Embed Size (px)
Citation preview
1
PART TWO:Distribution and
Human ResourcesChapter 6:
Inequalityand Poverty
2
•Bangladesh: one of the world’s most heavily populated low-income nations
•average income (2003: 1,770$PPP, 2010 1700$PPP)
•population: 140 million
•$5 per person per day on average
•what income level is earned by those who fall below the average?
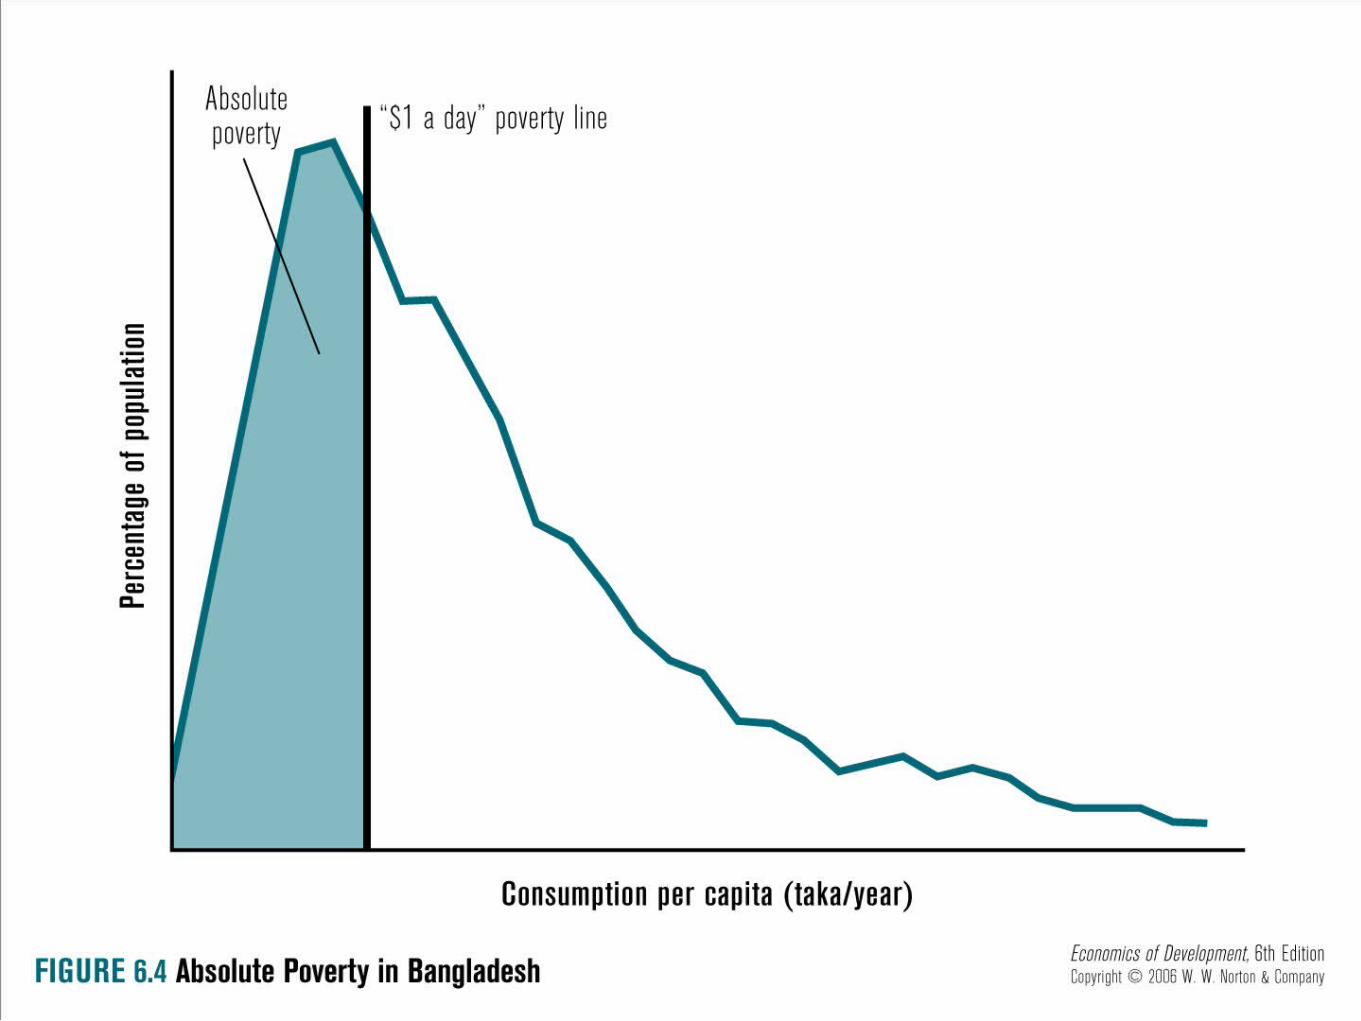
•36% of Bangladeshis (50 million) survive on “$1 a day” or less.... this is the definition of absolute poverty
3
•1 out of 6 people lives below the “$1 a day”
•half the world’s population survive on less than “$2 a day”
•this is related to the question of: is income distributed equally?
•Mexico: $9,168 per capita GDP in 2003, richest 20% receive over 50% of total income, 15 times as much as the poorest 20%, 15,700 in 2012
•10 million mexicans (10% of population) living below “$1 a day” poverty line.
4
•raising people out of poverty requires economic growth
•need to attain and reach sustained economic growth
•distribution of national income plays a vital role
5
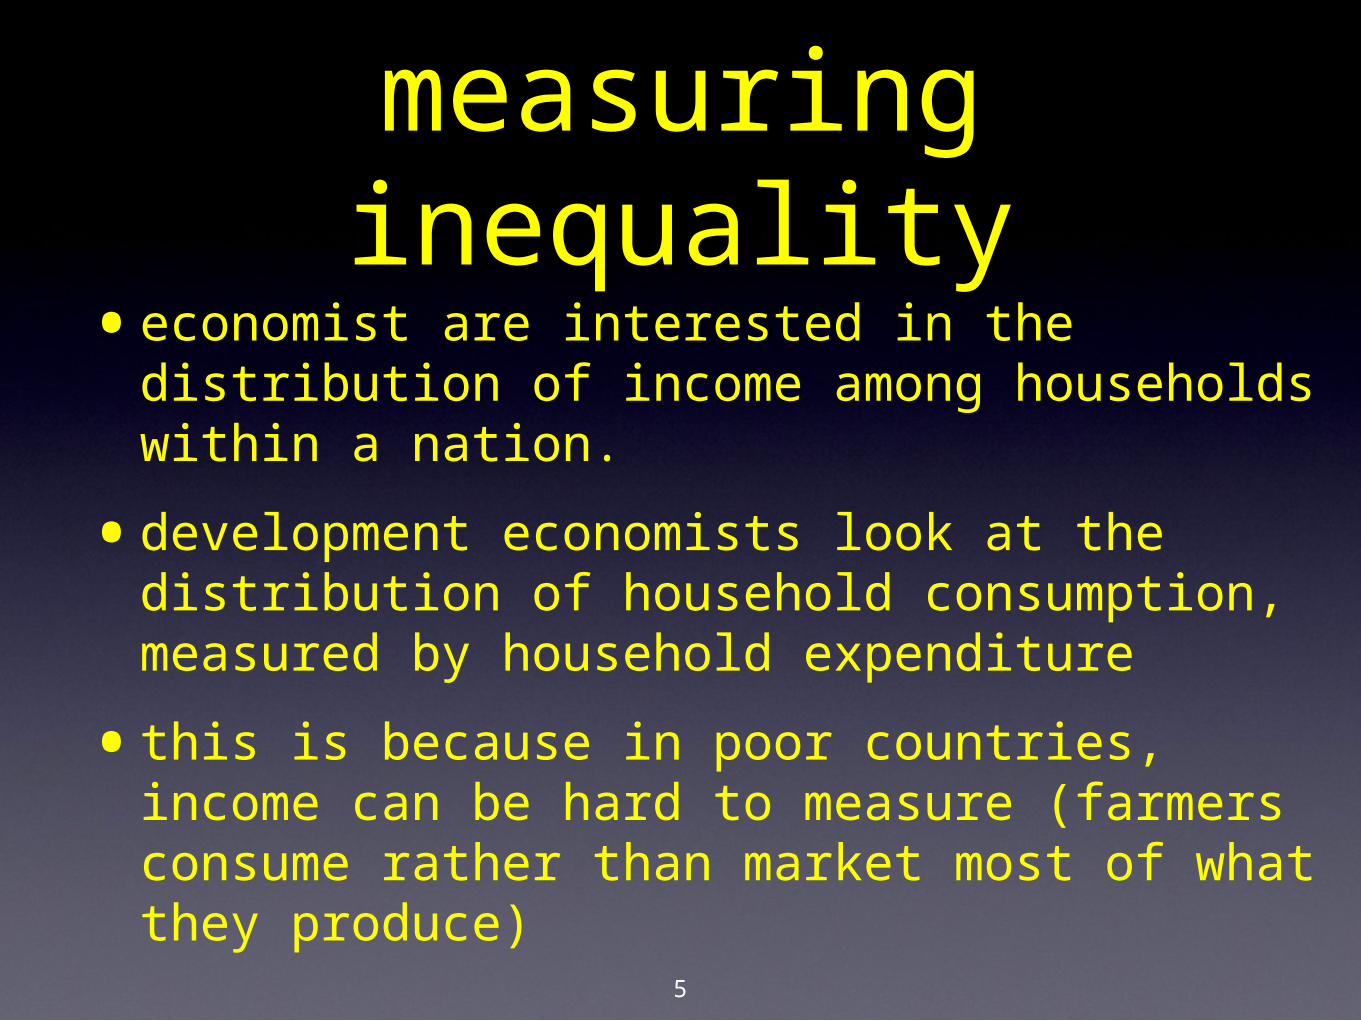
measuring inequality
•economist are interested in the distribution of income among households within a nation.
•development economists look at the distribution of household consumption, measured by household expenditure
•this is because in poor countries, income can be hard to measure (farmers consume rather than market most of what they produce)
6
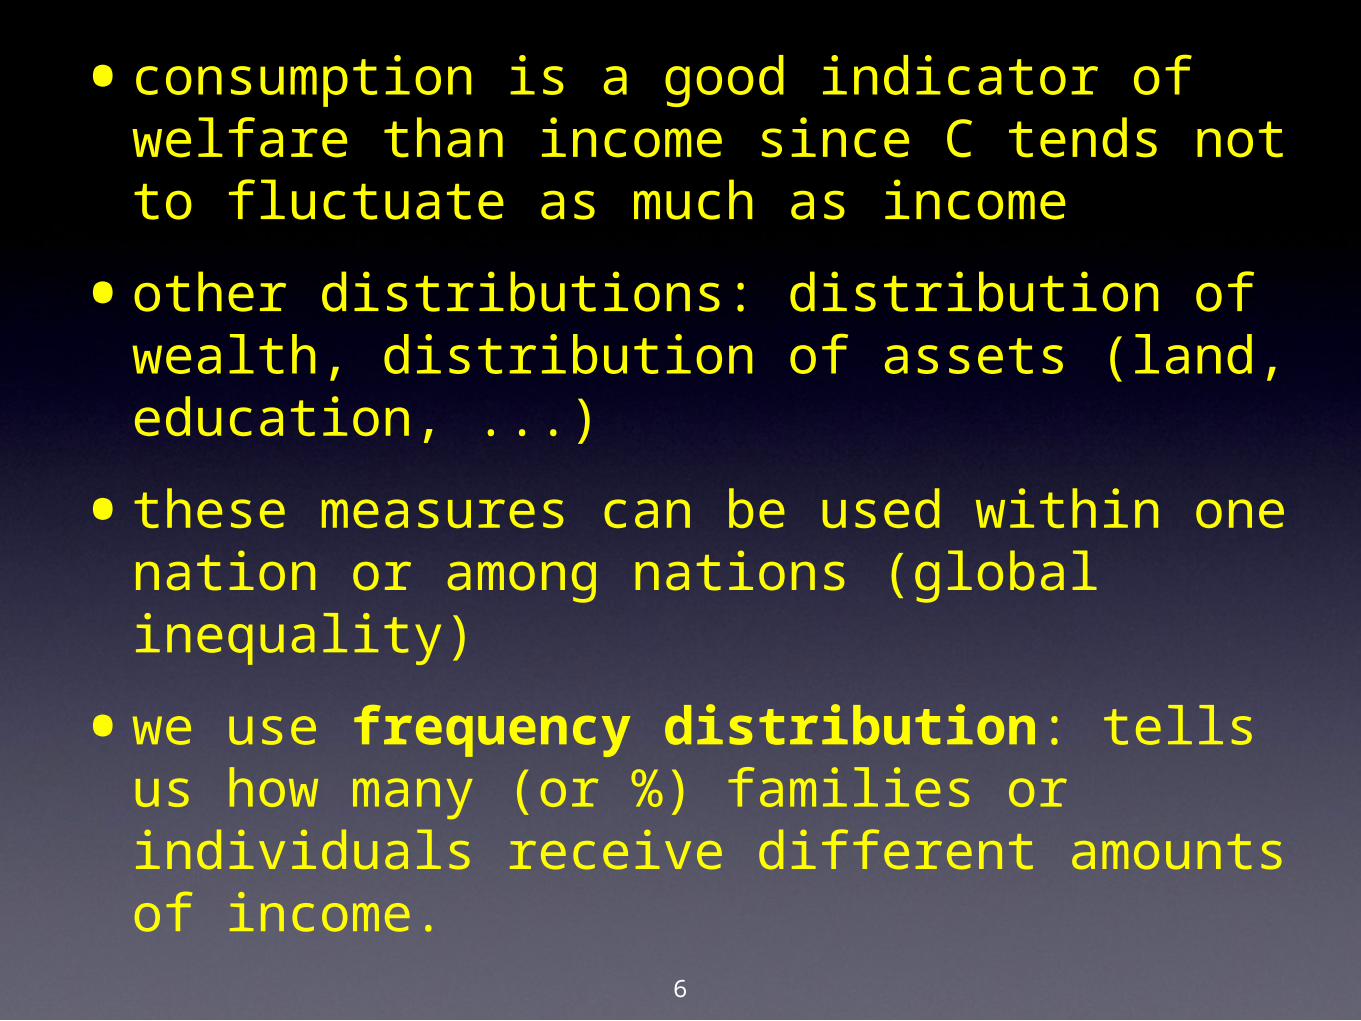
•consumption is a good indicator of welfare than income since C tends not to fluctuate as much as income
•other distributions: distribution of wealth, distribution of assets (land, education, ...)
•these measures can be used within one nation or among nations (global inequality)
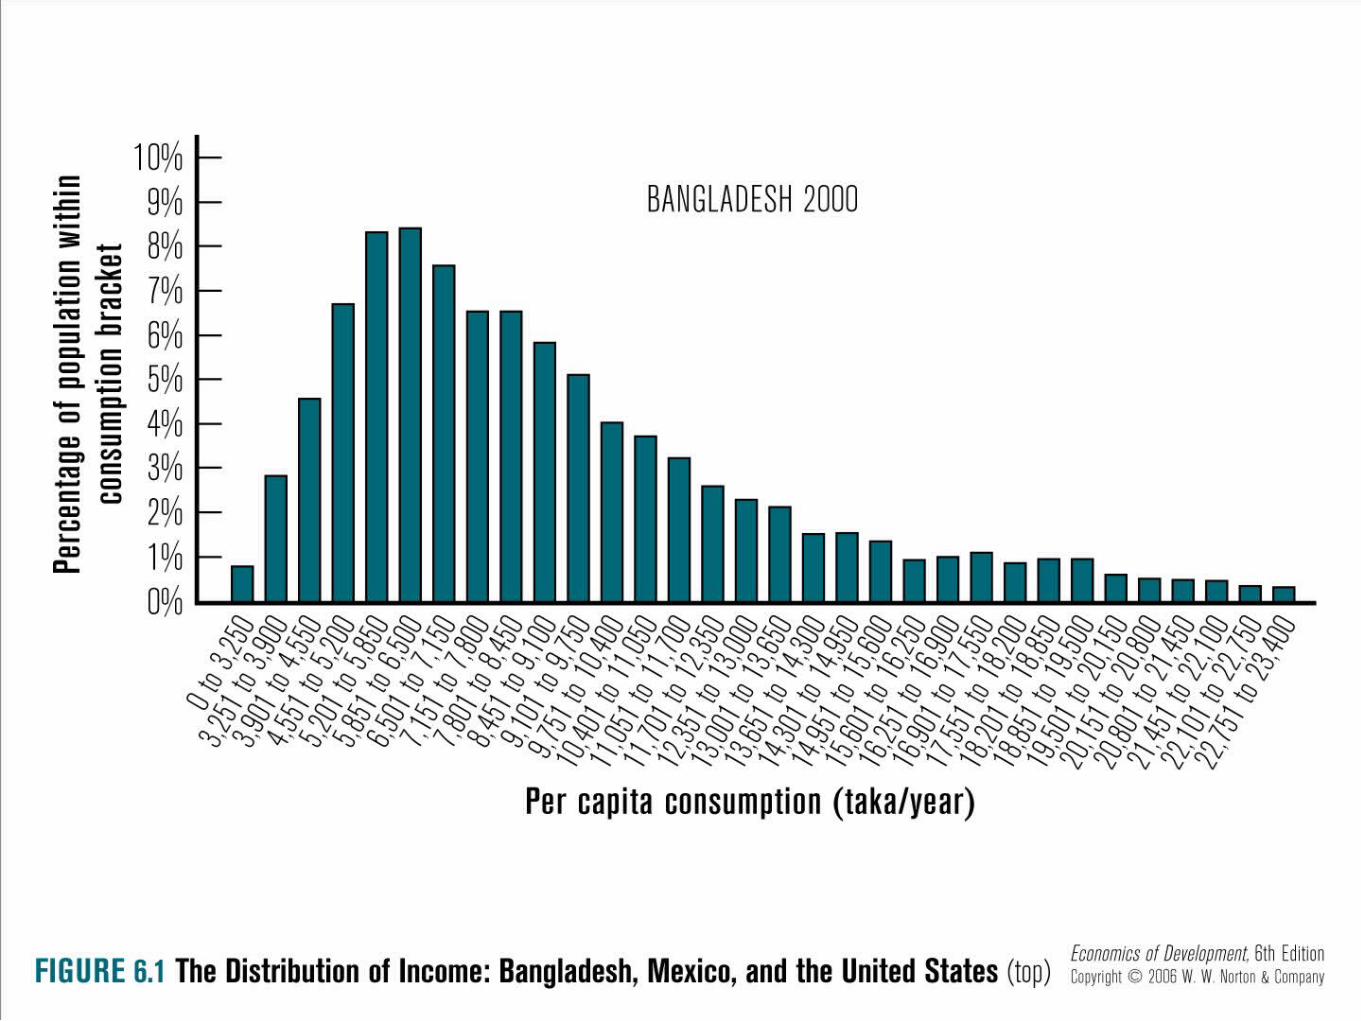
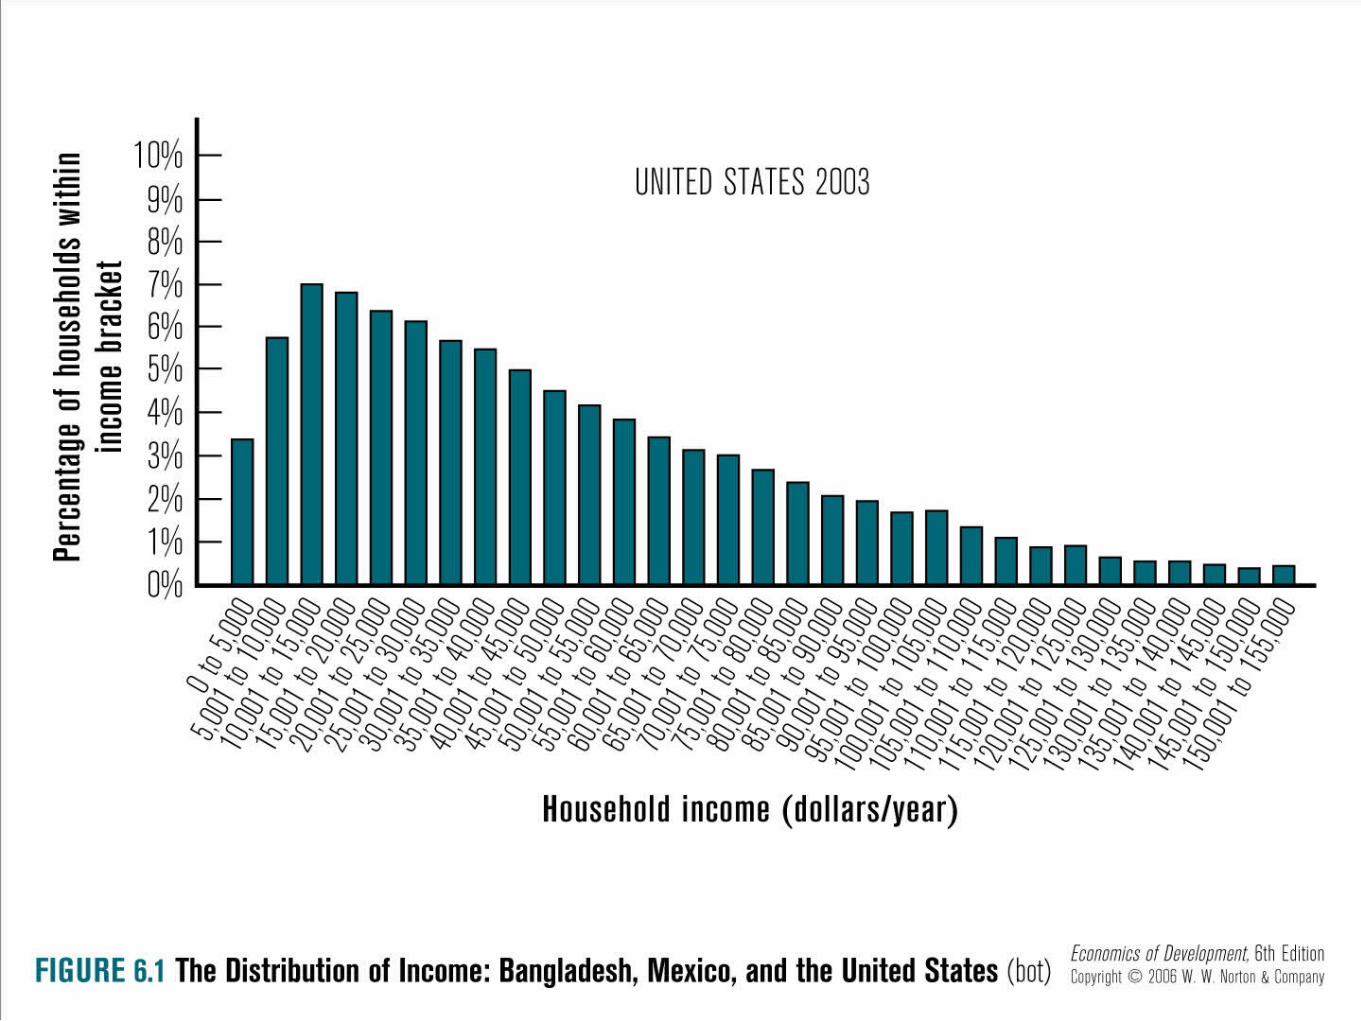
•we use frequency distribution: tells us how many (or %) families or individuals receive different amounts of income.
10
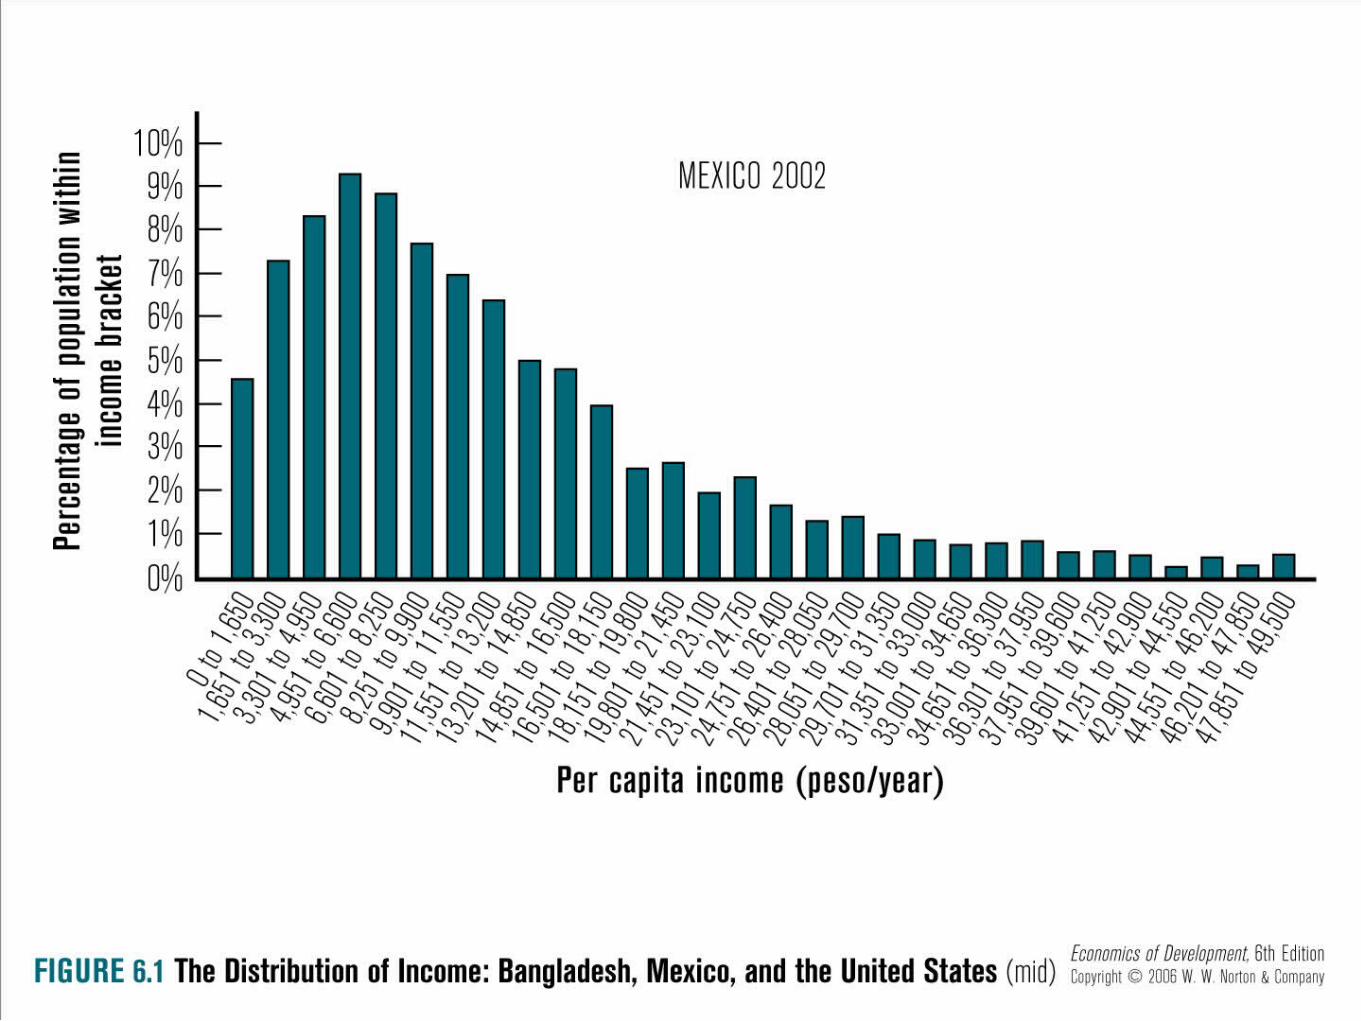
•all 3 figures have the same shaped frequency distribution but are NOT identical
•this means that the degree of inequality in 3 nations varies
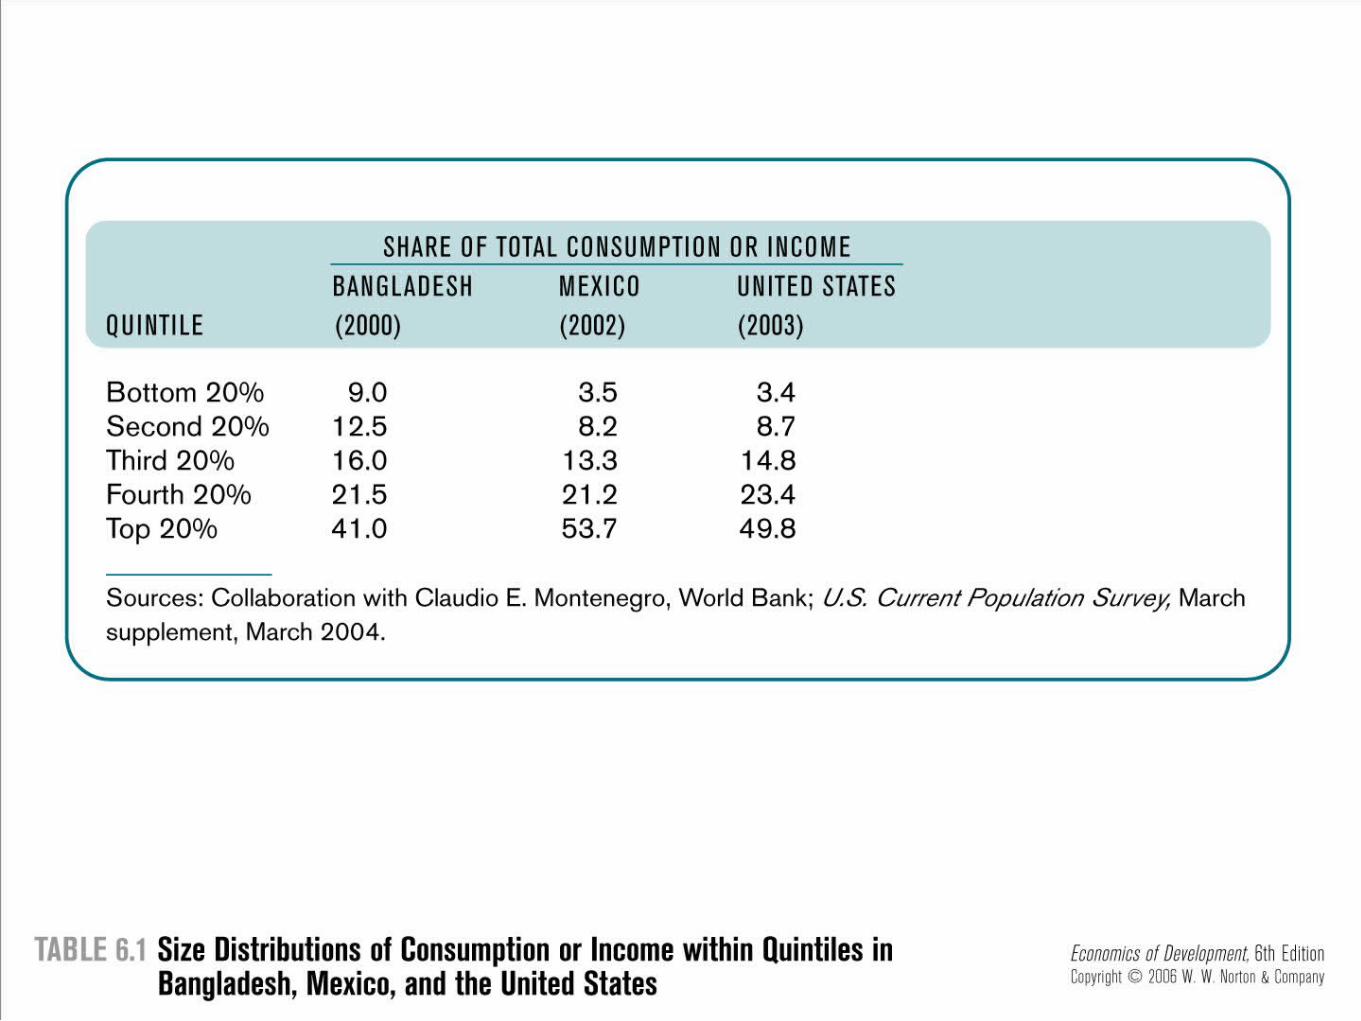
•we use size distribution to know the share of total C or income received by different groups of households ranked according to their C or income level
12
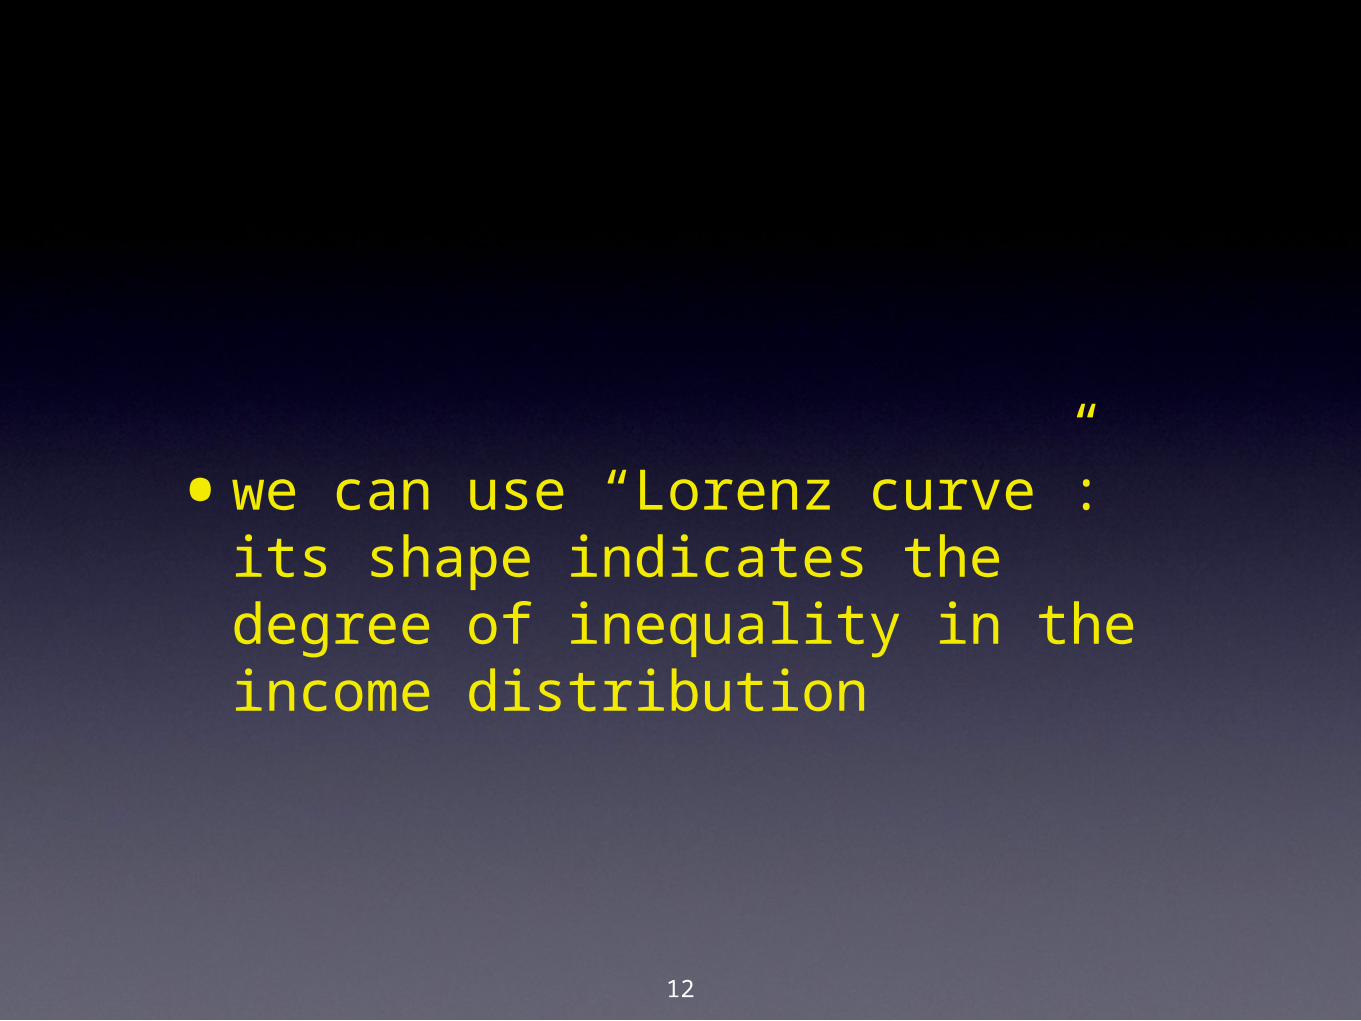
•we can use “Lorenz curve”: its shape indicates the degree of inequality in the income distribution
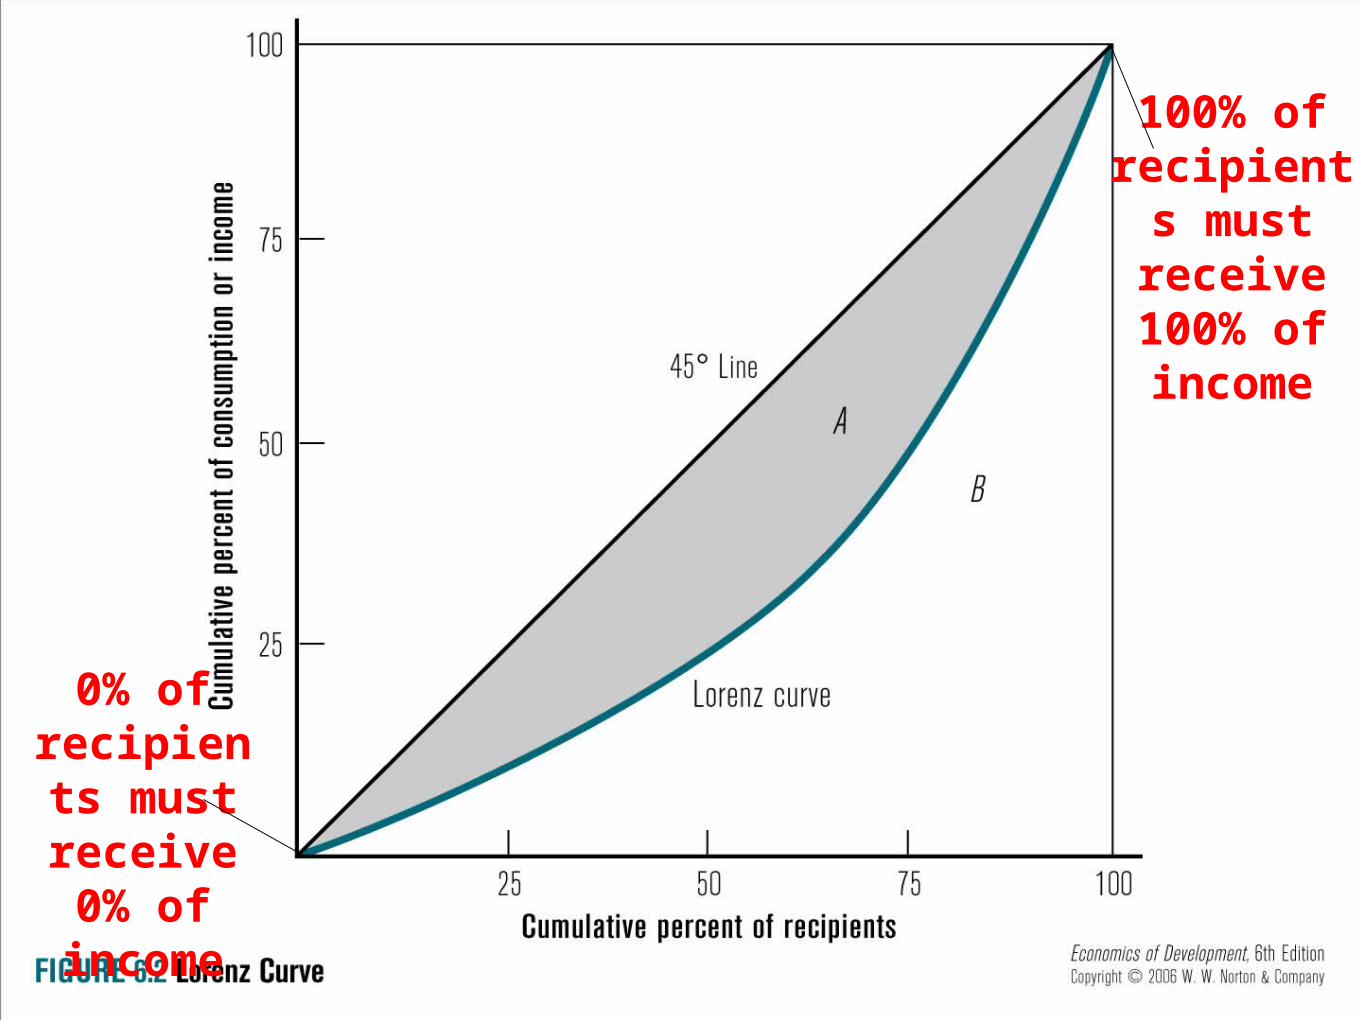
0% of recipients
must receive 0% of income
100% of recipients
must receive 100% of income
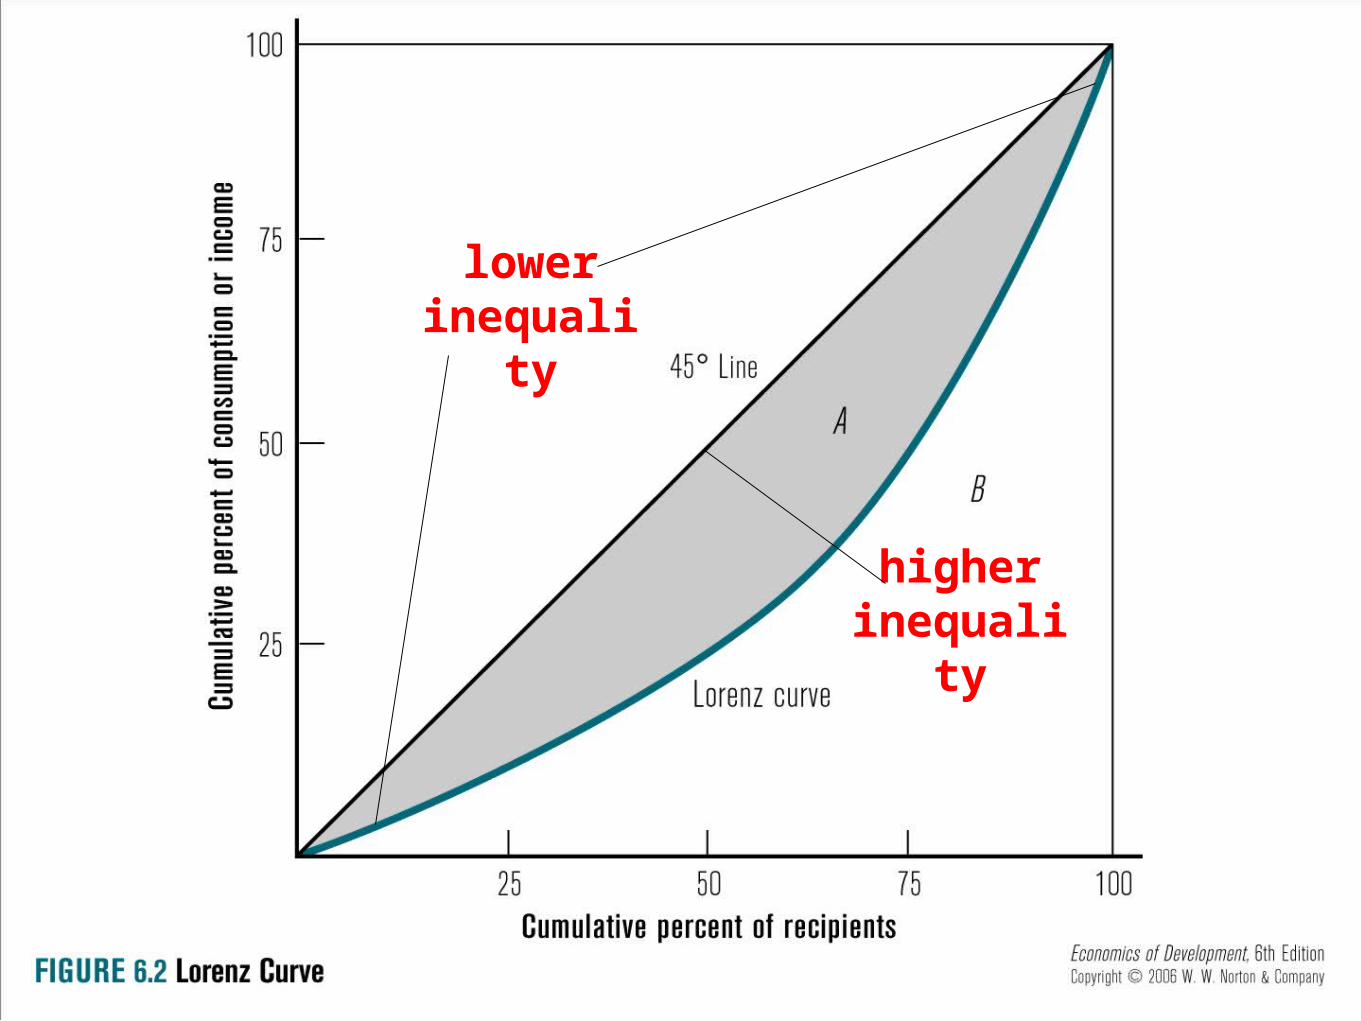
higher inequality
lower inequality
15
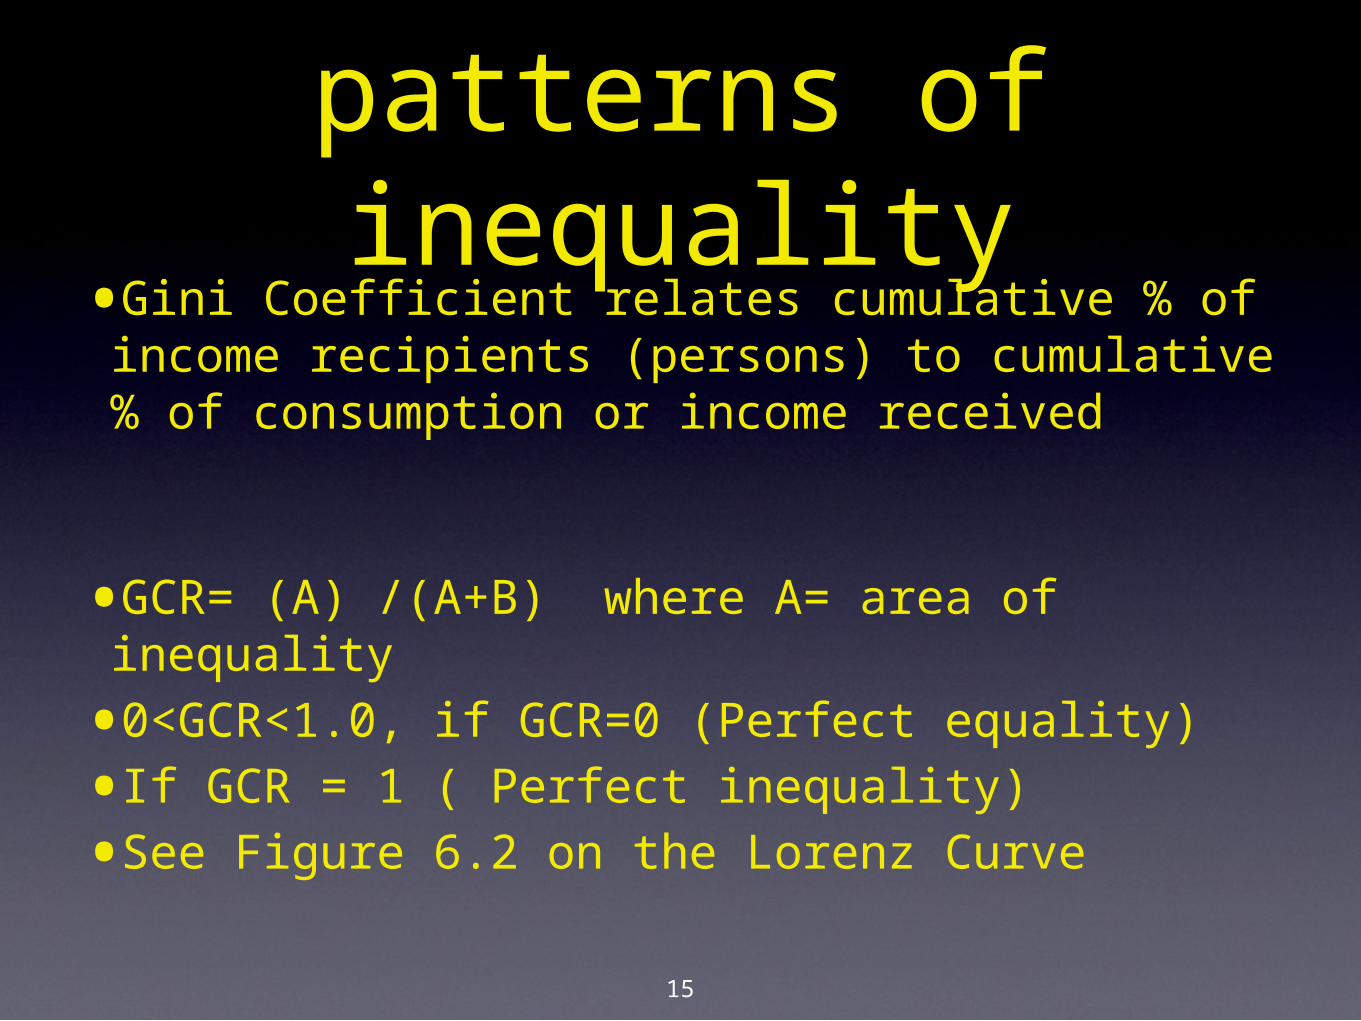
patterns of inequality
•Gini Coefficient relates cumulative % of income recipients (persons) to cumulative % of consumption or income received
•GCR= (A) /(A+B) where A= area of inequality
•0<GCR<1.0, if GCR=0 (Perfect equality)
•If GCR = 1 ( Perfect inequality)
•See Figure 6.2 on the Lorenz Curve
16
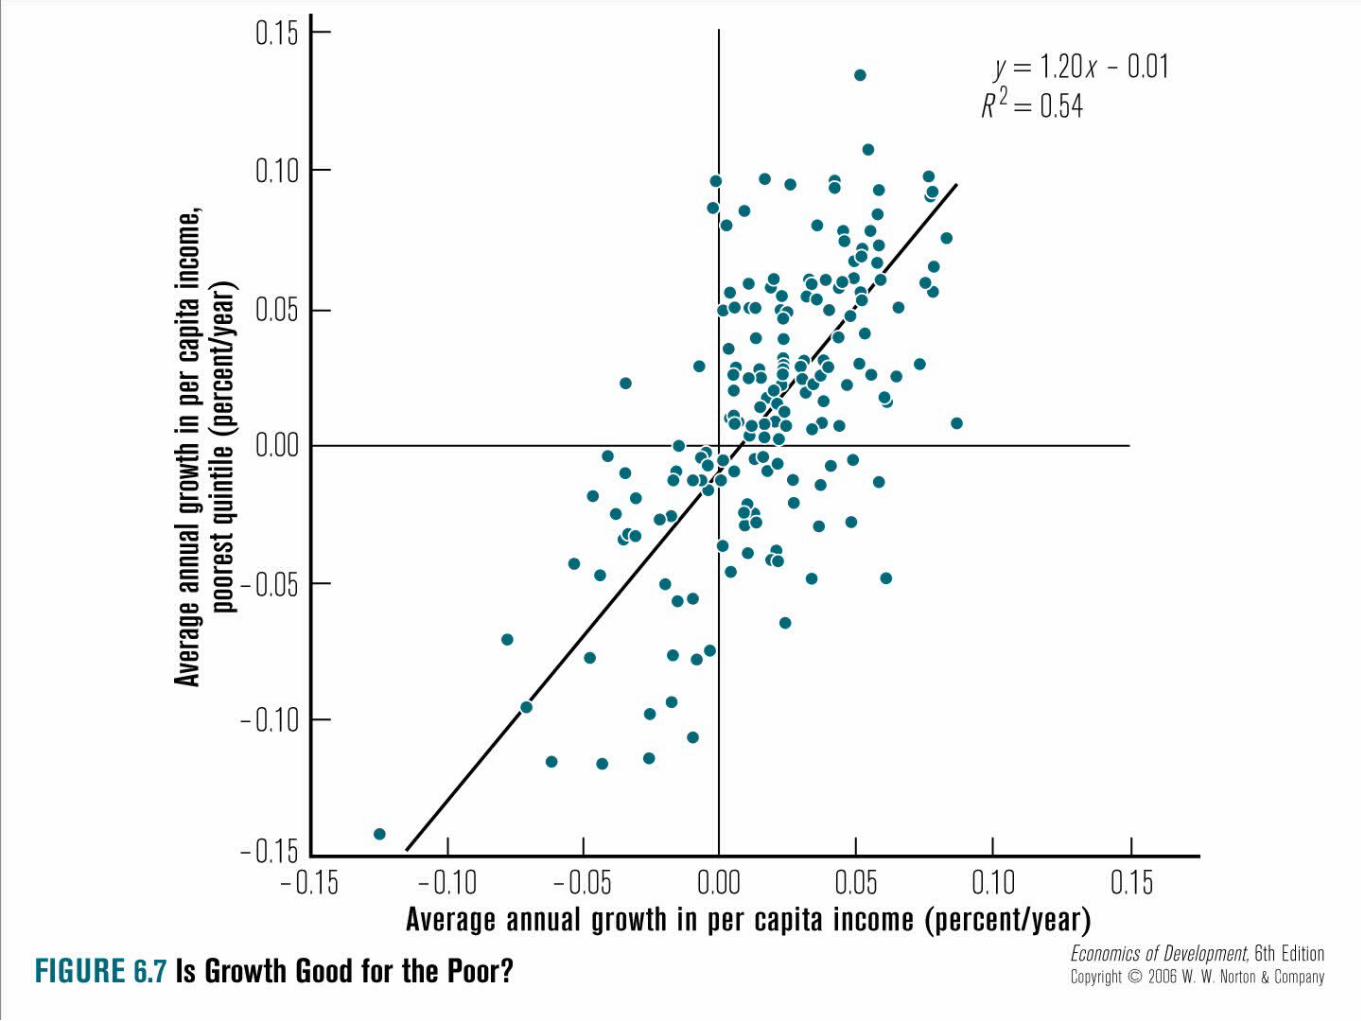
Growth and Inequality
17
What else might cause inequality?
18
Why Inequality matters?
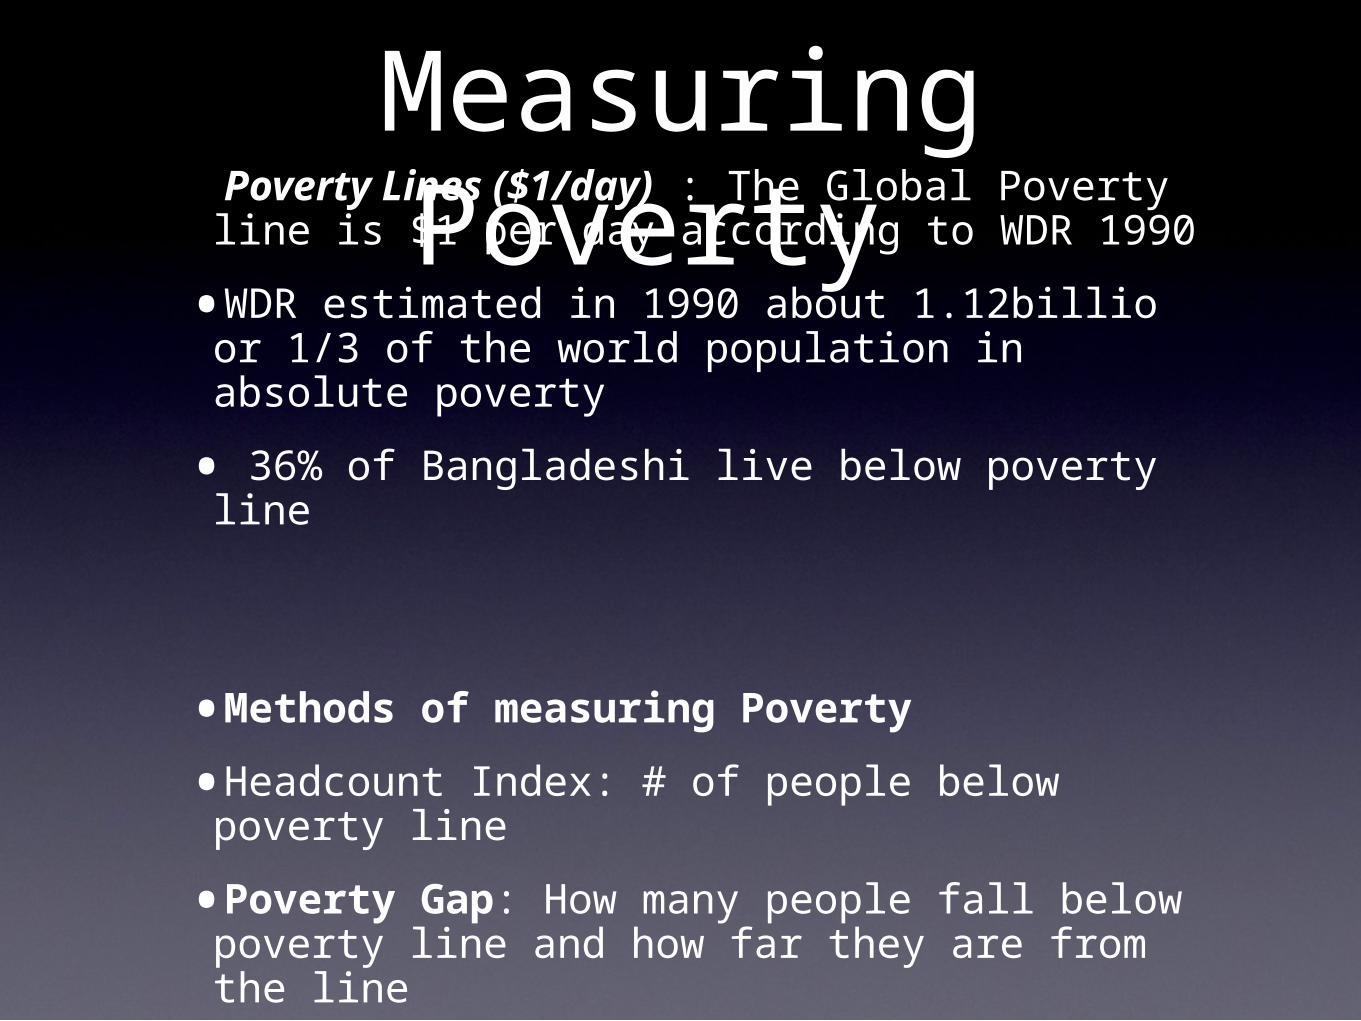
Measuring Poverty –Poverty Lines ($1/day) : The Global Poverty line is $1 per day according to WDR 1990
•WDR estimated in 1990 about 1.12billio or 1/3 of the world population in absolute poverty
• 36% of Bangladeshi live below poverty line
•Methods of measuring Poverty
•Headcount Index: # of people below poverty line
•Poverty Gap: How many people fall below poverty line and how far they are from the line
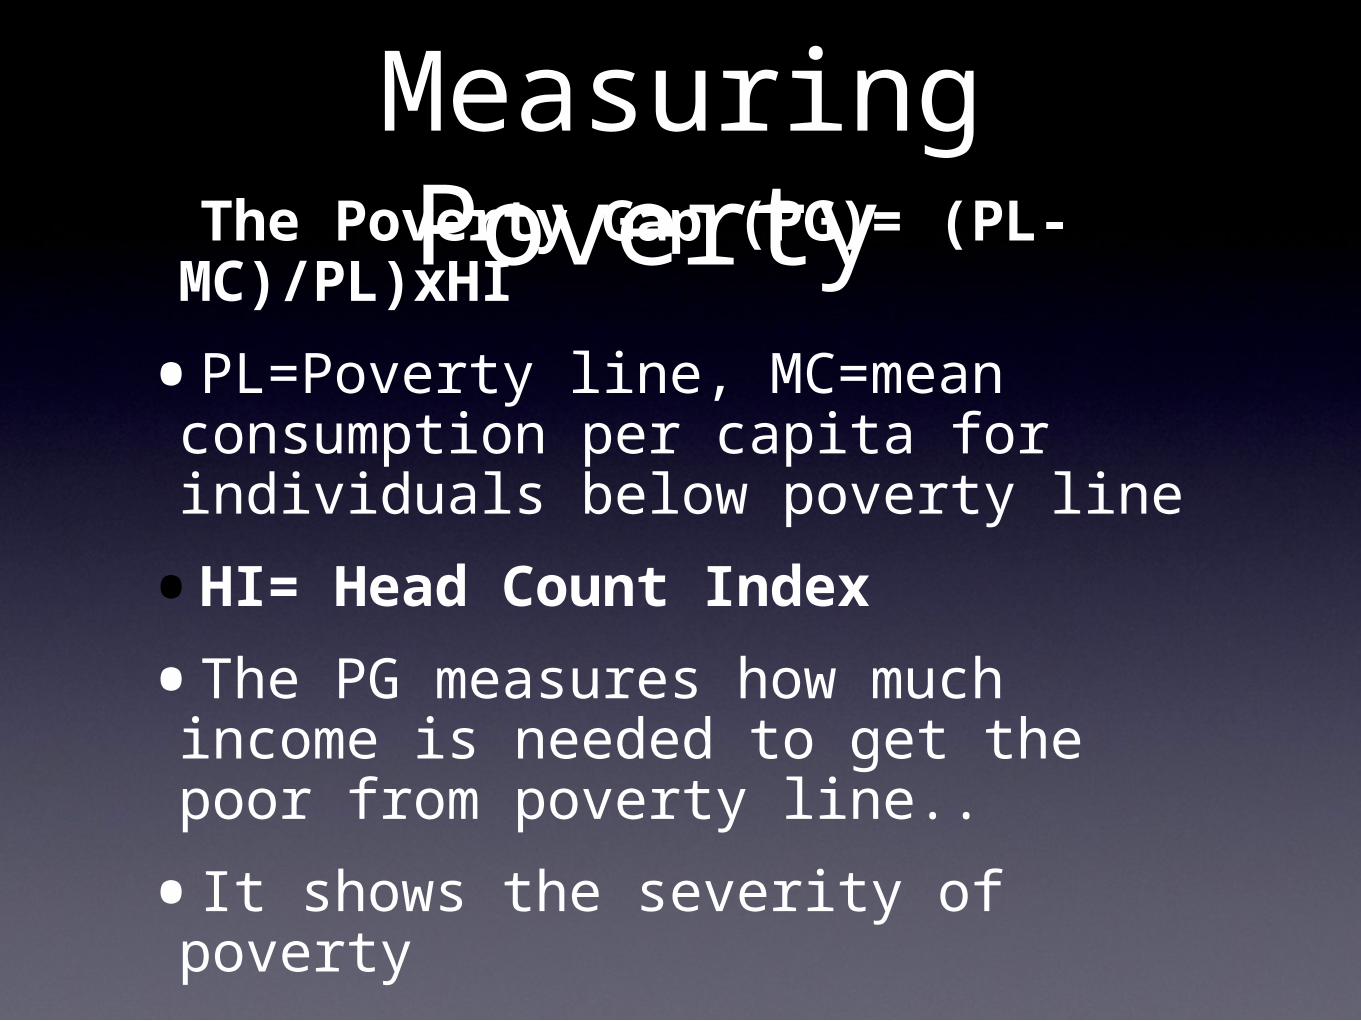
Measuring Poverty •The Poverty Gap (PG)= (PL-MC)/PL)xHI
•PL=Poverty line, MC=mean consumption per capita for individuals below poverty line
•HI= Head Count Index
•The PG measures how much income is needed to get the poor from poverty line..
•It shows the severity of poverty
How much Poverty is there?
•How Much Poverty Is There?
–Dissenting Opinions on the Extent of Absolute Poverty
–Who Are the Poor?
–Are Women Poorer than Men?
How much poverty is there
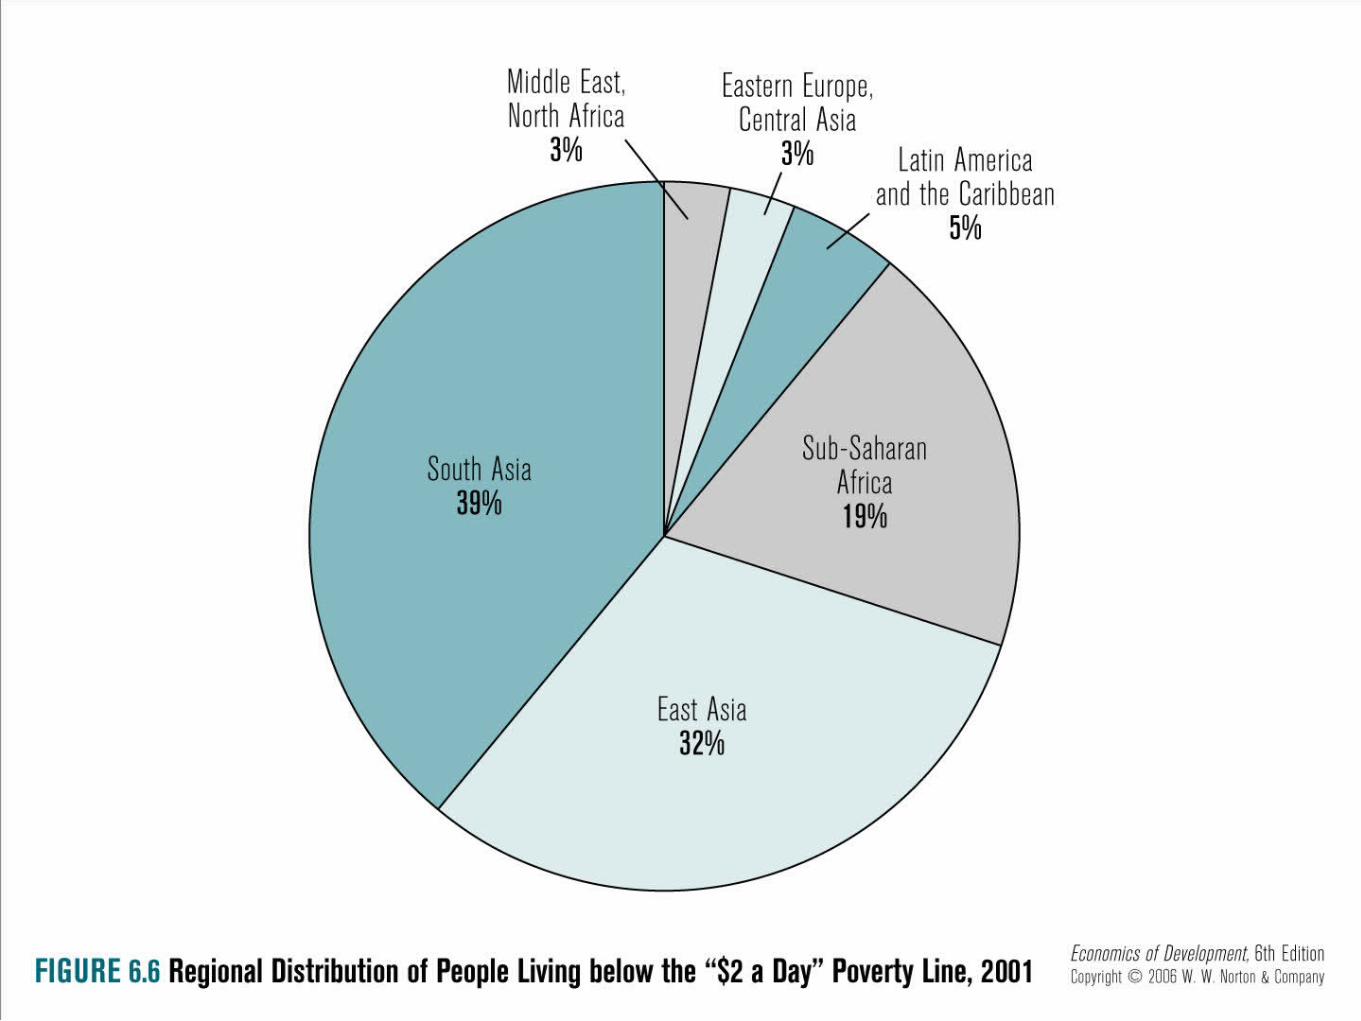
•The number of people living below $1 a day or $365 per year
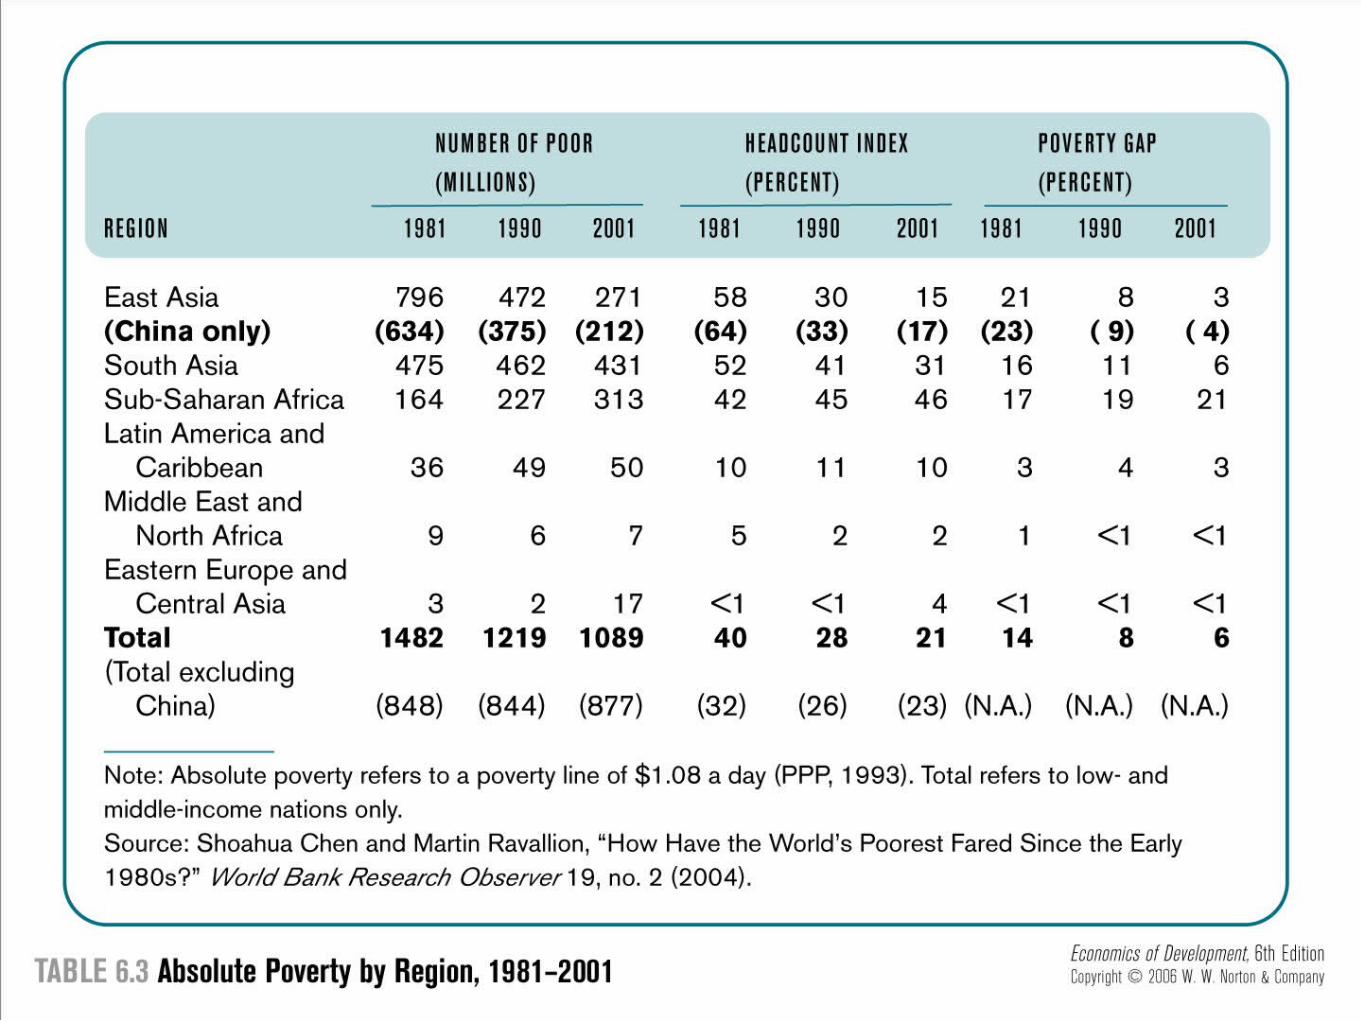
•See figure 6.5 for poverty levels for various regions of the world.
•The number of people below $1 in the world declined by 400 million between 1981-2001.
•This is good news? But what are bad news?
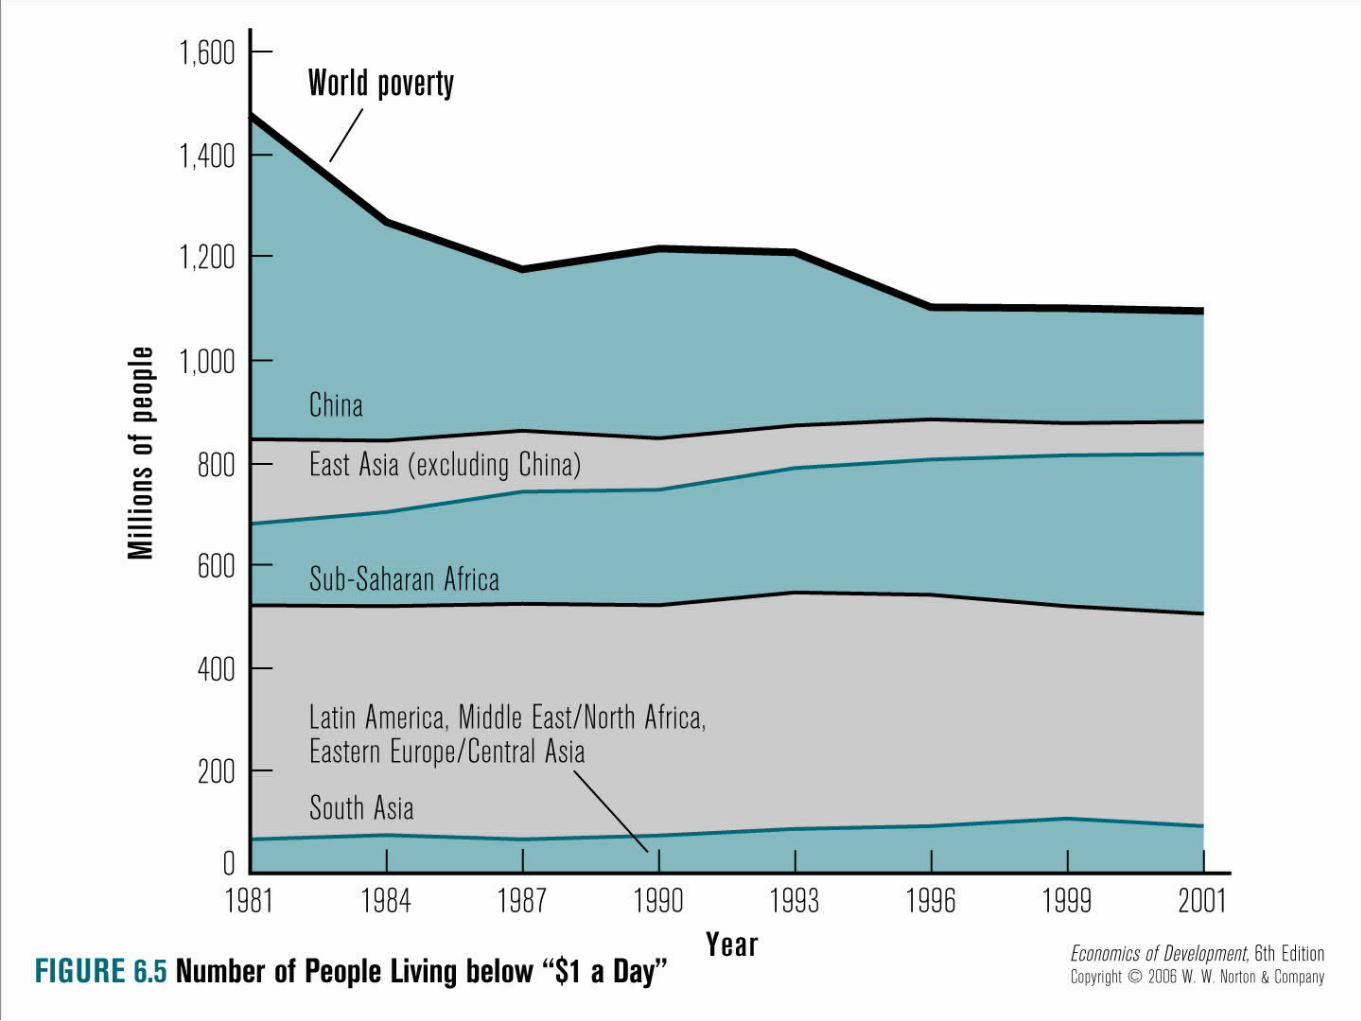
China Leads in reducing poverty
•China Head Count Index in 1981 was 64% it fell to 17% in 2001.
•Africa’s population growth led to doubling the number of people living below poverty line.
•China lowered poverty gap from 23% to 4%. A remarkable human achievement.
Strategies for Reduce Poverty
•Two elements of strategy: 1.Promote market oriented economic growth.2. Direct investment on basic health, education of the poor
•Recommendation of Washington Consensus
•Macroeconomic stability, more openness to trade and investment, increase public investment on infrastructure, and credit, etc
•Combine this with labor-intensive demand growth that would benefit the poor.
Strategies for reducing poverty •Economic growth will lead to poverty
reduction-World Bank Approach. “Trickle down Approach”
•Human Development Report approach sees problems with economic growth approach. HDR argues it can be jobless, ruthless, voiceless, and rootless, & futureless or unsustainable.
Problems with Economic Growth Approach
•What kind of growth? UNDP argues growth can be: “jobless” overall economy grows but does not expand employment,
• “ruthless”-where the rich only benefit, leaving millions in poverty,
• voiceless, no basic democratic freedoms, and
• rootless “ undermine cultural identity, and
•“futureless” where present generation squanders resources needed for future generation, UNDP’s Human Development Report 1996.
Conclusion Summary Chapter
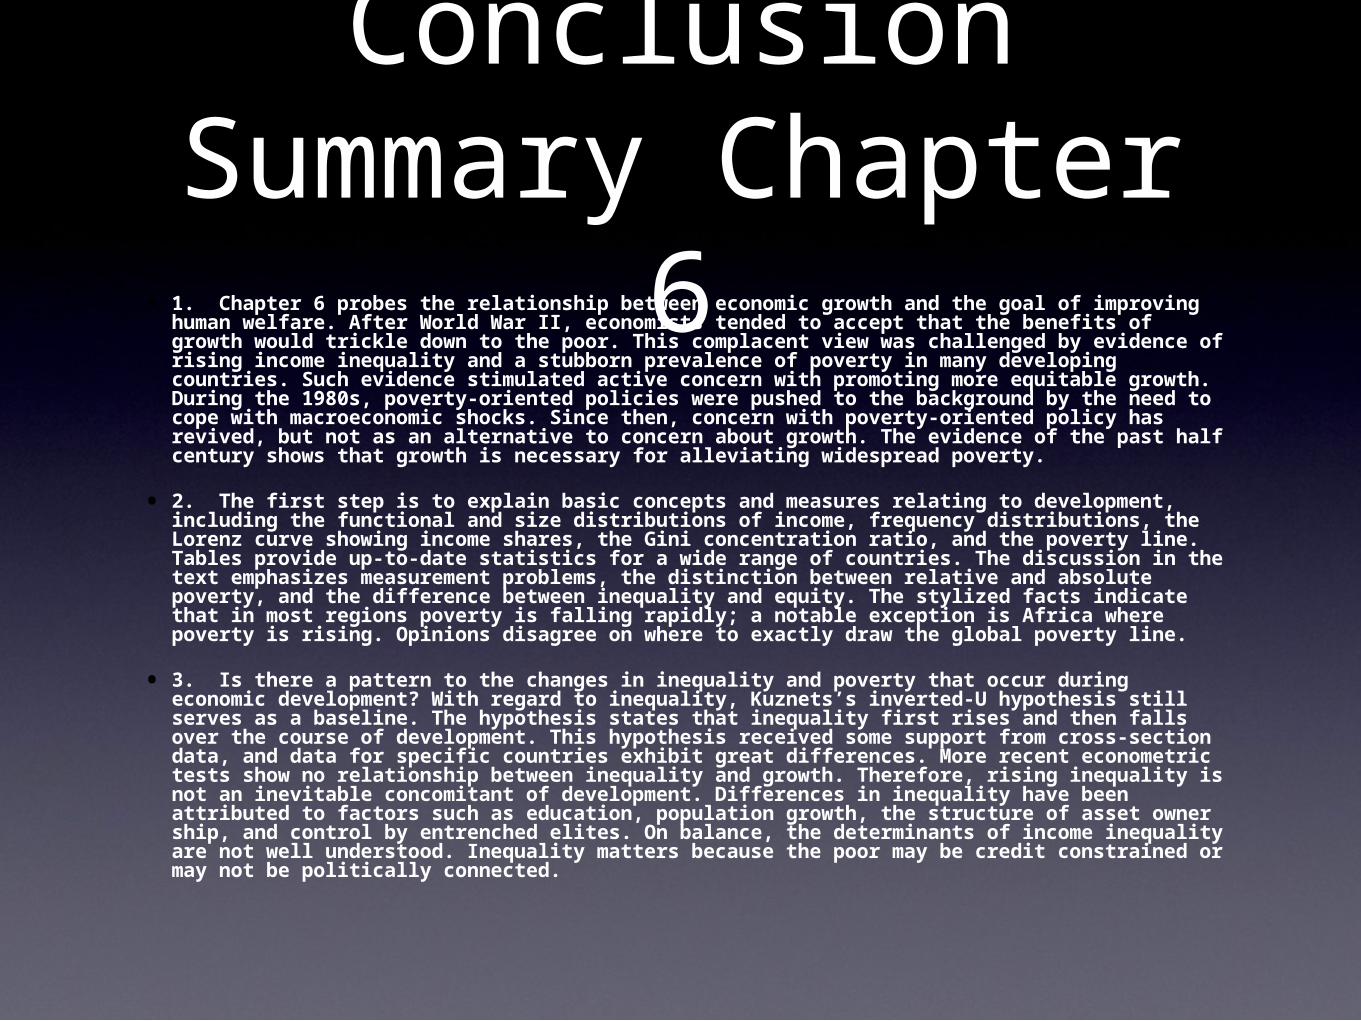
6• 1. Chapter 6 probes the relationship between economic growth and the goal of improving human welfare. After World War II, economists tended to accept that the benefits of growth would trickle down to the poor. This complacent view was challenged by evidence of rising income inequality and a stubborn prevalence of poverty in many developing countries. Such evidence stimu lated active concern with promoting more equitable growth. During the 1980s, poverty-oriented policies were pushed to the background by the need to cope with macroeconomic shocks. Since then, concern with poverty-oriented policy has revived, but not as an alternative to concern about growth. The evidence of the past half century shows that growth is necessary for alleviating widespread poverty.
• 2. The first step is to explain basic concepts and measures relating to devel opment, including the functional and size distributions of income, frequency distributions, the Lorenz curve showing income shares, the Gini concentration ratio, and the poverty line. Tables provide up-to-date statistics for a wide range of countries. The discussion in the text emphasizes measure ment problems, the distinction between relative and absolute poverty, and the difference between inequality and equity. The stylized facts indicate that in most regions poverty is falling rapidly; a notable exception is Africa where poverty is rising. Opinions disagree on where to exactly draw the global poverty line.
• 3. Is there a pattern to the changes in inequality and poverty that occur during economic development? With regard to inequality, Kuznets’s inverted-U hypothesis still serves as a baseline. The hypothesis states that inequality first rises and then falls over the course of development. This hypothesis received some support from cross-section data, and data for specific countries exhibit great differences. More recent econometric tests show no relationship between inequality and growth. Therefore, rising inequality is not an inevitable con comi tant of development. Differences in inequality have been attributed to factors such as education, population growth, the structure of asset owner ship, and control by entrenched elites. On balance, the determinants of income inequality are not well understood. In equality matters because the poor may be credit constrained or may not be politically connected.
Chapter 6 Summary Conclusion• IV. Looking at poverty, the empirical pattern is clear and simple: Poverty is
diminishing in countries that are growing rapidly, while in the absence of economic growth rising poverty is virtually unavoidable.
• V. The chapter contrasts the two broad strategies of growth as good and growth not being good enough. It describes the role of the Washington Consensus and its impact on poverty. It suggests some methods of poverty intervention such as improving opportunities and providing income transfers and safety nets. It closes by exploring the popular issue of global income inequality and shows how conclusions depend on the chosen unit of measurement. It also provides Sachs’s arguments for The End of Poverty.
• There are 3 boxed examples. The first study compares the national poverty lines of Bangladesh, Mexico, and the United States. The second example provides Pritchett’s dissension on the global poverty line of a “$1 a day.” The 3rd describes an interview with Dani Rodrik who explains why development strategies should be poverty focused.
• It has eliminated the previous focus on four strategies for poverty and compressed the strategies into two. It has new section on global inequality and visions on the end of poverty.