Embed Size (px)
Citation preview
Citation: Jones, Thomas, Howatson, Glyn, Russell, Mark and French, Duncan (2016) Performance and endocrine responses to differing ratios of concurrent strength and endurance training. Journal of Strength and Conditioning Research, 30 (3). pp. 693-702. ISSN 1064-8011
Published by: Lippincott, Williams & Wilkins
URL: http://doi.org/10.1519/JSC.0000000000001135 <http://doi.org/10.1519/JSC.0000000000001135>
This version was downloaded from Northumbria Research Link: http://nrl.northumbria.ac.uk/25940/
Northumbria University has developed Northumbria Research Link (NRL) to enable users to access the University’s research output. Copyright © and moral rights for items on NRL are retained by the individual author(s) and/or other copyright owners. Single copies of full items can be reproduced, displayed or performed, and given to third parties in any format or medium for personal research or study, educational, or not-for-profit purposes without prior permission or charge, provided the authors, title and full bibliographic details are given, as well as a hyperlink and/or URL to the original metadata page. The content must not be changed in any way. Full items must not be sold commercially in any format or medium without formal permission of the copyright holder. The full policy is available online: http://nrl.northumbria.ac.uk/policies.html
This document may differ from the final, published version of the research and has been made available online in accordance with publisher policies. To read and/or cite from the published version of the research, please visit the publisher’s website (a subscription may be required.)

1
PERFORMANCE AND ENDOCRINE RESPONSES TO DIFFERING RATIOS OF 1
CONCURRENT STRENGTH AND ENDURANCE TRAINING 2
3
PERFORMANCE RESPONSES TO DIFFERING RATIOS OF CONCURRENT 4
TRAINING 5
6
THOMAS. W JONES1, GLYN HOWATSON2,3, MARK RUSSELL2 and DUNCAN N. 7
FRENCH2,4 8
1ASPIRE, Academy for Sports Excellence, Doha, Qatar 9
2Department Sport, Exercise and Rehabilitation, Northumbria University, Newcastle 10
upon Tyne, United Kingdom 11
3Water Research Group, School of Environmental Sciences and Development, North 12
West University, Potchefstroom, South Africa 13
4English Institute of Sport, Sportcity, Manchester, United Kingdom 14
15
Dr Duncan N. French 16
Department of Sport and Exercise, and Rehabilitation 17
Northumbria University 18
Northumberland Building 19
Newcastle upon Tyne 20
NE1 8ST 21
23
2
ABSTRACT 1
The present study examined functional strength and endocrine responses to varying 2
ratios of strength and endurance training in a concurrent training regimen. 30 3
resistance-trained men completed 6 weeks of 3 d·wk-1 of i) strength training (ST), ii) 4
concurrent strength and endurance training ratio 3:1 (CT3), iii) concurrent strength 5
and endurance training ratio 1:1 (CT1) or iv) no training (CON). Strength training was 6
conducted using whole-body, multi-joint exercises, while endurance training 7
consisted of treadmill running. Assessments of maximal strength, lower body power, 8
and endocrine factors were conducted pre-training and following 3 and 6 weeks. 9
Following the intervention ST and CT3 elicited similar increases in lower body 10
strength; furthermore, ST resulted in greater increases than CT1 and CON (all p < 11
0.05). All training conditions resulted in similar increases in upper body strength 12
following training. ST group observed greater increases in lower body power than all 13
other conditions (all p < 0.05). Following the final training session, CT1 elicited 14
greater increases in cortisol than ST (p = 0.008). When implemented as part of a 15
concurrent training regimen, higher volumes of endurance training result in the 16
inhibition of lower body strength, whereas low volumes do not. Lower body power 17
was attenuated by high and low frequencies of endurance training. Higher 18
frequencies of endurance training resulted in increased cortisol responses to 19
training. These data suggest that if strength development is the primary focus of a 20
training intervention, frequency of endurance training should remain low. 21
22
KEY WORDS combined exercise, interference, cortisol, resistance training, training 23
frequency 24
25
3
INTRODUCTION 1
Various sports and events require contrasting physical performance phenotypes for 2
successful performance. Training for sports and events at the extremes of the 3
strength-endurance continuum, such as Powerlifting and ultra-endurance challenges, 4
is relatively straight-forward compared with sports and events that require a 5
combination of strength and endurance capabilities. In these situations athletes and 6
coaches are often forced to combine training methods which elicit contrasting and 7
even antagonistic physiological and performance responses (12). In the case of 8
‘concurrent training’, the divergent stimuli of strength and endurance training can 9
result in attenuated strength type adaptation when compared to strength training 10
performed in isolation. This divergent physiology is known as the interference effect 11
or phenomenon (17). 12
13
Research has indicated that any interference experienced during a concurrent 14
strength and endurance training regimen may be dependent in part on the volume of 15
training performed (1, 13, 24, 25, 33). Despite this, no study has specifically 16
examined the effects of whole body, multi-joint concurrent training inventions with 17
varying training volumes and the effect that is has on muscle force characteristics. 18
Previous work from our laboratory (20) has indicated that the magnitude of 19
interference experienced may be proportional to the frequency of endurance training 20
performed; indicating overall training volume and exercise stress may indeed 21
regulate the presence of any interference experienced. 22
23
Elevated training ‘stress’ has previously been proposed as a mechanism for 24
interference (10), and is perhaps attributable to the experimental design of some 25

4
published studies in this area. Often the concurrent training condition will perform 1
double the overall training volume and total work to that of the strength training alone 2
condition, which has previously resulted in muted strength development (6, 16, 20, 3
22). In contrast studies employing lower concurrent training volumes have reported 4
no inhibited strength development as a result of concurrent training (24, 25). These 5
findings may support the hypothesis that total work performed in a concurrent 6
programme influences both the presence and magnitude of any interference 7
experienced, although the underlying mechanisms are yet to be fully elucidated. 8
9
Previous research has reported a decreased testosterone:cortisol ratio following 10
concurrent training with no such decrease in participants who performed strength 11
training alone (2, 3, 22). This may implicate elevated endocrine responses and 12
catabolism as a contributing factor to interference. As such, it is reasonable to 13
suggest that the higher training volumes experienced in concurrent training regimens 14
can result in elevated physiological stress, which is reflected in the responses of 15
primary anabolic and catabolic hormones. This shift in the endocrine milieu in favour 16
of catabolism may contribute to attenuated strength and hypertrophic adaptation 17
associated with concurrent training. 18
19
Previous work from our laboratory (20) illustrates the value in exploring the role of 20
training frequency in a systematic fashion. Furthermore no research has assessed if 21
differing ratios of strength and endurance training can influence the degree of 22
interference experienced as a result of adaptations in the anabolic:catabolic 23
environment. Therefore, the purpose of this research was to investigate the strength, 24
5
anthropometric and endocrine responses to a variety of concurrent strength and 1
endurance training ratios, with incremental loads in a functional multi joint model. 2
3
METHOD 4
Experimental Approach to the Problem 5
A balanced, randomized, between-group study design was employed to examine the 6
effect of differing ratios of strength and endurance training in a concurrent regimen 7
on strength, anthropometric, and endocrine responses. A 6 week training 8
intervention was completed, during which participants were randomly assigned to 9
one of four experimental conditions: either i) strength training alone (ST), ii) 10
concurrent strength and endurance training at a ratio of 3:1 (CT3), iii) concurrent 11
strength and endurance training at a ratio of 1:1 (CT1), or iv) no training (CON). 12
Participants in the ST group were required to perform strength training alone on all 13
scheduled training sessions. The CT3 group completed strength training on every 14
scheduled session with every third session immediately followed by an endurance 15
training protocol. Elsewhere, participants designated CT1 completed an identical 16
strength training protocol immediately followed by endurance training at every 17
scheduled session. Those participants in the CON group performed no strength or 18
endurance training during the entire experimental period. Due to the requirements of 19
the separate training protocols, it was not possible to match total work performed in 20
the respective experimental conditions. All participants were instructed to abstain 21
from any other strength or endurance training throughout the experimental period 22
beyond that prescribed by the investigator. 23
24
6
Participants completed their respective intervention 3 d·wk-1 with ~48 h between 1
sessions for 6 weeks resulting in a total of 18 separate training sessions in the micro 2
cycle. In order to assess whether the frequency and ratio of strength and endurance 3
training performed influenced strength and changes in body composition, 4
assessments of 1 repetition maximums (1RM), countermovement jump height 5
(CMJ), and body composition were assed pre, mid and post-intervention. To assess 6
the effect of the designated training interventions on endocrine factors related to 7
strength and morphological adaptation, venous blood samples were taken and 8
subsequently analysed for circulating testosterone and cortisol concentrations. 9
During the investigation, venous blood samples were collected immediately before 10
(pre) and following the cessation of exercise (post) in the initial, mid and final 11
compound training sessions of the 18 sessions performed. 12
13
Subjects 14
Prior to all experimental procedures the study was approved by the Northumbria 15
University research ethics committee. All subjects were informed of the risks and 16
benefits of the investigation prior to signing an approved informed consent document 17
to participate in the study. Thirty healthy, recreationally resistance-trained men (age: 18
23 ± 4 y; body mass: 79.2 ± 6.7 kg; height: 179.2 ± 6.7 cm; % body fat: 16.2 ± 5.4 %; 19
sum of assessed 1RMs: 506.0 ± 11.4 kg; CMJ: 52.5 ± 7.3 cm; �̇�O2max: 50.2 ± 5.8 20
ml·kg·min) volunteered to participate in the study. Prior to commencing, participants 21
were matched for age, body mass, body fat % and 1RM (sum off all assessed 1RMs) 22
load (all p > 0.05), and then randomly assigned (via block randomisation) to one of 23
the four experimental conditions. Each participant had completed > 2 years of 24
strength training activities prior to the start of a study, and were considered 25
7
recreationally “resistance trained”; all participants were conducting strength training ≥ 1
2 d·wk-1, however none were involved in a sport-specific training programme. All 2
participants were non-smokers, free from any endocrine or metabolic 3
contraindications, and were not following any specialized dietary interventions. In all 4
cases participants were asked to refrain from nutritional supplementation or 5
pharmacological interventions for 30 days prior to and throughout the duration of any 6
experimental intervention. 7
8
Procedures 9
Strength training protocol 10
Prior to the intervention all participants completed a familiarisation week involving 11
each respective training session in order to habituate themselves fully with the 12
exercise techniques employed. The strength training intervention was comprised of 3 13
sessions, and each was performed on separate days with ~48 h between sessions. 14
Each session was composed of differing exercises; as such each of the sessions 15
were designated “compound”, “pull” and “push” respectively, to best describe the 16
nature of exercises performed. Full details of each session are presented in Table 1. 17
The respective sessions were performed in the same order each week (i.e., 18
compound, push then pull). Furthermore, the order of exercises within each session 19
was consistent throughout the intervention. 20
21
During familiarisation, training intensity was set at 70% of 1 repetition maximum 22
(1RM) for 3 sets of 10 repetitions. The first 3 weeks of the training intervention 23
required participants to complete all sessions and exercises at 80% 1RM for 4 sets 24
of 8 repetitions. The following and final 3 weeks of the intervention were completed 25
8
at an intensity of 85% 1RM for 5 sets of 6 repetitions. These loads, volumes and rest 1
intervals were selected as they are deemed appropriate for eliciting adaptations in 2
strength and hypertrophy in recreationally trained non-athletes (27, 28). Additionally, 3
strength training programmes of this nature involving exercises which stimulate large 4
muscle masses and shorter rest periods have been shown to elicit large increases in 5
the endocrine factors assessed within this study (21, 32). Full details of the 6
intervention are presented in Table 1. 7
8
All strength and/or endurance-based exercise commenced at the same time of day 9
(1000 h ± 1 h) to avoid any diurnal performance or endocrine variations (15). 10
Participants were also advised to abstain from exercise for 24 h prior to a visit. 11
Training load was modified accordingly for each exercise if a participant’s 1RMs 12
were observed to change at the mid-intervention assessments. Compliance was 13
100% for all participants. 14
15
Table 1 about here 16
17
Endurance training protocol 18
In all instances endurance training was conducted immediately following strength 19
training. The endurance training protocol required participants to run on a treadmill 20
(hp Cosmos, Pulsar, Nussdorf-Traunstein, Germany) at 1% incline at 70% of their 21
pre-determined peak running velocity at �̇�O2max (v�̇�O2max). Running velocity was 22
modified if participant’s v�̇�O2max was observed to change at the mid-intervention 23
assessments. 24
25
9
Whole body strength assessments - 1 repetition maximum (1RM) 1
1RM loads were established for all strength-training exercises prior to the 2
experimental intervention and following 3 and 6 weeks of training. For analysis 3
purposes lower body strength was assessed via back squat and deadlift 1RM total 4
load. To examine strength development in the upper body musculature, bench press, 5
bent over row and military press total 1RM load was analysed. These exercises were 6
chosen as they are considered gross motor movements that require all the major 7
joints and muscle groups involved in the strength training intervention. All 8
assessments were conducted in line with standardised procedures (29). 9
10
Maximal aerobic capacity - �̇�O2max 11
Assessments of participant’s maximal oxygen uptake and peak running velocity at 12
�̇�O2max were conducted at baseline, after 3 weeks of training and following the 6 13
week training intervention. All assessments were conducted in line with standardised 14
procedures reported elsewhere (34). 15
16
Lower body power - countermovement jump assessment 17
Lower body power was assessed via maximal countermovement jump height (CMJ) 18
and was conducted prior to and following 3 and 6 weeks of training. Maximal CMJ 19
was adopted as a proxy of lower body power, and was assessed using a contact mat 20
(Just Jump, Probotics, Huntsville, AL, USA). Following familiarization, independent 21
trials of CMJs were conducted with 3 min between each individual jump; the highest 22
jump being recorded for data analysis. When performing the test, participants 23
positioned themselves in the centre of the contact mat and place their hands on the 24
iliac crest where they were to remain throughout. CMJs began from an erect 25

10
standing position. When ready, participants squatted to a self-selected depth 1
perceived as their individual optimal depth, and immediately ascended to jump 2
vertically for maximal height. 3
4
Body composition - air displacement plethysmography 5
All participants lean mass and % body fat was assessed prior to and following 3 and 6
6 weeks of training. Lean mass and % body fat were assessed using air 7
displacement plethysmography (BodPod, Life Measurements Instruments, CA, USA) 8
(11, 26, 30). Initially the devise was calibrated using a metal cylinder of known and 9
standardised composition. Participants were asked to disrobe to minimal clothing 10
and place a tight fitting cap over their hair. Participants were then weighed on a 11
calibrated scale prior to entering the chamber. Once two consistent measures of 12
body composition were obtained % body fat and lean mass were calculated using 13
associated software (8). 14
15
Rate of perceived exertion 16
To examine perception of physical exertion in response to the training intervention, 17
rate of perceived exertion (RPE) was recorded during strength training. Briefly, 18
participants were required to select a number from 6 to 20, corresponding to a 19
statement which best described their level of exertion at that particular moment (4, 7, 20
31). 21
22
Blood sampling and storage 23
When blood samples were collected, participants arrived at the lab having refrained 24
from consuming food or caffeine for 2 h prior to assessment. Venous blood samples 25
11
were collected from the antecubital fossa in a branch of the basilica vein into 1
vacutainer tubes (BD Vacutainer, NJ, USA) coated with Ethylenediaminetetraacetic 2
acid (EDTA) to negate. Whole blood was subsequently centrifuged (accuSpin 3R, 3
Fisher Scientific, Loughborough, UK) at 4°C and 1509 g for 10 min, after which the 4
resultant plasma from each sample was then transferred to individual eppendorf 5
containers for subsequent storage at -80°c. Venous blood samples were collected 6
immediately before (pre) and following the cessation of exercise (post) in the initial, 7
mid and final compound training sessions (additional information presented in Table 8
1) of the 18 sessions performed. 9
10
Biochemical analysis 11
Plasma testosterone and cortisol were measured in duplicate (testosterone; ICC = 12
0.89, R = 0.89, Cortisol: ICC = 0.92, R = 0.95) via commercially available enzyme-13
linked immunosorbent assay (ELISA) kits (IBL International, Hamburg, Germany). In 14
all cases procedures were followed according to the manufacturer’s instructions. For 15
both variables, 25 ųL of each standard, control and sample were pipetted into the 16
respective wells of the mircotire plate, after which 2000 ųL of enzyme conjugate was 17
then pipetted into each well and the plate was covered and left to incubate at room 18
temperature (18 - 25°c) for 60 min. After this period the incubation solution was 19
discarded and the microplate was washed 3 times with wash buffer and distilled 20
water solution diluted at a ratio of 1:10. 100 ųL of Tetramethylbenzidine (TMB) 21
substrate solution was then pipetted into each well prior to a 15 min incubation 22
period. Immediately following this incubation 100 ųL of TMB stop solution was 23
pipetted into each well and the contents were briefly mixed by gently agitating the 24
plate. The optical density was measured at 450 nm within 10 min of the stop solution 25
12
being added using an Anthos 2010 mircoplate reader (DAZDAQ LTD, Brighton, UK 1
(reference-wavelength 600 – 650 nm)). For testosterone there was a minimum 2
detection limit of 0.2 nmol·L-1, inter-assay and intra-assay variation of 4.2 – 7.4 and 3
3.1 – 5.4 and the calibration curve revealed Pearson’s correlation coefficients (r) = 4
0.99. For cortisol there was a minimum detection limit of 6.8 nmol·L-1 with an inter-5
assay and intra-assay variation of 2.1 – 5.0 and 2.6 – 3.5, the calibration curve 6
revealed r = 0.99, respectively. 7
8
Statistical analysis 9
Data are presented as mean ± standard deviation. Values of RMs, CMJ and lean 10
mass were transformed to a percentage change (Δ%) from baseline and used for 11
analysis. Prior to analysis, dependant variables were verified as meeting required 12
assumptions of parametric statistics and changes in all assessed measures were 13
analysed using mixed model repeated measures ANOVA tests. ANOVA analysed 14
differences between 4 conditions (ST, CT3, CT1 and CON) and 3 time points 15
(baseline, mid-intervention and post-intervention). The alpha level of 0.05 was set 16
prior to data analysis. Assumptions of sphericity were assessed using Mauchly’s test 17
of sphericity, if the assumption of sphericity was violated Greenhouse Gessier 18
correction was employed. If significant effects between conditions or over time were 19
observed post-hoc differences were analysed with the use of Bonferroni correction. 20
Statistical power of the study was calculated post-hoc using G*Power statistical 21
software (v3.1.3, Düsseldorf, Germany) using the effect size, group mean, SD and 22
sample size of the primary outcome measures, in this case being lower and upper 23
body maximal strength and endocrine factors. Power was calculated as between 0.8 24
and 1 indicating sufficient statistical power (5). 25
13
1
RESULTS 2
Physical performance measures 3
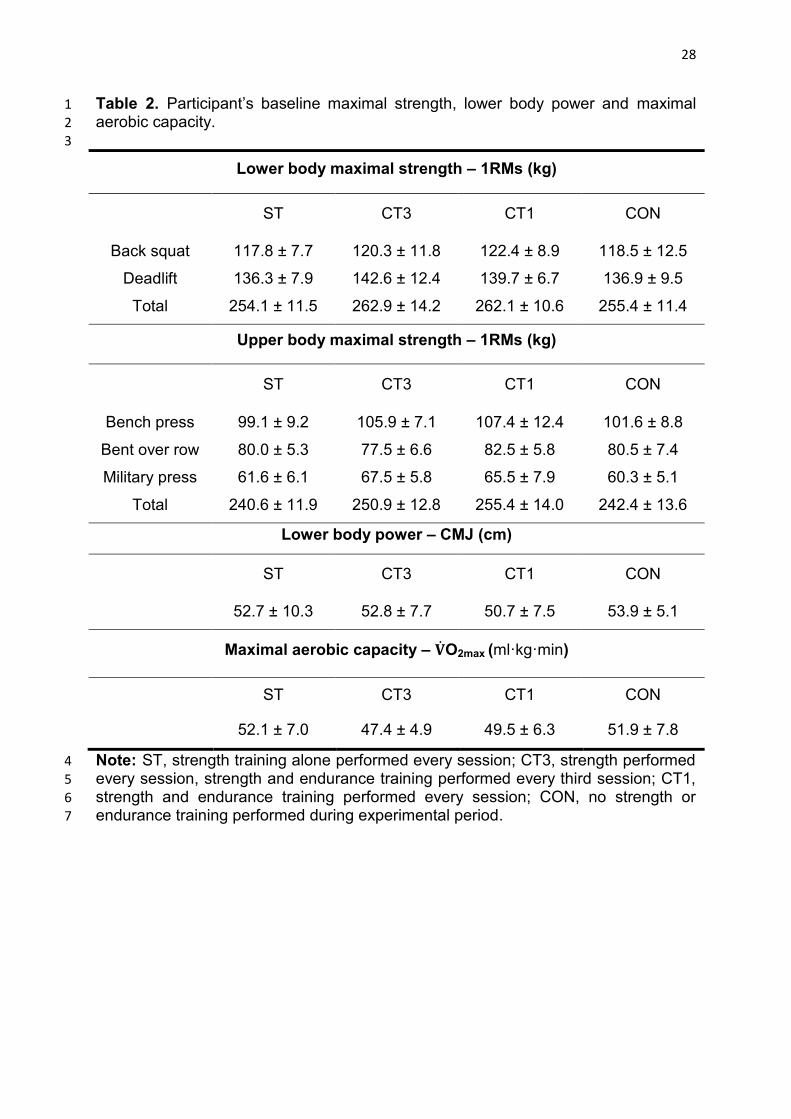
Participant’s baseline strength and endurance physical performance capabilities 4
were similar between experimental conditions, these data are presented in Table 2. 5
6
Table 2 about here 7
8
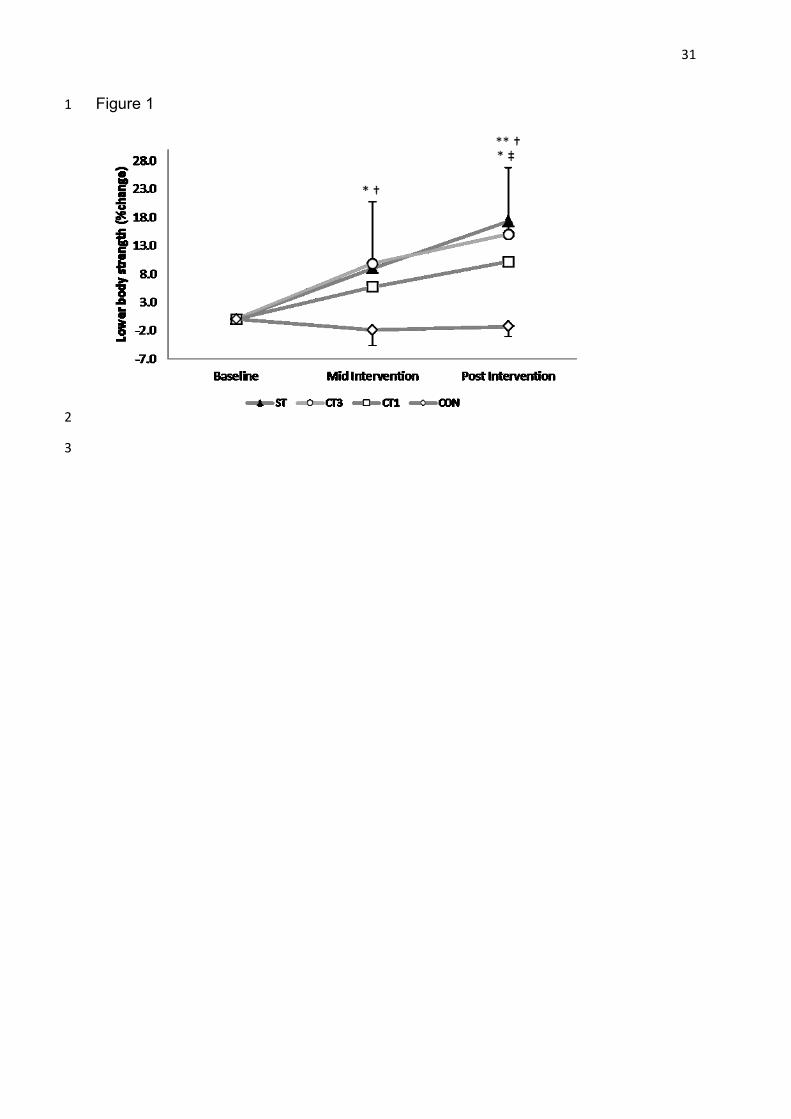
Upper and lower body maximal strength 9
A significant group x time interaction was observed (F(4, 36) = 4.940, p = 0.003) for 10
lower body strength development, as was an effect of time (F(1, 36) = 45.042, p < 11
0.001). All training conditions elicited increases in lower body strength at the mid-12
intervention time point following 3 weeks of training (ST; 9.0 ± 4.5%, p < 0.001. CT3; 13
9.8 ± 11.0%, p = 0.024. CT1; 5.8 ± 3.2%, p < 0.001). Similarly lower body strength 14
improved in all training conditions from baseline to post-intervention (ST; 17.2 ± 15
7.2%, p < 0.001. CT3; 15.0 ± 11.8%, p = 0.003. CT1; 10.1 ± 4.9%, p < 0.001). ST 16
was the only condition to significantly increase lower body strength from mid to post-17
intervention (8.3 ± 2.8%, p = 0.016, Figure 1). 18
19
Figure 1 about here 20
21
All training conditions improved lower body strength to a greater extent that CON at 22
both mid and post-intervention (all p < 0.05). Post-training ST improved lower body 23
strength 7.1 ± 2.4% more than CT1 (p = 0.036, Figure 1). 24
25
14
A significant group x time interaction (F(5, 41) = 2.895, p = 0.027) and an effect of time 1
(F(2, 36) = 31.510, p < 0.001) were observed for upper body strength development. 2
CT3 and CT1 both improved upper body strength between baseline to mid-3
intervention (6.2 ± 6.9%, p = 0.024 and 7.8 ± 4.5%, < 0.001 respectively, Figure 2). 4
All training conditions increased upper body strength from pre to post-training (all p < 5
0.05). Upper body strength improved in all training conditions following training 6
interventions (ST; 10.5 ± 5.2%, p < 0.001. CT3; 10.6 ± 10.7%, p = 0.014. CT1; 12.1 7
± 6.9%, p < 0.001). ST was the only condition to improve upper body strength from 8
mid to post-training (6.9 ± 0.1%, p = 0.019). 9
10
Figure 2 about here 11
12
All training conditions elicited significantly greater increases in upper body strength 13
than CON at mid- and post intervention (all p < 0.05, Figure 2). 14
15
Lower body power 16
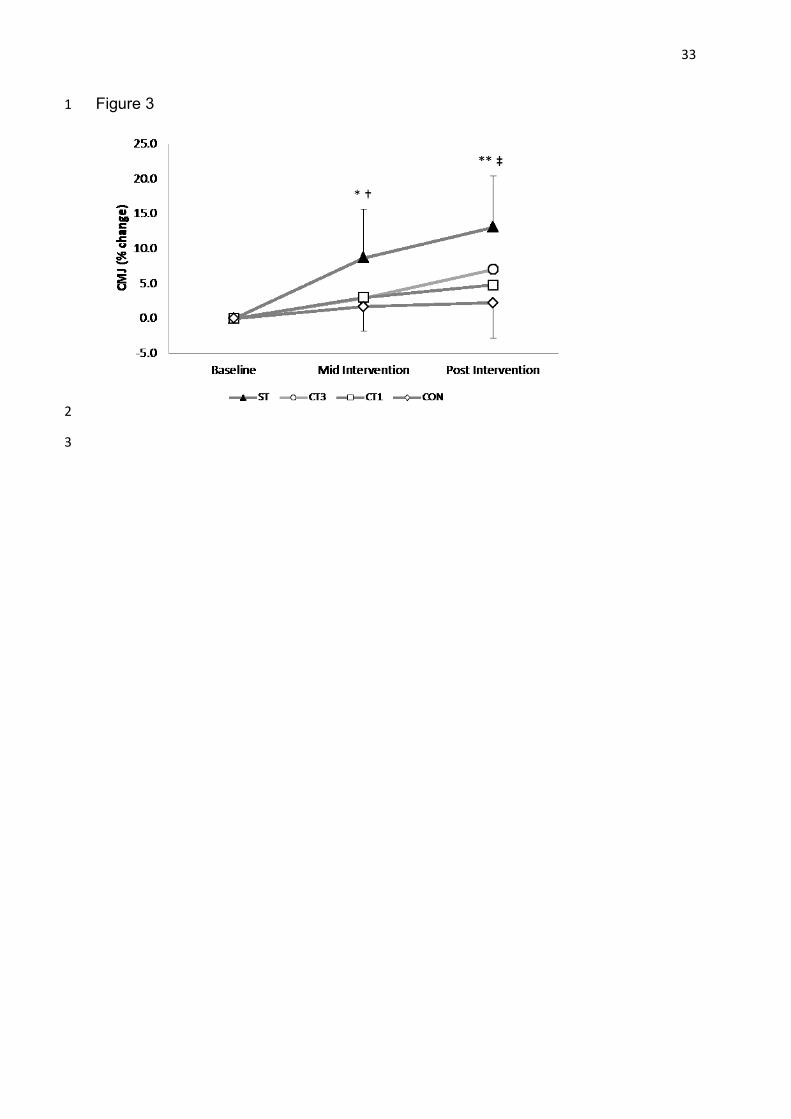
A significant group x time interaction (F(6, 52) = 3.236, p = 0.009) and effect of time 17
(F(2, 52) = 26.086, p < 0.001) were observed for lower body power development. Both 18
ST and CT1 increased CMJ from baseline to mid-intervention (ST; 8.7 ± 7.0%, p = 19
0.003. CT1; 3.0 ± 2.3%, p = 0.002). Post-intervention all training conditions elicited 20
significant increases in CMJ from baseline (ST; 13.1 ± 7.3%, p < 0.001. CT3; 7.1 ± 21
3.7%, p < 0.001. CT1; 4.8 ± 2.3%, p < 0.001; Figure 3). 22
23
Figure 3 about here 24
25
15
Participants in the ST condition achieved significantly higher CMJ than those 1
following CT1 (7.0 ± 3.5%) and CON (5.7 ± 4.7%) conditions after 3 weeks of 2
training (i.e. mid-intervention) (both p = 0.04). Following training (i.e. post-3
intervention), ST elicited 6.0 ± 3.6% greater increases in CMJ than CT3, 8.3 ± 5.0% 4
greater than CT1 and 10.9 ± 2.3% greater than CON (all p < 0.05). 5
6
Strength training performance 7
During the first 3 weeks of the training intervention all groups ability to maintain the 8
required training intensity was similar (F(3, 30) = 1.063, p = 0.548) and did not change 9
significantly over time (F(1, 30) = 4.295, p = 0.062). Similar results were observed in 10
the final 3 weeks of the intervention as ability to maintain designated training load 11
was not different between conditions (F(3, 28) = 1.301, p = 0.293) or over time (F(1, 28) 12
= 3.777, p = 0.052). 13
14
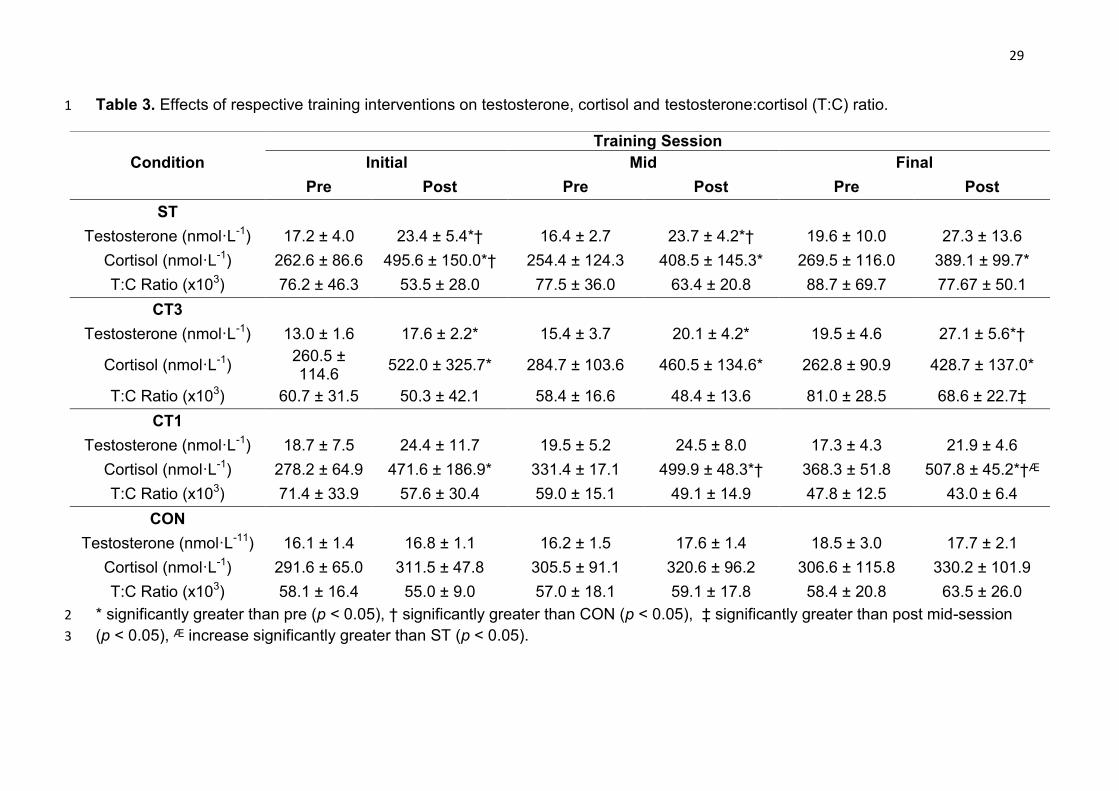
Testosterone 15
No group x time interaction was reported for circulating basal testosterone 16
concentrations (F(6, 52) = 1.820 p = 0.113, Table 3). A significant group x time 17
interaction was however observed for the testosterone response to strength training 18
(F(3, 26) = 11.466, p < 0.001). Testosterone responses to the respective training 19
interventions also changed significantly over time (F(1, 26) = 130.683, p < 0.001). 20
Following the initial and mid sessions ST was the only condition to increase 21
testosterone levels greater than CON (30.7 ± 5.0%, p = 0.04 and 37.1 ± 12.9% p = 22
0.005 respectively). CT3 was the only condition to elicit a greater increase in 23
testosterone than CON post the final session (42.2 ± 10.5%, p = 0.002). ST and CT3 24
elicited significant increases from pre training in both the mid and final sessions (all p 25
16
< 0.05). Testosterone was also increased post training in the CT3 condition following 1
the final session (p = 0.01). No other increases were observed. 2
3
Cortisol 4
No group x time interaction was observed for circulating basal cortisol concentrations 5
(F(6, 52) = 1.540, p = 0.184, Table 3). A significant a group x time interaction (F(3, 26) = 6
7.592, p = 0.001) and an effect of time (F(1, 26) = 101.852, p < 0.001) were observed 7
for cortisol responses to the respective training interventions. Following the initial 8
session ST was the only condition to increase cortisol levels to a greater extent than 9
CON (84.7 ± 22.1%, p = 0.014). Post training after the mid-intervention session CT1 10
was the only condition which resulted in significantly greater cortisol increases than 11
CON (49.2 ± 3.1%, p < 0.001). Following the final session, CT1 elicited 26.6 ± 8.4% 12
greater cortisol increases than ST (p < 0.008). All training conditions elicited 13
significant increases in cortisol post training on all assessed sessions (all p < 0.05). 14
15
Testosterone-cortisol ratio 16
No group x time interactions were present for basal testosterone:cortisol ratio (T:C 17
ratio) (F(6, 52) = 1.903, p = 0.098) nor the T:C ratio response to training (F(6, 52) = 18
1.124, p = 0.361). 19
20
Table 3 about here 21
22
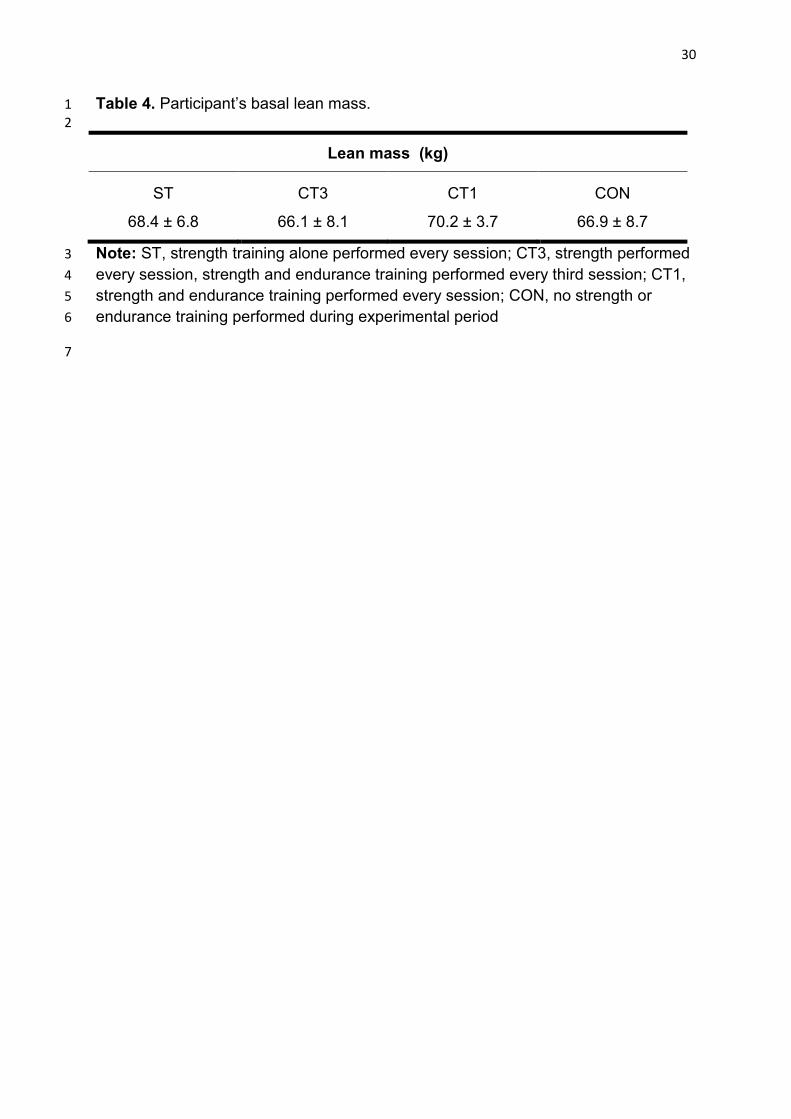
Lean mass 23

17
Participant’s baseline lean mass was similar between experimental conditions, these 1
data are presented in Table 4. No group x time interaction was observed for changes 2
in participant’s lean mass. 3
4
Table 4 about here 5
6
Body fat % 7
A significant group x time interaction was observed for body fat % (F(6, 52) = 4.616, p 8
= 0.001). Following the 6 week training intervention, CT1 resulted in 2.65 ± 0.04% 9
greater decreases in body fat % than CON (p < 0.001) at the post-intervention time 10
point. No other significant effects of time or group were observed for changes in 11
body fat %. 12
13
14
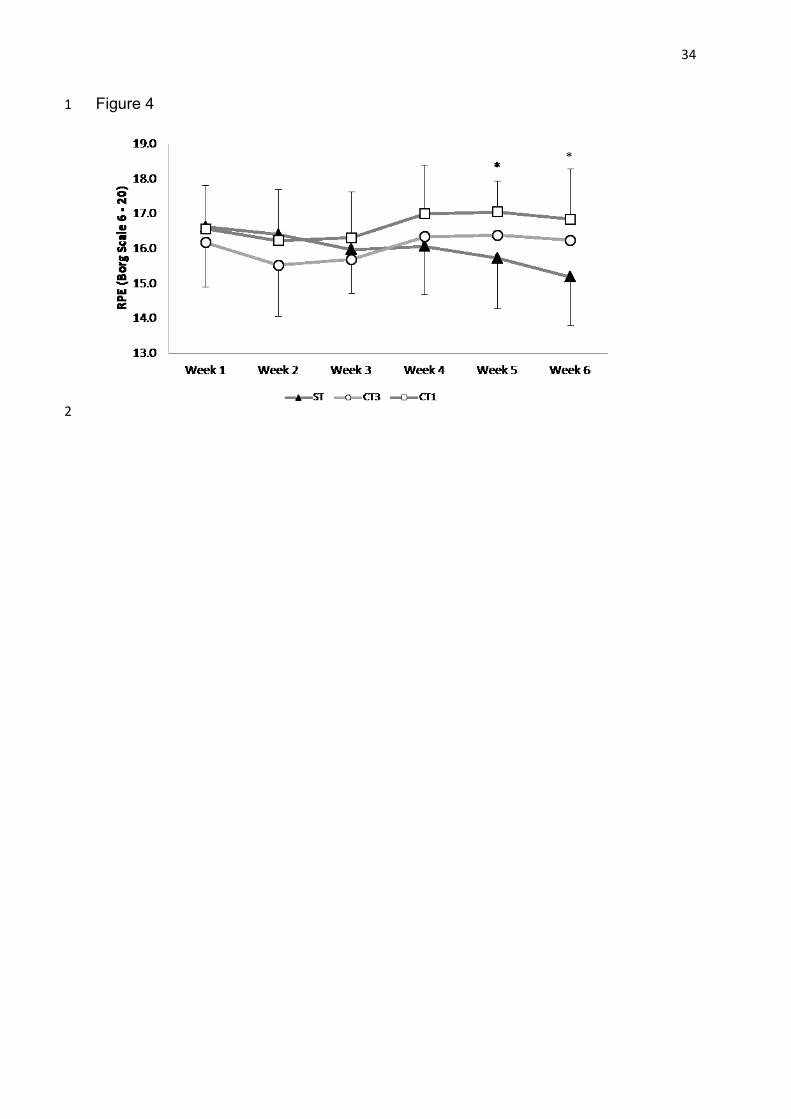
Rate of perceived exertion 15
A significant group x time interaction was present for RPE (F(5, 52) = 2.744, p = 16
0.029). At week 5 and 6 of the training intervention RPE was significantly lower in the 17
ST group than CT1 (both p < 0.05) (Figure 4). No other interactions or effects were 18
present. 19
20
Figure 4 about here 21
22
DISCUSSION 23
The present study sought to prioritise strength development in concurrent training 24
regimens with varying volumes of endurance training. The primary finding of this 25

18
study was that an increase in the frequency of endurance training and total training 1
volume within the concurrent training paradigm resulted in the attenuated 2
development of lower body strength when compared to strength training alone. 3
Following 6 weeks of training, ST and CT3 conditions resulted in similar increases in 4
lower body strength, whereas the improvements of those performing both strength 5
and endurance training collectively 3 times per week (CT1) were muted (Figure 1). 6
These findings reflect data presented in our previous work (20), in which ST and CT3 7
resulted in similar increases in maximal voluntary contraction (MVC), whereas 8
increases in the CT1 condition were significantly lower. Although no other published 9
research has examined differing frequencies of strength and endurance training on 10
strength-related adaptation, studies employing concurrent training frequencies of ≥ 3 11
d·wk-1 have typically reported some manifestation of interference characteristics (2, 12
14, 19, 22). Lower concurrent training frequencies (≤ 2 d·wk-1) have however 13
resulted in similar development of strength related phenotypes following both 14
concurrent and strength training programmes (24, 25). When combined, the findings 15
of these studies are consistent with those of the present study. Concurrent training 16
conducted 3 d·wk-1 (CT1) resulted in inhibited gains in maximal lower body strength, 17
whereas performing concurrent training once per week with 2 strength alone 18
sessions (CT3; concurrent training frequency of 1 d·wk-1) elicited similar lower body 19
strength increases than strength-training in isolation. The findings of this study and 20
those of previous research indicate higher training volumes and elevated 21
physiological stress may contribute to the presence of the interference phenomenon. 22
23
In addition to the inhibition of lower body strength development lower body power 24
development was also inhibited following 3 and 6 weeks of training in the CT1 25
19
condition when compared with strength training alone (Figure 3). Furthermore, lower 1
volumes of endurance training also resulted in attenuated increases in lower body 2
power, as post-intervention participants who performed strength and endurance 3
training at a ratio of 3:1 (CT3) exhibited improvements which were 6.0 ± 3.6% (p = 4
0.04, smallest worthwhile change = 1.2% (18)) lower than those who performed 5
strength training alone. As previously stated, maximal lower body strength 6
development was not different between ST and CT3 conditions (Figure 1), which 7
may indicate that power phenotypes are more susceptible to interference than 8
maximal strength indices. This suggestion is supported by previous research 9
indicating that development of variables including CMJ, rate of force development 10
(RFD) and peak torques at high velocities have been inhibited as a result of 11
combining strength and endurance training, yet maximal strength development 12
remained uninhibited (6, 9, 14). 13
14
Unlike lower body strength and power development, increases in upper body 15
strength were similar following both strength training alone and both concurrent 16
training conditions (CT3 and CT1). Furthermore, following 3 weeks of training CT1 17
resulted in 4.2 ± 0.8% greater increases than strength training alone (Figure 2), 18
although this was not statistically significant (p = 0.09). Previous research has also 19
reported concurrent training does not result in the inhibition of upper body maximal 20
strength (1, 3). Unlike the present study, which employed steady state running, 21
previous research involved rowing (3) and arm cranking (1) as the endurance 22
training modalities. It may be argued that whilst aerobically demanding the stimuli of 23
arm cranking and rowing are further towards the strength end of the strength-24
endurance continuum than steady state running. As such, it is reasonable to suggest 25
20
that concurrent training may not differently affect the upper body musculature, but 1
rather for interference to occur the assessed musculature must experience divergent 2
contractile activity (i.e. strength and endurance stimulus) of contrasting intensities 3
and durations. It is reasonable to suggest that the lower body musculature was 4
placed in a greater state of conflict than the upper body, as both training stimuli 5
directly affected hip dominant and lower limb muscle groups and only the strength 6
training protocol required noteworthy contributions from the upper body musculature. 7
Due to the relatively low number of high force contractions involved in strength 8
training and the continuous lower force contractions experienced during endurance 9
training, different patterns of motor unit activation are required. It is possible that the 10
divergent demands placed on the neuromuscular system by strength and endurance 11
training elicited differing alterations in motor unit recruitment in the musculature of 12
the lower limbs, previous research has also implicated altered neural activation 13
during high force contractions as a potential mechanism for impaired strength 14
development (22, 23). Morevover, the potential alterered neural recruitment during 15
rapid and high force contractions may have contributed to the inhibition of lower body 16
power development as a result of both high and low frequncies of concurrent training 17
(Figure 3). 18
19
Following the final training session of the intervention CT1 elicited greater cortisol 20
levels than ST which is consistent with previous research (2, 3). This may indicate 21
higher frequencies of concurrent training can result in elevated physiological stress, 22
which was also reflected in participant’s perceived exertion during training (Figure 4). 23
In additional to enhanced training stress elevations in cortisol have been implicated 24
in catabolism and impaired hypertrophic development with concurrent training (22). 25
21
However, in the present study increases in lean mass were similar between training 1
conditions, as such it is unlikely the observed elevations in cortisol influenced muscle 2
morphological adaptation. The variance in the findings of the present study and 3
those of Kraemer et al. (22) are perhaps due to the differing lengths of the respective 4
training programmes. Kraemer et al. (22) employed a 12 week intervention whereas 5
in the present study participants trained for 6 weeks. As the CT1 condition resulted in 6
the inhibition of strength development following 6 weeks of training it may be 7
speculated that had the interventions been longer CT1 may have also resulted in 8
impaired increases in lean mass. 9
10
PRACTICAL APPLICATIONS 11
The findings of this study build on the understanding of concurrent training 12
developed in the isolated limb model discussed in our previous work (20). The data 13
presented here indicate that if strength development is the primary goal of an training 14
programme, endurance-training frequency should be kept to a minimum. It should 15
however be noted, that this minimal dose of endurance training should be sufficient 16
to maintain any necessary endurance performance characteristics. Also the 17
elevations in post exercise cortisol concentrations observed only in participants 18
conducting strength and endurance training 3 times weekly indicate that overall 19
training stress likely plays a key role in the inhibition of strength development. 20
Therefore if a concurrent training programme must be performed it is imperative that 21
appropriate monitoring strategies are employed to ensure training stress doesn’t 22
become too great and result in the plateau of strength development. Furthermore if 23
development of power type characteristics is required then it appears that frequency 24
and volume of endurance training should be minimized or omitted from the 25

22
programme all together. This may be achieved via appropriate programme 1
construction and periodization to allow power development to occur in periods in 2
which endurance type training can be kept to a minimum. 3

23
REFERENCES 1
1. Abernethy PJ and Quigley BM. Concurrent strength and endurance training of the elbow 2 extensors. The Journal of Strength & Conditioning Research 7: 234-240, 1993. 3
2. Bell G, Syrotuik D, Martin T, Burnham R, and Quinney H. Effect of concurrent strength and 4 endurance training on skeletal muscle properties and hormone concentrations in humans. 5 European Journal of Applied Physiology 81: 418-427, 2000. 6
3. Bell G, Syrotuik D, Socha T, Maclean I, and Quinney HA. Effect of strength training and 7 concurrent strength and endurance training on strength, testosterone, and cortisol. The 8 Journal of Strength & Conditioning Research 11: 57-64, 1997. 9
4. Borg G. Perceived exertion as an indicator of somatic stress. Scandinavian Journal of 10 Rehabilitation Medicine 2: 92-98, 1970. 11
5. Cohen J. Statistical power analysis. Current Directions in Psychological Science 1: 98-101, 12 1992. 13
6. Craig BW, Lucas J, Pohlman R, and Stelling H. The effects of running, weightlifting and a 14 combination of both on growth hormone release. The Journal of Strength & Conditioning 15 Research 5: 198-206, 1991. 16
7. Day ML, McGuigan MR, Brice G, and Foster C. Monitoring exercise intensity during resistance 17 training using the session RPE scale. The Journal of Strength & Conditioning Research 18: 18 353-358, 2004. 19
8. Dempster P and Aitkens S. A new air displacement method for the determination of human 20 body composition. Medicine & Science in Sports & Exercise 27: 1692-1697, 1995. 21
9. Dudley GA and Djamil R. Incompatibility of endurance-and strength-training modes of 22 exercise. Journal of Applied Physiology 59: 1446-1451, 1985. 23
10. Dudley GA and Fleck SJ. Strength and endurance training are they mutually exclusive? Sports 24 Medicine 4: 79-85, 1987. 25
11. Fields DA, Goran MI, and McCrory MA. Body-composition assessment via air-displacement 26 plethysmography in adults and children: a review. The American Journal of Clinical Nutrition 27 75: 453-467, 2002. 28
12. García-Pallarés J and Izquierdo M. Strategies to optimize concurrent training of strength and 29 aerobic fitness for rowing and canoeing. Sports Medicine 41: 329-343, 2011. 30
13. Gravelle BL and Blessing DL. Physiological adaptation in women concurrently training for 31 strength and endurance. The Journal of Strength & Conditioning Research 14: 5-13, 2000. 32
14. Häkkinen K, Alen M, Kraemer W, Gorostiaga E, Izquierdo M, Rusko H, Mikkola J, Häkkinen A, 33 Valkeinen H, and Kaarakainen E. Neuromuscular adaptations during concurrent strength and 34 endurance training versus strength training. European Journal of Applied Physiology 89: 42-35 52, 2003. 36
15. Hayes LD, Bickerstaff GF, and Baker JS. Interactions of cortisol, testosterone, and resistance 37 training: influence of circadian rhythms. Chronobiology International 27: 675-705, 2010. 38
16. Hennessy LC and Watson AWS. The interference effects of training for strength and 39 endurance simultaneously. The Journal of Strength & Conditioning Research 8: 12-19, 1994. 40
17. Hickson RC. Interference of strength development by simultaneously training for strength 41 and endurance. European Journal of Applied Physiology and Occupational Physiology 45: 42 255-263, 1980. 43
18. Hopkins WG. How to interpret changes in an athletic performance test. Sportscience 8: 1-7, 44 2004. 45
19. Izquierdo M, Häkkinen K, Ibanez J, Kraemer WJ, and Gorostiaga EM. Effects of combined 46 resistance and cardiovascular training on strength, power, muscle cross-sectional area, and 47 endurance markers in middle-aged men. European Journal of Applied Physiology 94: 70-75, 48 2005. 49

24
20. Jones TW, Howatson G, Russell M, and French DN. Performance and neuromuscular 1 adaptations following differing ratios of concurrent strength and endurance training. J 2 Strength Cond Res 27: 3342-3351, 2013. 3
21. Kraemer WJ, Gordon S, Fleck S, Marchitelli L, Mello R, Dziados J, Friedl K, Harman E, Maresh 4 C, and Fry A. Endogenous anabolic hormonal and growth factor responses to heavy 5 resistance exercise in males and females. International Journal of Sports Medicine 12: 228-6 235, 2008. 7
22. Kraemer WJ, Patton JF, Gordon SE, Harman EA, Deschenes MR, Reynolds K, Newton RU, 8 Triplett NT, and Dziados JE. Compatibility of high-intensity strength and endurance training 9 on hormonal and skeletal muscle adaptations. Journal of Applied Physiology 78: 976-989, 10 1995. 11
23. Leveritt M and Abernethy PJ. Acute effects of high-intensity endurance exercise on 12 subsequent resistance activity. The Journal of Strength & Conditioning Research 13: 47-51, 13 1999. 14
24. McCarthy J, Agre JC, Graf B, Pozniak MA, and Vailas AC. Compatibility of adaptive responses 15 with combining strength and endurance training. Medicine & Science in Sports & Exercise 27: 16 429-436, 1995. 17
25. McCarthy J, Pozniak MA, and Agre JC. Neuromuscular adaptations to concurrent strength 18 and endurance training. Medicine & Science in Sports & Exercise 34: 511-519, 2002. 19
26. McCrory MA, Gomez TD, Bernauer EM, and Molé PA. Evaluation of a new air displacement 20 plethysmograph for measuring human body composition. Medicine & Science in Sports & 21 Exercise 27: 1686-1691, 1995. 22
27. Peterson MD, Rhea MR, and Alvar BA. Maximizing strength development in athletes: a meta-23 analysis to determine the dose-response relationship. The Journal of Strength & Conditioning 24 Research 18: 377-382, 2004. 25
28. Peterson MD, Rhea MR, and Alvar BA. Applications of the Dose-Response for Muscular 26 Strength Development: Areview of Meta-Analytic Efficacy and Reliability for Designing 27 Training Prescription. The Journal of Strength & Conditioning Research 19: 950-962, 2005. 28
29. Rønnestad BR, Hansen EA, and Raastad T. High volume of endurance training impairs 29 adaptations to 12 weeks of strength training in well-trained endurance athletes. European 30 Journal of Applied Physiology 112: 1457-1466, 2011. 31
30. Siri WE. Body composition from fluid spaces and density: analysis of methods, in: Techniques 32 for Measuring Body Composition. WE Siri, ed., 1961, pp 223-244. 33
31. Sweet TW, Foster C, McGuigan MR, and Brice G. Quantitation of resistance training using the 34 session rating of perceived exertion method. The Journal of Strength & Conditioning 35 Research 18: 796-802, 2004. 36
32. Volek JS, Kraemer WJ, Bush JA, Incledon T, and Boetes M. Testosterone and cortisol in 37 relationship to dietary nutrients and resistance exercise. Journal of Applied Physiology 82: 38 49-54, 1997. 39
33. Volpe SL, Walberg-Rankin J, Rodman KW, and Sebolt DR. The effect of endurance running on 40 training adaptations in women participating in a weight lifting program. The Journal of 41 Strength & Conditioning Research 7: 101-109, 1993. 42
34. Walshe I, Robson-Ansley P, Gibson ASC, Lawrence C, Thompson KG, and Ansley L. The 43 reliability of the IL-6, sIL-6R and sgp130 response to a preloaded time trial. European journal 44 of applied physiology 110: 619-625, 2010. 45
46
47

25
ACKNOWLEDGEMENTS 1
The authors would like to thank all individuals who volunteered to participate in the 2
study. Additional thanks go to Luke Dopson, Jordan Heath, Ashkan Hakimian, Scott 3
Keeling and Sean Armstrong for their assistance with data collection. The results of 4
the present study do not constitute any endorsement from the NSCA. 5

26
Figure Legends 1 2 Figure 1. Mean relative changes in lower body strength (as assessed by back squat 3 and deadlift) in response to respective training interventions in the ST (n = 8), CT3 (n 4
= 8), CT1 (n = 8) and CON (n = 6) conditions. ST, strength training alone performed 5 every session; CT3, strength performed every session, strength and endurance 6 training performed every third session; CT1, strength and endurance training 7 performed every session; CON, no strength or endurance training performed during 8 experimental period. * significant increases from baseline in all training conditions (p 9 < 0.05). ** significant increase from mid-intervention in ST (p = 0.016). † significantly 10
greater increases than CON in training conditions (p < 0.05). ‡ ST significantly 11 greater than CT1 (p = 0.036). 12
13 14 Figure 2. Mean relative changes in upper body strength (as assessed by bench 15 press, bent over row and military press) in response to respective training 16 interventions in the ST (n = 8), CT3 (n = 8), CT1 (n = 8) and CON (n = 6) conditions. 17
ST, strength training alone performed every session; CT3, strength performed every 18 session, strength and endurance training performed every third session; CT1, 19 strength and endurance training performed every session; CON, no strength or 20
endurance training performed during experimental period. * significant increases 21 from baseline in CT3 and CT1 (p < 0.05). ** significant increases from baseline in all 22 training conditions (p < 0.05). † Significant increase from mid-intervention in ST (p = 23
0.019). ‡ all training conditions greater than CON (p < 0.05). 24
25 26 Figure 3. Mean relative changes in countermovement jump height in response to 27
respective training intervention s in the ST (n = 8), CT3 (n = 8), CT1 (n = 8) and CON 28 (n = 6) conditions. ST, strength training alone performed every session; CT3, 29
strength performed every session, strength and endurance training performed every 30 third session; CT1, strength and endurance training performed every session; CON, 31 no strength or endurance training performed during experimental period. * ST and 32 CT1 significantly greater than baseline (p < 0.05). ** ST, CT3 and CT1 significantly 33
greater than baseline (p < 0.001). † ST significantly greater than CT1 and CON (p < 34 0.05). ‡ ST significantly greater than CT3, CT1 and CON (all p < 0.05). 35
36 37
Figure 4. Mean RPE experienced in the ST (n = 8), CT3 (n = 8) and CT1 (n = 8) 38 conditions. ST, strength training alone performed every session; CT3, strength 39 performed every session, strength and endurance training performed every third 40
session; CT1, strength and endurance training performed every session. * ST 41 significantly lower than CT1 (p < 0.05). 42
43

27
Table 1. Programme variables within periodized resistance training intervention. 1 2
Week 1 Pre-intervention assessments
Week 2 Familiarisation
Sets 3
Repetitions 10
% 1RM 70
Rest (s) 90
Weeks 3 – 5 Training
Sets 4
Repetitions 8
% 1RM 80
Rest (s) 120
Week 6 Mid-intervention assessments
Week 7 – 9 Training
Sets 5
Repetitions 6
% 1RM 85
Rest (s) 120
Week 10 Post-intervention assessments
Sessions Compound Pull Push
back squat, bench
press, bent over row,
dead lift and military
press
high pull, lat pull down,
seated row, standing
dumbbell reverse fly
and seated hamstring
curls
incline bench press,
front squat, push
press, seated leg
press and dumbbell
chest flys
3
28
Table 2. Participant’s baseline maximal strength, lower body power and maximal 1 aerobic capacity. 2 3
Lower body maximal strength – 1RMs (kg)
ST CT3 CT1 CON
Back squat 117.8 ± 7.7 120.3 ± 11.8 122.4 ± 8.9 118.5 ± 12.5
Deadlift 136.3 ± 7.9 142.6 ± 12.4 139.7 ± 6.7 136.9 ± 9.5
Total 254.1 ± 11.5 262.9 ± 14.2 262.1 ± 10.6 255.4 ± 11.4
Upper body maximal strength – 1RMs (kg)
ST CT3 CT1 CON
Bench press 99.1 ± 9.2 105.9 ± 7.1 107.4 ± 12.4 101.6 ± 8.8
Bent over row 80.0 ± 5.3 77.5 ± 6.6 82.5 ± 5.8 80.5 ± 7.4
Military press 61.6 ± 6.1 67.5 ± 5.8 65.5 ± 7.9 60.3 ± 5.1
Total 240.6 ± 11.9 250.9 ± 12.8 255.4 ± 14.0 242.4 ± 13.6
Lower body power – CMJ (cm)
ST CT3 CT1 CON
52.7 ± 10.3 52.8 ± 7.7 50.7 ± 7.5 53.9 ± 5.1
Maximal aerobic capacity – �̇�O2max (ml·kg·min)
ST CT3 CT1 CON
52.1 ± 7.0 47.4 ± 4.9 49.5 ± 6.3 51.9 ± 7.8
Note: ST, strength training alone performed every session; CT3, strength performed 4
every session, strength and endurance training performed every third session; CT1, 5 strength and endurance training performed every session; CON, no strength or 6 endurance training performed during experimental period. 7
29
Table 3. Effects of respective training interventions on testosterone, cortisol and testosterone:cortisol (T:C) ratio. 1
* significantly greater than pre (p < 0.05), † significantly greater than CON (p < 0.05), ‡ significantly greater than post mid-session 2
(p < 0.05), ᴭ increase significantly greater than ST (p < 0.05).3
Training Session
Condition Initial Mid Final
Pre Post Pre Post Pre Post
ST
Testosterone (nmol·L-1) 17.2 ± 4.0 23.4 ± 5.4*† 16.4 ± 2.7 23.7 ± 4.2*† 19.6 ± 10.0 27.3 ± 13.6
Cortisol (nmol·L-1) 262.6 ± 86.6 495.6 ± 150.0*† 254.4 ± 124.3 408.5 ± 145.3* 269.5 ± 116.0 389.1 ± 99.7*
T:C Ratio (x103) 76.2 ± 46.3 53.5 ± 28.0 77.5 ± 36.0 63.4 ± 20.8 88.7 ± 69.7 77.67 ± 50.1
CT3
Testosterone (nmol·L-1) 13.0 ± 1.6 17.6 ± 2.2* 15.4 ± 3.7 20.1 ± 4.2* 19.5 ± 4.6 27.1 ± 5.6*†
Cortisol (nmol·L-1) 260.5 ± 114.6
522.0 ± 325.7* 284.7 ± 103.6 460.5 ± 134.6* 262.8 ± 90.9 428.7 ± 137.0*
T:C Ratio (x103) 60.7 ± 31.5 50.3 ± 42.1 58.4 ± 16.6 48.4 ± 13.6 81.0 ± 28.5 68.6 ± 22.7‡
CT1
Testosterone (nmol·L-1) 18.7 ± 7.5 24.4 ± 11.7 19.5 ± 5.2 24.5 ± 8.0 17.3 ± 4.3 21.9 ± 4.6
Cortisol (nmol·L-1) 278.2 ± 64.9 471.6 ± 186.9* 331.4 ± 17.1 499.9 ± 48.3*† 368.3 ± 51.8 507.8 ± 45.2*†ᴭ
T:C Ratio (x103) 71.4 ± 33.9 57.6 ± 30.4 59.0 ± 15.1 49.1 ± 14.9 47.8 ± 12.5 43.0 ± 6.4
CON
Testosterone (nmol·L-11) 16.1 ± 1.4 16.8 ± 1.1 16.2 ± 1.5 17.6 ± 1.4 18.5 ± 3.0 17.7 ± 2.1
Cortisol (nmol·L-1) 291.6 ± 65.0 311.5 ± 47.8 305.5 ± 91.1 320.6 ± 96.2 306.6 ± 115.8 330.2 ± 101.9
T:C Ratio (x103) 58.1 ± 16.4 55.0 ± 9.0 57.0 ± 18.1 59.1 ± 17.8 58.4 ± 20.8 63.5 ± 26.0
30
Table 4. Participant’s basal lean mass. 1 2
Lean mass (kg)
ST CT3 CT1 CON
68.4 ± 6.8 66.1 ± 8.1 70.2 ± 3.7 66.9 ± 8.7
Note: ST, strength training alone performed every session; CT3, strength performed 3
every session, strength and endurance training performed every third session; CT1, 4
strength and endurance training performed every session; CON, no strength or 5
endurance training performed during experimental period 6
7
31
Figure 1 1
2
3

32
Figure 2 1
2
3
33
Figure 3 1
2
3
34
Figure 4 1
2