Embed Size (px)
Citation preview
.11 _II~IIIIII 1---
point Spread-Function, Line Spread-Function,and Modulation Transfer Function
Tools for the Study of Imaging Systems!
KURT ROSSMANN, Ph.D.
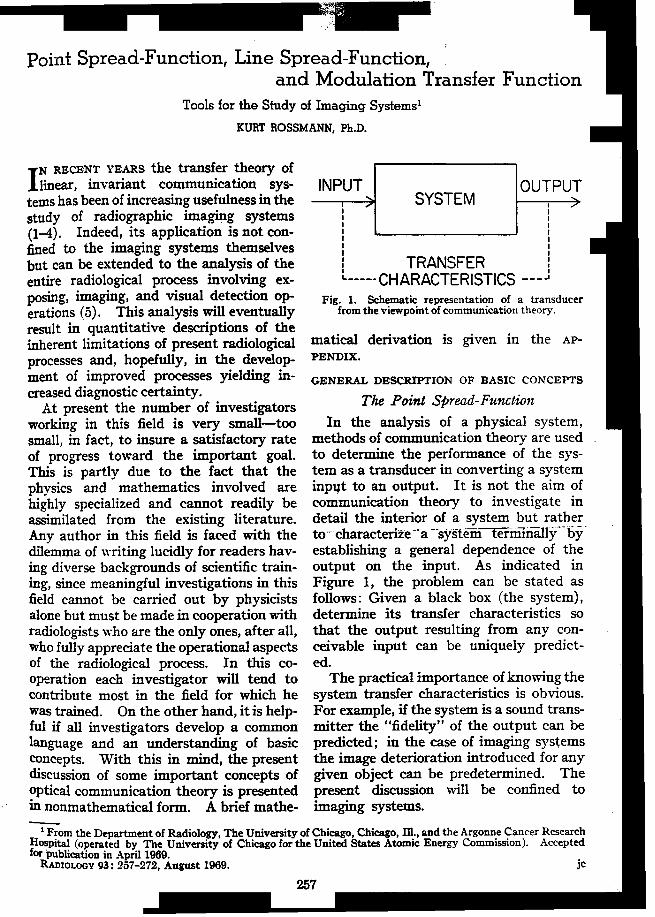
IN RECENT YEARS the transfer theory oflinear, invariant communication sys- INPUT OUTP
tems has been of increasing usefulness in the SYSTEMstudy of radiographic ima~g systems : !
(1-4). Indeed, its application is not con- : :fined to the imaging systems themselves ! Ibut can be extended to the analysis of the : TRANSFER !entire radiological process involving ex- L CHARACTERISTICS --_J
pos~g, i~aging, .and visu:al ~etection op- Fig. 1. Sch~atic. representation of a transducereratlons (u). ThIS analYSIs WIll eventually from the vlewpomt of communication theory.
result in quantitative descriptions of theinherent limitations of present radiological matical derivation is given in the AP-processes and, hopefully, in the develop- PENDIX.
ment of .impro,:ed pro.cesses yielding in- GENERAL DESCRIPTION OF BASIC CONCEPTScreased dIagnostIc certamty. ..
At present the number of investigators The Potont Spread-Funchon
working in this field is very small-too In the analysis of a physical system,small, in fact, to insure a satisfactory rate methods of communication theory are usedof progress toward the important goal. to determine the performance of the sys-This is partly due to the fact that the tern as a transducer in converting a systemphysics and mathematics involved are inpqt to an output. It is not the aim ofhighly specialized and cannot readily be communication theory to investigate inassimilated from the existing literature. detail the interior of a system but ratherAny author in this field is faced with the to-characterize-a--system-re-rmirialfy--bydilemma of ".riting lucidly for readers hav- establishing a general dependence of theing diverse backgrounds of scientific train- output on the input. As indicated ining, since meaningful investigations in this Figure 1, the problem can be stated asfield cannot be carried out by physicists follows: Given a black box (the system),alone but must be made in cooperation with determine its transfer characteristics soradiologists ,vho are the only ones, after all, that the output resulting from any cl)n-who fully appreciate the operational aspects ceivable input can be uniquely predict-of the radiological process. In this co- ed.operation each investigator will tend to The practical importance ofkno\vingthecontribute most in the field for which he system transfer characteristics is obvious.was trained. On the other hand, it is help- For example, if the system is a sound trans-ful if all investigators develop a common mitter the "fidelity" of the output can belanguage and an understanding of basic predicted; in the case of imaging systemsconcepts. With this in mind, the present the image deterioratwn introduced for anydiscussion of some important concepts of given object can be predetermined. The?ptical communication theory is presented present discussion will be confined toIn nonmathematical form. A brief mathe- imaging systems.-
1 F~om the Department of Radiology, The University of Chicago, Chicago, Ill., and the Argonne Cancer Research
rOSPlta1 (operated by The University of Chicago for the United States Atomic Energy Commission). Acceptedor publication in April 1969.
RADIOLOGY 93: 257-27==- 257 j'~272, August 1969. jc
257
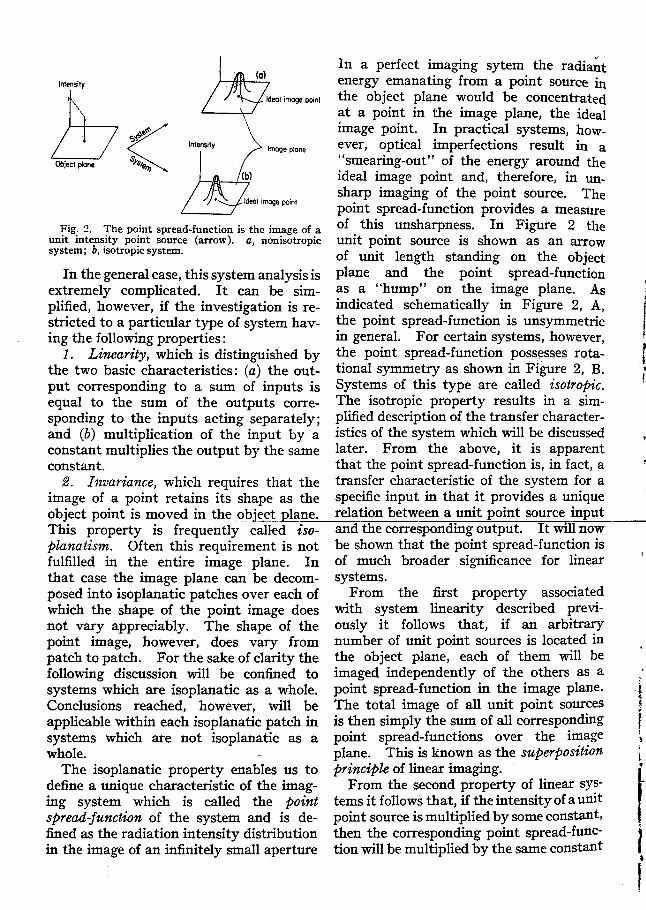
In a perfect ima~ng sytem the radi~tIntensity energy emanating from a point source in
h ' Ideal image point the object plane would be concentrated
\. at a point in the image plane, the ideal~~ image point, In practical systems, how-c,~ knoge plane ever, optical imperfections result in a
Object plane $J'.tfe "smearing-out" of the energy around the'" ideal image point and, therefore, in un-
sharp ima~ng of the point source, Theage poInt , d f ' ' dpomt sprea - unction proVl es a measure
Fig. 2. The point spread-function is the image of a of this unsharpness, In Figure 2 theunit intens,ity po!nt source (arrow). a, non isotropic unit point source is shown as an arrowsystem; b, ISOtrOpiC system, of U ' t I gth t d. th b . till en s an mg on e 0 Jec
In the general case, this system analysis is plane and the point spread-functionextremely complicated. It can be sim- as a "hump" on the image plane. Asplified, however, if the investigation is re- indicated schematically in Figure 2, A,
Istricted to a particular type of system hav- the point spread-function is unsymmetricing the following properties: in general. For certain systems, however, '
1. Linearity, which is distinguished by ~e point spread-function .poss.~sses rota- rthe two basic characteristics: (a) the out- tlonal symmetry as shown m FIgure 2, B. 'put corresponding to a sum of inputs is Systems of this type are called isotroPic. r
equal to the sum of the outputs corre- The isotropic property results in a sim-sponding to the inputs acting separately; plified description of the transfer character-and (b) multiplication of the input by a istics of the system which will be discussed .
constant multiplies the output by the same later. From the above, it is apparentconstant. that the point spread-function is, in fact, a '
2. lnvariance, which requires that the transfer characteristic of the system for aimage of a point retains its shape as the specific input in that it provides a uniqueobject point is moved in the obj~_Pl~e. relation between a unit point source ~~-This property is frequently called iso- and the corresponding output. It will nowplanatism. Often this requirement is not be shown that the point spread-function isfulfilled in the entire image plane. In of much broader significance for linear f
that case the image plane can be decom- systems,posed into isoplanatic patches over each of From the first property associatedwhich the shape of the point image does with system linearity described previ-not vary appreciably. The shape of the ously it follows that, if an arbitrarypoint image, however, does vary from number of unit point sources is located inpatch to patch, For the sake of clarity the the object plane, each of them will befollowing discussion will be confined to imaged independently of the others as a :.
systems which are isoplanatic as a whole. point spread-function in the image plane, iConclusions reached, however, will be The total image of all unit point sources ~
applicable within each isoplanatic patch in is then simply the sum of all corresponding fsystems which are not isoplanatic as a point spread-functions over th~ i~~ge :.
whole. plane. This is known as the superpos~uon iThe isoplanatic property enables us to princiPle of linear imaging. t'
define a unique characteristic of the imag- From the second property of linear sys-ing system which is called the point tems it follows that, if the intensity of a unitspread-function of the system and is de- point source is multiplied by some constant,fined as the radiation intensity distribution then the corresponding point spread-func-
"in the image of an infinitely small aperture tion will be multiplied by the same constant ,
,

, Vol. 93 l:'OINT ::;PREAD-1' UNCTION, LINE ::;PREAD-1' UNCTION, AND 1\11'1' ~iJVi-""'" ,~ "
1f:'fi;~ to yield the image of the point source of Intensity Intensity!!t nonunit intensity. This property in con-r!"~ junction with the superposition principle.~:~ leads to the conclusion that, if the input
,~ . f fi ld f . t f System~(",~ consists 0 a e 0 porn sources 0 .,.~ arbitrary intensity, the output or the total,li image of the field of point sources is simply Object plane Image planei_: : the sum of the corresponding point spread- Fig. 3. The image of two point sources formed by a
.'} functions, each multiplied by an appro- linear, isotropic system (superposition principle).l ' priate constant to take .accou~t of the . .
intensity o! the correspo;ndmg pomt source. Intensity IntensityFigure 3 1llustrates thiS phenomenon for ltJ ~ two point sources. "
f~~; It is conceptually not difficult to extend i'" ~'1.: the case of a finite number of point sources'~\~' t~ the practica~ case o.f a continuous? two- Object plane Image plane
; dlInenslonal object which can be considered F. 4 Th I. ad-fun ction is the ima ge of a.. f Ig.. e me spre:1c, as an aggregate of an infinite number 0 unit intensity line source.,; point sources of different intensities. The\ij image of each point in the object is the scanning with a small aperture exactly
"1.\,'., point spread-function multiplied by an through the center of the distributionl fi appropriate intensity factor, and the total which causes alignment difficulties. These
image is the sum of all the point images. experimental problems which cause in-l Thus, from a knowledge of the input in- accurate measurements can be overcome
If' tensity distribution in the object and of by measuring another transfer character-'" .
tithe ~yste~ poi~t ~pre~d-f~nctl°f! the out- istic of the ~ystem from which the pointI ~; put mtenslty distribution m the Image can spread-function can be calculated.
I ,Ct';: be determined. Therefore, -the-point-. ---: t,' spread-function is a general transfer char- The L1-ne Spread-Funct1-on
.:::i, acteristic of linear, isoplanatic imaging For linear, isoplanatic imaging systems,I! systems. The mathematical operation of a second transfer characteristic can be;"; multiplying each point in the object in- defined. This is the line spread-function
I '; tensity distribution by the system point which represents the radiation intensity
spread-function and summing over the distribution in the image of an infinitelyentire object distribution is known as narrow and infinitely long slit (line source)convolution of the input with the point of unit intensity. In a perfect imagingspread-function. system the radiant energy emanating from
Before this convolution can be carried a line source in the object plane would beout, the point spread-function of a given concentrated in a line in the image plane.system needs to be measured by using a In practical systems, however, opticalsmall aperture as a source. Direct mea- imperfections result in a "sme.aring-out"sUrement of the point spread-function, of the energy around the ideal line imagehowever, is difficult for two experimental and, therefore, in unsharp imaging of the
,reasons. First, in order to approximate a line source. The line spread-function pro-" point source of radiation the aperture must vides a measure of this unsharpness. In
be made quite small relative to the size of Figure 4 the unit line source is shown as athe point spread-function. Under prac- "knife edge" of unit height standing ontical conditions this yields a very low input the obje;ct plane, and the line spread-func-radiation intensity into the system. Sec- tion as a "welt" on the image plane. Itand, measurement of the resulting intensity will be shown later that the line spread-distribution in the imag-e plane requires function is a system transfer characteristic
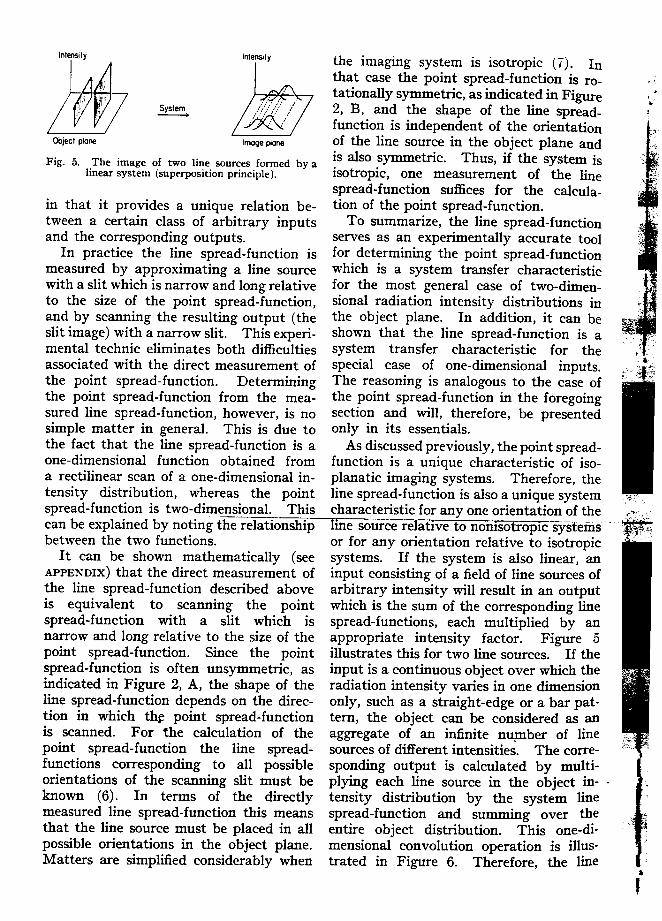
-~I... . .Intensity Intensity the imaging system is isotropic (i). In
that case the point spread-function is ro- ,tationally symmetric, as indicated in Figure ' '
~ 2, B, and the shape of the line spread- "function is independent of the orientation I ' Jec pone moge pone of the line source in the object plane and
F' 5 Tl ' f t I. f d b is also symmetric. Thus, if the system is .'Ig.. Ie Image 0 wo me sources orme y a. . .:linear system (superposition principle). ISOtrOPIC, o~e measurement of the hne r'
spread-function suffices for the calcula- ;:,in that it provides a unique relation be- tion of the point spread-function. " -tween a certain class of arbitrary inputs To summarize, the line spread-function ~;c
and the corresponding outputs. serves as an experimentally accurate tool ~In practice the li~e sI;>read-f~nction is for . det~rmining the point spread-func.ii°? j
measured by approxImatIng a hne source whIch IS a system transfer charactenstic i!with a slit which is narrow and long relative for the most general case of two-dimen- '!~to the size of the point spread-function, sional radiation intensity distributions in ,~
and by scanning the resulting output (the the object plane. In addition, it can beslit image) with a narrow slit. This experi- shown that the line spread-function is a ~mental technic eliminates both difficulties system transfer characteristic for theassociated with the direct measurement of special case of one-dimensional inputs. ithe point spread-function. Determining The reasoning is analogous to the case of .,the point spread-function from the mea- the point spread-function in the foregoingsured line spread-function, however, is no section and will, therefore, be presentedsimple matter in general. This is due to only in its essentials.the fact that the line spread-function is a As discussed previously, the point spread-one-dimensional function obtained from function is a unique characteristic of iso-a rectilinear scan of a one-dimensional in- planatic imaging systems. Therefore, thetensity distribution, whereas the point line spread-function is also a unique systemspread-function is two-dimensional. This characteristic for anyone orientation of thecan be explained by notingtherelationship lmesourcerelative to nonisotropiC-sysfems -rbetween the two functions. or for any orientation relative to isotropic ;~,-
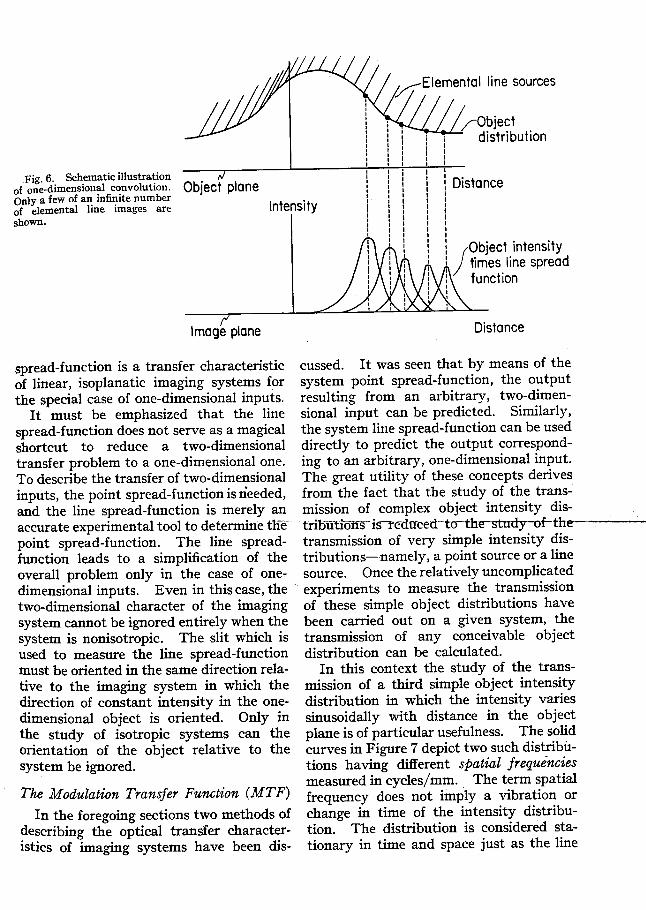
It can be shown mathematically (see systems. If the system is also linear, anAPPENDIX) that the direct measurement of input consisting of a field of line sources ofthe line spread.,function described above arbitrary intensity will result in an outputis equivalent to scanning the point which is the sum of the corresponding linespread-function with a slit which is spread-functions, each multiplied by annarrow and long relative to the size of the appropriate intensity factor. Figure 5point spread-function. Since the point illustrates this for two line sources. If thespread-function is often unsymmetric, as input is a continuous object over which theindicated in Figure 2., A, the shape of the radiation intensity varies in one dimensionline spread-function depends on the direc- only, such as a straight-edge or a bar pat-tion in which tht point spread-function tern, the object can be considered as anis scanned. For the calculation of the aggregate of an infinite nu~ber of linepoint spread-function the line spread- sources of different intensities. The corre-functions corresponding to all possible sponding output is calculat~d by multi-orientations of the scanning slit must be plying each line source in the object in- .known (6). In terms of the directly tensity distribution by the system linemeasured line spread-function this means spread-function and summing over thethat the line source must be placed in all entire object distribution. This one-di-possible orientations in the object plane. mensional convolution operation is illus-Matters are simplified considerably when trated in Figure 6. Therefore, the line
a,
~Elemental line sources
/ObjectI 1 I i distributionI 1 I I I: : I I I
II I I II I I I I
Fig. 6. Schematic illustration I I i I : .of one-dimensional convolution. Object plane : : I I I DistanceOnly a few of an infinite number .! ! I I :of elemental line images are Intensity: : I I Ih I I I I Isown. : : I I I
I I I I II
!;Object intensity: times line spread! function1II
Image plane Distance
spread-function is a transfer characteristic cussed. It was seen that by means of theof linear, isoplanatic imaging systems for system point spread-function, the outputthe special case of one-dimensional inputs. resulting from an arbitrary, two-dimen-
It must be emphasized that the line sional input can be predicted. Similarly,spread-function does not serve as a magical the system line spread-function can be usedshortcut to reduce a two-dimensional directly to predict the output correspond-transfer problem to a one-dimensional one. ing to an arbitrary, one-dimensional input.To describe the transfer of two-dimensional The great utility of these concepts derivesinputs, the point spread-function is needed, from the fact that the study of the trans-and the line spread-function is merely an mission of complex object intensity dis-accurate experimental tool to determine the triou-twnsisre-dfIced--to-tht: ~t!Idy of-the'point spread-function. The line spread- transmission of very simple intensity dis-function leads to a simplification of the tributions-namely, a point source or a lineoverall problem only in the case of one,. source. Once the relatively uncomplicateddimensional inputs. Even in this case, the experiments to measure the transmissiontwo-dimensional character of the imaging of these simple object distributions havesystem cannot be ignored entirely when the been carried out on a given system, thesystem is nonisotropic. The slit which is transmission of any conceivable objectused to measure the line spread-function distribution can be calculated.must be oriented in the same direction rela- In this context the study of the trans-tive to the imaging system in which the mission of a third simple object intensitydirection of constant intensity in the one- distribution in which the intensity variesdimensional object is oriented. Only in sinusoidally With distance in the objectthe study of isotropic systems can the plane is of particular usefulness. The solidorientation of the object relative to the curves in Figure 7 depic.t two such distribu-system be ignored. tions having different spatial frequencies
. . measured in cycles/mm. The term spatialThe Modulahon Transfer Funchon (MTF) frequency does not imply a vibration or
In the foregoing sections two methods of change in time of the intensity distribu-describing the optical transfer character- tion. The distribution is considered sta-istics of imaging systems have been dis- tionary in time and space just as the line
Intensity plane, and the modulation and phaseshift of each is measured in the image plane.The modulations and phase shifts in theimage will vary with spatial frequency.
t\\ ((\\ , a\ ~\ Q;Q, !he ratio of th.e output mod~lation to the,. \),i \j' .'lfUJU;' mput modulation together WIth the phase
shift expressed as a function of spatial fre-quency is called the optical transfer func-tion of the system (8). The ratio of the
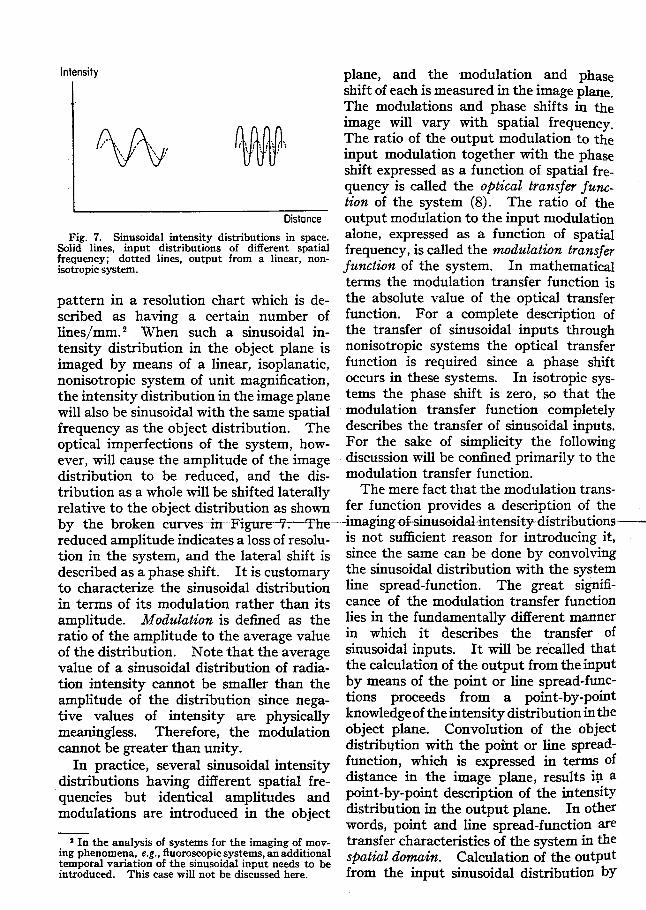
Distance output modulation to the input modulation~ig. 7. S~usoidal.int.ensi~y distribu.tions in spac;e. alone, expressed as a function of spatial
Solid lme~, mput ~Istributlons of dlffer~nt spatial frequency is called the modulation trans/.frequency, dotted lmes, output from a linear non- .' ~ erisotropic system. ' funcuon of the system. In mathematical
terms the modulation transfer function ispattern in a resolution chart which is de- the absolute value of the optical transferscribed as having a certain number of function. For a complete description oflines/mm.2 When such a sinusoidal in- the transfer of sinusoidal inputs throughtensity distribution in the object plane is nonisotropic systems the optical transferimaged by means of a linear, isoplanatic, function is required since a phase shiftnonisotropic system of unit magnification, occurs in these systems. In isotropic sys-the intensity distribution in the image plane tems the phase shift is zero, so that thewill also be sinusoidal with the same spatial modulation transfer function completelyfrequency as the object distribution. The describes the transfer of sinusoidal inputs.optical imperfections of the system, how- For the sake of simplicity the followingever, will cause the amplitude of the image discussion will be confined primarily to thedistribution to be reduced, and the dis- modulation transfer function.tribution as a whole will be shifted laterally The mere fact that the modulation trans-relative to the object distribution as shown fer function provides a description of theby the broken curvesin-- Figurrl:--The-.-imaging Qf-sinusoidal-intensitydistribu tions reduced amplitude indicates a loss of resolu- is not sufficient reason for introducing it,
tion in the system, and the lateral shift is since the same can be done by convolvingdescribed as a phase shift. It is customary the sinusoidal distribution with the systemto characterize the sinusoidal distribution line spread-function. The great signifi-in terms of its modulation rather than its cance of the modulation transfer functionamplitude. Modulation is defined as the lies in the fundamentally different mannerratio of the amplitude to the average value in which it describes the transfer ofof the distribution. Note that the average sinusoidal inputs. It will be recalled thatvalue of a sinusoidal distribution of radia- the calculation of the output from the inputtion intensity cannot be smaller than the by means of the point or line spread-func-amplitude of the distribution since nega- tions proceeds from a point-by-pointtive values of intensity are physically knowledge of the intensity distribution in themeaningless. Therefore, the modulation object plane. Convolution of the objectcannot be greater than unity. distrib1.Jtion with the point or line spread-
In practice, several sinusoidal intensity function, which is expressed in terms ofdistributions having different spatial fre- distance in the image plane, results ~ aquencies but identical amplitudes and point-by-point description of the intensitymodulations are introduced in the object distribution in the output plane. In other- words, point and line spread-function are. I In the analysis of systems for the imaging of mov- transfer characteristics of the system in themg phenomena, e.g., fluoroscopic systems, an additional P t. 1 do . Cal I . ttemporal variation of the sinusoidal input needs to be saw ma~n. cu ation of the outpuintroduced. This case will not be discussed here. from the input sinusoidal distribution by
Vol. 93 POINT SPREAD-FuNCTION, LINE SPREAD-FuNCTION, AND MTF 263
Intensity
Amplitude
Fourier .transformation
(0) (b) \/' Distance Spotial frequency
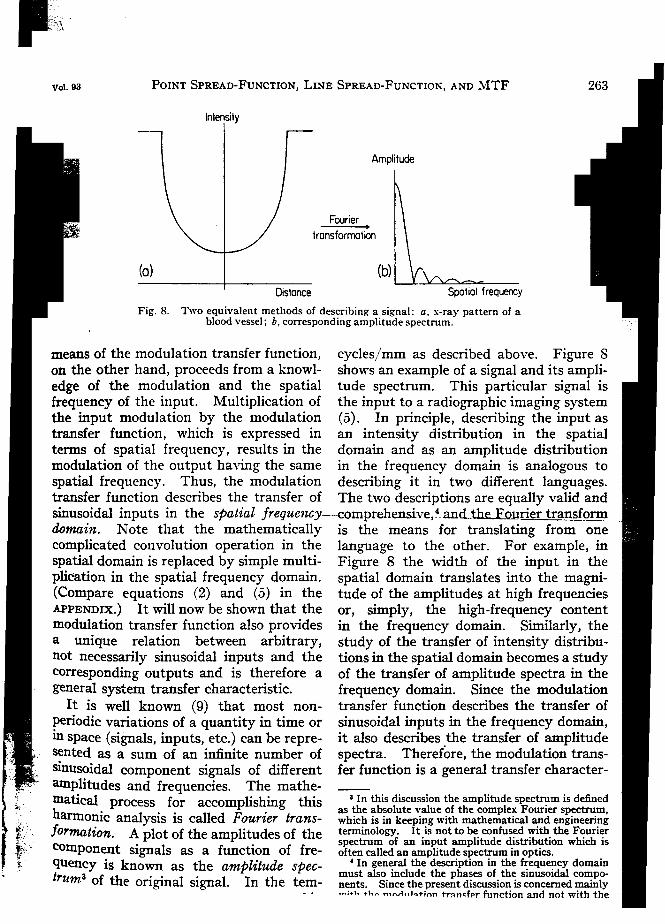
Fig. 8. T\vo equivalent methods of describing a signal: a, x-ray pattern of ablood vessel; b, corresponding amplitude spectrum.
means of the modulation transfer function, cycles/mm as described above. Figure 8on the other hand, proceeds from a knowl- shows an example of a signal and its ampli-edge of the modulation and the spatial tude spectrum. This particular signal isfrequency of the input. Multiplication of the input to a radiographic imaging systemthe input modulation by the modulation (5). In principle, describing the input astransfer function, which is expressed in an intensity distribution in the spatialterms of spatial frequency, results in the domain and as an amplitude distributionmodulation of the output having the same in the frequency domain is analogous tospatial frequency. Thus, the modulation describing it in two different languages.transfer function describes the transfer of The two descriptions are equally valid andsinusoidal inputs in the spatial freque1tCy-.-comprehensive,~_an~th.e-Eo.lJmL.tr-~.Q!m..-domain. Note that the mathematically is the means for translating from onecomplicated convolution operation in the language to the other. For example, inspatial domain is replaced by simple multi- Figure 8 the width of the input in theplication in the spatial frequency domain. spatial domain translates into the magni-(Compare equations (2) and (5) in the tude of the amplitudes at high frequenciesAPPENDIX.) It will now be shown that the or, simply, the high-frequency contentmodulation transfer function also provides in the frequency domain. Similarly, thea unique relation between arbitrary, study of the transfer of intensity distribu-not necessarily sinusoidal inputs and the tions in the spatial domain becomes a studycorresponding outputs and is therefore a of the transfer of amplitude spectra in thegeneral system transfer characteristic. frequency domain. Since the modulation
It is well known (9) that most non- transfer function describes the transfer ofperiodic variations of a quantity in time or sinusoidal inputs in the frequency domain,in space (signals, inputs, etc.) can be repre- it also describes the transfer of amplitudesented as a sum of an infinite number of spectra. Therefore, the modulation trans-sinusoidal component signals of different fer function is a general transfer character-amplitudes and frequencies. The mathe- -rnatical process for accomplishing this a In this discussion the amplitude spec~m is definedh . . . . as the absolute value of the complex Fourier spectrum,
,; armornc analYSIS IS called Four"ter trans- which is in keeping with mathematical and engineeringf ~.' formation. A plot of the amplitudes of the terminology. It.is not to be. confus~d ~ith. the F<?uric;r
;': C . . spectrum of an mp~t amplitude d!strlb';1tion which ISt; omponent sIgnals as a function of fre- often called an amplitude spectrum m optics.
c; quency is known as the amplitude spec- . In genc;ral the description in the ~equ~cy domaintrz 3 f . . . must also mclude the phases of the smusoldal compo-
1m 0 the orIgInal sIgnal. In the tem- nents. Since the present discussion is concerned mainly. . ...:... .hp ~",1.,I"t;n" tT"",,ff'T function and not with the
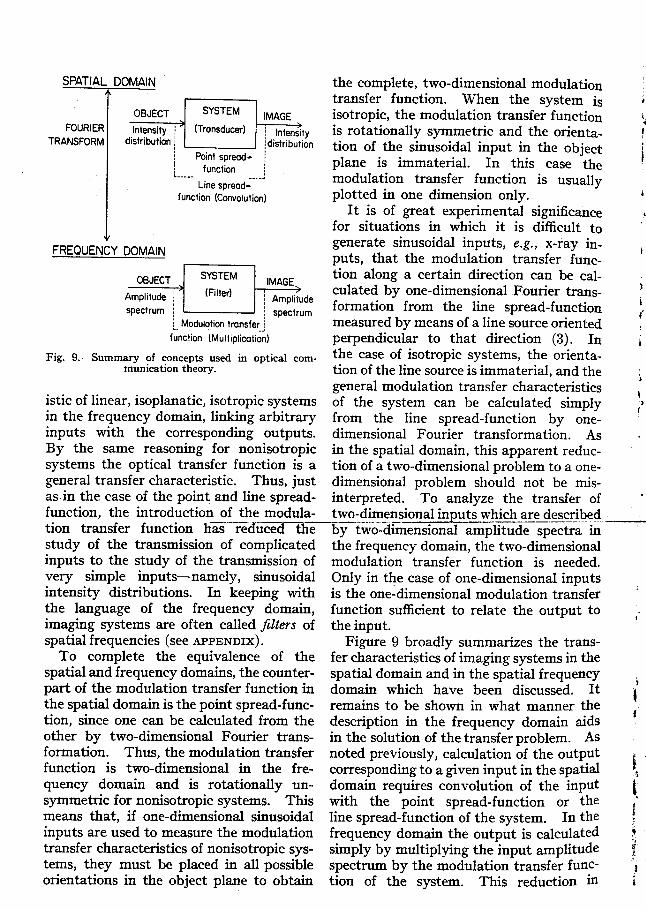
SPATIAL DOMAIN the complete, two-dimensional modulationtransfer function. When the system is ;
OBJECT SYSTEM IMAGE isotropic, the modulation transfer function i.
FOURIER Intensity i (Transducer) i Intensity is rotationally symmetric and the orienta- tTRANSFORM distribution i. !distribution tion of the sinusoidal input in the object i
i Point s~read- i plane is immaterial. In this case the I: function: d I . f f . ., . J mo u atlon trans er unction IS usually
Line spread- I d . d. . I Ifunction (Convolution) P otte m one Imensl0n on y.It is of great experimental significance j
for situations in which it is difficult togenerate sinusoidal inputs, e.g., x-ray in- j
FREQUENCY DOMAIN puts, that the modulation transfer func-
OBJECT SYSTEM tion along a certain direction can be cal-IMAGE I d b d. . I F . I
. , (Filter) , . cu ate y one- ImenSlona ouner trans- .
Amplitude: ' Amplitude. .d f . I
spectr m : : t formation from the lme sprea - unction .u : : spec rum ..,
i Modulation transfer i measured by means of a lme source onented r
f~nc!ion (Multiplicati~~) perpendicular to that direction (3). In iFig. 9. Summary of concepts used in optical com- the case of isotropic systems, the orienta-
munication theory. tion of the line source is immaterial, and the:$
general modulation transfer characteristics Iistic of linear, isoplanatic, isotropic systems of the system can be calculated simply t'in the frequency domain, linking arbitrary from the line spread-function by one-inputs with the corresponding outputs. dimensional Fourier transformation. AsBy the same reasoning for nonisotropic in the spatial domain, this apparent reduc-systems the optical transfer function is a tion of a two-dimensional problem to a one-general transfer characteristic. Thus, just dimensional problem should not be mis-as in the case of the point and line spread- interpreted. To analyze the transfer of .function, the introduction of the modula- two-dimensional inputs wh~~~~cIibe~-tion transfer function h~red-ucea~ebytwO-dlmensional amplitude spectra instudy of the transmission of complicated the frequency domain, the two-dimensionalinputs to the study of the transmission of modulation transfer function is needed.very simple inputs-namely, sinusoidal Only in the case of one-dimensional inputsintensity distributions. In keeping with is the one-dimensional modulation transferthe language of the frequency domain, function sufficient to relate the output to ,imaging systems are often called filters of the input.spatial frequencies (see APPENDIX). Figure 9 broadly summarizes the trans-
To complete the equivalence of the fer characteristics of imaging systems in thespatial and frequency domains, the counter- spatial domain and in the spatial frequency ,
part of the modulation transfer function in domain which have been discussed. It ithe spatial domain is the point spread-func- remains to be shown in what manner ~he ftion, since one can be calculated from the description in the frequency domain aidsother by two-dimensional Fourier trans- in the solution of the transfer problem. Asformation. Thus, the modulation transfer noted previously, calculation of the outP.ut i .
function is two-dimensional in the fre- corresponding to a given input in the spatial ~quency domain and is rotationally un- domain requires convolution of the input tsymmetric for nonisotropic systems. This with the point spread-function or the imeans that, if one-dimensional sinusoidal line spread-function of the system. In the finputs are used to measure the modulation frequency domain the output is calculated !transfer characteristics of nonisotropic sys- simply by multiplying the input. amplitude ~
tems, they must be placed in all possible spectrum by the modulation transfer func- Jorientations in the object plane to obtain tion of the system. This reduction in i
Vol. 93 POINT SPRE,,\lJ-FUNCTION, LINE ~PRE.\lJ-l'UN\.:TlUN. ,,\NlJ ~\J.~~' _\.'v
mathematical complexity is especially use- date the whole frequency band into whichful for the analysis of cascaded systems con- the pulse can be resolved. Otherwise, dis-sisting of several linear, isoplanatic com- tortion will result. Similarly, the opticalponents in series so that the output from degradation of an image can be related toone component is the input to the next the modulation transfer function of ancomponent. In the spatial domain, cal- imaging system.culation of the overall transfer character-istics of such systems from the component RADIOGRAPHIC APPLICATIONtransfer characteristics would require a In order to relate the concepts discussedcomplicated multiple convolution. On the above to practice, their application toother hand, the total modulation transfer radiographic screen-film systems will befunction of the complex system is simply described. The details of the experi-the product of all component modulation mental procedure have been discussed intransfer functions. This makes it easy, for previous publications (3, 11) and will onlyexample, to determine the weakest link be summarized here.in the chain of imaging components com- The most commonly used screen-filmprising a composite system. system consists of a pair of fluorescent
Furthermore, working in the frequency screens in intimate contact with both sidesdomain makes it possible to study the of a radiographic film which has photo-combined effects on the image of the optical graphic emulsion coated on both sides of asystem characteristics and of noise, such as support. The thickness of the phosphorelectronic system noise in image intensifier- layer on each screen is about 100 p., andtelevision chains, grain noise in films, and each emulsion is about 10 p. thick. Theinput quantum noise in all radiographic thickness of the support is about 180 ,IL.imaging systems. ~oise is best described Before the above concepts of communica-quantitatively by means of the Wiener tion theory are applied to this system, itspectrum which is derived from Fourier needs to be established if the system satis-analysis of the random noise pattern:. The fies-the-conditions--of-linearity--and--iso-~~-Wiener spectrum indicates the spatial planatism.frequency content of noise just as the The exposure response of the screen-filmamplitude spectrum is used to describe the system is nonlinear when it is expressed inspatial frequency content of nonrandom terms of photographic density by means ofintensity distributions. For example, the the characteristic curve of the film. It hasmodulation transfer function in con- been determined experimentally, however,junction with the noise spectrum is useful that the system is linear if the output isin predicting the transmission of input expressed in terms of effective exposure ornoise through the system. illuminance in the film. From two slit
Besides the two specific advantages of images whose exposures differed by a factorthe frequency domain representation cited of four, it was found that the ratio of theabove, treating optical imaging systems as two effective illuminance distributions infilters of spatial frequencies brings to bear the film was equal to the measured x-rayon the optical transfer problem a great body exposure ratio and independent of theof knowledge derived from electrical com- distance from the center of the line image.munications theory (10). For example, a Thus, the screen-film system can be "linear-close analogy exists between the design of ized" by using as the output the effectivean optical system and the construction of a illuminance in the emulsions. This pro-device to amplify an electrical pulse. De- cedure is commonly applied in the analysispending on the shape of the pulse which of photographic films.determines its frequency content, the The isoplanatic condition requires thatamplifier must have a frequency response the point spread-function is independent of"'I-A'iro;"",tl.., ..";,1,,, (hn11rl 71'irlfh1 to 9ccommo- the angle at which x rays are incident on
.- ...'0."..'.'
mediately adjacent to the intensifyingscreen nearest the x-ray tube, and the inputas the x-ray intensity pattern in this plane.Geometrical unsharpness and enlargementeffects are thereby separated from thecharacteristics of the screen-film systemand are described by separate transfercharacteristics of the exposing process (12).
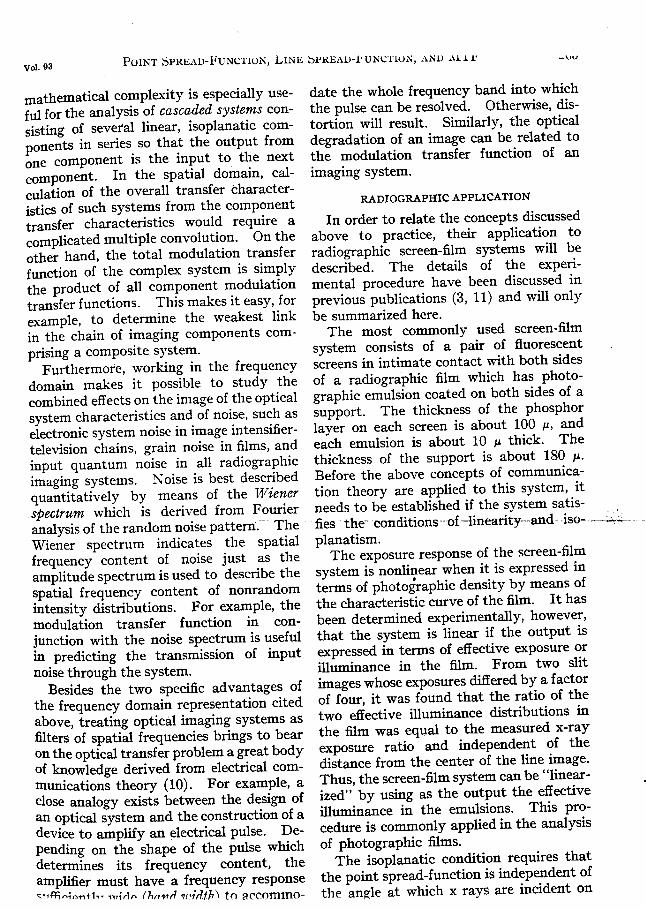
The line spread-function of screen-filmFig. 10. Radiographs of a la-!, slit on Royal Blue systems is then measured by means of a 10
film. A. Without intensifying screens. B. With l.t f d b 1 . .medium-speed screens. C. With fast screens. ,um s 1 orme y p atmum Jaws, 2000 ,um
thick, which is mounted in the aluminumthe screen-film system. This is not the front of a vacuum-exposure holder. Thecase, in general, since oblique incidence screen-film system to be investigated iswill result in an increase of the effective placed inside the holder in intimate con-thickness of the screens and in lateral dis- tact with the slit and exposed to x rays onplacement of images. The influence of an optical-bench arrangement. The finiteoblique incidence on the point spread- width of the slit is negligible relative to thefunction, however, is estimated to be unsharpness of present screen-film systems,negligible for practical exposure setups in- so that the slit is effectively a line source ofvolving focal-spot-screen distances which radiation. Exposed and processed slitare very large relative to the thickness of images similar to those shown in Figure 10the system for films of normal size. In are traced on amicrodensitometer (13), andany case, the isoplanatic condition will the line spread-function is calculated bycertainly be satisfied sufficiently well if ~eans of the microdensitometer calibra-only objects near the perpendicular to the tlon curve and the characteristic curve ofscreen-film system are considered. the film. It should be noted that this 'c
In additon to being linear and isoplanaticr-~~t40d__.Qf_measw:emenL.results in a .line". :screen-film systems can also be expected spread-function whose physical meaning is ,!4':';to be isotropic. This is known to be the somewhat different from that used incase for photographic emulsions and should optics. Since the double-coated film sand-also be true for intensifying screens if the wich is quite thick and since the total slitscreens are uniform, since it is difficult to image is composed of partial images in thesee how a uniform screen could introduce two emulsions which are separated by thedirectional effects. Experimental results film base, a well-defined image plane doeshave confirmed this expectation. not exist within the system. In fact, the
In applying linear communication theory only image plane which can be definedto radiographic screen-film systems in- rigorously is the final image plane in thevolving double-coated films, it should be microdensitometer during the scanningnoted that the process of image formation operation. Therefore, scanning of the slitis quite different from that usually en- image and subsequent application of thecountered in optics. The radiographic conventio:nally measured. characteristicimage is essentially a shadowgram of a curve of the film do not yield the corre-three-dimensional structure formed by sponding exposure or illuminance distribu.- I~penetrating radiation. The source of radi- tion in an image plane, but rather what tation is of finite size and the x-ray beam is might be looked upon as an "effective" ex- i'diverging. As a result, geometrical un- posure or illuminance distribution in thesharpness and enlargement exist in the film, It has been shown experimentally .
input to the imaging system. Under (14) that it is valid to call this effectivethese conditions it is convenient to define distribution a line spread-function of the .the object plane as a plane in space im- screen-film system. '
1.0
wO.8(.)z<tz
~06..Idw>0.4~..IWa: 0.2
250 200 150 100 50 0 50 100 150 200 250
DISTANCE (microns)
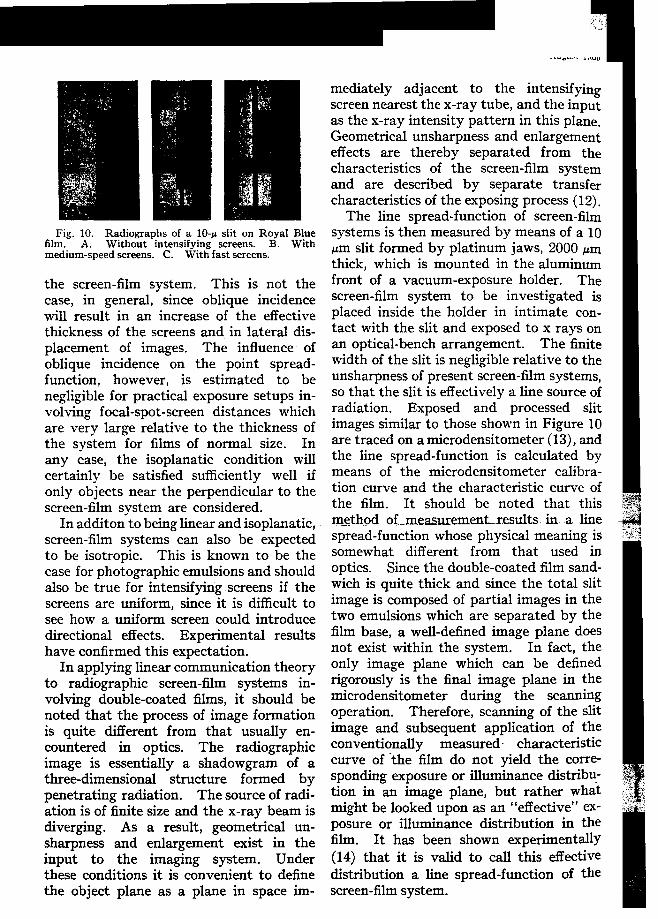
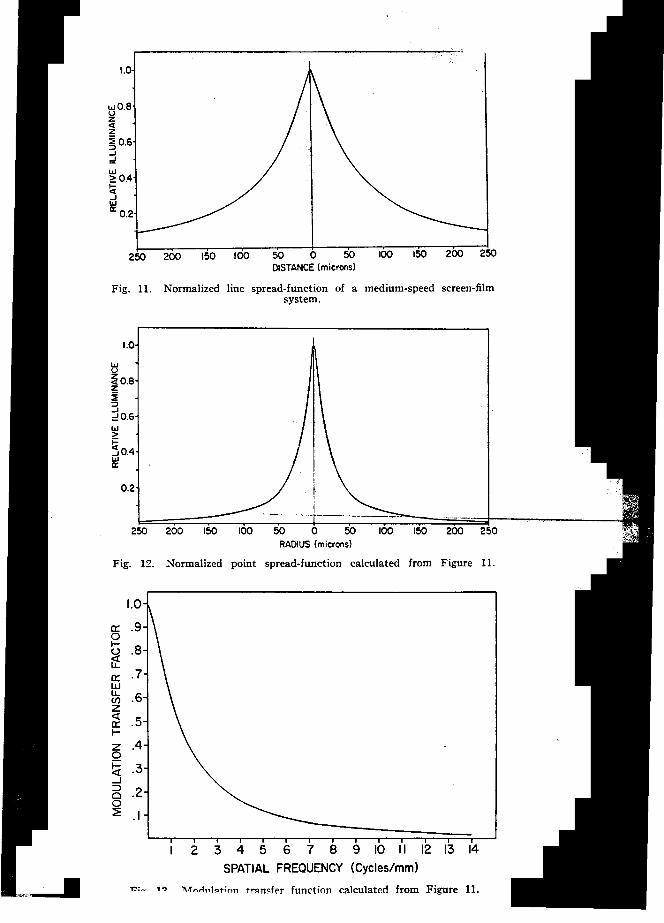
Fig. 11. Normalized line spread-function of a medium-speed screen-filmsystem.
1.0
w(.)Z<t 0.8z~:;)..I
=0.6w>
~..10.4wa:
0.2
250 200 150 200 250
Fig. 12. Nonnalized point spread-function calculated from Figure 11.
a: .90I-U .8~a: .7w~ .6z<ta: .5I-z .40
~ .3-J
5 .20:?: .1
345678
SPATIAL FREQUENCY
1:0:~ 1') ~.f"r1"1"t;",, tr~n~ff'r function calculated from Figure 11.
268 KURT ROSSMANN August 1969
From the measured line spread-func- REFERENCEStion, one can calculate the point spread- 1. DOl, K., AND SAYANAGI, K.: Optical Transfer Ifunction using a method described by Function in Radiography (I): X-ray Fluorescent
( . Screen. Oyo Buturi 33: 721-726, 1966.Marchand 7), and the modulation transfer 2. MORGAN, R. H., BATES, L. M., GOPALA RAOfunction by Fourier transformation. Re- u. Y., AN~ ¥ARINA~O, A.:. The Frequency Respons~. Characteristics of X-ray Films and Screens. Am JsuIts for a medIum-speed screen-film sys- Roentgenol. 92: 426-440, August 1964. . .
tem are shown in Figures 11-13. Applica- 3. ROSSMANN, K.: Measurement of the Modula-. f . . tion Transfer Function of Radiographic Systems Con-
tlon 0 these transfer charactenstlcs to the taining Fluorescent Screens. Physics in Med. & Biol. Icalculation of outputs from certain inputs 9: 551-557, October 1964.h b d . d 1 h (5) 4. STAHNKE, I., AND HEINRICH, H.: The Modula- I
as een Iscusse e sew ere. tion Transfer Function of an Electron-optical X-ray !The analysis of radiographic imacrincr Image Intensifier Tube. Optik 23: 251-267,1966.b f . l>. l> 5. ROSSMANN, K.: Spatial Frequency Spectrum: j
systems y means 0 such communIcatIon Means for Studying Qnality of Radiographic Imaging Itheory methods can provide the following Systems. Radiology 90: 1-13, January 1968. I
al . ( ) . . 6. MARCHAND, E. W.: From Line to Point SpreadIv uable results. a objective measure- Function: The General Case. J. Optic. Soc. America
ment of the optical system performance; 55: ~52-354, April 1965. , .. .(b) d . t . f h t . 1 d d I. MARCHAND, E. W.: DerIvation of the POint
Ietermma Ion 0 t e op lca egra a- Spread Function from the Line Spread Function. J.tion of diagnostically important detail in Optic. Soc. America 54: 915:919, July 1964. . Ih . d ( ) d ,' f . 1 8. INGELSTAM, E.: Nomenclature for Founer ,
t e Image; an c pre Ictl°n. 0 optlca Trans!ormers of Spread Functions. J. Optic. Soc. jsystem parameters for the desIgn and use Amenca 51: 1441, December 1961. .f .d' . . .b ' l ' f 9. BRACE\VELL, R.: The Founer Transform and I0 systems provl mg optimum VISI I1ty 0 Its Applications. Ne\v York, McGraw-Hill, 1965.
diagnostically important detail. . 10. HANCOCK, J: C.: An 1ntroduc~ion to. the Prin-ITh t b 1. d t th clples of Communication Theory. l\e\\" \:ork, Mc-
e same concep scan e app 1e 0 e Graw-Hill, 1961.analysis of other phenomena affectincr 11. ROSSMANN, K., LUBBERTS, G., AND CLEARE,
. ., . l> H. M.: Measurement of the Line Spread-Function ofradIographlc-1mage qualIty, such as geo- Radiographic Systems Containing Fluorescent Screens.metrical and motion unsharpness and the J. Optic. Scc. America 54: 187-190, February 1964.
d . f t . 12. LUBBERTS, G., AND RoSSMA:-;:-;, K.: Modula-recor mg 0 quan um nO1Se. tion Transfer Function Associated \vith Geometrical- Unsharpness~edical Radiograpny:-~hysicsiit Med. ~
SUMMARY & Biol. 12: 65-77,January 1967.. 13. ALTMAN, J. H., AND STULTZ, K. F.: Micro-
Concepts of communication theory are densitometer for Photographic Research. Rev. Sci-.. . ent. Instruments 27: 1033-1036, December 1956.
dIscussed wh1ch can be used to determIne 14. ROSSMANN, K., AND SANDERSO~, G.: Validitythe optical performance of imaging systems of the Modulation Transfer Function of Radiographic. ., Screen-Film Systems Measured by the Slit Method.m convertIng a system Input to an output. Physics in Med. & BioI. 13: 259-268, April 1968.
Three transfer characteristics of linear, !. . t . . t d .b d . APPENDIXmvanan Imaging sys ems are escn em... !a nonmathematical manner: the point D"tscusswn of SPaual Frequency Concept '
spread-function and line spread-function The descriptio~ of ~n x-ray pattern in spa~e as ain the spatial domain and the modulation sum .of many smu:oldal com~onents O~ dIfferent j
. .', amplItudes and spatial frequenCIes can be illustrated .I
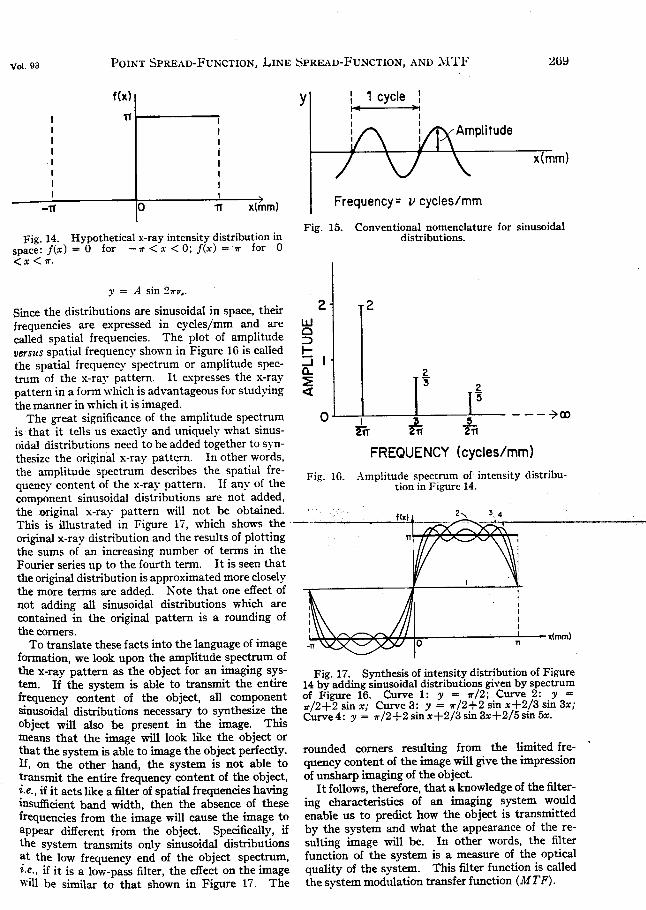
transf.er function m. the spatl~ frequency best by means of a specific example.domaIn. The phYSICal meanIng of these Let us assume that the x-ray pattern of interest 1concepts and t~e rel.ationships betwe~ is the square wave, f(x~, shown i~ Figure 14. ~y tthem are explaIned m detail. A bnef means of a mathematical technIc called Founermathematical derivation is given in the analysi~, th~s function o~ dist~ce can ~e written as a :
sum of mfin1tely many s1nus01dal functions, :J
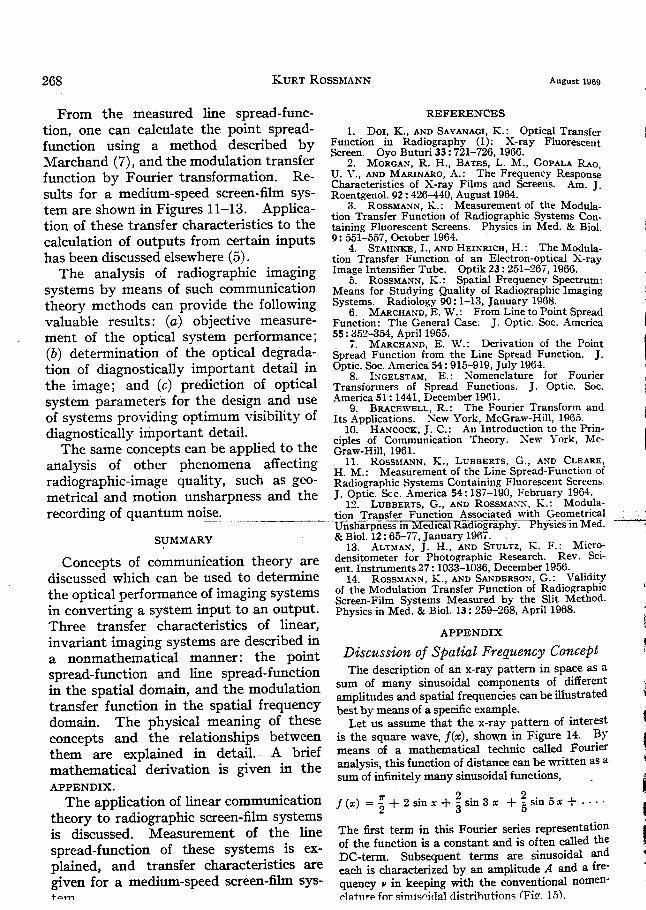
APPENDIX. ITh I ' t . f 1. . t . 7r 2 2e app 1ca Ion 0 mear commumca Ion f (x) = - + 2 sin x + - sin 3 x + - sin 5 x + . . . . Itheory to radiographic screen-film systems 2 3 5 .is discussed. Measurement of the line The first term in this Fourier series representation
I. . f th f .. d . f all d thespread-function of these systems 1S ex- 0 e unction 1S a constant an 1S o.ten c. e, ' . DC-term. Subsequent terms are s1nuso1dal and ~
p~amed, and t~ansfer charactenstlcs are each is characterized by an amplitude A and a fre-given for a medIUm-speed screen-film sys- quency" in keeping with the cOnventional nomen-t..,..,., /'l~t1Irf' for ~;m1~()jdal di~trihutions (Fif!. 1.5).
Vol.93 POINT SPREAD-FuNCTION, LINE SPREAV-FuNCTION, ANV }.lTF 2u\,J
f(x) y : 1 cycle:I~ ~I
1 11 I I I
I I plitudeI II ,I I x(mm)I II II I
-11 0 11 x(mm) Frequency = Z/ cycles/mm
Fig. 15. Conventional nomenclature for sinusoidalFig. 14. Hypothetical x-ray intensity distribution in distributions.
space:f(x) =0 for -,,<x<O;f(x) = " for 0
<x<".
y = .4 sin 2,,/1,.
Since the distributions are sinusoidal in space, their 2 2frequencies are expressed in cycles/mm and are Wcalled spatial frequencies. The plot of amplitude gversus spatial frequency shown in Figure 10 is called !::the spatial frequency spectrum or amplitude spec- ~ Itrum of the x-ray pattern. It expresses the x-ray ~pattern in a form which is advantageous for studying <X £the manner in ,vhich it is imaged. 5
The great si~nificance of the amplitude spectrum 0 , - - - -700
is that it tells us exactly and uniquely what sinus- 2iT Iii 211oidal distributions need to be added together to syn-thesize the original x-ray pattern. In other words, FREQUENCY (cycles/mm)tile amplitude spectrum describes the spatial fre-. . . . ..
. t t f th . tt If . f tl FIg. 16. Amplitude spectrum of IntensIty dlstnbu-quency con en 0 ex-ray pa ern. an} 0 .Ie tion in Figure 14.component sinusoidal distributions are not added,the original x-ray pattern will not be obtained.This is illustrated in Figure Ii, \vhich shows the ---~,original x-ray distribution and the results of plottingthe sums of an increasing number of terms in theFourier series up to the fourth term. It is seen thatthe original distribution is approximated more closely Ithe more terms are adde.d. Note that one effect ofnot adding all sinusoidal distributions which arecontained in the original pattern is a rounding ofthe corners.To translate these facts into the language of image x(mm)
formation, we look upon the amplitude spectrum ofthe x-ray pattern as ~he object for an ~maging s~s- Fig. 17. Synthesis of intensity distribution of Figuretern. If the system 1S able to transD11t the entire 14 by adding sinusoidal distributions given by spectrumfrequency content of the object, all component of Figure 16. Curve 1: y = ,,/2; Curve 2: y =sinusoidal distributions necessary to synthesize the ,,/2+2 sin x; Curve 3: y = ,,/2;t2 sin x+2!3 sin 3x;obJ. t "II al b t . th " Th " Curve4: y = ,,/2+2 smx+2/3sm3x+2/5sm 5x.
ec W1 so e presen ill e lInage. 1Smeans that the image will look like the object orthat the system is able to image the object perfectly. rounded corners resulting from the limited fre- .
If, on the other hand, the system is not able to quency content of the image will give the impressiontransmit the entire frequency content of the object, of unsharp imaging of the object.~.e., if it acts like a filter of spatial frequencies having It follows, therefore, that a knowledge of the filter-insufficient band width, then the absence of these ing characteristics of an imaging system wouldfrequencies from the image will cause the image to enable us to predict how the object is transmittedappear different from the object. Specifically, if by the system and what the appearance of the re-the system transmits only sinusoidal distributions suIting image will be. In other words, the filter~t the low frequency end of the object spectrum, function of the system is a measure of the optical1.~., if it is a low-pass filter, the effect on the image quality of the system. This filter function is called\vtll be similar to that shown in Figure 17. The the system modulation transfer function (MT F).
-',c~ I';
270 KURT ROSSMANN August 1969
i
I
I
I ,
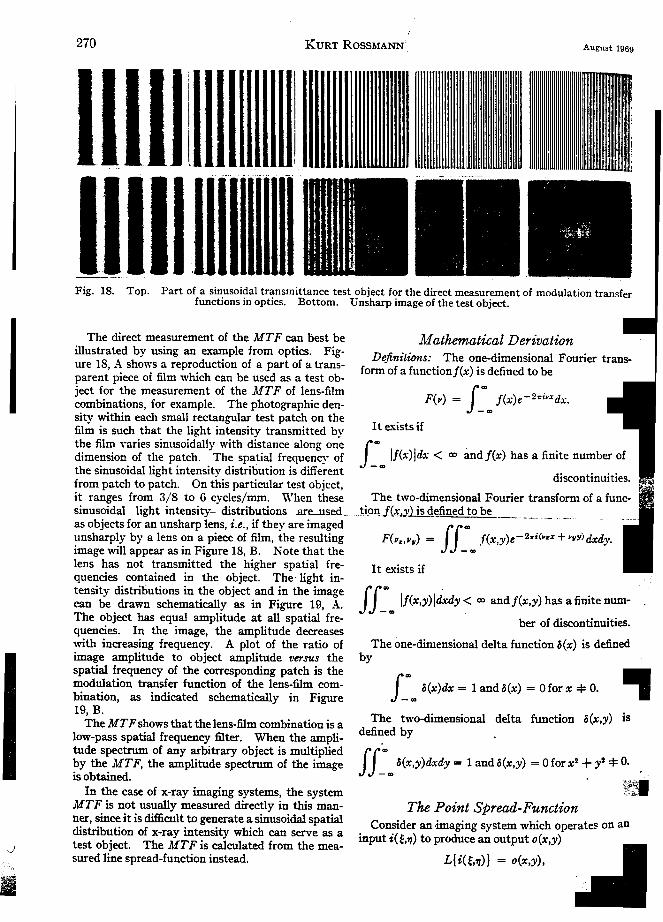
Fig. 18. Top. Part of a sinusoidal transmittance test object for the direct measurement of modulation transferfunctions in optics. Bottom. Unsharp image of the test object.
I . The direct me~urement of the MTF ca.n best.he Mathematical Derivationillustrated bv usmg an example from optics. Flg- D .I: .t . Th d. . I F .
-. eJ.nf fans: e one- Imenslona ouner trans-ure 18, A sho,vs a reproduction of a part of a trans- f f f t . f( ) . d fi d b.. onn 0 a unc Ion x IS e ne to eparent pIece of film which can be used as a test ob-ject f.or t.he measurement of the MTF of lens-film - f = . -2.i,,% .combmatl0ns, for example. The photographic den- F(v) - f(x)e ax.sity within each small rectangular test patch on the .. - mfilm is such that the light intensity transmitted by It exIsts Ifthe film ,aries sinusoidally ,vith distance along one f =
I dimension of the patch. The spatial frequency of If(x)!dx < 00 andf(x) has a finite number ofthe sinusoidal light intensitv distribution is different - =
d. .. .f t h t ch 0 th-.. I b . Iscontlnultles.rom pa c 0 pat. n IS partlcu ar test 0 ]ect,it ranges from 3/8 to G cycles/mm. "'lIen these The t\vo-dimensional Fourier transform of a func-sinusoidal light intensity- distributions ar~ed- _1;io~.J(,\"..;y~<!~fined to beas objects for an unsharp lens, i.e., if they are imaged
ffm -- --
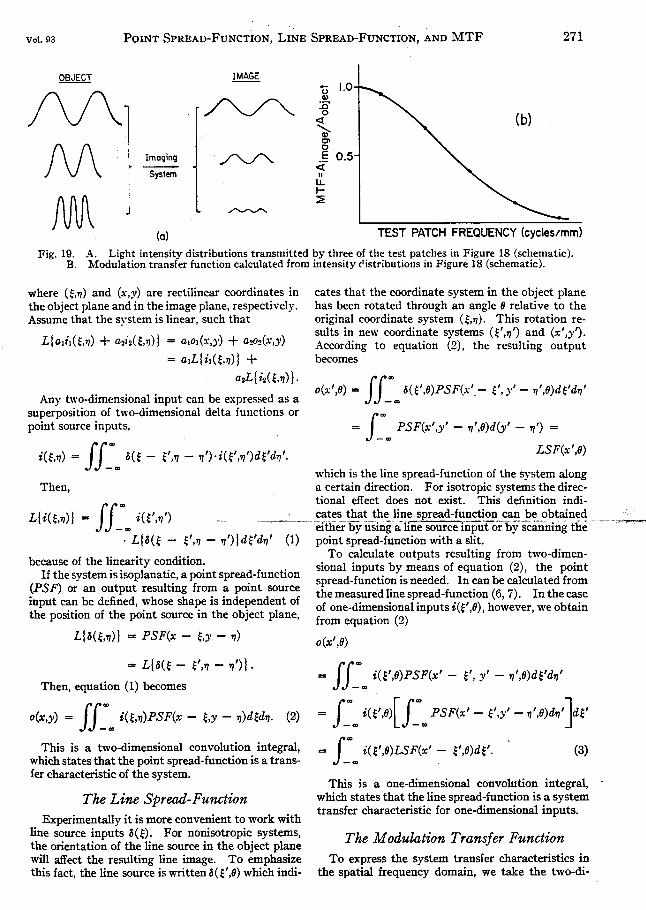
unsharply by a lens on a piece of film, the resulting F(vz,vlI) = .f(x,y)e-2.iC"z% + "II") dxd".image will appear as in Figure 18, B. Note that the -=lens has not transmitted the higher spatial fre- It exists ifquencies contained in the object. The light in-tensity distributions in the object and in the image r r= .can be drawn schematically as in Figure 19, A. JJ- If(x,y) I dxdy < 00 andf(x,y)hasafinltenum-The o.bject has eq~al amplitude at .all spatial fre- = ber of discontinuities.
quencles. In the Image, the amplitude decreaseswith increasing frequency. A plot of the ratio of The one-dimensional delta function ~(x) is definedimage amplitude to object amplitude versus the byspatial frequency of the corresponding patch is the =modulation transfer function of the lens-film com- f ~(x)dx = 1 and ~(x) = 0 for x =1= o. -bination, as indicated schematically in Figure - =
19, B. Th di . al del . ( ) .The MT F shows that the lens-film combination is a e two- menSlon ta function ~ x,y 1S
low-pass spatial frequency filter. When the ampli- defi~ed bytude spectrum of any arbitrary object is multiplied r r=~y the. MTF, the amplitude spectrum of the image J J - = ~(x,y)dxdy = 1 and ~(x,y) = 0 for x2 + y2 =4= o.1S obtained. - .
In the case of x-ray imaging systems, the system .MTF is not usually measured directly in this man- The Point Spread-Functionner, since it is difficult to generate a sinusoidal spatial C .d . . t hi h t and. .b . f . . . onSl er an 'Imaging sys em w c opera e~ onIStri ution 0 x-ray mtens1ty wh1ch can serve as a. .t st ob. t Th MTF . calcult d f th mput ~(~,7J) to produce an output o(x,y)v e Jec . e 1S a e rom e mea-sured line spread-function instead. L{ i(~,7J)} = o(x,y),
~::ii!i -.~" .I~II-
Vol. 93 POINT SPREAD-FuNCTION, LINE SPREAD-FuNCTION, AND MTF 271
OBJECT IMAGE- - ul.O
/V\ ] /",,_/~ { ( b )
, CIM i Imaging./' /"'- .§ 0.5r- <t; System ": l1.
t-~~ """"""'""'-'"' ~
(0) TEST PATCH FREQUENCY (cycles/mm)
Fig. 19. A. Light intensity distributions transmitted by three of the test patches in Figure 18 (schematic).B. Modulation transfer function calculated from intensity c'istributions in Figure 18 (schematic).
where (~.'1) and (x,y) are rectilinear coordinates in cates that the coordinate system in the object planethe object plane and in the image plane, respectively. has been rotated through an angle 6 relative to theAssume that the system is linear, such that original coordinate system (~.'1). This rotation re-
.. suIts in new coordinate systems (~','1') and (x',y').L{aI11(~.'1) + a2t2(~,'1)1 = alol(x,)') + a2D2(x,y) According to equation (2), the resulting output
= alLli1(~,'1) I + becomes
a:ILli2(~.'1)I. If ~ . . . o(x',6) = o(~',6)PSF(x' - ~'. y' - '1',6)d~'d'1'Any t\\"o-dlmenslonal Input can be expressed as a -~ -
superposition of two-dimensional delta functions or f ~
point source inputs, = PSF(x',y' - '1',6)d(y' - '1') =i(~,'1) = II: o(~ - ~','1 - '1').i(~','1')d~'d'1'. -~ LSF(x',6)
~ which is the line spread-function of the system along
Then, a certain direction. For isotropic systems the direc-~ tional effect does not exist. This definition indi-
L{i(~,'1)1 = If i(~','1') -~--_S~!~~-_!~!_t~~li~;SRread-!~~!:;!:~_!::-~~~o_~t~~~~---c.~- ~ either by using a hne source Input or by scannIng the. L{6(~ - ~','1 - '1')ld~'d'1' (1) point spread-function with a slit.
b f hr. dif To calculate outputs resulting from two-dimen-ecause 0 t e ~n~arlty co~ Ion: . sional inputs by means of equation (2), the pointIf the system IS Isoplanatl:, a pOint sprea~-functlon spread-function is needed. In can be calculated from
~PSF) or an output resulting fro~ .a pOint source the measured line spread-function (6, 7). In the caseInput can be defined, whose shape IS Independent of f d. . I . t .(1:' 6) h bt . . . . . . 0 one- ImenSlona InpU S1. ~, owever weo aInthe PosItIon of the pOInt source In the object plane, f t . (?) " rom equa Ion ~
L{o(~,'1)1 = PSF(x - ~,y - '1) o(x',6)
= L{o(~ - ~','1 - '1')1. = IJ~ i(~',6)PSF(x' - ~', y' - '1',6)d~'d,,'
Then, equation (1) becomes - ~
o(x,y) = II:= i(~,'1)PSF(x - ~,y - ,,)d~d'1. (2) = I:= i(~',6)[I:= PSF(x' - ~',y' - ,,',6)d'1' Jd~'
~his is a two-dime~sional convolu~ion. integral, = f = i(~',6)LSF(x' - ~',6)d~'. (3)which states that the pOInt spread-functIon IS a trans- - =fer characteristic of the system. This is a one-dimensional convolution integral, .
The Line Spread-Function which states that the line spread-function is a systemtransfer characteristic for one-dimensional inputs.
Experimentally it is more convenient to work withline ~urce ~nputs o(~): For no~sotropic. systems, The M adulation Transfer Functionthe onentation of the hne source In the object planewill affect the resulting line image. To emphasize To express the system transfer characteristics inthis fact, the line source is written o(~',6) which indi- the spatial frequency domain, we take the two-di-
~
272 KURT ROSSMANN' August 1969
mensional Fourier transfonn of both sides of equa- This can be writtention (2), 0(vz',6) = l(vz',6) . H(vz',6),ff ~ o(x,y)e-2wi(".z + ""I/)dxdy = which shows that the Fourier transfonn of the line
- ~ spread-function is the optical transfer function alongff ~ [ff ~ ] a certain direction Vz'. For isotropic systems, the
i(~,1])PSF (x - ~,y - 1/)d~d1/ X directional dependence vanishes.- ~ - ~ The connection between the optical and modula-
-2wi(".z + ",,1/) - ff ~ . tion ~ransfe: fun.ctio~s and the transf~r of one-di-e dxdy - -~ ~(~,1/) X m~nsl.onal smusoldal Inputs can be denved by sub-
stitutinge-2"i(".~ + ".,,) [ff:~ PSF(x - ~,y -1/) X i(~',6) = A + A, cos 27rv~'~'
] in equation (3). Letting x' - ~' = u, the outpute-2..i[".(z -~) + ".(1/ - ,,)] d(x - ~)d(y - 1/) d~d1/. becomes
This can be ,vritten o(x',6) = A + A, f: ~ LSF(u,6) COS 27rv~'
O(VZ,VII) = l(vz,vlI) X H(vz,vlI) (4) (x' - u)du,
"here 0 and 1 are the complex spatial f~equency spe:- and expanding the integrand,tra of the output and the Input respectively and HISthe optical transfer function of the s)'stem, This o(x',6) = A + Ai[H.(v~') cos 27rv~'.\" +equation indicates that H(vz,vlI) is a system transfer H.(v~') sin 27rv~'x'], (6)characteristic in the frequency domain. K ote that h H d H h . d .
f. f f . . h d. . I were. an . are t e cosme an sIne trans onnsthe optical trans er unction IS t e t,vo- ImenSlona f h r d f. . I Th'Fourier transform of the point spread-function. ~ t e. me sprea - unction respective y, IS canTaking absolute values of the functions in equation e ,vntten
(4), ,ve obtain o(x',6) = All + ./}foCO!; [27rvf."'" - 4>(v~')]J, (7)
10(vz,vlI)1 = II(vz,vlI)1 ' MTF(vz,vlI) (5) "here l}fO = AolA is the output modul..tion,..., h d . Letting cos 4>(v~') = H.(v~'),!(H.2 + H.2)'I' and
"hlch IS a relation bet,veen t e output an Input . (,) - H ( ')/(H 2 + H 2)';2' ua. n (6)a.rnplitude spectra and th,:~odul_a~~~fer fun~ s~: V~ ~ V~ . . m eq tlo ,
tlon of the system. The modulation transferronc- t e output mes - --.
tion is a general system transfer characteristic for o(x',6) = A I 1 + ./}f, ..isotropic systems, since in that case H(vz,vlI) is real.To express the transfer of one-dimensional inputs (H.2 + H.2)'/2. COS [27rv~'.\" - 4>(v~')]I, (8)
in the frequency domain, we fonn the one-dimen- ...sional Fourier transfonn of both sides of equation wh~re l}f, =. A ,I A IS the Input mod1;11atlon. Com-(3), parIng equations (7) and (8), we obtaInJ~ ff ~ Mo = M, X (H.2 + H.2)'/2 = l}f, X MTF(v~,),
o(x' 6)e-2..i".,z'dx' = i(~' 6)LSF (x' --~ ' -~ ' since (H.2 + H.2) '/2 is the absolute value of theop-
J ~ tical transfer function. This result states that the~',6)e-2wi".,z' dx'd~' = i(~',6)e-2"i",,~' X system acts as a filter of spatial frequencies, the MTF
- ~ being the filter function.[J ~ The phase shift 4>(V~,) in the output isLSF(x' - ~',6)e-2..i".'(z' -~') X
-~ .p(v~,) = arctan H.IH..
d(x' - ~')Jd~" !his ~quals zero when H. = 0, which is the case forISOtrOpiC systems.