Embed Size (px)
Citation preview

11
Prepared by:Prepared by:Research Services andResearch Services andStudent Assessment & School Student Assessment & School PerformancePerformance
School Accountability in School Accountability in Florida:Florida:Grading Schools andGrading Schools andMeasuring Adequate Yearly Measuring Adequate Yearly ProgressProgress
22
Two Accountability Two Accountability SystemsSystems School Grades are a component School Grades are a component
of Florida’s A++ Planof Florida’s A++ Plan
Adequate Yearly Progress (AYP) is Adequate Yearly Progress (AYP) is a component of the Federal No a component of the Federal No Child Left Behind legislationChild Left Behind legislation
33
School Grades
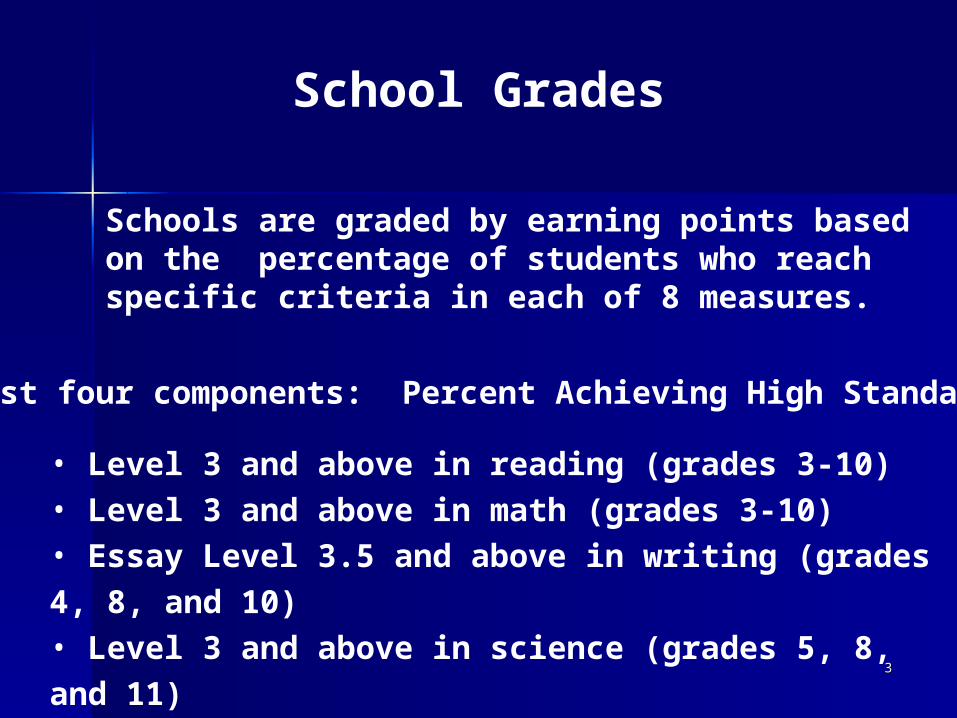
Schools are graded by earning points based on the percentage of students who reach specific criteria in each of 8 measures.
• Level 3 and above in reading (grades 3-10)• Level 3 and above in math (grades 3-10)• Essay Level 3.5 and above in writing (grades 4, 8, and 10)• Level 3 and above in science (grades 5, 8, and 11)
First four components: Percent Achieving High Standards
44
School Grades
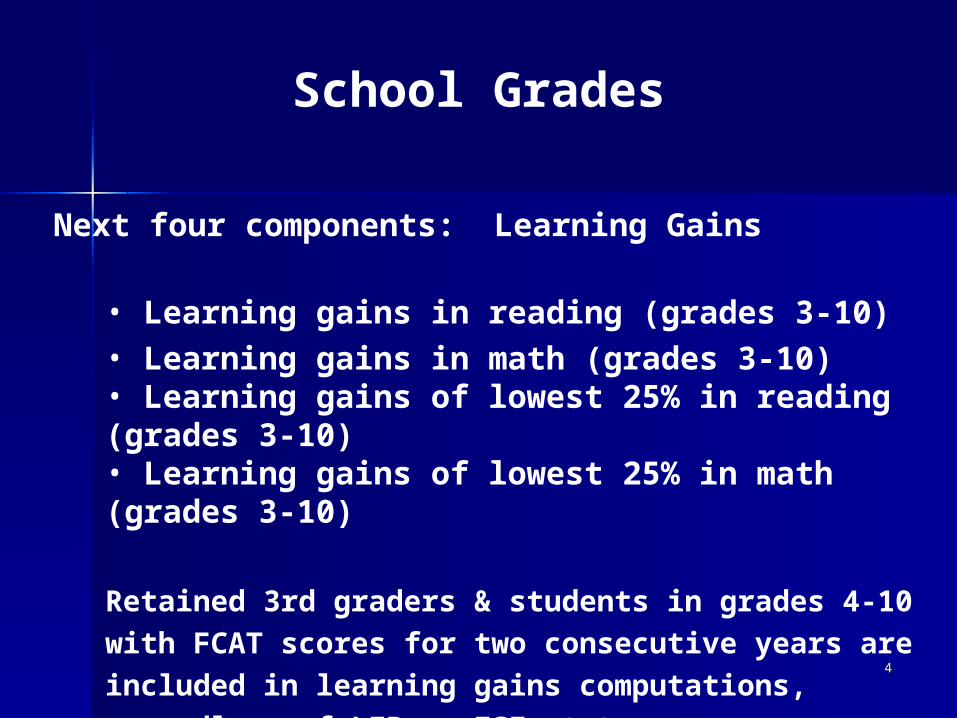
• Learning gains in reading (grades 3-10)• Learning gains in math (grades 3-10)• Learning gains of lowest 25% in reading (grades 3-10)• Learning gains of lowest 25% in math (grades 3-10)
Retained 3rd graders & students in grades 4-10 with FCAT
scores for two consecutive years are included in learning
gains computations, regardless of LEP or ESE status.
Next four components: Learning Gains
55
How Are Learning Gains How Are Learning Gains Defined?Defined?
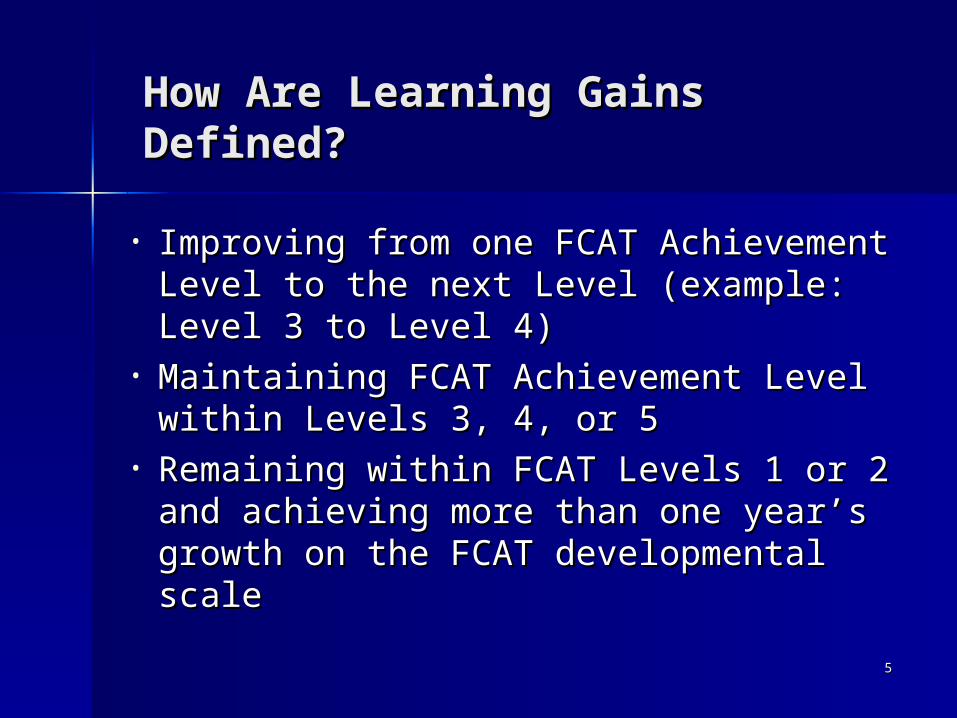
• Improving from one FCAT Improving from one FCAT Achievement Level to the next Level Achievement Level to the next Level (example: Level 3 to Level 4)(example: Level 3 to Level 4)
• Maintaining FCAT Achievement Level Maintaining FCAT Achievement Level within Levels 3, 4, or 5within Levels 3, 4, or 5
• Remaining within FCAT Levels 1 or 2 Remaining within FCAT Levels 1 or 2 and achieving more than one year’s and achieving more than one year’s growth on the FCAT developmental growth on the FCAT developmental scalescale
66
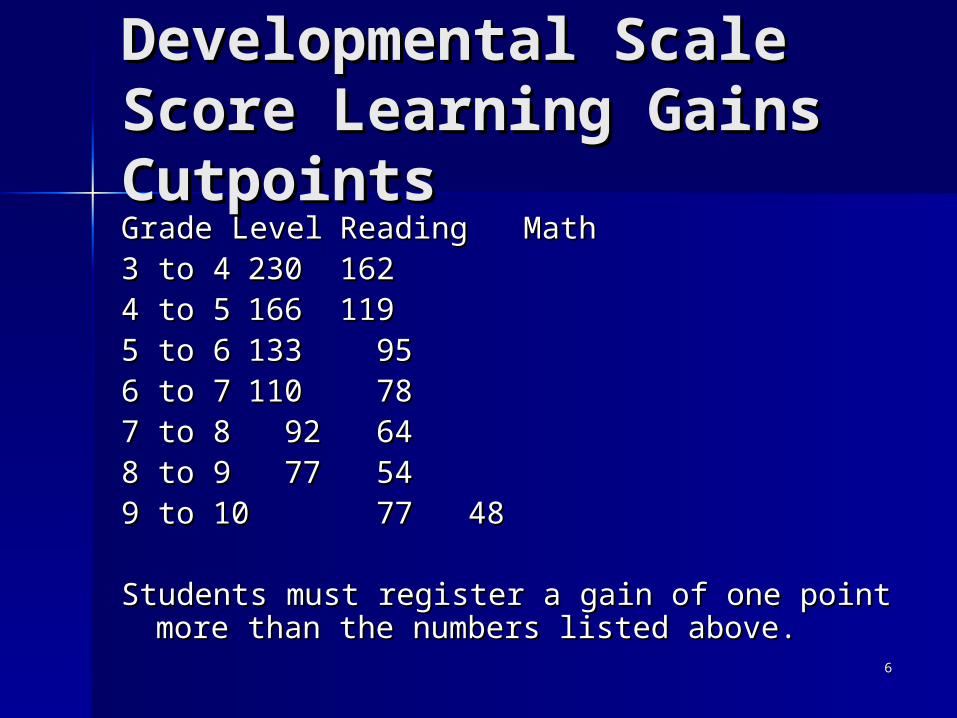
Developmental Scale Developmental Scale Score Learning Gains Score Learning Gains CutpointsCutpointsGrade LevelGrade Level ReadingReading MathMath3 to 43 to 4 230230 1621624 to 54 to 5 166166 1191195 to 65 to 6 133133 95 956 to 76 to 7 110110 78 787 to 87 to 8 92 92 64 648 to 98 to 9 77 77 54 549 to 109 to 10 77 77 48 48
Students must register a gain of one point more Students must register a gain of one point more than the numbers listed above.than the numbers listed above.
77
Learning GainsLearning Gains
• Students who drop a level (Level Students who drop a level (Level 4 to 3 or Level 5 to 4) are not be 4 to 3 or Level 5 to 4) are not be counted as learning gainscounted as learning gains
• Retained students who are Level Retained students who are Level 1 or Level 2 must improve at least 1 or Level 2 must improve at least one level in order to be counted one level in order to be counted as making learning gainsas making learning gains
88
WritingWriting
• Achievement Levels were provided for first Achievement Levels were provided for first time in 2006-07.time in 2006-07.
• As of now, achievement levels will not be As of now, achievement levels will not be incorporated into the grade computation for incorporated into the grade computation for 2007-08.2007-08.
• If a school tests 30 or fewer students in Writing If a school tests 30 or fewer students in Writing or does not have grade 4, 8, or 10, the District or does not have grade 4, 8, or 10, the District average score for Writing is substituted. This average score for Writing is substituted. This includes schools who do not serve one or more includes schools who do not serve one or more of the tested grade levels.of the tested grade levels.
99
ScienceScience
• Achievement Levels were provided for first time Achievement Levels were provided for first time in 2005-06.in 2005-06.
• Science Achievement Levels were incorporated Science Achievement Levels were incorporated in school grades for first time in 2006-07.in school grades for first time in 2006-07.
• If a school tests 30 or fewer students in Science If a school tests 30 or fewer students in Science or does not have grade 5, 8, or 11, the District or does not have grade 5, 8, or 11, the District average score for Science is substituted. This average score for Science is substituted. This includes schools who do not serve one or more includes schools who do not serve one or more of the tested grade levels.of the tested grade levels.
1010
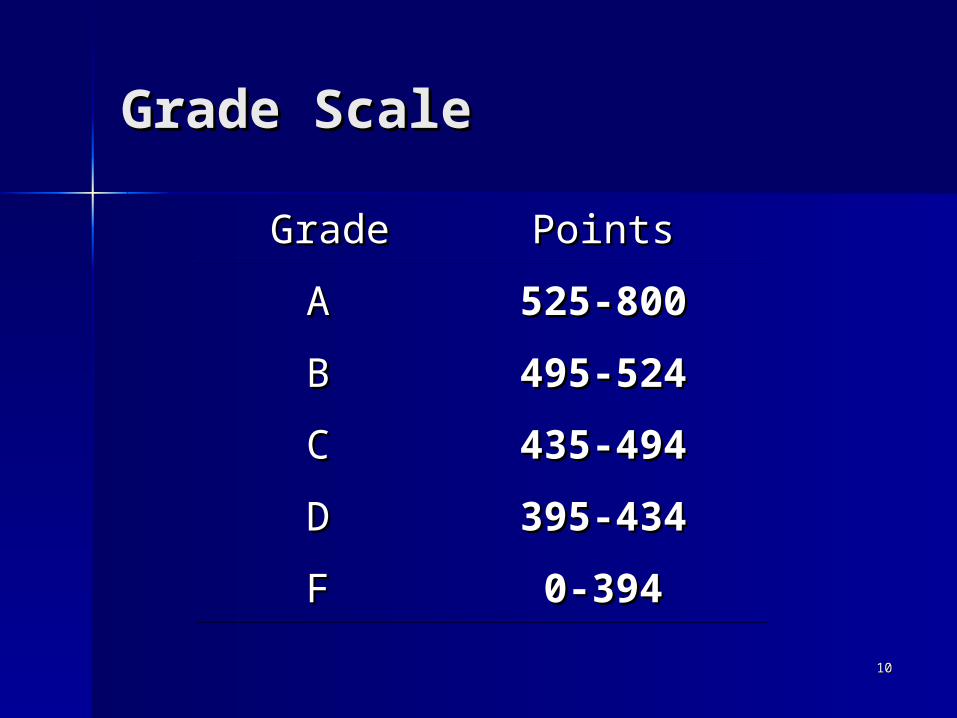
Grade ScaleGrade Scale
GradeGrade PointsPoints
AA 525-800525-800
BB 495-524495-524
CC 435-494435-494
DD 395-434395-434
FF 0-3940-394
1111
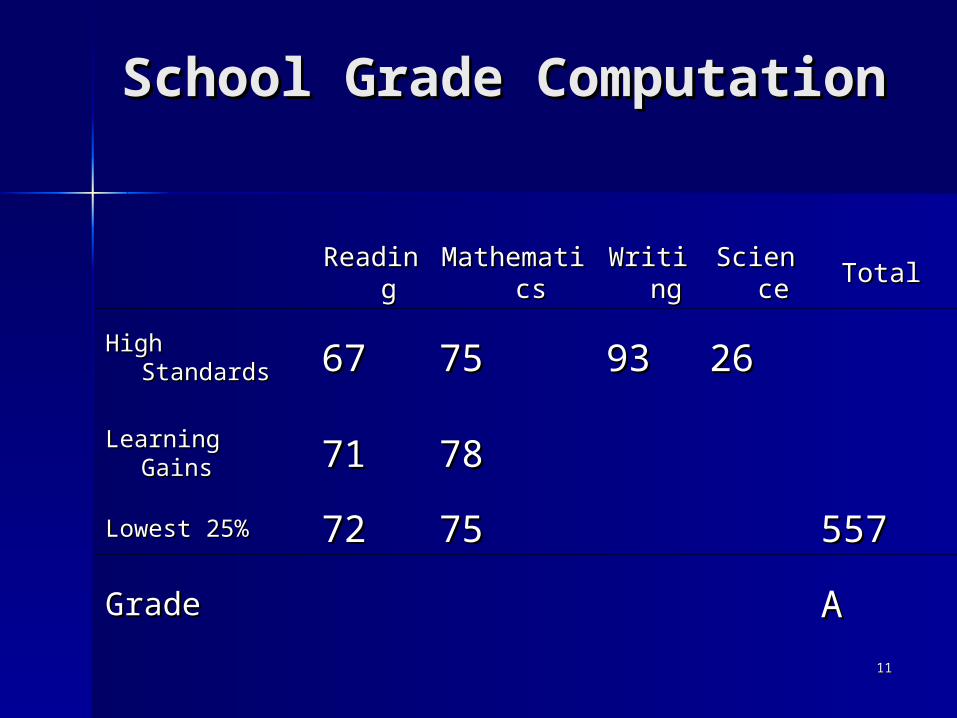
School Grade School Grade ComputationComputation
ReadinReadin
ggMathematiMathemati
cscsWritinWritin
ggSciencScienc
eeTotalTotal
High StandardsHigh Standards 6767 7575 9393 2626
Learning GainsLearning Gains 7171 7878
Lowest 25%Lowest 25% 7272 7575 557557
GradeGrade AA
1212
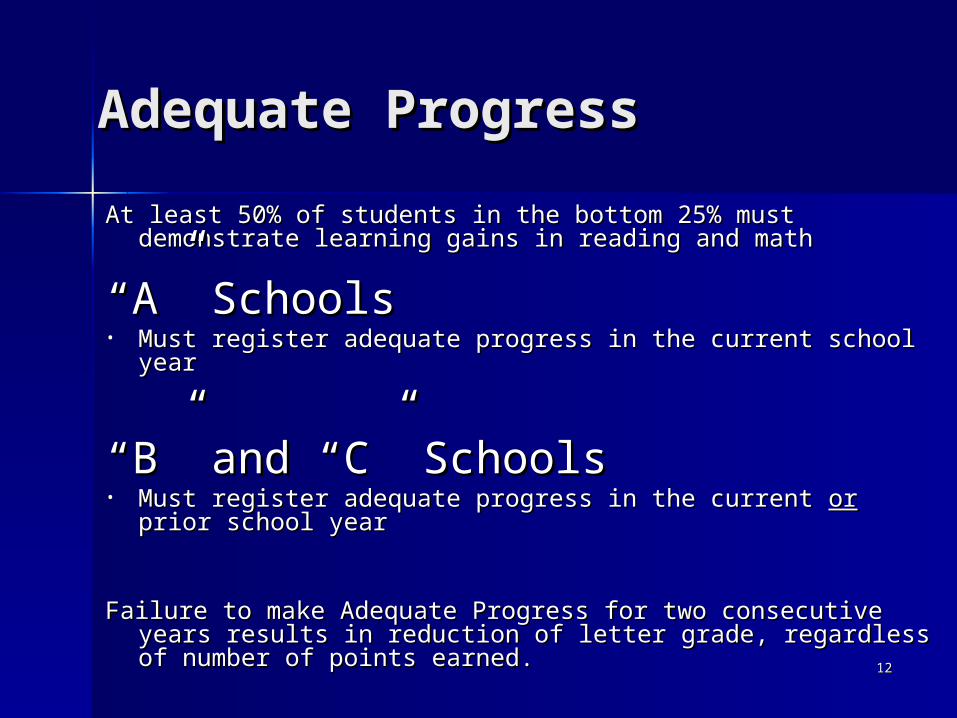
Adequate ProgressAdequate Progress
At least 50% of students in the bottom 25% must At least 50% of students in the bottom 25% must demonstrate learning gains in reading and mathdemonstrate learning gains in reading and math
““A” SchoolsA” Schools• Must register adequate progress in the current school yearMust register adequate progress in the current school year
““B” and “C” SchoolsB” and “C” Schools• Must register adequate progress in the current Must register adequate progress in the current oror prior prior
school yearschool year
Failure to make Adequate Progress for two consecutive years Failure to make Adequate Progress for two consecutive years results in reduction of letter grade, regardless of number results in reduction of letter grade, regardless of number of points earned.of points earned.
1313
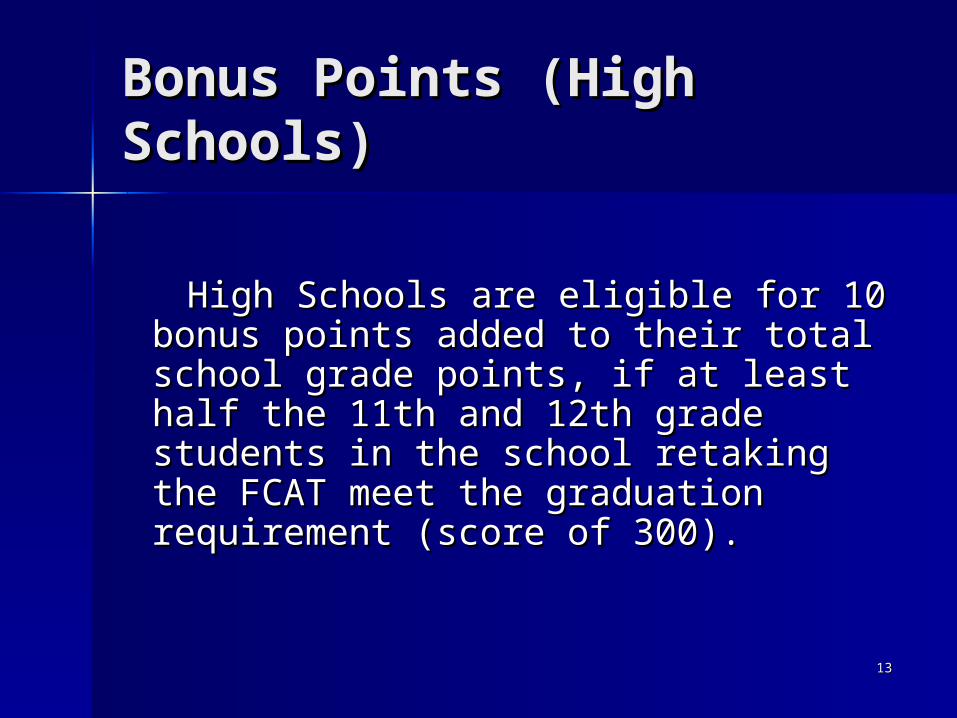
Bonus Points (High Bonus Points (High Schools)Schools)
High Schools are eligible for 10 High Schools are eligible for 10 bonus points added to their total bonus points added to their total school grade points, if at least half school grade points, if at least half the 11th and 12th grade students in the 11th and 12th grade students in the school retaking the FCAT meet the school retaking the FCAT meet the graduation requirement (score of the graduation requirement (score of 300).300).
1414
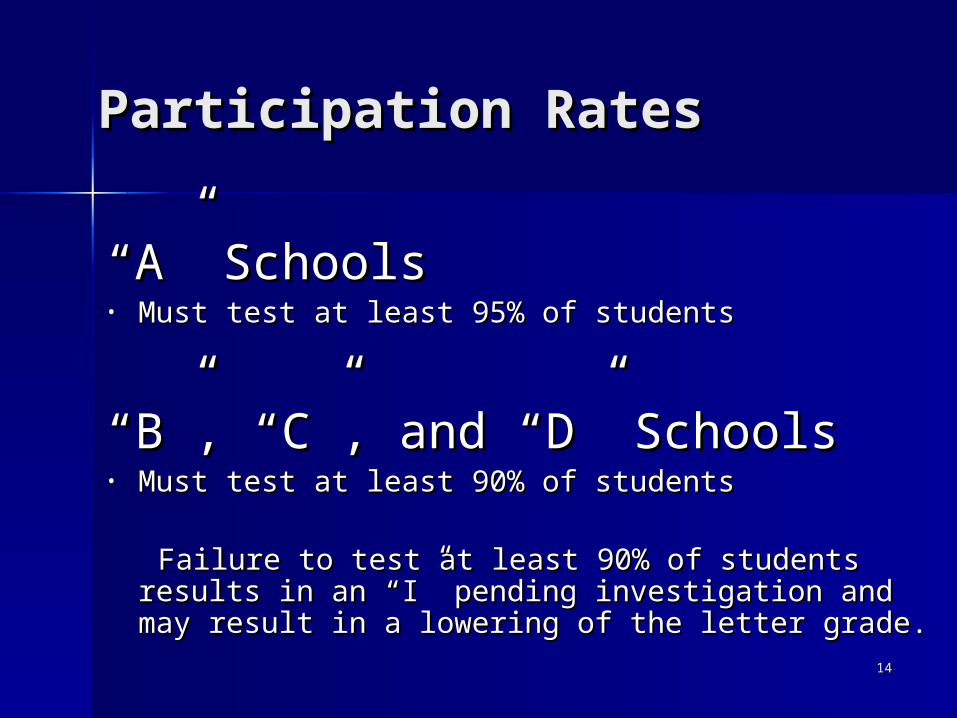
Participation RatesParticipation Rates
““A” SchoolsA” Schools• Must test at least 95% of studentsMust test at least 95% of students
““B”, “C”, and “D” SchoolsB”, “C”, and “D” Schools• Must test at least 90% of studentsMust test at least 90% of students
Failure to test at least 90% of students results in Failure to test at least 90% of students results in an “I” pending investigation and may result in a an “I” pending investigation and may result in a lowering of the letter grade.lowering of the letter grade.
1515
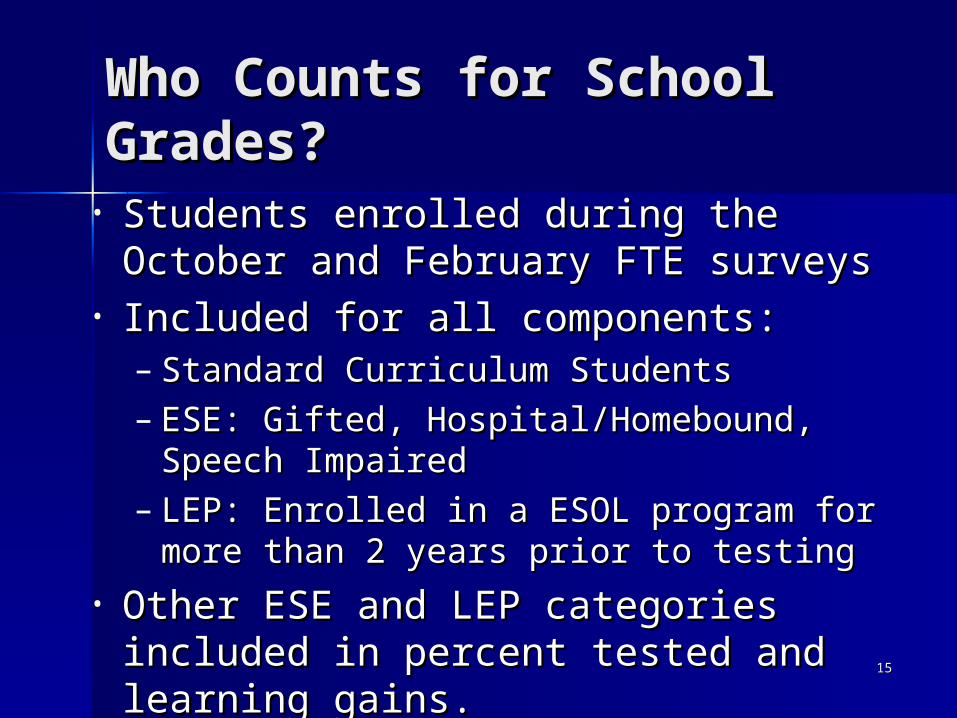
Who Counts for School Who Counts for School Grades?Grades?
• Students enrolled during the October Students enrolled during the October and February FTE surveysand February FTE surveys
• Included for all components:Included for all components:– Standard Curriculum StudentsStandard Curriculum Students– ESE: Gifted, Hospital/Homebound, ESE: Gifted, Hospital/Homebound,
Speech Impaired Speech Impaired – LEP: Enrolled in a ESOL program for more LEP: Enrolled in a ESOL program for more
than 2 years prior to testingthan 2 years prior to testing• Other ESE and LEP categories Other ESE and LEP categories
included in percent tested and included in percent tested and learning gains.learning gains.
1616
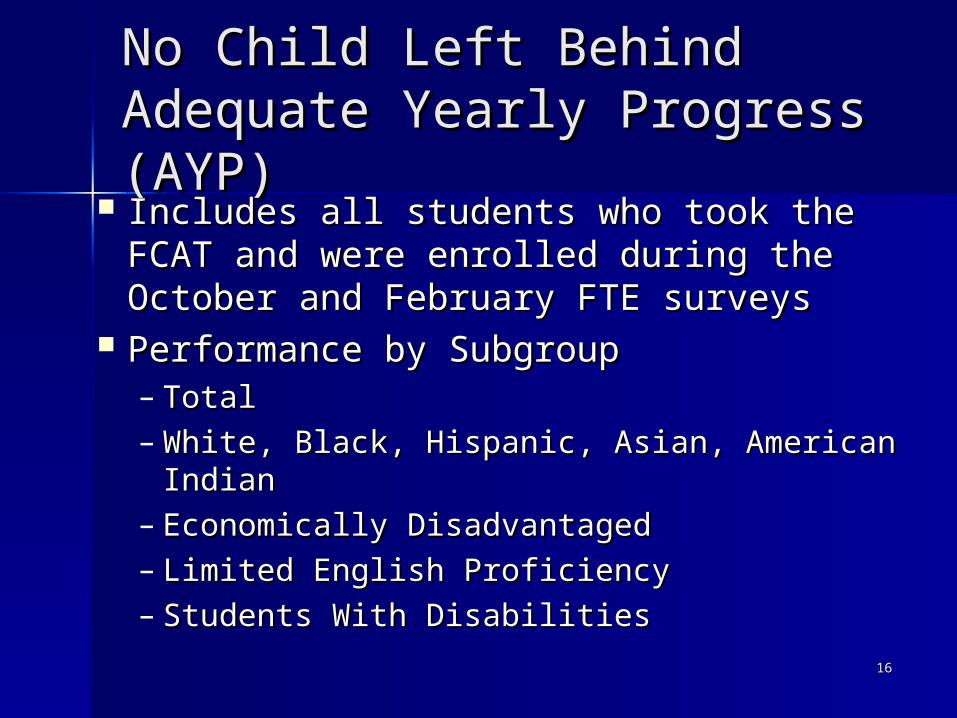
No Child Left BehindNo Child Left BehindAdequate Yearly Progress Adequate Yearly Progress (AYP)(AYP)
Includes all students who took the FCAT Includes all students who took the FCAT and were enrolled during the October and and were enrolled during the October and February FTE surveysFebruary FTE surveys
Performance by SubgroupPerformance by Subgroup– TotalTotal– White, Black, Hispanic, Asian, American IndianWhite, Black, Hispanic, Asian, American Indian– Economically Disadvantaged Economically Disadvantaged – Limited English Proficiency Limited English Proficiency – Students With DisabilitiesStudents With Disabilities
1717
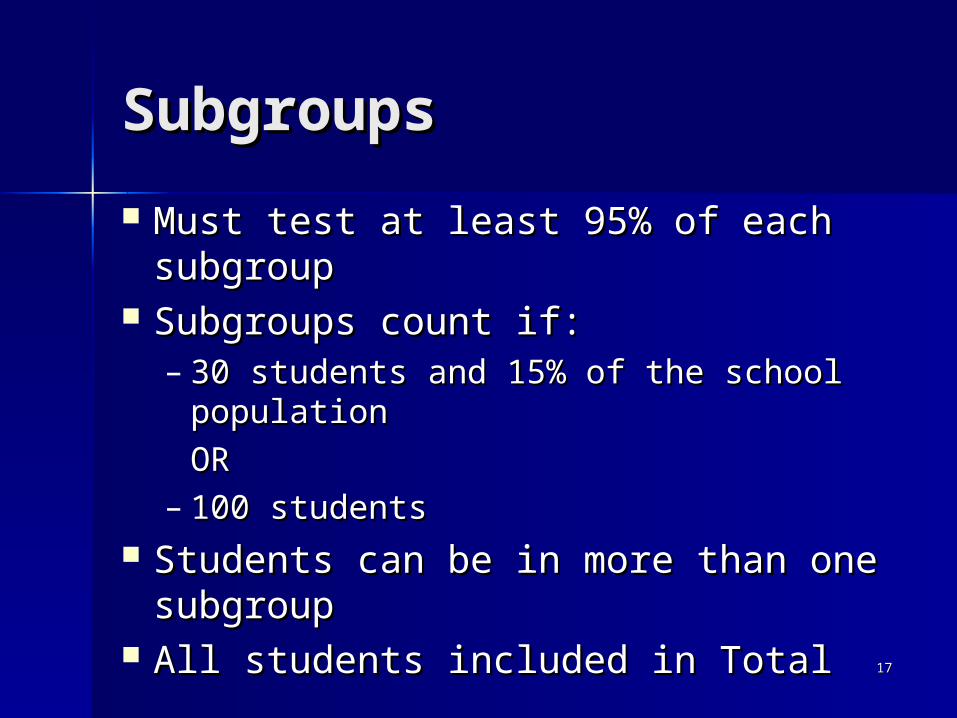
SubgroupsSubgroups
Must test at least 95% of each Must test at least 95% of each subgroupsubgroup
Subgroups count if:Subgroups count if:– 30 students and 15% of the school 30 students and 15% of the school
populationpopulation
OROR– 100 students100 students
Students can be in more than one Students can be in more than one subgroupsubgroup
All students included in TotalAll students included in Total
1818
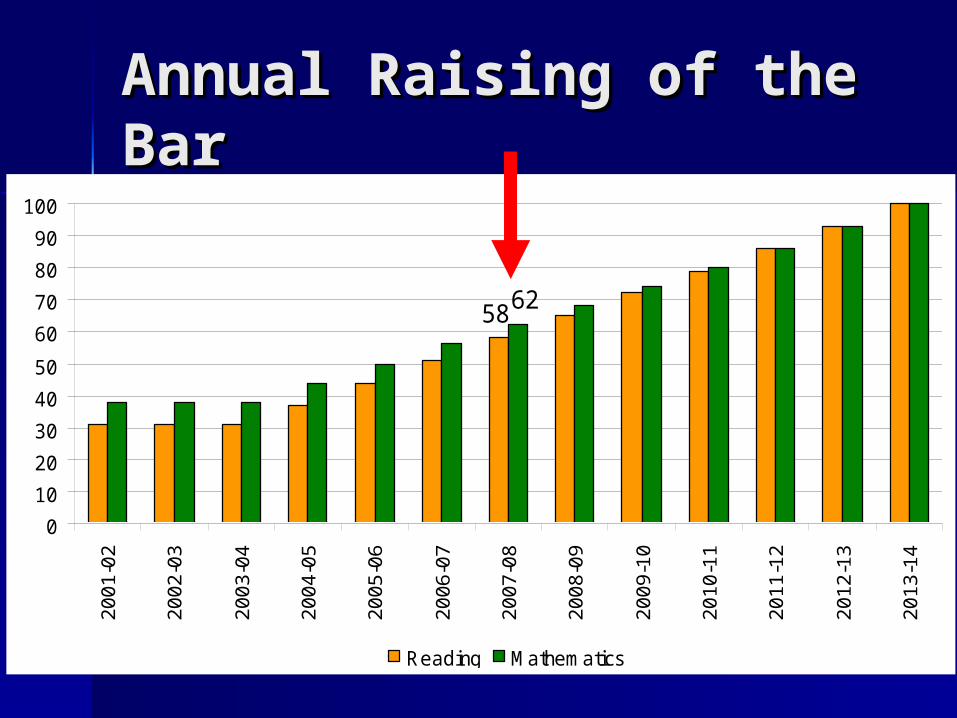
Annual Raising of the Annual Raising of the BarBar
5862
0
10
20
30
40
50
60
70
80
90
100
20
01
-02
20
02
-03
20
03
-04
20
04
-05
20
05
-06
20
06
-07
20
07
-08
20
08
-09
20
09
-10
20
10
-11
20
11
-12
20
12
-13
20
13
-14
Reading Mathematics
1919
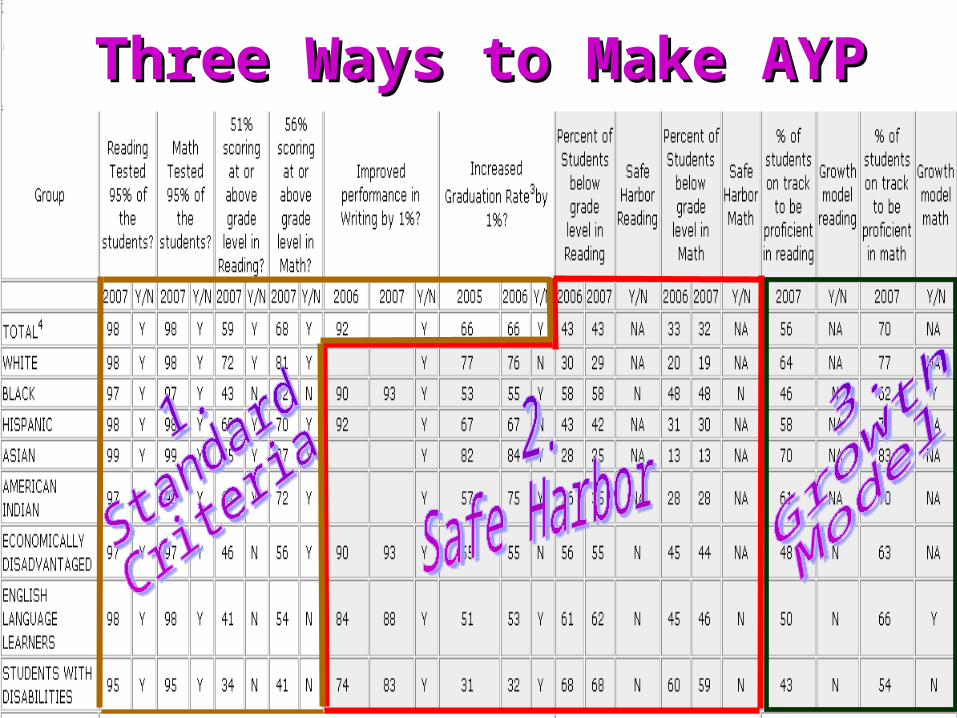
Three Ways to Make AYPThree Ways to Make AYP
2020
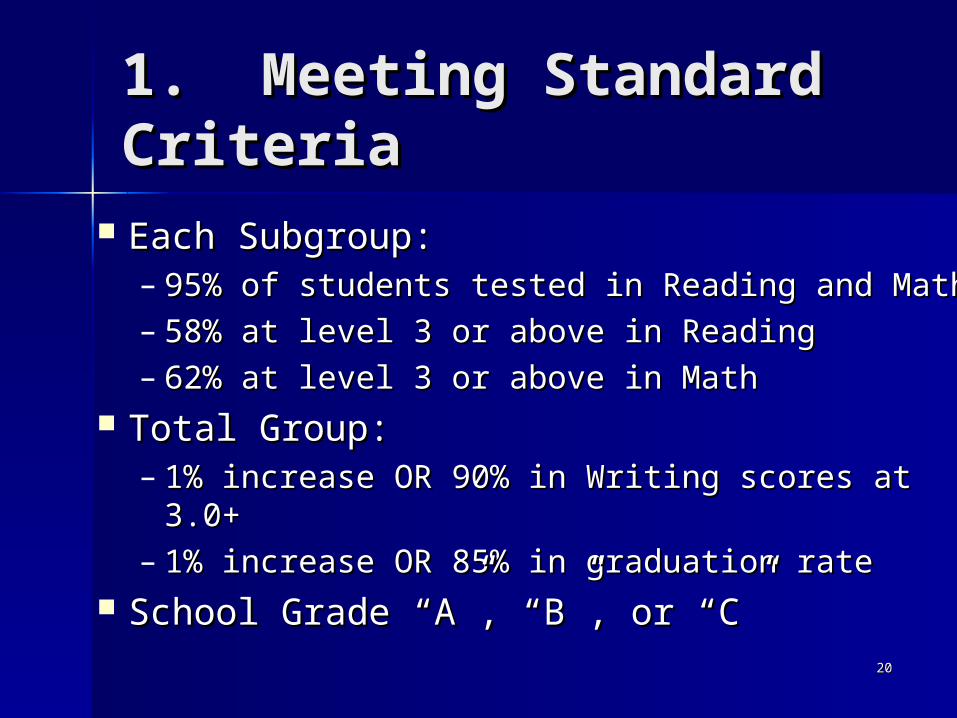
1. Meeting Standard 1. Meeting Standard CriteriaCriteria
Each Subgroup:Each Subgroup:– 95% of students tested in Reading and Math95% of students tested in Reading and Math– 58% at level 3 or above in Reading58% at level 3 or above in Reading– 62% at level 3 or above in Math62% at level 3 or above in Math
Total Group:Total Group:– 1% increase OR 90% in Writing scores at 1% increase OR 90% in Writing scores at
3.0+3.0+– 1% increase OR 85% in graduation rate1% increase OR 85% in graduation rate
School Grade “A”, “B”, or “C”School Grade “A”, “B”, or “C”
2121
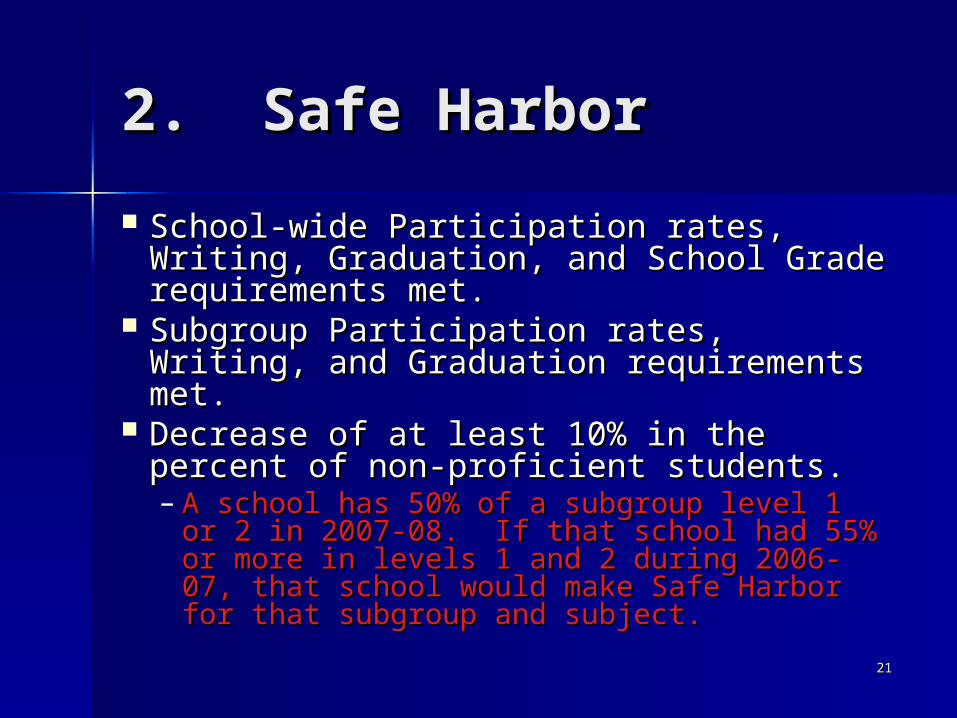
2. Safe Harbor2. Safe Harbor
School-wide Participation rates, Writing, School-wide Participation rates, Writing, Graduation, and School Grade Graduation, and School Grade requirements met.requirements met.
Subgroup Participation rates, Writing, Subgroup Participation rates, Writing, and Graduation requirements met.and Graduation requirements met.
Decrease of at least 10% in the percent Decrease of at least 10% in the percent of non-proficient students. of non-proficient students. – A school has 50% of a subgroup level 1 or 2 A school has 50% of a subgroup level 1 or 2
in 2007-08. If that school had 55% or more in 2007-08. If that school had 55% or more in levels 1 and 2 during 2006-07, that in levels 1 and 2 during 2006-07, that school would make Safe Harbor for that school would make Safe Harbor for that subgroup and subject.subgroup and subject.
2222
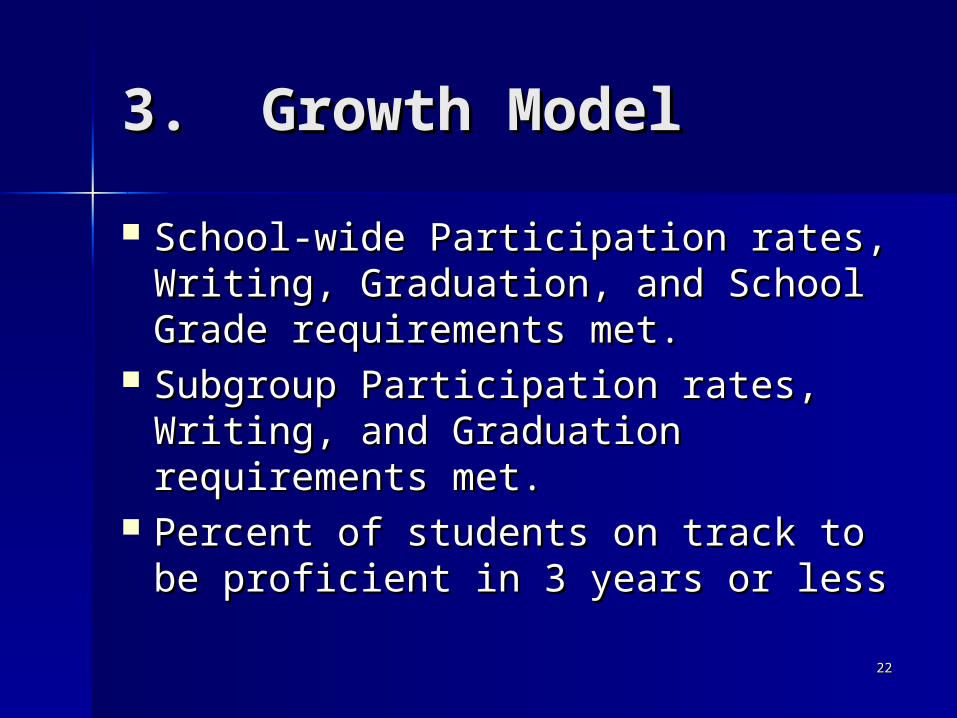
3. Growth Model3. Growth Model
School-wide Participation rates, School-wide Participation rates, Writing, Graduation, and School Writing, Graduation, and School Grade requirements met.Grade requirements met.
Subgroup Participation rates, Subgroup Participation rates, Writing, and Graduation Writing, and Graduation requirements met.requirements met.
Percent of students on track to be Percent of students on track to be proficient in 3 years or lessproficient in 3 years or less
2323
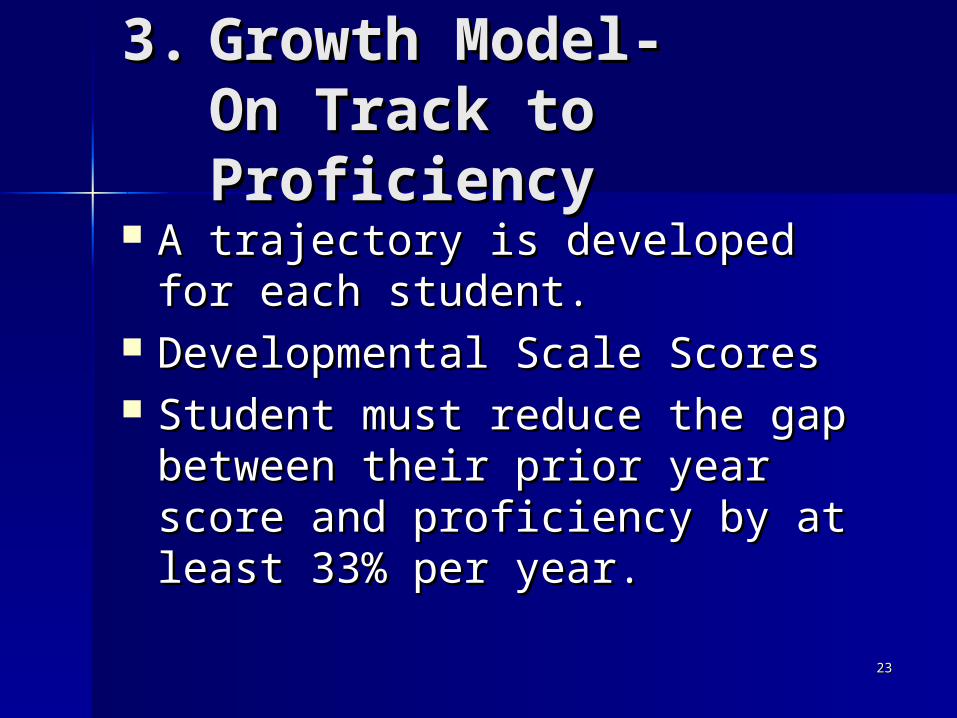
3.3. Growth Model-Growth Model-On Track to On Track to ProficiencyProficiency
A trajectory is developed for each A trajectory is developed for each student.student.
Developmental Scale Scores Developmental Scale Scores Student must reduce the gap Student must reduce the gap
between their prior year score between their prior year score and proficiency by at least 33% and proficiency by at least 33% per year. per year.
2424
3.3. Growth Model-Growth Model-On Track to On Track to ProficiencyProficiency
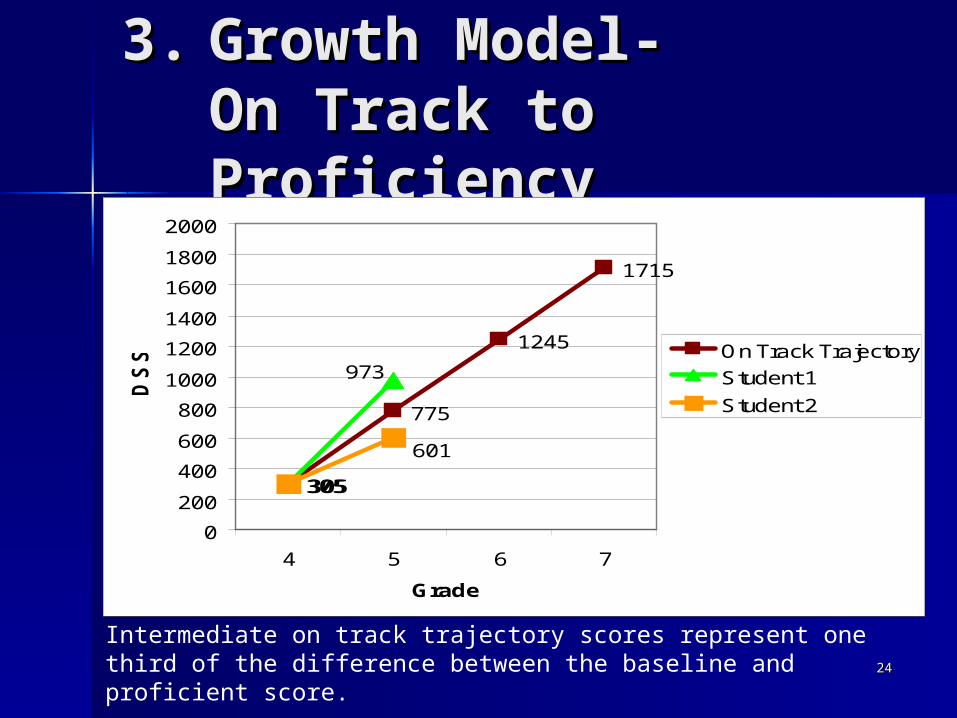
305
775
1245
1715
305305
973
601
0
200
400
600
800
1000
1200
1400
1600
1800
2000
4 5 6 7
Grade
DS
S On Track Trajectory
Student 1
Student 2
Intermediate on track trajectory scores represent one third of the difference between the baseline and proficient score.
2525
3.3. Growth Model-Growth Model-On Track to On Track to ProficiencyProficiency
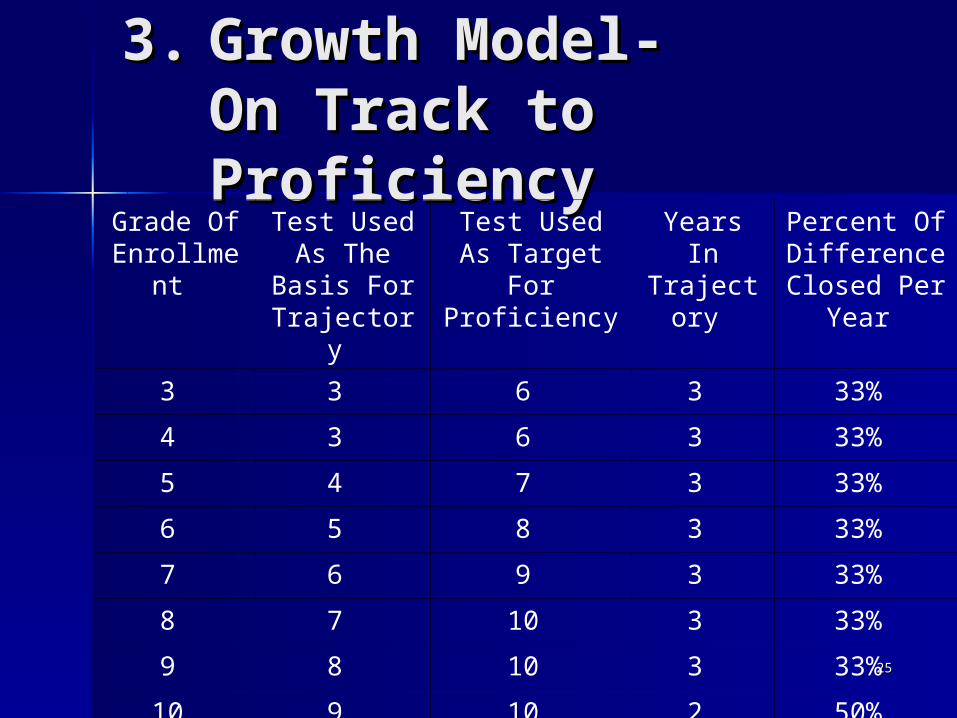
Grade Of Enrollment
Test Used As The
Basis For Trajectory
Test Used As Target For Proficiency
Years In Trajectory
Percent Of Difference Closed Per
Year
3 3 6 3 33%
4 3 6 3 33%
5 4 7 3 33%
6 5 8 3 33%
7 6 9 3 33%
8 7 10 3 33%
9 8 10 3 33%
10 9 10 2 50%

2626
Correlation Between Correlation Between School Grades and AYPSchool Grades and AYP
School Grades and AYP are based on School Grades and AYP are based on separate computational methods.separate computational methods.
In prior years, “Provisional AYP” In prior years, “Provisional AYP” status was awarded to schools that status was awarded to schools that did not meet AYP criteria, but earned did not meet AYP criteria, but earned an “A” or “B” designation. These an “A” or “B” designation. These schools still have same consequences schools still have same consequences as schools that do not meet AYP.as schools that do not meet AYP.
““D” or “F” schools cannot make AYP, D” or “F” schools cannot make AYP, even if all AYP criteria are met.even if all AYP criteria are met.
2727
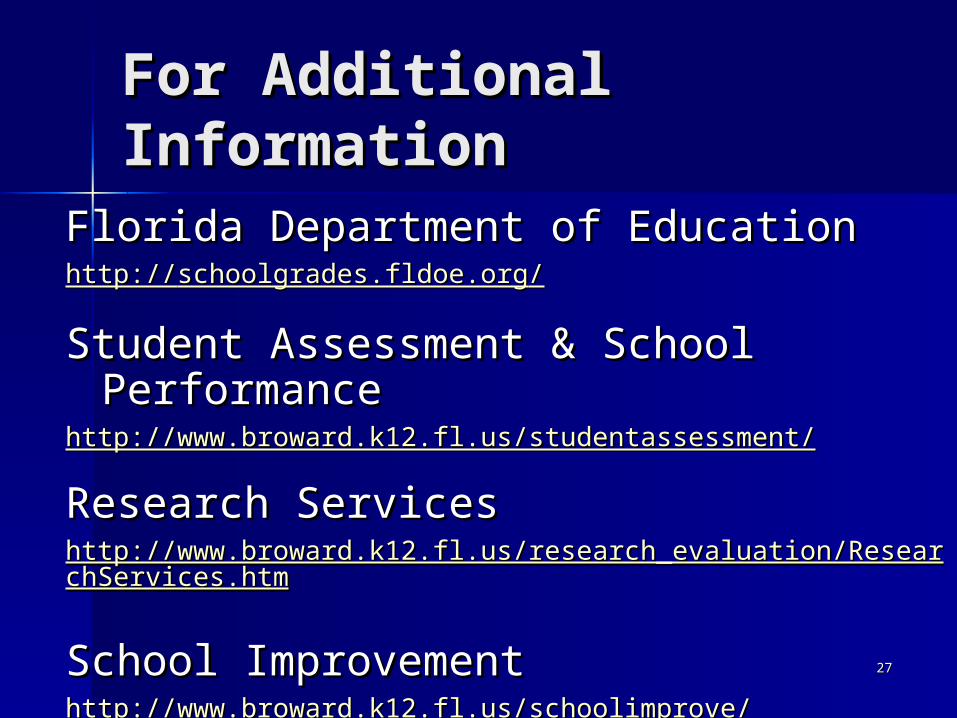
For Additional For Additional InformationInformation
Florida Department of EducationFlorida Department of Educationhttp://http://schoolgrades.fldoe.orgschoolgrades.fldoe.org//
Student Assessment & School Student Assessment & School PerformancePerformance
http://www.broward.k12.fl.us/studentassessment/http://www.broward.k12.fl.us/studentassessment/
Research ServicesResearch Serviceshttp://www.broward.k12.fl.us/research_evaluation/ResearchServichttp://www.broward.k12.fl.us/research_evaluation/ResearchServices.htmes.htm
School ImprovementSchool Improvementhttp://www.broward.k12.fl.us/schoolimprove/http://www.broward.k12.fl.us/schoolimprove/


![Adequate Yearly Progress 2011-12 [Our School District]](https://img.pdfslide.net/doc/110x75/568162d9550346895dd36008/adequate-yearly-progress-2011-12-our-school-district.jpg)