Embed Size (px)
Citation preview

1
Prospects for the New Look Tenon
John DellChief Executive, Tenon Limited
Crowne Plaza Hotel, Auckland
16 November 2004

2
First, a bit of history
• Fletcher Challenge Forests was a vertically integrated business, dominated by investment in forest resource
Characterised by:
• Capital intensive and low returns
• Not earning cost of capital
• Declining long term product price trend / increasing global supply profile
• Persistent under-valuation by equity market
• Pension funds natural owners

3
Why we sold the forest assets
• Forest returns low and volatile
• Processing and distribution returns high and growing
Return on Assets at Operating Earnings Level
0%
4%
8%
12%
16%
2001 2002 2003 2004
Forests & Supply Processing & Distribution

4
A bit more history
• November 2002 Forest divestment strategy announced
• March 2003 Sale of Teal cutting rights for $121m
• February 2004 Sale of forests to Kiwi Consortium for $560m
• April 2004 Sale of Tarawera cutting rights to Hancock for $165m
• June 2004 Rubicon acquires majority control of Tenon
• October 2004 Substantial completion of forest sale process
• October 2004 Strategic review of structural business commenced
5
Excess capital is being returned to shareholders
• $349m returned to shareholders in March 2004
• Forest sale now substantially complete - 98% of cash received
• Further $321m intended to be returned early 2005
• This further capital return represents $1.15 per existing share

6
0.00
0.50
1.00
1.50
2.00
2.50
Jan-03
Apr-03
Jul-03
Oct-03
Jan-04
Apr-04
Jul-04
Oct-04
15/1/03Sale of Cutting Rights
16/6/03Forest
Sale Plan
15/9/03Campbel
l Bid
19/12/03Kiwi Sale Agreeme
nt
$
Strategy is adding value – TEN Share Price (adjusted)
1/04/04 Tarawera
Sale
8/04/04 Rubicon
Offer

7
• A focus on manufacturing, marketing and distribution of solid wood products, characterised by:– Relatively low capital intensity– High and increasing returns on capital– Significant investment in distribution– Strong market positions– Significant growth opportunities
To the future

8
Structural building solutions
• For the Australian and New Zealand building sectors
• Key customers– Frame and truss manufacturers– NZ Building merchants– Australian timber/panel distributors– Rural supply merchants
• Key drivers– Building sector activity, particularly
residential– brand performance
9
Structural business strategic review
• Received unsolicited approaches in relation to our Structural business
• Undertaking a strategic review
• Good assets, good market position, good brand
• With plans for growth
• But - will sell if this maximises value to shareholders

10
• For the North American, Asian and European markets
• Key customers– American Wood Moulding The Home Depot– Empire Lowe’s– US millwork manufacturers– Zenia House in Europe– European / Asian furniture manufacturers
• Key drivers– US repair and remodelling spend– Furniture buyers’ acceptance of Radiata pine
Appearance wood products
11
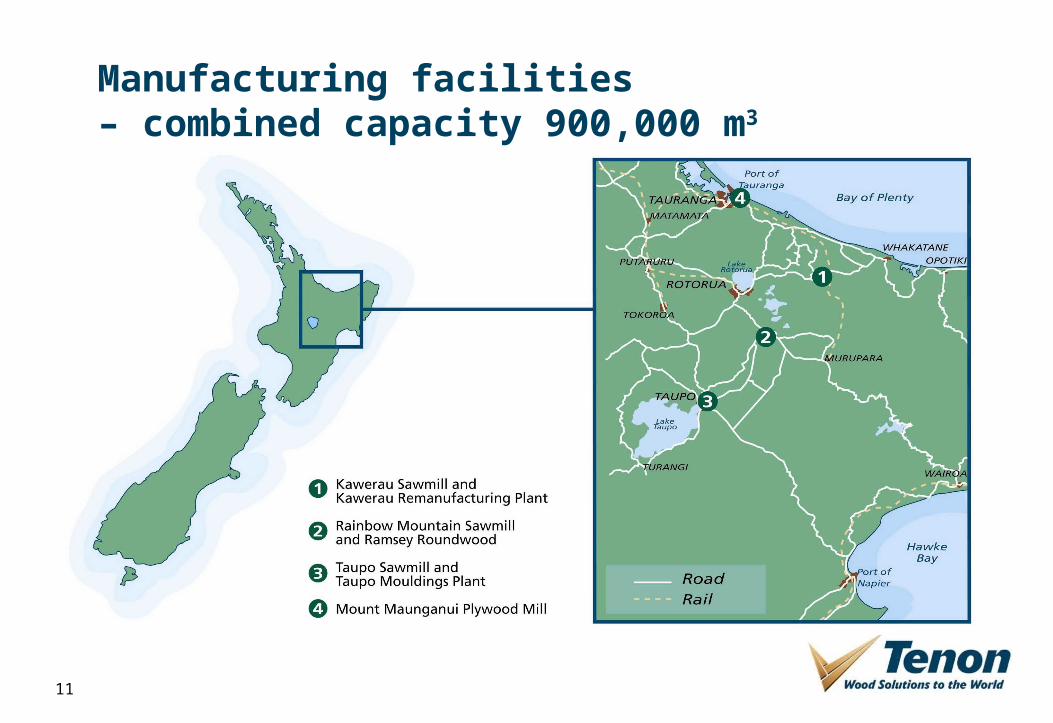
Manufacturing facilities – combined capacity 900,000 m3
12
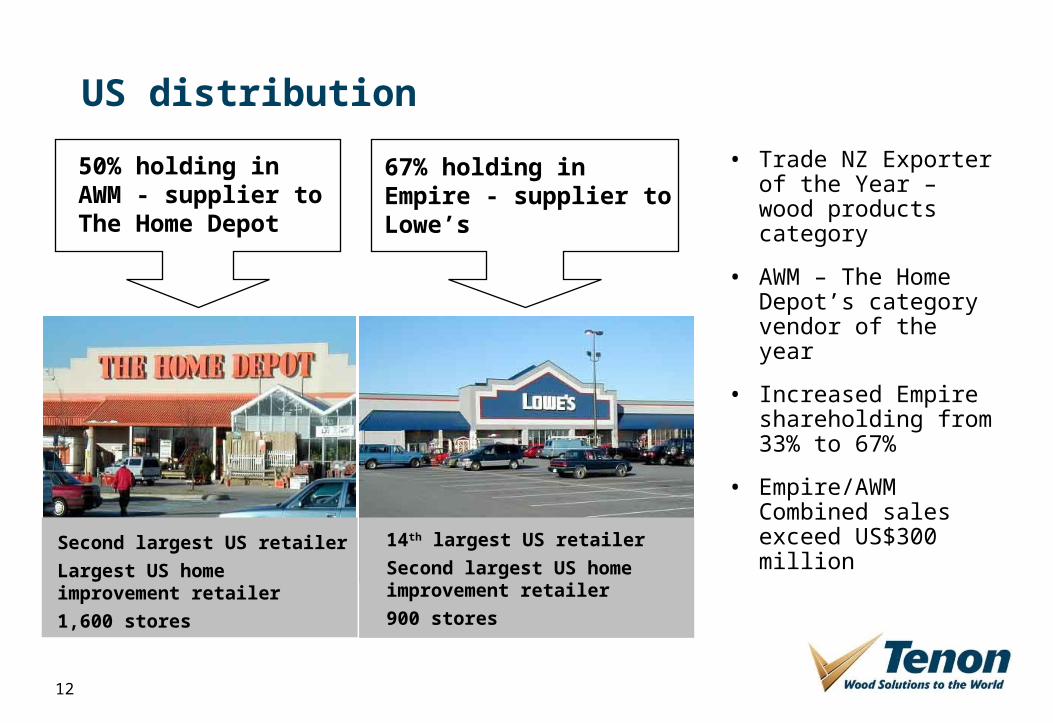
14th largest US retailer
Second largest US home improvement retailer
900 stores
Second largest US retailer
Largest US home improvement retailer
1,600 stores
US distribution
50% holding in AWM - supplier to The Home Depot
67% holding in Empire - supplier to Lowe’s
• Trade NZ Exporter of the Year – wood products category
• AWM – The Home Depot’s category vendor of the year
• Increased Empire shareholding from 33% to 67%
• Empire/AWM Combined sales exceed US$300 million

13
US distribution centres and service areas
The Empire Company67% owned
American Wood Moulding50% owned

14
Growth
• Tenon Consumer Solutions – 10,000 stores by 2010
• Expand US position – through acquisitions and organic growth
• Replicate US channel-to-market model in Europe, providing
– A supply channel for high value product, and– Equity profits
• China
– US$24b home renovation market growing at 30% per annum
– Global furniture manufacturing centre
– Establishing key relationships

15
Acquired 20% Zenia House

16
Financial outlook
• Underlying earnings growth in excess of 30%
• Marked by impact of foreign exchange movement and corporate costs
$million Actual FY04
Sales 556
EBITDA 64(before Unusual Items)
Projected FY05
735
64

17
Balance sheet
• Projected net debt to total market cap 2005 – 25%
• Borrowing covenants
– Gearing – net debt / EBITDA
Policy max 3.0 xProjected 2005 1.7 x
– Interest cover – EBIT / interest expense
Policy min 3.0 xProjected 2005 6.5 x

18
Summary
• Forest divestment strategy successfully implemented
• Diversified targeted market exposure
– Australasia, US, Europe, Asia
• Decision on continued ownership of Structural business will be based on maximising shareholder value
• Defined growth plans
• Shareholder value focus strongly evidenced by strategy and actions