Embed Size (px)
Citation preview

1. Quarter 2018
Dynamic Start to the Year
ETF Market Report
The first quarter of the 2018 stock exchange year was very dynamic and characterized by considerable volatility. The European leading indices made losses, due in part to the threat of trade war with the USA. The Swiss Market Index SMI© closed the quarter at 8,740.97 points, down 6.83% on the end of 2017. Product providers were prepared and listed 106 new ETFs on SIX Swiss Exchange. Five smart beta ETFs from Franklin Templeton can newly also be traded on the Swiss Exchange. In total, 1,343 ETFs (as of March 30, 2018) are currently on offer.
The Swiss ETF market showed a benevolent face in the first quarter of 2018: Trading turnover increased (on the previous quarter) by around 5% to CHF 31.6 billion – again thanks to high demand for equity ETFs. The increased market volatility caused a big jump in the number of trades. 321,562 ETF tickets were generated in the first quarter of 2018, a significant gain of 25% compared to the previous quarter and more than since the beginning of 2015, when the Swiss National Bank scrapped the euro/Swiss franc exchange rate peg and volatility increased sharply as a result.
Number of new listings in the 1. quarter 2018
Average trade size
Top turnover single ETFNumber of ETF transactions in
the 1. quarter 2018 on SIX Swiss Exchange
106
1,743 mn
98,252 1,343Volume in the 1. quarter in the UBS ETF ACWI (Symbol: ACWIU)
Best performance in 1. quarter 2018
15.97%Xtracker FTSE Vietnam ETF (XFVI)
Number of the quarter
Source: SIX Swiss Exchange
2. Quarter 4. Quarter1. Quarter 3. Quarter Number of trades
ETF turnover development
Exchange Traded Product Day 201824 May, SIX ConventionPoint, Zurichwww.etpd.ch
Register now!
Bn CHF
2012 2013 2014 2015 2016 2017 2018
140
120
100
80
60
40
20
0
Number of trades
1,400,000
1,200,000
1,000,000
800,000
600,000
400,000
200,000
0

2No. 01 | 1. Quarter 2018
ETF Market Report | Table of contents
Editorial
1. ETF market SIX Swiss Exchange ..................................................................................... 031.1 ETF turnover and number of trades on SIX Swiss Exchange (during the quarter) .................... 031.2 Top-10 selected changes in the overall market .......................................................................... 041.3 Turnover by product provider ..................................................................................................... 051.4 Top-5 selected changes per asset class ..................................................................................... 061.5 Trading details ............................................................................................................................. 07
2. ETFs in Switzerland ......................................................................................................... 082.1 Top-10 Inflows ........................................................................................................................... 082.2 Top-10 Outflows ......................................................................................................................... 09 2.3 Trading details ............................................................................................................................. 102.4 Number of ETFs on SIX Swiss Exchange by market maker ....................................................... 112.5 New listings in the quarter 2018 ................................................................................................. 12
3. European market ............................................................................................................. 16
4. Interview ......................................................................................................................... 17
5. Disclaimer/Imprint ........................................................................................................... 19
Table of contents

3No. 01 | 1. Quarter 2018
1. ETF market SIX Swiss Exchange
Top-20 most traded ETFs
Source: SIX Swiss Exchange
Source: SIX Swiss Exchange
The positive turnover trend in ETFs listed on SIX Swiss Exchange was primarily thanks to equity ETFs in the first quarter. The latter recorded an increase of +26.4% compared to the preceding quarter at the end of last year to CHF 27.49 billion. They again remained the dominant asset class by some margin. As a result of the US Fed’s interest hike debate and its effects on the bond market, turnover in bond ETFs declined markedly to CHF 2.3 billion (-62%). Turnover in commodity ETFs fell by -22% to CHF 1.76 billion.
UBSETF ACWI (symbol: ACWIU) took pole position on the list of the top 20 most-traded ETFs in Q1 2018. This ETF replicates an index that tracks large and mid-caps from industrialized and emerging countries. In this quarter, the top positions are again taken by the iShares S&P 500 ETF (symbol: CSSPX) and the iShares SMI ETF (symbol: CSSMI).
1.1 ETF turnover and number of trades
Turnover (bn CHF)
35
30
25
20
15
10
5
0
Number of trades
350,000
300,000
250,000
200,000
150,000
100,000
50,000
0Q1/16 02/16 Q3/16 Q4/16 Q1/17 Q2/17 Q3/17 Q4/17 Q1/18
Fixed IncomeEquity
Total turnoverCommodities Number of trades
ETF Market Report | 1. ETF market SIX Swiss Exchange | 1.1
Product Turnover (mn CHF) Trend
UBSETF ACWI hdg to USD A-acc 1,743.19
UBSETF ACWI hdg to CHF A-acc 1,476.80
UBSETF ACWI hdg to EUR A-acc 1,360.84
iShares S&P 500 UCITS 1,156.68
iShares SMI ETF (CH) 1,088.83
UBS ETF - MSCI EM SF USD A 899.05
LYXOR DAX 769.72
POWERSHARES EQQQ 756.80
iShares EURO STOXX 50 UCITS 693.35
LYXOR ETF EURO STOXX 50 LEV 597.94
UBS ETF (CH) - SMI (CHF) A 580.82
iShares MSCI EM IMI UCITS ETF 440.27
iShares S&P 500 UCITS 359.24
UBSETF MSCI USA hdg to EUR 339.34
iShares SMIM ETF (CH) 320.27
iShares Nasdaq 100 UCITS 291.44
UBS ETF MSCI EMU EUR A-acc 284.98
iShares MSCI EMU UCITS 281.73
iShares Core SPI ETF (CH) 267.86
UBS ETF MSCI EMU hdg to USD 263.92

4No. 01 | 1. Quarter 2018
1.2 Top-10 – selected changes in the overall market
In the first quarter, ETFs based on selected emerging countries dominated as performance frontrunners. The Xtracker FTSE VIETNAM ETF (symbol: XFVI) topped the performance rankings. The Brazilian equities market likewise celebrated a massive comeback, so there are many ETFs (symbols HBRL, CSBR, XMBR, BRZ and
IBZL) with a focus on Brazil in the top ten. ETFs based on US energy infrastructure battled losses. MLPI and MLPS lead the flop ten list. ETFs based on the precious metals palladium and gold also had hard times – and are represented in the flop ten list by six ETFs.
Source: Bloomberg Source: Bloomberg
Source: SIX Swiss Exchange
Top-10 ETFs best performance Top-10 ETFs worst performance
Top-10 ETFs number of trades (tickets)
ETF Market Report | 1. ETF market SIX Swiss Exchange | 1.2
Product Symbol Performance Trend
XTRACKER FTSE VIETNAM SWAP XFVI +15.97
HSBC MSCI BRAZIL UCITS ETF HBRL +11.50
LYXOR DAILY SHORTDAX X2 ETF LYDSD +11.35
iShares MSCI BRAZIL ACC CSBR +9.56
LYXOR SMI DAILY -2X INVERSE LYSSL +9.26
XTRACKER MSCI BRAZIL 1C XMBR +8.80
AMUNDI MSCI BRAZIL BRZ +8.77
ETFS ISE CYBER SEC GO UCITS ISPY +8.57
iShares MSCI BRAZIL IBZL +8.40
ISHR HEALTHCARE INNOVATION HEAL +8.09
Product Symbol Performance Trend
ETFS US ENERGY INFRASTRUCTUR MLPI -15.88
SOURCE MORNINGSTAR US ENERGY MLPS -13.46
UBS ETF SOL. GL. PURE GOLD GGMCHY -12.20
LYXOR SMI DAILY 2X LEVERAGED LYSLE -12.18
LYXOR ETF DAILY LEV DAX LYLVD -12.15
GAM PHYS PALLADIUM - USD AX JBPAUX -12.14
COMSTAGE ETF GOLD BUGS CBGOLD -12.05
GAM PHYS PALLADIUM - USD A JBPAUA -12.01
UBS ETF SOL. GL. PURE GOLD GGMUSY -11.98
UBS ETF PALLADIUM PLUSA -11.94
Product Symbol No. of trades Trend
iSHARES S&P 500 UCITS CSSPX 9,989
iShares SMI ETF (CH) CSSMI 8,413
UBS ETF - MSCI EM SF USD A EGUSAS 6,548
iShares SMIM ETF (CH) CSSMIM 5,228
iShares Core SPI ETF (CH) CHSPI 4,863
UBS ETF (CH) - SMI (CHF) A SMICHA 4,572
iSHARES Nasdaq 100 UCITS CSNDX 4,548
iShares MSCI EM IMI UCITS ETF EIMI 4,417
POWERSHARES EQQQ EQQQ 4,333
iSHARES EURO STOXX 50 UCITS CSSX5E 4,319
5No. 01 | 1. Quarter 2018
ETF Market Report | 1. ETF market SIX Swiss Exchange | 1.3
1.3 Turnover by product provider
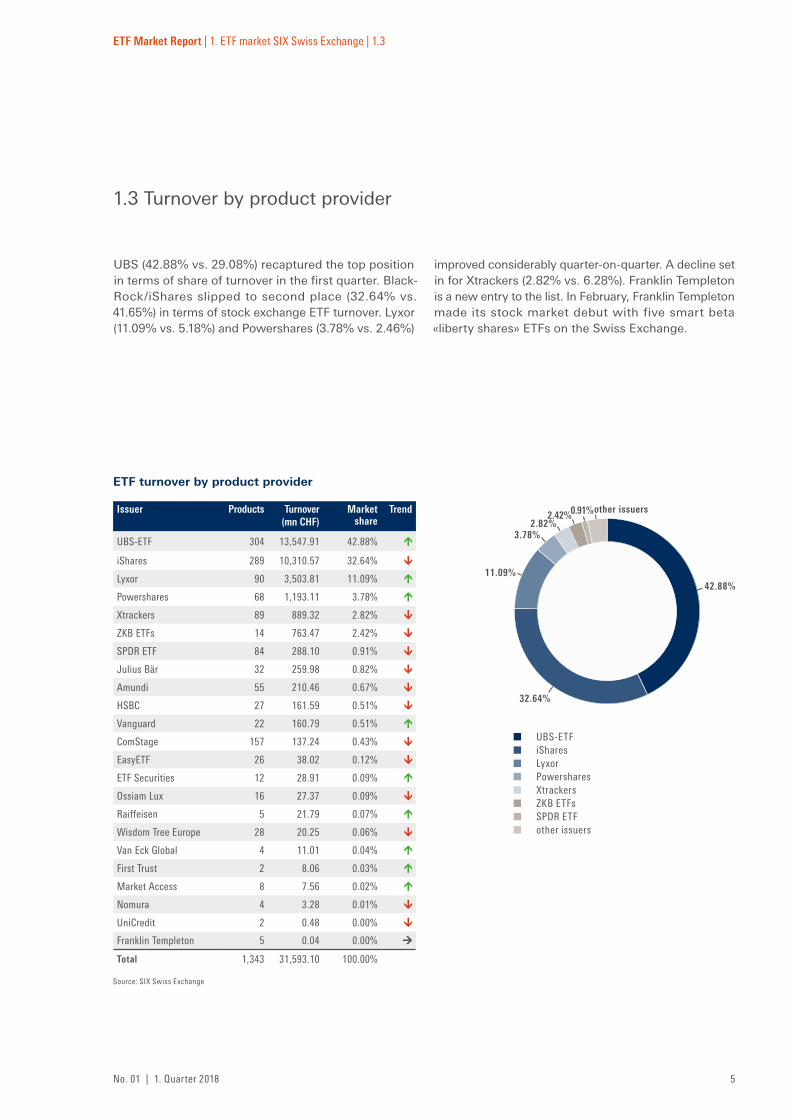
UBS (42.88% vs. 29.08%) recaptured the top position in terms of share of turnover in the first quarter. Black-Rock/iShares slipped to second place (32.64% vs. 41.65%) in terms of stock exchange ETF turnover. Lyxor (11.09% vs. 5.18%) and Powershares (3.78% vs. 2.46%)
improved considerably quarter-on-quarter. A decline set in for Xtrackers (2.82% vs. 6.28%). Franklin Templeton is a new entry to the list. In February, Franklin Templeton made its stock market debut with five smart beta «liberty shares» ETFs on the Swiss Exchange.
Source: SIX Swiss Exchange
42.88%
32.64%
2.42%
11.09%
3.78%2.82%
0.91%other issuers
ETF turnover by product provider
Issuer Products Turnover (mn CHF)
Market share
Trend
UBS-ETF 304 13,547.91 42.88%
iShares 289 10,310.57 32.64%
Lyxor 90 3,503.81 11.09%
Powershares 68 1,193.11 3.78%
Xtrackers 89 889.32 2.82%
ZKB ETFs 14 763.47 2.42%
SPDR ETF 84 288.10 0.91%
Julius Bär 32 259.98 0.82%
Amundi 55 210.46 0.67%
HSBC 27 161.59 0.51%
Vanguard 22 160.79 0.51%
ComStage 157 137.24 0.43%
EasyETF 26 38.02 0.12%
ETF Securities 12 28.91 0.09%
Ossiam Lux 16 27.37 0.09%
Raiffeisen 5 21.79 0.07%
Wisdom Tree Europe 28 20.25 0.06%
Van Eck Global 4 11.01 0.04%
First Trust 2 8.06 0.03%
Market Access 8 7.56 0.02%
Nomura 4 3.28 0.01%
UniCredit 2 0.48 0.00%
Franklin Templeton 5 0.04 0.00%
Total 1,343 31,593.10 100.00%
UBS-ETF iShares Lyxor Powershares Xtrackers ZKB ETFs SPDR ETF other issuers
6No. 01 | 1. Quarter 2018
ETF Market Report | 1. ETF market SIX Swiss Exchange | 1.4
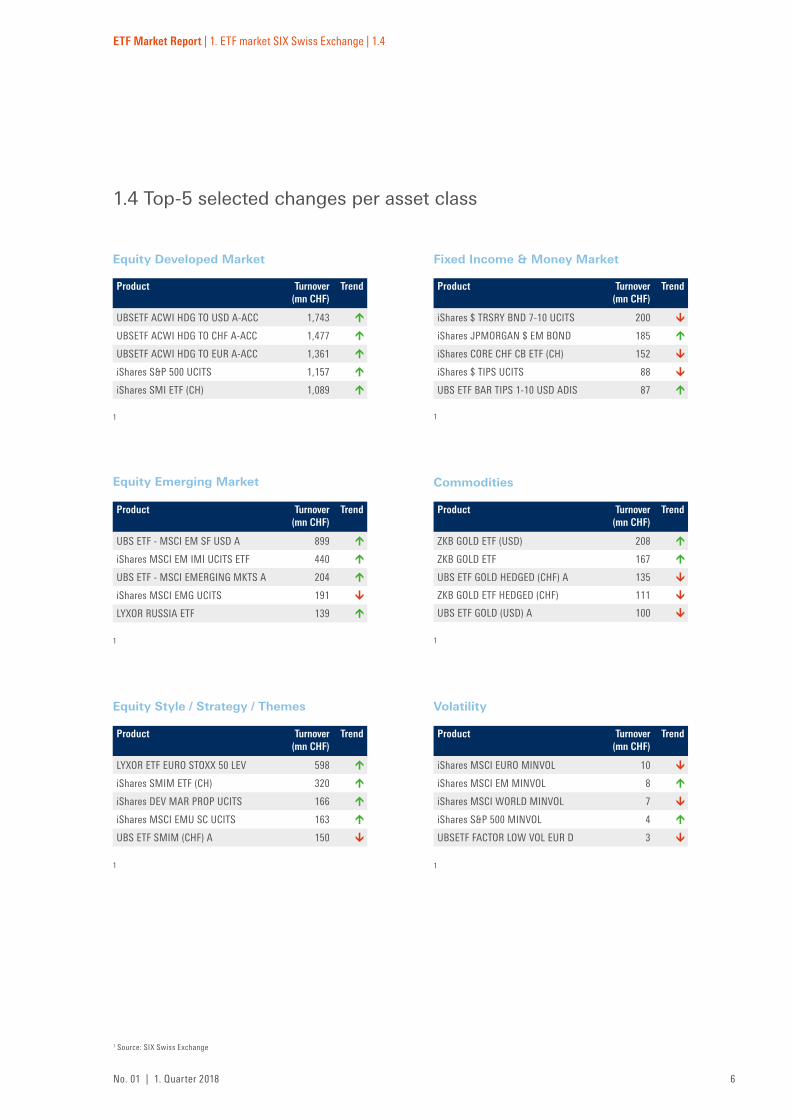
1.4 Top-5 selected changes per asset class
1
1
1
1 Source: SIX Swiss Exchange
1
1
1
Equity Developed Market
Equity Emerging Market
Equity Style / Strategy / Themes
Commodities
Volatility
Fixed Income & Money Market
Product Turnover(mn CHF)
Trend
UBSETF ACWI HDG TO USD A-ACC 1,743
UBSETF ACWI HDG TO CHF A-ACC 1,477
UBSETF ACWI HDG TO EUR A-ACC 1,361
iShares S&P 500 UCITS 1,157
iShares SMI ETF (CH) 1,089
Product Turnover(mn CHF)
Trend
UBS ETF - MSCI EM SF USD A 899
iShares MSCI EM IMI UCITS ETF 440
UBS ETF - MSCI EMERGING MKTS A 204
iShares MSCI EMG UCITS 191
LYXOR RUSSIA ETF 139
Product Turnover(mn CHF)
Trend
LYXOR ETF EURO STOXX 50 LEV 598
iShares SMIM ETF (CH) 320
iShares DEV MAR PROP UCITS 166
iShares MSCI EMU SC UCITS 163
UBS ETF SMIM (CHF) A 150
Product Turnover(mn CHF)
Trend
iShares $ TRSRY BND 7-10 UCITS 200
iShares JPMORGAN $ EM BOND 185
iShares CORE CHF CB ETF (CH) 152
iShares $ TIPS UCITS 88
UBS ETF BAR TIPS 1-10 USD ADIS 87
Product Turnover(mn CHF)
Trend
ZKB GOLD ETF (USD) 208
ZKB GOLD ETF 167
UBS ETF GOLD HEDGED (CHF) A 135
ZKB GOLD ETF HEDGED (CHF) 111
UBS ETF GOLD (USD) A 100
Product Turnover(mn CHF)
Trend
iShares MSCI EURO MINVOL 10
iShares MSCI EM MINVOL 8
iShares MSCI WORLD MINVOL 7
iShares S&P 500 MINVOL 4
UBSETF FACTOR LOW VOL EUR D 3
7No. 01 | 1. Quarter 2018
ETF Market Report | 1. ETF market SIX Swiss Exchange | 1.5
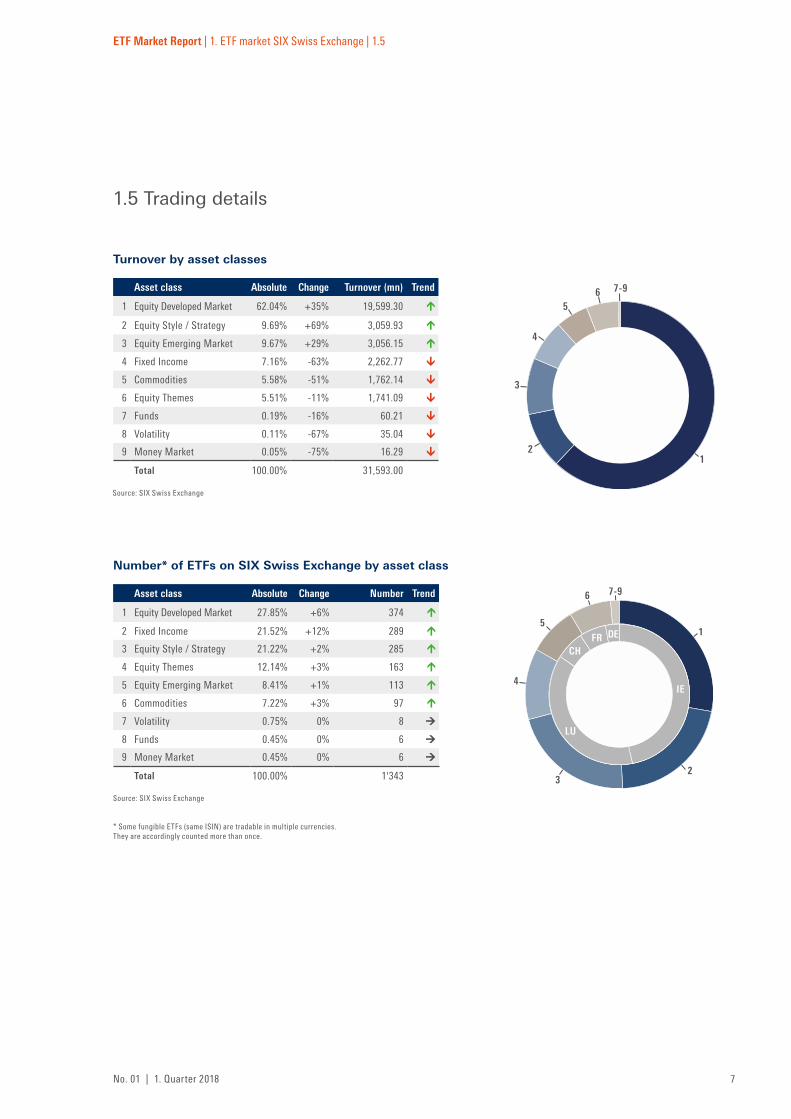
1.5 Trading details
Source: SIX Swiss Exchange
Source: SIX Swiss Exchange
Number* of ETFs on SIX Swiss Exchange by asset class
Turnover by asset classes
* Some fungible ETFs (same ISIN) are tradable in multiple currencies. They are accordingly counted more than once.
Asset class Absolute Change Turnover (mn) Trend
1 Equity Developed Market 62.04% +35% 19,599.30
2 Equity Style / Strategy 9.69% +69% 3,059.93
3 Equity Emerging Market 9.67% +29% 3,056.15
4 Fixed Income 7.16% -63% 2,262.77
5 Commodities 5.58% -51% 1,762.14
6 Equity Themes 5.51% -11% 1,741.09
7 Funds 0.19% -16% 60.21
8 Volatility 0.11% -67% 35.04
9 Money Market 0.05% -75% 16.29
Total 100.00% 31,593.00
Asset class Absolute Change Number Trend
1 Equity Developed Market 27.85% +6% 374
2 Fixed Income 21.52% +12% 289
3 Equity Style / Strategy 21.22% +2% 285
4 Equity Themes 12.14% +3% 163
5 Equity Emerging Market 8.41% +1% 113
6 Commodities 7.22% +3% 97
7 Volatility 0.75% 0% 8
8 Funds 0.45% 0% 6
9 Money Market 0.45% 0% 6
Total 100.00% 1'343
1
3
4
2
56 7-9
1
3
4
2
5
6 7-9
LU
IE
FRCH
DE

8No. 01 | 1. Quarter 2018
ETF Market Report | 2. ETFs in Switzerland | 2.1
2.1 Top-10 Inflows (in mn CHF)
2. ETFs in Switzerland
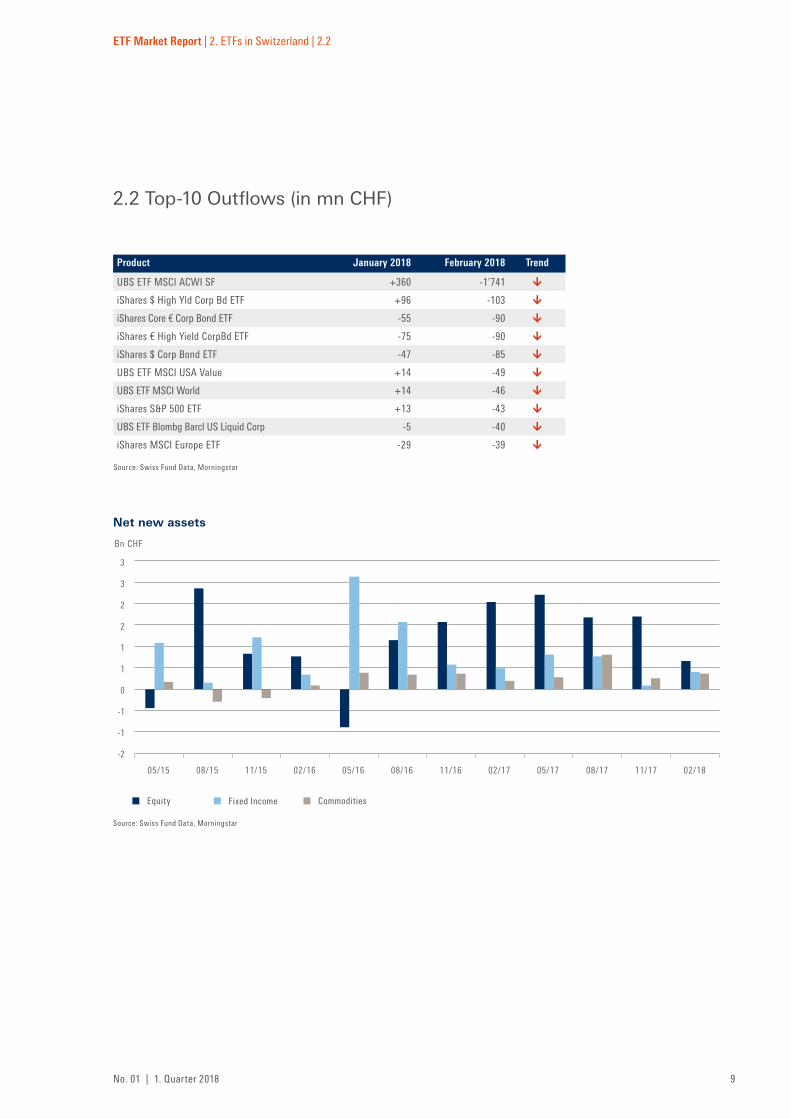
The most net new assets and net outflows were attributable to both bond ETFs and equity ETFs in February 2018. The iShares Core S&P 500 ETF (symbol: CSSPX) achieved the most growth in absolute terms. This ETF also made the biggest jump in relative net
inflows month-on-month. Outflows were dominated by UBS ETF MSCI ACWI SF (symbol: ACWIS), with very substantial net outflows. The outflows from bond ETFs from the corporate bond and high interest rate segment were likewise clearly visible.
Source: Swiss Fund Data, Morningstar
Product January 2018 February 2018 Trend
iShares Core S&P 500 ETF -253 +247
UBS ETF CMCI Ex-AgricultureTure SF +8 +203
UBS ETF Bloomberg Commodity SF +9 +167
UBS ETF (CH) MSCI Switzerland +57 +126
UBS ETF MSCI Canada +96 +119
UBS ETF MSCI EMU SRI +58 +107
iShares Core MSCI Japan IMI ETF +33 +103
iShares Core DAX® (DE) -67 +79
iShares $ Treasury Bd 7-10y ETF +20 +71
iShares MSCI World EUR Hedged ETF +73 +68
9No. 01 | 1. Quarter 2018
ETF Market Report | 2. ETFs in Switzerland | 2.2
2.2 Top-10 Outflows (in mn CHF)
Source: Swiss Fund Data, Morningstar
Fixed IncomeEquity Commodities
Net new assets
Bn CHF
3
3
2
2
1
1
0
-1
-1
-2
11/17 02/1805/15 08/15 11/15 02/16 05/16 08/16 11/16 02/17 05/17 08/17
Source: Swiss Fund Data, Morningstar
Product January 2018 February 2018 Trend
UBS ETF MSCI ACWI SF +360 -1'741
iShares $ High Yld Corp Bd ETF +96 -103
iShares Core € Corp Bond ETF -55 -90
iShares € High Yield CorpBd ETF -75 -90
iShares $ Corp Bond ETF -47 -85
UBS ETF MSCI USA Value +14 -49
UBS ETF MSCI World +14 -46
iShares S&P 500 ETF +13 -43
UBS ETF Blombg Barcl US Liquid Corp -5 -40
iShares MSCI Europe ETF -29 -39
10No. 01 | 1. Quarter 2018
ETF Market Report | 2. ETFs in Switzerland | 2.3
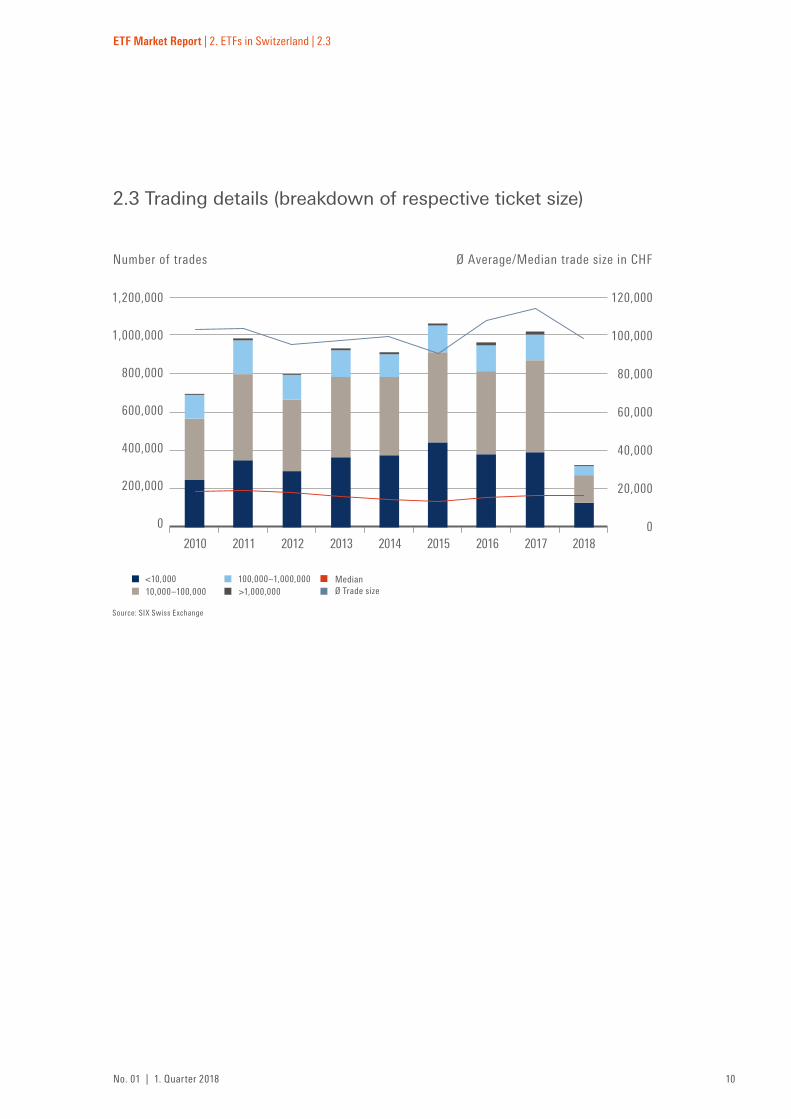
2.3 Trading details (breakdown of respective ticket size)
Source: SIX Swiss Exchange
10,000–100,000 >1,000,000<10,000 100,000–1,000,000 Median
Ø Trade size
Number of trades
1,200,000
1,000,000
800,000
600,000
400,000
200,000
0
Ø Average/Median trade size in CHF
120,000
100,000
80,000
60,000
40,000
20,000
020182010 2011 2012 2013 2014 2015 2016 2017
11No. 01 | 1. Quarter 2018
ETF Market Report | 2. ETFs in Switzerland | 2.4
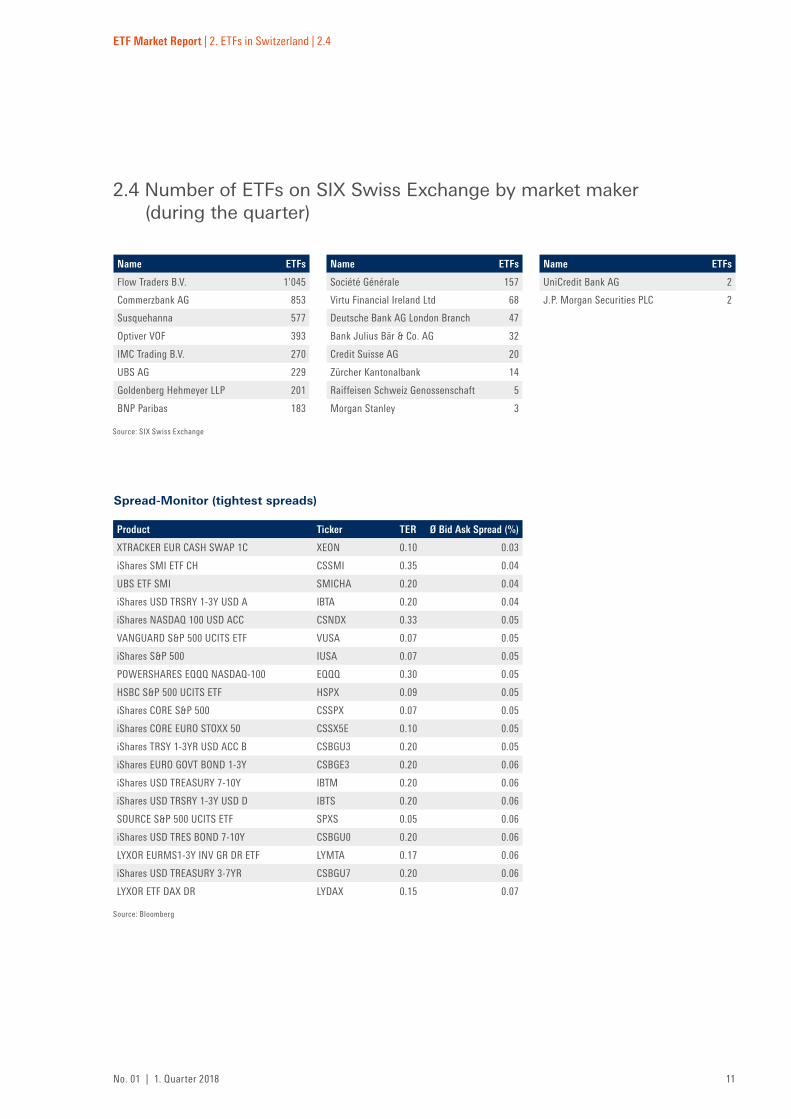
2.4 Number of ETFs on SIX Swiss Exchange by market maker (during the quarter)
Source: SIX Swiss Exchange
Spread-Monitor (tightest spreads)
Source: Bloomberg
Name ETFs Name ETFs Name ETFs
Flow Traders B.V. 1'045 Société Générale 157 UniCredit Bank AG 2
Commerzbank AG 853 Virtu Financial Ireland Ltd 68 J.P. Morgan Securities PLC 2
Susquehanna 577 Deutsche Bank AG London Branch 47
Optiver VOF 393 Bank Julius Bär & Co. AG 32
IMC Trading B.V. 270 Credit Suisse AG 20
UBS AG 229 Zürcher Kantonalbank 14
Goldenberg Hehmeyer LLP 201 Raiffeisen Schweiz Genossenschaft 5
BNP Paribas 183 Morgan Stanley 3
Product Ticker TER Ø Bid Ask Spread (%)
XTRACKER EUR CASH SWAP 1C XEON 0.10 0.03
iShares SMI ETF CH CSSMI 0.35 0.04
UBS ETF SMI SMICHA 0.20 0.04
iShares USD TRSRY 1-3Y USD A IBTA 0.20 0.04
iShares NASDAQ 100 USD ACC CSNDX 0.33 0.05
VANGUARD S&P 500 UCITS ETF VUSA 0.07 0.05
iShares S&P 500 IUSA 0.07 0.05
POWERSHARES EQQQ NASDAQ-100 EQQQ 0.30 0.05
HSBC S&P 500 UCITS ETF HSPX 0.09 0.05
iShares CORE S&P 500 CSSPX 0.07 0.05
iShares CORE EURO STOXX 50 CSSX5E 0.10 0.05
iShares TRSY 1-3YR USD ACC B CSBGU3 0.20 0.05
iShares EURO GOVT BOND 1-3Y CSBGE3 0.20 0.06
iShares USD TREASURY 7-10Y IBTM 0.20 0.06
iShares USD TRSRY 1-3Y USD D IBTS 0.20 0.06
SOURCE S&P 500 UCITS ETF SPXS 0.05 0.06
iShares USD TRES BOND 7-10Y CSBGU0 0.20 0.06
LYXOR EURMS1-3Y INV GR DR ETF LYMTA 0.17 0.06
iShares USD TREASURY 3-7YR CSBGU7 0.20 0.06
LYXOR ETF DAX DR LYDAX 0.15 0.07
12No. 01 | 1. Quarter 2018
ETF Market Report | 2. ETFs in Switzerland | 2.5
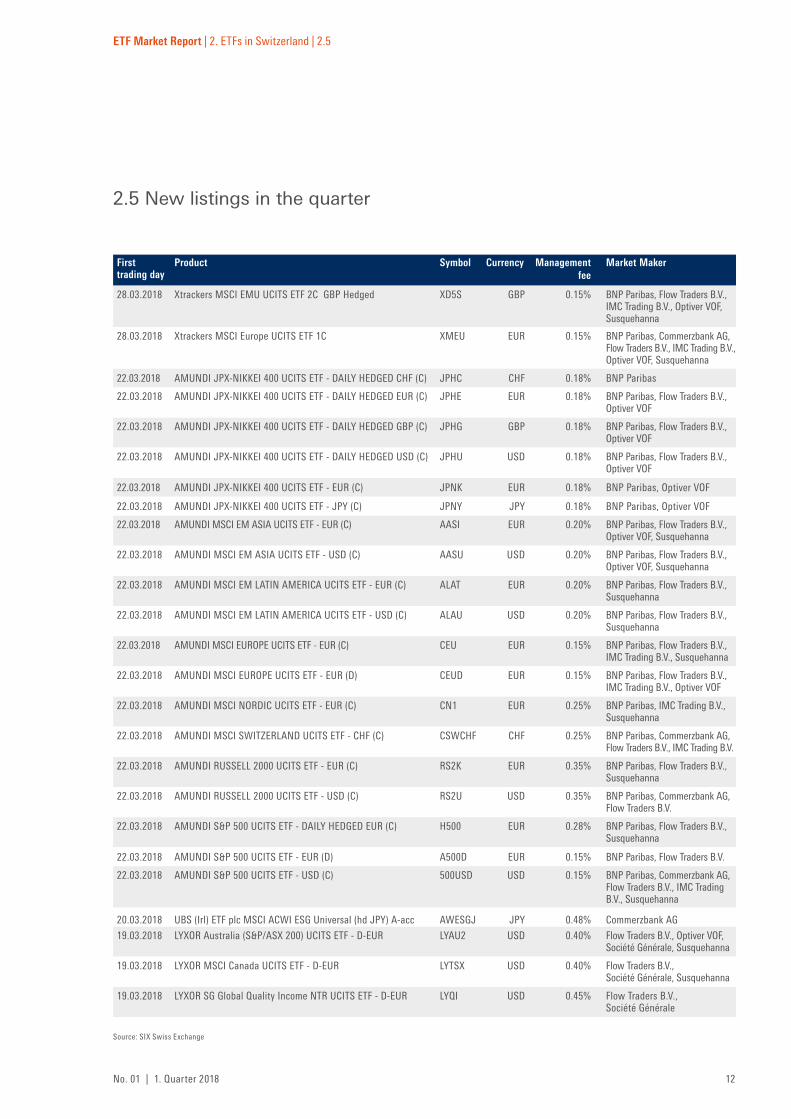
2.5 New listings in the quarter
Source: SIX Swiss Exchange
First trading day
Product Symbol Currency Management fee
Market Maker
28.03.2018 Xtrackers MSCI EMU UCITS ETF 2C GBP Hedged XD5S GBP 0.15% BNP Paribas, Flow Traders B.V., IMC Trading B.V., Optiver VOF, Susquehanna
28.03.2018 Xtrackers MSCI Europe UCITS ETF 1C XMEU EUR 0.15% BNP Paribas, Commerzbank AG, Flow Traders B.V., IMC Trading B.V., Optiver VOF, Susquehanna
22.03.2018 AMUNDI JPX-NIKKEI 400 UCITS ETF - DAILY HEDGED CHF (C) JPHC CHF 0.18% BNP Paribas
22.03.2018 AMUNDI JPX-NIKKEI 400 UCITS ETF - DAILY HEDGED EUR (C) JPHE EUR 0.18% BNP Paribas, Flow Traders B.V., Optiver VOF
22.03.2018 AMUNDI JPX-NIKKEI 400 UCITS ETF - DAILY HEDGED GBP (C) JPHG GBP 0.18% BNP Paribas, Flow Traders B.V., Optiver VOF
22.03.2018 AMUNDI JPX-NIKKEI 400 UCITS ETF - DAILY HEDGED USD (C) JPHU USD 0.18% BNP Paribas, Flow Traders B.V., Optiver VOF
22.03.2018 AMUNDI JPX-NIKKEI 400 UCITS ETF - EUR (C) JPNK EUR 0.18% BNP Paribas, Optiver VOF
22.03.2018 AMUNDI JPX-NIKKEI 400 UCITS ETF - JPY (C) JPNY JPY 0.18% BNP Paribas, Optiver VOF
22.03.2018 AMUNDI MSCI EM ASIA UCITS ETF - EUR (C) AASI EUR 0.20% BNP Paribas, Flow Traders B.V., Optiver VOF, Susquehanna
22.03.2018 AMUNDI MSCI EM ASIA UCITS ETF - USD (C) AASU USD 0.20% BNP Paribas, Flow Traders B.V., Optiver VOF, Susquehanna
22.03.2018 AMUNDI MSCI EM LATIN AMERICA UCITS ETF - EUR (C) ALAT EUR 0.20% BNP Paribas, Flow Traders B.V., Susquehanna
22.03.2018 AMUNDI MSCI EM LATIN AMERICA UCITS ETF - USD (C) ALAU USD 0.20% BNP Paribas, Flow Traders B.V., Susquehanna
22.03.2018 AMUNDI MSCI EUROPE UCITS ETF - EUR (C) CEU EUR 0.15% BNP Paribas, Flow Traders B.V., IMC Trading B.V., Susquehanna
22.03.2018 AMUNDI MSCI EUROPE UCITS ETF - EUR (D) CEUD EUR 0.15% BNP Paribas, Flow Traders B.V., IMC Trading B.V., Optiver VOF
22.03.2018 AMUNDI MSCI NORDIC UCITS ETF - EUR (C) CN1 EUR 0.25% BNP Paribas, IMC Trading B.V., Susquehanna
22.03.2018 AMUNDI MSCI SWITZERLAND UCITS ETF - CHF (C) CSWCHF CHF 0.25% BNP Paribas, Commerzbank AG, Flow Traders B.V., IMC Trading B.V.
22.03.2018 AMUNDI RUSSELL 2000 UCITS ETF - EUR (C) RS2K EUR 0.35% BNP Paribas, Flow Traders B.V., Susquehanna
22.03.2018 AMUNDI RUSSELL 2000 UCITS ETF - USD (C) RS2U USD 0.35% BNP Paribas, Commerzbank AG, Flow Traders B.V.
22.03.2018 AMUNDI S&P 500 UCITS ETF - DAILY HEDGED EUR (C) H500 EUR 0.28% BNP Paribas, Flow Traders B.V., Susquehanna
22.03.2018 AMUNDI S&P 500 UCITS ETF - EUR (D) A500D EUR 0.15% BNP Paribas, Flow Traders B.V.
22.03.2018 AMUNDI S&P 500 UCITS ETF - USD (C) 500USD USD 0.15% BNP Paribas, Commerzbank AG, Flow Traders B.V., IMC Trading B.V., Susquehanna
20.03.2018 UBS (Irl) ETF plc MSCI ACWI ESG Universal (hd JPY) A-acc AWESGJ JPY 0.48% Commerzbank AG
19.03.2018 LYXOR Australia (S&P/ASX 200) UCITS ETF - D-EUR LYAU2 USD 0.40% Flow Traders B.V., Optiver VOF, Société Générale, Susquehanna
19.03.2018 LYXOR MSCI Canada UCITS ETF - D-EUR LYTSX USD 0.40% Flow Traders B.V., Société Générale, Susquehanna
19.03.2018 LYXOR SG Global Quality Income NTR UCITS ETF - D-EUR LYQI USD 0.45% Flow Traders B.V., Société Générale

13No. 01 | 1. Quarter 2018
ETF Market Report | 2. ETFs in Switzerland | 2.5
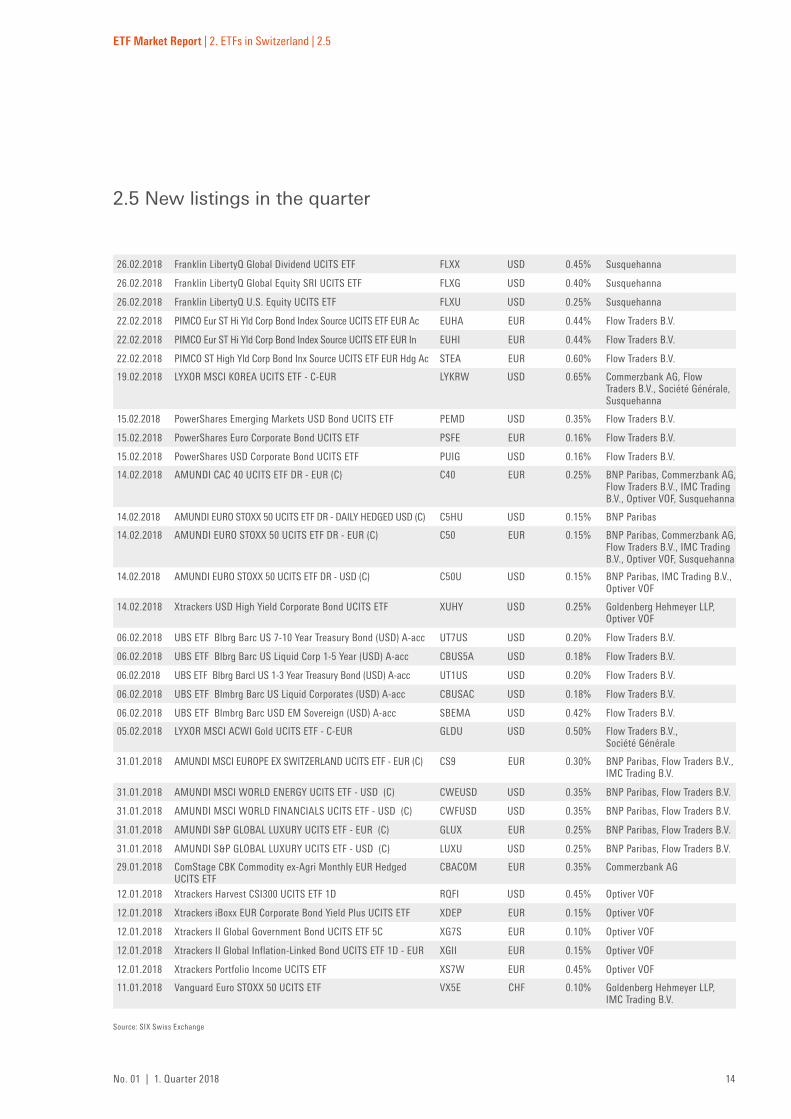
2.5 New listings in the quarter
Source: SIX Swiss Exchange
16.03.2018 iShares High Yield Corp Bond UCITS ETF USD HEDGED ACC HYGU USD 0.55% Goldenberg Hehmeyer LLP, Société Générale
16.03.2018 iShares Automation & Robotics UCITS ETF USD (Dist) RBOD USD 0.40% Commerzbank AG, Optiver VOF
16.03.2018 iShares Core FTSE 100 UCITS ETF - USD Hedged (Acc) ISFD USD 0.20% Commerzbank AG, IMC Trading B.V.
16.03.2018 iShares Global Aggregate Bond UCITS ETF - CHF Hedged (Acc) AGGS CHF 0.10% Goldenberg Hehmeyer LLP, Société Générale
16.03.2018 iShares Global Aggregate Bond UCITS ETF EUR Hedged (Acc) AGGH EUR 0.10% Goldenberg Hehmeyer LLP, Société Générale
16.03.2018 iShares Global Aggregate Bond UCITS ETF GBP Hedged (Dist) AGBP GBP 0.10% Goldenberg Hehmeyer LLP, Société Générale
16.03.2018 iShares Global Aggregate Bond UCITS ETF USD (Dist) AGGG USD 0.10% Goldenberg Hehmeyer LLP, Société Générale
16.03.2018 iShares Global Aggregate Bond UCITS ETF USD Hedged (Acc) AGGU USD 0.10% Goldenberg Hehmeyer LLP, Société Générale
16.03.2018 iShares Global Govt Bond UCITS ETF USD ACC IGLA USD 0.20% Commerzbank AG, Flow Traders B.V.
16.03.2018 iShares Global High Yield Corp Bond UCITS ETF USD ACC HYLA USD 0.50% Goldenberg Hehmeyer LLP, Société Générale
16.03.2018 iShares MSCI Japan SRI UCITS ETF USD (ACC) SUJP USD 0.30% Commerzbank AG, Optiver VOF
16.03.2018 iShares MSCI World SRI UCITS ETF EUR (ACC) SUSW EUR 0.30% Commerzbank AG, Optiver VOF
16.03.2018 iShares MSCI World SRI UCITS ETF USD (Dist) SUWS USD 0.30% Commerzbank AG, Optiver VOF
16.03.2018 iShares Nasdaq US Biotechnology UCITS ETF USD (Acc) BTEC USD 0.35% Commerzbank AG, Optiver VOF
16.03.2018 iShs Edge MSCI World Min Volatility UCITS ETF CHF Hdgd Acc MVSH CHF 0.35% Commerzbank AG, Optiver VOF
06.03.2018 UBS ETF BBG Commodity CMCI SF UCITS ETF (hdg to GBP) A-acc
BCCMG GBP 0.37% UBS AG
06.03.2018 UBS ETF CMCI ex-Agriculture SF UCITS ETF (hdg to GBP) A-acc CCXAG GBP 0.37% UBS AG
01.03.2018 UBS ETF JPM USD EM Diversified Bond 1-5 (hd to CHF) A-acc SHEMC CHF 0.47% Deutsche Bank AG London Branch
01.03.2018 UBS ETF JPM USD EM Diversified Bond 1-5 (hd to EUR) A-acc SHEME EUR 0.47% Deutsche Bank AG London Branch
01.03.2018 UBS ETF JPM USD EM Diversified Bond 1-5 (hd to GBP) A-dis SHEMG GBP 0.47% Deutsche Bank AG London Branch
01.03.2018 UBS ETF MSCI World SRI UCITS ETF (USD) A-acc WSRUS USD 0.38% Flow Traders B.V., UBS AG
27.02.2018 AMUNDI BBB EURO CORPO INVESTMENT GRADE UCITS ETF - EUR (C)
CBBB EUR 0.20% Commerzbank AG, Flow Traders B.V., Société Générale
27.02.2018 AMUNDI EURO CORPORATE FINANCIALS IBOXX UCITS ETF - EUR (C)
AFIN EUR 0.16% Commerzbank AG, Flow Traders B.V., Société Générale
27.02.2018 AMUNDI GLOBAL EMERGING BOND MARKIT IBOXX UCITS ETF - USD (C)
AGEB USD 0.30% Commerzbank AG, Flow Traders B.V., Société Générale
27.02.2018 AMUNDI US TREASURY 1-3 UCITS ETF - USD (C) US1 USD 0.14% Commerzbank AG, Flow Traders B.V., Société Générale
27.02.2018 AMUNDI US TREASURY 3-7 UCITS ETF - USD (C) US3 USD 0.14% Commerzbank AG, Flow Traders B.V., Société Générale
27.02.2018 AMUNDI US TREASURY 7-10 UCITS ETF - USD (C) US7 USD 0.14% Commerzbank AG, Flow Traders B.V., Société Générale
26.02.2018 Franklin LibertyQ Emerging Markets UCITS ETF FLXE USD 0.55% Susquehanna
26.02.2018 Franklin LibertyQ European Dividend UCITS ETF FLXD EUR 0.25% Susquehanna
14No. 01 | 1. Quarter 2018
ETF Market Report | 2. ETFs in Switzerland | 2.5
2.5 New listings in the quarter
Source: SIX Swiss Exchange
26.02.2018 Franklin LibertyQ Global Dividend UCITS ETF FLXX USD 0.45% Susquehanna
26.02.2018 Franklin LibertyQ Global Equity SRI UCITS ETF FLXG USD 0.40% Susquehanna
26.02.2018 Franklin LibertyQ U.S. Equity UCITS ETF FLXU USD 0.25% Susquehanna
22.02.2018 PIMCO Eur ST Hi Yld Corp Bond Index Source UCITS ETF EUR Ac EUHA EUR 0.44% Flow Traders B.V.
22.02.2018 PIMCO Eur ST Hi Yld Corp Bond Index Source UCITS ETF EUR In EUHI EUR 0.44% Flow Traders B.V.
22.02.2018 PIMCO ST High Yld Corp Bond Inx Source UCITS ETF EUR Hdg Ac STEA EUR 0.60% Flow Traders B.V.
19.02.2018 LYXOR MSCI KOREA UCITS ETF - C-EUR LYKRW USD 0.65% Commerzbank AG, Flow Traders B.V., Société Générale, Susquehanna
15.02.2018 PowerShares Emerging Markets USD Bond UCITS ETF PEMD USD 0.35% Flow Traders B.V.
15.02.2018 PowerShares Euro Corporate Bond UCITS ETF PSFE EUR 0.16% Flow Traders B.V.
15.02.2018 PowerShares USD Corporate Bond UCITS ETF PUIG USD 0.16% Flow Traders B.V.
14.02.2018 AMUNDI CAC 40 UCITS ETF DR - EUR (C) C40 EUR 0.25% BNP Paribas, Commerzbank AG, Flow Traders B.V., IMC Trading B.V., Optiver VOF, Susquehanna
14.02.2018 AMUNDI EURO STOXX 50 UCITS ETF DR - DAILY HEDGED USD (C) C5HU USD 0.15% BNP Paribas
14.02.2018 AMUNDI EURO STOXX 50 UCITS ETF DR - EUR (C) C50 EUR 0.15% BNP Paribas, Commerzbank AG, Flow Traders B.V., IMC Trading B.V., Optiver VOF, Susquehanna
14.02.2018 AMUNDI EURO STOXX 50 UCITS ETF DR - USD (C) C50U USD 0.15% BNP Paribas, IMC Trading B.V., Optiver VOF
14.02.2018 Xtrackers USD High Yield Corporate Bond UCITS ETF XUHY USD 0.25% Goldenberg Hehmeyer LLP, Optiver VOF
06.02.2018 UBS ETF Blbrg Barc US 7-10 Year Treasury Bond (USD) A-acc UT7US USD 0.20% Flow Traders B.V.
06.02.2018 UBS ETF Blbrg Barc US Liquid Corp 1-5 Year (USD) A-acc CBUS5A USD 0.18% Flow Traders B.V.
06.02.2018 UBS ETF Blbrg Barcl US 1-3 Year Treasury Bond (USD) A-acc UT1US USD 0.20% Flow Traders B.V.
06.02.2018 UBS ETF Blmbrg Barc US Liquid Corporates (USD) A-acc CBUSAC USD 0.18% Flow Traders B.V.
06.02.2018 UBS ETF Blmbrg Barc USD EM Sovereign (USD) A-acc SBEMA USD 0.42% Flow Traders B.V.
05.02.2018 LYXOR MSCI ACWI Gold UCITS ETF - C-EUR GLDU USD 0.50% Flow Traders B.V., Société Générale
31.01.2018 AMUNDI MSCI EUROPE EX SWITZERLAND UCITS ETF - EUR (C) CS9 EUR 0.30% BNP Paribas, Flow Traders B.V., IMC Trading B.V.
31.01.2018 AMUNDI MSCI WORLD ENERGY UCITS ETF - USD (C) CWEUSD USD 0.35% BNP Paribas, Flow Traders B.V.
31.01.2018 AMUNDI MSCI WORLD FINANCIALS UCITS ETF - USD (C) CWFUSD USD 0.35% BNP Paribas, Flow Traders B.V.
31.01.2018 AMUNDI S&P GLOBAL LUXURY UCITS ETF - EUR (C) GLUX EUR 0.25% BNP Paribas, Flow Traders B.V.
31.01.2018 AMUNDI S&P GLOBAL LUXURY UCITS ETF - USD (C) LUXU USD 0.25% BNP Paribas, Flow Traders B.V.
29.01.2018 ComStage CBK Commodity ex-Agri Monthly EUR Hedged UCITS ETF
CBACOM EUR 0.35% Commerzbank AG
12.01.2018 Xtrackers Harvest CSI300 UCITS ETF 1D RQFI USD 0.45% Optiver VOF
12.01.2018 Xtrackers iBoxx EUR Corporate Bond Yield Plus UCITS ETF XDEP EUR 0.15% Optiver VOF
12.01.2018 Xtrackers II Global Government Bond UCITS ETF 5C XG7S EUR 0.10% Optiver VOF
12.01.2018 Xtrackers II Global Inflation-Linked Bond UCITS ETF 1D - EUR XGII EUR 0.15% Optiver VOF
12.01.2018 Xtrackers Portfolio Income UCITS ETF XS7W EUR 0.45% Optiver VOF
11.01.2018 Vanguard Euro STOXX 50 UCITS ETF VX5E CHF 0.10% Goldenberg Hehmeyer LLP, IMC Trading B.V.

15No. 01 | 1. Quarter 2018
ETF Market Report | 2. ETFs in Switzerland | 2.5
2.5 New listings in the quarter
Source: SIX Swiss Exchange
03.01.2018 UBS (Irl) ETF plc Global Gender Equality (hd CHF) A-acc GENDES CHF 0.30% Commerzbank AG
03.01.2018 UBS (Irl) ETF plc Global Gender Equality (hd CHF) A-dis GENDET CHF 0.30% Commerzbank AG
03.01.2018 UBS (Irl) ETF plc Global Gender Equality (hd EUR) A-acc GENDEE EUR 0.30% Commerzbank AG
03.01.2018 UBS (Irl) ETF plc Global Gender Equality (hd USD) A-acc GENDEW USD 0.30% Commerzbank AG
03.01.2018 UBS (Irl) ETF plc Global Gender Equality (USD) A-acc GENDER USD 0.20% Commerzbank AG
03.01.2018 UBS (Irl) ETF plc MSCI ACWI ESG Universal (hd CHF) A-acc AWESGS CHF 0.48% Commerzbank AG
03.01.2018 UBS (Irl) ETF plc MSCI ACWI ESG Universal (hd CHF) A-dis AWESGT CHF 0.48% Commerzbank AG
03.01.2018 UBS (Irl) ETF plc MSCI ACWI ESG Universal (hd EUR) A-acc AWESGE EUR 0.48% Commerzbank AG
03.01.2018 UBS (Irl) ETF plc MSCI ACWI ESG Universal (hd USD) A-acc AWESGW USD 0.48% Commerzbank AG
03.01.2018 UBS (Irl) ETF plc MSCI ACWI SRI UCITS ETF (hd CHF) A-acc AWSRIS CHF 0.48% Commerzbank AG
03.01.2018 UBS (Irl) ETF plc MSCI ACWI SRI UCITS ETF (hd CHF) A-dis AWSRIT CHF 0.48% Commerzbank AG
03.01.2018 UBS (Irl) ETF plc MSCI ACWI SRI UCITS ETF (hd EUR) A-acc AWSRIE EUR 0.48% Commerzbank AG
03.01.2018 UBS (Irl) ETF plc MSCI ACWI SRI UCITS ETF (hd GBP) A-dis AWSRIH GBP 0.48% Commerzbank AG
03.01.2018 UBS (Irl) ETF plc MSCI ACWI SRI UCITS ETF (hd USD) A-acc AWSRIW USD 0.48% Commerzbank AG
03.01.2018 UBS (Irl) ETF plc S&P 500 UCITS ETF (hedged to EUR) A-dis SP500F EUR 0.22% Flow Traders B.V., UBS AG
03.01.2018 UBS ETF BB MSCI Euro Area Liq Corp Sust ETF (EUR) A-acc CBSEUA EUR 0.20% Commerzbank AG, Deutsche Bank AG London Branch, Flow Traders B.V.
03.01.2018 UBS ETF BB MSCI Euro Area Liq Corp Sust ETF (hd CHF) A-acc CBSEUS CHF 0.25% Commerzbank AG, Deutsche Bank AG London Branch, Flow Traders B.V.
03.01.2018 UBS ETF BB MSCI Euro Area Liq Corp Sust ETF (hd CHF) A-dis CBSEUT CHF 0.25% Commerzbank AG, Deutsche Bank AG London Branch, Flow Traders B.V.
03.01.2018 UBS ETF MSCI EMU Socially Responsible ETF (EUR) A-acc EMUSRI EUR 0.28% UBS AG

16No. 01 | 1. Quarter 2018
ETF Market Report | 3. European market
3. European market
At a European level, ETFs continued to enjoy strong net new assets in the early part of 2018. For example, net new assets of EUR 22.6 billion were invested in equity ETFs in Q1 2018 alone. Considerable net new assets were also registered in bond ETFs –
despite discussions of interest rate hikes and potential pressure on bond prices. Commodity ETFs were also sought-after by investors. Only leveraged and leveraged inverse ETFs posted notable net outflows.
Net New Assets per asset class (in bn USD)
Asset classes ETFs/ETPs AuM March 18 (in mn USD)
Market share Net New Assets (in mn USD)
March 2018 YTD 2018 YTD 2017 2017
Active 25 9,139 1.1% 138 280 878 2,311
Alternative 4 110 0.0% 9 -2 -149 -125
Commodities 378 62,443 7.6% -43 1,236 4,734 8,414
Currency 70 295 0.0% 38 -8 -65 -3
Equity 1,091 554,793 67.19% 1,534 22,646 21,231 70,847
Fixed Income 388 186,452 22.6% -380 3,459 7,819 25,004
Inverse 68 4,438 0.5% 279 291 287 845
Leveraged 192 3,827 0.5% 3 -156 -113 -80
Leveraged inverse 74 3,408 0.4% -132 -415 674 1,000
Other 12 851 0.1% 16 72 70 204
Total 2,302 825,756 100.00% 1,462 27,404 35,366 108,417
Source: ETFGI
Source: ETFGI
March 2018 YTD 2018
Active
Alternative
Commodities
Currency
Equity
Fixed Income
Inverse
Leveraged
Leveraged inverse
Others
-5 0 5 10 15 20 25

17No. 01 | 1. Quarter 2018
ETF Marktreport | 4. Interview
«We believe that multifactor products will profit from increasing uncertainty.»
Patrick Lutz is the country head of Franklin Templeton in Switzerland. He is responsible for the institutional business and wholesale business in Switzerland. Patrick has been with the company for over 9 years in different positions. Before joining Franklin Templeton he used to work for Schroder’s as Sales Executive and prior to that as Co-Head of Fund Research at Zurcher Kantonalbank and Portfolio Manager responsible for the multi mana-ger strategies. Prior to this, he was working with UBS Investment Bank, SIX Group and Thurgauer Kantonalbank in different roles. Patrick holds a Bachelor of Science from the University of Applied Sciences Zurich.
Patrick Lutz, Franklin Templeton Investments
What is your specialty? For our multifactor model, our ETF developers have intensively studied our active strategies in order to determine which factors in the past were able to deliver superior returns or better risk/return ratios. Other Smart Beta ETFs typically only consider at most one or two factors, e.g. value or volatility. Our Franklin LibertyQ funds take into account four factors: 50% quality, 30% value, momentum and volatility (10% each). This weighting is unique, and thus makes it a distinguishing feature compared to existing funds. Every factor has its time. The four factors mean we di-versify more strongly than others, and thus we expect better results over several cycles.
What issues are currently shaping developments in the ETF sector?There are many. But perhaps the top one is the return of volatility due to trade war rhetoric, as well as attractive US interest rates and economic policy risks worldwide. We’ve already had a foretaste of this in February and March. As a result, many investors are asking themselves: how would further stock market shocks affect my equity and bond portfolio, and how do I position myself? We believe that multifactor pro-ducts will profit from increasing uncertainty. They’re
better diversified since they don’t have large individual positions in just a few industries or countries.
What are your clients focusing on in the current environment?We have a long tradition in active asset management, and 30 years ago we were among the first firms to in-vest in emerging markets. Emerging market equities, as well as bonds, are back in focus among investors. Institutional and retail clients are interested in incre-asing their allocations to emerging market equities. Since February 26, Franklin Templeton has had a multi-factor Emerging Markets ETF listed on the Swiss Stock Exchange that represents a good complement to an active emerging market portfolio. It's the first emer-ging market Smart Beta UCITS ETF in Europe and uses the factors quality, value, momentum and volatility.
What changes do you have planned?We listen to our customers and look to see where we can fill gaps with our ETFs. In doing so, we also look to the US, where we already play the entire range of ETFs under the brand name Franklin LibertyShares®. The short answer is «yes», we plan on launching more ETFs in Switzerland. The five Smart Beta ETFs were just the beginning.
18No. 01 | 1. Quarter 2018
ETF Marktreport | 4. Interview
Where do you see the ETF market in Switzerland in the near future?We believe that, relative to the US market, the Swiss ETF market still has a lot of growth potential. The strongest growth, albeit from a low level, can be seen in Smart Beta ETFs. Since 2012, this segment has grown an average of 45% per annum, so it has significantly outperformed the traditional ETF market at roughly 25%. Globally, the Smart Beta ETF segment has already attracted 20% of capital invested in ETFs – it’s 25% in the US and around 8% in Europe and Switzerland.
Thank you for the interview!
19No. 01 | 1. Quarter 2018
ETF Marktreport | 5. Disclaimer©
SIX
Sw
iss
Exch
ange
AG
, 04.
2018
Disclaimer/Imprint
None of the information contained herein constitutes an offer or a recommendation to buy or sell or take any other action regarding financial instruments. SIX Group AG or its direct and indirect subsidiaries (here-after: SIX) are liable neither for the completeness, accuracy, currentness and continuous availability of the information given, nor for any loss incurred as a result of action taken on the basis of information pro-vided in this or any other SIX publication.
SIX expressly reserves the right to alter prices or com-position of products or services at any time.
The information contained herein does not constitute investment advice or recommendation for investments or other decisions. The performance of securities in the past is no guaranty for any future price develop-ment of the concerned securities. Individual sale re-strictions specific to countries or persons may apply to financial instruments traded on SIX. Investors are themselves responsible for adherence to the corres-ponding product terms of the issuer.
The entire content of this publication is protected by copyright. Whether in full or in part, the copying, re-production, modification, transmission (electronically or otherwise), reuse or other use for public or com-mercial purposes is expressly prohibited without prior written consent.
© SIX Swiss Exchange AG, 2018. All rights reserved.
PublisherSIX Swiss Exchange AGP.O. BoxCH-8021 Zurichwww.six-swiss-exchange.cometffinancial@six-swiss-exchange.com