Embed Size (px)
Citation preview

Page 1 of 42
PHYSIOLOGICAL MEASUREMENT
Nigel H. Lovell
Graduate School of Biomedical Engineering, University of New South Wales, Sydney, Australia, 2052.
National Information and Communications Technology Australia (NICTA), Australian Technology Park, Eveleigh, Australia, 1430.
Dean Karantonis and Shaun L. Cloherty
Graduate School of Biomedical Engineering, University of New South Wales, Sydney, Australia, 2052.
Branko G. Celler
School of Electrical Engineering and Telecommunications, University of New South Wales, Sydney, Australia, 2052.
Keywords
Physiological measurement, biosensor, transducer, clinical measurement, medical instrument, bioinstrumentation, blood pressure, electrocardiogram, blood flow, biopotential, biochemical transducer.

Page 2 of 42
Contents
1.Introduction 2.Biomedical Signals and Measurement Systems
2.1.Biomedical Signals 2.2.Biomedical Instrumentation Overview
3.Physical Measurements 3.1.Flow and Volume Measurement
3.1.1.Blood Flow Measurement 3.1.2.Volume Measurement
3.2.Pressure and Force Measurement 3.2.1.Sensing Elements 3.2.2.Invasive Pressure Sensors 3.2.3.Non-invasive Pressure Measurement 3.2.4.Force Measurement
3.3.Measurement of Motion (Displacement, Velocity and Acceleration) 3.4.Chemical Measurement
3.4.1.Optically-based Sensors 3.4.2.Electrochemical Sensors
3.5.Bioelectric Measurement 3.5.1.Origin of Bioelectric Potentials 3.5.2.Biopotentials and their Applications 3.5.3.Biopotential Electrodes and Instrumentation
3.6.Measurement of Thermal Radiation 4.Conclusion 5.Bibliography
Summary
Physiological measurement involves using biosensors, transducers and associated bioinstrumentation to investigate and record various signals from the human body. The focus of this chapter is on the range of physical quantities (typically chemical, mechanical or electrical) that can be sensed or transduced from living organisms and how these physical quantities relate to physiological phenomena. A generalized medical instrument for acquiring physiological measurements is examined with a discussion of the various functional units of transduction, amplification, filtering, digitization and computer processing, analysis, storage and display.
The various object quantities that can be recorded (flow, volume, pressure, force, motion, chemical and bioelectric events), their physiological correlates and the collection of sensors, which can be used to transduce these signals are presented. Brief descriptions are also offered on how recorded signals can be practically acquired from various organ (principally the circulatory, respiratory, muscular and nervous) systems and used to assist clinical diagnosis and disease management.

Page 3 of 42
1. Introduction
Concomitant with the development of modern medicine has been the increasing application of scientific methods and devices in the clinical setting. The central component of the scientific method is measurement. It is therefore not surprising that biological instrumentation and physiological monitoring is an international, multi-billion dollar industry.
When one needs to understand or manage a system or process, one of the critical requirements is to be able to measure or sample various aspects of the system. From an engineering viewpoint, accurate measurement and acquisition of system observers is a fundamental necessity in order to model, understand and ultimately control a system. From a clinical viewpoint, the basis of a diagnosis is derived from observations and measurements. Physiological measurement or clinical measurement is an integral component of modern clinical medicine, bioscience discovery and medical research. The acquisition or transduction of physiological signs or variables is an essential component of the majority of diagnostic and therapeutic medical devices.
In this chapter, we explore the complexity of physiological measurement. Initially a systems approach is taken to examine in a general way a computer-based, clinical recording instrument. A ‘black box’ representation of the instrument is presented – where we consider the instrument as a collection of functional units. This representation is broken down or reduced to functional units including transduction, amplification, filtering, digitization and computer analysis. Each unit is described in detail.
The majority of the chapter however focuses on the very first unit in the instrument, namely that of biosensing. In a biosensor, a physical quantity that has a correspondence with a physiological variable is sensed and typically converted or ‘transduced’ to an electrical quantity for further processing by the instrument. In terms of terminology, a transducer is the general name for a sensor or actuator. In a broad definition, a sensor is a device that detects a change in physical stimulus and converts it into a signal, which can then be measured or recorded. An actuator does the converse in that it produces observable outputs in a system. The general concept of ‘transduction’ therefore is a device that transfers a signal from one energy system to another in the same or in a different form. In the majority of cases, a sensor converts a measured object quantity into an electrical signal. Once an object quantity is converted into an electrical signal, then standard instrumentation techniques can be applied.
The other term which needs definition is that of ‘signal’. The essential characteristic of a signal is that of being able to change as a function of space or time. In the case of a biological signal, it is a detectable unit of information that characterizes the behavior, structure or function of the biological system or process under study.
It is useful to associate the type of signal with various forms of energy. Table 1 lists different forms of energy and corresponding examples of the signal types that may be measured from these sources. When performing physiological measurement, some signals are intrinsic to bodily function (for example voltages from biopotentials), whereas others are modulated when external energy sources are applied to the body (for example, blood flow in a vessel measured using an electromagnetic or ultrasonic flow meter).
This chapter is primarily arranged in sequence of the various object quantities being measured, their physiological correlates and the collection of sensors, which can be used to transduce these signals. Object quantities in biomedical measurements are typically chemical, mechanical or electric quantities that echo physiological functions in the living system. The other way to present physiological measurement information would be based on the organ system in which the measurement was being made. Instead of employing this approach, we shall highlight how a

Page 4 of 42
number of measurement techniques can be applied and adapted to organ systems as the various signal types are described. Measurements are routinely made on all the organ systems in the body, although the first four systems in the following list are the ones in which most physiological measurements are made, and are thus the focus of this chapter.
• Circulatory System: Comprises the heart, blood, blood vessels, and lymphatics. It is concerned with circulating blood to deliver oxygen and nutrients to every part of the body.
• Nervous System: Is made up of the brain, spinal cord, and central and peripheral nerves. It receives and interprets stimuli from sensory organs and transmits impulses to effector organs.
• Musculoskeletal System: Consists of muscles, bones, cartilage, ligaments, tendons and joints. It comprises muscle tissue that helps move the body and move materials through the body. It provides the shape and form for our bodies in addition to supporting and protecting our bodies, allowing bodily movement and producing blood cells.
• Respiratory System: It consists of the nose, larynx, trachea, diaphragm, bronchi, and lungs. The principal function of the respiratory system is to supply the blood with oxygen for delivery to the tissues.
• Digestive System: The organs involved in this system include the mouth, stomach, gall bladder and intestines.
• Endocrine System: This system is made up of a collection of glands, including the pancreas, adrenal pituitary and thyroid, as well as the ovaries and testes. It regulates, coordinates, and controls a number of body functions by secreting hormones and neurotransmitters into the bloodstream.
• Integumentary System: This system consists of the skin, hair, nails, and sweat glands. Its main function is to act as a barrier to protect the body.
• Reproductive System: It comprises organs such as the uterus, penis, ovaries, and testes.
• Urinary System: It consists of the kidneys, ureters, urinary bladder, and urethra.

Page 5 of 42
Table 1. A list of energy sources and common signals measured from these sources.
Energy Source (Object Quantities)
Example Signals
Mechanical force, pressure, flow, acceleration, velocity, displacement
Electrical voltage, current, resistance, capacitance, inductance
Molecular/Atomic (Chemical)
chemical composition, pH value
Thermal temperature
Radiant visible light, infrared, radio waves
Magnetic magnetic flux
It should be noted that a single chapter cannot examine all aspects of physiological measurement, nor for that matter even one aspect in detail. Indeed not just books but entire encyclopedic volumes have been dedicated to or have been strongly focused on such treatises. The focus of this chapter will be to document the range of physical quantities which these devices encompass without resorting to complex formulae or detailed technical aspects of the underlying sensing technology.
2. Biomedical Signals and Measurement Systems
2.1. Biomedical Signals
The collection of physiological data is basically the process of scientific observation and may be performed without instrumentation. However instrumentation can be used to amplify, highlight, detect, retain, archive, automate and further process observations beyond that possible by a human operator. There are many issues associated with performing a physiological measurement on biological tissue. Put simply, they are difficult measurements to take because of signal artifact and noise from myriad sources and because of issues related to the influence of the measuring device on the underlying biological function.
Moreover, it is most common that the health care worker will need to decide which particular signal out of a range of signals is most appropriate in order to measure the behavior of the living system. For example, in measuring the activity of the heart it is possible to measure signals related to pressure, flow, motion, volume, bioelectricity and/or biochemistry. Each signal will necessarily describe a different aspect of cardiac activity or function/dysfunction. It is actually necessary to record multiple signals to gain a more complete picture of cardiac function. To derive an index of ventricular contractility (the amount of work the heart is capable of doing), it is necessary to record both ventricular pressure and ventricular volume over the course of time. To derive information on conduction abnormalities in the heart (arrhythmias), an electrical measurement technique known as an electrocardiograph (ECG) would be most appropriate. In this noninvasive technique, multiple electrodes are attached to the body surface to infer the conduction behavior of the heart. In circumstances where the cardiac arrhythmia is potentially life-threatening a more complete cardiac mapping study may be undertaken whereby, electrodes are introduced inside the heart to record directly the cardiac electrical activity. In a separate approach, biochemical analysis of the blood

Page 6 of 42
would be the most useful approach for detecting the incidence and severity of a recent myocardial infarction (death of heart tissue leading to a heart attack).
Part of the evolving nature of biomedical engineering research and development is the discovery of new sensing technologies and associated instruments. Studies would then need to be undertaken to match the properties of the instrumentation with those of the biological signal. In an iterative process as the research and clinical trials progressed, measurement techniques and technologies would be further refined as more of the signal characteristics were understood. As these techniques then became clinically validated and more widely accepted, they would migrate from research laboratories to be used in everyday clinical practice. Naturally, at this stage the economic implications of such technology in terms of cost-benefit and improved patient health outcomes would also need to be evaluated as part of the rationale to routinely use such equipment.
History serves an example. It was not until the end of the 19th century that bioelectric signals were able to be recorded as part of cardiac activity monitoring. Prior to this, cardiac activity was only able to be characterized by pressure and flow signals and these signals failed to reveal the complex underlying electrical activity of the heart, the genesis of cardiac rhythm and the multiplicity of rhythm disturbances (arrhythmogenesis). As more sophisticated signal processing techniques as well as instrument designs were introduced in the 1960s and 1970s, cardiac activity monitoring via bioelectric phenomenon was even able to localize probable areas of myocardial infarction as well as other major heart diseases/pathologies.
2.2. Biomedical Instrumentation Overview
Nearly all measurement systems share common characteristics that can be divided into fundamental building blocks. The basic components of the system are the same in any instrumentation system with the principal difference for physiological measurement being that a living person is the subject (Figure 1). The transducer generates an electrical signal that reflects the underlying physiological variable. The instrument then performs signal conditioning on this waveform and optionally outputs an analogue signal for display purposes.

Figure 1. A generalized physiological measurement system comprises a measurement device connected to a subject by way of one or more transducers. The measurement device contains a
number of fundamental units to amplify, filter and process the signal. Typically, feedback is also used to control the sensor or to maximize the signal to noise ratio by applying a stimulus or
intervention to the subject.
The signal conditioning unit in nearly all instruments comprises a number of common stages. Usually the first stage (which may be physically located on or very near the transducer, or separately on an electronic board within the measurement device) involves transducer interface electronics to support the conversion process. For example, in the case of a strain gauge used to measure force or pressure it may involve a set of resistors arranged in a bridge configuration. In the case of a biopotential recording from an electrode attached to the body it may involve an amplifier known as a ‘head stage’. The ‘head stage’ does not usually increase the size or amplitude of the transduced signal but acts as a buffer or impedance matching device to isolate changes in impedance at the electrode tissue interface and thus to improve noise immunity and reduce the introduction of artifact into the measurement process.
The subsequent stages involve combinations of filtering and amplification. For example an ECG signal that measures the cardiac electrical activity, as can be recorded on the surface of the body, is typically up to several millivolts in amplitude. Indeed, in the majority of cases the transduced electrical signal is small in amplitude and will need to be amplified considerably. A signal of several volts is normally needed for analogue outputting or further processing. The aim of the process is to increase the signal component of interest that directly relates to the underlying physiological process and reduce the noise component (the so-called artifact).
In the case of ECG recording, the signal of interest may be concealed or buried in noise signals generated by muscle activity, respiratory movement or changes in characteristics of the electrodes (drying of the gel within or under them or relative movement of the electrode relative to the tissue). External electrical noise sources may also influence the recorded signal. Such sources are caused by electrical generators (for example interference from electrical equipment including radio wave transmitters, etc.). These generators induce electrical signals on the surface of the body or directly
Page 7 of 42

Page 8 of 42
in the transducer and instrumentation. Other physical processes either internal to the subject or of external origin may also contaminate the signal of interest.
The process of amplification and filtering involves understanding the frequency range of the underlying signal being measured and using this to band limit the amplification of the signal – or to express differently, to filter out or reduce in relative amplitude those ‘noise’ signals outside the frequency band of interest. An ECG recording in an adult may only have frequency content associated with the cardiac electrical activity in the range of 0.5 Hz to 40 Hz. All signals outside this range should be attenuated or ‘filtered out’. Thus the filtering stage should effectively reduce low frequencies (< 0.5 Hz) associated with respiratory artifact and high frequencies (> 40 Hz) associated with skeletal muscle activity as well as the influence of electrical noise sources. One of the main sources of electrical noise is the mains power reticulation system that operates at either 50 Hz or 60 Hz (country dependent). All medical instruments must be designed to minimize the impact of mains power noise on the measurement process. Filtering is one of the most common methods in doing this.
Extending this premise, one of the most important tools for the designer of bioinstrumentation is to engineer appropriate filtering algorithms. These may be done in electronics (hardware) or in software. The first stage in this design is a detailed knowledge of the signal characteristics being acquired. In nearly all cases the physiological signal of interest will be band-limited (constrained to frequencies within a defined range). Frequency content outside this range will be related to artifacts and can be removed. In more sophisticated computer-based, biosignal processing approaches it is also common to apply feature extraction algorithms that examine the shape or morphometry of particular signals to calculate indices from the signal waveform. Apart from the frequency content, a detailed knowledge of the rate, spontaneity, duration, periodicity and amplitude characteristics is essential. For example in a blood pressure signal the systolic and diastolic points would need to be calculated. Considerable complexity may need to be embedded in such algorithms to account for vastly different waveshapes from different subjects. A single ECG beat can have over 200 features without even taking into account the inter-relationships between beats in an individual signal and the correlation of information if a multi-lead ECG recording is being taken (as is usually the case).
In terms of signal processing approaches, they are often carried out in analogue electronic circuitry. This is especially the case in smaller and less expensive instruments. It could include circuits to linearize a transducer response in the case of a body temperature sensor. It could also include circuits to detect the heart beat from an ECG signal by differentiating the signal and applying a threshold. With this circuitry the fast rising edge of the ECG signal (associated with electrical activation of the ventricular chambers of the heart) is accentuated by the differentiation and can be effectively detected using a circuit known as a comparator.
In older medical instruments the only output method was by way of an analogue means (for example a trace on a paper chart or using some form of analogue display such as a meter). In the case of the ECG it could have been a chart record of the ECG waveform or a flashing light with the detection of each heart beat.
In nearly all devices nowadays, the conditioned signal is passed to an analogue to digital (A/D) converter for further computer processing and display. Either an embedded microcontroller – like those used in most domestic appliances - or a more complex computer-based processing system would be employed. The A/D process used in these systems converts the analog data stream into a series of digital numbers, normally at a fixed sampling rate. Once the signal is stored in a digital form, complex processing tasks (as discussed above) can be performed on the waveform. These processing tasks may include complex mathematical operations such as digital filtering to remove unwanted noise or other processing tasks to enhance or transform the signal.

Page 9 of 42
In many instruments a feedback path is used to facilitate the measurement by applying energy in some form to the transducer or by way of a controlled subject intervention. Sensors often require active processes to be applied to the object or sensor (excitation, transmission, illumination, irradiation, stimulation, application, injection). These procedures are integral to the measurement process. Transducers are therefore classified as either active or passive transducers. Tradeoffs exist between the measurement simplicity of a passive transducer, the invasiveness of the procedure (puncture skin or vessel or applying high levels of energy) and the continuous nature of the measurement. For real-time (continuous) measurement a sensor must be attached to the living system - as opposed for example, to extracting a blood sample from the body for a single blood chemistry measurement.
An example of the trade-off is when taking blood pressure measurements. To obtain a continuous reproduction of the blood pressure waveform as it fluctuates with each heart beat, an invasive procedure must be followed whereby a catheter is introduced inside the vessel in which the measurement is to be made. The transducer can sense the instantaneous pressure within the artery at any instant in time. In the case of a non-invasive blood pressure measurement, an estimate of the maximum (systolic) and minimum (diastolic) pressures can be made by placing a cuff around the upper arm and by listening to the flow patterns of blood in the brachial artery through application of a stethoscope. Using this method, it is possible over the course of half a minute, to estimate two pressure points from the continuous blood pressure waveform in the brachial artery. These measurements are not continuous and do not reflect the inherent complexity of the blood pressure waveform. However, the obvious advantage is that the cuff technique is an extremely low-risk, non-invasive technique.
Apart from active sensor excitation, other forms of active feedback are often necessary to perform the measurement or reduce noise contamination. An example is the use of a ‘driven right leg circuit’ when performing ECG measurements. In this case the electrode connected to the right leg of the patient is not used to record the electrical activity of the heart but is used as an active voltage source effectively driving down or reducing the ‘common-mode’ noise signal as measured on the surface of the body. With this active measurement technique an ECG can be recorded with considerably reduced interference from mains and other high frequency noise sources.
Often a controlled intervention will also be necessary when performing a measurement. In the case of non-invasive blood pressure measurement, the cuff must be placed around the upper arm and inflated to a pressure above the estimated systolic pressure and then deflated in a controlled manner. As another example, the reader can also refer to the section on flow measurement to see how injection of an ‘indicator’, for example cold saline, is used to measure cardiac output in patients.
3. Physical Measurements
In the previous section the general concept of a biological signal being transduced and processed using a physiological measurement system was discussed. In this section, various physical measurements of the physiological analogue will be introduced. There are only two forms of matter – mass and energy. Any physical signal must be sub-types of one of these basic forms. Key sub-types are listed in Table 2 along with summary descriptions. Subsequent sections provide additional details on these physical measurements.

Page 10 of 42
Table 2. A list of physical signal forms and descriptions of measurement applications.
Signal Form Description
Flow and Volume Fluid movement occurs in the circulatory, respiratory and gastrointestinal systems. It is an example of mass transfer and may be measured as a volume flow rate or mass flow rate. The integral of the flow yields the volume. Flow rates and volume measurements are routinely taken when determining the flow of blood through vessels – for example the cardiac output of the heart – and for making measurements to assess respiratory function.
Pressure and Force Body cavities, organs and vessels are frequently pressurized with a definable physiological range of pressures being associated with normal versus pathological operation. Blood pressure in the systemic circulation and intra-pleural and intra-cranial pressures are typical important clinical measures.
Motion Movement of various limbs and of the entire person (their gait) is indicative of the healthy functioning of an individual. At an organ or tissue level, complex rotation and translational motions, such as cardiac contraction and gut peristalsis, are observed.
Chemical The nature of all biological processes involves chemical reactions. Measurement techniques typically monitor reactions and their end-products by way of a sampled material (blood, urine, etc). A common form of measurement is the monitoring of blood gases using optical techniques applied non-invasively through the skin.
Bioelectric Bioelectrical signals arise from chemical reactions but as they are so prevalent in living tissue they are usually given a separate classification. In all excitable tissues a voltage (transmembrane potential) exists. The dynamics of the change in these transmembrane potentials form the basis of all communication in the nervous system, the heart, smooth muscle and other specialized organs in the body.
Radiation All naturally occurring biological radiation is non-ionizing. Examples include the production of sound and heat. The latter is the by-product of almost all chemical reactions and processes. The body hosts a complex temperature control system that when subject to disease and assault can often be perturbed from baseline (for example, high temperatures associated with infection). Sound is generated by the turbulent flow of fluids within a vessel or organ. It can be used to assess malfunction or disease, for example heart sounds can assess valvular abnormalities or be used for noninvasive blood pressure measurements.
3.1. Flow and Volume Measurement
Flow is a basic quantity whose measurement is essential in many areas of physiological research, from respiratory analysis, to the diffusion of nutrients across cellular membranes, the movement of cerebrospinal fluid and the flow of blood through the vasculature and bodily organs. Under the SI system, flow is typically measured as a volume flow rate in cubic meters per second (m3/s). However in physiological systems, flow rates are often recorded in liters per min (L/min) or liters per second (L/s). For example a typical adult cardiac output (CO) (amount of blood pumped around the body per unit time) would be 5 L/min and the maximal respiratory flow rate during forced expiration would be up to 12 L/s. Depending on the application, flow may also be measured in terms of mass flow rate (in units of kg/s) (in the case of flow from an artificial heart pump for

example), or a flow velocity (in units of m/s) (often used as a measure in occluded or stenosed vessels). In the subsequent subsections flow and volume measurements will be considered, however, it should be noted that the measurement techniques and transducers can often be used in an interchangeable manner whereby the time integral of a flow signal can be used to provide a volume signal and the time differential of the volume signal can be used to provide flow information.
3.1.1. Blood Flow Measurement
Blood is a multi-component fluid whose primary function is to provide a transport medium for the delivery of oxygen and nutrients to and removal of waste products from bodily tissues. As the flow of blood through the body performs many varied and vital roles, its accurate measurement is equally important with regard to physiological assessment. For example, cardiac output provides an indicator of heart performance, while a relatively low flow in the peripheral arteries and veins might signify the presence of peripheral vascular disease (abnormal narrowing of the vessels).
Indirect Methods A widely used technique for flow measurement is the indicator dilution method, which involves the injection of a known quantity of indicator into a vessel and the measurement of its concentration at a downstream site over time. Flow may then be calculated using this concentration-time curve (known as the dilution curve) and a mathematical formula that is independent of the indicator. Cold saline, dyes, radioisotopes, heat, and electrolytes may all be used as indicators.
Aorta
Pulmonary artery
Left atrium
Left ventricle
Right ventricle
Right atrium
Vena cava
Jugular vein
Right pulmonary artery
Injectate port
Thermistor sensor
Balloon
Aorta
Pulmonary artery
Left atrium
Left ventricle
Right ventricle
Right atrium
Vena cava
Jugular vein
Right pulmonary artery
Injectate port
Thermistor sensor
Balloon
Figure 2. A diagrammatic representation of a Swan-Ganz catheter introduced into the jugular vein and floated (by way of an inflatable balloon) through the right side of the heart such that the
catheter tip rests in the right pulmonary artery. A port for injection of cold saline is located in the right atrium and a thermistor is used to sense the temperature of the blood. Using a thermodilution
technique the cardiac output can be calculated.
Page 11 of 42

The standard method of cardiac output measurement in clinical practice is the thermodilution method (Figure 2). Here, an injection of chilled saline (0.9% sodium chloride) is made into the right atrium via a catheter whose tip is mounted with a thermistor. The thermistor then records the temperature change of the blood in the pulmonary artery over time, allowing flow to be calculated.
If appropriate gas analysis equipment is available, then oxygen may be used as the indicator to determine cardiac output using the Fick method. Values for oxygen uptake by the lungs (VO2; measured in mL/min) and oxygen concentrations of arterial (CaO2; mL/100mL blood) and mixed venous (CvO2; mL/100mL blood) blood may be used to determine CO using the following relationship:
2
2 2
O
aO vO
VCO
C C=
− (1)
Oxygen uptake may be measured via lung volume recordings (using a spirometer) and the oxygen content of expired air, while blood-gas analysers are used to determine the blood sample concentrations. The indirect Fick method, which employs carbon dioxide in place of oxygen, allows flow to be determined using expiratory gas analysis only, thus avoiding the procedure of blood sampling.
Plethysmography is a technique for recording the volume change in a tissue (discussed more in the following section on volume measurement), and may be used to determine blood flow to the peripheral site of interest. Venous occlusion is the most popular plethysmographic method, in which inflatable cuffs are placed at either end of the limb segment under evaluation. The furthest cuff from the trunk (distal cuff) is inflated to a pressure exceeding the maximum arterial pressure, such that all blood vessels in the vicinity are occluded. The proximal cuff is simultaneously inflated to a pressure level below the minimum arterial pressure but above the venous pressure. In this way we ensure that arterial blood flow is maintained while venous flows are obstructed. The volume change of the segment is then recorded, with the blood flow equal to the rate of volume increase at the onset of the occlusion.
Direct Methods (Flow Sensors) Numerous flow sensors have been developed which probe the flow field, and thus measure flow rate in a more direct manner to those discussed above. A major subset of these sensors relies on the transfer or propagation of electromagnetic radiation (EMR) to investigate an accessible ‘window’ of the flow field. Such sensors include electromagnetic, ultrasonic, magnetic resonance, x-ray, optical and laser Doppler flow meters.
Electromagnetic flow meters are designed to measure the volume flow rate of an electrically conducting fluid by exploiting Faraday’s Law of Electromagnetic Induction. This law stipulates that when a fluid containing electrically charged particles (in this case blood) moves through a magnetic field (supplied by the meter), an electric field is induced which is sensed as a voltage by the probe’s electrode pair (Figure 3). For a fixed magnetic field and set distance between the electrodes, the flow rate is then proportional to the measured voltage. Despite being inherently invasive, their ability to be constructed as either perivascular probes (which surround the vessel) or mounted on catheter tips for intravascular insertion, has ensured that electromagnetic flow meters have found wide application in surgical procedures and other clinical scenarios.
Page 12 of 42

Flow
Electrode
Magnet
Vessel
MagneticFieldFlow
Electrode
Magnet
Vessel
MagneticField
Figure 3. Operating principle of an electromagnetic flow meter. The applied magnetic field and flow of charged ions in the vessel induces an electric field which is sensed as a voltage by the
probe’s electrode pair.
Propagation of sound waves through a fluid will be affected by that fluid’s velocity, and the reflection of these waves is affected by the velocity of the fluid particles which cause the reflection. The first phenomenon underlies the principle upon which transit-time ultrasound flow meters are based. Ultrasound refers to those sound waves whose frequency is above that of normal human hearing (i.e., greater than approximately 20 kHz). The time taken for an ultrasound wave to propagate across a fluid medium (the transit time) depends not only on the distance of propagation, but also on the velocity of that fluid, since sound travels at a constant velocity relative to the medium. Thus, the motion of the fluid will add to or subtract from the transit time, and this time shift is related to the average fluid velocity across the vessel. A number of methods have been proposed to detect the transit time differences, however all systems employ piezoelectric materials to transmit and receive the ultrasound signals (Figure 4). The term ‘piezoelectric’ refers to those materials with the ability to generate an electrical charge in response to an applied mechanical stress. The converse effect – the production of mechanical stress in response to an applied electric field – is also exhibited by piezoelectric materials.
Page 13 of 42

(a)
Transmitter
Flow
Receiver
Reflector
Transmitter
Flow
Receiver
Reflector
(b)
Flow
Transmitter
Receiver
Flow
Transmitter
Receiver
(c)
Transmitters
Flow
Receivers
Transmitters
Flow
Receivers
Figure 4. Three typical configurations for ultrasound transmitter and receiver transducers, based on the transit-time principle.
The latter of the phenomena described earlier – relating to the effects of particle velocity on wave reflections – forms the basis for ultrasonic Doppler flow meters. When an ultrasound wave of known frequency is transmitted into and reflected by moving particles, the received wave will exhibit a frequency shift (the Doppler shift) relative to the original wave (Figure 5). This Doppler shift is linearly related to the fluid velocity. A measurement of the fluid velocity may then be used to determine the volume flow rate indirectly, by calculating the integral of the velocity profile over the vessel’s cross-sectional area. Both types of ultrasonic flow meters are widely used in the clinical and research environments, with a key attraction being the intrinsic lack of contact with or disturbance to the fluid flow.
Page 14 of 42

Flow
Receiver
Blood cell
Vessel
Transmitter
Transmitted wave (fT)
Reflected wave (fR)Flow
Receiver
Blood cell
Vessel
Transmitter
Transmitted wave (fT)
Reflected wave (fR)
Figure 5. Principle of ultrasonic Doppler flow meters. The reflected wave exhibits a frequency shift from the transmitted wave which is linearly related to the velocity of the blood cell.
Laser-Doppler flowmetry (LDF) is a method for the continuous measurement of blood flow to the microcirculation, which exploits the Doppler shift of laser light as the source of flow information. Typical clinical use involves probes which can measure the velocity of blood cells in vessels via catheter-based fiber-optic insertion, or transcutaneous measurement of capillary blood flow beneath the skin. While they exhibit high temporal and spatial resolution, LDF sensors are capable of only local measurements and provide only trends in flow (i.e. no absolute quantity may be ascertained).
Magnetic resonance (MR) is a versatile but relatively expensive method of flow mapping which allows any vessel or chamber of interest to be imaged in any oblique plane. It is based on the magnetic resonance response of the hydrogen nucleus (1H, found in the water molecules of blood) to the applied static and excitatory magnetic fields. In the time-of-flight MR method, the magnetic moments of the nuclei perpendicular to the imaged vessel may be magnetically saturated, “labeled”, and the distance traveled by this labeled blood in a certain time interval is used to determine its velocity. Another MR technique known as the phase shift method exploits a basic MR property to alter the phase shifts of the magnetic moments.
Particle Image Velocimetry (PIV) and Particle Tracking Velocimetry (PTV) are optical methods used to measure velocity fields in fluids. The fluid of interest is seeded with particles which are generally assumed to faithfully reproduce and follow the flow dynamics. A double pulse of laser light illuminates the flow field at two points in time, and after acquiring (via a digital camera) and correlating both images, the motion of these particles is used to calculate velocity information. Laser-based PIV tools require optical access to the flow field, and thus are used almost exclusively in in vitro applications. However, X-ray based PTV systems are currently being developed for in vivo use.
Page 15 of 42
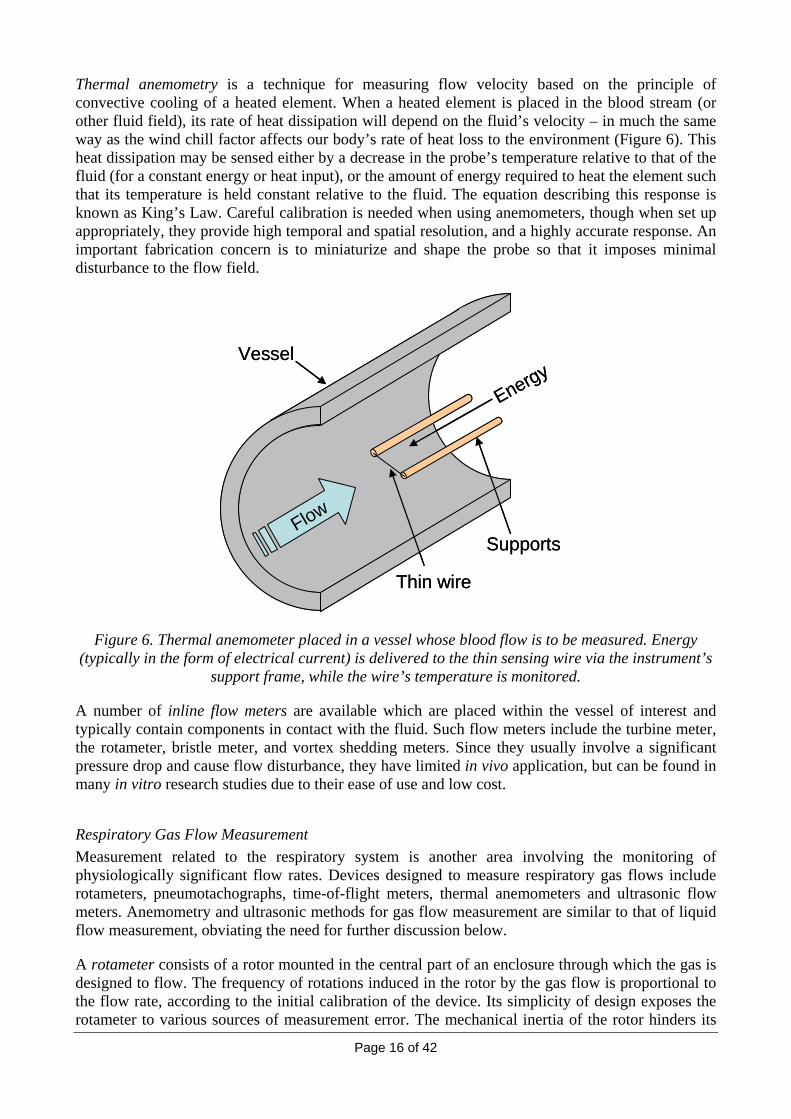
Thermal anemometry is a technique for measuring flow velocity based on the principle of convective cooling of a heated element. When a heated element is placed in the blood stream (or other fluid field), its rate of heat dissipation will depend on the fluid’s velocity – in much the same way as the wind chill factor affects our body’s rate of heat loss to the environment (Figure 6). This heat dissipation may be sensed either by a decrease in the probe’s temperature relative to that of the fluid (for a constant energy or heat input), or the amount of energy required to heat the element such that its temperature is held constant relative to the fluid. The equation describing this response is known as King’s Law. Careful calibration is needed when using anemometers, though when set up appropriately, they provide high temporal and spatial resolution, and a highly accurate response. An important fabrication concern is to miniaturize and shape the probe so that it imposes minimal disturbance to the flow field.
Flow
Thin wire
EnergyVessel
SupportsFlow
Thin wire
EnergyVessel
Supports
Figure 6. Thermal anemometer placed in a vessel whose blood flow is to be measured. Energy (typically in the form of electrical current) is delivered to the thin sensing wire via the instrument’s
support frame, while the wire’s temperature is monitored.
A number of inline flow meters are available which are placed within the vessel of interest and typically contain components in contact with the fluid. Such flow meters include the turbine meter, the rotameter, bristle meter, and vortex shedding meters. Since they usually involve a significant pressure drop and cause flow disturbance, they have limited in vivo application, but can be found in many in vitro research studies due to their ease of use and low cost.
Respiratory Gas Flow Measurement Measurement related to the respiratory system is another area involving the monitoring of physiologically significant flow rates. Devices designed to measure respiratory gas flows include rotameters, pneumotachographs, time-of-flight meters, thermal anemometers and ultrasonic flow meters. Anemometry and ultrasonic methods for gas flow measurement are similar to that of liquid flow measurement, obviating the need for further discussion below.
A rotameter consists of a rotor mounted in the central part of an enclosure through which the gas is designed to flow. The frequency of rotations induced in the rotor by the gas flow is proportional to the flow rate, according to the initial calibration of the device. Its simplicity of design exposes the rotameter to various sources of measurement error. The mechanical inertia of the rotor hinders its
Page 16 of 42

ability to respond quickly to flow changes, while at low flow rates it results in a relatively high measurement error (compared with higher flow rates).
Poiseuille’s Law states that under laminar (or smooth) flow conditions, the volume flow rate of a Newtonian fluid is equal to the pressure difference divided by the flow resistance. Water is a Newtonian fluid because it continues to exemplify fluid properties no matter how fast it is stirred or mixed. The concept of laminar (as opposed to turbulent) flow is also important. In laminar or non-turbulent flow the fluid moves in parallel lines or layers. Pneumotachographs utilize Poiseuille’s law by measuring the differential pressure across a fixed resistance, thereby determining the flow rate. The resistive component typically consists of a bundle of parallel lumens placed longitudinally to the flow path, ensuring the flow remains laminar for a certain flow range (Figure 7). Alternate pneumotachograph designs employ a structure intended to create a turbulent flow. In this case the flow rate becomes proportional to the square root of the differential pressure.
Flow
Differential Pressuretransducer
HeaterParallellumens
Flow
Differential Pressuretransducer
HeaterParallellumens
Figure 7. Design schematic for a laminar-flow pneumotachograph, displaying a cross-section through the tubing. An optional heater is used to ensure the unit is kept dry.
Time-of-flight flow meters enable the measurement of flow velocity by introducing an indicator into the flow field that is subsequently detected at a downstream site. A popular indicator is a heated gas bolus, which may be injected via a pulse of current to a fine wire. A secondary wire then senses the induced temperature change, and after accounting for the inter-wire distance, ambient air temperature and delays associated with the heat radiation and dissipation, the gas flow rate may be ascertained.
Respiratory gas flows may also be monitored via plethysmography and spirometry. These techniques primarily measure the time-varying gas volume, and determine flow rate by assessing the rate of volume change in time. As such, a discussion of these devices shall be presented in the Volume Measurement section.
3.1.2. Volume Measurement
Perhaps the most frequently measured volumes in the body involve the lungs. Standard assessments of respiratory function involve recording the resting breathing volume (tidal volume), the volume in excess of tidal volume that may be inspired (inspiratory capacity), the volume that may be forcibly expired (expiratory reserve volume) among others (Figure 8). These volumes along with information on maximal flow rates, provide a valuable diagnostic tool, and are often indicative of various respiratory diseases and ailments. The conventional device employed for lung volume
Page 17 of 42

measurement is the spirometer, which traditionally consisted of an inverted cylindrical container sealed by a liquid. The volume in the container is related to its vertical displacement, so that when appropriately connected to a person, inspired and expired air volume will be indicated a decrease or increase in cylinder height, respectively (Figure 9).
Res
idua
lVo
lum
eVi
tal C
apac
ity
Tida
lVo
lum
eIn
spira
tory
Res
erve
Volu
me
ERV
Res
idua
lV
olum
e
Tota
l Lun
g C
apac
ity
Func
tiona
l Res
idua
lC
apac
ityIn
spira
tory
Cap
acity
Volu
me
(L)
6
5
4
3
2
1
0
Lung Volumetime trace
Res
idua
lVo
lum
eVi
tal C
apac
ity
Tida
lVo
lum
eIn
spira
tory
Res
erve
Volu
me
ERV
Res
idua
lV
olum
e
Tota
l Lun
g C
apac
ity
Func
tiona
l Res
idua
lC
apac
ityIn
spira
tory
Cap
acity
Volu
me
(L)
6
5
4
3
2
1
0
Lung Volumetime trace
Figure 8. Various lung volumes of diagnostic importance (ERV = Expiratory Reserve Volume).
Mouthpiece
Waterseal
Scale
Marker
Counterweight
Air flow
Bell
Mouthpiece
Waterseal
Scale
Marker
Counterweight
Air flow
Bell
Figure 9. Schematic diagram of a basic spirometer.
Page 18 of 42
Page 19 of 42
Modern spirometers measure the movement of this container (or a bellows) with displacement transducers, thus providing a continuous electronic recording. An alternative approach that is much more prevalent in modern instruments involves integration of the time-varying flow signal. Here an initial volume is required if absolute measurements are desired. Processing of the flow signal must also account for drift in the recording over time. Due to the differing temperature and water vapor pressure present inside the lungs as compared with the external point of measurement, certain corrections need to be carefully applied to ensure an accurate recording is made.
An alternative device for measuring lung volumes, used primarily in research scenarios or specialized respiratory function laboratories rather than routine clinical assessment, is the body plethysmograph. The subject is placed in an airtight chamber and allowed to breathe through a mouthpiece with an external air supply. Breathing will induce either a pressure change in the chamber (if the volume is fixed), or a volume change (if the pressure is fixed). By Boyle’s Law, it is known that the product of pressure and volume is constant (for a fixed temperature and gas mass), thus allowing the chamber volume to be determined from pressure measurements.
Impedance plethysmography is another technique used for volume measurement. It is defined as the measurement of physiological volume changes through the measurement of electrical impedance. Applications include evaluation of peripheral vascular disease, detection of respiration, measurement of bladder, kidney and heart vessel volumes, nervous activity, galvanic skin reflex and cardiac function (including non-invasive cardiac output measurement – known as impedance cardiography).
With impedance measurement techniques, the physiological tissue through which an event is occurring is placed between measuring electrodes in such a way that the event alters the current-density distribution between the electrodes, thus manifesting itself as a change in impedance. In most methods, four or more electrodes are used with a pair of outer electrodes injecting current and one or more pairs of inner electrodes measuring the voltage and deriving the impedance (or in some cases its inverse – the conductance).
The stimulating system involves application of a constant current sinusoidal waveform. It is therefore necessary to select frequencies and intensities that do not stimulate excitable tissue. Since the strength-duration curves for all excitable tissues rise with decreasing duration, it follows that the minimum risk of stimulation is achieved by using high frequencies (typically 10 kHz – 100 kHz), or stated differently, at higher frequencies more current can be used to safely measure a physiological event.
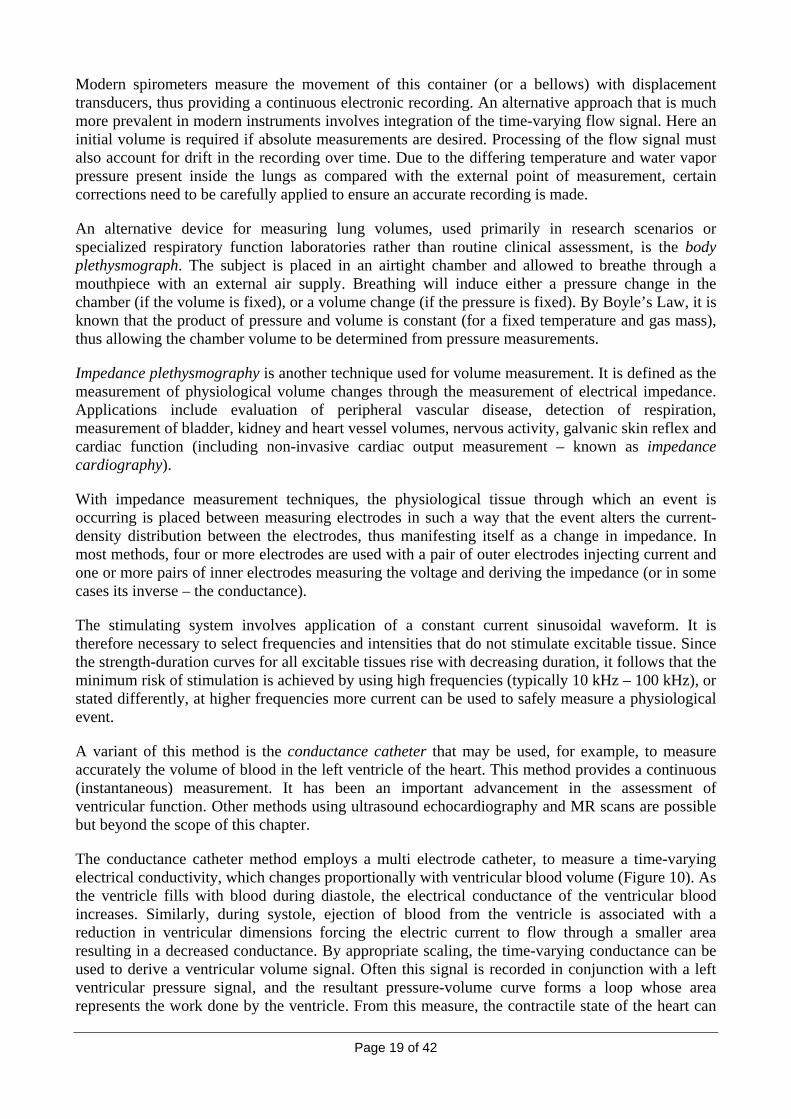
A variant of this method is the conductance catheter that may be used, for example, to measure accurately the volume of blood in the left ventricle of the heart. This method provides a continuous (instantaneous) measurement. It has been an important advancement in the assessment of ventricular function. Other methods using ultrasound echocardiography and MR scans are possible but beyond the scope of this chapter.
The conductance catheter method employs a multi electrode catheter, to measure a time-varying electrical conductivity, which changes proportionally with ventricular blood volume (Figure 10). As the ventricle fills with blood during diastole, the electrical conductance of the ventricular blood increases. Similarly, during systole, ejection of blood from the ventricle is associated with a reduction in ventricular dimensions forcing the electric current to flow through a smaller area resulting in a decreased conductance. By appropriate scaling, the time-varying conductance can be used to derive a ventricular volume signal. Often this signal is recorded in conjunction with a left ventricular pressure signal, and the resultant pressure-volume curve forms a loop whose area represents the work done by the ventricle. From this measure, the contractile state of the heart can

be inferred.
picture of an actual cardiac conductance catheter superimposed on a schematic of the left ventricle demonstrating the technique used to measure left ventricular volume. The two outer
co e
A non-invasive technique for mea lume) based on plethysmography is that of impedance cardiography, whereby the transthoracic electric impedance
ting and
ique
3.2. Pressure and Force Measurement
nsidered under the same broad heading, so too can pressure and force measurements be grouped together. The need to measure physiological pressures
Figure 10. A
electrodes (one in the ascending aorta and the other at the catheter tip located in the left ventricular apex) are used for current injection. The other pairs of electrodes measure the nductivity of the blood segments and can be summed after appropriate scaling to derive th
volume of blood in the ventricle.
suring cardiac output (or stroke vo
waveform is derived by way of a tetrapolar electrode configuration with current injecrecording electrodes bracketing the thoracic cavity. The impedance waveform is differentiated and scaled by the left ventricular ejection time in order to provide the CO measurement. The technis subject to a number of sources of error including the contribution due to changes in impedance caused by respiration. As such it is usually employed as a means of recording relative changes in CO and has more application in research environments than clinical practice.
Just as flow and volume measurements can be co
exists in many organ systems within the body. Typically, pressure measurements are made in the cardiovascular and respiratory systems and are made relative to atmospheric pressure. As we are
Page 20 of 42

normally assessing a pressure difference between two points in the body, the absolute value of atmospheric pressure is not important. However, in some cases, especially with implantable pressure transducers where an absolute pressure measurement is made, atmospheric pressure changes must be considered.
The SI unit of pressure is the Pascal (Pa) but due to the low pressures seen in physiological systems, units of centimeters of water (cmH2O) or millimeters of mercury (mmHg) tend to be used.
poin types of sensing elements that may be employed within pressure- and force-measuring instruments. The majority of sensors in use today are based on resistive,
Typically maximal pressures in the normal human cardiovascular system are 100-150 mmHg in the systemic arterial system and tens of mmHg in the venous system. In pathophysiological states these numbers can change considerably and the maximal arterial pressure could even double.
3.2.1. Sensing Elements
At this t let us examine the
piezoelectric, capacitive, or fiber-optic methods. Resistive strain gauges utilize either metal or semiconductor elements whose electrical resistance varies in response to an applied mechanical strain (known as the piezoresistive effect). They may be manufactured in a number of ways – including single fine wires, thin metal films (Figure 11) or patterned foil – however the aim is primarily to maximize the resistance over a given area, which results in an increased measurement sensitivity. This sensitivity (otherwise known as the gauge factor) is calculated as the ratio of relative resistance change (ΔR/R) to relative change in length (or strain) (ΔL/L). Semiconductor strain gauges have significantly higher gauge factors compared with their metallic counterparts. Metals exhibit changes in resistivity only due to the change of the sensor geometry, while in semiconductors there is an additional factor related to the stress dependent resistivity of the material.
Backing material
Connection(solder) tab
Metal foil
Backing material
Connection(solder) tab
Metal foil
Figure 11. Schematic diagram of a foil-type strain gauge bonded to a backing material.
As m ating an electric charge in response to mechanical deformation of its crystal structure. Such transducers
entioned earlier, piezoelectric transducers employ materials which are capable of gener
are carefully fabricated to ensure that the applied force (and hence pressure) is directly proportional to the generated charge and output voltage. In practice they are relatively highly rigid sensors, capable of measure pressuring waves with frequencies of up to 100 kHz, and may be used for the transmission and reception of ultrasonic pressure waves. They cannot, however, measure static
Page 21 of 42

pressures – only changes in pressure.
Capacitive sensors rely on the principle that the capacitance between two conductive parallel plates is inversely proportional to the distance separating them. Hence, the displacement of a diaphragm
ght from the rear of the diaphragm. Typically, an optical source transmits light along a fiber-optic catheter to
pres ly facilitated by a flexible diaphragm in contact with the measurement site. Upon being subjected to pressure, the diaphragm is deformed or displaced by a
due to an applied pressure may be ascertained via a suitably constructed electronic circuit.
Fiber-optic sensors measure diaphragm deformation by sensing the amount of reflected li
the rear of the transducing diaphragm. When the diaphragm is not subject to an applied pressure, its surface will be straight and perpendicular to all incident light waves, providing maximal reflection to the light detector. As the degree of deformation increases, segments of the diaphragm will reflect light away from the catheter, and the amount of light detected will decrease.
3.2.2. Invasive Pressure Sensors
Direct sure measurement is typical
varying amount which is dependent on the applied pressure. This deformation may then be transduced into an electrical signal via resistive strain gauge, piezoresistive, piezoelectric, capacitive, or fiber-optic methods. The amount of deformation may be linear with applied pressure over a limited range, however in general will be non-linear, thus requiring an accurate calibration to be made for each sensor design.
Sensing elementand fluid chamber
Tubing topressure source
Voltage output cable
Sensing elementand fluid chamber
Tubing topressure source
Voltage output cable
Figure 12: Extravascular pressure transducer. The fluid from the pressure source is drawn into the fluid chamber, in which the pressure sensing diaphragm resides. This particular transducer uses a
number of resistive elements arranged in a bridge configuration and thus requires an excitation voltage to be applied to the sensor.
Page 22 of 42

In order to access the meas inserted via surgical incision, percutaneous guidewire or other means. The transducing diaphragm may reside either at the tip of the catheter in direct contact with the pressure source, or external to the body with the fluid connected to it via the catheter tubing (Figure 12). Since the external tubing introduces a dampening effect and slight time-delay, proximity of the sensor to the pressure source will result in a more accurate signal. Thus, although catheter-tipped transducers may be relatively fragile, expensive and require more frequent recalibration, they provide a higher quality output signal. Depending on the application, other types of transducers may be used. For example, intracranial pressure may be monitored by means of an implantable transducer, with either a wired or wireless interface. Microvascular studies may employ micro-pipettes to serve the role of catheter, and operate in conjunction with a highly rigid (and therefore highly sensitive) transducer. Ingestible capsules encasing a pressure transducer, amplifier, transmitter and battery, may be employed for gastro-intestinal pressure measurements.
3.2.3. Non-invasive Pressure Measurement
Perhaps the most frequently measured physiological pressure is blood pressure, specifically an individual’s systolic, diastolic and mean arterial pressure. This measurement is conventionally performed with a sphygmomanometer, consisting of an inflatable cuff for vascular occlusion, a bulb for cuff inflation, and a mercury or aneroid manometer to record the pressure values (Figure 13). The cuff is placed around the upper arm and inflated until the pressure delivered to the tissue and underlying arteries exceeds the systolic pressure, thus occluding the arterial vessels. As the cuff is slowly deflated, acoustic waves (referred to as Korotkoff sounds) are generated by the pulsation of blood and vascular vibrations, and are present whilst the cuff pressure remains between systolic and diastolic pressure.
urement site, catheters may be
Mercury manometer
Pressure cuff
Inflation bulb
Mercury manometer
Pressure cuff
Inflation bulb
Figure 13. Example of a sphygmomanometer for blood pressure measurement.
Page 23 of 42
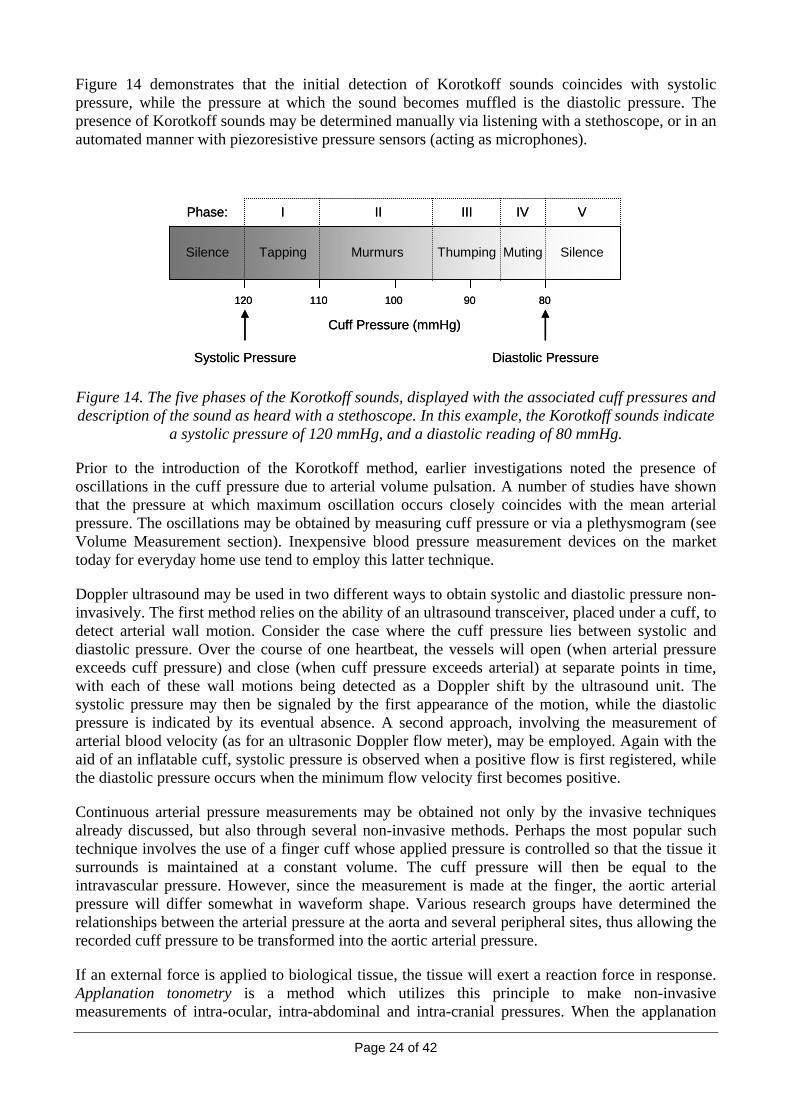
Figure 14 demonstrates that the initial detection of Korotkoff sounds coincides with systolic pressure, while the pressure at which the sound becomes muffled is the diastolic pressure. The presence of Korotkoff sounds may be determined manually via listening with a stethoscope, or in an automated manner with piezoresistive pressure sensors (acting as microphones).
Silence Silence
120
Tapping Murmurs Thumping Muting
Cuff Pressure (mmHg)
110 100 90 80
Phase: I II III IV V
Silence Silence
120
Tapping Murmurs Thumping Muting
Cuff Pressure (mmHg)
110 100 90 80
Phase: I II III IV V
Systolic PressureSystolic Pressure Diastolic PressureDiastolic Pressure
ent section). Inexpensive blood pressure measurement devices on the market today for everyday home use tend to employ this latter technique.
Doppler ultrasound may be used in two different ways to obtain systolic and diastolic pressure non-invasively. The first method relies on the ability of an ultrasound transceiver, placed under a cuff, to detect arterial wall motion. Consider the case where the cuff pressure lies between systolic and diastolic pressure. Over the course of one heartbeat, the vessels will open (when arterial pressure exceeds cuff pressure) and close (when cuff pressure exceeds arterial) at separate points in time, with each of these wall motions being detected as a Doppler shift by the ultrasound unit. The systolic pressure may then be signaled by the first appearance of the motion, while the diastolic pressure is indicated by its eventual absence. A second approach, involving the measurement of arterial blood velocity (as for an ultrasonic Doppler flow meter), may be employed. Again with the aid of an inflatable cuff, systolic pressure is observed when a positive flow is first registered, while the diastolic pressure occurs when the minimum flow velocity first becomes positive.
Continuous arterial pressure measurements may be obtained not only by the invasive techniques already discussed, but also through several non-invasive methods. Perhaps the most popular such technique involves the use of a finger cuff whose applied pressure is controlled so that the tissue it surrounds is maintained at a constant volume. The cuff pressure will then be equal to the intravascular pressure. However, since the measurement is made at the finger, the aortic arterial pressure will differ somewhat in waveform shape. Various research groups have determined the relationships between the arterial pressure at the aorta and several peripheral allowing the recorded cuff pressure to be transformed into the aortic arterial pressure.
If an external force is applied to biological tissue, the tissue will exert a reaction force in response. Applanation tonometry is a method which utilizes this principle to make non-invasive measurements of intra-ocular, intra-abdominal and intra-cranial pressures. When the applanation
Figure 14. The five phases of the Korotkoff sounds, displayed with the associated cuff pressures and description of the sound as heard with a stethoscope. In this example, the Korotkoff sounds indicate
a systolic pressure of 120 mmHg, and a diastolic reading of 80 mmHg.
Prior to the introduction of the Korotkoff method, earlier investigations noted the presence of oscillations in the cuff pressure due to arterial volume pulsation. A number of studies have shown that the pressure at which maximum oscillation occurs closely coincides with the mean arterial pressure. The oscillations may be obtained by measuring cuff pressure or via a plethysmogram (see Volume Measurem
sites, thus
Page 24 of 42

force is of known magnitude, the internal tissue pressure may be calculated by dividing this force by the area of applanation. This technique is routinely employed in the diagnosis of glaucoma, or raised intra-ocular pressure. Here, the flat plate of the applanation tonometer is pressed against the surface of the eye (cornea), so that the diameter of the contact area remains between 3-3.5 mm (Figure 15). Scientific literature states that at this contact area, the elastic force and surface tension alance each other out, and the increase in intra-ocular pressure due to the applanation is
insignificant, thus providing a measure of the pressure within the eye chamber. The contact area is determined optically, with incident light being reflected toward the operator only if it is indeed touching the eye’s surface.
b
ForceIntraocular
Tonometer
Page 25 of 42
Pressure
ContactAreaCross-section
of cornea
Tonometer
ForceIntraocularPressure
ContactAreaCross-section
of cornea
Figure 15. Principle of applanation tonometry, applied to the cornea.
3.2.4. Force Measurement
Force measurements form a fundamental component of many medical research and diagnostic activities, including the development of prostheses, gait analysis, and muscular tissue function. The SI unit of force is the Newton (N), where 1 N is defined as the force needed to accelerate an object (which is free to move) of mass 1 kg at a rate of 1 m/s2. Typically, this quantity is measured by sensing the level of mechanical strain induced in an elastic material. Whether the strain generated is
chniques are confined to laboratory-based studies and not used in humans.
(Figure 16).
compressive (causing contraction), tensile (causing elongation) or shear (causing deflection), it can be transduced into an electrical signal via resistive strain gauge, piezoresistive, piezoelectric, capacitive, or fiber-optic sensors These techniques have already been described in some detail in the section on pressure measurement.
In experiments involving the measurement of contractile forces produced by muscle fibers, one end of the muscle is fixed while the other interfaces to the pressure transducer. The elastic structure to which the sensing element is attached depends on the application, but may involve a cantilever beam, column, shear beam or load button. Muscular contraction produces a deformation in the structure, resulting in a measurable electrical signal from the sensor, and allowing the associated force measurement to be made according to the device calibration. Usually such te
Gait analysis refers to the assessment of an individual’s walking manner, and finds clinical application in the study of cerebral palsy, amputee recipients or any of a number of injuries. A routine gait evaluation will involve the measurement of the forces and moments acting on various joints such as the knee and ankle. These parameters are typically obtained indirectly via measurements of the foot-ground force via a force plate. The most popular force plates consist of transducers that record a three-dimensional force (vertical, lateral and frontal directions), allowing the direction, point of application, and ground force torque to be obtained

Reaction ForceVector
Page 26 of 42
Force Plate
yz
x
Reaction ForceVector
x
Force Plate
yz
Figure 16. Typical gait analysis configuration with a force plate on a walkway, able to measure the reaction force vector generated by the subject.
A more detailed view of the ground force distribution encountered by the foot’s sole may be obtained by a specialized force plate embedded with a matrix of force sensors. Knowledge of this force pattern m ign corrective footwear. Force plates m ral stability, in
stand as still as possible, or to counteract an external disturbance effo ce transducers allows the point of
e ascertained, providing the arrangement of strain gauges on the
application in gait analysis, energy
d to measure the angular displacement of a joint in a single axis or multiple axes, with one potentiometer used per degree of freedom. A photo-encoder is comprised of a light source, a plate with slits, and a light detector. As the plate moves, either linearly or rotationally, the sequences of light pulses detected may be used to infer the displacement of the motion.
ay assist with an investigation of the body’s postural control or to desay also be employed during an examination of one’s postu
which the subject may be asked toin their rts to remain upright. A series of vertically aligned forapplication to be determined over time, providing an approximate indication of the extent to which their centre of gravity is changing. Such techniques are widely used in assessing the risk of falls in the frail elderly.
Evaluation of bone stress – that is, the force per unit area acting on the bone – is an inherently invasive task, and is generally determined indirectly from the stress-strain relation of the bone. Strain may be measured by surgically attaching strain gauges directly to the bone. If the stress-strain relation is known – either via estimations from prior studies or subsequent removal and testing of the bone – stress may then be estimated from the recordings of strain. Components of strain in different directions may bbone is appropriate.
3.3. Measurement of Motion (Displacement, Velocity and Acceleration)
Motion may be described in terms of linear movement by displacement (m), velocity (m/s) or acceleration (m/s2), or rotational movement by its angular equivalents. The measurement of such physical quantities with respect to the human body finds expenditure estimation, and movement classification among others.
Displacement and rotation (angular displacement) can be assessed with the aid of contact transducers – such as potentiometers, photo-encoders, or capacitive transducers – or non-contact transducers, which may employ optical or magnetic methods. A potentiometer is essentially a variable resistor. When interfaced to a movable slide the resistance change may be used to sense translational (linear) displacement, while rotation (angular displacement) may be detected when the potentiometer is driven by a rotating shaft. For example, a goniometer is a device use

Page 27 of 42
Video and photography are popular optical tools to inspect body motion. A typical setup consists of one or more cameras whose task is to capture the light reflected from a set of specialized markers placed at key positions on the body (usually the joints). Computer algorithms are then used to create an animated model of the movement, and allow the measurement of displacements, velocities and accelerations associated with the tracked body segments.
Changes in magnetic flux may be detected with a suitable coil or Hall effect transducer (which varies its output voltage in response to changes in a magnetic field). If the distance between magnetic source and sensor changes, so too will the magnetic flux recorded at the sensor, thus allowing the displacement to be measured over a limited range. Devices operating on this principle may be used to measure respiratory-related chest wall movement, and ability of the torso to rotate.
Although velocity may be obtained by calculating the rate of change of a displacement recording, it is often beneficial to m
measurement section, Dop ear velocity of a moving
r is moved in a magnetic field. A tachometer, for example, generates a voltage
ing. These units allow the detection not only of steps and step rate – as performed by pedometers – but are also capable of distinguishing between types of activities such as lying down, sitting up, walking, bicycling, and even the detection of falls. Numerous studies
gy consumption for a range of activity types, thus allowing individuals to assess their daily energy output and plan
or piezoelectric transducers.
easure velocity directly to avoid problems associated with noise amplification (a potential complication of the differentiation process). As discussed in the flow
pler ultrasound may be used to quantify the linobject. In addition to blood flow, this technique may be used to assess various other motions within the body, such as the cardiac and respiratory function of a fetus.
A gyroscope is a type of device which utilizes a rotating flywheel to detect angular velocity. This internal flywheel seeks to conserve its angular momentum by resisting changes to its motion, and produces a measurable torque proportional to the angular velocity of the gyroscope. These devices find application in gait analysis, where joint movement and body rotation are assessed.
In a similar manner, various velocity transducers rely on sensing the induced voltage when an electric conductoproportional to rotational speed, and may be combined with a treadmill to measure a person’s running speed.
Accelerations acting on or generated by the body are a particularly useful quantity for measurement when attempting to estimate an individual’s energy expenditure, or classify their type of movement. The introduction of Micro-Electro-Mechanical Systems (MEMS), where sensors are miniaturized and integrated onto a silicon chip, has facilitated the widespread deployment of wearable units for acceleration monitor
have also linked the output of tri-axial (three-dimensional) accelerometers with ener
their diet accordingly. Such energy expenditure monitoring is especially useful for diabetes sufferers. The transducing elements used in accelerometers typically consist of a mass attached to an elastic beam. When accelerated, this mass produces a force which bends the elastic beam, and which may be sensed by strain gauge, piezoresistive, capacitivePiezoelectric sensors only measure dynamic accelerations, which may be valuable when static accelerations such as gravity are not required.
3.4. Chemical Measurement
Chemical sensing of blood and other body fluids and tissue has arisen as a simple and effective means of testing homeostasis and detecting underlying pathologies and abnormalities in bodily function. Chemical sensing can also provide significant potential in the early warning and detection of chemical and biological pollutants, hazardous agents and pathogens.

Page 28 of 42
The cells that comprise the body take in metabolic products and output waste products in ways that are specific to the organ systems in which the cells reside. By measuring the chemical inputs and outputs of the cells, the functional status of the organ system can be determined. Blood is the most common entity for chemical measurement due to the fact that in many cases blood concentrations of important substances reflect the concentration of the substances in the end-organ and because many substances are carried by way of the circulatory system. There are a number of blood analytes that
ars has promoted the movement of
e followed;
e range of electrochemical and opto-electronic biosensors. This chapter will briefly
e photobleaching (fading of the amplitude response over time) of the chemical transducer.
bly th accepted roles for optical sensing in the body is related to measuring the concentration of blood gases, specifically the oxygen saturation of hemoglobin in
arterial blood is the pulse
are particular important in critical and intensive care situations as excessive changes from normal values over extended periods are not compatible with life. These include the electrolytes (sodium, potassium, chloride, calcium, bicarbonate, etc.), metabolites (urea, creatinine, lactate, glucose, etc.), blood gases (partial pressures of carbon dioxide and oxygen, arterial blood oxygen saturation) and other blood related parameters (complex biochemistry, hemoglobin, hematocrit, etc.).
Chemical measurements from the human are taken by analyzing a sampled material such as urine, blood or tissue. In this case, the sample must be extracted and then input to the instrument. Many such sensors involve a chemical color reaction followed by a colorimetric determination of the concentration. As an example, in a conventional approach, a venous blood sample would be taken and fed into a chemical analyzer. The automation of these and similar chemical tests was a major advance in clinical laboratory automation. The trend in recent yecomplex chemical analysis equipment from the dedicated testing laboratory to the bedside or point-of-care.
As an alternative to sampled measurements, some biosensors are designed for continuous in vivo monitoring. In order to achieve continuous measurements a number of approaches can ba biosensor could be placed in the vessel; a sensor could be placed in the interstitial fluid (if the substance was permeable to the capillary wall); or using extrinsic sensors typically based around optical techniques.
There are a widhighlight some broad categories of sensing approaches. The area of biochemical measurement is especially wide as it extends from the clinical laboratory, to intensive-care, to the operating theatre, bedside and home. This chapter only briefly describes the basic biochemical sensing approaches.
3.4.1. Optically-based Sensors
Optical biosensors are finding ever-increasing applications in different branches of medicine. Miniaturization (by using optical fibres, for instance) can make it possible to directly measure biomedical parameters by allowing the probe to be placed either in contact with human skin or inside the body.
Optical sensors are mainly based on amplitude-modulation - the intensity of the light is directly modulated by the parameter being investigated (which has optical properties) or by a chemical transducer whose optical properties vary with the concentration of the parameter under study. In the case of fluorescence, time- or phase-modulation is often preferred to amplitude-modulation, since sensor response is practically unaffected by th
Proba e most used and readily
arterial blood. Oxygen is the raw material for aerobic respiration whereby glucose and oxygen under the action of enzymes produce energy and carbon dioxide as a primary byproduct.
A current technology employed to measure oxygen saturation in the

Page 29 of 42
oximeter. It is a simple non-invasive method of monitoring the percentage of hemoglobin, which is saturated with oxygen. It consists of a sensor normally attached to the patient's finger. This device is often used on patients who have experienced severe trauma and are suffering significant blood loss. The pulse oximeter is able to detect hypoxia before the patient becomes clinically cyanosed. Anesthetized patients may also be fitted with a pulse oximeter to monitor oxygen saturation in the blood whilst the breathing muscles are paralyzed. It is also routinely used after surgery in recovery wards and in patients with chronic obstructive pulmonary disease and when administering oxygen to neonates as excessive oxygen levels can lead to serious damage to the lungs and retina.
The color of blood varies depending on how much oxygen it contains. The pulse oximeter uses the optical properties of blood to determine oxygen saturation. The oximeter probe shines two beams of light through a finger, one beam is red light and one is infrared light. A separate photodetector
example of gas monitoring is the capnograph. In this instance, the blood is not monitored but the expired respiratory gases. The removal of carbon dioxide is necessary for optimal cell
centrations to be measured. Thus capnography is the measurement of exhaled carbon dioxide values.
n dioxide being expired.
light source that is passed through the expired gas sample.
rochemical Sensors
Speed of response (typically less than a minute) and ease of use are the main advantages offered by
The methods of electrochemical detection can be classified according to the type of electrochemical
(produces an output voltage proportional to light intensity) records how much light is absorbed at both wavelengths of light. Based upon the ratio of changing absorbance of the red and infrared light caused by the difference in color between oxygen-bound (bright red) and oxygen unbound (dark red or blue, in severe cases) blood hemoglobin, a measure of oxygenation (the percent of hemoglobin molecules bound with oxygen molecules) can be made using a relationship known as the Beer-Lambert law.
Another
function and maintenance. Carbon dioxide and water are both products of aerobic respiration, if they are not removed from the body these chemicals accumulate in the form of carbonic acid. This leads to a decrease in the pH levels of the blood proving toxic to cells as enzyme reactions cannot function at optimal levels. In order to circumvent this problem, chemical testing methods allow carbon dioxide con
The capnograph is rapidly becoming a standard of care as a patient assessment tool during anesthesia. A capnograph consists of a monitor attached to a probe, which is inserted into the patient's endotracheal tube after anesthetic induction. This probe measures the amount of carbo
The sensor is made up of an infraredInfrared light is absorbed by carbon dioxide in the gas and this variation can be detected by a photodetector.
3.4.2. Elect
A chemical biosensor or biological signal transducer consists of two components: a sensor or sensing material (usually biological in origin) and a signal transducer (usually physical, chemical or electrical). The two components are combined or integrated into one compact unit. The biosensor functions as an analytical device and produces a measurement signal (either discrete or continuous) in response to the concentration or level of either a single analyte or a group of analytes.
chemical biosensors. Typically the smaller the device, the faster and more sensitive the response. Biosensors can easily detect analytes in the micromolar to nanomolar range. Micro-machining (e.g., of glass or silicon chips) can allow biosensor production with a high degree of miniaturization.
sensor:

Page 30 of 42
• Potentiometric sensors record a voltage difference (potential difference) between a reference electrode and an indicator electrode. This potential is theoretically proportional to the logarithm of the concentration of the chemical species being sensed. Thus, an ion-selective electrode as would be used to measure pH is a typical sensor in this class. The ion-selective field effect transistor (ISFET) is a common sensor construction. In this case, the surface voltage is related to the ions interacting on the semiconductor surface. A selectively permeable polymer layer on the sensor electrode provides the necessary specificity to analyte ions. Variants of the above can be constructed with biologically selective materials – for example, a protein such as an enzyme or antibody, a nucleic acid (DNA, RNA), antibody
tometric sensors as their name suggests monitor the conductivity of an electrochemical cell in which the concentration of an ion species being measured is
iants of the above electrochemical sensors they are often considered in their own classification due to the distinguishing fact that the receptor component of the biosensor
unts, the study of bioelectric phenomena began almost concurrently with initial experiments on electricity in the 18th century. Indeed, Galvani, one of the earliest investigators of
ch in an isolated nerve-muscle preparation from the frog, when the muscle made contact with a pair of metallic “electrodes”. Galvani erroneously attributed
Today we know that differences in electric potential are indeed generated by the cell membranes of
es”). Before addressing the topic of biopotential electrodes and the associated instrumentation employed
ise to biopotentials and the characteristics of those biopotentials of primary interest in
fragment, a whole microbial cell, or even a plant or animal tissue.
• Amperometric sensors as their name suggests monitor a current that is correlated to the concentration of an ion species being measured. The origin of the current is the chemical reaction between an electrode and its substrate. Sensors for measuring gas concentration in fluids use this technique by combining the electrode with a selectively gas permeable membrane.
• Conduc
correlated to the concentration. In a manner similar to an impedance measurement device, a small AC signal is passed to an electrochemical cell. Electrochemical impedance spectroscopy is a variant of this approach. The sensor can be used to measure the concentration of urea, various charged species, as well as oligonucleotides (short sequences of nucleotides - RNA or DNA).
In recent times there has been an intense focus on the development of specific biosensors. While such devices may be var
incorporates biological elements as a part of its sensing system. The biological receptor selectively interacts with analytes in the sample, with the transducer component of the biosensor converting these typically chemical reactions into standard electrical signals.
3.5. Bioelectric Measurement
By many acco
electricity, reportedly observed a twit
this twitch to an electric current generated within the muscle - subsequently coining the term “animal electricity” and promoting the view that electricity was inseparable from biology. Galvani's assertion was famously refuted by Volta, who noted that the electric charge described by Galvani could be attributed to the interface between the tissue and the metallic contacts.
nerve and muscle cells (see below). However, the dispute between Galvani and Volta serves to illustrate the key challenge facing the physiological measurement of biopotentials – specifically, the interaction between the potential being measured (originating within the tissue of interest) and the necessarily metallic interface between the tissue and the instrument (notionally, the “electrod
in recording biopotentials, we divert our attention to briefly review the mechanisms responsible for giving r

Page 31 of 42
clin
3.5.1.
Bioeleccells foincludeforminsmoothvastly ll excitable cells, share a common characteristic – theyand schemicis the ethe nexparticular, the bioelectric response of excitable cells and the mechanisms underlying it.
The eseparator out speciesin its extraceextracellular fluid is much higher compared to those in the intracellular fluid. Conversely, the
+
Activation or excitation of the cell membrane by an appropriate stimulus triggers a complex time ng cha he membrane to the various ion species. As a result, sodium
anges in membrane
ical applications.
Origin of Bioelectric Potentials
tric potentials are generated by the intrinsic properties of the cell membranes of excitable rming the functional tissue or organ systems of the body. Examples of such excitable cells : the nerve cells or neurons of the central and peripheral nervous systems, cardiomyocytes g the muscle and the specialised conduction systems of the heart, skeletal muscle fibres, muscle fibres of the visceral organs, and active cells of the endocrine system. Despite their different roles and functions within the body these, and indeed a
are all able to be excited. That is to say, they are all able to receive re pond to appropriate stimuli. Broadly speaking, such stimuli may be electrical, mechanical or
al in nature, and may arise either within the body itself or from the external environment. It xcitation or activation of these cells which gives rise to the various biopotentials described in t section. Here we take the opportunity to briefly review the cellular basis of excitability, in
c ll membrane of all excitable cells consists of a thin (7.5 μm) lipid bilayer which serves to e the intracellular and extracellular fluids and tightly regulate the movement of material into of the cell. The cell membrane is selectively permeable or semipermeable to certain ion with the permeability being modulated by various active and passive processes. At rest, or unexcited state, the cell membrane maintains the ionic concentrations of the intra and llular fluids such that the concentration of sodium (Na+) and chloride (Cl-) ions in the
concentration of potassium (K ) ions in the extracellular fluid is maintained at a much lower level compared to that in the intracellular fluid. These gradients in ionic concentrations across the cell membrane give rise to a net gradient in electric potential between the extracellular and intracellular spaces – the so called membrane potential or resting potential. By convention, the membrane potential is measured relative to the extracellular space. In skeletal muscle for example, the resting potential is on the order of -90 mV, indicating that the intracellular space is at a lower potential relative to the extracellular space.
varyi nge in the permeability of tions in the extracellular fluid begin to move rapidly down their concentration gradient, across the cell membrane into the cell. This in turn causes a rapid transient change in membrane potential from its resting level (typically -60 - -100 mV) to a much less negative or even a positive potential (typically 0 - +20 mV). Over time, typically on the order of a few milliseconds in nerve cells but up to as much as a few hundred milliseconds in cardiac muscle cells, the membrane permeability and hence the membrane potential returns to its resting state. This rapid transient change in membrane potential in response to appropriate stimuli is referred to as an action potential. It is these action potentials which are responsible for information transmission in the nervous system and for initiating contraction in cardiac and skeletal muscle. It is also these transient chpotential which give rise to the various biopotentials described in the next section.
In all cases, the biopotential being measured is the result of ionic current flow from regions close to the activated cell membrane, possessing a high electric potential, to more distant areas possessing a lower electric potential. The observed biopotential is therefore essentially the ohmic (resistive) potential drop caused by this current flowing within the extracellular medium of the body. Biopotentials are, almost without exception, measured as the transient difference in potential between two or more points in this extracellular medium.

Page 32 of 42
3.5.2. Biopotentials and their Applications
st co e clinical setting are summarised in Table 3. The mo mmon biopotentials recorded in th
Table 3: Biopotentials commonly measured in clinical practice and their typical signal characteristics.
Biopotential Abbreviation Frequency Range Typical Amplitude
Electrocardiogram ECG 0.1 – 100 Hz < 2 mV
Electroencephalogram EEG 1 – 70 Hz < 100 μV
Electromyogram EMG 1 – 3 kHz < 1 mV
Electroretinogram ERG 2 – 50 Hz < 100 μV
Electro-oculogram EOG 0 – 30 Hz < 200 μV
The Electrocardiogram (ECG) The ECG is the recording of the potential at the surface of the body generated by the sequential electrical activation of the heart. Since it was first observed in the late 1800's monitoring and recording of the ECG has become a cornerstone of modern clinical medicine. In its most basic form, the ECG is measured as the difference in potential between two electrodes placed on the skin of the chest. However, in modern clinical practice, the term 'ECG' is often used to refer collectively to the combination of a number of such recordings, made between strategic locations on the torso of the patient. In this context, the standard ECG consists of 9 such differential recordings, combined algebraically to produce as many as 12 different waveforms - each referred to as a lead.
The amplitude and temporal dynamics contained in these 12 leads provides significant information
The Electroencephalogram (EEG)
) the unipolar montage, 3) the average
regarding the physiological state of the heart, allowing a skilled clinician to diagnose a range of pathological conditions such as: hypertension, myocardial ischemia, valvular stenosis, or cardiac arrhythmia. Continuous recording of the ECG for periods of up to 24 hours – using a so called Holter monitor – provides a powerful means of diagnosing transient or episodic rhythm disturbances. Such monitors typically employ a subset of the standard ECG, consisting of only one or two leads. Recording of the ECG during exercise is routinely employed as a noninvasive observer for diagnosis of coronary artery disease. The ECG may also provide a noninvasive means of monitoring the heart rate of a fetus during development and of fetal monitoring during delivery. However, recording of the fetal ECG is confounded by a number of factors including the presence of the maternal ECG, which is often an order of magnitude larger than the fetal ECG recorded from the mother’s abdomen, or the uterine electromyogram.
The EEG is the electric potential resulting from neural activity in the brain. It is typically recorded using as many as 20 electrodes placed at standard locations on the surface of the scalp. As for the other biopotentials described here, the ECG is recorded as the difference in potential between each of these electrodes and either a subset of the remaining standard electrodes (bipolar recordings), or a distant reference electrode (unipolar recordings). Four configurations for recording and reporting of the EEG have been defined: 1) the bipolar montage, 2

Page 33 of 42
reference montage, and 4) the Laplacian montage. Recordings for the bipolar montage are made between adjacent pairs of electrodes on the scalp while those for the unipolar montage are made
ssible to derive a bipoplar montage by algebraic combination of a set of unipolar recordings. Recording the
ge reference ntial recordings are made at each of the standard electrodes with reference to the
combined or average potential of the remaining electrodes. When recording the Laplacian montage, ings ar en each el r nea ereby
approximating the second spatial derivative or Laplacian of the EEG. As for the bipolar montage, it ce and Laplacian montage set of unipolar
recordings.
Although not mandated by a standard, when making unipolar recordings of the EEG the reference ck, nose or chin. Precise knowledge of the position
of the standard recording electrodes relative to anatomical landmarks is crucial for interpretation f the EEG. Nevertheless, give iability observ n individuals,
comparison or correlation of the EEG across patients remains a significant challenge.
ical practice incl agnosis and ca on of seizures, assessment of brain function in the event of brain injury, and monitoring the depth of anaesthesia
lso widely employed for characterization of sleep patterns (the anifest in the EEG as changes in its spectral content), and in
etween two
muscular dystrophy and neuropathies such as motor neuron disease. Combined measurement of the uterine EMG and the fetal ECG (together
r CTG) is routinely employed as a means of monitoring fetal
between each of the standard electrodes and a distant reference electrode - it is therefore po
average reference or Laplacian montages is less straight forward. In recording the averamontage, differe
differential record e made betwe ectrode and its fou rest neighbors – th
is possible to derive both the average referen s from a
electrode is typically placed on the ear lobe, ne
and comparison o n the var ed betwee
Applications of the EEG in clin ude the di tegorizati
during surgery. The EEG is adifferent stages of sleep are mcombination with other biopotentials such as the ECG, EMG and EOG (the combination is often referred to as a polysomnogram or PSG), provides a powerful means of diagnosing sleep disorders.
The Electromyogram (EMG) The EMG is the potential resulting from electrical activation and subsequent contraction of skeletal or smooth muscle. The EMG may be recorded by one of two means. Firstly, the summed electrical activity of the muscle being studied may be measured as the difference in potential belectrodes placed on the surface of the skin over the muscle or muscle group of interest. This is referred to as a surface EMG. Alternatively, the electrical activity of a single motor unit – that is, a single motor neuron and the muscle fibers it innervates - may be recorded by measuring the difference in potential between a pair of penetrating needle electrodes inserted into the muscle under investigation. This is referred to as an intramuscular EMG. Of the two modalities, the intramuscular EMG finds the most application in the clinical setting since it provides a detailed picture of muscle activation. In practice, intramuscular recordings are made from a number of motor units by placing the recording electrodes (i.e., needles) at multiple locations in the muscle of interest, and/or by making recordings at multiple depths for each needle penetration.
Changes in the amplitude and temporal dynamics of the EMG have been attributed to a number of degenerative diseases affecting the neuromuscular system. The EMG is therefore employed in the clinical setting for the diagnosis of myopathies such as
referred to as a cardiotocogram ohealth during delivery. Beyond its use as a diagnostic tool, the surface EMG is also employed as an aid in physical therapies for rehabilitation and considerable research is being undertaken to exploit the EMG as a control signal for functional electrical stimulation (FES) or for control of prosthetic limbs.

Page 34 of 42
The Electroretinogram (ERG) The ERG is the summed electrical response of the retina to full-field flash stimuli, recorded using an electrode placed either on the cornea or the conjunctiva. Recordings may be either bipolar (i.e., with respect to a reference electrode also placed on the conjunctiva) or monopolar (i.e., with respect to a distant reference electrode typically placed on or near the lateral canthus, or on the forehead). Recording electrodes typically take the form of a clear contact lens with a central optical opening surrounded by an integrated ring of gold which makes contact with the cornea. Alternatively, the ERG may be recorded using wire, gold foil or metallized polyester film placed under the eye lid in contact with the conjunctiva. Visual stimulation, in the form of a high intensity flash, is generally provided by way of a full-field (Ganzfeld) dome stimulator combined where necessary with appropriate refractive correction to ensure uniform stimulation of the retina. Where use of a
mplitude and temporal latencies of which provide insight into various aspect of normal and abnormal retinal
response, for example, the rod or cone responses, may be isolated by varying the flash intensity the eye prior to the stimulus flash. The response of rod or cone rther separated by using colored light stimuli.
ical activity of the retina. The potential difference between the cornea and the retina varies as a function of incident
e of the corneo-retinal potential. The clinical EOG attempts to quantify the peak-to-trough ratio (referred to as the Arden ratio) of the light and dark responses of the corneo-retinal potential. This is typically achieved by recording the changing potential across the eye during repetitive eye movements, while carefully controlling the level of illumination - usually by way of a Ganzfeld
Ganzfeld stimulator is not feasible, flash stimuli may be delivered using a strobe light or light emitting diode (LED) source.
In the standard ERG, a brief (< 5 ms duration) flash of white light is delivered to the dark-adapted retina eliciting a biphasic change in the potential recorded from the cornea, the a
function. The most common aspects of the ERG measured in practice are the amplitude (relative to the baseline) and latency (from flash onset to peak response) of the first negative deflection referred to as the a-wave, and the amplitude (measured from the trough of the a-wave) and latency (from flash onset to peak response) of the subsequent positive deflection referred to as the b-wave. The first 10-12 ms of the a-wave has been attributed to activation of photoreceptors in the outer retina while the b-wave reflects the functional health of the inner retina. Specific aspects of the retinal
and/or the adapted state of photoreceptors may also be fu
Standards exist regarding clinical protocols (patient preparation, stimulus parameters, recording techniques etc.) for recording of the ERG to help ensure comparable application and reporting of ERG measurements worldwide. In addition to the standard full-field ERG discussed above, a number of more specialised ERGs have also been described (e.g., the multifocal ERG: mfERG; and the patterned ERG: PERG) which have the potential to provide additional diagnostic information.
The Electro-oculogram (EOG)
The EOG is closely related to the ERG just described. Like the ERG, the EOG is a manifestation of the average electrical activity of neural cells of the retina. However, where the ERG is measured as the evoked response to flash stimuli (see above), the EOG reflects the baseline electr
light intensity - decreasing in darkness and increasing upon subsequent illumination. Many diseases of the retina affect the light-dark response of the corneo-retinal potential and hence may be detected using the EOG.
The EOG is measured as the potential difference between electrodes placed on or near the canthi on opposite sides of the eye. This potential varies with changes in horizontal eye position due to the changing orientation of the corneo-retinal dipole with respect to the recording electrodes. The magnitude of this change, for a given change in eye position, provides a robust though indirect measur

Page 35 of 42
stimulator.
via an electrolyte solution. Due to the presence of the electrolyte solution, such electrodes are sometimes referred to as “wet electrodes” to distinguish them from the
g the positive valence state of an element (i.e., loss of electrons). In the simplest case, this may be denoted by a pair of
of valency n in solution, Am- denotes a free anion of valency m in solution, C denotes an atom of the cationic species (e.g., the metal of the electrode), A denotes an
ordings as a DC offset potential. The magnitude of this half-cell potential is primarily determined by:
In addition to providing a diagnostic tool, the EOG is also widely employed as a non-invasive means of monitoring and recording eye movements. Such monitoring of eye movements is a key component of the polysomnogram described above.
3.5.3. Biopotential Electrodes and Instrumentation
In the most general terms, a biopotential electrode is a transducer – converting ionic currents (carried by ions in solution) in physiological media (tissues and organs of the body) into electronic currents (carried by electrons) in metallic conductors, suitable for detection, amplification and analysis by an instrument. Conventional biopotential electrodes in use today consist of a metallic conductor in contact with the tissue of interest (e.g., the skin, when recording body surface potentials such as the ECG)
less conventional “dry electrodes” which make contact with the tissue without the aid of an electrolyte solution. The following discussion is restricted to these conventional or wet electrodes since they are by far the more common type in general use today.
The physical processes governing conventional biopotential electrodes give rise to a number of challenges when using them to record biopotentials. The first of these challenges lies in the interface between the metallic electrode material and the electrolyte solution – the so called “electrode-electrolyte” interface. No free anions or cations exist in the metallic conductor and, conversely, no free electrons exist in the adjacent electrolyte solution. As a result, charge is transferred across this interface through a complex set of reduction-oxidation (REDOX) reactions. Reduction, in the electrochemical sense, is the process of lowering the positive valence state of an element (i.e., gaining of electrons) while oxidation is the process of raisin
chemical reactions of the form;
C ⇔ Cn+ + ne-
Am- ⇔ A + me-
where Cn+ denotes a free cation
atom of the anionic species (e.g., typically chloride), and e- denotes a single free electron.
Differences in the rate of diffusion of metallic ions into and out of the metallic conductor of the electrode results in a region of electrolyte at the interface in which neutrality of charge is not maintained. The electrolyte in this local region therefore exists at a different potential to the rest of the solution. This difference in potential is referred to as the half-cell potential, and is manifest in biopotential rec
1. the metallic species employed,
2. the concentration of its ions in the electrolyte solution, and
3. temperature.
Half-cell potentials have been determined experimentally for a wide range of electrode materials under standard conditions. Half-cell potentials for a number of the more common electrode

Page 36 of 42
materials are summarised in Table 4. As can be seen, the half-cell potentials can be several orders of magnitude larger than the magnitude of the biopotentials of interest (see Table 3 above).
Electrode Material Oxidation Reaction Half-cell Potential (V)
Table 4: Common biopotential electrode materials and their respective half-cell potentials.
Aluminium Al ⇔ Al + 3e -1.706 3+ -
Titanium Ti ⇔ Ti3+ + 3e- -1.210
Silver Chloride Ag + Cl- ⇔ AgCl + e- +0.223
Copper Cu ⇔ Cu2+ + 2e- +0.337
Silver Ag ⇔ Ag+ + e- +0.799
Platinum ⇔ 2+ -Pt Pt + 2e +1.190
Gold Au ⇔ Au3+ + 3e- +1.420
Recall that biopotentials are often measured as the difference in potential between two electrodes placed in contact with the extracellular medium. With this in mind, it is evident that the effect of the half-cell potential may be reduced when making biopotential recordings by carefully matching the half-cell potentials of the biopotential electrodes employed. Under ideal conditions, the half-cell potentials of the two electrodes would then sum to exactly zero. However, in practice a perfect match can never be achieved and the remaining DC potential must be compensated for by the
ly used electrode in the clinical setting today is the pre-gelled disposable Ag/AgCl electrode illustrated in Figure 17. Electrodes such as this are readily available at low cost
instrument.
Perhaps the most wide
from commercial suppliers and are widely used in monitoring body surface potentials such as the ECG.

Figure 17. A typical pre-gelled disposable Ag/AgCl electrode suitable for measuring body surface potentials such as the ECG. Note the key elements common to all conventional biopotential
des, namely the metallic co ase the Ag/AgCl nd the electrolyte gel, in this case contained within the sponge pad.
is increasingly being used in cancer treatment to potentiate the efficacy of chemotherapy or radiotherapy. In this section we briefly review the techniques routinely employed
l categories: 1. Thermal expansion, 2. Thermoelectric, 3. Thermoresistive, or 4. Thermoradiation,
according to the physical mechanism used to convert thermal energy into a signal which may be measured. The following section reviews four different sensors of primary interest in physiological measurement: liquid filled glass thermometers (thermal expansion), thermocouples (thermoelectric), thermistors (thermoresistive), and infrared (IR) thermometers (thermoradiation). A fifth sensor, the platinum resistance temperature detector (RTD) - a thermoresistive temperature sensor – is also discussed briefly.
The notion of thermal expansion for temperature measurement is familiar to anyone who has seen or used a traditional mercury-in-glass thermometer. This instrument consists of a small reservoir of mercury connected to a thin glass capillary tube. As the temperature of the mercury in the reservoir
electro nductor, in this c pellet, a
3.6. Measurement of Thermal Radiation
Many physiological processes in the body are sensitive to temperature and body temperature is an important clinical indicator for monitoring patients suffering shock or infection. Furthermore, careful manipulation of temperature may be used to achieve clinically desirable outcomes. For example, hypothermia is used to slow metabolic processes during surgery and localized hyperthermia
to measure temperature in biomedical applications.
There are numerous different temperature sensors, all of which may be classified into one of four genera
Page 37 of 42

increases, the mercury expands and is forced up the capillary tube. The temperature may be read and recorded by comparing the height of the mercury in the tube against a precalibrated scale. Due to the health risks posed by ingestion of mercury or inhalation of mercury vapor, mercury-in-glass thermometers are rarely seen in medical applications today, having been largely replaced by sensors such as those described below or, in some cases, by thermometers filled with an alternative non-toxic liquid metal alloy. The most widely employed sensors in physiological temperature measurement are based on the thermoelectric or thermoresistive principles. Thermoelectric sensors are based on two underlying physical phenomena. Firstly, any current carrying conductor subjected to a thermal gradient generates a potential difference – this is referred to as the Thompson effect. Secondly, a junction between two dissimilar conductors is also known to generate an electric potential – this is referred to as the Peltier effect. These two phemonema are exploited in the construction of simple temperature sensors known as thermocouples.
In its most basic form, illustrated in Figure 18, a thermocouple consists of a metallic conductor connected at each end to conductors of a different material. The connections between the two conductor materials at each end are referred to as junctions. In practice, thermocouples actually measure the difference in temperature between the two junctions. Typically, one junction – often referred to as the cold junction – is maintained at a known reference temperature (e.g., 0 oC) while t pote the he other junction is placed on or near the sensing location. The thermocouple then produces a
ntial difference dependant on the difference between the reference temperature and that of second junction.
Figure 18: Schematic illustration of thermocouple construction; (a) As a result of the Thompson effect, a current carrying conductor (shown in blue) subjected to a thermal gradient will generate a potential difference (ET) depending on the temperature gradient, (b) As a result of the Peltier effect,
the junction between two dissimilar conductors (shown in red and blue) will also generate an electric potential (EP), (c) The combined configuration, consisting of a conductor (blue) bonded at each end to conductors of a different material (red) is referred to as a thermocouple. In practice,
thermocouples are used to measure temperature by maintaining one junction at a known reference temperature (T1) and recording the potential E generated when the second junction is placed on or
near the sensing location (T2).
Page 38 of 42

Due to the simplicity of their construction, thermocouples are relatively cheap and extremely robust - seemingly ideal for biomedical applications. However, their output voltage is generally very low (typically < 1mV), and their sensitivity – the change in output voltage for a given change in temperature differential, quantified in the Seebeck coefficient (μV/K) – is also low. Furthermore, the sensitivity of a thermocouple is in general not constant, necessitating temperature compensation in the instrument. Despite these limitations, thermocouples have a number of advantages over the thermoresistive sensors discussed below. Firstly, thermocouples require no bias current. Secondly, thermocouples may be readily manufactured using micro-fabrication techniques. These characteristics make thermocouples ideally suited for integration in low-power devices requiring very small sensors for localized temperature measurement, or where self-heating may be deleterious.
Of the available thermoresistive sensors, those primarily of interest in physiological measurement
rs. A typical resistance-vs-temperature characteristic for an NTC thermistor is illustrated in Figure 19 where the data points indicate measurements of resistance at a range of different temperatures. As can be seen, the resistance-vs-temperature relationship is highly nonlinear, often necessitating compensation or linearization in the instrument.
applications are the so called thermistors – literally, thermosensitive resistors. Thermistors are solid-state semiconductor devices whose resistance changes in a predictable fashion as a function of temperature. Two different types of thermistor are generally available, 1) positive temperature coefficient (PTC) thermistors, whose resistance increases with temperature, and 2) negative temperature coefficient (NTC) thermistors, whose resistance decreases with temperature. PTC thermistors are of limited use as temperature sensing devices, rather, finding application as control elements in electrical and electronic equipment. NTC thermistors are, in contrast, widely used as temperature senso
Figure 19: The nonlinear Resistance-vs-Temperature characteristic of a typical negative temperature coefficient (NTC) thermistor. Data points indicate empirical measurements of
thermistor resistance over a range of different temperatures. The solid line shows an analytic approximation obtained by least-squares fitting of the Hart & Steinhart equation (a = 1.72e-2, b =
-6.01e-4, and c = 6.03e-3) to the observed data points (see text).
Page 39 of 42

Page 40 of 42
The resistance-vs-temperature characteristic illustrated in Figure 19 may be approximated by an exponential function of the form,
R = A*exp(β/T),
where R and T denote resistance and temperature respectively, and A and β are parameters to be determined). In practice, the inverse relationship - temperature as a function of resistance – is of greater use. This temperature-vs-resistance relationship has been found to be well approximated by the Hart & Steinhart equation,
T = 1/(a + b*ln(R) + c*ln(R)^3 )
where again R and T denote resistance and temperature respectively, and the constants a, b, and c are determined by empirical measurement. The inverse of the Hart & Steinhart equation, after least-squares fitting to the observed data points, is shown by the solid line in Figure 19.
Temperature may be measured using a thermistor in two ways. Firstly, the thermistor may be connected in parallel with a constant voltage source. The current flowing in the thermistor may then be measured as an indication of temperature. Alternatively, and perhaps more commonly, the thermistor may be connected in series with a constant current source. Temperature may then be measured by measuring the temperature dependent voltage drop across the thermistor.
Like thermocouples, thermistors are relatively cheap, physically small and may be encapsulated in glass or ceramic making them extremely robust. However, the effective temperature range of a thermistor sensor is considerably less than that of a typical thermocouple (tens or perhaps hundreds of degrees Celsius, as opposed to hundreds or typically thousands of degrees for a thermocouple). Nevertheless, this range is usually more than adequate for the measurement of temperatures in the physiological range (say 30 – 40 oC). Furthermore, the sensitivity of a thermistor is typically four to five times greater than that of a thermocouple sensor. Thermistors are therefore ideally suited to physiological measurement applications. Indeed, thermistor temperature sensors are central to a wide range of physiological measurement techniques - see for example the discussion on thermodilution for the measurement of cardiac output above.
The last class of temperature sensors of interest in physiological measurement is based on the principle of thermoradiation. They measure temperature based on the blackbody radiation emitted by all objects. At the temperatures of interest in physiological measurement applications, this radiation is generally in the infrared range. Temperature sensors based on measuring the blackbody radiation of an object are therefore often referred to as infrared (IR) temperature sensors or IR thermometers. In their most basic form, IR temperature sensors consist of an IR detector, which converts incident radiation into an electrical signal which may be measured and recorded, and a lens, which focuses the IR radiation onto the detector. The electrical signal produced by the detector, together with knowledge of the object’s emissivity – the degree to which the object or body deviates from an idea blackbody – may be used to determine the object’s temperature. Infrared thermometers typically require careful calibration and care must be taken to compensate for ambient temperature changes. Infrared thermometers, unlike those temperature sensors discussed so far, are unique in their ability to measure without being in contact with the body or object under inves tact temp ters par or tAnother advantag s response.
In addition to the thermistors discussed above, a second thermoresistive temperature sensor is
tigation. As a result, IR thermometers are also sometimes referred to as non-conerature sensors. Their ability to measure temperature at a distance makes IR thermome
ticularly attractive in clinical applications where compliance with the use of the thermistor hermocouple probe is difficult, e.g., when measuring the body temperature of a new-born or infant.
e of IR thermometers is that they essentially have an instantaneou

Page 41 of 42
worthy of mention here – the platinum resistance temperature detector (RTD). A platinum RTD consists of a thin film or wire of almost pure platinum encapsulated in a probe for temperature sensing. Temperature is measured by virtue of the positive temperature coefficient of the platinum
e temperature increases, the resistance of the platinum increases. The resistance-vs-temperature characteristic of a pure platinum RTD is very nearly linear over
brating instruments based on the more widely employed temperature sensors discussed above.
hat this relates to the multitude of physical parameters that may be sensed from biological organisms and their
hese patient observations typically include blood pressure, temperature, pulse or heart rate and respiratory rate.
n and intelligence embedded within measurement devices. Such progress will flow from emerging technological advances in a range of
sensing element – as th
temperatures ranging from approximately -200 – 600 oC. Although rarely employed in making physiological measurements due to their relatively high cost and limited durability, platinum RTDs are among the most accurate temperature sensors available. They are therefore mentioned here since they are often employed in cali
4. Conclusion
It is evident that the range of physiological measurement devices is extensive and t
surrounding milieu. This chapter skimmed the surface of the most prominent biosensors and biosensing instruments.
While many types of measurement and measurement methodologies are possible perhaps the most significant measurements are those that relate to vital signs of the patient. T
Such signs allow health professionals to rapidly assess patient health. In the simplest measurement scenario all the equipment that would be needed would be a stethoscope and sphygmomanometer (to measure blood pressure), a thermometer (to measure temperature) and a watch (to measure heart rate). Vital signs could be further supplemented with pulse oximetry, electrocardiograms, lung function, measurement of blood chemistry – with an ever-increasing list of measurement options depending on disease complexity, severity and health care resources and budgets.
Despite the remarkable advances that have been made to date in the area of physiological measurement and monitoring, it is also clear that future generations will both benefit from and depend on increasing levels of sophistication, miniaturizatio
areas including; semiconductor and (MEMS) biosensors and transducers; ubiquitous and pervasive communications technology; and embedded systems intelligence providing both point-of-care diagnostics and access to powerful clinical decision support systems.
Through ever increasing sophistication, specificity and mass production (and thus cost reduction) of targeted biosensing and measurement technology, it is hoped that future medical devices will have huge impacts in both developing and developed nations – better managing the burden of acute and chronic disease alike and allowing focus on preventive health strategies to promote health and wellness.

Page 42 of 42
5. Bibliography
Anderson IA and Lim K, Force Measurement, in Wiley Encyclopedia of Biomedical Engineering, 2006, John Wiley and Sons. [This chapter provides an assessment of force measurement in relation to gait analysis and muscle strength].
Bronzino JD (2006) The Biomedical Engineering Handbook. 3rd Edition. CRC Press. [This book provides a review of flow, pressure and other types of physiological monitoring].
Brown M, Marmor M,Vaegan, Zrenner E, Brigell M, and Bach M, ISCEV Standard for Clinical Electro-oculography (EOG) 2006, Doc. Ophthalmol., 2006;113:205-212. [International Society for Clinical Electrophysiology of Vision (ISCEV) standard for clinical application of the EOG including a description of basic protocols, practical aspects and technical procedures].
taine KB and Deutsch S, Flow Measurement, in Wiley Encyclopedia of Biomedical Engineering, 2006, John Wiley and Sons. [A summary of several liquid flow measuring methods is provided in this
ok].
low measurement is
of maximum amplitude obtained in cuff pressure oscillations].
k provides an in depth assessment of many biomedical instruments, particularly those associated with flow, pressure, force, and motion measurements].
Webster J (1998) Medical Instrumentation: Application and Design, 3rd edition, John Wiley & Sons, New York. [A frequently used textbook for biomedical engineering instrumentation course, it describes many aspects of transducer design and measurement].
Weyman AE (1994) Principles and Practice of Echocardiography, 2nd ed., Lea & Febiger Publishers, Philadelphia, PA. [This book provides a detailed view of the principles underlying ultrasonic flow meters].
Wilkinson I and Webb D, Venous occlusion plethysmography in cardiovascular research: methodology and clinical applications. Br J Clin Pharmacol. 2001;52:631-646. [This paper describes the application of the venous occlusion plethysmography technique for assessing changes in physiological volumes].
Fon AA, Manning
chapter].
Geddes LA and Baker LE (1975) Principles of Applied Biomedical Instrumentation, 3rd ed., John Wiley & Sons. [Information regarding respiratory gas analysis and basic information on the electrode-tissue information was sourced from this bo
Karamanoglu M and Feneley MP, On-line synthesis of the human ascending aortic pressure pulse from the finger pulse. Hypertension 1997; 30:1416-1424. [This study describes how we can ascertain the aortic blood pressure waveform by recording the finger cuff pressure].
Marmor MF, Holder GE, Seeliger MW and Yamamoto S, Standard for Clinical Electroretinography (2004 Update), Doc. Ophthalmol., 2004;108:107-114. [International Society for Clinical Electrophysiology of Vision (ISCEV) standard for clinical application of the full-field ERG including a description of basic technical procedures. This paper also includes useful references which describe the measurement of other specialized ERGs].
Masood S and Yang G-Z, Blood Flow Measurement, in Wiley Encyclopedia of Biomedical Engineering, 2006, John Wiley and Sons. [A description of techniques based on magnetic resonance for blood fgiven here].
Mootanah R and Bader DL, Pressure Sensors, in Wiley Encyclopedia of Biomedical Engineering, 2006, John Wiley and Sons. [An overview of the electrical transducers and their application in pressure measurement is provided in this chapter].
Posey JA, Geddes LA, Williams H and Moore AG, The meaning of the point of maximum oscillations in cuff pressure in the indirect measurement of blood pressure, Part 1, Cardiovasc Res Cent Bull, 1969;8:15. [This study demonstrates the correlation between mean arterial pressure and the point
Ramsey M, Noninvasive automatic determination of mean arterial pressure, Med Biol Eng Comput, 1979;17:11. [This study demonstrates the method by which mean arterial pressure may be obtained non-invasively].
Togawa T, Tamura T and Oberg PA (1997) Biomedical transducers and instruments. CRC Press, Florida, USA. [This boo