Embed Size (px)
Citation preview
© Oliver Wyman
Page 1
Nova Scotia
Private Passenger Vehicles
Oliver Wyman Selected Loss Trend Rates
Based on Industry Data Through June 30, 2018
1. Selected Trend Rates - Summary
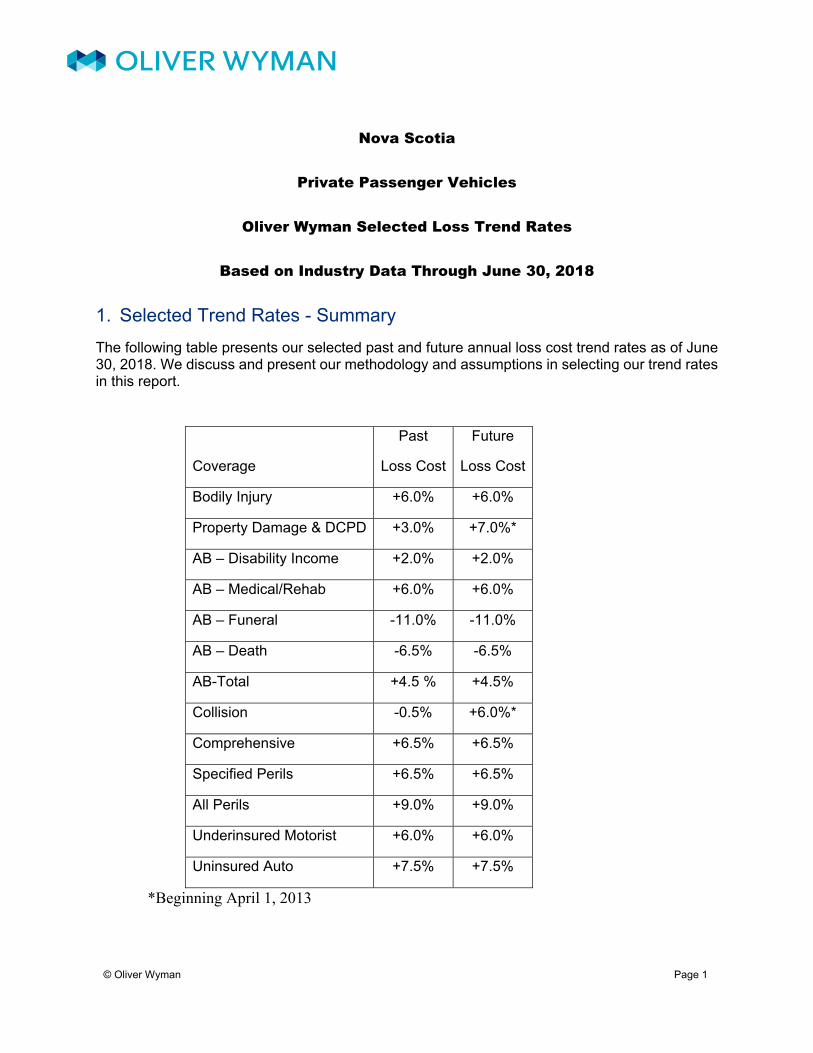
The following table presents our selected past and future annual loss cost trend rates as of June 30, 2018. We discuss and present our methodology and assumptions in selecting our trend rates in this report.
Coverage
Past
Loss Cost
Future
Loss Cost
Bodily Injury +6.0% +6.0%
Property Damage & DCPD +3.0% +7.0%*
AB – Disability Income +2.0% +2.0%
AB – Medical/Rehab +6.0% +6.0%
AB – Funeral -11.0% -11.0%
AB – Death -6.5% -6.5%
AB-Total +4.5 % +4.5%
Collision -0.5% +6.0%*
Comprehensive +6.5% +6.5%
Specified Perils +6.5% +6.5%
All Perils +9.0% +9.0%
Underinsured Motorist +6.0% +6.0%
Uninsured Auto +7.5% +7.5%
*Beginning April 1, 2013
© Oliver Wyman
Page 2
2. Introduction
Loss trend rates are factors that are used to determine rate level indications. They are applied to the experience period incurred losses to adjust for the cost levels that are anticipated during the policy period covered under the proposed rate program.
The application of trend rates is, essentially, a two-step process. The data in the experience period under consideration must be adjusted to reflect changes in cost conditions that have taken place (i.e., “past trend”), and then the data must be further adjusted to reflect changes in cost conditions that are expected to take place between the present time and the time during which the new premiums will be in effect (i.e., “future trend”).
Therefore, past trend rates should reflect the underlying trend patterns that occurred during the experience period, which we have assumed to be the three to five years ending June 30, 2018. Future trend rates should reflect those same patterns that occurred during the experience period, as well as the likelihood that those patterns may change.
We select trend rates based on historical Industry Nova Scotia claim experience as published by the General Insurance Statistical Agency (GISA)1. The Industry data is organized by half-year, and in this report, we refer to the first half of an accident half year as XXXX-1 or XXXX.1 and the second half of the accident year as XXXX-2 or XXXX.2. So, for example, the accident half-year spanning January 1, 2018 through June 30, 2018 is referred to as 2018-1 or 2018.1.
The claim experience includes allocated loss adjustment expenses, and we include a provision for unallocated loss adjustment expenses (ULAE) based on the factors published by GISA.2
We derive indicated annual loss trend rates based on an exponential regression model using Industry historical accident year loss and loss adjustment expense data that we project to ultimate cost level (when all claims are reported and settled) using the Industry loss development factors we select.
3. Estimation of Industry Ultimate Loss and Claim Amounts
The Industry Nova Scotia experience upon which the loss trend rates are based must be adjusted to an ultimate claim count and loss amount level. We do so through the application of what are referred to as development factors to the reported claim counts and claim amounts as of June 30, 2018. We select development factors based on a review of the Industry Nova Scotia loss development patterns; we do this by coverage. The data we use to select loss development factors and claim count development factors is the 2018-1 AUTO7001 Industry Nova Scotia
1 GISA outlines various data reporting issues, and as a result, GISA advises caution to the readers and users of the
data.
2 As GISA only provides an annual factor, in our June 30th reviews, we assume the prior year ULAE factor is a reasonable estimate for the subsequent half-year.
© Oliver Wyman
Page 3
accident half-year3 reported incurred loss and allocated loss adjustment expense (ALAE) and claim count data.4
Generally, we select the weighted average of the last six development factors, adjusted, where appropriate, to reflect seasonality evident in the 6 to 12 month development period,5 as we consider this selection to be a reasonable balance between responsiveness and stability.6 We refer to these selections as our default selections. For coverages with smaller data volumes, we select longer time periods as our default; e.g., for Specified Perils, Death Benefits, and Funeral, we use a twenty-point weighted average.
Although in the past we examined the claim count and claim amount development triangles for each of the top ten private passenger automobile insurer groups in Nova Scotia, and excluded the data for some insurers, we do not do so in this review for the following reasons: (a) we found the difference in our selected factors with or without the exclusions was not sufficiently different so as to materially affect the calculated loss trend rates; (b) the nature of reserving (i.e., when to open a claim file and how to set case reserve amounts) is constantly changing amongst companies; and (c) there is insufficient information to distinguish between changes that are due to reserve policy versus random changes.
In Appendices A – D we summarize our selections:
Appendix A – presents our selected cumulative factors and basis for selection (e.g., weighted average of the last six development factors). Some minor exceptions to our default selections are for smoothing, or recognition of a changing pattern over the more recent time periods.
Appendix B – presents our selected ultimate loss costs, severity amounts, and frequency by accident half-year.
Appendix C – presents a summary of our selected factors, estimated ultimate losses, as well as a comparison to the selections made in our prior review.
Appendix D – presents a summary of our selected factors, estimated ultimate claim counts, as well as a comparison to the selections made in our prior review.
We note that the selection of development factors has an effect on the selected loss trend rates and other key assumptions, factors, and provisions.7 As a result of the claim experience that has emerged and the development factors we select, our estimates of ultimate loss costs,
3 We use the terms “accident half-year” and “semester” (i.e., first semester or second semester; or the June semester
or December semester) interchangeably in this report.
4 Our selections are based on the Incurred Method.
5 The 6-12 month development period refers to the six months following the end of the particular accident half-year. For example, the 6-12 month development period for the 2016-2 accident half-year is the period spanning January 1, 2017 through June 30, 2017. Other development periods referenced in this report (e.g., 12-18) are similarly defined.
6 If seasonality is evident, our default selection is the weighted average of the June 2014, June 2015, June 2016, and June 2017 semester 6-12 month development factors.
7 A summary of our selected ultimate loss costs, severity amounts and frequency by accident half-year are presented in Appendix B.
© Oliver Wyman
Page 4
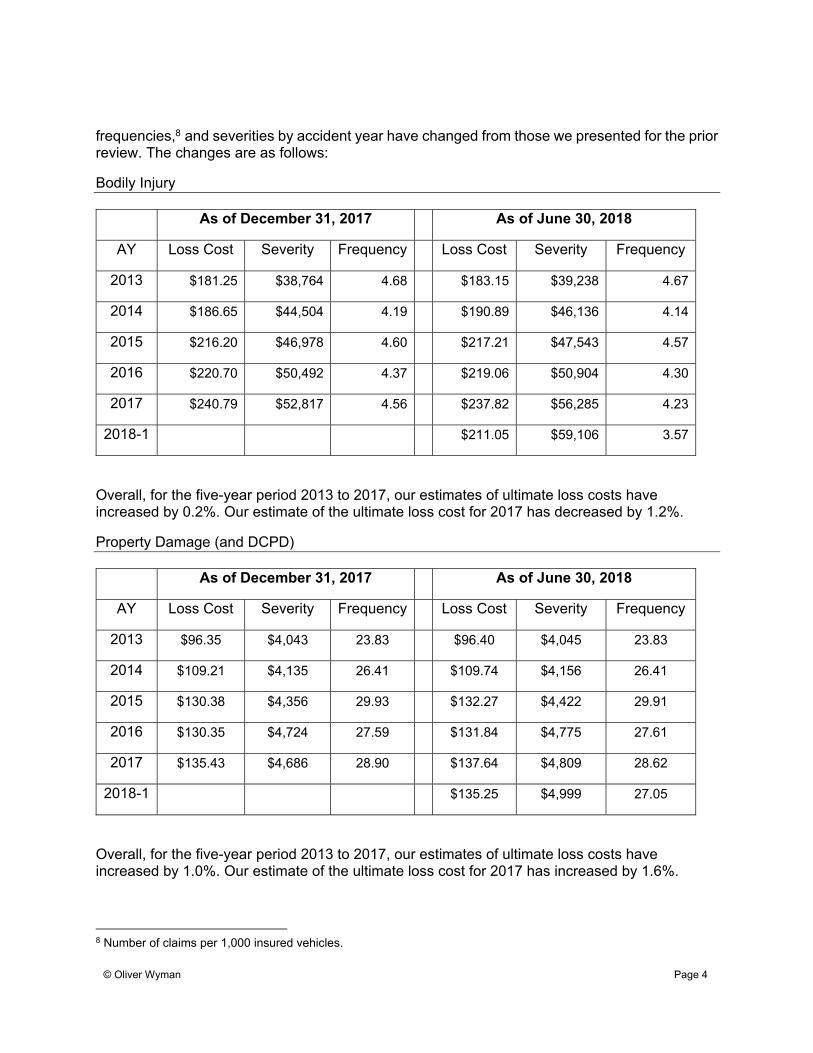
frequencies,8 and severities by accident year have changed from those we presented for the prior review. The changes are as follows:
Bodily Injury
As of December 31, 2017 As of June 30, 2018
AY Loss Cost Severity Frequency Loss Cost Severity Frequency
2013 $181.25 $38,764 4.68 $183.15 $39,238 4.67
2014 $186.65 $44,504 4.19 $190.89 $46,136 4.14
2015 $216.20 $46,978 4.60 $217.21 $47,543 4.57
2016 $220.70 $50,492 4.37 $219.06 $50,904 4.30
2017 $240.79 $52,817 4.56 $237.82 $56,285 4.23
2018-1 $211.05 $59,106 3.57
Overall, for the five-year period 2013 to 2017, our estimates of ultimate loss costs have increased by 0.2%. Our estimate of the ultimate loss cost for 2017 has decreased by 1.2%.
Property Damage (and DCPD)
As of December 31, 2017 As of June 30, 2018
AY Loss Cost Severity Frequency Loss Cost Severity Frequency
2013 $96.35 $4,043 23.83 $96.40 $4,045 23.83
2014 $109.21 $4,135 26.41 $109.74 $4,156 26.41
2015 $130.38 $4,356 29.93 $132.27 $4,422 29.91
2016 $130.35 $4,724 27.59 $131.84 $4,775 27.61
2017 $135.43 $4,686 28.90 $137.64 $4,809 28.62
2018-1 $135.25 $4,999 27.05
Overall, for the five-year period 2013 to 2017, our estimates of ultimate loss costs have increased by 1.0%. Our estimate of the ultimate loss cost for 2017 has increased by 1.6%.
8 Number of claims per 1,000 insured vehicles.
© Oliver Wyman
Page 5
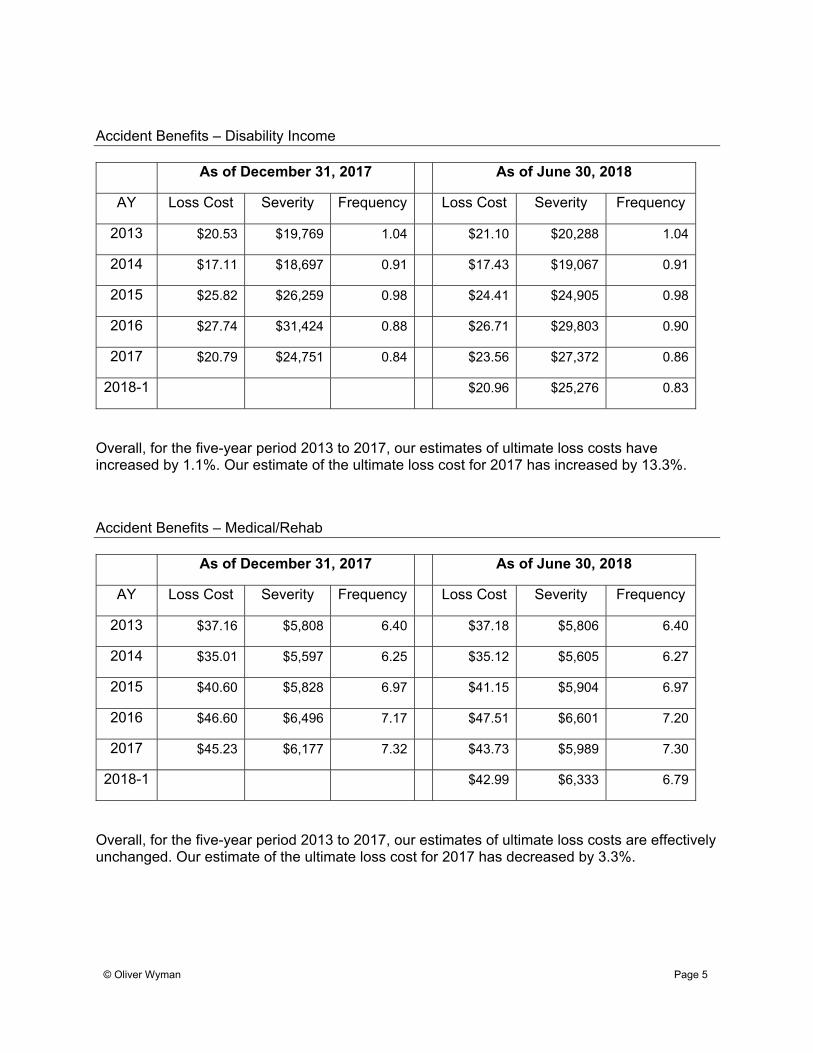
Accident Benefits – Disability Income
As of December 31, 2017 As of June 30, 2018
AY Loss Cost Severity Frequency Loss Cost Severity Frequency
2013 $20.53 $19,769 1.04 $21.10 $20,288 1.04
2014 $17.11 $18,697 0.91 $17.43 $19,067 0.91
2015 $25.82 $26,259 0.98 $24.41 $24,905 0.98
2016 $27.74 $31,424 0.88 $26.71 $29,803 0.90
2017 $20.79 $24,751 0.84 $23.56 $27,372 0.86
2018-1 $20.96 $25,276 0.83
Overall, for the five-year period 2013 to 2017, our estimates of ultimate loss costs have increased by 1.1%. Our estimate of the ultimate loss cost for 2017 has increased by 13.3%.
Accident Benefits – Medical/Rehab
As of December 31, 2017 As of June 30, 2018
AY Loss Cost Severity Frequency Loss Cost Severity Frequency
2013 $37.16 $5,808 6.40 $37.18 $5,806 6.40
2014 $35.01 $5,597 6.25 $35.12 $5,605 6.27
2015 $40.60 $5,828 6.97 $41.15 $5,904 6.97
2016 $46.60 $6,496 7.17 $47.51 $6,601 7.20
2017 $45.23 $6,177 7.32 $43.73 $5,989 7.30
2018-1 $42.99 $6,333 6.79
Overall, for the five-year period 2013 to 2017, our estimates of ultimate loss costs are effectively unchanged. Our estimate of the ultimate loss cost for 2017 has decreased by 3.3%.
© Oliver Wyman
Page 6
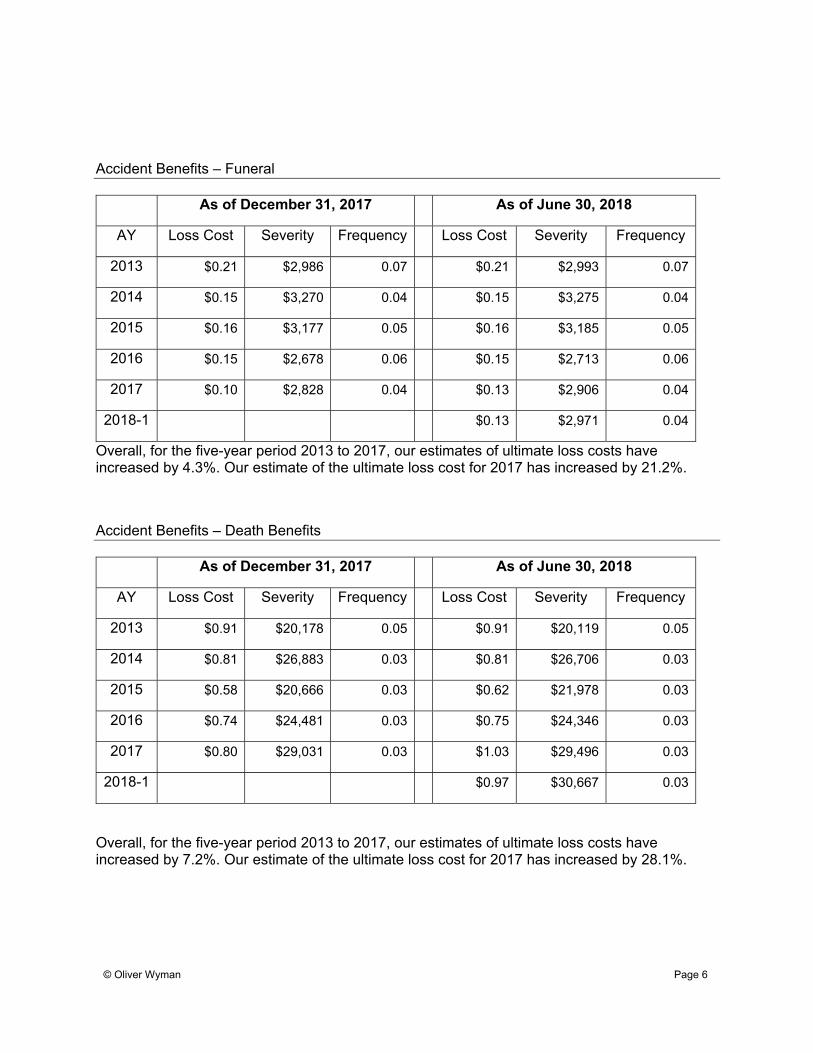
Accident Benefits – Funeral
As of December 31, 2017 As of June 30, 2018
AY Loss Cost Severity Frequency Loss Cost Severity Frequency
2013 $0.21 $2,986 0.07 $0.21 $2,993 0.07
2014 $0.15 $3,270 0.04 $0.15 $3,275 0.04
2015 $0.16 $3,177 0.05 $0.16 $3,185 0.05
2016 $0.15 $2,678 0.06 $0.15 $2,713 0.06
2017 $0.10 $2,828 0.04 $0.13 $2,906 0.04
2018-1 $0.13 $2,971 0.04
Overall, for the five-year period 2013 to 2017, our estimates of ultimate loss costs have increased by 4.3%. Our estimate of the ultimate loss cost for 2017 has increased by 21.2%.
Accident Benefits – Death Benefits
As of December 31, 2017 As of June 30, 2018
AY Loss Cost Severity Frequency Loss Cost Severity Frequency
2013 $0.91 $20,178 0.05 $0.91 $20,119 0.05
2014 $0.81 $26,883 0.03 $0.81 $26,706 0.03
2015 $0.58 $20,666 0.03 $0.62 $21,978 0.03
2016 $0.74 $24,481 0.03 $0.75 $24,346 0.03
2017 $0.80 $29,031 0.03 $1.03 $29,496 0.03
2018-1 $0.97 $30,667 0.03
Overall, for the five-year period 2013 to 2017, our estimates of ultimate loss costs have increased by 7.2%. Our estimate of the ultimate loss cost for 2017 has increased by 28.1%.
© Oliver Wyman
Page 7
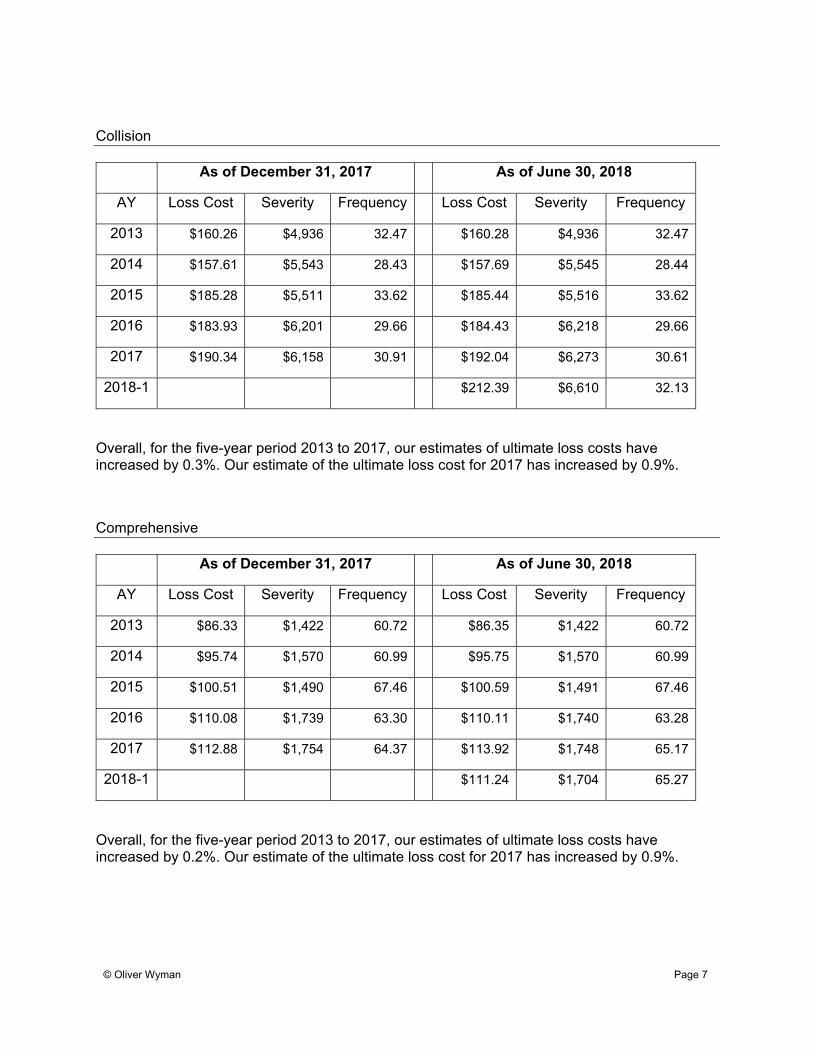
Collision
As of December 31, 2017 As of June 30, 2018
AY Loss Cost Severity Frequency Loss Cost Severity Frequency
2013 $160.26 $4,936 32.47 $160.28 $4,936 32.47
2014 $157.61 $5,543 28.43 $157.69 $5,545 28.44
2015 $185.28 $5,511 33.62 $185.44 $5,516 33.62
2016 $183.93 $6,201 29.66 $184.43 $6,218 29.66
2017 $190.34 $6,158 30.91 $192.04 $6,273 30.61
2018-1 $212.39 $6,610 32.13
Overall, for the five-year period 2013 to 2017, our estimates of ultimate loss costs have increased by 0.3%. Our estimate of the ultimate loss cost for 2017 has increased by 0.9%.
Comprehensive
As of December 31, 2017 As of June 30, 2018
AY Loss Cost Severity Frequency Loss Cost Severity Frequency
2013 $86.33 $1,422 60.72 $86.35 $1,422 60.72
2014 $95.74 $1,570 60.99 $95.75 $1,570 60.99
2015 $100.51 $1,490 67.46 $100.59 $1,491 67.46
2016 $110.08 $1,739 63.30 $110.11 $1,740 63.28
2017 $112.88 $1,754 64.37 $113.92 $1,748 65.17
2018-1 $111.24 $1,704 65.27
Overall, for the five-year period 2013 to 2017, our estimates of ultimate loss costs have increased by 0.2%. Our estimate of the ultimate loss cost for 2017 has increased by 0.9%.
© Oliver Wyman
Page 8
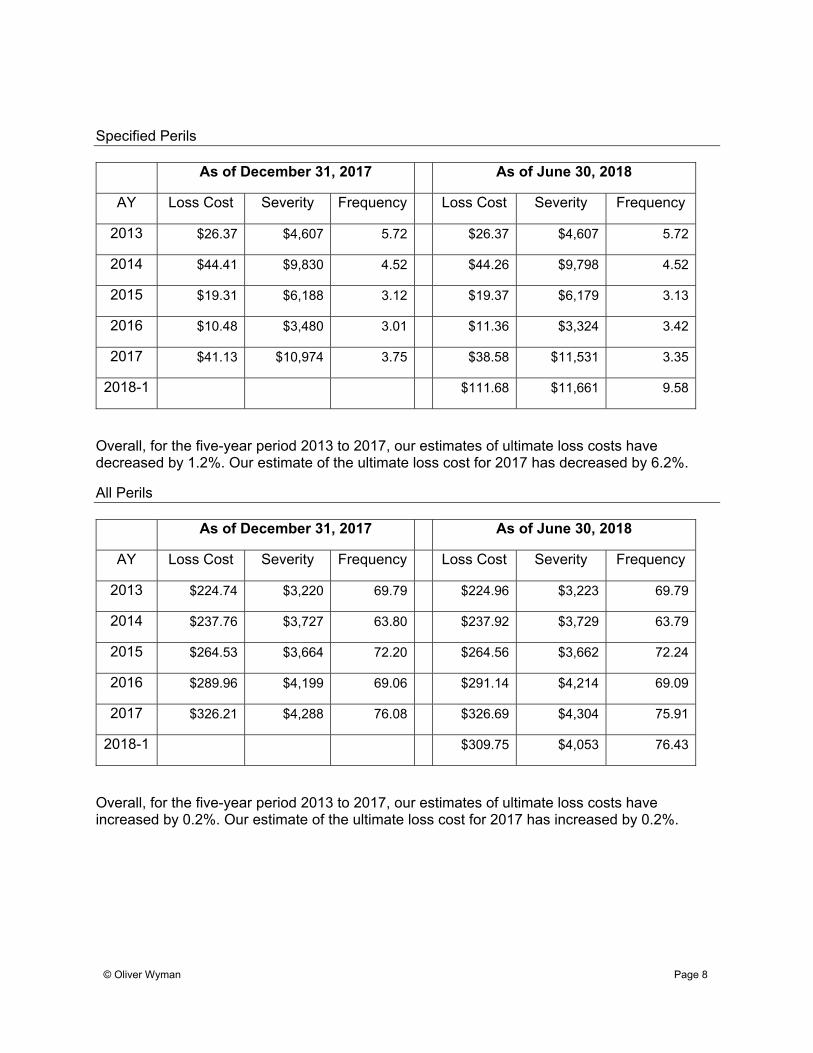
Specified Perils
As of December 31, 2017 As of June 30, 2018
AY Loss Cost Severity Frequency Loss Cost Severity Frequency
2013 $26.37 $4,607 5.72 $26.37 $4,607 5.72
2014 $44.41 $9,830 4.52 $44.26 $9,798 4.52
2015 $19.31 $6,188 3.12 $19.37 $6,179 3.13
2016 $10.48 $3,480 3.01 $11.36 $3,324 3.42
2017 $41.13 $10,974 3.75 $38.58 $11,531 3.35
2018-1 $111.68 $11,661 9.58
Overall, for the five-year period 2013 to 2017, our estimates of ultimate loss costs have decreased by 1.2%. Our estimate of the ultimate loss cost for 2017 has decreased by 6.2%.
All Perils
As of December 31, 2017 As of June 30, 2018
AY Loss Cost Severity Frequency Loss Cost Severity Frequency
2013 $224.74 $3,220 69.79 $224.96 $3,223 69.79
2014 $237.76 $3,727 63.80 $237.92 $3,729 63.79
2015 $264.53 $3,664 72.20 $264.56 $3,662 72.24
2016 $289.96 $4,199 69.06 $291.14 $4,214 69.09
2017 $326.21 $4,288 76.08 $326.69 $4,304 75.91
2018-1 $309.75 $4,053 76.43
Overall, for the five-year period 2013 to 2017, our estimates of ultimate loss costs have increased by 0.2%. Our estimate of the ultimate loss cost for 2017 has increased by 0.2%.
© Oliver Wyman
Page 9
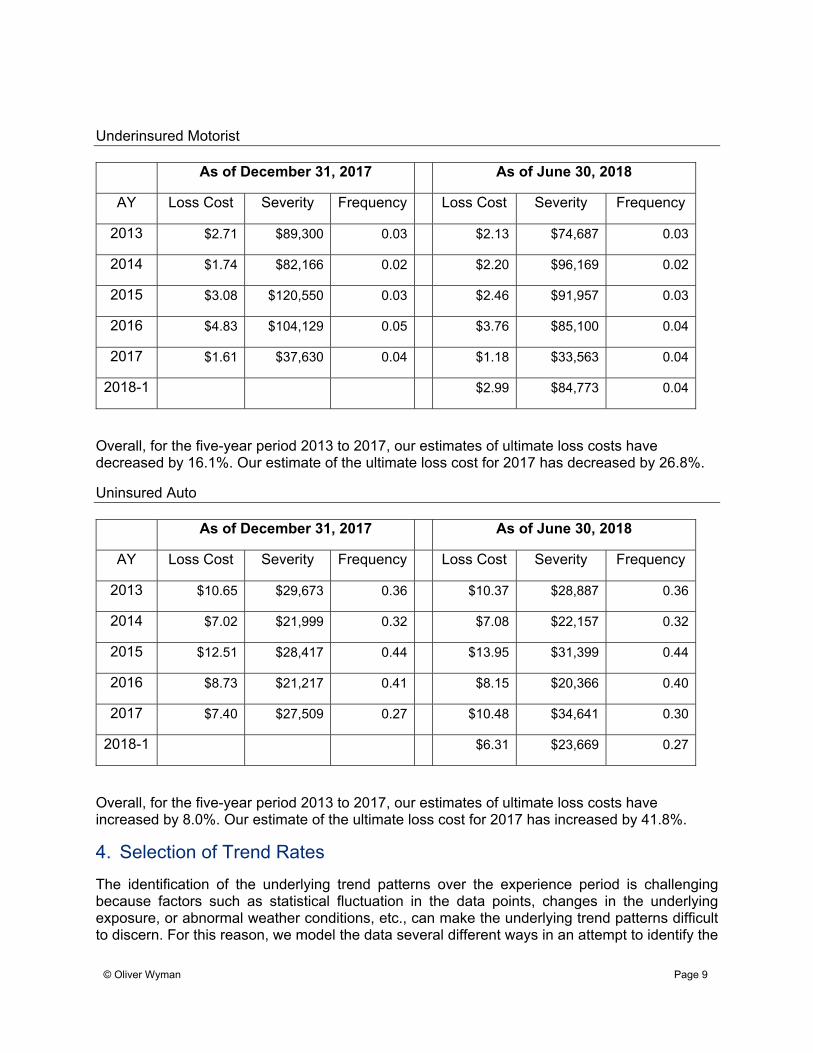
Underinsured Motorist
As of December 31, 2017 As of June 30, 2018
AY Loss Cost Severity Frequency Loss Cost Severity Frequency
2013 $2.71 $89,300 0.03 $2.13 $74,687 0.03
2014 $1.74 $82,166 0.02 $2.20 $96,169 0.02
2015 $3.08 $120,550 0.03 $2.46 $91,957 0.03
2016 $4.83 $104,129 0.05 $3.76 $85,100 0.04
2017 $1.61 $37,630 0.04 $1.18 $33,563 0.04
2018-1 $2.99 $84,773 0.04
Overall, for the five-year period 2013 to 2017, our estimates of ultimate loss costs have decreased by 16.1%. Our estimate of the ultimate loss cost for 2017 has decreased by 26.8%.
Uninsured Auto
As of December 31, 2017 As of June 30, 2018
AY Loss Cost Severity Frequency Loss Cost Severity Frequency
2013 $10.65 $29,673 0.36 $10.37 $28,887 0.36
2014 $7.02 $21,999 0.32 $7.08 $22,157 0.32
2015 $12.51 $28,417 0.44 $13.95 $31,399 0.44
2016 $8.73 $21,217 0.41 $8.15 $20,366 0.40
2017 $7.40 $27,509 0.27 $10.48 $34,641 0.30
2018-1 $6.31 $23,669 0.27
Overall, for the five-year period 2013 to 2017, our estimates of ultimate loss costs have increased by 8.0%. Our estimate of the ultimate loss cost for 2017 has increased by 41.8%.
4. Selection of Trend Rates
The identification of the underlying trend patterns over the experience period is challenging because factors such as statistical fluctuation in the data points, changes in the underlying exposure, or abnormal weather conditions, etc., can make the underlying trend patterns difficult to discern. For this reason, we model the data several different ways in an attempt to identify the
© Oliver Wyman
Page 10
underlying trends during the experience period, and we review the data over time periods that are longer than the experience period as a means of increasing the stability of results from our estimation approach and the credibility of the data being analyzed. In addition, we consider models with and without certain data points to improve our understanding of the sensitivity of the calculated loss trend rate to the inclusion or exclusion of those points.
4.1. Time Period Considered
In this review, we present and consider the claim experience by accident half-year, spanning the twenty-year period from 1998-2 to 2018-1.
While we provide twenty years of experience data, we generally select trend rates considering the claim experience over the more recent years.
4.2. Seasonality
Some coverages exhibit what is referred to as “seasonality” – where claim costs (number of claims or claim amounts) incurred during the first half of a year are generally higher/lower than claim costs incurred during the second half of a year. In the coverage-by-coverage discussion that follows, we state whether or not a seasonality parameter is applied. We note, however, that we find that seasonality may be significant for some, but not all time periods; or significant for loss cost, or severity, or frequency, but not for all three. Hence, for most coverages we present the measured trends with and without applying seasonality.
4.3. Reform (Level Change) Parameter
The purpose of a reform or level change parameter is to isolate and, in a sense, remove the impact that reforms or other events had on the level of claim costs. This better allows the true underlying claim cost trend to be identified. The regression model we use to analyze severity, frequency, and loss cost trend patterns allows the inclusion of a parameter to reflect the impact that reforms or other events have had on claim counts and amounts.
• For Bodily Injury, we give special consideration to the 2008-1 to 2010-1 period where challenges to the Minor Injury Regulations (MIR) may have had an impact on the claims experience, which was then followed by the changes to the MIR in April 2010. In particular:
– We consider a possible change in reporting pattern that might have occurred beginning January 2008 as a result of challenges to the Minor Injury Regulations - in particular, the Decision by the Supreme Court of Nova Scotia to uphold the Minor Injury Regulation released on December 15, 2009, and the Supreme Court of Canada’s Decision on May 27, 2010 to refuse leave to appeal the Decision.
– We consider Bill 52, an amendment to the Automobile Accident Minor Injury Regulations of the Insurance Act, enacted on April 28, 2010.
• We consider the Fair Act Insurance Reforms enacted on April 1, 2012, which introduced higher maximum benefit levels for Accident Benefits sub-coverages.
• Effective April 1, 2013, the DCPD coverage was introduced in Nova Scotia. We consider this change in our selected trend rates for both Property Damage (which includes DCPD) and Collision.
© Oliver Wyman
Page 11
We note that in those cases where we select a reform or level change parameter, the reform/level change is to be applied to the data (severity, frequency, or loss cost – as appropriate) prior to the time period when the change is identified to have begun. In so doing, the reform/level change parameter adjusts the data prior to the change to the same “level” as the data following the change.
4.4. Data Points
We give special consideration to data points that we consider to have a material impact on the measured trends. Of note is that for certain coverages, most notably for DCPD and Collision, there were large increases (spikes) in frequency in the 2015-1 accident period. We believe these increases to be at least in part (perhaps mostly) attributed to the relatively high amount of snow precipitation in the first quarter of 2015. We consider the possible impact of weather during 2015-1 in our individual coverage discussion sections below.
4.5. Statistical Tests
We test the various trends that we model for statistical significance based on Adjusted R-squared values, p-values, and confidence intervals. As respects the Adjusted R-squared, we generally refer to values greater than 80% to be “high,” values between 40% and 80% to be “moderate,” and values below 40% to be “low.” We consider p-values under 5% to be “significant.” The confidence interval range presented represents a 95% probability level range.
4.6. Future Trend Rates
In selecting future trend rates, we adjust our selected past trend rates if there is evidence of new patterns emerging. If no future trend rate is noted in the discussion below, it should be assumed that our selected future trend rate is equal to our selected past trend rate.
A discussion of our selected trend rates follows. The various trend patterns that we review and associated statistical results are summarized in Appendix E for each of frequency, severity, and loss cost.
******************************************************************
5. Our Selected Trend Rates
5.1. Bodily Injury
Based on our analysis as of December 31, 2017, we selected a past and future loss cost trend rate of +6%.
We estimate that during 2018-1 compared to the prior corresponding accident half year (2017-1) the frequency rate, the average severity, and the loss cost changed by approximately -14.4%, +9.3%, and -6.4%, respectively. We estimate that the loss cost for the accident year ending
© Oliver Wyman
Page 12
June 30, 2018 decreased by 1.2% over the loss cost for the accident year ending June 30, 2017.
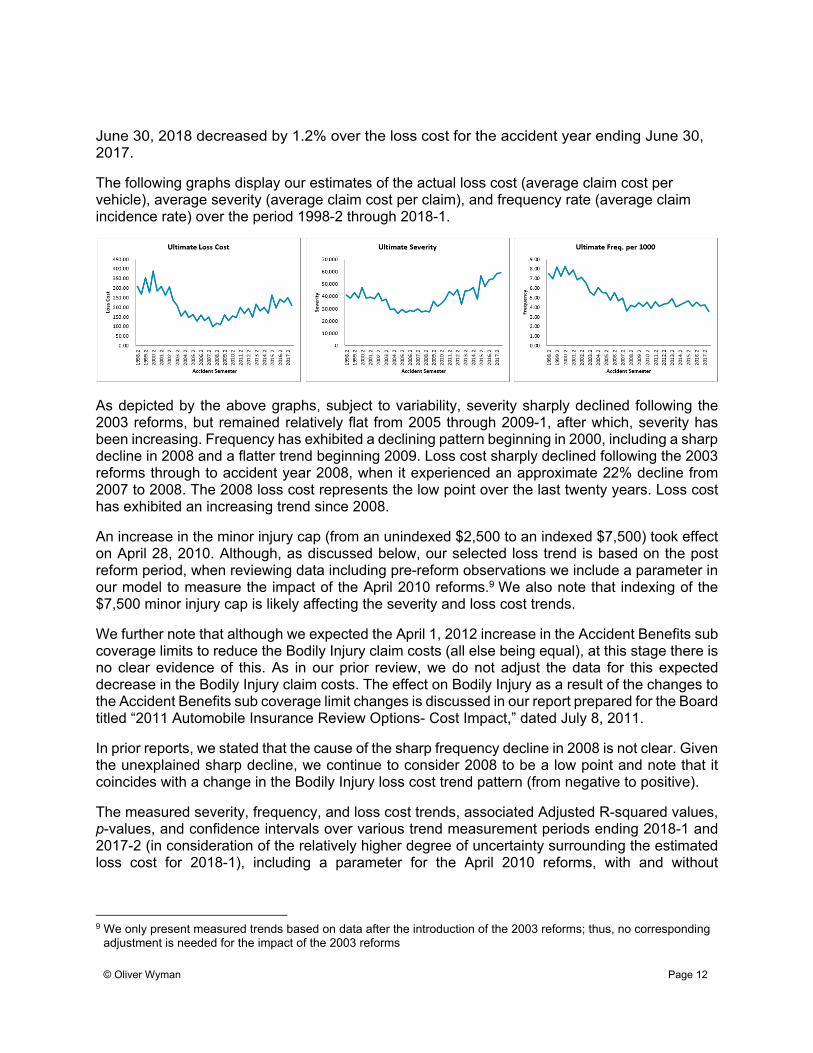
The following graphs display our estimates of the actual loss cost (average claim cost per vehicle), average severity (average claim cost per claim), and frequency rate (average claim incidence rate) over the period 1998-2 through 2018-1.
As depicted by the above graphs, subject to variability, severity sharply declined following the 2003 reforms, but remained relatively flat from 2005 through 2009-1, after which, severity has been increasing. Frequency has exhibited a declining pattern beginning in 2000, including a sharp decline in 2008 and a flatter trend beginning 2009. Loss cost sharply declined following the 2003 reforms through to accident year 2008, when it experienced an approximate 22% decline from 2007 to 2008. The 2008 loss cost represents the low point over the last twenty years. Loss cost has exhibited an increasing trend since 2008.
An increase in the minor injury cap (from an unindexed $2,500 to an indexed $7,500) took effect on April 28, 2010. Although, as discussed below, our selected loss trend is based on the post reform period, when reviewing data including pre-reform observations we include a parameter in our model to measure the impact of the April 2010 reforms.9 We also note that indexing of the $7,500 minor injury cap is likely affecting the severity and loss cost trends.
We further note that although we expected the April 1, 2012 increase in the Accident Benefits sub coverage limits to reduce the Bodily Injury claim costs (all else being equal), at this stage there is no clear evidence of this. As in our prior review, we do not adjust the data for this expected decrease in the Bodily Injury claim costs. The effect on Bodily Injury as a result of the changes to the Accident Benefits sub coverage limit changes is discussed in our report prepared for the Board titled “2011 Automobile Insurance Review Options- Cost Impact,” dated July 8, 2011.
In prior reports, we stated that the cause of the sharp frequency decline in 2008 is not clear. Given the unexplained sharp decline, we continue to consider 2008 to be a low point and note that it coincides with a change in the Bodily Injury loss cost trend pattern (from negative to positive).
The measured severity, frequency, and loss cost trends, associated Adjusted R-squared values, p-values, and confidence intervals over various trend measurement periods ending 2018-1 and 2017-2 (in consideration of the relatively higher degree of uncertainty surrounding the estimated loss cost for 2018-1), including a parameter for the April 2010 reforms, with and without
9 We only present measured trends based on data after the introduction of the 2003 reforms; thus, no corresponding
adjustment is needed for the impact of the 2003 reforms
© Oliver Wyman
Page 13
seasonality, and with and without the 2010-2 data point which we find to be low10 for severity, are presented in Appendix E.
We make the following observations about these measured trends.
The severity trends, beginning 2011-1 through 2014-1, ending 2018-1 and 2017-2, with seasonality (which we find to be significant), generally fall in the range of approximately +5.5% to +8.0% with moderate Adjusted R-squareds and significant p-values for time, with trends ending 2018-1 higher than those ending 2017-2.
The measured frequency trends over the same time period as noted for severity with seasonality (which we find to be significant), cluster around -2.0% to +0.0% with low Adjusted R-squareds and p-values for time that are not significant. We therefore consider the loss cost trends directly.
The loss cost trends, beginning 2011-1 through 2014-1, ending 2018-1 and 2017-2, with seasonality (which we find to be significant), generally fall in the range of approximately +5.5% to +7.5% with moderate-high Adjusted R-squareds and significant p-values for time.
We select a loss cost trend rate of +6.0% (rounded), based on the trends beginning 2011-1 and 2011-2, the same as our prior selection.
5.2. Property Damage (and DCPD)
DCPD was introduced on April 1, 2013. The data we analyze includes the combined Property Damage and DCPD experience.
Based on our analysis as of December 31, 2017, we selected a past loss cost trend of +3.0% through to April 1, 2013 and a loss cost trend rate of +7.0% for the period beginning April 1, 2013; with no reform parameter.
We estimate that during 2018-1 compared to the prior corresponding accident half year (2017-1) the frequency rate, the average severity, and the loss cost changed by approximately -2.7%, +6.0%, and +3.1%, respectively. We estimate that the loss cost for the accident year ending June 30, 2018 increased by 3.8% over the loss cost for the accident year ending June 30, 2017.
The following graphs display our estimates of the actual loss cost (average claim cost per vehicle), average severity (average claim cost per claim), and frequency rate (average claim incidence rate) over the period 1998-2 through 2018-1.
10 Although the minor injury reforms with a higher cap amount were introduced effective April 1, 2010, the 2010-2
severity estimate is less than the 2009-1 severity estimate. For this reason, we consider the measured severity trend rates with and without this data point.
© Oliver Wyman
Page 14
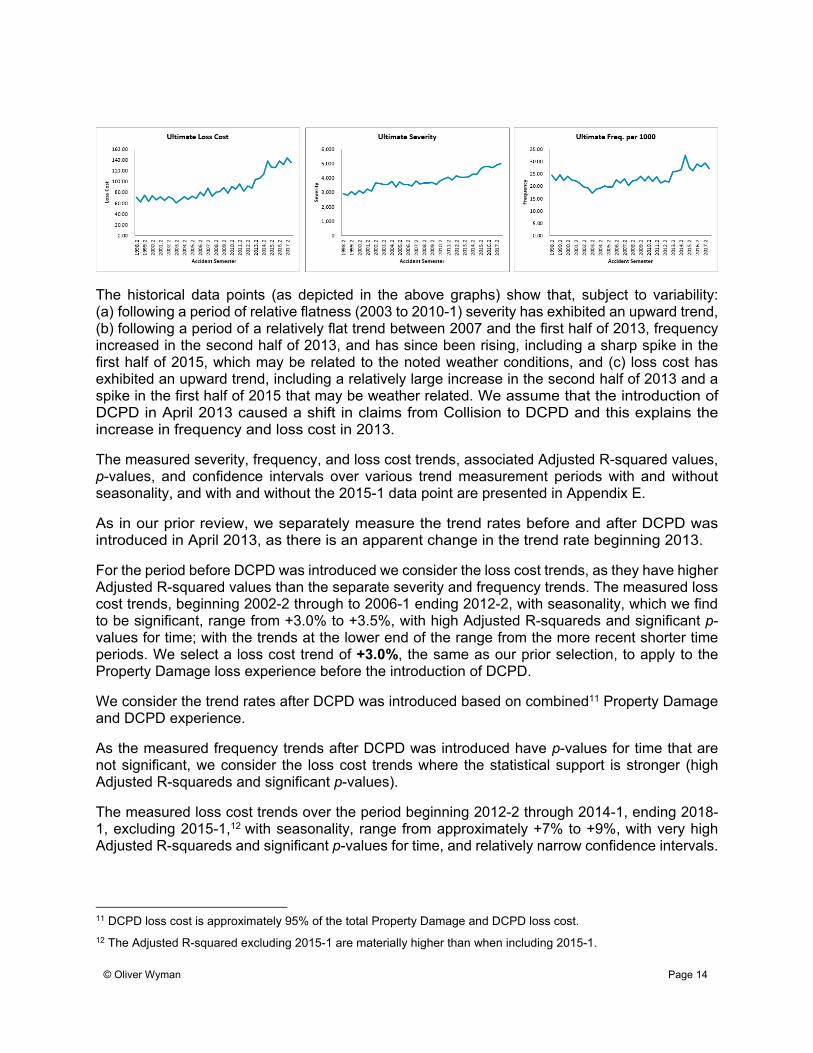
The historical data points (as depicted in the above graphs) show that, subject to variability: (a) following a period of relative flatness (2003 to 2010-1) severity has exhibited an upward trend, (b) following a period of a relatively flat trend between 2007 and the first half of 2013, frequency increased in the second half of 2013, and has since been rising, including a sharp spike in the first half of 2015, which may be related to the noted weather conditions, and (c) loss cost has exhibited an upward trend, including a relatively large increase in the second half of 2013 and a spike in the first half of 2015 that may be weather related. We assume that the introduction of DCPD in April 2013 caused a shift in claims from Collision to DCPD and this explains the increase in frequency and loss cost in 2013.
The measured severity, frequency, and loss cost trends, associated Adjusted R-squared values, p-values, and confidence intervals over various trend measurement periods with and without seasonality, and with and without the 2015-1 data point are presented in Appendix E.
As in our prior review, we separately measure the trend rates before and after DCPD was introduced in April 2013, as there is an apparent change in the trend rate beginning 2013.
For the period before DCPD was introduced we consider the loss cost trends, as they have higher Adjusted R-squared values than the separate severity and frequency trends. The measured loss cost trends, beginning 2002-2 through to 2006-1 ending 2012-2, with seasonality, which we find to be significant, range from +3.0% to +3.5%, with high Adjusted R-squareds and significant p-values for time; with the trends at the lower end of the range from the more recent shorter time periods. We select a loss cost trend of +3.0%, the same as our prior selection, to apply to the Property Damage loss experience before the introduction of DCPD.
We consider the trend rates after DCPD was introduced based on combined11 Property Damage and DCPD experience.
As the measured frequency trends after DCPD was introduced have p-values for time that are not significant, we consider the loss cost trends where the statistical support is stronger (high Adjusted R-squareds and significant p-values).
The measured loss cost trends over the period beginning 2012-2 through 2014-1, ending 2018-1, excluding 2015-1,12 with seasonality, range from approximately +7% to +9%, with very high Adjusted R-squareds and significant p-values for time, and relatively narrow confidence intervals.
11 DCPD loss cost is approximately 95% of the total Property Damage and DCPD loss cost.
12 The Adjusted R-squared excluding 2015-1 are materially higher than when including 2015-1.
© Oliver Wyman
Page 15
The lower trend rates are based on the shorter more recent time periods. We select a loss cost trend rate of +7.0% for the period beginning April 1, 2013; the same as our prior selection.
We select a past loss cost trend of +3.0% through to April 1, 2013 and a loss cost trend rate of +7.0% for the period beginning April 1, 2013.
5.3. Accident Benefits – Disability Income
Based on our analysis as of December 31, 2017 we selected a past and future loss cost trend rate of +1.5% with a level change parameter (for the reform) at April 2012 of 1.50 (or +50%).
We estimate that during 2018-1 compared to the prior corresponding accident half year (2017-1) the frequency rate, the average severity, and the loss cost changed by approximately +14.8%, -17.5%, and -5.3%, respectively. We estimate that the loss cost for the accident year ending June 30, 2018 decreased by 3.6% over the loss cost for the accident year ending June 30, 2017.
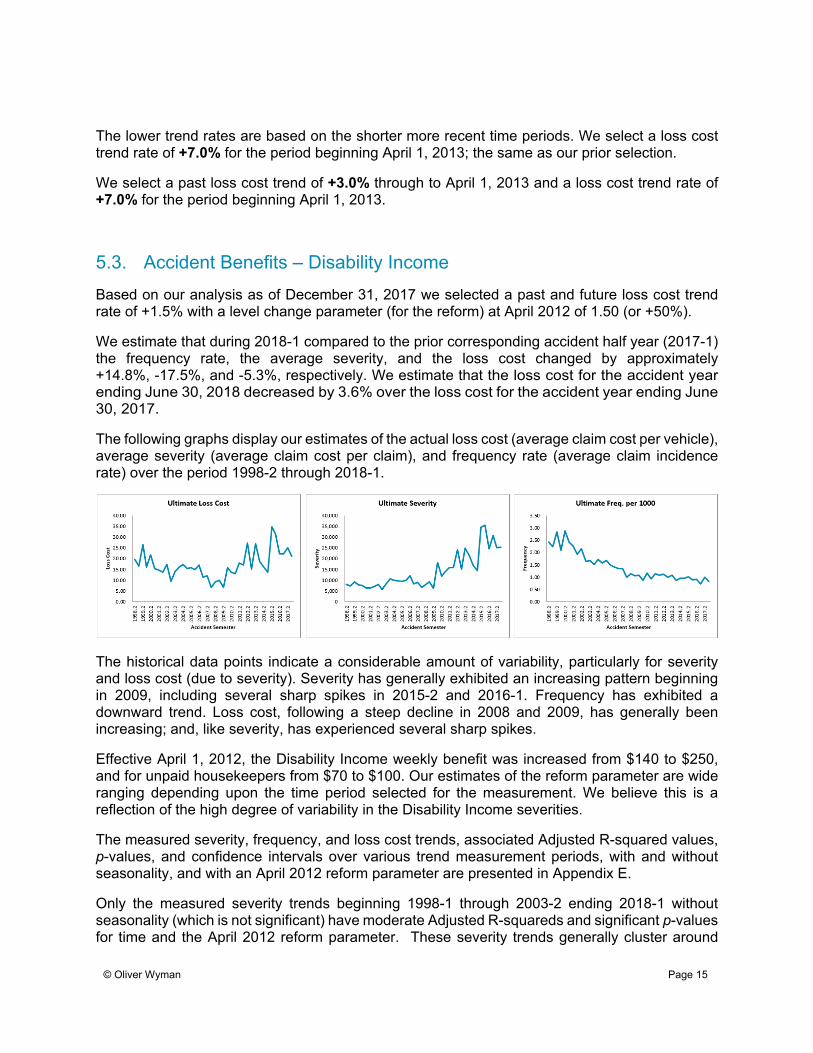
The following graphs display our estimates of the actual loss cost (average claim cost per vehicle), average severity (average claim cost per claim), and frequency rate (average claim incidence rate) over the period 1998-2 through 2018-1.
The historical data points indicate a considerable amount of variability, particularly for severity and loss cost (due to severity). Severity has generally exhibited an increasing pattern beginning in 2009, including several sharp spikes in 2015-2 and 2016-1. Frequency has exhibited a downward trend. Loss cost, following a steep decline in 2008 and 2009, has generally been increasing; and, like severity, has experienced several sharp spikes.
Effective April 1, 2012, the Disability Income weekly benefit was increased from $140 to $250, and for unpaid housekeepers from $70 to $100. Our estimates of the reform parameter are wide ranging depending upon the time period selected for the measurement. We believe this is a reflection of the high degree of variability in the Disability Income severities.
The measured severity, frequency, and loss cost trends, associated Adjusted R-squared values, p-values, and confidence intervals over various trend measurement periods, with and without seasonality, and with an April 2012 reform parameter are presented in Appendix E.
Only the measured severity trends beginning 1998-1 through 2003-2 ending 2018-1 without seasonality (which is not significant) have moderate Adjusted R-squareds and significant p-values for time and the April 2012 reform parameter. These severity trends generally cluster around
© Oliver Wyman
Page 16
+6% for the trends beginning 2000 to 2003. The associated reform parameter clusters around 1.5. The severity trend rates we measured over other time periods generally had low Adjusted R-squareds and/or insignificant p-values. We select a severity trend rate of +6.0%.
The measured frequency trends with seasonality (which is significant) over the same time periods we considered for severity generally range from approximately -4.5% to -6.0%, with high Adjusted R-squareds and significant p-values for time and seasonality. If an April 2012 reform parameter is included, the frequency trend rates are larger negatives, ranging from approximately -6.5% to -8% with high Adjusted R-squareds and significant p-values for time, seasonality and the reform. However, over the more recent time periods beginning 2012-2 and 2013-1 ending 2018-1, the measured frequency trend is approximately -4.0%, with moderate Adjusted R-squareds and significant p-values for time and seasonality. We note that the majority of the experience that will be considered in upcoming rate applications will be after the April 2012 reforms. We select a frequency trend of -4.0%.
Given the variability in the data around what appears to be an increasing pattern, we suggest it supports a small but positive loss cost trend rate. As a result, with a selected severity trend rate of +6.0% and frequency trend rate of -4.0%, we select a past loss cost trend rate of +2.0%13 (rounded), with a level change parameter at April 2012 of 1.5.
As we see no clear statistical evidence of a recent change in trend pattern, we select a future loss cost trend of +2.0%, a half-point increase from our prior selection.
5.4. Accident Benefits – Medical/Rehab
Based on data as of December 31, 2017, we selected a past and future loss cost trend rate of +6.5%.
We estimate that during 2018-1 compared to the prior corresponding accident half year (2017-1) the frequency rate, the average severity, and the loss cost changed by approximately -3.8%, +5.2%, and +1.2%, respectively. We estimate that the loss cost for the accident year ending June 30, 2018 decreased by 2.8% over the loss cost for the accident year ending June 30, 2017.
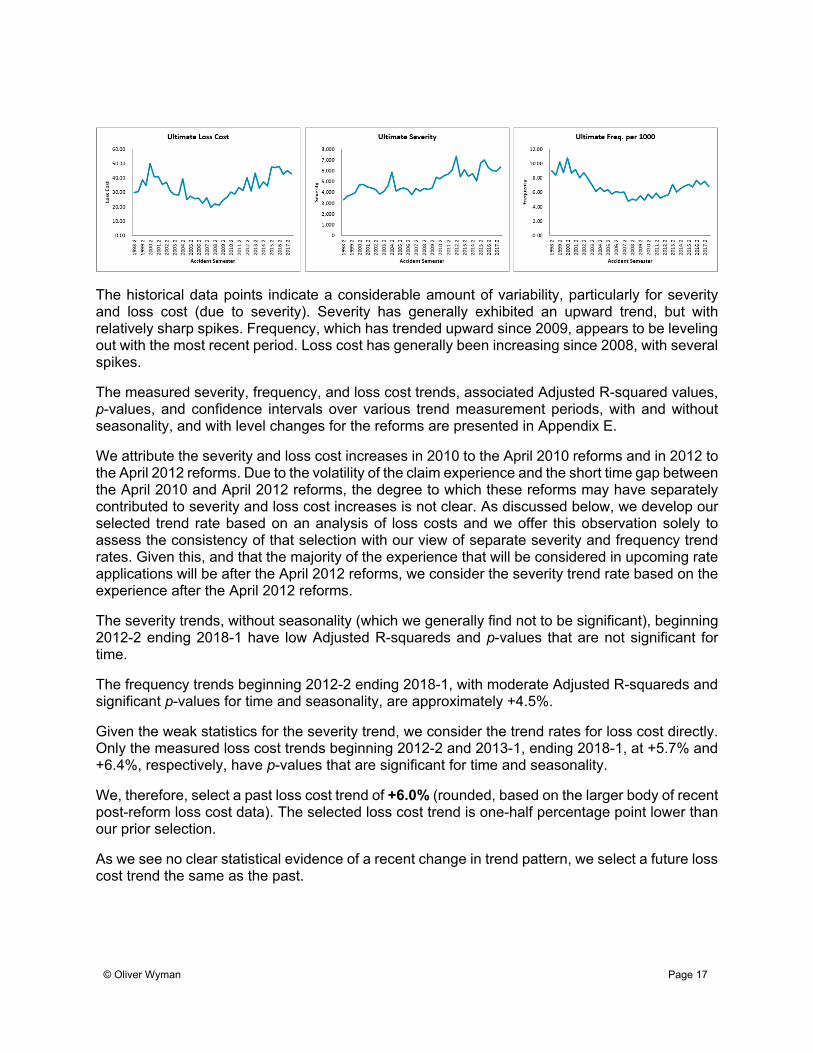
The following graphs display our estimates of the actual loss cost (average claim cost per vehicle), average severity (average claim cost per claim), and frequency rate (average claim incidence rate) over the period 1998-2 through 2018-1.
13 Our estimate of the loss cost for 2017 is higher than in our prior review, and this contributes to our selection of a
higher trend rate than in our prior review.
© Oliver Wyman
Page 17
The historical data points indicate a considerable amount of variability, particularly for severity and loss cost (due to severity). Severity has generally exhibited an upward trend, but with relatively sharp spikes. Frequency, which has trended upward since 2009, appears to be leveling out with the most recent period. Loss cost has generally been increasing since 2008, with several spikes.
The measured severity, frequency, and loss cost trends, associated Adjusted R-squared values, p-values, and confidence intervals over various trend measurement periods, with and without seasonality, and with level changes for the reforms are presented in Appendix E.
We attribute the severity and loss cost increases in 2010 to the April 2010 reforms and in 2012 to the April 2012 reforms. Due to the volatility of the claim experience and the short time gap between the April 2010 and April 2012 reforms, the degree to which these reforms may have separately contributed to severity and loss cost increases is not clear. As discussed below, we develop our selected trend rate based on an analysis of loss costs and we offer this observation solely to assess the consistency of that selection with our view of separate severity and frequency trend rates. Given this, and that the majority of the experience that will be considered in upcoming rate applications will be after the April 2012 reforms, we consider the severity trend rate based on the experience after the April 2012 reforms.
The severity trends, without seasonality (which we generally find not to be significant), beginning 2012-2 ending 2018-1 have low Adjusted R-squareds and p-values that are not significant for time.
The frequency trends beginning 2012-2 ending 2018-1, with moderate Adjusted R-squareds and significant p-values for time and seasonality, are approximately +4.5%.
Given the weak statistics for the severity trend, we consider the trend rates for loss cost directly. Only the measured loss cost trends beginning 2012-2 and 2013-1, ending 2018-1, at +5.7% and +6.4%, respectively, have p-values that are significant for time and seasonality.
We, therefore, select a past loss cost trend of +6.0% (rounded, based on the larger body of recent post-reform loss cost data). The selected loss cost trend is one-half percentage point lower than our prior selection.
As we see no clear statistical evidence of a recent change in trend pattern, we select a future loss cost trend the same as the past.
© Oliver Wyman
Page 18
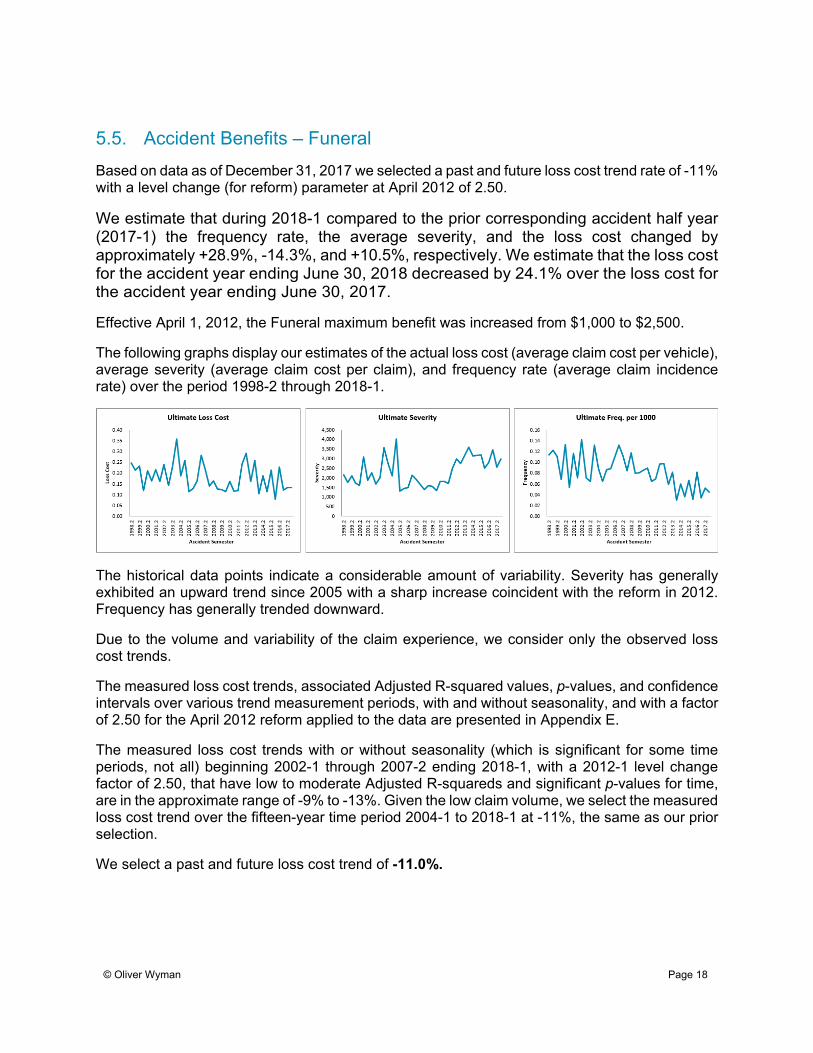
5.5. Accident Benefits – Funeral
Based on data as of December 31, 2017 we selected a past and future loss cost trend rate of -11% with a level change (for reform) parameter at April 2012 of 2.50.
We estimate that during 2018-1 compared to the prior corresponding accident half year (2017-1) the frequency rate, the average severity, and the loss cost changed by approximately +28.9%, -14.3%, and +10.5%, respectively. We estimate that the loss cost for the accident year ending June 30, 2018 decreased by 24.1% over the loss cost for the accident year ending June 30, 2017.
Effective April 1, 2012, the Funeral maximum benefit was increased from $1,000 to $2,500.
The following graphs display our estimates of the actual loss cost (average claim cost per vehicle), average severity (average claim cost per claim), and frequency rate (average claim incidence rate) over the period 1998-2 through 2018-1.
The historical data points indicate a considerable amount of variability. Severity has generally exhibited an upward trend since 2005 with a sharp increase coincident with the reform in 2012. Frequency has generally trended downward.
Due to the volume and variability of the claim experience, we consider only the observed loss cost trends.
The measured loss cost trends, associated Adjusted R-squared values, p-values, and confidence intervals over various trend measurement periods, with and without seasonality, and with a factor of 2.50 for the April 2012 reform applied to the data are presented in Appendix E.
The measured loss cost trends with or without seasonality (which is significant for some time periods, not all) beginning 2002-1 through 2007-2 ending 2018-1, with a 2012-1 level change factor of 2.50, that have low to moderate Adjusted R-squareds and significant p-values for time, are in the approximate range of -9% to -13%. Given the low claim volume, we select the measured loss cost trend over the fifteen-year time period 2004-1 to 2018-1 at -11%, the same as our prior selection.
We select a past and future loss cost trend of -11.0%.
© Oliver Wyman
Page 19
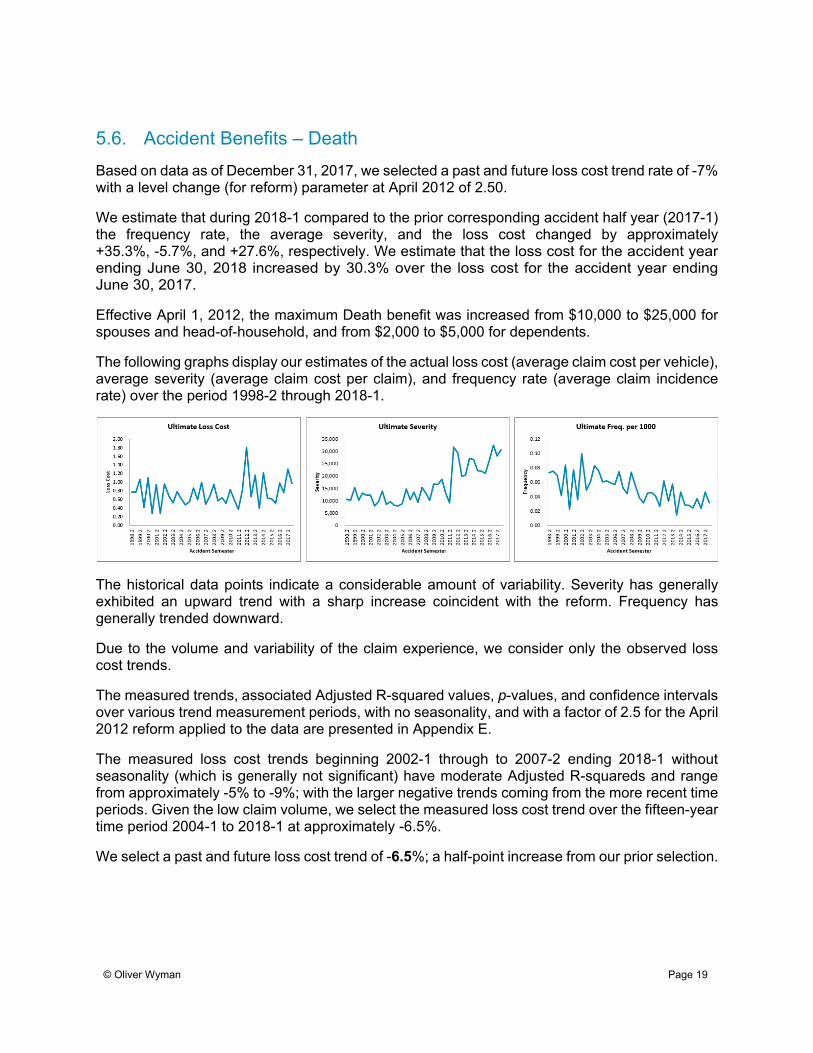
5.6. Accident Benefits – Death
Based on data as of December 31, 2017, we selected a past and future loss cost trend rate of -7% with a level change (for reform) parameter at April 2012 of 2.50.
We estimate that during 2018-1 compared to the prior corresponding accident half year (2017-1) the frequency rate, the average severity, and the loss cost changed by approximately +35.3%, -5.7%, and +27.6%, respectively. We estimate that the loss cost for the accident year ending June 30, 2018 increased by 30.3% over the loss cost for the accident year ending June 30, 2017.
Effective April 1, 2012, the maximum Death benefit was increased from $10,000 to $25,000 for spouses and head-of-household, and from $2,000 to $5,000 for dependents.
The following graphs display our estimates of the actual loss cost (average claim cost per vehicle), average severity (average claim cost per claim), and frequency rate (average claim incidence rate) over the period 1998-2 through 2018-1.
The historical data points indicate a considerable amount of variability. Severity has generally exhibited an upward trend with a sharp increase coincident with the reform. Frequency has generally trended downward.
Due to the volume and variability of the claim experience, we consider only the observed loss cost trends.
The measured trends, associated Adjusted R-squared values, p-values, and confidence intervals over various trend measurement periods, with no seasonality, and with a factor of 2.5 for the April 2012 reform applied to the data are presented in Appendix E.
The measured loss cost trends beginning 2002-1 through to 2007-2 ending 2018-1 without seasonality (which is generally not significant) have moderate Adjusted R-squareds and range from approximately -5% to -9%; with the larger negative trends coming from the more recent time periods. Given the low claim volume, we select the measured loss cost trend over the fifteen-year time period 2004-1 to 2018-1 at approximately -6.5%.
We select a past and future loss cost trend of -6.5%; a half-point increase from our prior selection.
© Oliver Wyman
Page 20
5.7. Accident Benefits –Total
Based on our review of the trends for the Accident Benefits subcoverages described above, we select an approximate a loss cost trend of +4.5% (rounded) for this coverage; this is the same as our prior selection.
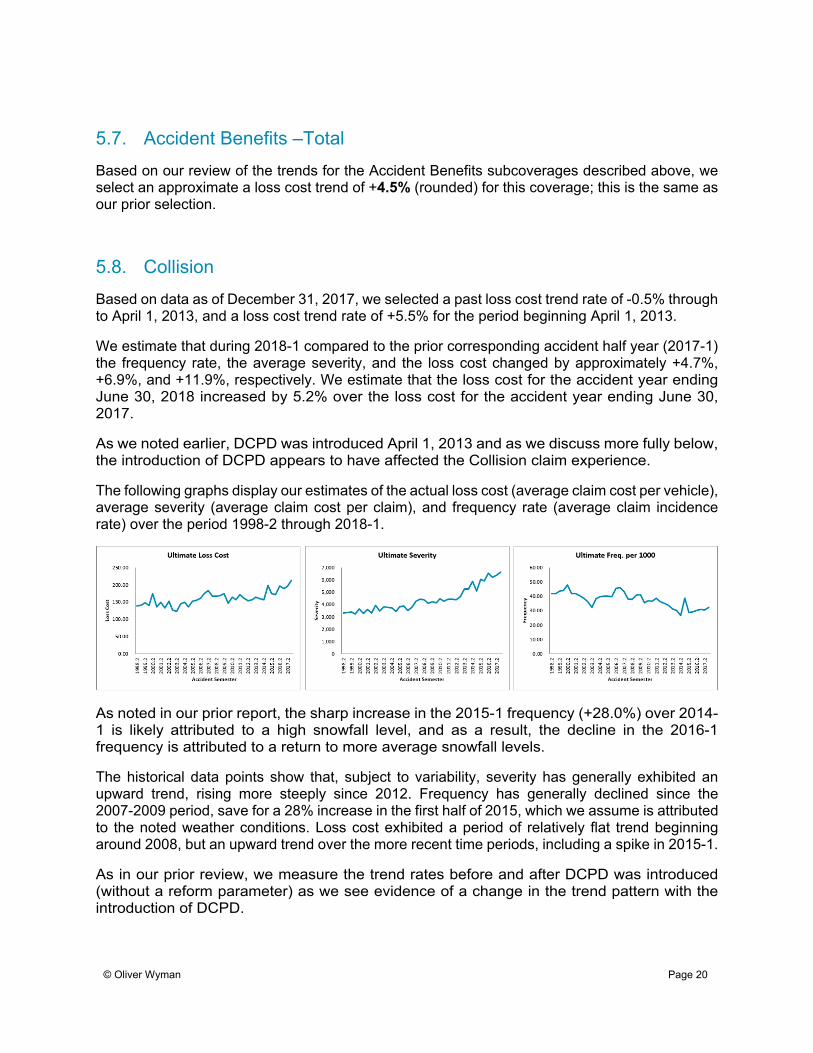
5.8. Collision
Based on data as of December 31, 2017, we selected a past loss cost trend rate of -0.5% through to April 1, 2013, and a loss cost trend rate of +5.5% for the period beginning April 1, 2013.
We estimate that during 2018-1 compared to the prior corresponding accident half year (2017-1) the frequency rate, the average severity, and the loss cost changed by approximately +4.7%, +6.9%, and +11.9%, respectively. We estimate that the loss cost for the accident year ending June 30, 2018 increased by 5.2% over the loss cost for the accident year ending June 30, 2017.
As we noted earlier, DCPD was introduced April 1, 2013 and as we discuss more fully below, the introduction of DCPD appears to have affected the Collision claim experience.
The following graphs display our estimates of the actual loss cost (average claim cost per vehicle), average severity (average claim cost per claim), and frequency rate (average claim incidence rate) over the period 1998-2 through 2018-1.
As noted in our prior report, the sharp increase in the 2015-1 frequency (+28.0%) over 2014-1 is likely attributed to a high snowfall level, and as a result, the decline in the 2016-1 frequency is attributed to a return to more average snowfall levels.
The historical data points show that, subject to variability, severity has generally exhibited an upward trend, rising more steeply since 2012. Frequency has generally declined since the 2007-2009 period, save for a 28% increase in the first half of 2015, which we assume is attributed to the noted weather conditions. Loss cost exhibited a period of relatively flat trend beginning around 2008, but an upward trend over the more recent time periods, including a spike in 2015-1.
As in our prior review, we measure the trend rates before and after DCPD was introduced (without a reform parameter) as we see evidence of a change in the trend pattern with the introduction of DCPD.
© Oliver Wyman
Page 21
The measured severity, frequency, and loss cost trends, associated Adjusted R-squared values, p-values, and confidence intervals over various trend measurement periods, with and without seasonality, and with and without the 2015-1 data point are presented in Appendix E.
The measured severity trends beginning 2002-1 through 2006-2 ending 2012-2, before DCPD was introduced, with significant p-values for time and moderate Adjusted R-squareds, cluster close to +2.5%.
The measured frequency trends beginning 2005-1 through 2007-2, ending 2012-2 before DCPD was introduced, have the highest moderate Adjusted R-squareds and significant p-values for time, and range from approximately -2.5% to -3.5%.
We select a loss cost trend rate of -0.5% (rounded; severity: +2.5%; frequency -3.0%) through to April 1, 2013, before DCPD was introduced.
As the measured frequency trends after DCPD was introduced generally have p-values for time that are not significant, we consider the loss cost trends where the statistical support is stronger (moderate Adjusted R-squareds and significant p-values).
The measured loss cost trends beginning 2013-2 to 2014-1, ending 2018-1, with and without 2015-1, with significant p-values for the time, are approximately +6.0% to +7.0%. These trends have relatively narrow confidence intervals compared to the (higher) measured trend beginning 2014-2 ending 2018-1. We select a loss cost trend of +6.0% for the time period after DCPD was introduced.
We, therefore, select a past loss cost trend of -0.5% through to April 1, 2013 and a past loss cost trend rate of +6.0% for the period beginning April 1, 2013; the same trend through April 1, 2013 and one-half point higher trend beginning April 1, 2013 than our prior selections.
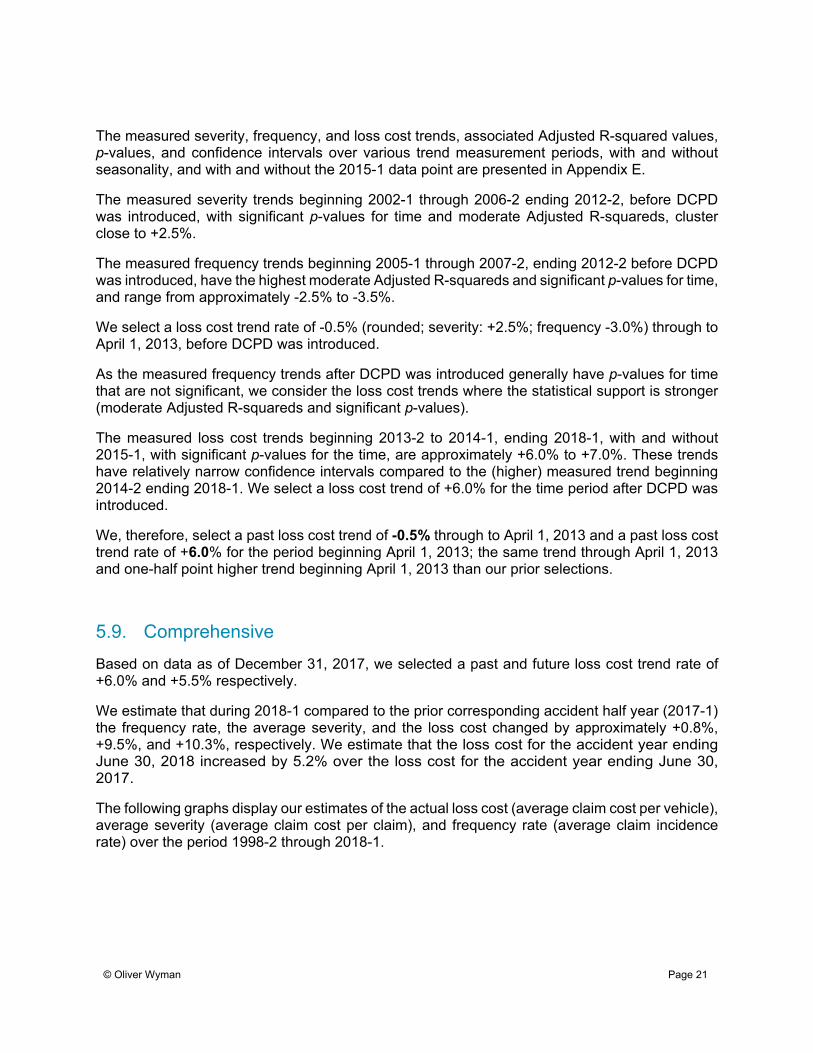
5.9. Comprehensive
Based on data as of December 31, 2017, we selected a past and future loss cost trend rate of +6.0% and +5.5% respectively.
We estimate that during 2018-1 compared to the prior corresponding accident half year (2017-1) the frequency rate, the average severity, and the loss cost changed by approximately +0.8%, +9.5%, and +10.3%, respectively. We estimate that the loss cost for the accident year ending June 30, 2018 increased by 5.2% over the loss cost for the accident year ending June 30, 2017.
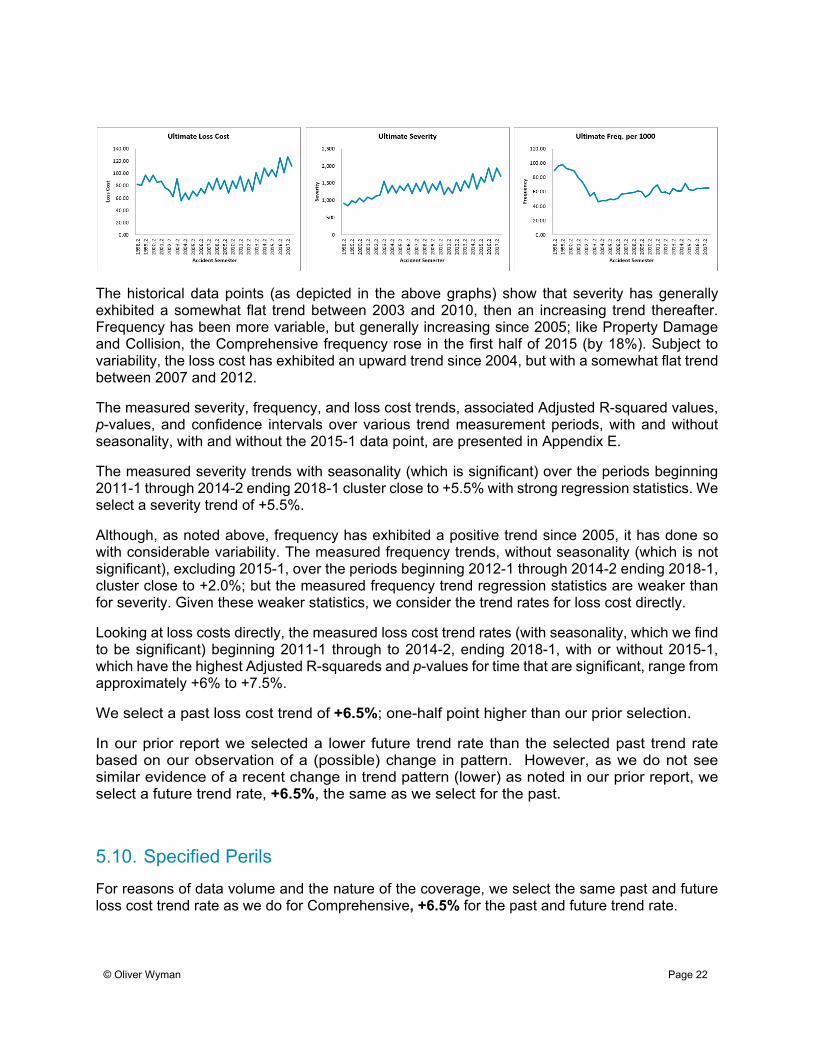
The following graphs display our estimates of the actual loss cost (average claim cost per vehicle), average severity (average claim cost per claim), and frequency rate (average claim incidence rate) over the period 1998-2 through 2018-1.
© Oliver Wyman
Page 22
The historical data points (as depicted in the above graphs) show that severity has generally exhibited a somewhat flat trend between 2003 and 2010, then an increasing trend thereafter. Frequency has been more variable, but generally increasing since 2005; like Property Damage and Collision, the Comprehensive frequency rose in the first half of 2015 (by 18%). Subject to variability, the loss cost has exhibited an upward trend since 2004, but with a somewhat flat trend between 2007 and 2012.
The measured severity, frequency, and loss cost trends, associated Adjusted R-squared values, p-values, and confidence intervals over various trend measurement periods, with and without seasonality, with and without the 2015-1 data point, are presented in Appendix E.
The measured severity trends with seasonality (which is significant) over the periods beginning 2011-1 through 2014-2 ending 2018-1 cluster close to +5.5% with strong regression statistics. We select a severity trend of +5.5%.
Although, as noted above, frequency has exhibited a positive trend since 2005, it has done so with considerable variability. The measured frequency trends, without seasonality (which is not significant), excluding 2015-1, over the periods beginning 2012-1 through 2014-2 ending 2018-1, cluster close to +2.0%; but the measured frequency trend regression statistics are weaker than for severity. Given these weaker statistics, we consider the trend rates for loss cost directly.
Looking at loss costs directly, the measured loss cost trend rates (with seasonality, which we find to be significant) beginning 2011-1 through to 2014-2, ending 2018-1, with or without 2015-1, which have the highest Adjusted R-squareds and p-values for time that are significant, range from approximately +6% to +7.5%.
We select a past loss cost trend of +6.5%; one-half point higher than our prior selection.
In our prior report we selected a lower future trend rate than the selected past trend rate based on our observation of a (possible) change in pattern. However, as we do not see similar evidence of a recent change in trend pattern (lower) as noted in our prior report, we select a future trend rate, +6.5%, the same as we select for the past.
5.10. Specified Perils
For reasons of data volume and the nature of the coverage, we select the same past and future loss cost trend rate as we do for Comprehensive, +6.5% for the past and future trend rate.
© Oliver Wyman
Page 23
5.11. All Perils
Based on data as of December 31, 2017, we selected a past and future loss cost trend rate of +10.0%.
We estimate that during 2018-1 compared to the prior corresponding accident half year (2017-1) the frequency rate, the average severity, and the loss cost changed by approximately +7.4%, -2.6%, and +4.6%, respectively. We estimate that the loss cost for the accident year ending June 30, 2018 increased by 7.5% over the loss cost for the accident year ending June 30, 2017.
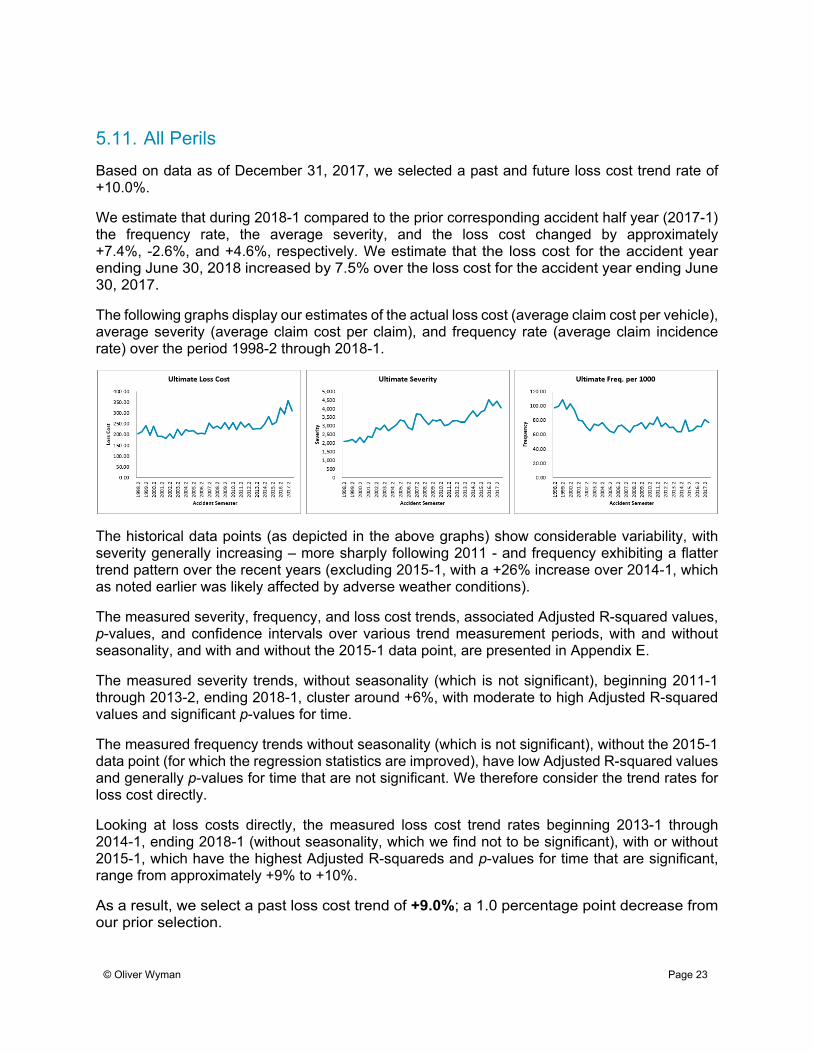
The following graphs display our estimates of the actual loss cost (average claim cost per vehicle), average severity (average claim cost per claim), and frequency rate (average claim incidence rate) over the period 1998-2 through 2018-1.
The historical data points (as depicted in the above graphs) show considerable variability, with severity generally increasing – more sharply following 2011 - and frequency exhibiting a flatter trend pattern over the recent years (excluding 2015-1, with a +26% increase over 2014-1, which as noted earlier was likely affected by adverse weather conditions).
The measured severity, frequency, and loss cost trends, associated Adjusted R-squared values, p-values, and confidence intervals over various trend measurement periods, with and without seasonality, and with and without the 2015-1 data point, are presented in Appendix E.
The measured severity trends, without seasonality (which is not significant), beginning 2011-1 through 2013-2, ending 2018-1, cluster around +6%, with moderate to high Adjusted R-squared values and significant p-values for time.
The measured frequency trends without seasonality (which is not significant), without the 2015-1 data point (for which the regression statistics are improved), have low Adjusted R-squared values and generally p-values for time that are not significant. We therefore consider the trend rates for loss cost directly.
Looking at loss costs directly, the measured loss cost trend rates beginning 2013-1 through 2014-1, ending 2018-1 (without seasonality, which we find not to be significant), with or without 2015-1, which have the highest Adjusted R-squareds and p-values for time that are significant, range from approximately +9% to +10%.
As a result, we select a past loss cost trend of +9.0%; a 1.0 percentage point decrease from our prior selection.
© Oliver Wyman
Page 24
5.12. Underinsured Motorist
For reasons of data volume and the nature of the coverage, we select as the past loss cost trend rate, the severity trend rate of +6% that approximately underlies our selected Bodily Injury severity trend rate. We also apply this selection to future loss cost trend.
5.13. Uninsured Auto
Based on data as of December 31, 2017, we selected a past and future loss cost trend rate of +7.5%.
We estimate that during 2018-1 compared to the prior corresponding accident half year (2017-1) the frequency rate, the average severity, and the loss cost changed by approximately -6.4%, -34.8%, and -39.0%, respectively. We estimate that the loss cost for the accident year ending June 30, 2018 decreased by 8.4% over the loss cost for the accident year ending June 30, 2017. While these increases and decreases could be viewed as an indication of the inherent variability in the Uninsured Auto claim experience (due to the low claim volume), it must also be noted that the degree of uncertainty surrounding the recent accident half year estimates is quite high.
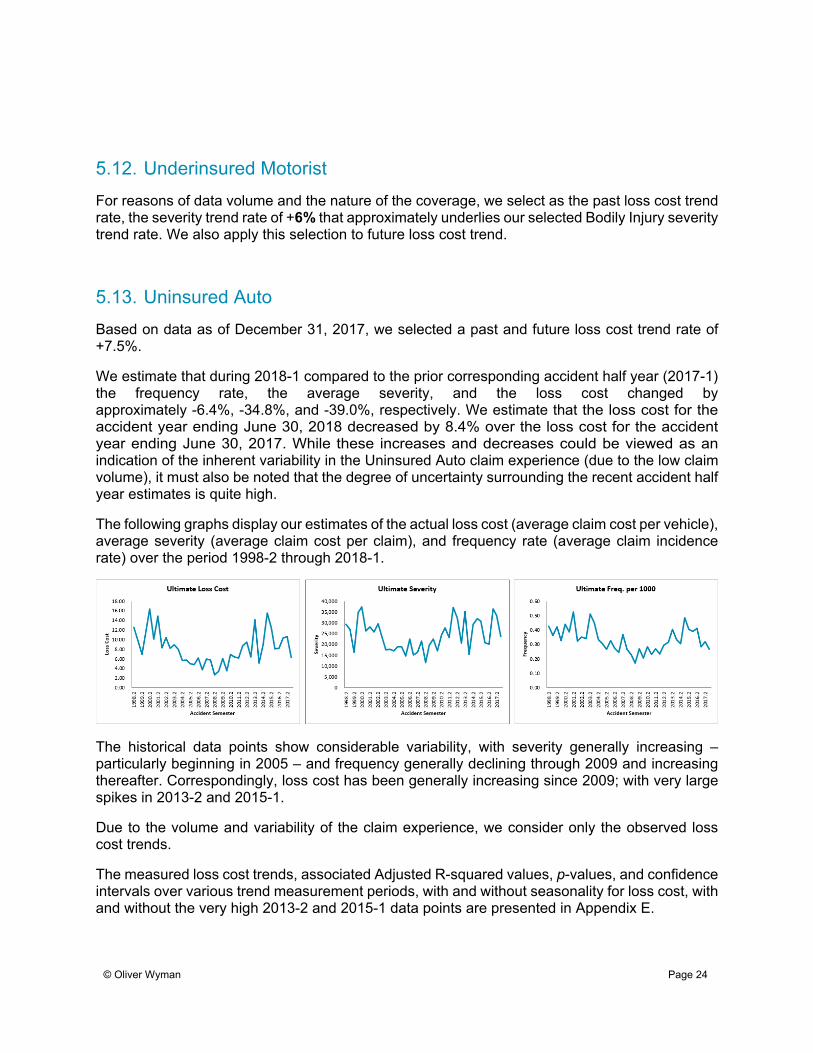
The following graphs display our estimates of the actual loss cost (average claim cost per vehicle), average severity (average claim cost per claim), and frequency rate (average claim incidence rate) over the period 1998-2 through 2018-1.
The historical data points show considerable variability, with severity generally increasing – particularly beginning in 2005 – and frequency generally declining through 2009 and increasing thereafter. Correspondingly, loss cost has been generally increasing since 2009; with very large spikes in 2013-2 and 2015-1.
Due to the volume and variability of the claim experience, we consider only the observed loss cost trends.
The measured loss cost trends, associated Adjusted R-squared values, p-values, and confidence intervals over various trend measurement periods, with and without seasonality for loss cost, with and without the very high 2013-2 and 2015-1 data points are presented in Appendix E.
© Oliver Wyman
Page 25
The measured loss cost trends, without seasonality (which is generally not significant) beginning 2006-1 through 2007-2, ending 2018-1, excluding the 2013-2 and 2015-1 data points, have the highest Adjusted R-squareds (which are low) and significant p-values for time. The measured trends range from +7% to +8.5%.
We select a past and future loss cost trend rate of +7.5%; the same as our prior selection.
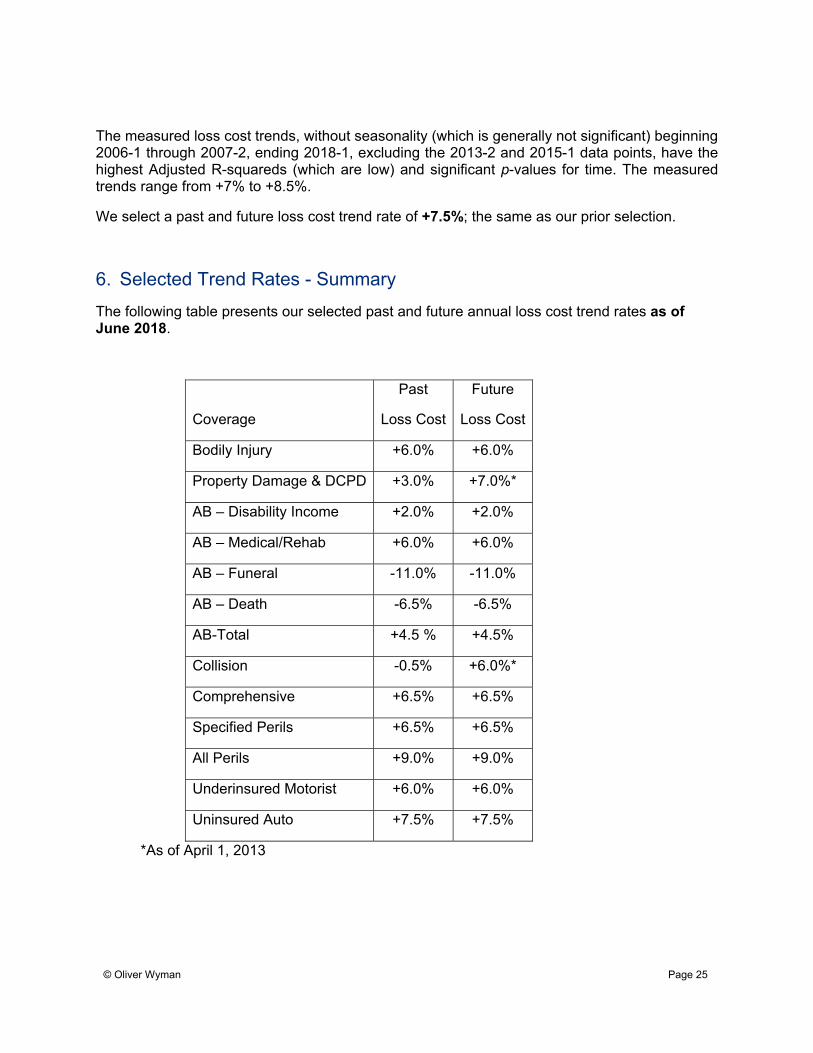
6. Selected Trend Rates - Summary
The following table presents our selected past and future annual loss cost trend rates as of June 2018.
Coverage
Past
Loss Cost
Future
Loss Cost
Bodily Injury +6.0% +6.0%
Property Damage & DCPD +3.0% +7.0%*
AB – Disability Income +2.0% +2.0%
AB – Medical/Rehab +6.0% +6.0%
AB – Funeral -11.0% -11.0%
AB – Death -6.5% -6.5%
AB-Total +4.5 % +4.5%
Collision -0.5% +6.0%*
Comprehensive +6.5% +6.5%
Specified Perils +6.5% +6.5%
All Perils +9.0% +9.0%
Underinsured Motorist +6.0% +6.0%
Uninsured Auto +7.5% +7.5%
*As of April 1, 2013
© Oliver Wyman
Page 26
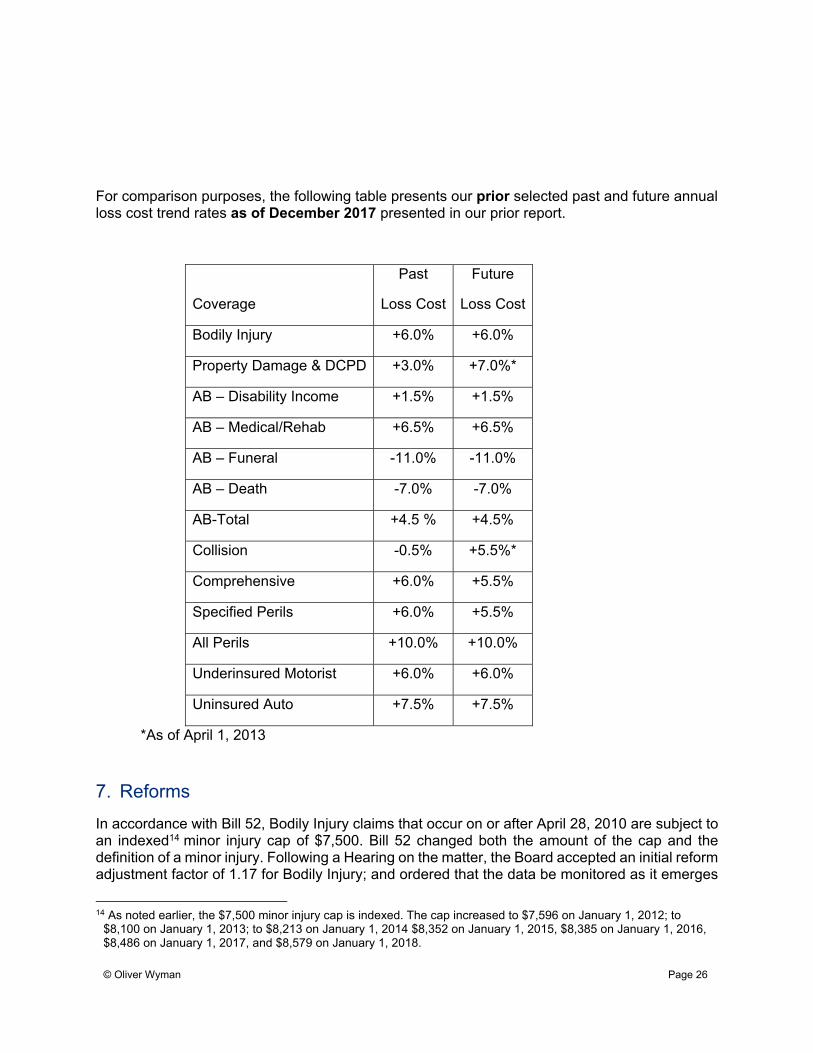
For comparison purposes, the following table presents our prior selected past and future annual loss cost trend rates as of December 2017 presented in our prior report.
Coverage
Past
Loss Cost
Future
Loss Cost
Bodily Injury +6.0% +6.0%
Property Damage & DCPD +3.0% +7.0%*
AB – Disability Income +1.5% +1.5%
AB – Medical/Rehab +6.5% +6.5%
AB – Funeral -11.0% -11.0%
AB – Death -7.0% -7.0%
AB-Total +4.5 % +4.5%
Collision -0.5% +5.5%*
Comprehensive +6.0% +5.5%
Specified Perils +6.0% +5.5%
All Perils +10.0% +10.0%
Underinsured Motorist +6.0% +6.0%
Uninsured Auto +7.5% +7.5%
*As of April 1, 2013
7. Reforms
In accordance with Bill 52, Bodily Injury claims that occur on or after April 28, 2010 are subject to an indexed14 minor injury cap of $7,500. Bill 52 changed both the amount of the cap and the definition of a minor injury. Following a Hearing on the matter, the Board accepted an initial reform adjustment factor of 1.17 for Bodily Injury; and ordered that the data be monitored as it emerges
14 As noted earlier, the $7,500 minor injury cap is indexed. The cap increased to $7,596 on January 1, 2012; to
$8,100 on January 1, 2013; to $8,213 on January 1, 2014 $8,352 on January 1, 2015, $8,385 on January 1, 2016, $8,486 on January 1, 2017, and $8,579 on January 1, 2018.
© Oliver Wyman
Page 27
so as to measure the change, if any, in the loss trend rate and the actual change in loss costs due to Bill 52.
We have reviewed the Industry Bodily Injury experience that has emerged since the Bill 52 reforms were introduced to determine if the initial reform factor of 1.17 should be amended.
We observe there to have been an increase in the severity level as a result of the introduction of Bill 52 in the first half of 2010. The measurement of the reform factor may change over time, depending upon the data included in the regression analysis. So as to avoid any distortion from the Bill 1 (2003-2) reforms, we calculate a reform factor for this change in the severity level based on the experience period beginning 2004-1. Including a parameter for seasonality, which we find to be significant, we measure a factor of 1.11 based on the time period 2004-1 to 2018-1 and 1.17 based on the time period 2004-1 to 2018-1 (excluding the 2010-2 data point and including seasonality), which exhibit the lowest p-values for the reform value.
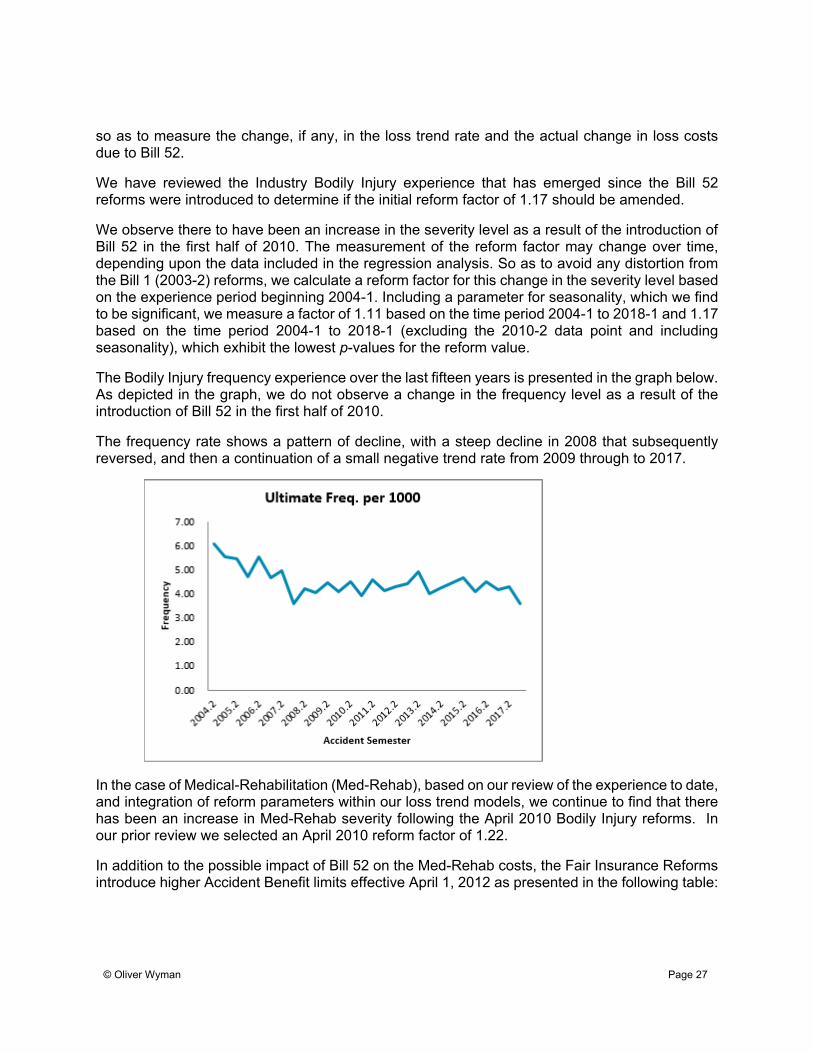
The Bodily Injury frequency experience over the last fifteen years is presented in the graph below. As depicted in the graph, we do not observe a change in the frequency level as a result of the introduction of Bill 52 in the first half of 2010.
The frequency rate shows a pattern of decline, with a steep decline in 2008 that subsequently reversed, and then a continuation of a small negative trend rate from 2009 through to 2017.
In the case of Medical-Rehabilitation (Med-Rehab), based on our review of the experience to date, and integration of reform parameters within our loss trend models, we continue to find that there has been an increase in Med-Rehab severity following the April 2010 Bodily Injury reforms. In our prior review we selected an April 2010 reform factor of 1.22.
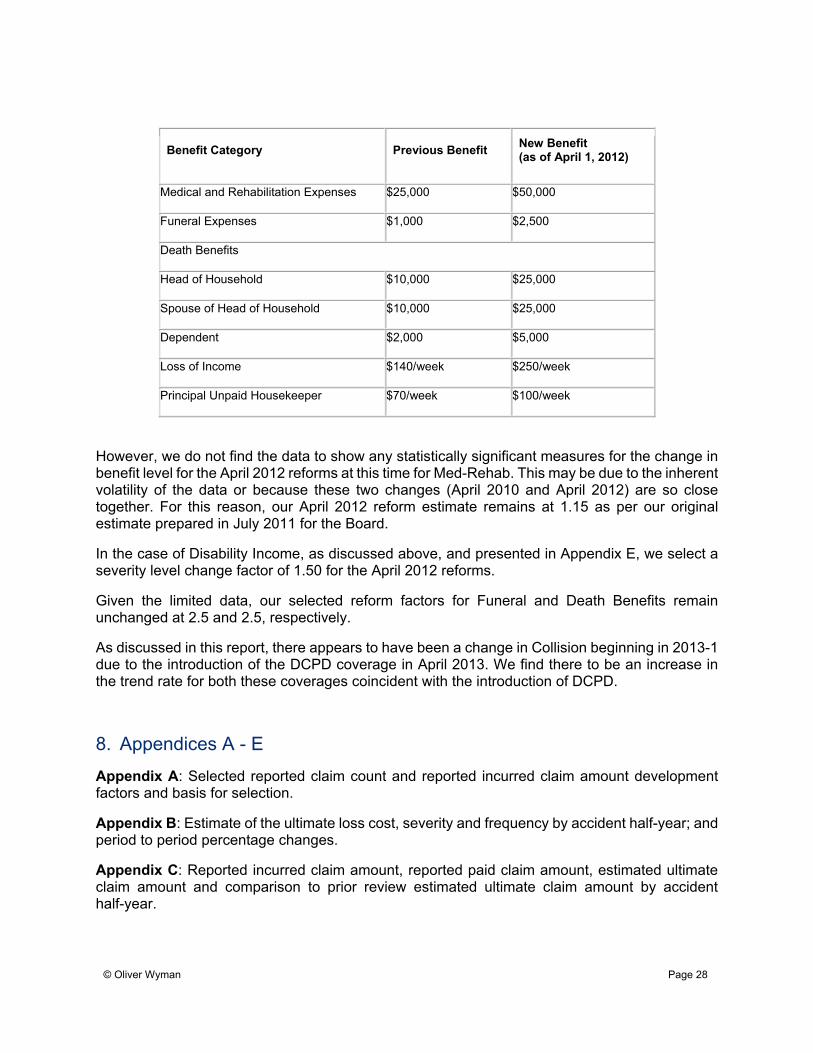
In addition to the possible impact of Bill 52 on the Med-Rehab costs, the Fair Insurance Reforms introduce higher Accident Benefit limits effective April 1, 2012 as presented in the following table:
© Oliver Wyman
Page 28
Benefit Category Previous Benefit New Benefit (as of April 1, 2012)
Medical and Rehabilitation Expenses $25,000 $50,000
Funeral Expenses $1,000 $2,500
Death Benefits
Head of Household $10,000 $25,000
Spouse of Head of Household $10,000 $25,000
Dependent $2,000 $5,000
Loss of Income $140/week $250/week
Principal Unpaid Housekeeper $70/week $100/week
However, we do not find the data to show any statistically significant measures for the change in benefit level for the April 2012 reforms at this time for Med-Rehab. This may be due to the inherent volatility of the data or because these two changes (April 2010 and April 2012) are so close together. For this reason, our April 2012 reform estimate remains at 1.15 as per our original estimate prepared in July 2011 for the Board.
In the case of Disability Income, as discussed above, and presented in Appendix E, we select a severity level change factor of 1.50 for the April 2012 reforms.
Given the limited data, our selected reform factors for Funeral and Death Benefits remain unchanged at 2.5 and 2.5, respectively.
As discussed in this report, there appears to have been a change in Collision beginning in 2013-1 due to the introduction of the DCPD coverage in April 2013. We find there to be an increase in the trend rate for both these coverages coincident with the introduction of DCPD.
8. Appendices A - E
Appendix A: Selected reported claim count and reported incurred claim amount development factors and basis for selection.
Appendix B: Estimate of the ultimate loss cost, severity and frequency by accident half-year; and period to period percentage changes.
Appendix C: Reported incurred claim amount, reported paid claim amount, estimated ultimate claim amount and comparison to prior review estimated ultimate claim amount by accident half-year.
© Oliver Wyman
Page 29
Appendix D: Reported incurred claim count, estimated ultimate claim count and comparison to prior review estimated claim count by accident half-year.
Appendix E: Summary of loss trend regression analysis which includes modeled trend results for various time periods; with and without a seasonality parameter; with and without certain data points; with and without certain level change parameters.
• Bodily Injury: Pages 1 to 8
• Property Damage & DCPD: Pages 9 to 14
• Accident Benefits- Disability Income: Pages 15 to 17
• Accident Benefits- Medical-Rehabilitation: Pages 18 to 23
• Accident Benefits- Funeral: Pages 24 to 25
• Accident Benefits- Death Benefits: Pages 26 to 27
• Collision: Pages 28 to 33
• Comprehensive: Pages 34 to 37
• All Perils: Pages 38 to 41
• Uninsured Auto: Pages 42 to 44
9. Considerations and Limitations
• For our review, we relied on data and information provided by GISA without independent audit. Though we have reviewed the data for reasonableness and consistency, we have not audited or otherwise verified this data. It should also be noted that our review of data may not always reveal imperfections. We have assumed that the data provided is both accurate and complete. The results of our analysis are dependent on this assumption. If this data or information is inaccurate or incomplete, our findings and conclusions may need to be revised.
• Our conclusions are based on an analysis of the GISA data and on the estimation of the outcome of many contingent events. Future costs were developed from the historical claim experience and covered exposure, with adjustments for anticipated changes. Our estimates make no provision for extraordinary future emergence of new classes of losses or types of losses not sufficiently represented in historical databases or which are not yet quantifiable.
• While this analysis complies with applicable Actuarial Standards of Practice and Statements of Principles, users of this analysis should recognize that our projections involve estimates of future events, and are subject to economic and statistical variations from expected values. We have not anticipated any extraordinary changes to the legal, social, or economic environment that might affect the frequency or severity of claims. For these reasons, no assurance can be given that the emergence of actual losses will correspond to the projections in this analysis.
© Oliver Wyman
Page 30
Paula Elliott, FCAS, FCIA Raj Sahasrabuddhe, FCAS, MAAA
Oliver Wyman Actuarial Consulting, Inc. (DE)
Oliver Wyman Three Logan Square 1717 Arch Street, Suite 1100 Philadelphia, PA 19103 Tel: 1 (215) 246-1000 Fax: 1 (215) 246-1399 www.oliverwyman.com
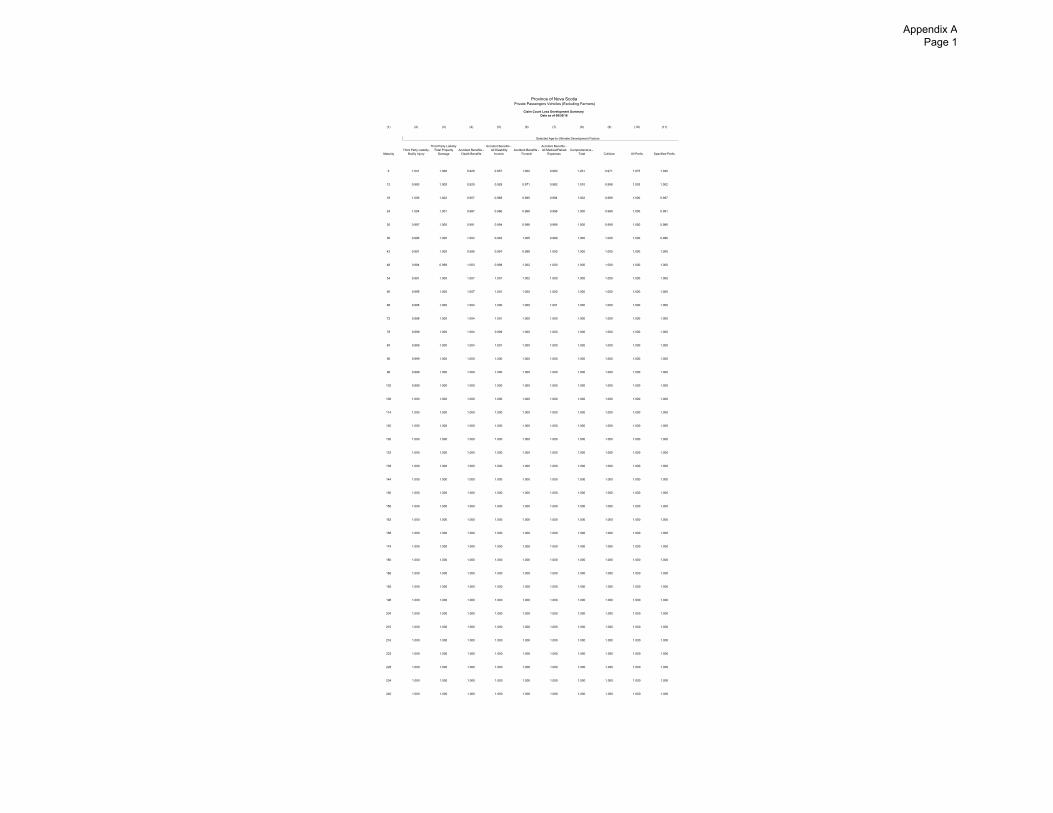
Province of Nova ScotiaPrivate Passengers Vehicles (Excluding Farmers)
Claim Count Loss Development SummaryData as of 06/30/18
(1) (2) (3) (4) (5) (6) (7) (8) (9) (10) (11)
Selected Age-to-Ultimate Development Factors
MaturityThird Party Liability -
Bodily Injury
Third Party Liability -Total Property
DamageAccident Benefits -
Death Benefits
Accident Benefits - All Disability
IncomeAccident Benefits -
Funeral
Accident Benefits - All Medical/Rehab
ExpensesComprehensive -
Total Collision All Perils Specified Perils
6 1.041 1.008 0.920 0.857 1.002 0.900 1.201 0.971 1.075 1.020
12 0.990 1.005 0.920 0.928 0.971 0.982 1.010 0.998 1.003 1.002
18 1.006 1.002 0.957 0.968 0.995 0.994 1.002 0.999 1.000 0.997
24 1.004 1.001 0.987 0.986 0.998 0.998 1.000 0.999 1.000 0.991
30 0.997 1.000 0.991 0.994 0.998 0.999 1.000 0.999 1.000 0.986
36 0.996 1.000 1.004 0.994 1.005 0.999 1.000 1.000 1.000 0.996
42 0.991 1.000 0.995 0.997 0.998 1.000 1.000 1.000 1.000 1.000
48 0.994 0.999 1.003 0.998 1.002 1.000 1.000 1.000 1.000 1.000
54 0.991 1.000 1.007 1.001 1.002 1.000 1.000 1.000 1.000 1.000
60 0.995 1.000 1.007 1.001 1.000 1.000 1.000 1.000 1.000 1.000
66 0.995 1.000 1.004 1.000 1.000 1.001 1.000 1.000 1.000 1.000
72 0.998 1.000 1.004 1.001 1.000 1.000 1.000 1.000 1.000 1.000
78 0.999 1.000 1.004 0.999 1.000 1.000 1.000 1.000 1.000 1.000
84 0.999 1.000 1.004 1.001 1.000 1.000 1.000 1.000 1.000 1.000
90 0.999 1.000 1.000 1.000 1.000 1.000 1.000 1.000 1.000 1.000
96 0.999 1.000 1.000 1.000 1.000 1.000 1.000 1.000 1.000 1.000
102 0.999 1.000 1.000 1.000 1.000 1.000 1.000 1.000 1.000 1.000
108 1.000 1.000 1.000 1.000 1.000 1.000 1.000 1.000 1.000 1.000
114 1.000 1.000 1.000 1.000 1.000 1.000 1.000 1.000 1.000 1.000
120 1.000 1.000 1.000 1.000 1.000 1.000 1.000 1.000 1.000 1.000
126 1.000 1.000 1.000 1.000 1.000 1.000 1.000 1.000 1.000 1.000
132 1.000 1.000 1.000 1.000 1.000 1.000 1.000 1.000 1.000 1.000
138 1.000 1.000 1.000 1.000 1.000 1.000 1.000 1.000 1.000 1.000
144 1.000 1.000 1.000 1.000 1.000 1.000 1.000 1.000 1.000 1.000
150 1.000 1.000 1.000 1.000 1.000 1.000 1.000 1.000 1.000 1.000
156 1.000 1.000 1.000 1.000 1.000 1.000 1.000 1.000 1.000 1.000
162 1.000 1.000 1.000 1.000 1.000 1.000 1.000 1.000 1.000 1.000
168 1.000 1.000 1.000 1.000 1.000 1.000 1.000 1.000 1.000 1.000
174 1.000 1.000 1.000 1.000 1.000 1.000 1.000 1.000 1.000 1.000
180 1.000 1.000 1.000 1.000 1.000 1.000 1.000 1.000 1.000 1.000
186 1.000 1.000 1.000 1.000 1.000 1.000 1.000 1.000 1.000 1.000
192 1.000 1.000 1.000 1.000 1.000 1.000 1.000 1.000 1.000 1.000
198 1.000 1.000 1.000 1.000 1.000 1.000 1.000 1.000 1.000 1.000
204 1.000 1.000 1.000 1.000 1.000 1.000 1.000 1.000 1.000 1.000
210 1.000 1.000 1.000 1.000 1.000 1.000 1.000 1.000 1.000 1.000
216 1.000 1.000 1.000 1.000 1.000 1.000 1.000 1.000 1.000 1.000
222 1.000 1.000 1.000 1.000 1.000 1.000 1.000 1.000 1.000 1.000
228 1.000 1.000 1.000 1.000 1.000 1.000 1.000 1.000 1.000 1.000
234 1.000 1.000 1.000 1.000 1.000 1.000 1.000 1.000 1.000 1.000
240 1.000 1.000 1.000 1.000 1.000 1.000 1.000 1.000 1.000 1.000
Appendix A Page 1
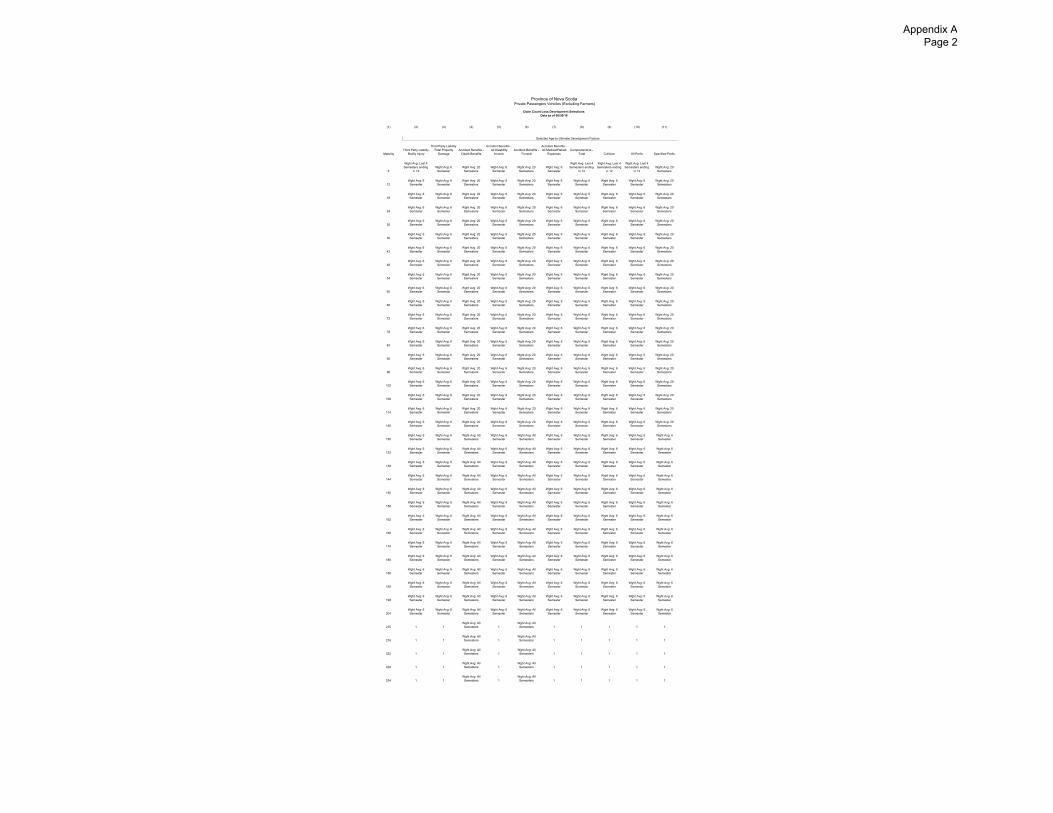
Province of Nova ScotiaPrivate Passengers Vehicles (Excluding Farmers)
Claim Count Loss Development SelectionsData as of 06/30/18
(1) (2) (3) (4) (5) (6) (7) (8) (9) (10) (11)
Selected Age-to-Ultimate Development Factors
MaturityThird Party Liability -
Bodily Injury
Third Party Liability -Total Property
DamageAccident Benefits -
Death Benefits
Accident Benefits - All Disability
IncomeAccident Benefits -
Funeral
Accident Benefits - All Medical/Rehab
ExpensesComprehensive -
Total Collision All Perils Specified Perils
6
Wght Avg: Last 4 Semesters ending
in 12Wght Avg: 6
SemesterWght Avg: 20
SemestersWght Avg: 6
SemesterWght Avg: 20
SemestersWght Avg: 6
Semester
Wght Avg: Last 4 Semesters ending
in 12
Wght Avg: Last 4 Semesters ending
in 12
Wght Avg: Last 4 Semesters ending
in 12Wght Avg: 20
Semesters
12Wght Avg: 6
SemesterWght Avg: 6
SemesterWght Avg: 20
SemestersWght Avg: 6
SemesterWght Avg: 20
SemestersWght Avg: 6
SemesterWght Avg: 6
SemesterWght Avg: 6
SemesterWght Avg: 6
SemesterWght Avg: 20
Semesters
18Wght Avg: 6
SemesterWght Avg: 6
SemesterWght Avg: 20
SemestersWght Avg: 6
SemesterWght Avg: 20
SemestersWght Avg: 6
SemesterWght Avg: 6
SemesterWght Avg: 6
SemesterWght Avg: 6
SemesterWght Avg: 20
Semesters
24Wght Avg: 6
SemesterWght Avg: 6
SemesterWght Avg: 20
SemestersWght Avg: 6
SemesterWght Avg: 20
SemestersWght Avg: 6
SemesterWght Avg: 6
SemesterWght Avg: 6
SemesterWght Avg: 6
SemesterWght Avg: 20
Semesters
30Wght Avg: 6
SemesterWght Avg: 6
SemesterWght Avg: 20
SemestersWght Avg: 6
SemesterWght Avg: 20
SemestersWght Avg: 6
SemesterWght Avg: 6
SemesterWght Avg: 6
SemesterWght Avg: 6
SemesterWght Avg: 20
Semesters
36Wght Avg: 6
SemesterWght Avg: 6
SemesterWght Avg: 20
SemestersWght Avg: 6
SemesterWght Avg: 20
SemestersWght Avg: 6
SemesterWght Avg: 6
SemesterWght Avg: 6
SemesterWght Avg: 6
SemesterWght Avg: 20
Semesters
42Wght Avg: 6
SemesterWght Avg: 6
SemesterWght Avg: 20
SemestersWght Avg: 6
SemesterWght Avg: 20
SemestersWght Avg: 6
SemesterWght Avg: 6
SemesterWght Avg: 6
SemesterWght Avg: 6
SemesterWght Avg: 20
Semesters
48Wght Avg: 6
SemesterWght Avg: 6
SemesterWght Avg: 20
SemestersWght Avg: 6
SemesterWght Avg: 20
SemestersWght Avg: 6
SemesterWght Avg: 6
SemesterWght Avg: 6
SemesterWght Avg: 6
SemesterWght Avg: 20
Semesters
54Wght Avg: 6
SemesterWght Avg: 6
SemesterWght Avg: 20
SemestersWght Avg: 6
SemesterWght Avg: 20
SemestersWght Avg: 6
SemesterWght Avg: 6
SemesterWght Avg: 6
SemesterWght Avg: 6
SemesterWght Avg: 20
Semesters
60Wght Avg: 6
SemesterWght Avg: 6
SemesterWght Avg: 20
SemestersWght Avg: 6
SemesterWght Avg: 20
SemestersWght Avg: 6
SemesterWght Avg: 6
SemesterWght Avg: 6
SemesterWght Avg: 6
SemesterWght Avg: 20
Semesters
66Wght Avg: 6
SemesterWght Avg: 6
SemesterWght Avg: 20
SemestersWght Avg: 6
SemesterWght Avg: 20
SemestersWght Avg: 6
SemesterWght Avg: 6
SemesterWght Avg: 6
SemesterWght Avg: 6
SemesterWght Avg: 20
Semesters
72Wght Avg: 6
SemesterWght Avg: 6
SemesterWght Avg: 20
SemestersWght Avg: 6
SemesterWght Avg: 20
SemestersWght Avg: 6
SemesterWght Avg: 6
SemesterWght Avg: 6
SemesterWght Avg: 6
SemesterWght Avg: 20
Semesters
78Wght Avg: 6
SemesterWght Avg: 6
SemesterWght Avg: 20
SemestersWght Avg: 6
SemesterWght Avg: 20
SemestersWght Avg: 6
SemesterWght Avg: 6
SemesterWght Avg: 6
SemesterWght Avg: 6
SemesterWght Avg: 20
Semesters
84Wght Avg: 6
SemesterWght Avg: 6
SemesterWght Avg: 20
SemestersWght Avg: 6
SemesterWght Avg: 20
SemestersWght Avg: 6
SemesterWght Avg: 6
SemesterWght Avg: 6
SemesterWght Avg: 6
SemesterWght Avg: 20
Semesters
90Wght Avg: 6
SemesterWght Avg: 6
SemesterWght Avg: 20
SemestersWght Avg: 6
SemesterWght Avg: 20
SemestersWght Avg: 6
SemesterWght Avg: 6
SemesterWght Avg: 6
SemesterWght Avg: 6
SemesterWght Avg: 20
Semesters
96Wght Avg: 6
SemesterWght Avg: 6
SemesterWght Avg: 20
SemestersWght Avg: 6
SemesterWght Avg: 20
SemestersWght Avg: 6
SemesterWght Avg: 6
SemesterWght Avg: 6
SemesterWght Avg: 6
SemesterWght Avg: 20
Semesters
102Wght Avg: 6
SemesterWght Avg: 6
SemesterWght Avg: 20
SemestersWght Avg: 6
SemesterWght Avg: 20
SemestersWght Avg: 6
SemesterWght Avg: 6
SemesterWght Avg: 6
SemesterWght Avg: 6
SemesterWght Avg: 20
Semesters
108Wght Avg: 6
SemesterWght Avg: 6
SemesterWght Avg: 20
SemestersWght Avg: 6
SemesterWght Avg: 20
SemestersWght Avg: 6
SemesterWght Avg: 6
SemesterWght Avg: 6
SemesterWght Avg: 6
SemesterWght Avg: 20
Semesters
114Wght Avg: 6
SemesterWght Avg: 6
SemesterWght Avg: 20
SemestersWght Avg: 6
SemesterWght Avg: 20
SemestersWght Avg: 6
SemesterWght Avg: 6
SemesterWght Avg: 6
SemesterWght Avg: 6
SemesterWght Avg: 20
Semesters
120Wght Avg: 6
SemesterWght Avg: 6
SemesterWght Avg: 20
SemestersWght Avg: 6
SemesterWght Avg: 20
SemestersWght Avg: 6
SemesterWght Avg: 6
SemesterWght Avg: 6
SemesterWght Avg: 6
SemesterWght Avg: 20
Semesters
126Wght Avg: 6
SemesterWght Avg: 6
SemesterWght Avg: All
SemestersWght Avg: 6
SemesterWght Avg: All
SemestersWght Avg: 6
SemesterWght Avg: 6
SemesterWght Avg: 6
SemesterWght Avg: 6
SemesterWght Avg: 6
Semester
132Wght Avg: 6
SemesterWght Avg: 6
SemesterWght Avg: All
SemestersWght Avg: 6
SemesterWght Avg: All
SemestersWght Avg: 6
SemesterWght Avg: 6
SemesterWght Avg: 6
SemesterWght Avg: 6
SemesterWght Avg: 6
Semester
138Wght Avg: 6
SemesterWght Avg: 6
SemesterWght Avg: All
SemestersWght Avg: 6
SemesterWght Avg: All
SemestersWght Avg: 6
SemesterWght Avg: 6
SemesterWght Avg: 6
SemesterWght Avg: 6
SemesterWght Avg: 6
Semester
144Wght Avg: 6
SemesterWght Avg: 6
SemesterWght Avg: All
SemestersWght Avg: 6
SemesterWght Avg: All
SemestersWght Avg: 6
SemesterWght Avg: 6
SemesterWght Avg: 6
SemesterWght Avg: 6
SemesterWght Avg: 6
Semester
150Wght Avg: 6
SemesterWght Avg: 6
SemesterWght Avg: All
SemestersWght Avg: 6
SemesterWght Avg: All
SemestersWght Avg: 6
SemesterWght Avg: 6
SemesterWght Avg: 6
SemesterWght Avg: 6
SemesterWght Avg: 6
Semester
156Wght Avg: 6
SemesterWght Avg: 6
SemesterWght Avg: All
SemestersWght Avg: 6
SemesterWght Avg: All
SemestersWght Avg: 6
SemesterWght Avg: 6
SemesterWght Avg: 6
SemesterWght Avg: 6
SemesterWght Avg: 6
Semester
162Wght Avg: 6
SemesterWght Avg: 6
SemesterWght Avg: All
SemestersWght Avg: 6
SemesterWght Avg: All
SemestersWght Avg: 6
SemesterWght Avg: 6
SemesterWght Avg: 6
SemesterWght Avg: 6
SemesterWght Avg: 6
Semester
168Wght Avg: 6
SemesterWght Avg: 6
SemesterWght Avg: All
SemestersWght Avg: 6
SemesterWght Avg: All
SemestersWght Avg: 6
SemesterWght Avg: 6
SemesterWght Avg: 6
SemesterWght Avg: 6
SemesterWght Avg: 6
Semester
174Wght Avg: 6
SemesterWght Avg: 6
SemesterWght Avg: All
SemestersWght Avg: 6
SemesterWght Avg: All
SemestersWght Avg: 6
SemesterWght Avg: 6
SemesterWght Avg: 6
SemesterWght Avg: 6
SemesterWght Avg: 6
Semester
180Wght Avg: 6
SemesterWght Avg: 6
SemesterWght Avg: All
SemestersWght Avg: 6
SemesterWght Avg: All
SemestersWght Avg: 6
SemesterWght Avg: 6
SemesterWght Avg: 6
SemesterWght Avg: 6
SemesterWght Avg: 6
Semester
186Wght Avg: 6
SemesterWght Avg: 6
SemesterWght Avg: All
SemestersWght Avg: 6
SemesterWght Avg: All
SemestersWght Avg: 6
SemesterWght Avg: 6
SemesterWght Avg: 6
SemesterWght Avg: 6
SemesterWght Avg: 6
Semester
192Wght Avg: 6
SemesterWght Avg: 6
SemesterWght Avg: All
SemestersWght Avg: 6
SemesterWght Avg: All
SemestersWght Avg: 6
SemesterWght Avg: 6
SemesterWght Avg: 6
SemesterWght Avg: 6
SemesterWght Avg: 6
Semester
198Wght Avg: 6
SemesterWght Avg: 6
SemesterWght Avg: All
SemestersWght Avg: 6
SemesterWght Avg: All
SemestersWght Avg: 6
SemesterWght Avg: 6
SemesterWght Avg: 6
SemesterWght Avg: 6
SemesterWght Avg: 6
Semester
204Wght Avg: 6
SemesterWght Avg: 6
SemesterWght Avg: All
SemestersWght Avg: 6
SemesterWght Avg: All
SemestersWght Avg: 6
SemesterWght Avg: 6
SemesterWght Avg: 6
SemesterWght Avg: 6
SemesterWght Avg: 6
Semester
210 1 1Wght Avg: All
Semesters 1Wght Avg: All
Semesters 1 1 1 1 1
216 1 1Wght Avg: All
Semesters 1Wght Avg: All
Semesters 1 1 1 1 1
222 1 1Wght Avg: All
Semesters 1Wght Avg: All
Semesters 1 1 1 1 1
228 1 1Wght Avg: All
Semesters 1Wght Avg: All
Semesters 1 1 1 1 1
234 1 1Wght Avg: All
Semesters 1Wght Avg: All
Semesters 1 1 1 1 1
Appendix A Page 2
Province of Nova ScotiaPrivate Passengers Vehicles (Excluding Farmers)
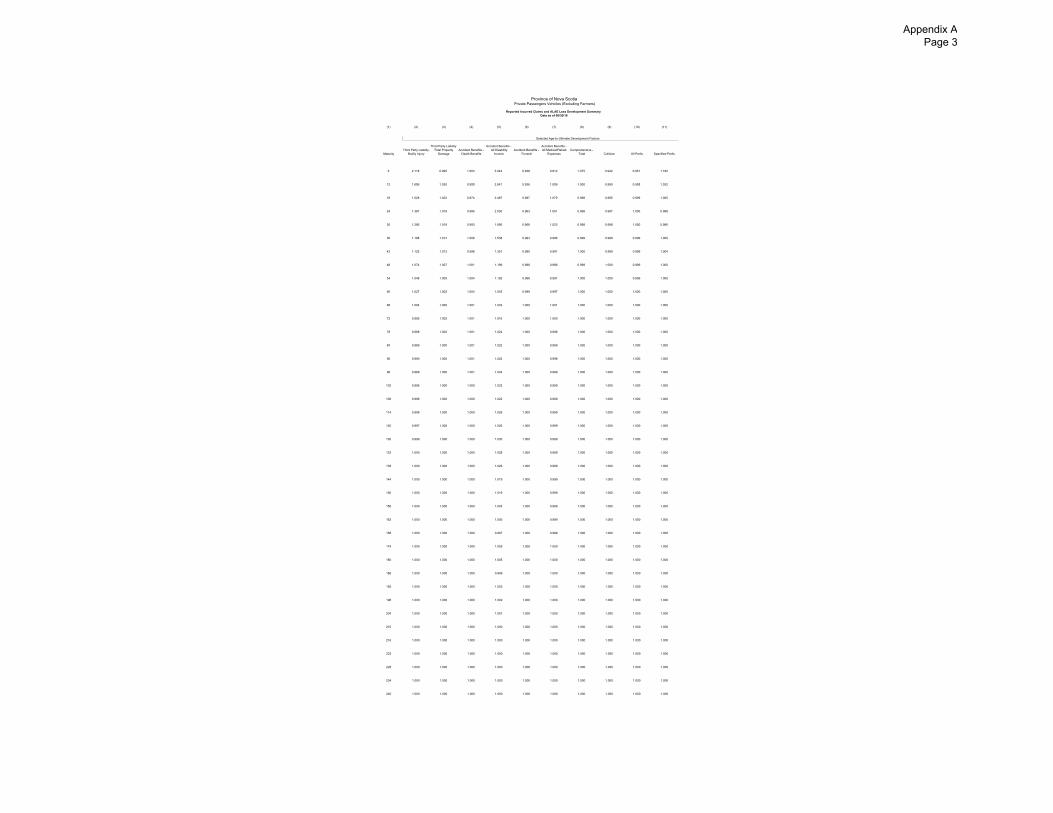
Reported Incurred Claims and ALAE Loss Development SummaryData as of 06/30/18
(1) (2) (3) (4) (5) (6) (7) (8) (9) (10) (11)
Selected Age-to-Ultimate Development Factors
MaturityThird Party Liability -
Bodily Injury
Third Party Liability -Total Property
DamageAccident Benefits -
Death Benefits
Accident Benefits - All Disability
IncomeAccident Benefits -
Funeral
Accident Benefits - All Medical/Rehab
ExpensesComprehensive -
Total Collision All Perils Specified Perils
6 2.118 0.995 1.003 3.044 0.938 0.812 1.075 0.942 0.951 1.182
12 1.656 1.030 0.955 2.841 0.936 1.059 1.000 0.990 0.995 1.032
18 1.528 1.023 0.974 2.487 0.987 1.079 0.998 0.995 0.999 1.005
24 1.387 1.019 0.995 2.030 0.983 1.051 0.998 0.997 1.000 0.998
30 1.286 1.019 0.993 1.690 0.968 1.023 0.998 0.998 1.000 0.996
36 1.188 1.014 1.006 1.538 0.994 0.996 0.999 0.999 0.999 1.000
42 1.125 1.013 0.998 1.351 0.990 0.991 1.000 0.999 0.999 1.004
48 1.074 1.007 1.001 1.199 0.998 0.988 0.999 1.000 0.999 1.000
54 1.048 1.005 1.004 1.126 0.998 0.991 1.000 1.000 0.999 1.000
60 1.027 1.002 1.004 1.045 0.999 0.997 1.000 1.000 1.000 1.000
66 1.004 1.000 1.001 1.033 1.000 1.001 1.000 1.000 1.000 1.000
72 0.995 1.002 1.001 1.016 1.000 1.000 1.000 1.000 1.000 1.000
78 0.988 1.002 1.001 1.024 1.000 0.998 1.000 1.000 1.000 1.000
84 0.989 1.000 1.001 1.022 1.000 0.999 1.000 1.000 1.000 1.000
90 0.990 1.000 1.001 1.022 1.000 0.998 1.000 1.000 1.000 1.000
96 0.989 1.000 1.001 1.034 1.000 0.999 1.000 1.000 1.000 1.000
102 0.996 1.000 1.000 1.033 1.000 0.999 1.000 1.000 1.000 1.000
108 0.998 1.000 1.000 1.022 1.000 0.999 1.000 1.000 1.000 1.000
114 0.998 1.000 1.000 1.026 1.000 0.999 1.000 1.000 1.000 1.000
120 0.997 1.000 1.000 1.026 1.000 0.999 1.000 1.000 1.000 1.000
126 0.999 1.000 1.000 1.030 1.000 0.999 1.000 1.000 1.000 1.000
132 1.000 1.000 1.000 1.028 1.000 0.999 1.000 1.000 1.000 1.000
138 1.000 1.000 1.000 1.026 1.000 0.999 1.000 1.000 1.000 1.000
144 1.000 1.000 1.000 1.019 1.000 0.999 1.000 1.000 1.000 1.000
150 1.000 1.000 1.000 1.019 1.000 0.999 1.000 1.000 1.000 1.000
156 1.000 1.000 1.000 1.004 1.000 0.999 1.000 1.000 1.000 1.000
162 1.000 1.000 1.000 1.000 1.000 0.999 1.000 1.000 1.000 1.000
168 1.000 1.000 1.000 0.997 1.000 0.999 1.000 1.000 1.000 1.000
174 1.000 1.000 1.000 1.005 1.000 1.000 1.000 1.000 1.000 1.000
180 1.000 1.000 1.000 1.005 1.000 1.000 1.000 1.000 1.000 1.000
186 1.000 1.000 1.000 0.999 1.000 1.000 1.000 1.000 1.000 1.000
192 1.000 1.000 1.000 1.003 1.000 1.000 1.000 1.000 1.000 1.000
198 1.000 1.000 1.000 1.002 1.000 1.000 1.000 1.000 1.000 1.000
204 1.000 1.000 1.000 1.001 1.000 1.000 1.000 1.000 1.000 1.000
210 1.000 1.000 1.000 1.000 1.000 1.000 1.000 1.000 1.000 1.000
216 1.000 1.000 1.000 1.000 1.000 1.000 1.000 1.000 1.000 1.000
222 1.000 1.000 1.000 1.000 1.000 1.000 1.000 1.000 1.000 1.000
228 1.000 1.000 1.000 1.000 1.000 1.000 1.000 1.000 1.000 1.000
234 1.000 1.000 1.000 1.000 1.000 1.000 1.000 1.000 1.000 1.000
240 1.000 1.000 1.000 1.000 1.000 1.000 1.000 1.000 1.000 1.000
Appendix A Page 3
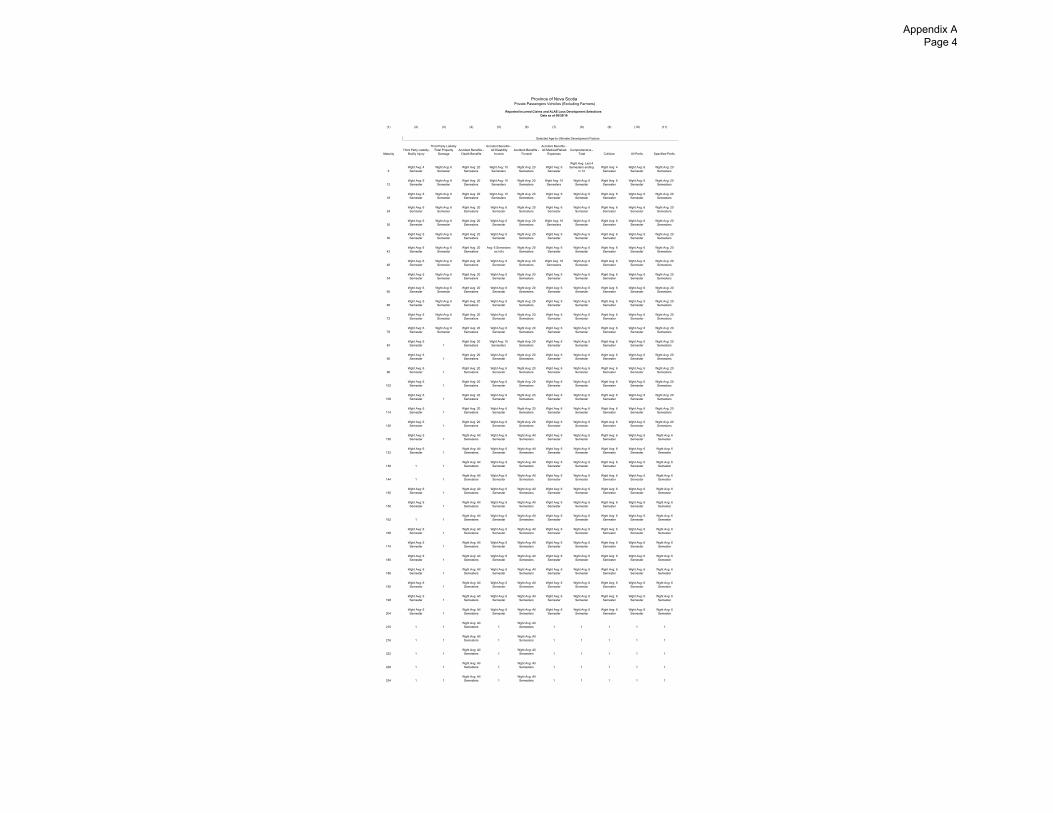
Province of Nova ScotiaPrivate Passengers Vehicles (Excluding Farmers)
Reported Incurred Claims and ALAE Loss Development SelectionsData as of 06/30/18
(1) (2) (3) (4) (5) (6) (7) (8) (9) (10) (11)
Selected Age-to-Ultimate Development Factors
MaturityThird Party Liability -
Bodily Injury
Third Party Liability -Total Property
DamageAccident Benefits -
Death Benefits
Accident Benefits - All Disability
IncomeAccident Benefits -
Funeral
Accident Benefits - All Medical/Rehab
ExpensesComprehensive -
Total Collision All Perils Specified Perils
6Wght Avg: 4
SemesterWght Avg: 6
SemesterWght Avg: 20
SemestersWght Avg: 10
SemestersWght Avg: 20
SemestersWght Avg: 6
Semester
Wght Avg: Last 4 Semesters ending
in 12Wght Avg: 4
SemesterWght Avg: 6
SemesterWght Avg: 20
Semesters
12Wght Avg: 6
SemesterWght Avg: 6
SemesterWght Avg: 20
SemestersWght Avg: 10
SemestersWght Avg: 20
SemestersWght Avg: 10
SemestersWght Avg: 6
SemesterWght Avg: 6
SemesterWght Avg: 6
SemesterWght Avg: 20
Semesters
18Wght Avg: 6
SemesterWght Avg: 6
SemesterWght Avg: 20
SemestersWght Avg: 10
SemestersWght Avg: 20
SemestersWght Avg: 6
SemesterWght Avg: 6
SemesterWght Avg: 6
SemesterWght Avg: 6
SemesterWght Avg: 20
Semesters
24Wght Avg: 6
SemesterWght Avg: 6
SemesterWght Avg: 20
SemestersWght Avg: 6
SemesterWght Avg: 20
SemestersWght Avg: 6
SemesterWght Avg: 6
SemesterWght Avg: 6
SemesterWght Avg: 6
SemesterWght Avg: 20
Semesters
30Wght Avg: 6
SemesterWght Avg: 6
SemesterWght Avg: 20
SemestersWght Avg: 6
SemesterWght Avg: 20
SemestersWght Avg: 10
SemestersWght Avg: 6
SemesterWght Avg: 6
SemesterWght Avg: 6
SemesterWght Avg: 20
Semesters
36Wght Avg: 6
SemesterWght Avg: 6
SemesterWght Avg: 20
SemestersWght Avg: 6
SemesterWght Avg: 20
SemestersWght Avg: 6
SemesterWght Avg: 6
SemesterWght Avg: 6
SemesterWght Avg: 6
SemesterWght Avg: 20
Semesters
42Wght Avg: 6
SemesterWght Avg: 6
SemesterWght Avg: 20
SemestersAvg: 6 Semesters
ex hi/loWght Avg: 20
SemestersWght Avg: 6
SemesterWght Avg: 6
SemesterWght Avg: 6
SemesterWght Avg: 6
SemesterWght Avg: 20
Semesters
48Wght Avg: 6
SemesterWght Avg: 6
SemesterWght Avg: 20
SemestersWght Avg: 6
SemesterWght Avg: 20
SemestersWght Avg: 10
SemestersWght Avg: 6
SemesterWght Avg: 6
SemesterWght Avg: 6
SemesterWght Avg: 20
Semesters
54Wght Avg: 6
SemesterWght Avg: 6
SemesterWght Avg: 20
SemestersWght Avg: 6
SemesterWght Avg: 20
SemestersWght Avg: 6
SemesterWght Avg: 6
SemesterWght Avg: 6
SemesterWght Avg: 6
SemesterWght Avg: 20
Semesters
60Wght Avg: 6
SemesterWght Avg: 6
SemesterWght Avg: 20
SemestersWght Avg: 6
SemesterWght Avg: 20
SemestersWght Avg: 6
SemesterWght Avg: 6
SemesterWght Avg: 6
SemesterWght Avg: 6
SemesterWght Avg: 20
Semesters
66Wght Avg: 6
SemesterWght Avg: 6
SemesterWght Avg: 20
SemestersWght Avg: 6
SemesterWght Avg: 20
SemestersWght Avg: 6
SemesterWght Avg: 6
SemesterWght Avg: 6
SemesterWght Avg: 6
SemesterWght Avg: 20
Semesters
72Wght Avg: 6
SemesterWght Avg: 6
SemesterWght Avg: 20
SemestersWght Avg: 6
SemesterWght Avg: 20
SemestersWght Avg: 6
SemesterWght Avg: 6
SemesterWght Avg: 6
SemesterWght Avg: 6
SemesterWght Avg: 20
Semesters
78Wght Avg: 6
SemesterWght Avg: 6
SemesterWght Avg: 20
SemestersWght Avg: 6
SemesterWght Avg: 20
SemestersWght Avg: 6
SemesterWght Avg: 6
SemesterWght Avg: 6
SemesterWght Avg: 6
SemesterWght Avg: 20
Semesters
84Wght Avg: 6
Semester 1Wght Avg: 20
SemestersWght Avg: 10
SemestersWght Avg: 20
SemestersWght Avg: 6
SemesterWght Avg: 6
SemesterWght Avg: 6
SemesterWght Avg: 6
SemesterWght Avg: 20
Semesters
90Wght Avg: 6
Semester 1Wght Avg: 20
SemestersWght Avg: 6
SemesterWght Avg: 20
SemestersWght Avg: 6
SemesterWght Avg: 6
SemesterWght Avg: 6
SemesterWght Avg: 6
SemesterWght Avg: 20
Semesters
96Wght Avg: 6
Semester 1Wght Avg: 20
SemestersWght Avg: 6
SemesterWght Avg: 20
SemestersWght Avg: 6
SemesterWght Avg: 6
SemesterWght Avg: 6
SemesterWght Avg: 6
SemesterWght Avg: 20
Semesters
102Wght Avg: 6
Semester 1Wght Avg: 20
SemestersWght Avg: 6
SemesterWght Avg: 20
SemestersWght Avg: 6
SemesterWght Avg: 6
SemesterWght Avg: 6
SemesterWght Avg: 6
SemesterWght Avg: 20
Semesters
108Wght Avg: 6
Semester 1Wght Avg: 20
SemestersWght Avg: 6
SemesterWght Avg: 20
SemestersWght Avg: 6
SemesterWght Avg: 6
SemesterWght Avg: 6
SemesterWght Avg: 6
SemesterWght Avg: 20
Semesters
114Wght Avg: 6
Semester 1Wght Avg: 20
SemestersWght Avg: 6
SemesterWght Avg: 20
SemestersWght Avg: 6
SemesterWght Avg: 6
SemesterWght Avg: 6
SemesterWght Avg: 6
SemesterWght Avg: 20
Semesters
120Wght Avg: 6
Semester 1Wght Avg: 20
SemestersWght Avg: 6
SemesterWght Avg: 20
SemestersWght Avg: 6
SemesterWght Avg: 6
SemesterWght Avg: 6
SemesterWght Avg: 6
SemesterWght Avg: 20
Semesters
126Wght Avg: 6
Semester 1Wght Avg: All
SemestersWght Avg: 6
SemesterWght Avg: All
SemestersWght Avg: 6
SemesterWght Avg: 6
SemesterWght Avg: 6
SemesterWght Avg: 6
SemesterWght Avg: 6
Semester
132Wght Avg: 6
Semester 1Wght Avg: All
SemestersWght Avg: 6
SemesterWght Avg: All
SemestersWght Avg: 6
SemesterWght Avg: 6
SemesterWght Avg: 6
SemesterWght Avg: 6
SemesterWght Avg: 6
Semester
138 1 1Wght Avg: All
SemestersWght Avg: 6
SemesterWght Avg: All
SemestersWght Avg: 6
SemesterWght Avg: 6
SemesterWght Avg: 6
SemesterWght Avg: 6
SemesterWght Avg: 6
Semester
144 1 1Wght Avg: All
SemestersWght Avg: 6
SemesterWght Avg: All
SemestersWght Avg: 6
SemesterWght Avg: 6
SemesterWght Avg: 6
SemesterWght Avg: 6
SemesterWght Avg: 6
Semester
150Wght Avg: 6
Semester 1Wght Avg: All
SemestersWght Avg: 6
SemesterWght Avg: All
SemestersWght Avg: 6
SemesterWght Avg: 6
SemesterWght Avg: 6
SemesterWght Avg: 6
SemesterWght Avg: 6
Semester
156Wght Avg: 6
Semester 1Wght Avg: All
SemestersWght Avg: 6
SemesterWght Avg: All
SemestersWght Avg: 6
SemesterWght Avg: 6
SemesterWght Avg: 6
SemesterWght Avg: 6
SemesterWght Avg: 6
Semester
162 1 1Wght Avg: All
SemestersWght Avg: 6
SemesterWght Avg: All
SemestersWght Avg: 6
SemesterWght Avg: 6
SemesterWght Avg: 6
SemesterWght Avg: 6
SemesterWght Avg: 6
Semester
168Wght Avg: 6
Semester 1Wght Avg: All
SemestersWght Avg: 6
SemesterWght Avg: All
SemestersWght Avg: 6
SemesterWght Avg: 6
SemesterWght Avg: 6
SemesterWght Avg: 6
SemesterWght Avg: 6
Semester
174Wght Avg: 6
Semester 1Wght Avg: All
SemestersWght Avg: 6
SemesterWght Avg: All
SemestersWght Avg: 6
SemesterWght Avg: 6
SemesterWght Avg: 6
SemesterWght Avg: 6
SemesterWght Avg: 6
Semester
180Wght Avg: 6
Semester 1Wght Avg: All
SemestersWght Avg: 6
SemesterWght Avg: All
SemestersWght Avg: 6
SemesterWght Avg: 6
SemesterWght Avg: 6
SemesterWght Avg: 6
SemesterWght Avg: 6
Semester
186Wght Avg: 6
Semester 1Wght Avg: All
SemestersWght Avg: 6
SemesterWght Avg: All
SemestersWght Avg: 6
SemesterWght Avg: 6
SemesterWght Avg: 6
SemesterWght Avg: 6
SemesterWght Avg: 6
Semester
192Wght Avg: 6
Semester 1Wght Avg: All
SemestersWght Avg: 6
SemesterWght Avg: All
SemestersWght Avg: 6
SemesterWght Avg: 6
SemesterWght Avg: 6
SemesterWght Avg: 6
SemesterWght Avg: 6
Semester
198Wght Avg: 6
Semester 1Wght Avg: All
SemestersWght Avg: 6
SemesterWght Avg: All
SemestersWght Avg: 6
SemesterWght Avg: 6
SemesterWght Avg: 6
SemesterWght Avg: 6
SemesterWght Avg: 6
Semester
204Wght Avg: 6
Semester 1Wght Avg: All
SemestersWght Avg: 6
SemesterWght Avg: All
SemestersWght Avg: 6
SemesterWght Avg: 6
SemesterWght Avg: 6
SemesterWght Avg: 6
SemesterWght Avg: 6
Semester
210 1 1Wght Avg: All
Semesters 1Wght Avg: All
Semesters 1 1 1 1 1
216 1 1Wght Avg: All
Semesters 1Wght Avg: All
Semesters 1 1 1 1 1
222 1 1Wght Avg: All
Semesters 1Wght Avg: All
Semesters 1 1 1 1 1
228 1 1Wght Avg: All
Semesters 1Wght Avg: All
Semesters 1 1 1 1 1
234 1 1Wght Avg: All
Semesters 1Wght Avg: All
Semesters 1 1 1 1 1
Appendix A Page 4
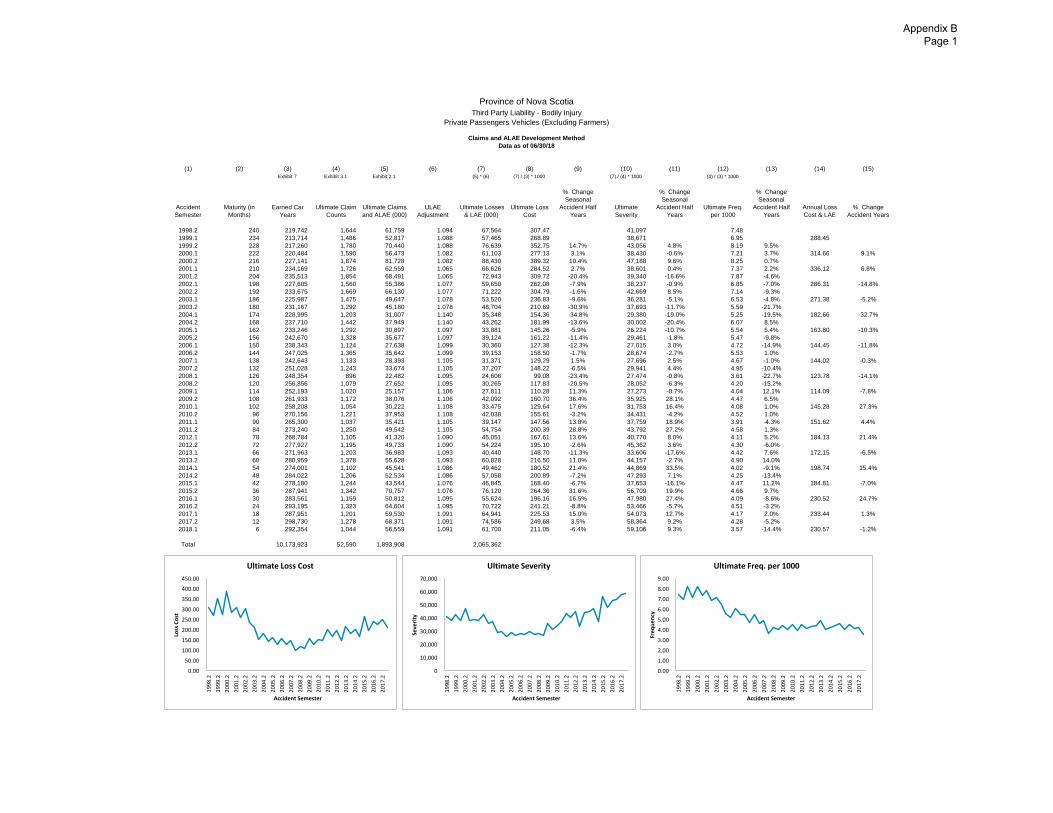
Province of Nova Scotia
Third Party Liability - Bodily Injury
Private Passengers Vehicles (Excluding Farmers)
Claims and ALAE Development Method
Data as of 06/30/18
(1) (2) (3) (4) (5) (6) (7) (8) (9) (10) (11) (12) (13) (14) (15)
Exhibit 7 Exhibit 3.1 Exhibit 2.1 (5) * (6) (7) / (3) * 1000 (7) / (4) * 1000 (4) / (3) * 1000
Accident
Semester
Maturity (in
Months)
Earned Car
Years
Ultimate Claim
Counts
Ultimate Claims
and ALAE (000)
ULAE
Adjustment
Ultimate Losses
& LAE (000)
Ultimate Loss
Cost
% Change
Seasonal
Accident Half
Years
Ultimate
Severity
% Change
Seasonal
Accident Half
Years
Ultimate Freq.
per 1000
% Change
Seasonal
Accident Half
Years
Annual Loss
Cost & LAE
% Change
Accident Years
1998.2 240 219,742 1,644 61,759 1.094 67,564 307.47 41,097 7.48
1999.1 234 213,714 1,486 52,817 1.088 57,465 268.89 38,671 6.95 288.45
1999.2 228 217,260 1,780 70,440 1.088 76,639 352.75 14.7% 43,056 4.8% 8.19 9.5%
2000.1 222 220,484 1,590 56,473 1.082 61,103 277.13 3.1% 38,430 -0.6% 7.21 3.7% 314.66 9.1%
2000.2 216 227,141 1,874 81,728 1.082 88,430 389.32 10.4% 47,188 9.6% 8.25 0.7%
2001.1 210 234,169 1,726 62,559 1.065 66,626 284.52 2.7% 38,601 0.4% 7.37 2.2% 336.12 6.8%
2001.2 204 235,513 1,854 68,491 1.065 72,943 309.72 -20.4% 39,340 -16.6% 7.87 -4.6%
2002.1 198 227,605 1,560 55,386 1.077 59,650 262.08 -7.9% 38,237 -0.9% 6.85 -7.0% 286.31 -14.8%
2002.2 192 233,675 1,669 66,130 1.077 71,222 304.79 -1.6% 42,669 8.5% 7.14 -9.3%
2003.1 186 225,987 1,475 49,647 1.078 53,520 236.83 -9.6% 36,281 -5.1% 6.53 -4.8% 271.38 -5.2%
2003.2 180 231,167 1,292 45,180 1.078 48,704 210.69 -30.9% 37,693 -11.7% 5.59 -21.7%
2004.1 174 228,995 1,203 31,007 1.140 35,348 154.36 -34.8% 29,380 -19.0% 5.25 -19.5% 182.66 -32.7%
2004.2 168 237,710 1,442 37,949 1.140 43,262 181.99 -13.6% 30,002 -20.4% 6.07 8.5%
2005.1 162 233,246 1,292 30,897 1.097 33,881 145.26 -5.9% 26,224 -10.7% 5.54 5.4% 163.80 -10.3%
2005.2 156 242,670 1,328 35,677 1.097 39,124 161.22 -11.4% 29,461 -1.8% 5.47 -9.8%
2006.1 150 238,343 1,124 27,638 1.099 30,360 127.38 -12.3% 27,015 3.0% 4.72 -14.9% 144.45 -11.8%
2006.2 144 247,025 1,365 35,642 1.099 39,153 158.50 -1.7% 28,674 -2.7% 5.53 1.0%
2007.1 138 242,643 1,133 28,393 1.105 31,371 129.29 1.5% 27,696 2.5% 4.67 -1.0% 144.02 -0.3%
2007.2 132 251,028 1,243 33,674 1.105 37,207 148.22 -6.5% 29,941 4.4% 4.95 -10.4%
2008.1 126 248,354 896 22,482 1.095 24,606 99.08 -23.4% 27,474 -0.8% 3.61 -22.7% 123.78 -14.1%
2008.2 120 256,856 1,079 27,652 1.095 30,265 117.83 -20.5% 28,052 -6.3% 4.20 -15.2%
2009.1 114 252,193 1,020 25,157 1.106 27,811 110.28 11.3% 27,273 -0.7% 4.04 12.1% 114.09 -7.8%
2009.2 108 261,933 1,172 38,076 1.106 42,092 160.70 36.4% 35,925 28.1% 4.47 6.5%
2010.1 102 258,208 1,054 30,222 1.108 33,475 129.64 17.6% 31,753 16.4% 4.08 1.0% 145.28 27.3%
2010.2 96 270,156 1,221 37,953 1.108 42,038 155.61 -3.2% 34,431 -4.2% 4.52 1.0%
2011.1 90 265,300 1,037 35,421 1.105 39,147 147.56 13.8% 37,759 18.9% 3.91 -4.3% 151.62 4.4%
2011.2 84 273,240 1,250 49,542 1.105 54,754 200.39 28.8% 43,792 27.2% 4.58 1.3%
2012.1 78 268,784 1,105 41,320 1.090 45,051 167.61 13.6% 40,770 8.0% 4.11 5.2% 184.13 21.4%
2012.2 72 277,927 1,195 49,733 1.090 54,224 195.10 -2.6% 45,362 3.6% 4.30 -6.0%
2013.1 66 271,963 1,203 36,983 1.093 40,440 148.70 -11.3% 33,606 -17.6% 4.42 7.6% 172.15 -6.5%
2013.2 60 280,959 1,378 55,628 1.093 60,828 216.50 11.0% 44,157 -2.7% 4.90 14.0%
2014.1 54 274,001 1,102 45,541 1.086 49,462 180.52 21.4% 44,869 33.5% 4.02 -9.1% 198.74 15.4%
2014.2 48 284,022 1,206 52,534 1.086 57,058 200.89 -7.2% 47,293 7.1% 4.25 -13.4%
2015.1 42 278,180 1,244 43,544 1.076 46,845 168.40 -6.7% 37,653 -16.1% 4.47 11.2% 184.81 -7.0%
2015.2 36 287,941 1,342 70,757 1.076 76,120 264.36 31.6% 56,709 19.9% 4.66 9.7%
2016.1 30 283,561 1,159 50,812 1.095 55,624 196.16 16.5% 47,980 27.4% 4.09 -8.6% 230.52 24.7%
2016.2 24 293,195 1,323 64,604 1.095 70,722 241.21 -8.8% 53,466 -5.7% 4.51 -3.2%
2017.1 18 287,951 1,201 59,530 1.091 64,941 225.53 15.0% 54,073 12.7% 4.17 2.0% 233.44 1.3%
2017.2 12 298,730 1,278 68,371 1.091 74,586 249.68 3.5% 58,364 9.2% 4.28 -5.2%
2018.1 6 292,354 1,044 56,559 1.091 61,700 211.05 -6.4% 59,106 9.3% 3.57 -14.4% 230.57 -1.2%
Total 10,173,923 52,590 1,893,908 2,065,362
0
10,000
20,000
30,000
40,000
50,000
60,000
70,000
1998.2
1999.2
2000.2
2001.2
2002.2
2003.2
2004.2
2005.2
2006.2
2007.2
2008.2
2009.2
2010.2
2011.2
2012.2
2013.2
2014.2
2015.2
2016.2
2017.2
Seve
rity
Accident Semester
Ultimate Severity
0.00
1.00
2.00
3.00
4.00
5.00
6.00
7.00
8.00
9.00
1998.2
1999.2
2000.2
2001.2
2002.2
2003.2
2004.2
2005.2
2006.2
2007.2
2008.2
2009.2
2010.2
2011.2
2012.2
2013.2
2014.2
2015.2
2016.2
2017.2
Fre
qu
en
cy
Accident Semester
Ultimate Freq. per 1000
0.00
50.00
100.00
150.00
200.00
250.00
300.00
350.00
400.00
450.00
1998.2
1999.2
2000.2
2001.2
2002.2
2003.2
2004.2
2005.2
2006.2
2007.2
2008.2
2009.2
2010.2
2011.2
2012.2
2013.2
2014.2
2015.2
2016.2
2017.2
Loss
Co
st
Accident Semester
Ultimate Loss Cost
Appendix B Page 1
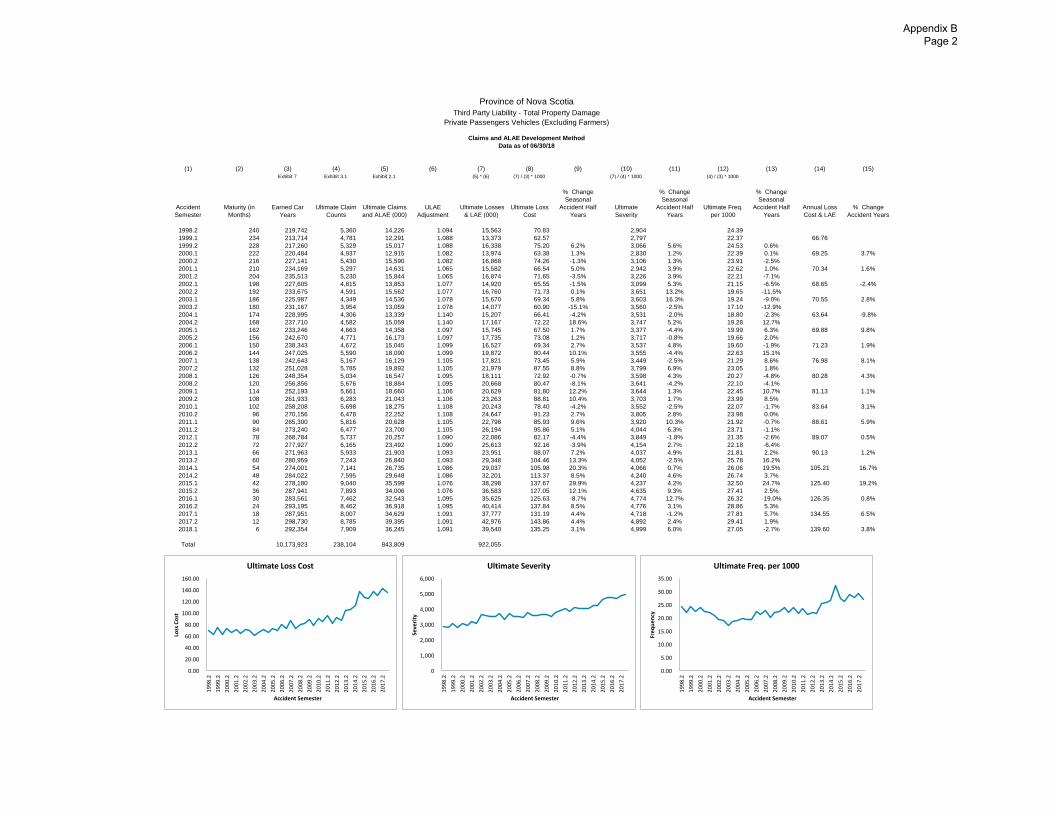
Province of Nova Scotia
Third Party Liability - Total Property Damage
Private Passengers Vehicles (Excluding Farmers)
Claims and ALAE Development Method
Data as of 06/30/18
(1) (2) (3) (4) (5) (6) (7) (8) (9) (10) (11) (12) (13) (14) (15)
Exhibit 7 Exhibit 3.1 Exhibit 2.1 (5) * (6) (7) / (3) * 1000 (7) / (4) * 1000 (4) / (3) * 1000
Accident
Semester
Maturity (in
Months)
Earned Car
Years
Ultimate Claim
Counts
Ultimate Claims
and ALAE (000)
ULAE
Adjustment
Ultimate Losses
& LAE (000)
Ultimate Loss
Cost
% Change
Seasonal
Accident Half
Years
Ultimate
Severity
% Change
Seasonal
Accident Half
Years
Ultimate Freq.
per 1000
% Change
Seasonal
Accident Half
Years
Annual Loss
Cost & LAE
% Change
Accident Years
1998.2 240 219,742 5,360 14,226 1.094 15,563 70.83 2,904 24.39
1999.1 234 213,714 4,781 12,291 1.088 13,373 62.57 2,797 22.37 66.76
1999.2 228 217,260 5,329 15,017 1.088 16,338 75.20 6.2% 3,066 5.6% 24.53 0.6%
2000.1 222 220,484 4,937 12,915 1.082 13,974 63.38 1.3% 2,830 1.2% 22.39 0.1% 69.25 3.7%
2000.2 216 227,141 5,430 15,590 1.082 16,868 74.26 -1.3% 3,106 1.3% 23.91 -2.5%
2001.1 210 234,169 5,297 14,631 1.065 15,582 66.54 5.0% 2,942 3.9% 22.62 1.0% 70.34 1.6%
2001.2 204 235,513 5,230 15,844 1.065 16,874 71.65 -3.5% 3,226 3.9% 22.21 -7.1%
2002.1 198 227,605 4,815 13,853 1.077 14,920 65.55 -1.5% 3,099 5.3% 21.15 -6.5% 68.65 -2.4%
2002.2 192 233,675 4,591 15,562 1.077 16,760 71.73 0.1% 3,651 13.2% 19.65 -11.5%
2003.1 186 225,987 4,349 14,536 1.078 15,670 69.34 5.8% 3,603 16.3% 19.24 -9.0% 70.55 2.8%
2003.2 180 231,167 3,954 13,059 1.078 14,077 60.90 -15.1% 3,560 -2.5% 17.10 -12.9%
2004.1 174 228,995 4,306 13,339 1.140 15,207 66.41 -4.2% 3,531 -2.0% 18.80 -2.3% 63.64 -9.8%
2004.2 168 237,710 4,582 15,059 1.140 17,167 72.22 18.6% 3,747 5.2% 19.28 12.7%
2005.1 162 233,246 4,663 14,358 1.097 15,745 67.50 1.7% 3,377 -4.4% 19.99 6.3% 69.88 9.8%
2005.2 156 242,670 4,771 16,173 1.097 17,735 73.08 1.2% 3,717 -0.8% 19.66 2.0%
2006.1 150 238,343 4,672 15,045 1.099 16,527 69.34 2.7% 3,537 4.8% 19.60 -1.9% 71.23 1.9%
2006.2 144 247,025 5,590 18,090 1.099 19,872 80.44 10.1% 3,555 -4.4% 22.63 15.1%
2007.1 138 242,643 5,167 16,129 1.105 17,821 73.45 5.9% 3,449 -2.5% 21.29 8.6% 76.98 8.1%
2007.2 132 251,028 5,785 19,892 1.105 21,979 87.55 8.8% 3,799 6.9% 23.05 1.8%
2008.1 126 248,354 5,034 16,547 1.095 18,111 72.92 -0.7% 3,598 4.3% 20.27 -4.8% 80.28 4.3%
2008.2 120 256,856 5,676 18,884 1.095 20,668 80.47 -8.1% 3,641 -4.2% 22.10 -4.1%
2009.1 114 252,193 5,661 18,660 1.106 20,629 81.80 12.2% 3,644 1.3% 22.45 10.7% 81.13 1.1%
2009.2 108 261,933 6,283 21,043 1.106 23,263 88.81 10.4% 3,703 1.7% 23.99 8.5%
2010.1 102 258,208 5,698 18,275 1.108 20,243 78.40 -4.2% 3,552 -2.5% 22.07 -1.7% 83.64 3.1%
2010.2 96 270,156 6,478 22,252 1.108 24,647 91.23 2.7% 3,805 2.8% 23.98 0.0%
2011.1 90 265,300 5,816 20,628 1.105 22,798 85.93 9.6% 3,920 10.3% 21.92 -0.7% 88.61 5.9%
2011.2 84 273,240 6,477 23,700 1.105 26,194 95.86 5.1% 4,044 6.3% 23.71 -1.1%
2012.1 78 268,784 5,737 20,257 1.090 22,086 82.17 -4.4% 3,849 -1.8% 21.35 -2.6% 89.07 0.5%
2012.2 72 277,927 6,165 23,492 1.090 25,613 92.16 -3.9% 4,154 2.7% 22.18 -6.4%
2013.1 66 271,963 5,933 21,903 1.093 23,951 88.07 7.2% 4,037 4.9% 21.81 2.2% 90.13 1.2%
2013.2 60 280,959 7,243 26,840 1.093 29,348 104.46 13.3% 4,052 -2.5% 25.78 16.2%
2014.1 54 274,001 7,141 26,735 1.086 29,037 105.98 20.3% 4,066 0.7% 26.06 19.5% 105.21 16.7%
2014.2 48 284,022 7,595 29,648 1.086 32,201 113.37 8.5% 4,240 4.6% 26.74 3.7%
2015.1 42 278,180 9,040 35,599 1.076 38,298 137.67 29.9% 4,237 4.2% 32.50 24.7% 125.40 19.2%
2015.2 36 287,941 7,893 34,006 1.076 36,583 127.05 12.1% 4,635 9.3% 27.41 2.5%
2016.1 30 283,561 7,462 32,543 1.095 35,625 125.63 -8.7% 4,774 12.7% 26.32 -19.0% 126.35 0.8%
2016.2 24 293,195 8,462 36,918 1.095 40,414 137.84 8.5% 4,776 3.1% 28.86 5.3%
2017.1 18 287,951 8,007 34,629 1.091 37,777 131.19 4.4% 4,718 -1.2% 27.81 5.7% 134.55 6.5%
2017.2 12 298,730 8,785 39,395 1.091 42,976 143.86 4.4% 4,892 2.4% 29.41 1.9%
2018.1 6 292,354 7,909 36,245 1.091 39,540 135.25 3.1% 4,999 6.0% 27.05 -2.7% 139.60 3.8%
Total 10,173,923 238,104 843,809 922,055
0
1,000
2,000
3,000
4,000
5,000
6,000
1998.2
1999.2
2000.2
2001.2
2002.2
2003.2
2004.2
2005.2
2006.2
2007.2
2008.2
2009.2
2010.2
2011.2
2012.2
2013.2
2014.2
2015.2
2016.2
2017.2
Seve
rity
Accident Semester
Ultimate Severity
0.00
5.00
10.00
15.00
20.00
25.00
30.00
35.00
1998.2
1999.2
2000.2
2001.2
2002.2
2003.2
2004.2
2005.2
2006.2
2007.2
2008.2
2009.2
2010.2
2011.2
2012.2
2013.2
2014.2
2015.2
2016.2
2017.2
Fre
qu
en
cy
Accident Semester
Ultimate Freq. per 1000
0.00
20.00
40.00
60.00
80.00
100.00
120.00
140.00
160.00
1998.2
1999.2
2000.2
2001.2
2002.2
2003.2
2004.2
2005.2
2006.2
2007.2
2008.2
2009.2
2010.2
2011.2
2012.2
2013.2
2014.2
2015.2
2016.2
2017.2
Loss
Co
st
Accident Semester
Ultimate Loss Cost
Appendix B Page 2
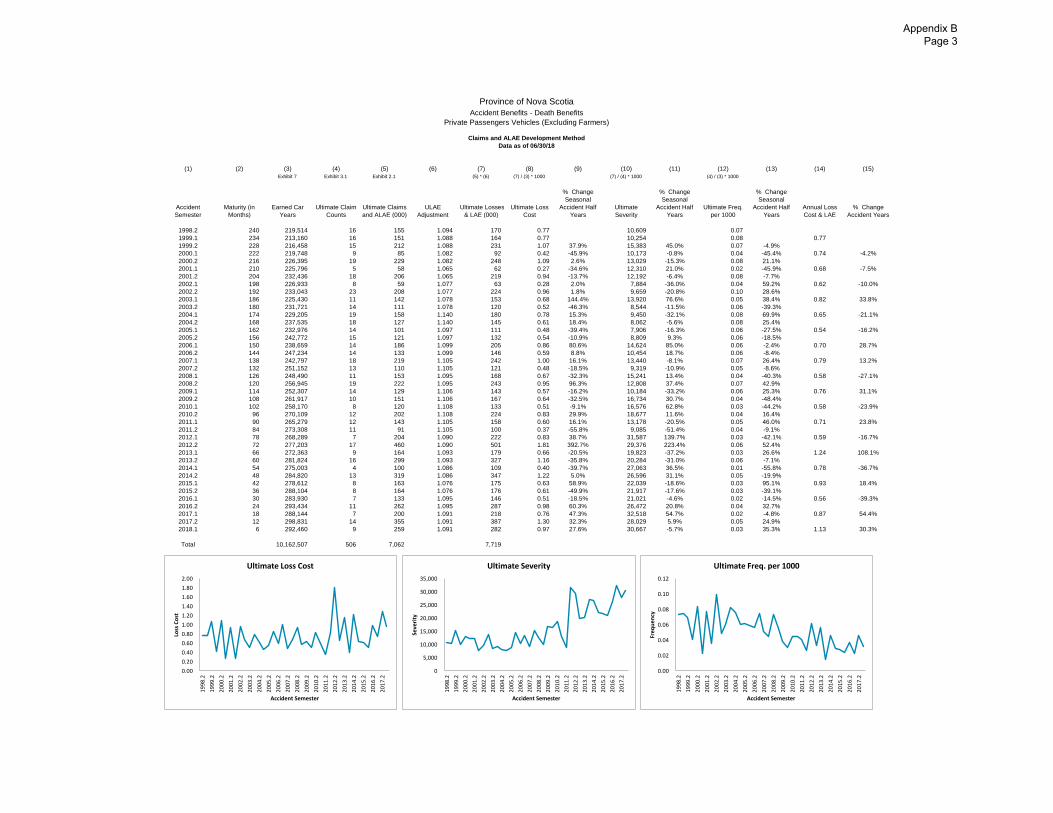
Province of Nova Scotia
Accident Benefits - Death Benefits
Private Passengers Vehicles (Excluding Farmers)
Claims and ALAE Development Method
Data as of 06/30/18
(1) (2) (3) (4) (5) (6) (7) (8) (9) (10) (11) (12) (13) (14) (15)
Exhibit 7 Exhibit 3.1 Exhibit 2.1 (5) * (6) (7) / (3) * 1000 (7) / (4) * 1000 (4) / (3) * 1000
Accident
Semester
Maturity (in
Months)
Earned Car
Years
Ultimate Claim
Counts
Ultimate Claims
and ALAE (000)
ULAE
Adjustment
Ultimate Losses
& LAE (000)
Ultimate Loss
Cost
% Change
Seasonal
Accident Half
Years
Ultimate
Severity
% Change
Seasonal
Accident Half
Years
Ultimate Freq.
per 1000
% Change
Seasonal
Accident Half
Years
Annual Loss
Cost & LAE
% Change
Accident Years
1998.2 240 219,514 16 155 1.094 170 0.77 10,609 0.07
1999.1 234 213,160 16 151 1.088 164 0.77 10,254 0.08 0.77
1999.2 228 216,458 15 212 1.088 231 1.07 37.9% 15,383 45.0% 0.07 -4.9%
2000.1 222 219,748 9 85 1.082 92 0.42 -45.9% 10,173 -0.8% 0.04 -45.4% 0.74 -4.2%
2000.2 216 226,395 19 229 1.082 248 1.09 2.6% 13,029 -15.3% 0.08 21.1%
2001.1 210 225,796 5 58 1.065 62 0.27 -34.6% 12,310 21.0% 0.02 -45.9% 0.68 -7.5%
2001.2 204 232,436 18 206 1.065 219 0.94 -13.7% 12,192 -6.4% 0.08 -7.7%
2002.1 198 226,933 8 59 1.077 63 0.28 2.0% 7,884 -36.0% 0.04 59.2% 0.62 -10.0%
2002.2 192 233,043 23 208 1.077 224 0.96 1.8% 9,659 -20.8% 0.10 28.6%
2003.1 186 225,430 11 142 1.078 153 0.68 144.4% 13,920 76.6% 0.05 38.4% 0.82 33.8%
2003.2 180 231,721 14 111 1.078 120 0.52 -46.3% 8,544 -11.5% 0.06 -39.3%
2004.1 174 229,205 19 158 1.140 180 0.78 15.3% 9,450 -32.1% 0.08 69.9% 0.65 -21.1%
2004.2 168 237,535 18 127 1.140 145 0.61 18.4% 8,062 -5.6% 0.08 25.4%
2005.1 162 232,976 14 101 1.097 111 0.48 -39.4% 7,906 -16.3% 0.06 -27.5% 0.54 -16.2%
2005.2 156 242,772 15 121 1.097 132 0.54 -10.9% 8,809 9.3% 0.06 -18.5%
2006.1 150 238,659 14 186 1.099 205 0.86 80.6% 14,624 85.0% 0.06 -2.4% 0.70 28.7%
2006.2 144 247,234 14 133 1.099 146 0.59 8.8% 10,454 18.7% 0.06 -8.4%
2007.1 138 242,797 18 219 1.105 242 1.00 16.1% 13,440 -8.1% 0.07 26.4% 0.79 13.2%
2007.2 132 251,152 13 110 1.105 121 0.48 -18.5% 9,319 -10.9% 0.05 -8.6%
2008.1 126 248,490 11 153 1.095 168 0.67 -32.3% 15,241 13.4% 0.04 -40.3% 0.58 -27.1%
2008.2 120 256,945 19 222 1.095 243 0.95 96.3% 12,808 37.4% 0.07 42.9%
2009.1 114 252,307 14 129 1.106 143 0.57 -16.2% 10,184 -33.2% 0.06 25.3% 0.76 31.1%
2009.2 108 261,917 10 151 1.106 167 0.64 -32.5% 16,734 30.7% 0.04 -48.4%
2010.1 102 258,170 8 120 1.108 133 0.51 -9.1% 16,576 62.8% 0.03 -44.2% 0.58 -23.9%
2010.2 96 270,109 12 202 1.108 224 0.83 29.9% 18,677 11.6% 0.04 16.4%
2011.1 90 265,279 12 143 1.105 158 0.60 16.1% 13,178 -20.5% 0.05 46.0% 0.71 23.8%
2011.2 84 273,308 11 91 1.105 100 0.37 -55.8% 9,085 -51.4% 0.04 -9.1%
2012.1 78 268,289 7 204 1.090 222 0.83 38.7% 31,587 139.7% 0.03 -42.1% 0.59 -16.7%
2012.2 72 277,203 17 460 1.090 501 1.81 392.7% 29,376 223.4% 0.06 52.4%
2013.1 66 272,363 9 164 1.093 179 0.66 -20.5% 19,823 -37.2% 0.03 26.6% 1.24 108.1%
2013.2 60 281,824 16 299 1.093 327 1.16 -35.8% 20,284 -31.0% 0.06 -7.1%
2014.1 54 275,003 4 100 1.086 109 0.40 -39.7% 27,063 36.5% 0.01 -55.8% 0.78 -36.7%
2014.2 48 284,820 13 319 1.086 347 1.22 5.0% 26,596 31.1% 0.05 -19.9%
2015.1 42 278,612 8 163 1.076 175 0.63 58.9% 22,039 -18.6% 0.03 95.1% 0.93 18.4%
2015.2 36 288,104 8 164 1.076 176 0.61 -49.9% 21,917 -17.6% 0.03 -39.1%
2016.1 30 283,930 7 133 1.095 146 0.51 -18.5% 21,021 -4.6% 0.02 -14.5% 0.56 -39.3%
2016.2 24 293,434 11 262 1.095 287 0.98 60.3% 26,472 20.8% 0.04 32.7%
2017.1 18 288,144 7 200 1.091 218 0.76 47.3% 32,518 54.7% 0.02 -4.8% 0.87 54.4%
2017.2 12 298,831 14 355 1.091 387 1.30 32.3% 28,029 5.9% 0.05 24.9%
2018.1 6 292,460 9 259 1.091 282 0.97 27.6% 30,667 -5.7% 0.03 35.3% 1.13 30.3%
Total 10,162,507 506 7,062 7,719
0
5,000
10,000
15,000
20,000
25,000
30,000
35,000
1998.2
1999.2
2000.2
2001.2
2002.2
2003.2
2004.2
2005.2
2006.2
2007.2
2008.2
2009.2
2010.2
2011.2
2012.2
2013.2
2014.2
2015.2
2016.2
2017.2
Seve
rity
Accident Semester
Ultimate Severity
0.00
0.02
0.04
0.06
0.08
0.10
0.12
1998.2
1999.2
2000.2
2001.2
2002.2
2003.2
2004.2
2005.2
2006.2
2007.2
2008.2
2009.2
2010.2
2011.2
2012.2
2013.2
2014.2
2015.2
2016.2
2017.2
Fre
qu
en
cy
Accident Semester
Ultimate Freq. per 1000
0.00
0.20
0.40
0.60
0.80
1.00
1.20
1.40
1.60
1.80
2.00
1998.2
1999.2
2000.2
2001.2
2002.2
2003.2
2004.2
2005.2
2006.2
2007.2
2008.2
2009.2
2010.2
2011.2
2012.2
2013.2
2014.2
2015.2
2016.2
2017.2
Loss
Co
st
Accident Semester
Ultimate Loss Cost
Appendix B Page 3
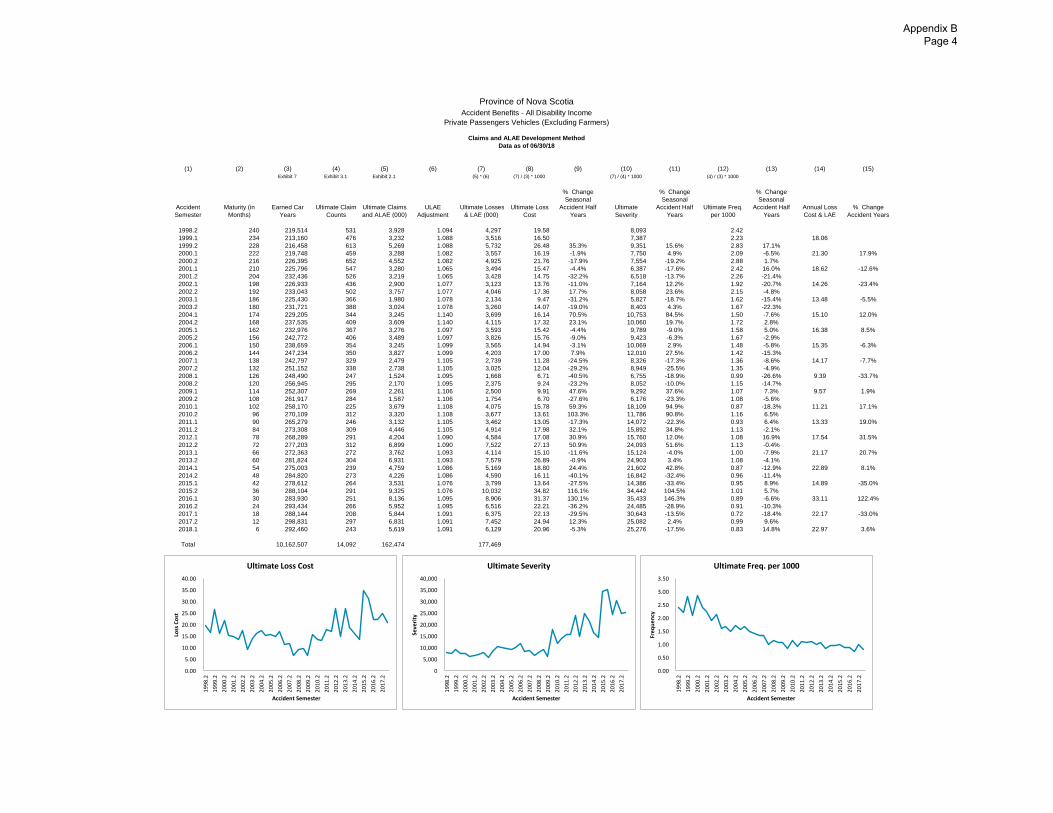
Province of Nova Scotia
Accident Benefits - All Disability Income
Private Passengers Vehicles (Excluding Farmers)
Claims and ALAE Development Method
Data as of 06/30/18
(1) (2) (3) (4) (5) (6) (7) (8) (9) (10) (11) (12) (13) (14) (15)
Exhibit 7 Exhibit 3.1 Exhibit 2.1 (5) * (6) (7) / (3) * 1000 (7) / (4) * 1000 (4) / (3) * 1000
Accident
Semester
Maturity (in
Months)
Earned Car
Years
Ultimate Claim
Counts
Ultimate Claims
and ALAE (000)
ULAE
Adjustment
Ultimate Losses
& LAE (000)
Ultimate Loss
Cost
% Change
Seasonal
Accident Half
Years
Ultimate
Severity
% Change
Seasonal
Accident Half
Years
Ultimate Freq.
per 1000
% Change
Seasonal
Accident Half
Years
Annual Loss
Cost & LAE
% Change
Accident Years
1998.2 240 219,514 531 3,928 1.094 4,297 19.58 8,093 2.42
1999.1 234 213,160 476 3,232 1.088 3,516 16.50 7,387 2.23 18.06
1999.2 228 216,458 613 5,269 1.088 5,732 26.48 35.3% 9,351 15.6% 2.83 17.1%
2000.1 222 219,748 459 3,288 1.082 3,557 16.19 -1.9% 7,750 4.9% 2.09 -6.5% 21.30 17.9%
2000.2 216 226,395 652 4,552 1.082 4,925 21.76 -17.9% 7,554 -19.2% 2.88 1.7%
2001.1 210 225,796 547 3,280 1.065 3,494 15.47 -4.4% 6,387 -17.6% 2.42 16.0% 18.62 -12.6%
2001.2 204 232,436 526 3,219 1.065 3,428 14.75 -32.2% 6,518 -13.7% 2.26 -21.4%
2002.1 198 226,933 436 2,900 1.077 3,123 13.76 -11.0% 7,164 12.2% 1.92 -20.7% 14.26 -23.4%
2002.2 192 233,043 502 3,757 1.077 4,046 17.36 17.7% 8,058 23.6% 2.15 -4.8%
2003.1 186 225,430 366 1,980 1.078 2,134 9.47 -31.2% 5,827 -18.7% 1.62 -15.4% 13.48 -5.5%
2003.2 180 231,721 388 3,024 1.078 3,260 14.07 -19.0% 8,403 4.3% 1.67 -22.3%
2004.1 174 229,205 344 3,245 1.140 3,699 16.14 70.5% 10,753 84.5% 1.50 -7.6% 15.10 12.0%
2004.2 168 237,535 409 3,609 1.140 4,115 17.32 23.1% 10,060 19.7% 1.72 2.8%
2005.1 162 232,976 367 3,276 1.097 3,593 15.42 -4.4% 9,789 -9.0% 1.58 5.0% 16.38 8.5%
2005.2 156 242,772 406 3,489 1.097 3,826 15.76 -9.0% 9,423 -6.3% 1.67 -2.9%
2006.1 150 238,659 354 3,245 1.099 3,565 14.94 -3.1% 10,069 2.9% 1.48 -5.8% 15.35 -6.3%
2006.2 144 247,234 350 3,827 1.099 4,203 17.00 7.9% 12,010 27.5% 1.42 -15.3%
2007.1 138 242,797 329 2,479 1.105 2,739 11.28 -24.5% 8,326 -17.3% 1.36 -8.6% 14.17 -7.7%
2007.2 132 251,152 338 2,738 1.105 3,025 12.04 -29.2% 8,949 -25.5% 1.35 -4.9%
2008.1 126 248,490 247 1,524 1.095 1,668 6.71 -40.5% 6,755 -18.9% 0.99 -26.6% 9.39 -33.7%
2008.2 120 256,945 295 2,170 1.095 2,375 9.24 -23.2% 8,052 -10.0% 1.15 -14.7%
2009.1 114 252,307 269 2,261 1.106 2,500 9.91 47.6% 9,292 37.6% 1.07 7.3% 9.57 1.9%
2009.2 108 261,917 284 1,587 1.106 1,754 6.70 -27.6% 6,176 -23.3% 1.08 -5.6%
2010.1 102 258,170 225 3,679 1.108 4,075 15.78 59.3% 18,109 94.9% 0.87 -18.3% 11.21 17.1%
2010.2 96 270,109 312 3,320 1.108 3,677 13.61 103.3% 11,786 90.8% 1.16 6.5%
2011.1 90 265,279 246 3,132 1.105 3,462 13.05 -17.3% 14,072 -22.3% 0.93 6.4% 13.33 19.0%
2011.2 84 273,308 309 4,446 1.105 4,914 17.98 32.1% 15,892 34.8% 1.13 -2.1%
2012.1 78 268,289 291 4,204 1.090 4,584 17.08 30.9% 15,760 12.0% 1.08 16.9% 17.54 31.5%
2012.2 72 277,203 312 6,899 1.090 7,522 27.13 50.9% 24,093 51.6% 1.13 -0.4%
2013.1 66 272,363 272 3,762 1.093 4,114 15.10 -11.6% 15,124 -4.0% 1.00 -7.9% 21.17 20.7%
2013.2 60 281,824 304 6,931 1.093 7,579 26.89 -0.9% 24,903 3.4% 1.08 -4.1%
2014.1 54 275,003 239 4,759 1.086 5,169 18.80 24.4% 21,602 42.8% 0.87 -12.9% 22.89 8.1%
2014.2 48 284,820 273 4,226 1.086 4,590 16.11 -40.1% 16,842 -32.4% 0.96 -11.4%
2015.1 42 278,612 264 3,531 1.076 3,799 13.64 -27.5% 14,386 -33.4% 0.95 8.9% 14.89 -35.0%
2015.2 36 288,104 291 9,325 1.076 10,032 34.82 116.1% 34,442 104.5% 1.01 5.7%
2016.1 30 283,930 251 8,136 1.095 8,906 31.37 130.1% 35,433 146.3% 0.89 -6.6% 33.11 122.4%
2016.2 24 293,434 266 5,952 1.095 6,516 22.21 -36.2% 24,485 -28.9% 0.91 -10.3%
2017.1 18 288,144 208 5,844 1.091 6,375 22.13 -29.5% 30,643 -13.5% 0.72 -18.4% 22.17 -33.0%
2017.2 12 298,831 297 6,831 1.091 7,452 24.94 12.3% 25,082 2.4% 0.99 9.6%
2018.1 6 292,460 243 5,619 1.091 6,129 20.96 -5.3% 25,276 -17.5% 0.83 14.8% 22.97 3.6%
Total 10,162,507 14,092 162,474 177,469
0
5,000
10,000
15,000
20,000
25,000
30,000
35,000
40,000
1998.2
1999.2
2000.2
2001.2
2002.2
2003.2
2004.2
2005.2
2006.2
2007.2
2008.2
2009.2
2010.2
2011.2
2012.2
2013.2
2014.2
2015.2
2016.2
2017.2
Seve
rity
Accident Semester
Ultimate Severity
0.00
0.50
1.00
1.50
2.00
2.50
3.00
3.50
1998.2
1999.2
2000.2
2001.2
2002.2
2003.2
2004.2
2005.2
2006.2
2007.2
2008.2
2009.2
2010.2
2011.2
2012.2
2013.2
2014.2
2015.2
2016.2
2017.2
Fre
qu
en
cy
Accident Semester
Ultimate Freq. per 1000
0.00
5.00
10.00
15.00
20.00
25.00
30.00
35.00
40.00
1998.2
1999.2
2000.2
2001.2
2002.2
2003.2
2004.2
2005.2
2006.2
2007.2
2008.2
2009.2
2010.2
2011.2
2012.2
2013.2
2014.2
2015.2
2016.2
2017.2
Loss
Co
st
Accident Semester
Ultimate Loss Cost
Appendix B Page 4
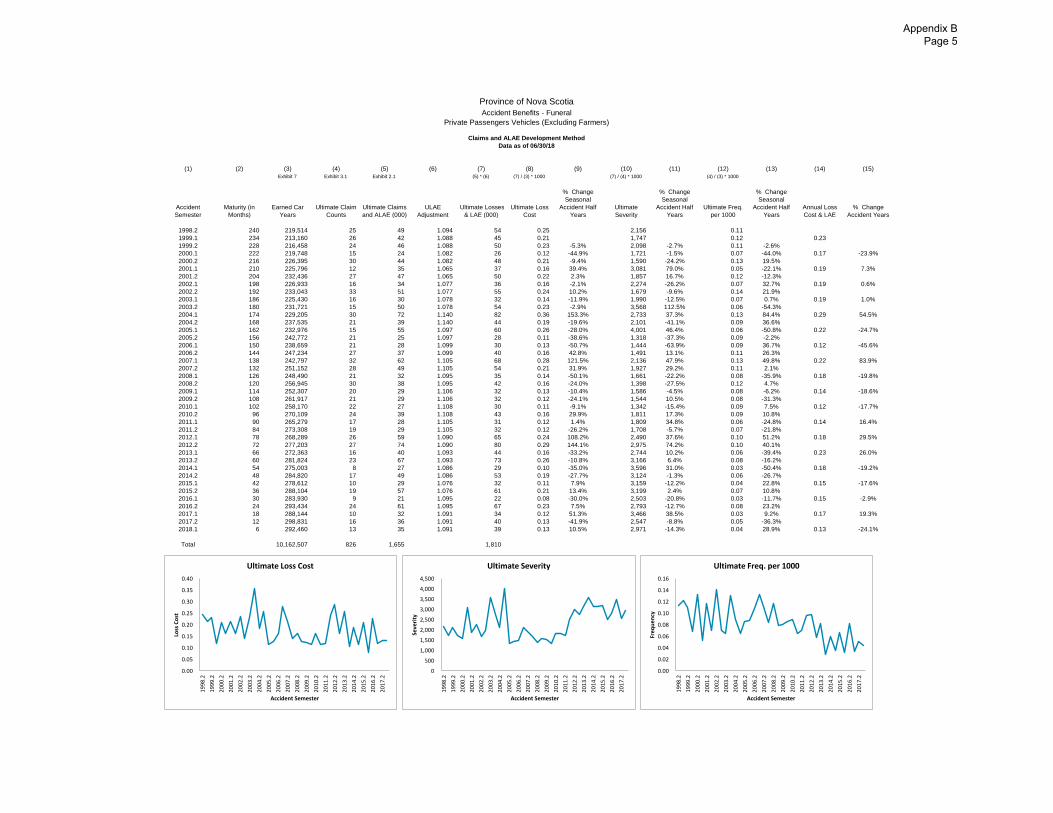
Province of Nova Scotia
Accident Benefits - Funeral
Private Passengers Vehicles (Excluding Farmers)
Claims and ALAE Development Method
Data as of 06/30/18
(1) (2) (3) (4) (5) (6) (7) (8) (9) (10) (11) (12) (13) (14) (15)
Exhibit 7 Exhibit 3.1 Exhibit 2.1 (5) * (6) (7) / (3) * 1000 (7) / (4) * 1000 (4) / (3) * 1000
Accident
Semester
Maturity (in
Months)
Earned Car
Years
Ultimate Claim
Counts
Ultimate Claims
and ALAE (000)
ULAE
Adjustment
Ultimate Losses
& LAE (000)
Ultimate Loss
Cost
% Change
Seasonal
Accident Half
Years
Ultimate
Severity
% Change
Seasonal
Accident Half
Years
Ultimate Freq.
per 1000
% Change
Seasonal
Accident Half
Years
Annual Loss
Cost & LAE
% Change
Accident Years
1998.2 240 219,514 25 49 1.094 54 0.25 2,156 0.11
1999.1 234 213,160 26 42 1.088 45 0.21 1,747 0.12 0.23
1999.2 228 216,458 24 46 1.088 50 0.23 -5.3% 2,098 -2.7% 0.11 -2.6%
2000.1 222 219,748 15 24 1.082 26 0.12 -44.9% 1,721 -1.5% 0.07 -44.0% 0.17 -23.9%
2000.2 216 226,395 30 44 1.082 48 0.21 -9.4% 1,590 -24.2% 0.13 19.5%
2001.1 210 225,796 12 35 1.065 37 0.16 39.4% 3,081 79.0% 0.05 -22.1% 0.19 7.3%
2001.2 204 232,436 27 47 1.065 50 0.22 2.3% 1,857 16.7% 0.12 -12.3%
2002.1 198 226,933 16 34 1.077 36 0.16 -2.1% 2,274 -26.2% 0.07 32.7% 0.19 0.6%
2002.2 192 233,043 33 51 1.077 55 0.24 10.2% 1,679 -9.6% 0.14 21.9%
2003.1 186 225,430 16 30 1.078 32 0.14 -11.9% 1,990 -12.5% 0.07 0.7% 0.19 1.0%
2003.2 180 231,721 15 50 1.078 54 0.23 -2.9% 3,568 112.5% 0.06 -54.3%
2004.1 174 229,205 30 72 1.140 82 0.36 153.3% 2,733 37.3% 0.13 84.4% 0.29 54.5%
2004.2 168 237,535 21 39 1.140 44 0.19 -19.6% 2,101 -41.1% 0.09 36.6%
2005.1 162 232,976 15 55 1.097 60 0.26 -28.0% 4,001 46.4% 0.06 -50.8% 0.22 -24.7%
2005.2 156 242,772 21 25 1.097 28 0.11 -38.6% 1,318 -37.3% 0.09 -2.2%
2006.1 150 238,659 21 28 1.099 30 0.13 -50.7% 1,444 -63.9% 0.09 36.7% 0.12 -45.6%
2006.2 144 247,234 27 37 1.099 40 0.16 42.8% 1,491 13.1% 0.11 26.3%
2007.1 138 242,797 32 62 1.105 68 0.28 121.5% 2,136 47.9% 0.13 49.8% 0.22 83.9%
2007.2 132 251,152 28 49 1.105 54 0.21 31.9% 1,927 29.2% 0.11 2.1%
2008.1 126 248,490 21 32 1.095 35 0.14 -50.1% 1,661 -22.2% 0.08 -35.9% 0.18 -19.8%
2008.2 120 256,945 30 38 1.095 42 0.16 -24.0% 1,398 -27.5% 0.12 4.7%
2009.1 114 252,307 20 29 1.106 32 0.13 -10.4% 1,586 -4.5% 0.08 -6.2% 0.14 -18.6%
2009.2 108 261,917 21 29 1.106 32 0.12 -24.1% 1,544 10.5% 0.08 -31.3%
2010.1 102 258,170 22 27 1.108 30 0.11 -9.1% 1,342 -15.4% 0.09 7.5% 0.12 -17.7%
2010.2 96 270,109 24 39 1.108 43 0.16 29.9% 1,811 17.3% 0.09 10.8%
2011.1 90 265,279 17 28 1.105 31 0.12 1.4% 1,809 34.8% 0.06 -24.8% 0.14 16.4%
2011.2 84 273,308 19 29 1.105 32 0.12 -26.2% 1,708 -5.7% 0.07 -21.8%
2012.1 78 268,289 26 59 1.090 65 0.24 108.2% 2,490 37.6% 0.10 51.2% 0.18 29.5%
2012.2 72 277,203 27 74 1.090 80 0.29 144.1% 2,975 74.2% 0.10 40.1%
2013.1 66 272,363 16 40 1.093 44 0.16 -33.2% 2,744 10.2% 0.06 -39.4% 0.23 26.0%
2013.2 60 281,824 23 67 1.093 73 0.26 -10.8% 3,166 6.4% 0.08 -16.2%
2014.1 54 275,003 8 27 1.086 29 0.10 -35.0% 3,596 31.0% 0.03 -50.4% 0.18 -19.2%
2014.2 48 284,820 17 49 1.086 53 0.19 -27.7% 3,124 -1.3% 0.06 -26.7%
2015.1 42 278,612 10 29 1.076 32 0.11 7.9% 3,159 -12.2% 0.04 22.8% 0.15 -17.6%
2015.2 36 288,104 19 57 1.076 61 0.21 13.4% 3,199 2.4% 0.07 10.8%
2016.1 30 283,930 9 21 1.095 22 0.08 -30.0% 2,503 -20.8% 0.03 -11.7% 0.15 -2.9%
2016.2 24 293,434 24 61 1.095 67 0.23 7.5% 2,793 -12.7% 0.08 23.2%
2017.1 18 288,144 10 32 1.091 34 0.12 51.3% 3,466 38.5% 0.03 9.2% 0.17 19.3%
2017.2 12 298,831 16 36 1.091 40 0.13 -41.9% 2,547 -8.8% 0.05 -36.3%
2018.1 6 292,460 13 35 1.091 39 0.13 10.5% 2,971 -14.3% 0.04 28.9% 0.13 -24.1%
Total 10,162,507 826 1,655 1,810
0
500
1,000
1,500
2,000
2,500
3,000
3,500
4,000
4,500
1998.2
1999.2
2000.2
2001.2
2002.2
2003.2
2004.2
2005.2
2006.2
2007.2
2008.2
2009.2
2010.2
2011.2
2012.2
2013.2
2014.2
2015.2
2016.2
2017.2
Seve
rity
Accident Semester
Ultimate Severity
0.00
0.02
0.04
0.06
0.08
0.10
0.12
0.14
0.16
1998.2
1999.2
2000.2
2001.2
2002.2
2003.2
2004.2
2005.2
2006.2
2007.2
2008.2
2009.2
2010.2
2011.2
2012.2
2013.2
2014.2
2015.2
2016.2
2017.2
Fre
qu
en
cy
Accident Semester
Ultimate Freq. per 1000
0.00
0.05
0.10
0.15
0.20
0.25
0.30
0.35
0.40
1998.2
1999.2
2000.2
2001.2
2002.2
2003.2
2004.2
2005.2
2006.2
2007.2
2008.2
2009.2
2010.2
2011.2
2012.2
2013.2
2014.2
2015.2
2016.2
2017.2
Loss
Co
st
Accident Semester
Ultimate Loss Cost
Appendix B Page 5
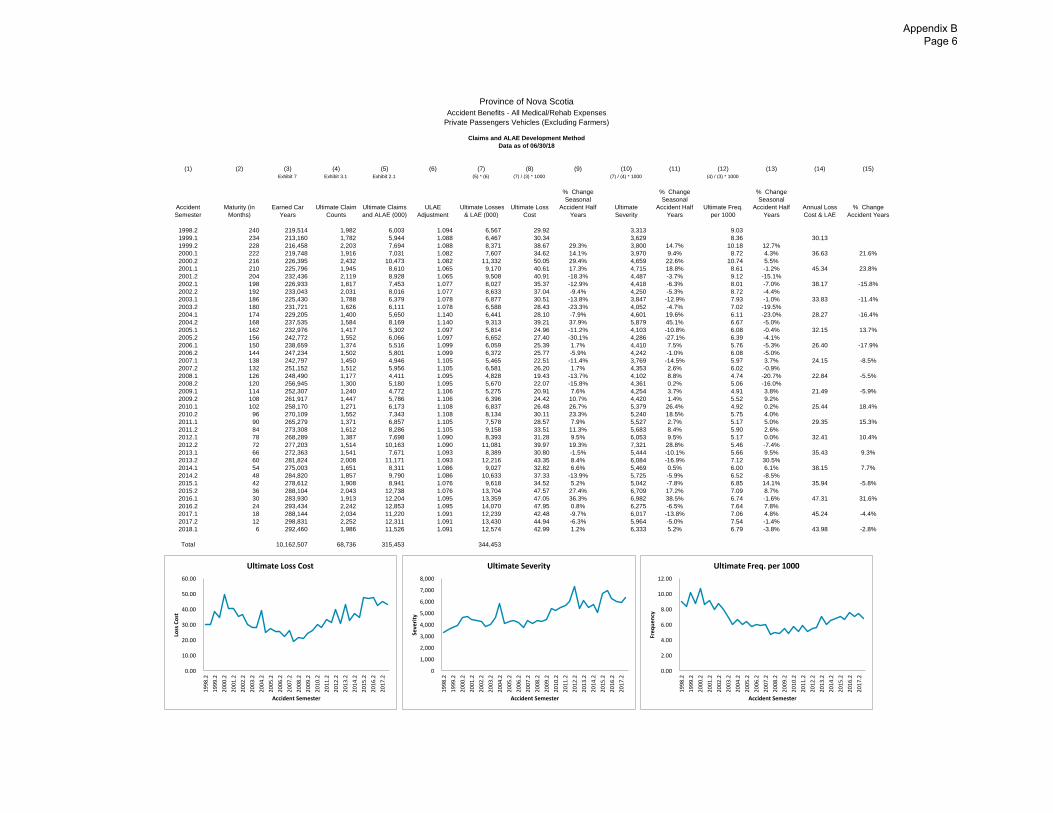
Province of Nova Scotia
Accident Benefits - All Medical/Rehab Expenses
Private Passengers Vehicles (Excluding Farmers)
Claims and ALAE Development Method
Data as of 06/30/18
(1) (2) (3) (4) (5) (6) (7) (8) (9) (10) (11) (12) (13) (14) (15)
Exhibit 7 Exhibit 3.1 Exhibit 2.1 (5) * (6) (7) / (3) * 1000 (7) / (4) * 1000 (4) / (3) * 1000
Accident
Semester
Maturity (in
Months)
Earned Car
Years
Ultimate Claim
Counts
Ultimate Claims
and ALAE (000)
ULAE
Adjustment
Ultimate Losses
& LAE (000)
Ultimate Loss
Cost
% Change
Seasonal
Accident Half
Years
Ultimate
Severity
% Change
Seasonal
Accident Half
Years
Ultimate Freq.
per 1000
% Change
Seasonal
Accident Half
Years
Annual Loss
Cost & LAE
% Change
Accident Years
1998.2 240 219,514 1,982 6,003 1.094 6,567 29.92 3,313 9.03
1999.1 234 213,160 1,782 5,944 1.088 6,467 30.34 3,629 8.36 30.13
1999.2 228 216,458 2,203 7,694 1.088 8,371 38.67 29.3% 3,800 14.7% 10.18 12.7%
2000.1 222 219,748 1,916 7,031 1.082 7,607 34.62 14.1% 3,970 9.4% 8.72 4.3% 36.63 21.6%
2000.2 216 226,395 2,432 10,473 1.082 11,332 50.05 29.4% 4,659 22.6% 10.74 5.5%
2001.1 210 225,796 1,945 8,610 1.065 9,170 40.61 17.3% 4,715 18.8% 8.61 -1.2% 45.34 23.8%
2001.2 204 232,436 2,119 8,928 1.065 9,508 40.91 -18.3% 4,487 -3.7% 9.12 -15.1%
2002.1 198 226,933 1,817 7,453 1.077 8,027 35.37 -12.9% 4,418 -6.3% 8.01 -7.0% 38.17 -15.8%
2002.2 192 233,043 2,031 8,016 1.077 8,633 37.04 -9.4% 4,250 -5.3% 8.72 -4.4%
2003.1 186 225,430 1,788 6,379 1.078 6,877 30.51 -13.8% 3,847 -12.9% 7.93 -1.0% 33.83 -11.4%
2003.2 180 231,721 1,626 6,111 1.078 6,588 28.43 -23.3% 4,052 -4.7% 7.02 -19.5%
2004.1 174 229,205 1,400 5,650 1.140 6,441 28.10 -7.9% 4,601 19.6% 6.11 -23.0% 28.27 -16.4%
2004.2 168 237,535 1,584 8,169 1.140 9,313 39.21 37.9% 5,879 45.1% 6.67 -5.0%
2005.1 162 232,976 1,417 5,302 1.097 5,814 24.96 -11.2% 4,103 -10.8% 6.08 -0.4% 32.15 13.7%
2005.2 156 242,772 1,552 6,066 1.097 6,652 27.40 -30.1% 4,286 -27.1% 6.39 -4.1%
2006.1 150 238,659 1,374 5,516 1.099 6,059 25.39 1.7% 4,410 7.5% 5.76 -5.3% 26.40 -17.9%
2006.2 144 247,234 1,502 5,801 1.099 6,372 25.77 -5.9% 4,242 -1.0% 6.08 -5.0%
2007.1 138 242,797 1,450 4,946 1.105 5,465 22.51 -11.4% 3,769 -14.5% 5.97 3.7% 24.15 -8.5%
2007.2 132 251,152 1,512 5,956 1.105 6,581 26.20 1.7% 4,353 2.6% 6.02 -0.9%
2008.1 126 248,490 1,177 4,411 1.095 4,828 19.43 -13.7% 4,102 8.8% 4.74 -20.7% 22.84 -5.5%
2008.2 120 256,945 1,300 5,180 1.095 5,670 22.07 -15.8% 4,361 0.2% 5.06 -16.0%
2009.1 114 252,307 1,240 4,772 1.106 5,275 20.91 7.6% 4,254 3.7% 4.91 3.8% 21.49 -5.9%
2009.2 108 261,917 1,447 5,786 1.106 6,396 24.42 10.7% 4,420 1.4% 5.52 9.2%
2010.1 102 258,170 1,271 6,173 1.108 6,837 26.48 26.7% 5,379 26.4% 4.92 0.2% 25.44 18.4%
2010.2 96 270,109 1,552 7,343 1.108 8,134 30.11 23.3% 5,240 18.5% 5.75 4.0%
2011.1 90 265,279 1,371 6,857 1.105 7,578 28.57 7.9% 5,527 2.7% 5.17 5.0% 29.35 15.3%
2011.2 84 273,308 1,612 8,286 1.105 9,158 33.51 11.3% 5,683 8.4% 5.90 2.6%
2012.1 78 268,289 1,387 7,698 1.090 8,393 31.28 9.5% 6,053 9.5% 5.17 0.0% 32.41 10.4%
2012.2 72 277,203 1,514 10,163 1.090 11,081 39.97 19.3% 7,321 28.8% 5.46 -7.4%
2013.1 66 272,363 1,541 7,671 1.093 8,389 30.80 -1.5% 5,444 -10.1% 5.66 9.5% 35.43 9.3%
2013.2 60 281,824 2,008 11,171 1.093 12,216 43.35 8.4% 6,084 -16.9% 7.12 30.5%
2014.1 54 275,003 1,651 8,311 1.086 9,027 32.82 6.6% 5,469 0.5% 6.00 6.1% 38.15 7.7%
2014.2 48 284,820 1,857 9,790 1.086 10,633 37.33 -13.9% 5,725 -5.9% 6.52 -8.5%
2015.1 42 278,612 1,908 8,941 1.076 9,618 34.52 5.2% 5,042 -7.8% 6.85 14.1% 35.94 -5.8%
2015.2 36 288,104 2,043 12,738 1.076 13,704 47.57 27.4% 6,709 17.2% 7.09 8.7%
2016.1 30 283,930 1,913 12,204 1.095 13,359 47.05 36.3% 6,982 38.5% 6.74 -1.6% 47.31 31.6%
2016.2 24 293,434 2,242 12,853 1.095 14,070 47.95 0.8% 6,275 -6.5% 7.64 7.8%
2017.1 18 288,144 2,034 11,220 1.091 12,239 42.48 -9.7% 6,017 -13.8% 7.06 4.8% 45.24 -4.4%
2017.2 12 298,831 2,252 12,311 1.091 13,430 44.94 -6.3% 5,964 -5.0% 7.54 -1.4%
2018.1 6 292,460 1,986 11,526 1.091 12,574 42.99 1.2% 6,333 5.2% 6.79 -3.8% 43.98 -2.8%
Total 10,162,507 68,736 315,453 344,453
0
1,000
2,000
3,000
4,000
5,000
6,000
7,000
8,000
1998.2
1999.2
2000.2
2001.2
2002.2
2003.2
2004.2
2005.2
2006.2
2007.2
2008.2
2009.2
2010.2
2011.2
2012.2
2013.2
2014.2
2015.2
2016.2
2017.2
Seve
rity
Accident Semester
Ultimate Severity
0.00
2.00
4.00
6.00
8.00
10.00
12.00
1998.2
1999.2
2000.2
2001.2
2002.2
2003.2
2004.2
2005.2
2006.2
2007.2
2008.2
2009.2
2010.2
2011.2
2012.2
2013.2
2014.2
2015.2
2016.2
2017.2
Fre
qu
en
cy
Accident Semester
Ultimate Freq. per 1000
0.00
10.00
20.00
30.00
40.00
50.00
60.00
1998.2
1999.2
2000.2
2001.2
2002.2
2003.2
2004.2
2005.2
2006.2
2007.2
2008.2
2009.2
2010.2
2011.2
2012.2
2013.2
2014.2
2015.2
2016.2
2017.2
Loss
Co
st
Accident Semester
Ultimate Loss Cost
Appendix B Page 6
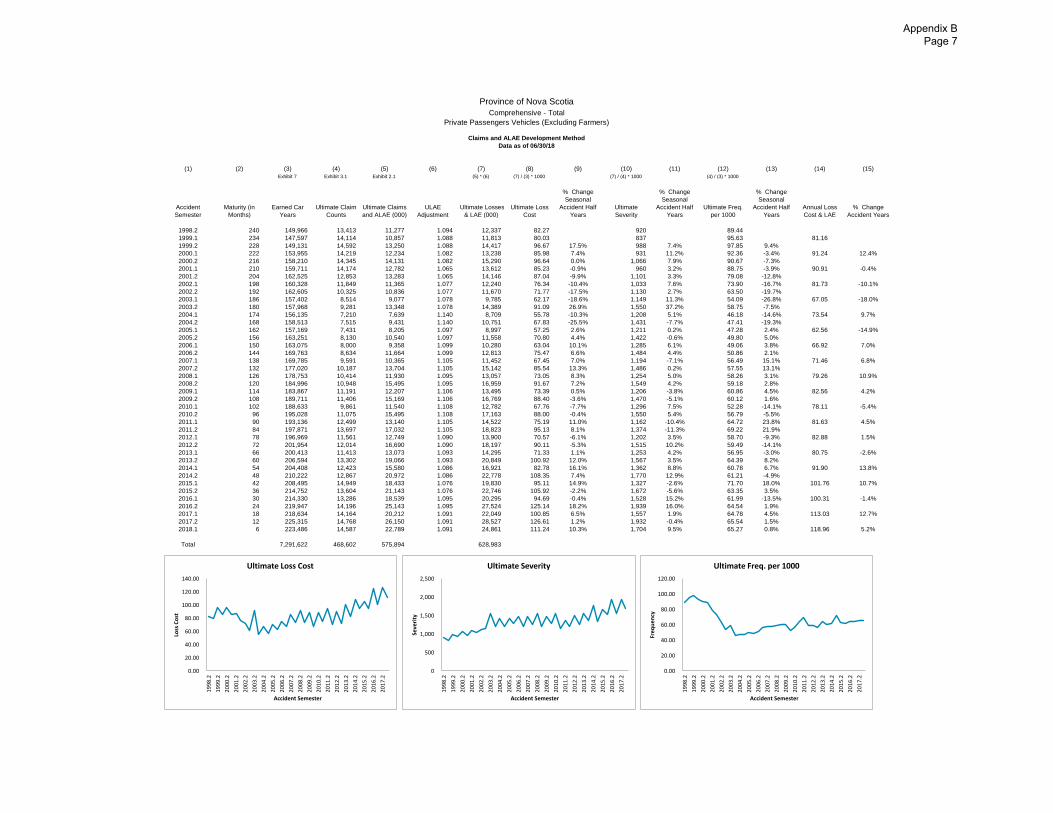
Province of Nova Scotia
Comprehensive - Total
Private Passengers Vehicles (Excluding Farmers)
Claims and ALAE Development Method
Data as of 06/30/18
(1) (2) (3) (4) (5) (6) (7) (8) (9) (10) (11) (12) (13) (14) (15)
Exhibit 7 Exhibit 3.1 Exhibit 2.1 (5) * (6) (7) / (3) * 1000 (7) / (4) * 1000 (4) / (3) * 1000
Accident
Semester
Maturity (in
Months)
Earned Car
Years
Ultimate Claim
Counts
Ultimate Claims
and ALAE (000)
ULAE
Adjustment
Ultimate Losses
& LAE (000)
Ultimate Loss
Cost
% Change
Seasonal
Accident Half
Years
Ultimate
Severity
% Change
Seasonal
Accident Half
Years
Ultimate Freq.
per 1000
% Change
Seasonal
Accident Half
Years
Annual Loss
Cost & LAE
% Change
Accident Years
1998.2 240 149,966 13,413 11,277 1.094 12,337 82.27 920 89.44
1999.1 234 147,597 14,114 10,857 1.088 11,813 80.03 837 95.63 81.16
1999.2 228 149,131 14,592 13,250 1.088 14,417 96.67 17.5% 988 7.4% 97.85 9.4%
2000.1 222 153,955 14,219 12,234 1.082 13,238 85.98 7.4% 931 11.2% 92.36 -3.4% 91.24 12.4%
2000.2 216 158,210 14,345 14,131 1.082 15,290 96.64 0.0% 1,066 7.9% 90.67 -7.3%
2001.1 210 159,711 14,174 12,782 1.065 13,612 85.23 -0.9% 960 3.2% 88.75 -3.9% 90.91 -0.4%
2001.2 204 162,525 12,853 13,283 1.065 14,146 87.04 -9.9% 1,101 3.3% 79.08 -12.8%
2002.1 198 160,328 11,849 11,365 1.077 12,240 76.34 -10.4% 1,033 7.6% 73.90 -16.7% 81.73 -10.1%
2002.2 192 162,605 10,325 10,836 1.077 11,670 71.77 -17.5% 1,130 2.7% 63.50 -19.7%
2003.1 186 157,402 8,514 9,077 1.078 9,785 62.17 -18.6% 1,149 11.3% 54.09 -26.8% 67.05 -18.0%
2003.2 180 157,968 9,281 13,348 1.078 14,389 91.09 26.9% 1,550 37.2% 58.75 -7.5%
2004.1 174 156,135 7,210 7,639 1.140 8,709 55.78 -10.3% 1,208 5.1% 46.18 -14.6% 73.54 9.7%
2004.2 168 158,513 7,515 9,431 1.140 10,751 67.83 -25.5% 1,431 -7.7% 47.41 -19.3%
2005.1 162 157,169 7,431 8,205 1.097 8,997 57.25 2.6% 1,211 0.2% 47.28 2.4% 62.56 -14.9%
2005.2 156 163,251 8,130 10,540 1.097 11,558 70.80 4.4% 1,422 -0.6% 49.80 5.0%
2006.1 150 163,075 8,000 9,358 1.099 10,280 63.04 10.1% 1,285 6.1% 49.06 3.8% 66.92 7.0%
2006.2 144 169,763 8,634 11,664 1.099 12,813 75.47 6.6% 1,484 4.4% 50.86 2.1%
2007.1 138 169,785 9,591 10,365 1.105 11,452 67.45 7.0% 1,194 -7.1% 56.49 15.1% 71.46 6.8%
2007.2 132 177,020 10,187 13,704 1.105 15,142 85.54 13.3% 1,486 0.2% 57.55 13.1%
2008.1 126 178,753 10,414 11,930 1.095 13,057 73.05 8.3% 1,254 5.0% 58.26 3.1% 79.26 10.9%
2008.2 120 184,996 10,948 15,495 1.095 16,959 91.67 7.2% 1,549 4.2% 59.18 2.8%
2009.1 114 183,867 11,191 12,207 1.106 13,495 73.39 0.5% 1,206 -3.8% 60.86 4.5% 82.56 4.2%
2009.2 108 189,711 11,406 15,169 1.106 16,769 88.40 -3.6% 1,470 -5.1% 60.12 1.6%
2010.1 102 188,633 9,861 11,540 1.108 12,782 67.76 -7.7% 1,296 7.5% 52.28 -14.1% 78.11 -5.4%
2010.2 96 195,028 11,075 15,495 1.108 17,163 88.00 -0.4% 1,550 5.4% 56.79 -5.5%
2011.1 90 193,136 12,499 13,140 1.105 14,522 75.19 11.0% 1,162 -10.4% 64.72 23.8% 81.63 4.5%
2011.2 84 197,871 13,697 17,032 1.105 18,823 95.13 8.1% 1,374 -11.3% 69.22 21.9%
2012.1 78 196,969 11,561 12,749 1.090 13,900 70.57 -6.1% 1,202 3.5% 58.70 -9.3% 82.88 1.5%
2012.2 72 201,954 12,014 16,690 1.090 18,197 90.11 -5.3% 1,515 10.2% 59.49 -14.1%
2013.1 66 200,413 11,413 13,073 1.093 14,295 71.33 1.1% 1,253 4.2% 56.95 -3.0% 80.75 -2.6%
2013.2 60 206,594 13,302 19,066 1.093 20,849 100.92 12.0% 1,567 3.5% 64.39 8.2%
2014.1 54 204,408 12,423 15,580 1.086 16,921 82.78 16.1% 1,362 8.8% 60.78 6.7% 91.90 13.8%
2014.2 48 210,222 12,867 20,972 1.086 22,778 108.35 7.4% 1,770 12.9% 61.21 -4.9%
2015.1 42 208,495 14,949 18,433 1.076 19,830 95.11 14.9% 1,327 -2.6% 71.70 18.0% 101.76 10.7%
2015.2 36 214,752 13,604 21,143 1.076 22,746 105.92 -2.2% 1,672 -5.6% 63.35 3.5%
2016.1 30 214,330 13,286 18,539 1.095 20,295 94.69 -0.4% 1,528 15.2% 61.99 -13.5% 100.31 -1.4%
2016.2 24 219,947 14,196 25,143 1.095 27,524 125.14 18.2% 1,939 16.0% 64.54 1.9%
2017.1 18 218,634 14,164 20,212 1.091 22,049 100.85 6.5% 1,557 1.9% 64.78 4.5% 113.03 12.7%
2017.2 12 225,315 14,768 26,150 1.091 28,527 126.61 1.2% 1,932 -0.4% 65.54 1.5%
2018.1 6 223,486 14,587 22,789 1.091 24,861 111.24 10.3% 1,704 9.5% 65.27 0.8% 118.96 5.2%
Total 7,291,622 468,602 575,894 628,983
0
500
1,000
1,500
2,000
2,500
1998.2
1999.2
2000.2
2001.2
2002.2
2003.2
2004.2
2005.2
2006.2
2007.2
2008.2
2009.2
2010.2
2011.2
2012.2
2013.2
2014.2
2015.2
2016.2
2017.2
Seve
rity
Accident Semester
Ultimate Severity
0.00
20.00
40.00
60.00
80.00
100.00
120.00
1998.2
1999.2
2000.2
2001.2
2002.2
2003.2
2004.2
2005.2
2006.2
2007.2
2008.2
2009.2
2010.2
2011.2
2012.2
2013.2
2014.2
2015.2
2016.2
2017.2
Fre
qu
en
cy
Accident Semester
Ultimate Freq. per 1000
0.00
20.00
40.00
60.00
80.00
100.00
120.00
140.00
1998.2
1999.2
2000.2
2001.2
2002.2
2003.2
2004.2
2005.2
2006.2
2007.2
2008.2
2009.2
2010.2
2011.2
2012.2
2013.2
2014.2
2015.2
2016.2
2017.2
Loss
Co
st
Accident Semester
Ultimate Loss Cost
Appendix B Page 7
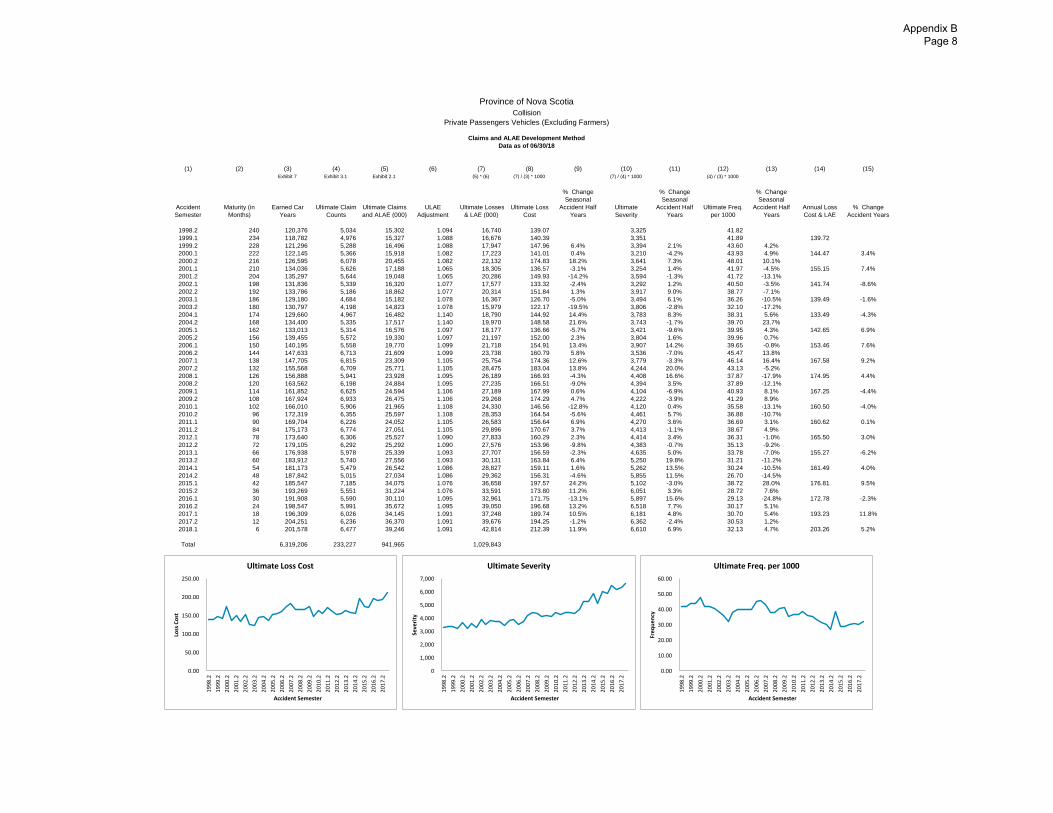
Province of Nova Scotia
Collision
Private Passengers Vehicles (Excluding Farmers)
Claims and ALAE Development Method
Data as of 06/30/18
(1) (2) (3) (4) (5) (6) (7) (8) (9) (10) (11) (12) (13) (14) (15)
Exhibit 7 Exhibit 3.1 Exhibit 2.1 (5) * (6) (7) / (3) * 1000 (7) / (4) * 1000 (4) / (3) * 1000
Accident
Semester
Maturity (in
Months)
Earned Car
Years
Ultimate Claim
Counts
Ultimate Claims
and ALAE (000)
ULAE
Adjustment
Ultimate Losses
& LAE (000)
Ultimate Loss
Cost
% Change
Seasonal
Accident Half
Years
Ultimate
Severity
% Change
Seasonal
Accident Half
Years
Ultimate Freq.
per 1000
% Change
Seasonal
Accident Half
Years
Annual Loss
Cost & LAE
% Change
Accident Years
1998.2 240 120,376 5,034 15,302 1.094 16,740 139.07 3,325 41.82
1999.1 234 118,782 4,976 15,327 1.088 16,676 140.39 3,351 41.89 139.72
1999.2 228 121,296 5,288 16,496 1.088 17,947 147.96 6.4% 3,394 2.1% 43.60 4.2%
2000.1 222 122,145 5,366 15,918 1.082 17,223 141.01 0.4% 3,210 -4.2% 43.93 4.9% 144.47 3.4%
2000.2 216 126,595 6,078 20,455 1.082 22,132 174.83 18.2% 3,641 7.3% 48.01 10.1%
2001.1 210 134,036 5,626 17,188 1.065 18,305 136.57 -3.1% 3,254 1.4% 41.97 -4.5% 155.15 7.4%
2001.2 204 135,297 5,644 19,048 1.065 20,286 149.93 -14.2% 3,594 -1.3% 41.72 -13.1%
2002.1 198 131,836 5,339 16,320 1.077 17,577 133.32 -2.4% 3,292 1.2% 40.50 -3.5% 141.74 -8.6%
2002.2 192 133,786 5,186 18,862 1.077 20,314 151.84 1.3% 3,917 9.0% 38.77 -7.1%
2003.1 186 129,180 4,684 15,182 1.078 16,367 126.70 -5.0% 3,494 6.1% 36.26 -10.5% 139.49 -1.6%
2003.2 180 130,797 4,198 14,823 1.078 15,979 122.17 -19.5% 3,806 -2.8% 32.10 -17.2%
2004.1 174 129,660 4,967 16,482 1.140 18,790 144.92 14.4% 3,783 8.3% 38.31 5.6% 133.49 -4.3%
2004.2 168 134,400 5,335 17,517 1.140 19,970 148.58 21.6% 3,743 -1.7% 39.70 23.7%
2005.1 162 133,013 5,314 16,576 1.097 18,177 136.66 -5.7% 3,421 -9.6% 39.95 4.3% 142.65 6.9%
2005.2 156 139,455 5,572 19,330 1.097 21,197 152.00 2.3% 3,804 1.6% 39.96 0.7%
2006.1 150 140,195 5,558 19,770 1.099 21,718 154.91 13.4% 3,907 14.2% 39.65 -0.8% 153.46 7.6%
2006.2 144 147,633 6,713 21,609 1.099 23,738 160.79 5.8% 3,536 -7.0% 45.47 13.8%
2007.1 138 147,705 6,815 23,309 1.105 25,754 174.36 12.6% 3,779 -3.3% 46.14 16.4% 167.58 9.2%
2007.2 132 155,568 6,709 25,771 1.105 28,475 183.04 13.8% 4,244 20.0% 43.13 -5.2%
2008.1 126 156,888 5,941 23,928 1.095 26,189 166.93 -4.3% 4,408 16.6% 37.87 -17.9% 174.95 4.4%
2008.2 120 163,562 6,198 24,884 1.095 27,235 166.51 -9.0% 4,394 3.5% 37.89 -12.1%
2009.1 114 161,852 6,625 24,594 1.106 27,189 167.99 0.6% 4,104 -6.9% 40.93 8.1% 167.25 -4.4%
2009.2 108 167,924 6,933 26,475 1.106 29,268 174.29 4.7% 4,222 -3.9% 41.29 8.9%
2010.1 102 166,010 5,906 21,965 1.108 24,330 146.56 -12.8% 4,120 0.4% 35.58 -13.1% 160.50 -4.0%
2010.2 96 172,319 6,355 25,597 1.108 28,353 164.54 -5.6% 4,461 5.7% 36.88 -10.7%
2011.1 90 169,704 6,226 24,052 1.105 26,583 156.64 6.9% 4,270 3.6% 36.69 3.1% 160.62 0.1%
2011.2 84 175,173 6,774 27,051 1.105 29,896 170.67 3.7% 4,413 -1.1% 38.67 4.9%
2012.1 78 173,640 6,306 25,527 1.090 27,833 160.29 2.3% 4,414 3.4% 36.31 -1.0% 165.50 3.0%
2012.2 72 179,105 6,292 25,292 1.090 27,576 153.96 -9.8% 4,383 -0.7% 35.13 -9.2%
2013.1 66 176,938 5,978 25,339 1.093 27,707 156.59 -2.3% 4,635 5.0% 33.78 -7.0% 155.27 -6.2%
2013.2 60 183,912 5,740 27,556 1.093 30,131 163.84 6.4% 5,250 19.8% 31.21 -11.2%
2014.1 54 181,173 5,479 26,542 1.086 28,827 159.11 1.6% 5,262 13.5% 30.24 -10.5% 161.49 4.0%
2014.2 48 187,842 5,015 27,034 1.086 29,362 156.31 -4.6% 5,855 11.5% 26.70 -14.5%
2015.1 42 185,547 7,185 34,075 1.076 36,658 197.57 24.2% 5,102 -3.0% 38.72 28.0% 176.81 9.5%
2015.2 36 193,269 5,551 31,224 1.076 33,591 173.80 11.2% 6,051 3.3% 28.72 7.6%
2016.1 30 191,908 5,590 30,110 1.095 32,961 171.75 -13.1% 5,897 15.6% 29.13 -24.8% 172.78 -2.3%
2016.2 24 198,547 5,991 35,672 1.095 39,050 196.68 13.2% 6,518 7.7% 30.17 5.1%
2017.1 18 196,309 6,026 34,145 1.091 37,248 189.74 10.5% 6,181 4.8% 30.70 5.4% 193.23 11.8%
2017.2 12 204,251 6,236 36,370 1.091 39,676 194.25 -1.2% 6,362 -2.4% 30.53 1.2%
2018.1 6 201,578 6,477 39,246 1.091 42,814 212.39 11.9% 6,610 6.9% 32.13 4.7% 203.26 5.2%
Total 6,319,206 233,227 941,965 1,029,843
0
1,000
2,000
3,000
4,000
5,000
6,000
7,000
1998.2
1999.2
2000.2
2001.2
2002.2
2003.2
2004.2
2005.2
2006.2
2007.2
2008.2
2009.2
2010.2
2011.2
2012.2
2013.2
2014.2
2015.2
2016.2
2017.2
Seve
rity
Accident Semester
Ultimate Severity
0.00
10.00
20.00
30.00
40.00
50.00
60.00
1998.2
1999.2
2000.2
2001.2
2002.2
2003.2
2004.2
2005.2
2006.2
2007.2
2008.2
2009.2
2010.2
2011.2
2012.2
2013.2
2014.2
2015.2
2016.2
2017.2
Fre
qu
en
cy
Accident Semester
Ultimate Freq. per 1000
0.00
50.00
100.00
150.00
200.00
250.00
1998.2
1999.2
2000.2
2001.2
2002.2
2003.2
2004.2
2005.2
2006.2
2007.2
2008.2
2009.2
2010.2
2011.2
2012.2
2013.2
2014.2
2015.2
2016.2
2017.2
Loss
Co
st
Accident Semester
Ultimate Loss Cost
Appendix B Page 8
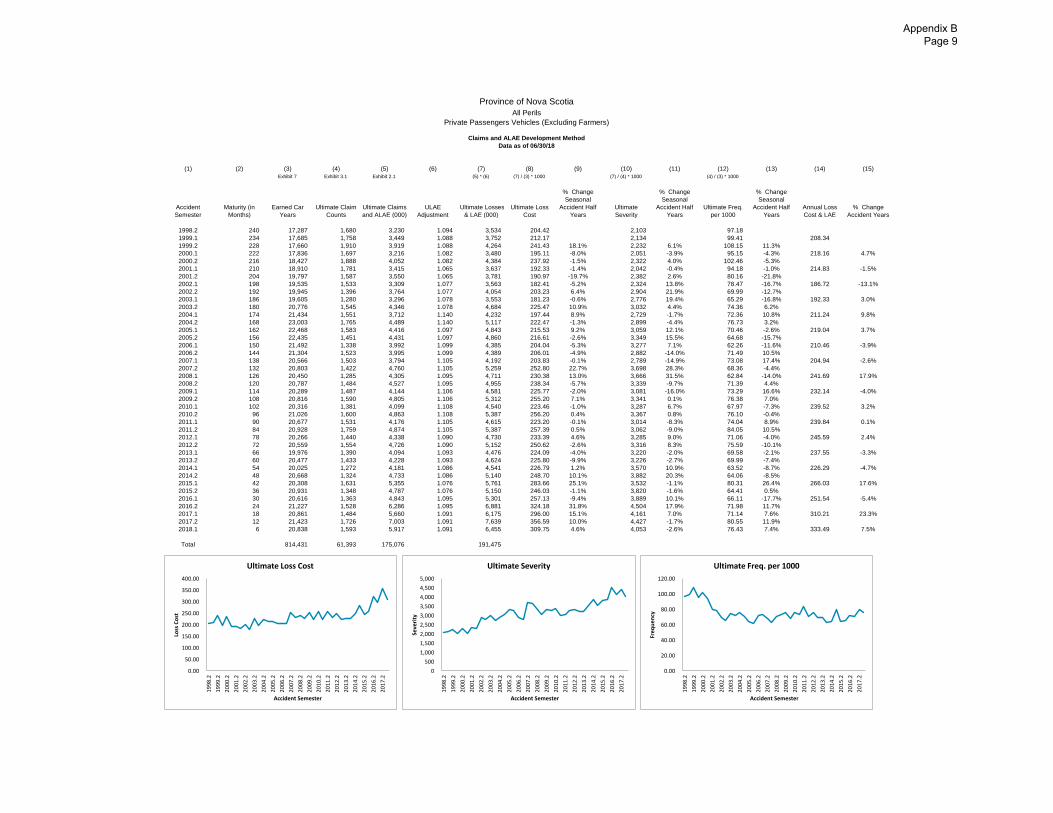
Province of Nova Scotia
All Perils
Private Passengers Vehicles (Excluding Farmers)
Claims and ALAE Development Method
Data as of 06/30/18
(1) (2) (3) (4) (5) (6) (7) (8) (9) (10) (11) (12) (13) (14) (15)
Exhibit 7 Exhibit 3.1 Exhibit 2.1 (5) * (6) (7) / (3) * 1000 (7) / (4) * 1000 (4) / (3) * 1000
Accident
Semester
Maturity (in
Months)
Earned Car
Years
Ultimate Claim
Counts
Ultimate Claims
and ALAE (000)
ULAE
Adjustment
Ultimate Losses
& LAE (000)
Ultimate Loss
Cost
% Change
Seasonal
Accident Half
Years
Ultimate
Severity
% Change
Seasonal
Accident Half
Years
Ultimate Freq.
per 1000
% Change
Seasonal
Accident Half
Years
Annual Loss
Cost & LAE
% Change
Accident Years
1998.2 240 17,287 1,680 3,230 1.094 3,534 204.42 2,103 97.18
1999.1 234 17,685 1,758 3,449 1.088 3,752 212.17 2,134 99.41 208.34
1999.2 228 17,660 1,910 3,919 1.088 4,264 241.43 18.1% 2,232 6.1% 108.15 11.3%
2000.1 222 17,836 1,697 3,216 1.082 3,480 195.11 -8.0% 2,051 -3.9% 95.15 -4.3% 218.16 4.7%
2000.2 216 18,427 1,888 4,052 1.082 4,384 237.92 -1.5% 2,322 4.0% 102.46 -5.3%
2001.1 210 18,910 1,781 3,415 1.065 3,637 192.33 -1.4% 2,042 -0.4% 94.18 -1.0% 214.83 -1.5%
2001.2 204 19,797 1,587 3,550 1.065 3,781 190.97 -19.7% 2,382 2.6% 80.16 -21.8%
2002.1 198 19,535 1,533 3,309 1.077 3,563 182.41 -5.2% 2,324 13.8% 78.47 -16.7% 186.72 -13.1%
2002.2 192 19,945 1,396 3,764 1.077 4,054 203.23 6.4% 2,904 21.9% 69.99 -12.7%
2003.1 186 19,605 1,280 3,296 1.078 3,553 181.23 -0.6% 2,776 19.4% 65.29 -16.8% 192.33 3.0%
2003.2 180 20,776 1,545 4,346 1.078 4,684 225.47 10.9% 3,032 4.4% 74.36 6.2%
2004.1 174 21,434 1,551 3,712 1.140 4,232 197.44 8.9% 2,729 -1.7% 72.36 10.8% 211.24 9.8%
2004.2 168 23,003 1,765 4,489 1.140 5,117 222.47 -1.3% 2,899 -4.4% 76.73 3.2%
2005.1 162 22,468 1,583 4,416 1.097 4,843 215.53 9.2% 3,059 12.1% 70.46 -2.6% 219.04 3.7%
2005.2 156 22,435 1,451 4,431 1.097 4,860 216.61 -2.6% 3,349 15.5% 64.68 -15.7%
2006.1 150 21,492 1,338 3,992 1.099 4,385 204.04 -5.3% 3,277 7.1% 62.26 -11.6% 210.46 -3.9%
2006.2 144 21,304 1,523 3,995 1.099 4,389 206.01 -4.9% 2,882 -14.0% 71.49 10.5%
2007.1 138 20,566 1,503 3,794 1.105 4,192 203.83 -0.1% 2,789 -14.9% 73.08 17.4% 204.94 -2.6%
2007.2 132 20,803 1,422 4,760 1.105 5,259 252.80 22.7% 3,698 28.3% 68.36 -4.4%
2008.1 126 20,450 1,285 4,305 1.095 4,711 230.38 13.0% 3,666 31.5% 62.84 -14.0% 241.69 17.9%
2008.2 120 20,787 1,484 4,527 1.095 4,955 238.34 -5.7% 3,339 -9.7% 71.39 4.4%
2009.1 114 20,289 1,487 4,144 1.106 4,581 225.77 -2.0% 3,081 -16.0% 73.29 16.6% 232.14 -4.0%
2009.2 108 20,816 1,590 4,805 1.106 5,312 255.20 7.1% 3,341 0.1% 76.38 7.0%
2010.1 102 20,316 1,381 4,099 1.108 4,540 223.46 -1.0% 3,287 6.7% 67.97 -7.3% 239.52 3.2%
2010.2 96 21,026 1,600 4,863 1.108 5,387 256.20 0.4% 3,367 0.8% 76.10 -0.4%
2011.1 90 20,677 1,531 4,176 1.105 4,615 223.20 -0.1% 3,014 -8.3% 74.04 8.9% 239.84 0.1%
2011.2 84 20,928 1,759 4,874 1.105 5,387 257.39 0.5% 3,062 -9.0% 84.05 10.5%
2012.1 78 20,266 1,440 4,338 1.090 4,730 233.39 4.6% 3,285 9.0% 71.06 -4.0% 245.59 2.4%
2012.2 72 20,559 1,554 4,726 1.090 5,152 250.62 -2.6% 3,316 8.3% 75.59 -10.1%
2013.1 66 19,976 1,390 4,094 1.093 4,476 224.09 -4.0% 3,220 -2.0% 69.58 -2.1% 237.55 -3.3%
2013.2 60 20,477 1,433 4,228 1.093 4,624 225.80 -9.9% 3,226 -2.7% 69.99 -7.4%
2014.1 54 20,025 1,272 4,181 1.086 4,541 226.79 1.2% 3,570 10.9% 63.52 -8.7% 226.29 -4.7%
2014.2 48 20,668 1,324 4,733 1.086 5,140 248.70 10.1% 3,882 20.3% 64.06 -8.5%
2015.1 42 20,308 1,631 5,355 1.076 5,761 283.66 25.1% 3,532 -1.1% 80.31 26.4% 266.03 17.6%
2015.2 36 20,931 1,348 4,787 1.076 5,150 246.03 -1.1% 3,820 -1.6% 64.41 0.5%
2016.1 30 20,616 1,363 4,843 1.095 5,301 257.13 -9.4% 3,889 10.1% 66.11 -17.7% 251.54 -5.4%
2016.2 24 21,227 1,528 6,286 1.095 6,881 324.18 31.8% 4,504 17.9% 71.98 11.7%
2017.1 18 20,861 1,484 5,660 1.091 6,175 296.00 15.1% 4,161 7.0% 71.14 7.6% 310.21 23.3%
2017.2 12 21,423 1,726 7,003 1.091 7,639 356.59 10.0% 4,427 -1.7% 80.55 11.9%
2018.1 6 20,838 1,593 5,917 1.091 6,455 309.75 4.6% 4,053 -2.6% 76.43 7.4% 333.49 7.5%
Total 814,431 61,393 175,076 191,475
0
500
1,000
1,500
2,000
2,500
3,000
3,500
4,000
4,500
5,000
1998.2
1999.2
2000.2
2001.2
2002.2
2003.2
2004.2
2005.2
2006.2
2007.2
2008.2
2009.2
2010.2
2011.2
2012.2
2013.2
2014.2
2015.2
2016.2
2017.2
Seve
rity
Accident Semester
Ultimate Severity
0.00
20.00
40.00
60.00
80.00
100.00
120.00
1998.2
1999.2
2000.2
2001.2
2002.2
2003.2
2004.2
2005.2
2006.2
2007.2
2008.2
2009.2
2010.2
2011.2
2012.2
2013.2
2014.2
2015.2
2016.2
2017.2
Fre
qu
en
cy
Accident Semester
Ultimate Freq. per 1000
0.00
50.00
100.00
150.00
200.00
250.00
300.00
350.00
400.00
1998.2
1999.2
2000.2
2001.2
2002.2
2003.2
2004.2
2005.2
2006.2
2007.2
2008.2
2009.2
2010.2
2011.2
2012.2
2013.2
2014.2
2015.2
2016.2
2017.2
Loss
Co
st
Accident Semester
Ultimate Loss Cost
Appendix B Page 9
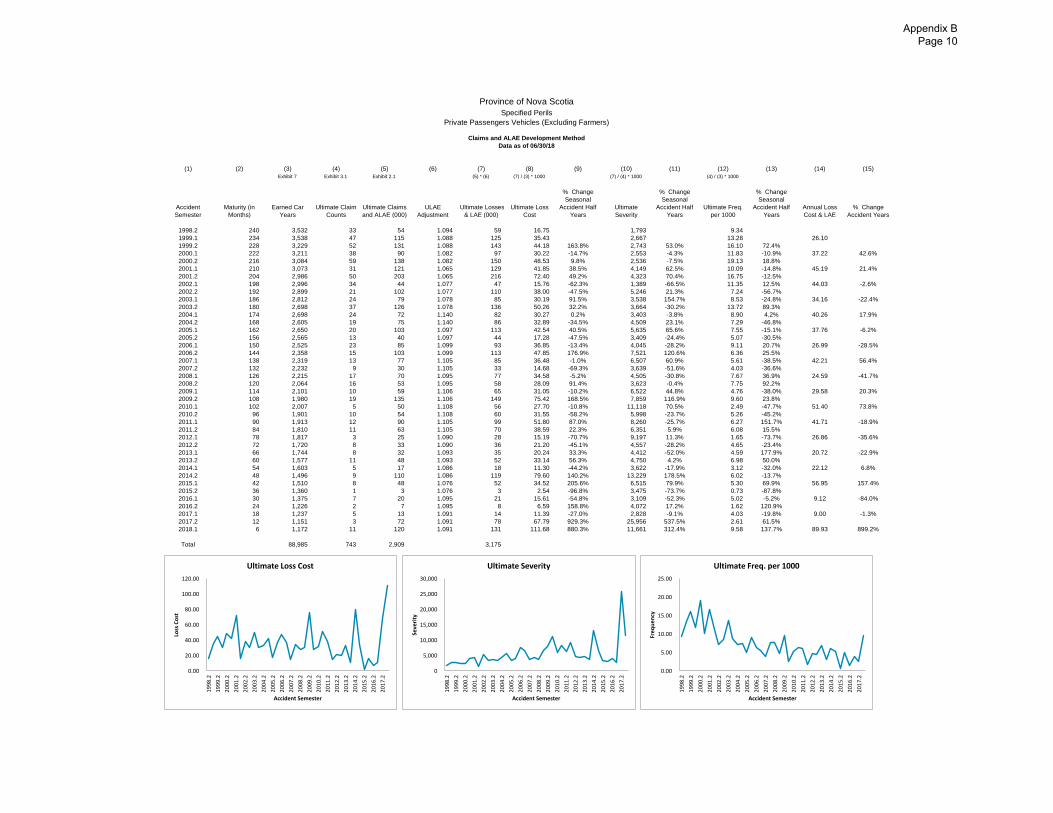
Province of Nova Scotia
Specified Perils
Private Passengers Vehicles (Excluding Farmers)
Claims and ALAE Development Method
Data as of 06/30/18
(1) (2) (3) (4) (5) (6) (7) (8) (9) (10) (11) (12) (13) (14) (15)
Exhibit 7 Exhibit 3.1 Exhibit 2.1 (5) * (6) (7) / (3) * 1000 (7) / (4) * 1000 (4) / (3) * 1000
Accident
Semester
Maturity (in
Months)
Earned Car
Years
Ultimate Claim
Counts
Ultimate Claims
and ALAE (000)
ULAE
Adjustment
Ultimate Losses
& LAE (000)
Ultimate Loss
Cost
% Change
Seasonal
Accident Half
Years
Ultimate
Severity
% Change
Seasonal
Accident Half
Years
Ultimate Freq.
per 1000
% Change
Seasonal
Accident Half
Years
Annual Loss
Cost & LAE
% Change
Accident Years
1998.2 240 3,532 33 54 1.094 59 16.75 1,793 9.34
1999.1 234 3,538 47 115 1.088 125 35.43 2,667 13.28 26.10
1999.2 228 3,229 52 131 1.088 143 44.18 163.8% 2,743 53.0% 16.10 72.4%
2000.1 222 3,211 38 90 1.082 97 30.22 -14.7% 2,553 -4.3% 11.83 -10.9% 37.22 42.6%
2000.2 216 3,084 59 138 1.082 150 48.53 9.8% 2,536 -7.5% 19.13 18.8%
2001.1 210 3,073 31 121 1.065 129 41.85 38.5% 4,149 62.5% 10.09 -14.8% 45.19 21.4%
2001.2 204 2,986 50 203 1.065 216 72.40 49.2% 4,323 70.4% 16.75 -12.5%
2002.1 198 2,996 34 44 1.077 47 15.76 -62.3% 1,389 -66.5% 11.35 12.5% 44.03 -2.6%
2002.2 192 2,899 21 102 1.077 110 38.00 -47.5% 5,246 21.3% 7.24 -56.7%
2003.1 186 2,812 24 79 1.078 85 30.19 91.5% 3,538 154.7% 8.53 -24.8% 34.16 -22.4%
2003.2 180 2,698 37 126 1.078 136 50.26 32.2% 3,664 -30.2% 13.72 89.3%
2004.1 174 2,698 24 72 1.140 82 30.27 0.2% 3,403 -3.8% 8.90 4.2% 40.26 17.9%
2004.2 168 2,605 19 75 1.140 86 32.89 -34.5% 4,509 23.1% 7.29 -46.8%
2005.1 162 2,650 20 103 1.097 113 42.54 40.5% 5,635 65.6% 7.55 -15.1% 37.76 -6.2%
2005.2 156 2,565 13 40 1.097 44 17.28 -47.5% 3,409 -24.4% 5.07 -30.5%
2006.1 150 2,525 23 85 1.099 93 36.85 -13.4% 4,045 -28.2% 9.11 20.7% 26.99 -28.5%
2006.2 144 2,358 15 103 1.099 113 47.85 176.9% 7,521 120.6% 6.36 25.5%
2007.1 138 2,319 13 77 1.105 85 36.48 -1.0% 6,507 60.9% 5.61 -38.5% 42.21 56.4%
2007.2 132 2,232 9 30 1.105 33 14.68 -69.3% 3,639 -51.6% 4.03 -36.6%
2008.1 126 2,215 17 70 1.095 77 34.58 -5.2% 4,505 -30.8% 7.67 36.9% 24.59 -41.7%
2008.2 120 2,064 16 53 1.095 58 28.09 91.4% 3,623 -0.4% 7.75 92.2%
2009.1 114 2,101 10 59 1.106 65 31.05 -10.2% 6,522 44.8% 4.76 -38.0% 29.58 20.3%
2009.2 108 1,980 19 135 1.106 149 75.42 168.5% 7,859 116.9% 9.60 23.8%
2010.1 102 2,007 5 50 1.108 56 27.70 -10.8% 11,118 70.5% 2.49 -47.7% 51.40 73.8%
2010.2 96 1,901 10 54 1.108 60 31.55 -58.2% 5,998 -23.7% 5.26 -45.2%
2011.1 90 1,913 12 90 1.105 99 51.80 87.0% 8,260 -25.7% 6.27 151.7% 41.71 -18.9%
2011.2 84 1,810 11 63 1.105 70 38.59 22.3% 6,351 5.9% 6.08 15.5%
2012.1 78 1,817 3 25 1.090 28 15.19 -70.7% 9,197 11.3% 1.65 -73.7% 26.86 -35.6%
2012.2 72 1,720 8 33 1.090 36 21.20 -45.1% 4,557 -28.2% 4.65 -23.4%
2013.1 66 1,744 8 32 1.093 35 20.24 33.3% 4,412 -52.0% 4.59 177.9% 20.72 -22.9%
2013.2 60 1,577 11 48 1.093 52 33.14 56.3% 4,750 4.2% 6.98 50.0%
2014.1 54 1,603 5 17 1.086 18 11.30 -44.2% 3,622 -17.9% 3.12 -32.0% 22.12 6.8%
2014.2 48 1,496 9 110 1.086 119 79.60 140.2% 13,229 178.5% 6.02 -13.7%
2015.1 42 1,510 8 48 1.076 52 34.52 205.6% 6,515 79.9% 5.30 69.9% 56.95 157.4%
2015.2 36 1,360 1 3 1.076 3 2.54 -96.8% 3,475 -73.7% 0.73 -87.8%
2016.1 30 1,375 7 20 1.095 21 15.61 -54.8% 3,109 -52.3% 5.02 -5.2% 9.12 -84.0%
2016.2 24 1,226 2 7 1.095 8 6.59 158.8% 4,072 17.2% 1.62 120.9%
2017.1 18 1,237 5 13 1.091 14 11.39 -27.0% 2,828 -9.1% 4.03 -19.8% 9.00 -1.3%
2017.2 12 1,151 3 72 1.091 78 67.79 929.3% 25,956 537.5% 2.61 61.5%
2018.1 6 1,172 11 120 1.091 131 111.68 880.3% 11,661 312.4% 9.58 137.7% 89.93 899.2%
Total 88,985 743 2,909 3,175
0
5,000
10,000
15,000
20,000
25,000
30,000
1998.2
1999.2
2000.2
2001.2
2002.2
2003.2
2004.2
2005.2
2006.2
2007.2
2008.2
2009.2
2010.2
2011.2
2012.2
2013.2
2014.2
2015.2
2016.2
2017.2
Seve
rity
Accident Semester
Ultimate Severity
0.00
5.00
10.00
15.00
20.00
25.00
1998.2
1999.2
2000.2
2001.2
2002.2
2003.2
2004.2
2005.2
2006.2
2007.2
2008.2
2009.2
2010.2
2011.2
2012.2
2013.2
2014.2
2015.2
2016.2
2017.2
Fre
qu
en
cy
Accident Semester
Ultimate Freq. per 1000
0.00
20.00
40.00
60.00
80.00
100.00
120.00
1998.2
1999.2
2000.2
2001.2
2002.2
2003.2
2004.2
2005.2
2006.2
2007.2
2008.2
2009.2
2010.2
2011.2
2012.2
2013.2
2014.2
2015.2
2016.2
2017.2
Loss
Co
st
Accident Semester
Ultimate Loss Cost
Appendix B Page 10
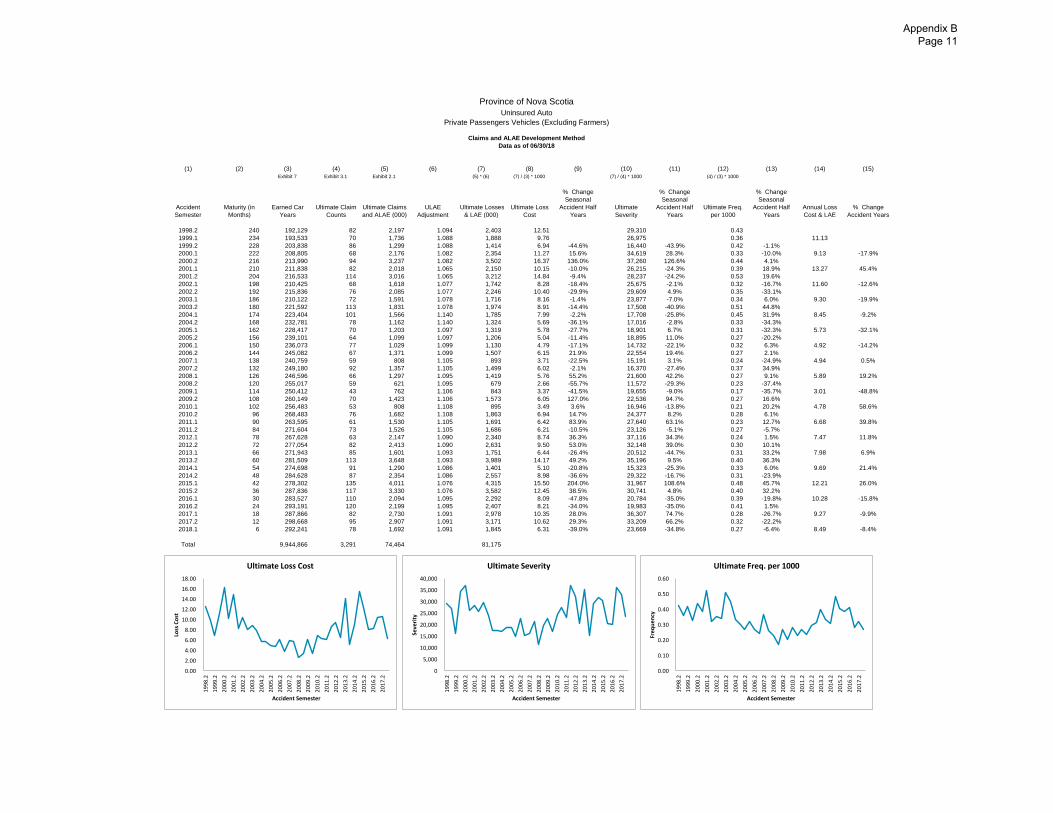
Province of Nova Scotia
Uninsured Auto
Private Passengers Vehicles (Excluding Farmers)
Claims and ALAE Development Method
Data as of 06/30/18
(1) (2) (3) (4) (5) (6) (7) (8) (9) (10) (11) (12) (13) (14) (15)
Exhibit 7 Exhibit 3.1 Exhibit 2.1 (5) * (6) (7) / (3) * 1000 (7) / (4) * 1000 (4) / (3) * 1000
Accident
Semester
Maturity (in
Months)
Earned Car
Years
Ultimate Claim
Counts
Ultimate Claims
and ALAE (000)
ULAE
Adjustment
Ultimate Losses
& LAE (000)
Ultimate Loss
Cost
% Change
Seasonal
Accident Half
Years
Ultimate
Severity
% Change
Seasonal
Accident Half
Years
Ultimate Freq.
per 1000
% Change
Seasonal
Accident Half
Years
Annual Loss
Cost & LAE
% Change
Accident Years
1998.2 240 192,129 82 2,197 1.094 2,403 12.51 29,310 0.43
1999.1 234 193,533 70 1,736 1.088 1,888 9.76 26,975 0.36 11.13
1999.2 228 203,838 86 1,299 1.088 1,414 6.94 -44.6% 16,440 -43.9% 0.42 -1.1%
2000.1 222 208,805 68 2,176 1.082 2,354 11.27 15.6% 34,619 28.3% 0.33 -10.0% 9.13 -17.9%
2000.2 216 213,990 94 3,237 1.082 3,502 16.37 136.0% 37,260 126.6% 0.44 4.1%
2001.1 210 211,838 82 2,018 1.065 2,150 10.15 -10.0% 26,215 -24.3% 0.39 18.9% 13.27 45.4%
2001.2 204 216,533 114 3,016 1.065 3,212 14.84 -9.4% 28,237 -24.2% 0.53 19.6%
2002.1 198 210,425 68 1,618 1.077 1,742 8.28 -18.4% 25,675 -2.1% 0.32 -16.7% 11.60 -12.6%
2002.2 192 215,836 76 2,085 1.077 2,246 10.40 -29.9% 29,609 4.9% 0.35 -33.1%
2003.1 186 210,122 72 1,591 1.078 1,716 8.16 -1.4% 23,877 -7.0% 0.34 6.0% 9.30 -19.9%
2003.2 180 221,592 113 1,831 1.078 1,974 8.91 -14.4% 17,508 -40.9% 0.51 44.8%
2004.1 174 223,404 101 1,566 1.140 1,785 7.99 -2.2% 17,708 -25.8% 0.45 31.9% 8.45 -9.2%
2004.2 168 232,781 78 1,162 1.140 1,324 5.69 -36.1% 17,016 -2.8% 0.33 -34.3%
2005.1 162 228,417 70 1,203 1.097 1,319 5.78 -27.7% 18,901 6.7% 0.31 -32.3% 5.73 -32.1%
2005.2 156 239,101 64 1,099 1.097 1,206 5.04 -11.4% 18,895 11.0% 0.27 -20.2%
2006.1 150 236,073 77 1,029 1.099 1,130 4.79 -17.1% 14,732 -22.1% 0.32 6.3% 4.92 -14.2%
2006.2 144 245,082 67 1,371 1.099 1,507 6.15 21.9% 22,554 19.4% 0.27 2.1%
2007.1 138 240,759 59 808 1.105 893 3.71 -22.5% 15,191 3.1% 0.24 -24.9% 4.94 0.5%
2007.2 132 249,180 92 1,357 1.105 1,499 6.02 -2.1% 16,370 -27.4% 0.37 34.9%
2008.1 126 246,596 66 1,297 1.095 1,419 5.76 55.2% 21,600 42.2% 0.27 9.1% 5.89 19.2%
2008.2 120 255,017 59 621 1.095 679 2.66 -55.7% 11,572 -29.3% 0.23 -37.4%
2009.1 114 250,412 43 762 1.106 843 3.37 -41.5% 19,655 -9.0% 0.17 -35.7% 3.01 -48.8%
2009.2 108 260,149 70 1,423 1.106 1,573 6.05 127.0% 22,536 94.7% 0.27 16.6%
2010.1 102 256,483 53 808 1.108 895 3.49 3.6% 16,946 -13.8% 0.21 20.2% 4.78 58.6%
2010.2 96 268,483 76 1,682 1.108 1,863 6.94 14.7% 24,377 8.2% 0.28 6.1%
2011.1 90 263,595 61 1,530 1.105 1,691 6.42 83.9% 27,640 63.1% 0.23 12.7% 6.68 39.8%
2011.2 84 271,604 73 1,526 1.105 1,686 6.21 -10.5% 23,126 -5.1% 0.27 -5.7%
2012.1 78 267,628 63 2,147 1.090 2,340 8.74 36.3% 37,116 34.3% 0.24 1.5% 7.47 11.8%
2012.2 72 277,054 82 2,413 1.090 2,631 9.50 53.0% 32,148 39.0% 0.30 10.1%
2013.1 66 271,943 85 1,601 1.093 1,751 6.44 -26.4% 20,512 -44.7% 0.31 33.2% 7.98 6.9%
2013.2 60 281,509 113 3,648 1.093 3,989 14.17 49.2% 35,196 9.5% 0.40 36.3%
2014.1 54 274,698 91 1,290 1.086 1,401 5.10 -20.8% 15,323 -25.3% 0.33 6.0% 9.69 21.4%
2014.2 48 284,628 87 2,354 1.086 2,557 8.98 -36.6% 29,322 -16.7% 0.31 -23.9%
2015.1 42 278,302 135 4,011 1.076 4,315 15.50 204.0% 31,967 108.6% 0.48 45.7% 12.21 26.0%
2015.2 36 287,836 117 3,330 1.076 3,582 12.45 38.5% 30,741 4.8% 0.40 32.2%
2016.1 30 283,527 110 2,094 1.095 2,292 8.09 -47.8% 20,784 -35.0% 0.39 -19.8% 10.28 -15.8%
2016.2 24 293,191 120 2,199 1.095 2,407 8.21 -34.0% 19,983 -35.0% 0.41 1.5%
2017.1 18 287,866 82 2,730 1.091 2,978 10.35 28.0% 36,307 74.7% 0.28 -26.7% 9.27 -9.9%
2017.2 12 298,668 95 2,907 1.091 3,171 10.62 29.3% 33,209 66.2% 0.32 -22.2%
2018.1 6 292,241 78 1,692 1.091 1,845 6.31 -39.0% 23,669 -34.8% 0.27 -6.4% 8.49 -8.4%
Total 9,944,866 3,291 74,464 81,175
0
5,000
10,000
15,000
20,000
25,000
30,000
35,000
40,000
1998.2
1999.2
2000.2
2001.2
2002.2
2003.2
2004.2
2005.2
2006.2
2007.2
2008.2
2009.2
2010.2
2011.2
2012.2
2013.2
2014.2
2015.2
2016.2
2017.2
Seve
rity
Accident Semester
Ultimate Severity
0.00
0.10
0.20
0.30
0.40
0.50
0.60
1998.2
1999.2
2000.2
2001.2
2002.2
2003.2
2004.2
2005.2
2006.2
2007.2
2008.2
2009.2
2010.2
2011.2
2012.2
2013.2
2014.2
2015.2
2016.2
2017.2
Fre
qu
en
cy
Accident Semester
Ultimate Freq. per 1000
0.00
2.00
4.00
6.00
8.00
10.00
12.00
14.00
16.00
18.00
1998.2
1999.2
2000.2
2001.2
2002.2
2003.2
2004.2
2005.2
2006.2
2007.2
2008.2
2009.2
2010.2
2011.2
2012.2
2013.2
2014.2
2015.2
2016.2
2017.2
Loss
Co
st
Accident Semester
Ultimate Loss Cost
Appendix B Page 11
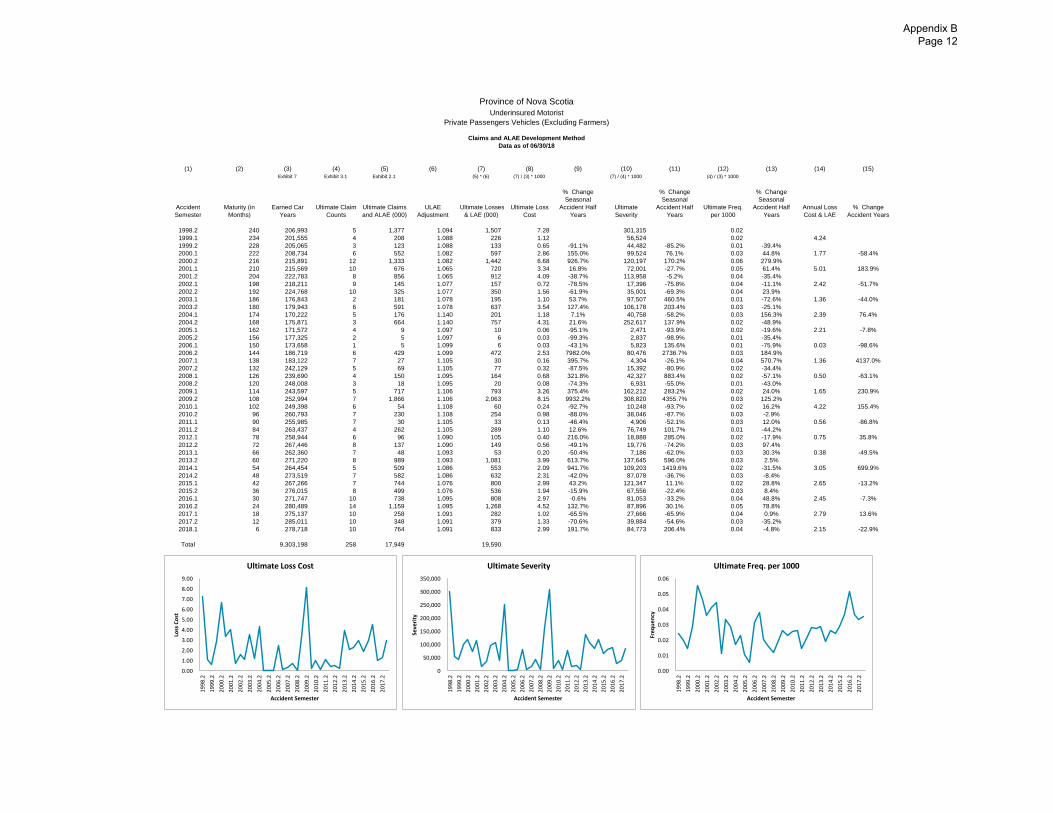
Province of Nova Scotia
Underinsured Motorist
Private Passengers Vehicles (Excluding Farmers)
Claims and ALAE Development Method
Data as of 06/30/18
(1) (2) (3) (4) (5) (6) (7) (8) (9) (10) (11) (12) (13) (14) (15)
Exhibit 7 Exhibit 3.1 Exhibit 2.1 (5) * (6) (7) / (3) * 1000 (7) / (4) * 1000 (4) / (3) * 1000
Accident
Semester
Maturity (in
Months)
Earned Car
Years
Ultimate Claim
Counts
Ultimate Claims
and ALAE (000)
ULAE
Adjustment
Ultimate Losses
& LAE (000)
Ultimate Loss
Cost
% Change
Seasonal
Accident Half
Years
Ultimate
Severity
% Change
Seasonal
Accident Half
Years
Ultimate Freq.
per 1000
% Change
Seasonal
Accident Half
Years
Annual Loss
Cost & LAE
% Change
Accident Years
1998.2 240 206,993 5 1,377 1.094 1,507 7.28 301,315 0.02
1999.1 234 201,555 4 208 1.088 226 1.12 56,524 0.02 4.24
1999.2 228 205,065 3 123 1.088 133 0.65 -91.1% 44,482 -85.2% 0.01 -39.4%
2000.1 222 208,734 6 552 1.082 597 2.86 155.0% 99,524 76.1% 0.03 44.8% 1.77 -58.4%
2000.2 216 215,891 12 1,333 1.082 1,442 6.68 926.7% 120,197 170.2% 0.06 279.9%
2001.1 210 215,569 10 676 1.065 720 3.34 16.8% 72,001 -27.7% 0.05 61.4% 5.01 183.9%
2001.2 204 222,783 8 856 1.065 912 4.09 -38.7% 113,958 -5.2% 0.04 -35.4%
2002.1 198 218,211 9 145 1.077 157 0.72 -78.5% 17,396 -75.8% 0.04 -11.1% 2.42 -51.7%
2002.2 192 224,768 10 325 1.077 350 1.56 -61.9% 35,001 -69.3% 0.04 23.9%
2003.1 186 176,843 2 181 1.078 195 1.10 53.7% 97,507 460.5% 0.01 -72.6% 1.36 -44.0%
2003.2 180 179,943 6 591 1.078 637 3.54 127.4% 106,178 203.4% 0.03 -25.1%
2004.1 174 170,222 5 176 1.140 201 1.18 7.1% 40,758 -58.2% 0.03 156.3% 2.39 76.4%
2004.2 168 175,871 3 664 1.140 757 4.31 21.6% 252,617 137.9% 0.02 -48.9%
2005.1 162 171,572 4 9 1.097 10 0.06 -95.1% 2,471 -93.9% 0.02 -19.6% 2.21 -7.8%
2005.2 156 177,325 2 5 1.097 6 0.03 -99.3% 2,837 -98.9% 0.01 -35.4%
2006.1 150 173,658 1 5 1.099 6 0.03 -43.1% 5,823 135.6% 0.01 -75.9% 0.03 -98.6%
2006.2 144 186,719 6 429 1.099 472 2.53 7982.0% 80,476 2736.7% 0.03 184.9%
2007.1 138 183,122 7 27 1.105 30 0.16 395.7% 4,304 -26.1% 0.04 570.7% 1.36 4137.0%
2007.2 132 242,129 5 69 1.105 77 0.32 -87.5% 15,392 -80.9% 0.02 -34.4%
2008.1 126 239,690 4 150 1.095 164 0.68 321.8% 42,327 883.4% 0.02 -57.1% 0.50 -63.1%
2008.2 120 248,008 3 18 1.095 20 0.08 -74.3% 6,931 -55.0% 0.01 -43.0%
2009.1 114 243,597 5 717 1.106 793 3.26 375.4% 162,212 283.2% 0.02 24.0% 1.65 230.9%
2009.2 108 252,994 7 1,866 1.106 2,063 8.15 9932.2% 308,820 4355.7% 0.03 125.2%
2010.1 102 249,398 6 54 1.108 60 0.24 -92.7% 10,248 -93.7% 0.02 16.2% 4.22 155.4%
2010.2 96 260,793 7 230 1.108 254 0.98 -88.0% 38,046 -87.7% 0.03 -2.9%
2011.1 90 255,985 7 30 1.105 33 0.13 -46.4% 4,906 -52.1% 0.03 12.0% 0.56 -86.8%
2011.2 84 263,437 4 262 1.105 289 1.10 12.6% 76,749 101.7% 0.01 -44.2%
2012.1 78 258,944 6 96 1.090 105 0.40 216.0% 18,888 285.0% 0.02 -17.9% 0.75 35.8%
2012.2 72 267,446 8 137 1.090 149 0.56 -49.1% 19,776 -74.2% 0.03 97.4%
2013.1 66 262,360 7 48 1.093 53 0.20 -50.4% 7,186 -62.0% 0.03 30.3% 0.38 -49.5%
2013.2 60 271,220 8 989 1.093 1,081 3.99 613.7% 137,645 596.0% 0.03 2.5%
2014.1 54 264,454 5 509 1.086 553 2.09 941.7% 109,203 1419.6% 0.02 -31.5% 3.05 699.9%
2014.2 48 273,519 7 582 1.086 632 2.31 -42.0% 87,078 -36.7% 0.03 -8.4%
2015.1 42 267,266 7 744 1.076 800 2.99 43.2% 121,347 11.1% 0.02 28.8% 2.65 -13.2%
2015.2 36 276,015 8 499 1.076 536 1.94 -15.9% 67,556 -22.4% 0.03 8.4%
2016.1 30 271,747 10 738 1.095 808 2.97 -0.6% 81,053 -33.2% 0.04 48.8% 2.45 -7.3%
2016.2 24 280,489 14 1,159 1.095 1,268 4.52 132.7% 87,896 30.1% 0.05 78.8%
2017.1 18 275,137 10 258 1.091 282 1.02 -65.5% 27,666 -65.9% 0.04 0.9% 2.79 13.6%
2017.2 12 285,011 10 348 1.091 379 1.33 -70.6% 39,884 -54.6% 0.03 -35.2%
2018.1 6 278,718 10 764 1.091 833 2.99 191.7% 84,773 206.4% 0.04 -4.8% 2.15 -22.9%
Total 9,303,198 258 17,949 19,590
0
50,000
100,000
150,000
200,000
250,000
300,000
350,000
1998.2
1999.2
2000.2
2001.2
2002.2
2003.2
2004.2
2005.2
2006.2
2007.2
2008.2
2009.2
2010.2
2011.2
2012.2
2013.2
2014.2
2015.2
2016.2
2017.2
Seve
rity
Accident Semester
Ultimate Severity
0.00
0.01
0.02
0.03
0.04
0.05
0.06
1998.2
1999.2
2000.2
2001.2
2002.2
2003.2
2004.2
2005.2
2006.2
2007.2
2008.2
2009.2
2010.2
2011.2
2012.2
2013.2
2014.2
2015.2
2016.2
2017.2
Fre
qu
en
cy
Accident Semester
Ultimate Freq. per 1000
0.00
1.00
2.00
3.00
4.00
5.00
6.00
7.00
8.00
9.00
1998.2
1999.2
2000.2
2001.2
2002.2
2003.2
2004.2
2005.2
2006.2
2007.2
2008.2
2009.2
2010.2
2011.2
2012.2
2013.2
2014.2
2015.2
2016.2
2017.2
Loss
Co
st
Accident Semester
Ultimate Loss Cost
Appendix B Page 12
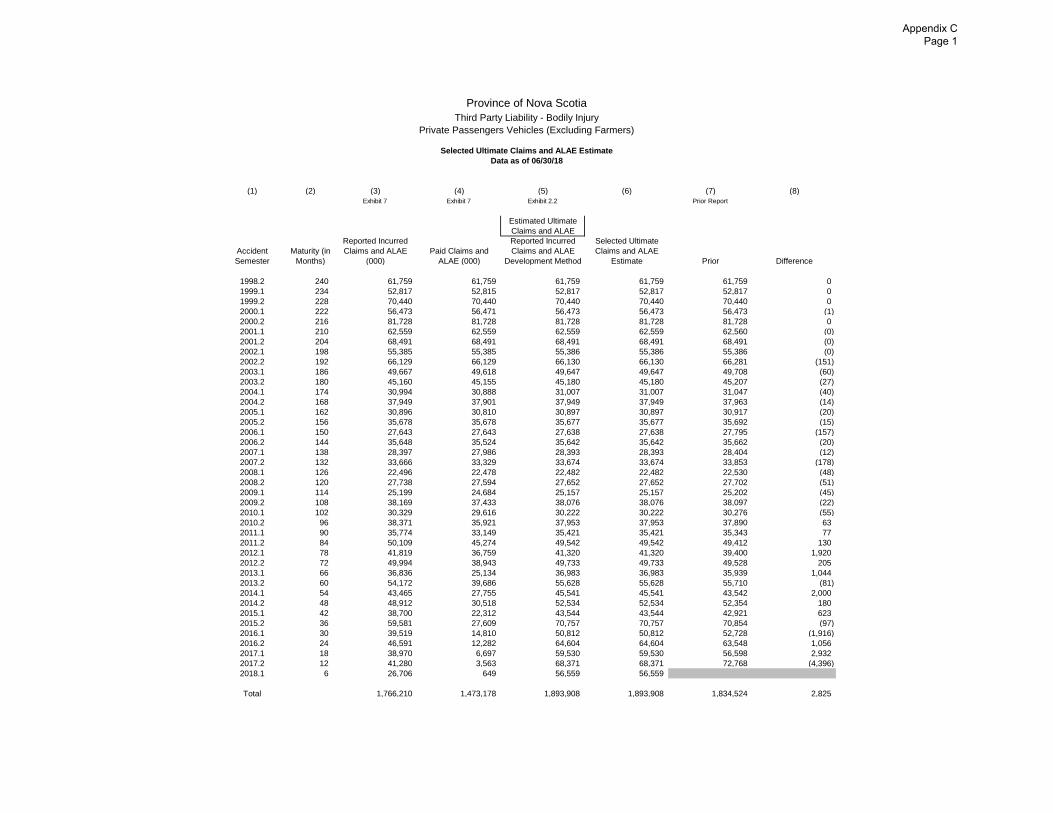
Province of Nova Scotia
Third Party Liability - Bodily Injury
Private Passengers Vehicles (Excluding Farmers)
Selected Ultimate Claims and ALAE Estimate
Data as of 06/30/18
(1) (2) (3) (4) (5) (6) (7) (8)
Exhibit 7 Exhibit 7 Exhibit 2.2 Prior Report
Estimated Ultimate
Claims and ALAE
Accident
Semester
Maturity (in
Months)
Reported Incurred
Claims and ALAE
(000)
Paid Claims and
ALAE (000)
Reported Incurred
Claims and ALAE
Development Method
Selected Ultimate
Claims and ALAE
Estimate Prior Difference
1998.2 240 61,759 61,759 61,759 61,759 61,759 0
1999.1 234 52,817 52,815 52,817 52,817 52,817 0
1999.2 228 70,440 70,440 70,440 70,440 70,440 0
2000.1 222 56,473 56,471 56,473 56,473 56,473 (1)
2000.2 216 81,728 81,728 81,728 81,728 81,728 0
2001.1 210 62,559 62,559 62,559 62,559 62,560 (0)
2001.2 204 68,491 68,491 68,491 68,491 68,491 (0)
2002.1 198 55,385 55,385 55,386 55,386 55,386 (0)
2002.2 192 66,129 66,129 66,130 66,130 66,281 (151)
2003.1 186 49,667 49,618 49,647 49,647 49,708 (60)
2003.2 180 45,160 45,155 45,180 45,180 45,207 (27)
2004.1 174 30,994 30,888 31,007 31,007 31,047 (40)
2004.2 168 37,949 37,901 37,949 37,949 37,963 (14)
2005.1 162 30,896 30,810 30,897 30,897 30,917 (20)
2005.2 156 35,678 35,678 35,677 35,677 35,692 (15)
2006.1 150 27,643 27,643 27,638 27,638 27,795 (157)
2006.2 144 35,648 35,524 35,642 35,642 35,662 (20)
2007.1 138 28,397 27,986 28,393 28,393 28,404 (12)
2007.2 132 33,666 33,329 33,674 33,674 33,853 (178)
2008.1 126 22,496 22,478 22,482 22,482 22,530 (48)
2008.2 120 27,738 27,594 27,652 27,652 27,702 (51)
2009.1 114 25,199 24,684 25,157 25,157 25,202 (45)
2009.2 108 38,169 37,433 38,076 38,076 38,097 (22)
2010.1 102 30,329 29,616 30,222 30,222 30,276 (55)
2010.2 96 38,371 35,921 37,953 37,953 37,890 63
2011.1 90 35,774 33,149 35,421 35,421 35,343 77
2011.2 84 50,109 45,274 49,542 49,542 49,412 130
2012.1 78 41,819 36,759 41,320 41,320 39,400 1,920
2012.2 72 49,994 38,943 49,733 49,733 49,528 205
2013.1 66 36,836 25,134 36,983 36,983 35,939 1,044
2013.2 60 54,172 39,686 55,628 55,628 55,710 (81)
2014.1 54 43,465 27,755 45,541 45,541 43,542 2,000
2014.2 48 48,912 30,518 52,534 52,534 52,354 180
2015.1 42 38,700 22,312 43,544 43,544 42,921 623
2015.2 36 59,581 27,609 70,757 70,757 70,854 (97)
2016.1 30 39,519 14,810 50,812 50,812 52,728 (1,916)
2016.2 24 46,591 12,282 64,604 64,604 63,548 1,056
2017.1 18 38,970 6,697 59,530 59,530 56,598 2,932
2017.2 12 41,280 3,563 68,371 68,371 72,768 (4,396)
2018.1 6 26,706 649 56,559 56,559
Total 1,766,210 1,473,178 1,893,908 1,893,908 1,834,524 2,825
Appendix C Page 1
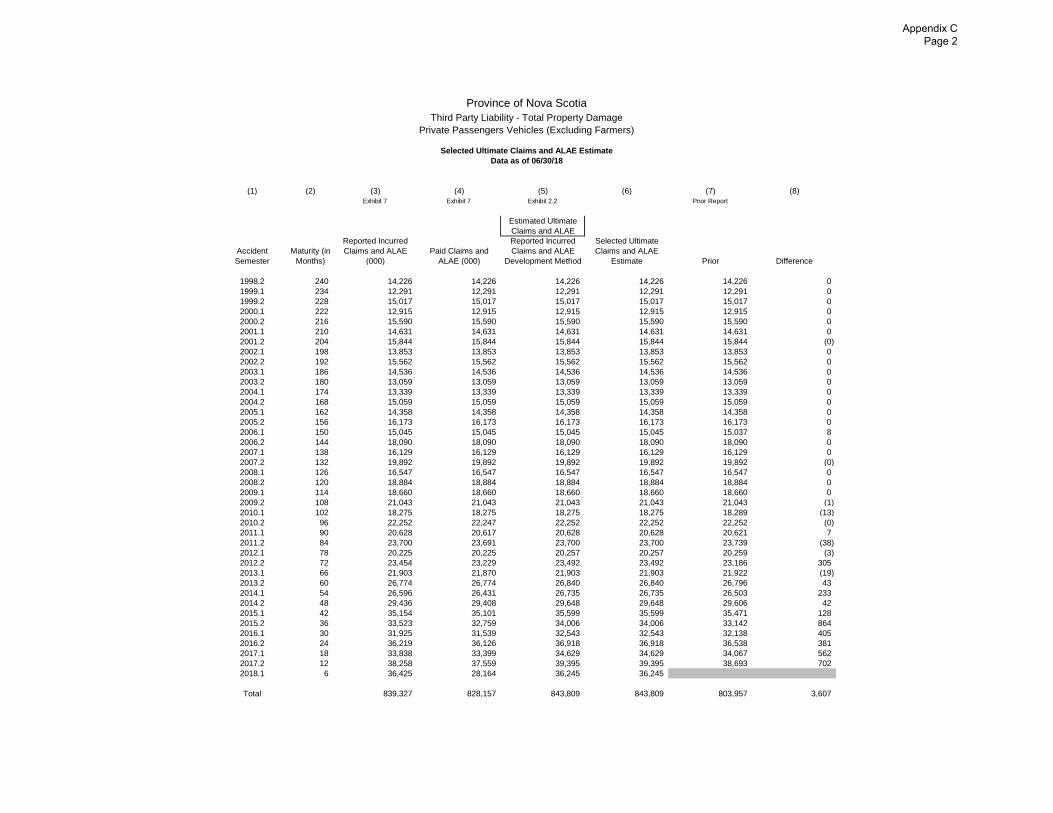
Province of Nova Scotia
Third Party Liability - Total Property Damage
Private Passengers Vehicles (Excluding Farmers)
Selected Ultimate Claims and ALAE Estimate
Data as of 06/30/18
(1) (2) (3) (4) (5) (6) (7) (8)
Exhibit 7 Exhibit 7 Exhibit 2.2 Prior Report
Estimated Ultimate
Claims and ALAE
Accident
Semester
Maturity (in
Months)
Reported Incurred
Claims and ALAE
(000)
Paid Claims and
ALAE (000)
Reported Incurred
Claims and ALAE
Development Method
Selected Ultimate
Claims and ALAE
Estimate Prior Difference
1998.2 240 14,226 14,226 14,226 14,226 14,226 0
1999.1 234 12,291 12,291 12,291 12,291 12,291 0
1999.2 228 15,017 15,017 15,017 15,017 15,017 0
2000.1 222 12,915 12,915 12,915 12,915 12,915 0
2000.2 216 15,590 15,590 15,590 15,590 15,590 0
2001.1 210 14,631 14,631 14,631 14,631 14,631 0
2001.2 204 15,844 15,844 15,844 15,844 15,844 (0)
2002.1 198 13,853 13,853 13,853 13,853 13,853 0
2002.2 192 15,562 15,562 15,562 15,562 15,562 0
2003.1 186 14,536 14,536 14,536 14,536 14,536 0
2003.2 180 13,059 13,059 13,059 13,059 13,059 0
2004.1 174 13,339 13,339 13,339 13,339 13,339 0
2004.2 168 15,059 15,059 15,059 15,059 15,059 0
2005.1 162 14,358 14,358 14,358 14,358 14,358 0
2005.2 156 16,173 16,173 16,173 16,173 16,173 0
2006.1 150 15,045 15,045 15,045 15,045 15,037 8
2006.2 144 18,090 18,090 18,090 18,090 18,090 0
2007.1 138 16,129 16,129 16,129 16,129 16,129 0
2007.2 132 19,892 19,892 19,892 19,892 19,892 (0)
2008.1 126 16,547 16,547 16,547 16,547 16,547 0
2008.2 120 18,884 18,884 18,884 18,884 18,884 0
2009.1 114 18,660 18,660 18,660 18,660 18,660 0
2009.2 108 21,043 21,043 21,043 21,043 21,043 (1)
2010.1 102 18,275 18,275 18,275 18,275 18,289 (13)
2010.2 96 22,252 22,247 22,252 22,252 22,252 (0)
2011.1 90 20,628 20,617 20,628 20,628 20,621 7
2011.2 84 23,700 23,691 23,700 23,700 23,739 (38)
2012.1 78 20,225 20,225 20,257 20,257 20,259 (3)
2012.2 72 23,454 23,229 23,492 23,492 23,186 305
2013.1 66 21,903 21,870 21,903 21,903 21,922 (19)
2013.2 60 26,774 26,774 26,840 26,840 26,796 43
2014.1 54 26,596 26,431 26,735 26,735 26,503 233
2014.2 48 29,436 29,408 29,648 29,648 29,606 42
2015.1 42 35,154 35,101 35,599 35,599 35,471 128
2015.2 36 33,523 32,759 34,006 34,006 33,142 864
2016.1 30 31,925 31,539 32,543 32,543 32,138 405
2016.2 24 36,219 36,126 36,918 36,918 36,538 381
2017.1 18 33,838 33,399 34,629 34,629 34,067 562
2017.2 12 38,258 37,559 39,395 39,395 38,693 702
2018.1 6 36,425 28,164 36,245 36,245
Total 839,327 828,157 843,809 843,809 803,957 3,607
Appendix C Page 2
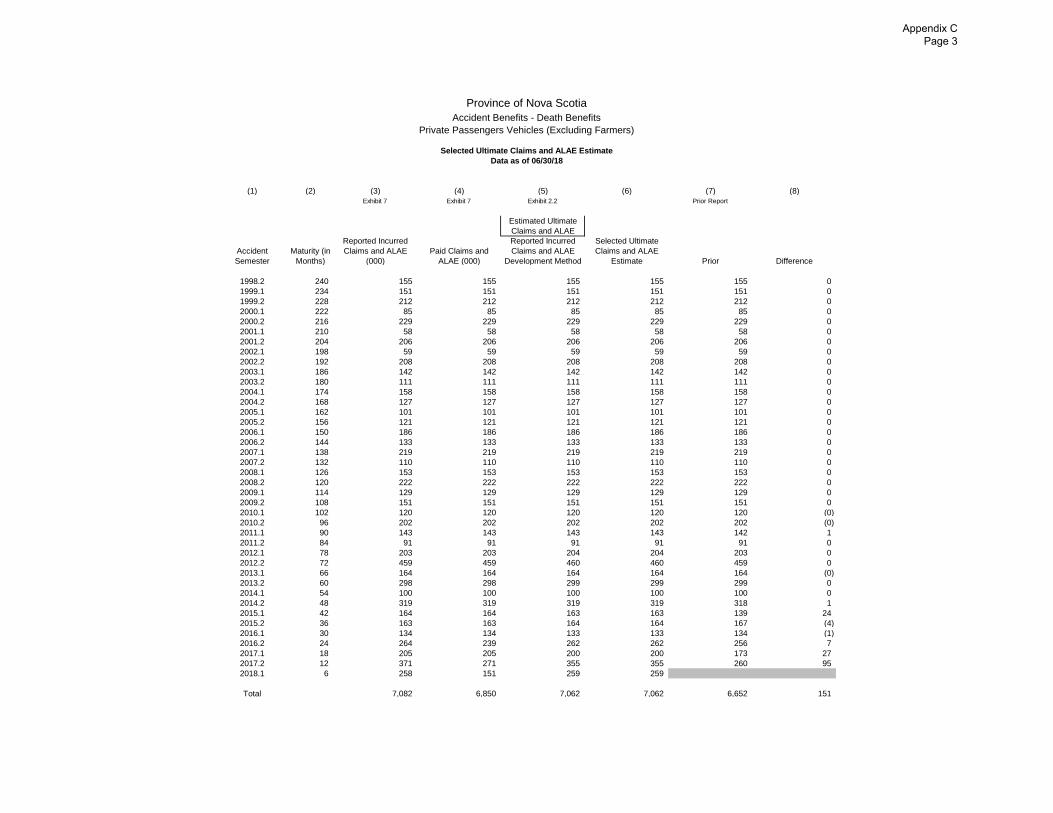
Province of Nova Scotia
Accident Benefits - Death Benefits
Private Passengers Vehicles (Excluding Farmers)
Selected Ultimate Claims and ALAE Estimate
Data as of 06/30/18
(1) (2) (3) (4) (5) (6) (7) (8)
Exhibit 7 Exhibit 7 Exhibit 2.2 Prior Report
Estimated Ultimate
Claims and ALAE
Accident
Semester
Maturity (in
Months)
Reported Incurred
Claims and ALAE
(000)
Paid Claims and
ALAE (000)
Reported Incurred
Claims and ALAE
Development Method
Selected Ultimate
Claims and ALAE
Estimate Prior Difference
1998.2 240 155 155 155 155 155 0
1999.1 234 151 151 151 151 151 0
1999.2 228 212 212 212 212 212 0
2000.1 222 85 85 85 85 85 0
2000.2 216 229 229 229 229 229 0
2001.1 210 58 58 58 58 58 0
2001.2 204 206 206 206 206 206 0
2002.1 198 59 59 59 59 59 0
2002.2 192 208 208 208 208 208 0
2003.1 186 142 142 142 142 142 0
2003.2 180 111 111 111 111 111 0
2004.1 174 158 158 158 158 158 0
2004.2 168 127 127 127 127 127 0
2005.1 162 101 101 101 101 101 0
2005.2 156 121 121 121 121 121 0
2006.1 150 186 186 186 186 186 0
2006.2 144 133 133 133 133 133 0
2007.1 138 219 219 219 219 219 0
2007.2 132 110 110 110 110 110 0
2008.1 126 153 153 153 153 153 0
2008.2 120 222 222 222 222 222 0
2009.1 114 129 129 129 129 129 0
2009.2 108 151 151 151 151 151 0
2010.1 102 120 120 120 120 120 (0)
2010.2 96 202 202 202 202 202 (0)
2011.1 90 143 143 143 143 142 1
2011.2 84 91 91 91 91 91 0
2012.1 78 203 203 204 204 203 0
2012.2 72 459 459 460 460 459 0
2013.1 66 164 164 164 164 164 (0)
2013.2 60 298 298 299 299 299 0
2014.1 54 100 100 100 100 100 0
2014.2 48 319 319 319 319 318 1
2015.1 42 164 164 163 163 139 24
2015.2 36 163 163 164 164 167 (4)
2016.1 30 134 134 133 133 134 (1)
2016.2 24 264 239 262 262 256 7
2017.1 18 205 205 200 200 173 27
2017.2 12 371 271 355 355 260 95
2018.1 6 258 151 259 259
Total 7,082 6,850 7,062 7,062 6,652 151
Appendix C Page 3
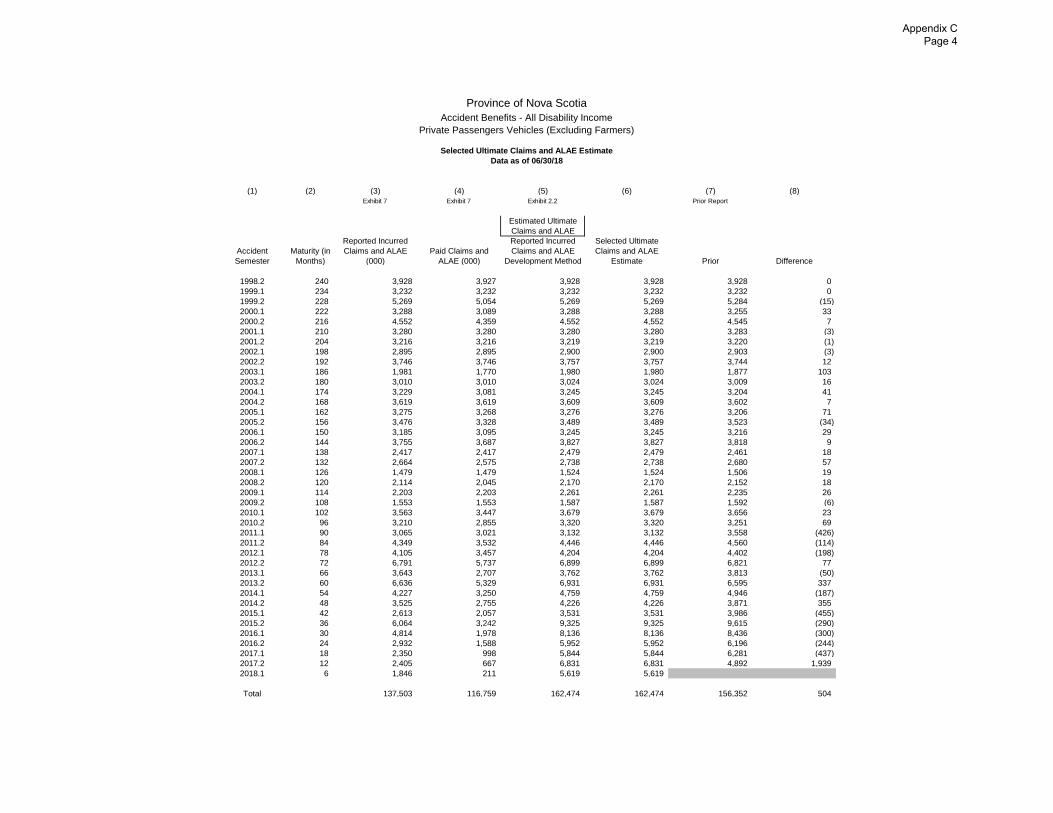
Province of Nova Scotia
Accident Benefits - All Disability Income
Private Passengers Vehicles (Excluding Farmers)
Selected Ultimate Claims and ALAE Estimate
Data as of 06/30/18
(1) (2) (3) (4) (5) (6) (7) (8)
Exhibit 7 Exhibit 7 Exhibit 2.2 Prior Report
Estimated Ultimate
Claims and ALAE
Accident
Semester
Maturity (in
Months)
Reported Incurred
Claims and ALAE
(000)
Paid Claims and
ALAE (000)
Reported Incurred
Claims and ALAE
Development Method
Selected Ultimate
Claims and ALAE
Estimate Prior Difference
1998.2 240 3,928 3,927 3,928 3,928 3,928 0
1999.1 234 3,232 3,232 3,232 3,232 3,232 0
1999.2 228 5,269 5,054 5,269 5,269 5,284 (15)
2000.1 222 3,288 3,089 3,288 3,288 3,255 33
2000.2 216 4,552 4,359 4,552 4,552 4,545 7
2001.1 210 3,280 3,280 3,280 3,280 3,283 (3)
2001.2 204 3,216 3,216 3,219 3,219 3,220 (1)
2002.1 198 2,895 2,895 2,900 2,900 2,903 (3)
2002.2 192 3,746 3,746 3,757 3,757 3,744 12
2003.1 186 1,981 1,770 1,980 1,980 1,877 103
2003.2 180 3,010 3,010 3,024 3,024 3,009 16
2004.1 174 3,229 3,081 3,245 3,245 3,204 41
2004.2 168 3,619 3,619 3,609 3,609 3,602 7
2005.1 162 3,275 3,268 3,276 3,276 3,206 71
2005.2 156 3,476 3,328 3,489 3,489 3,523 (34)
2006.1 150 3,185 3,095 3,245 3,245 3,216 29
2006.2 144 3,755 3,687 3,827 3,827 3,818 9
2007.1 138 2,417 2,417 2,479 2,479 2,461 18
2007.2 132 2,664 2,575 2,738 2,738 2,680 57
2008.1 126 1,479 1,479 1,524 1,524 1,506 19
2008.2 120 2,114 2,045 2,170 2,170 2,152 18
2009.1 114 2,203 2,203 2,261 2,261 2,235 26
2009.2 108 1,553 1,553 1,587 1,587 1,592 (6)
2010.1 102 3,563 3,447 3,679 3,679 3,656 23
2010.2 96 3,210 2,855 3,320 3,320 3,251 69
2011.1 90 3,065 3,021 3,132 3,132 3,558 (426)
2011.2 84 4,349 3,532 4,446 4,446 4,560 (114)
2012.1 78 4,105 3,457 4,204 4,204 4,402 (198)
2012.2 72 6,791 5,737 6,899 6,899 6,821 77
2013.1 66 3,643 2,707 3,762 3,762 3,813 (50)
2013.2 60 6,636 5,329 6,931 6,931 6,595 337
2014.1 54 4,227 3,250 4,759 4,759 4,946 (187)
2014.2 48 3,525 2,755 4,226 4,226 3,871 355
2015.1 42 2,613 2,057 3,531 3,531 3,986 (455)
2015.2 36 6,064 3,242 9,325 9,325 9,615 (290)
2016.1 30 4,814 1,978 8,136 8,136 8,436 (300)
2016.2 24 2,932 1,588 5,952 5,952 6,196 (244)
2017.1 18 2,350 998 5,844 5,844 6,281 (437)
2017.2 12 2,405 667 6,831 6,831 4,892 1,939
2018.1 6 1,846 211 5,619 5,619
Total 137,503 116,759 162,474 162,474 156,352 504
Appendix C Page 4
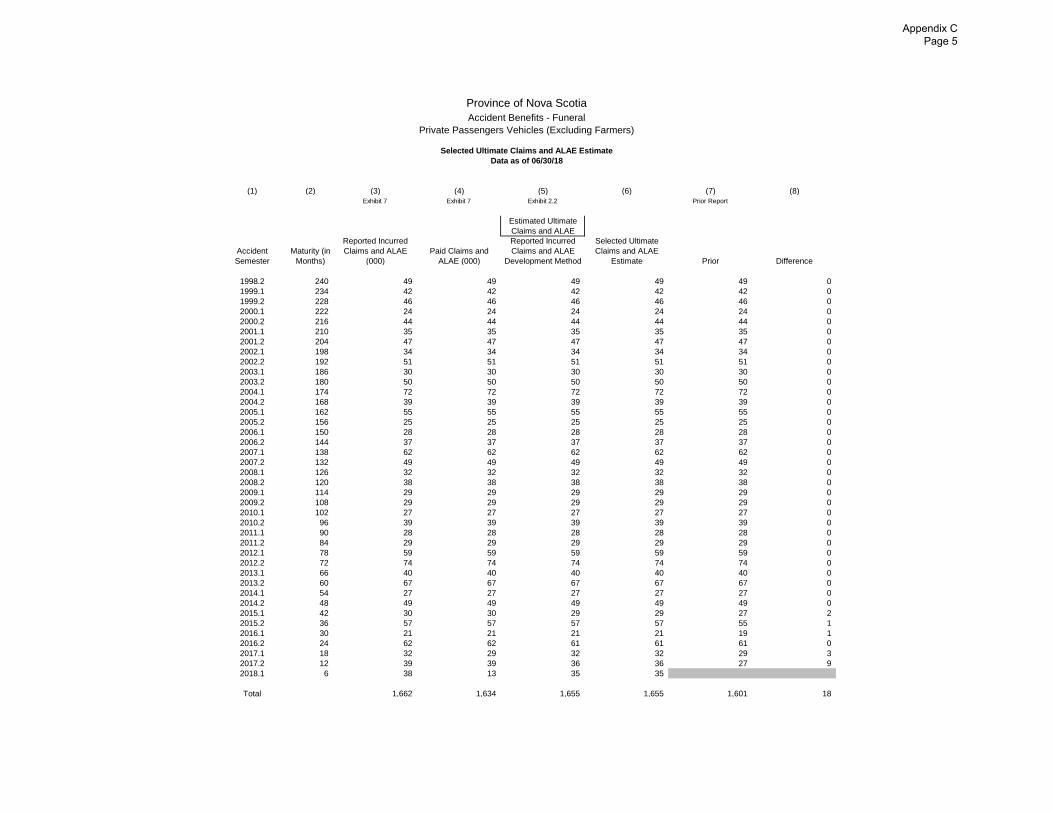
Province of Nova Scotia
Accident Benefits - Funeral
Private Passengers Vehicles (Excluding Farmers)
Selected Ultimate Claims and ALAE Estimate
Data as of 06/30/18
(1) (2) (3) (4) (5) (6) (7) (8)
Exhibit 7 Exhibit 7 Exhibit 2.2 Prior Report
Estimated Ultimate
Claims and ALAE
Accident
Semester
Maturity (in
Months)
Reported Incurred
Claims and ALAE
(000)
Paid Claims and
ALAE (000)
Reported Incurred
Claims and ALAE
Development Method
Selected Ultimate
Claims and ALAE
Estimate Prior Difference
1998.2 240 49 49 49 49 49 0
1999.1 234 42 42 42 42 42 0
1999.2 228 46 46 46 46 46 0
2000.1 222 24 24 24 24 24 0
2000.2 216 44 44 44 44 44 0
2001.1 210 35 35 35 35 35 0
2001.2 204 47 47 47 47 47 0
2002.1 198 34 34 34 34 34 0
2002.2 192 51 51 51 51 51 0
2003.1 186 30 30 30 30 30 0
2003.2 180 50 50 50 50 50 0
2004.1 174 72 72 72 72 72 0
2004.2 168 39 39 39 39 39 0
2005.1 162 55 55 55 55 55 0
2005.2 156 25 25 25 25 25 0
2006.1 150 28 28 28 28 28 0
2006.2 144 37 37 37 37 37 0
2007.1 138 62 62 62 62 62 0
2007.2 132 49 49 49 49 49 0
2008.1 126 32 32 32 32 32 0
2008.2 120 38 38 38 38 38 0
2009.1 114 29 29 29 29 29 0
2009.2 108 29 29 29 29 29 0
2010.1 102 27 27 27 27 27 0
2010.2 96 39 39 39 39 39 0
2011.1 90 28 28 28 28 28 0
2011.2 84 29 29 29 29 29 0
2012.1 78 59 59 59 59 59 0
2012.2 72 74 74 74 74 74 0
2013.1 66 40 40 40 40 40 0
2013.2 60 67 67 67 67 67 0
2014.1 54 27 27 27 27 27 0
2014.2 48 49 49 49 49 49 0
2015.1 42 30 30 29 29 27 2
2015.2 36 57 57 57 57 55 1
2016.1 30 21 21 21 21 19 1
2016.2 24 62 62 61 61 61 0
2017.1 18 32 29 32 32 29 3
2017.2 12 39 39 36 36 27 9
2018.1 6 38 13 35 35
Total 1,662 1,634 1,655 1,655 1,601 18
Appendix C Page 5
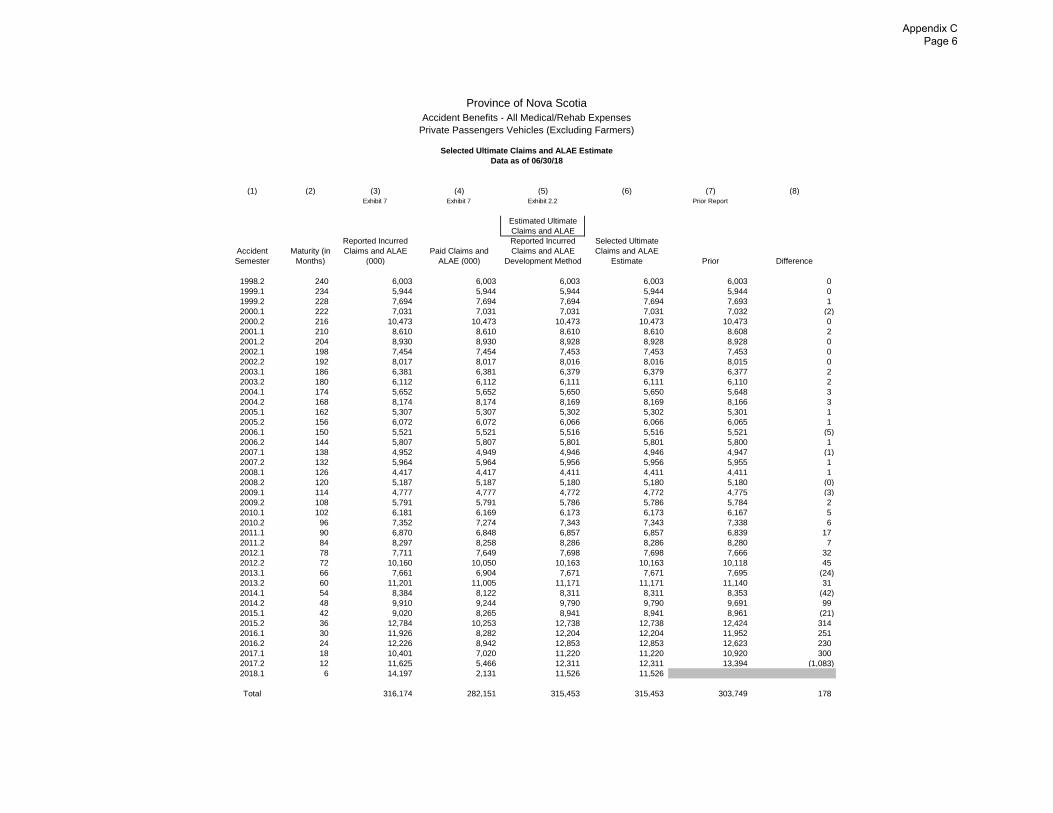
Province of Nova Scotia
Accident Benefits - All Medical/Rehab Expenses
Private Passengers Vehicles (Excluding Farmers)
Selected Ultimate Claims and ALAE Estimate
Data as of 06/30/18
(1) (2) (3) (4) (5) (6) (7) (8)
Exhibit 7 Exhibit 7 Exhibit 2.2 Prior Report
Estimated Ultimate
Claims and ALAE
Accident
Semester
Maturity (in
Months)
Reported Incurred
Claims and ALAE
(000)
Paid Claims and
ALAE (000)
Reported Incurred
Claims and ALAE
Development Method
Selected Ultimate
Claims and ALAE
Estimate Prior Difference
1998.2 240 6,003 6,003 6,003 6,003 6,003 0
1999.1 234 5,944 5,944 5,944 5,944 5,944 0
1999.2 228 7,694 7,694 7,694 7,694 7,693 1
2000.1 222 7,031 7,031 7,031 7,031 7,032 (2)
2000.2 216 10,473 10,473 10,473 10,473 10,473 0
2001.1 210 8,610 8,610 8,610 8,610 8,608 2
2001.2 204 8,930 8,930 8,928 8,928 8,928 0
2002.1 198 7,454 7,454 7,453 7,453 7,453 0
2002.2 192 8,017 8,017 8,016 8,016 8,015 0
2003.1 186 6,381 6,381 6,379 6,379 6,377 2
2003.2 180 6,112 6,112 6,111 6,111 6,110 2
2004.1 174 5,652 5,652 5,650 5,650 5,648 3
2004.2 168 8,174 8,174 8,169 8,169 8,166 3
2005.1 162 5,307 5,307 5,302 5,302 5,301 1
2005.2 156 6,072 6,072 6,066 6,066 6,065 1
2006.1 150 5,521 5,521 5,516 5,516 5,521 (5)
2006.2 144 5,807 5,807 5,801 5,801 5,800 1
2007.1 138 4,952 4,949 4,946 4,946 4,947 (1)
2007.2 132 5,964 5,964 5,956 5,956 5,955 1
2008.1 126 4,417 4,417 4,411 4,411 4,411 1
2008.2 120 5,187 5,187 5,180 5,180 5,180 (0)
2009.1 114 4,777 4,777 4,772 4,772 4,775 (3)
2009.2 108 5,791 5,791 5,786 5,786 5,784 2
2010.1 102 6,181 6,169 6,173 6,173 6,167 5
2010.2 96 7,352 7,274 7,343 7,343 7,338 6
2011.1 90 6,870 6,848 6,857 6,857 6,839 17
2011.2 84 8,297 8,258 8,286 8,286 8,280 7
2012.1 78 7,711 7,649 7,698 7,698 7,666 32
2012.2 72 10,160 10,050 10,163 10,163 10,118 45
2013.1 66 7,661 6,904 7,671 7,671 7,695 (24)
2013.2 60 11,201 11,005 11,171 11,171 11,140 31
2014.1 54 8,384 8,122 8,311 8,311 8,353 (42)
2014.2 48 9,910 9,244 9,790 9,790 9,691 99
2015.1 42 9,020 8,265 8,941 8,941 8,961 (21)
2015.2 36 12,784 10,253 12,738 12,738 12,424 314
2016.1 30 11,926 8,282 12,204 12,204 11,952 251
2016.2 24 12,226 8,942 12,853 12,853 12,623 230
2017.1 18 10,401 7,020 11,220 11,220 10,920 300
2017.2 12 11,625 5,466 12,311 12,311 13,394 (1,083)
2018.1 6 14,197 2,131 11,526 11,526
Total 316,174 282,151 315,453 315,453 303,749 178
Appendix C Page 6
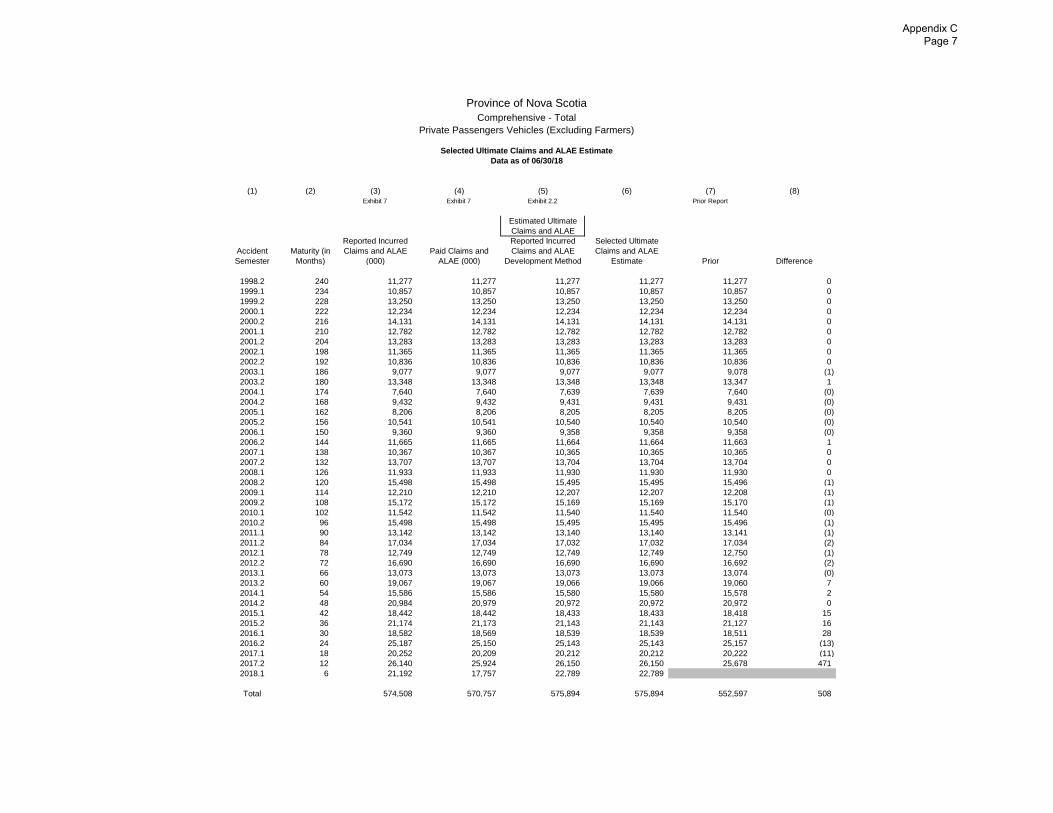
Province of Nova Scotia
Comprehensive - Total
Private Passengers Vehicles (Excluding Farmers)
Selected Ultimate Claims and ALAE Estimate
Data as of 06/30/18
(1) (2) (3) (4) (5) (6) (7) (8)
Exhibit 7 Exhibit 7 Exhibit 2.2 Prior Report
Estimated Ultimate
Claims and ALAE
Accident
Semester
Maturity (in
Months)
Reported Incurred
Claims and ALAE
(000)
Paid Claims and
ALAE (000)
Reported Incurred
Claims and ALAE
Development Method
Selected Ultimate
Claims and ALAE
Estimate Prior Difference
1998.2 240 11,277 11,277 11,277 11,277 11,277 0
1999.1 234 10,857 10,857 10,857 10,857 10,857 0
1999.2 228 13,250 13,250 13,250 13,250 13,250 0
2000.1 222 12,234 12,234 12,234 12,234 12,234 0
2000.2 216 14,131 14,131 14,131 14,131 14,131 0
2001.1 210 12,782 12,782 12,782 12,782 12,782 0
2001.2 204 13,283 13,283 13,283 13,283 13,283 0
2002.1 198 11,365 11,365 11,365 11,365 11,365 0
2002.2 192 10,836 10,836 10,836 10,836 10,836 0
2003.1 186 9,077 9,077 9,077 9,077 9,078 (1)
2003.2 180 13,348 13,348 13,348 13,348 13,347 1
2004.1 174 7,640 7,640 7,639 7,639 7,640 (0)
2004.2 168 9,432 9,432 9,431 9,431 9,431 (0)
2005.1 162 8,206 8,206 8,205 8,205 8,205 (0)
2005.2 156 10,541 10,541 10,540 10,540 10,540 (0)
2006.1 150 9,360 9,360 9,358 9,358 9,358 (0)
2006.2 144 11,665 11,665 11,664 11,664 11,663 1
2007.1 138 10,367 10,367 10,365 10,365 10,365 0
2007.2 132 13,707 13,707 13,704 13,704 13,704 0
2008.1 126 11,933 11,933 11,930 11,930 11,930 0
2008.2 120 15,498 15,498 15,495 15,495 15,496 (1)
2009.1 114 12,210 12,210 12,207 12,207 12,208 (1)
2009.2 108 15,172 15,172 15,169 15,169 15,170 (1)
2010.1 102 11,542 11,542 11,540 11,540 11,540 (0)
2010.2 96 15,498 15,498 15,495 15,495 15,496 (1)
2011.1 90 13,142 13,142 13,140 13,140 13,141 (1)
2011.2 84 17,034 17,034 17,032 17,032 17,034 (2)
2012.1 78 12,749 12,749 12,749 12,749 12,750 (1)
2012.2 72 16,690 16,690 16,690 16,690 16,692 (2)
2013.1 66 13,073 13,073 13,073 13,073 13,074 (0)
2013.2 60 19,067 19,067 19,066 19,066 19,060 7
2014.1 54 15,586 15,586 15,580 15,580 15,578 2
2014.2 48 20,984 20,979 20,972 20,972 20,972 0
2015.1 42 18,442 18,442 18,433 18,433 18,418 15
2015.2 36 21,174 21,173 21,143 21,143 21,127 16
2016.1 30 18,582 18,569 18,539 18,539 18,511 28
2016.2 24 25,187 25,150 25,143 25,143 25,157 (13)
2017.1 18 20,252 20,209 20,212 20,212 20,222 (11)
2017.2 12 26,140 25,924 26,150 26,150 25,678 471
2018.1 6 21,192 17,757 22,789 22,789
Total 574,508 570,757 575,894 575,894 552,597 508
Appendix C Page 7
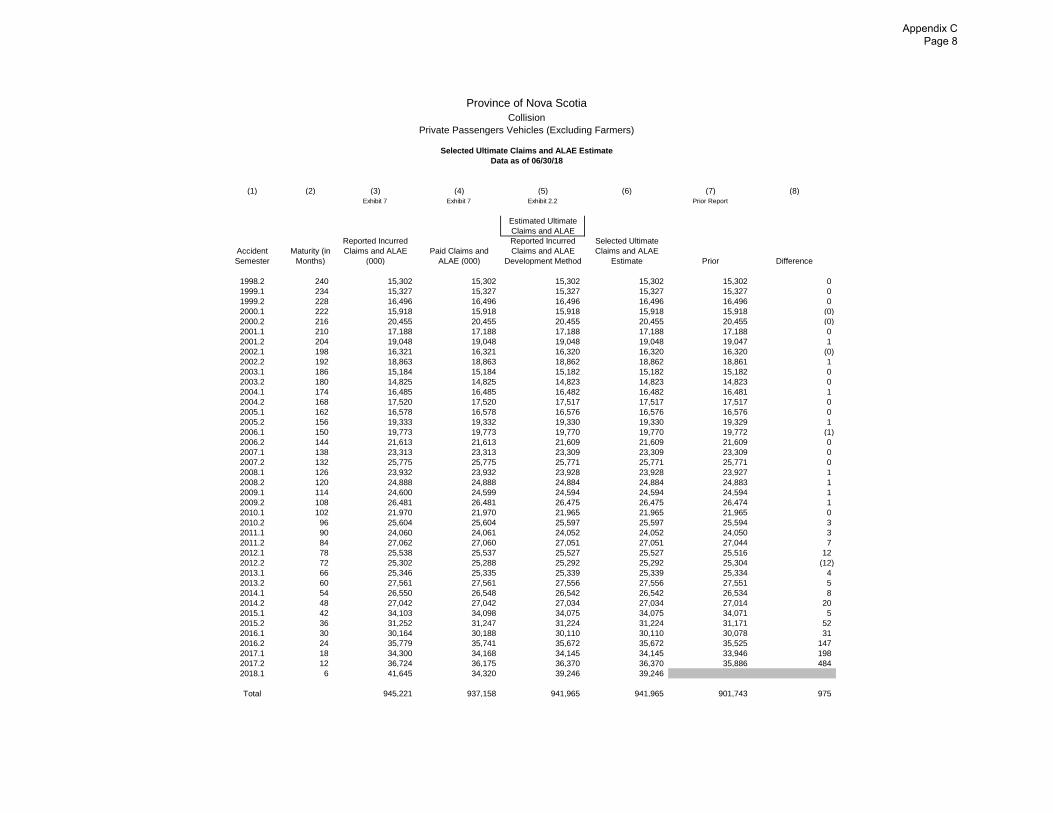
Province of Nova Scotia
Collision
Private Passengers Vehicles (Excluding Farmers)
Selected Ultimate Claims and ALAE Estimate
Data as of 06/30/18
(1) (2) (3) (4) (5) (6) (7) (8)
Exhibit 7 Exhibit 7 Exhibit 2.2 Prior Report
Estimated Ultimate
Claims and ALAE
Accident
Semester
Maturity (in
Months)
Reported Incurred
Claims and ALAE
(000)
Paid Claims and
ALAE (000)
Reported Incurred
Claims and ALAE
Development Method
Selected Ultimate
Claims and ALAE
Estimate Prior Difference
1998.2 240 15,302 15,302 15,302 15,302 15,302 0
1999.1 234 15,327 15,327 15,327 15,327 15,327 0
1999.2 228 16,496 16,496 16,496 16,496 16,496 0
2000.1 222 15,918 15,918 15,918 15,918 15,918 (0)
2000.2 216 20,455 20,455 20,455 20,455 20,455 (0)
2001.1 210 17,188 17,188 17,188 17,188 17,188 0
2001.2 204 19,048 19,048 19,048 19,048 19,047 1
2002.1 198 16,321 16,321 16,320 16,320 16,320 (0)
2002.2 192 18,863 18,863 18,862 18,862 18,861 1
2003.1 186 15,184 15,184 15,182 15,182 15,182 0
2003.2 180 14,825 14,825 14,823 14,823 14,823 0
2004.1 174 16,485 16,485 16,482 16,482 16,481 1
2004.2 168 17,520 17,520 17,517 17,517 17,517 0
2005.1 162 16,578 16,578 16,576 16,576 16,576 0
2005.2 156 19,333 19,332 19,330 19,330 19,329 1
2006.1 150 19,773 19,773 19,770 19,770 19,772 (1)
2006.2 144 21,613 21,613 21,609 21,609 21,609 0
2007.1 138 23,313 23,313 23,309 23,309 23,309 0
2007.2 132 25,775 25,775 25,771 25,771 25,771 0
2008.1 126 23,932 23,932 23,928 23,928 23,927 1
2008.2 120 24,888 24,888 24,884 24,884 24,883 1
2009.1 114 24,600 24,599 24,594 24,594 24,594 1
2009.2 108 26,481 26,481 26,475 26,475 26,474 1
2010.1 102 21,970 21,970 21,965 21,965 21,965 0
2010.2 96 25,604 25,604 25,597 25,597 25,594 3
2011.1 90 24,060 24,061 24,052 24,052 24,050 3
2011.2 84 27,062 27,060 27,051 27,051 27,044 7
2012.1 78 25,538 25,537 25,527 25,527 25,516 12
2012.2 72 25,302 25,288 25,292 25,292 25,304 (12)
2013.1 66 25,346 25,335 25,339 25,339 25,334 4
2013.2 60 27,561 27,561 27,556 27,556 27,551 5
2014.1 54 26,550 26,548 26,542 26,542 26,534 8
2014.2 48 27,042 27,042 27,034 27,034 27,014 20
2015.1 42 34,103 34,098 34,075 34,075 34,071 5
2015.2 36 31,252 31,247 31,224 31,224 31,171 52
2016.1 30 30,164 30,188 30,110 30,110 30,078 31
2016.2 24 35,779 35,741 35,672 35,672 35,525 147
2017.1 18 34,300 34,168 34,145 34,145 33,946 198
2017.2 12 36,724 36,175 36,370 36,370 35,886 484
2018.1 6 41,645 34,320 39,246 39,246
Total 945,221 937,158 941,965 941,965 901,743 975
Appendix C Page 8
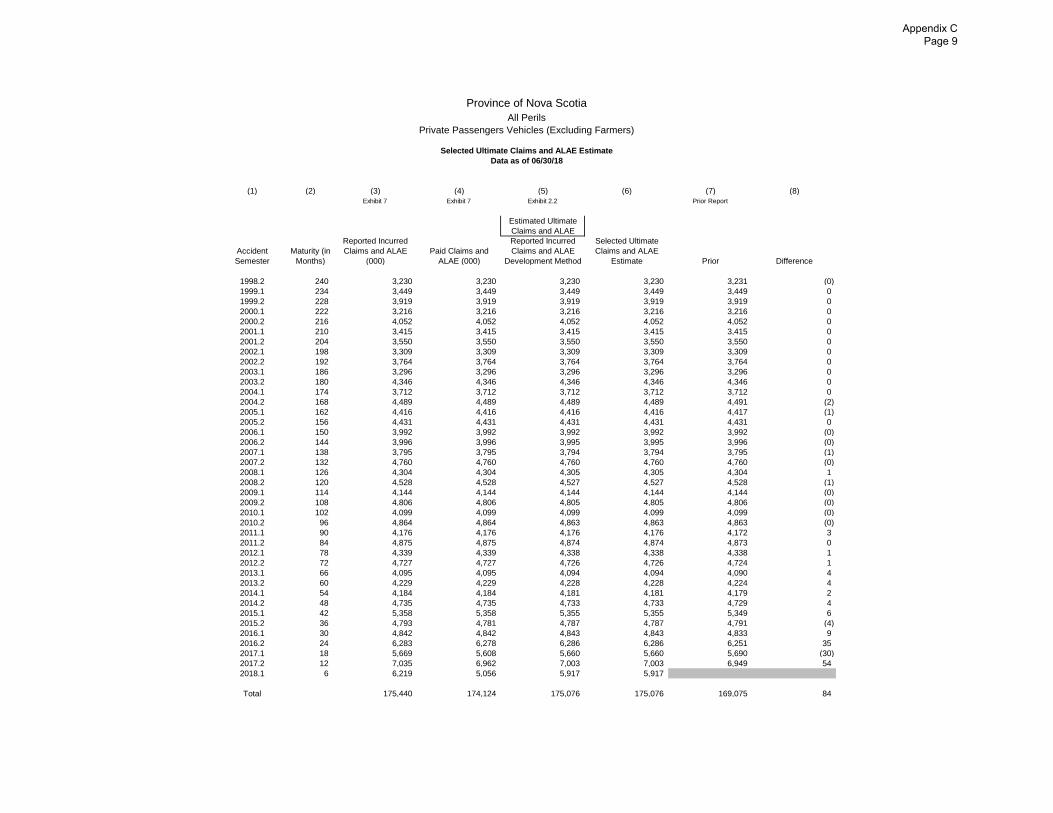
Province of Nova Scotia
All Perils
Private Passengers Vehicles (Excluding Farmers)
Selected Ultimate Claims and ALAE Estimate
Data as of 06/30/18
(1) (2) (3) (4) (5) (6) (7) (8)
Exhibit 7 Exhibit 7 Exhibit 2.2 Prior Report
Estimated Ultimate
Claims and ALAE
Accident
Semester
Maturity (in
Months)
Reported Incurred
Claims and ALAE
(000)
Paid Claims and
ALAE (000)
Reported Incurred
Claims and ALAE
Development Method
Selected Ultimate
Claims and ALAE
Estimate Prior Difference
1998.2 240 3,230 3,230 3,230 3,230 3,231 (0)
1999.1 234 3,449 3,449 3,449 3,449 3,449 0
1999.2 228 3,919 3,919 3,919 3,919 3,919 0
2000.1 222 3,216 3,216 3,216 3,216 3,216 0
2000.2 216 4,052 4,052 4,052 4,052 4,052 0
2001.1 210 3,415 3,415 3,415 3,415 3,415 0
2001.2 204 3,550 3,550 3,550 3,550 3,550 0
2002.1 198 3,309 3,309 3,309 3,309 3,309 0
2002.2 192 3,764 3,764 3,764 3,764 3,764 0
2003.1 186 3,296 3,296 3,296 3,296 3,296 0
2003.2 180 4,346 4,346 4,346 4,346 4,346 0
2004.1 174 3,712 3,712 3,712 3,712 3,712 0
2004.2 168 4,489 4,489 4,489 4,489 4,491 (2)
2005.1 162 4,416 4,416 4,416 4,416 4,417 (1)
2005.2 156 4,431 4,431 4,431 4,431 4,431 0
2006.1 150 3,992 3,992 3,992 3,992 3,992 (0)
2006.2 144 3,996 3,996 3,995 3,995 3,996 (0)
2007.1 138 3,795 3,795 3,794 3,794 3,795 (1)
2007.2 132 4,760 4,760 4,760 4,760 4,760 (0)
2008.1 126 4,304 4,304 4,305 4,305 4,304 1
2008.2 120 4,528 4,528 4,527 4,527 4,528 (1)
2009.1 114 4,144 4,144 4,144 4,144 4,144 (0)
2009.2 108 4,806 4,806 4,805 4,805 4,806 (0)
2010.1 102 4,099 4,099 4,099 4,099 4,099 (0)
2010.2 96 4,864 4,864 4,863 4,863 4,863 (0)
2011.1 90 4,176 4,176 4,176 4,176 4,172 3
2011.2 84 4,875 4,875 4,874 4,874 4,873 0
2012.1 78 4,339 4,339 4,338 4,338 4,338 1
2012.2 72 4,727 4,727 4,726 4,726 4,724 1
2013.1 66 4,095 4,095 4,094 4,094 4,090 4
2013.2 60 4,229 4,229 4,228 4,228 4,224 4
2014.1 54 4,184 4,184 4,181 4,181 4,179 2
2014.2 48 4,735 4,735 4,733 4,733 4,729 4
2015.1 42 5,358 5,358 5,355 5,355 5,349 6
2015.2 36 4,793 4,781 4,787 4,787 4,791 (4)
2016.1 30 4,842 4,842 4,843 4,843 4,833 9
2016.2 24 6,283 6,278 6,286 6,286 6,251 35
2017.1 18 5,669 5,608 5,660 5,660 5,690 (30)
2017.2 12 7,035 6,962 7,003 7,003 6,949 54
2018.1 6 6,219 5,056 5,917 5,917
Total 175,440 174,124 175,076 175,076 169,075 84
Appendix C Page 9

Province of Nova Scotia
Specified Perils
Private Passengers Vehicles (Excluding Farmers)
Selected Ultimate Claims and ALAE Estimate
Data as of 06/30/18
(1) (2) (3) (4) (5) (6) (7) (8)
Exhibit 7 Exhibit 7 Exhibit 2.2 Prior Report
Estimated Ultimate
Claims and ALAE
Accident
Semester
Maturity (in
Months)
Reported Incurred
Claims and ALAE
(000)
Paid Claims and
ALAE (000)
Reported Incurred
Claims and ALAE
Development Method
Selected Ultimate
Claims and ALAE
Estimate Prior Difference
1998.2 240 54 54 54 54 54 0
1999.1 234 115 115 115 115 115 0
1999.2 228 131 131 131 131 131 0
2000.1 222 90 90 90 90 90 0
2000.2 216 138 138 138 138 138 0
2001.1 210 121 121 121 121 121 0
2001.2 204 203 203 203 203 203 0
2002.1 198 44 44 44 44 44 0
2002.2 192 102 102 102 102 102 0
2003.1 186 79 79 79 79 79 0
2003.2 180 126 126 126 126 126 0
2004.1 174 72 72 72 72 72 0
2004.2 168 75 75 75 75 75 0
2005.1 162 103 103 103 103 103 0
2005.2 156 40 40 40 40 40 0
2006.1 150 85 85 85 85 85 0
2006.2 144 103 103 103 103 103 0
2007.1 138 77 77 77 77 77 0
2007.2 132 30 30 30 30 30 0
2008.1 126 70 70 70 70 70 0
2008.2 120 53 53 53 53 53 0
2009.1 114 59 59 59 59 59 0
2009.2 108 135 135 135 135 135 0
2010.1 102 50 50 50 50 50 0
2010.2 96 54 54 54 54 54 0
2011.1 90 90 90 90 90 90 0
2011.2 84 63 63 63 63 63 0
2012.1 78 25 25 25 25 25 0
2012.2 72 33 33 33 33 33 0
2013.1 66 32 32 32 32 32 0
2013.2 60 48 48 48 48 48 0
2014.1 54 17 17 17 17 17 0
2014.2 48 110 110 110 110 110 (0)
2015.1 42 48 48 48 48 48 0
2015.2 36 3 3 3 3 3 0
2016.1 30 20 20 20 20 18 2
2016.2 24 7 7 7 7 7 0
2017.1 18 13 13 13 13 13 0
2017.2 12 69 69 72 72 77 (6)
2018.1 6 101 82 120 120
Total 2,888 2,869 2,909 2,909 2,792 (4)
Appendix C Page 10

Province of Nova Scotia
Uninsured Auto
Private Passengers Vehicles (Excluding Farmers)
Selected Ultimate Claims and ALAE Estimate
Data as of 06/30/18
(1) (2) (3) (4) (5) (6) (7) (8)
Exhibit 7 Exhibit 7 Exhibit 2.2 Prior Report
Estimated Ultimate
Claims and ALAE
Accident
Semester
Maturity (in
Months)
Reported Incurred
Claims and ALAE
(000)
Paid Claims and
ALAE (000)
Reported Incurred
Claims and ALAE
Development Method
Selected Ultimate
Claims and ALAE
Estimate Prior Difference
1998.2 240 2,197 2,197 2,197 2,197 2,197 0
1999.1 234 1,736 1,723 1,736 1,736 1,736 0
1999.2 228 1,299 1,299 1,299 1,299 1,299 0
2000.1 222 2,176 2,176 2,176 2,176 2,176 (0)
2000.2 216 3,237 3,237 3,237 3,237 3,238 (1)
2001.1 210 2,019 2,019 2,018 2,018 2,019 (0)
2001.2 204 3,017 3,017 3,016 3,016 3,017 (1)
2002.1 198 1,618 1,618 1,618 1,618 1,618 (0)
2002.2 192 2,086 2,084 2,085 2,085 2,084 1
2003.1 186 1,593 1,593 1,591 1,591 1,592 (0)
2003.2 180 1,833 1,833 1,831 1,831 1,833 (2)
2004.1 174 1,566 1,564 1,566 1,566 1,566 (0)
2004.2 168 1,163 1,160 1,162 1,162 1,159 2
2005.1 162 1,205 1,205 1,203 1,203 1,203 0
2005.2 156 1,101 1,096 1,099 1,099 1,110 (10)
2006.1 150 1,033 1,033 1,029 1,029 1,025 4
2006.2 144 1,383 1,383 1,371 1,371 1,366 6
2007.1 138 819 819 808 808 810 (2)
2007.2 132 1,372 1,370 1,357 1,357 1,369 (12)
2008.1 126 1,300 1,300 1,297 1,297 1,290 6
2008.2 120 626 621 621 621 625 (4)
2009.1 114 766 766 762 762 764 (2)
2009.2 108 1,430 1,430 1,423 1,423 1,415 8
2010.1 102 817 815 808 808 817 (9)
2010.2 96 1,700 1,685 1,682 1,682 1,678 4
2011.1 90 1,555 1,235 1,530 1,530 1,497 33
2011.2 84 1,550 1,534 1,526 1,526 1,508 18
2012.1 78 2,201 1,717 2,147 2,147 2,158 (12)
2012.2 72 2,484 2,230 2,413 2,413 2,391 23
2013.1 66 1,684 1,129 1,601 1,601 1,671 (69)
2013.2 60 3,789 2,971 3,648 3,648 3,719 (71)
2014.1 54 1,329 855 1,290 1,290 1,226 64
2014.2 48 2,414 1,052 2,354 2,354 2,391 (37)
2015.1 42 3,842 1,693 4,011 4,011 3,796 214
2015.2 36 3,078 1,134 3,330 3,330 2,787 543
2016.1 30 1,826 1,069 2,094 2,094 2,290 (196)
2016.2 24 1,771 973 2,199 2,199 2,309 (111)
2017.1 18 1,961 466 2,730 2,730 2,497 233
2017.2 12 1,785 397 2,907 2,907 1,475 1,432
2018.1 6 721 220 1,692 1,692
Total 71,080 57,716 74,464 74,464 70,720 2,052
Appendix C Page 11
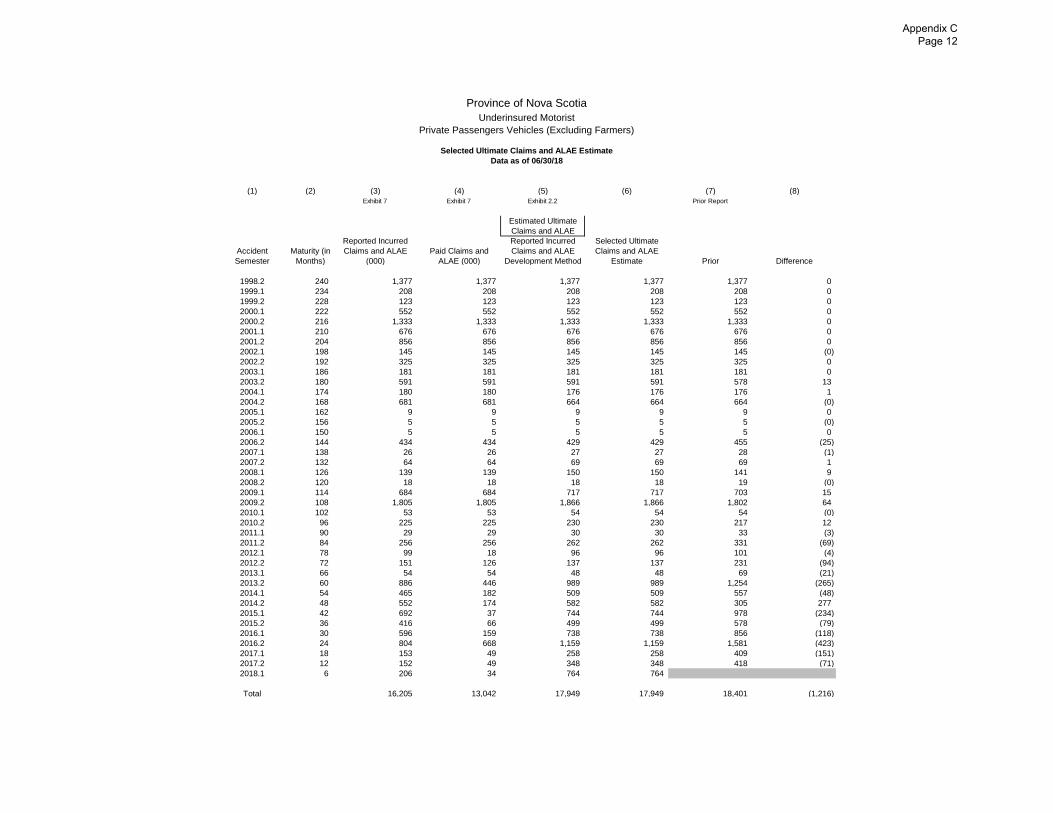
Province of Nova Scotia
Underinsured Motorist
Private Passengers Vehicles (Excluding Farmers)
Selected Ultimate Claims and ALAE Estimate
Data as of 06/30/18
(1) (2) (3) (4) (5) (6) (7) (8)
Exhibit 7 Exhibit 7 Exhibit 2.2 Prior Report
Estimated Ultimate
Claims and ALAE
Accident
Semester
Maturity (in
Months)
Reported Incurred
Claims and ALAE
(000)
Paid Claims and
ALAE (000)
Reported Incurred
Claims and ALAE
Development Method
Selected Ultimate
Claims and ALAE
Estimate Prior Difference
1998.2 240 1,377 1,377 1,377 1,377 1,377 0
1999.1 234 208 208 208 208 208 0
1999.2 228 123 123 123 123 123 0
2000.1 222 552 552 552 552 552 0
2000.2 216 1,333 1,333 1,333 1,333 1,333 0
2001.1 210 676 676 676 676 676 0
2001.2 204 856 856 856 856 856 0
2002.1 198 145 145 145 145 145 (0)
2002.2 192 325 325 325 325 325 0
2003.1 186 181 181 181 181 181 0
2003.2 180 591 591 591 591 578 13
2004.1 174 180 180 176 176 176 1
2004.2 168 681 681 664 664 664 (0)
2005.1 162 9 9 9 9 9 0
2005.2 156 5 5 5 5 5 (0)
2006.1 150 5 5 5 5 5 0
2006.2 144 434 434 429 429 455 (25)
2007.1 138 26 26 27 27 28 (1)
2007.2 132 64 64 69 69 69 1
2008.1 126 139 139 150 150 141 9
2008.2 120 18 18 18 18 19 (0)
2009.1 114 684 684 717 717 703 15
2009.2 108 1,805 1,805 1,866 1,866 1,802 64
2010.1 102 53 53 54 54 54 (0)
2010.2 96 225 225 230 230 217 12
2011.1 90 29 29 30 30 33 (3)
2011.2 84 256 256 262 262 331 (69)
2012.1 78 99 18 96 96 101 (4)
2012.2 72 151 126 137 137 231 (94)
2013.1 66 54 54 48 48 69 (21)
2013.2 60 886 446 989 989 1,254 (265)
2014.1 54 465 182 509 509 557 (48)
2014.2 48 552 174 582 582 305 277
2015.1 42 692 37 744 744 978 (234)
2015.2 36 416 66 499 499 578 (79)
2016.1 30 596 159 738 738 856 (118)
2016.2 24 804 668 1,159 1,159 1,581 (423)
2017.1 18 153 49 258 258 409 (151)
2017.2 12 152 49 348 348 418 (71)
2018.1 6 206 34 764 764
Total 16,205 13,042 17,949 17,949 18,401 (1,216)
Appendix C Page 12
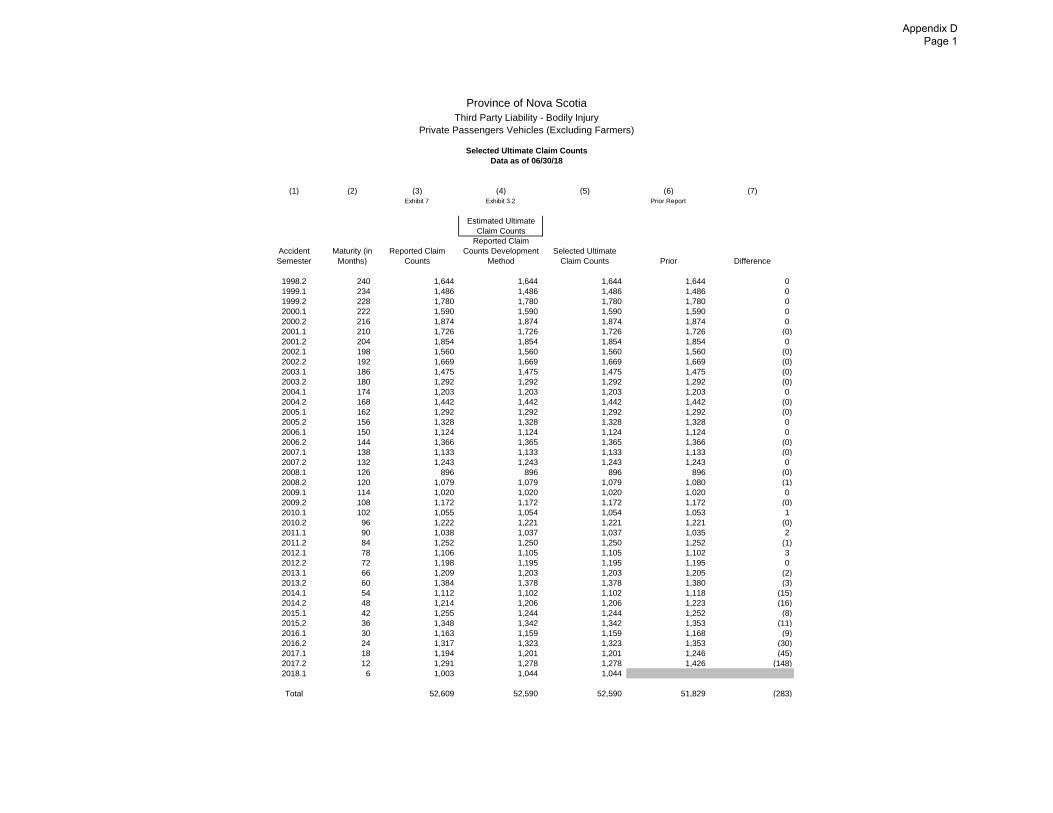
Province of Nova Scotia
Third Party Liability - Bodily Injury
Private Passengers Vehicles (Excluding Farmers)
Selected Ultimate Claim Counts
Data as of 06/30/18
(1) (2) (3) (4) (5) (6) (7)
Exhibit 7 Exhibit 3.2 Prior Report
Estimated Ultimate
Claim Counts
Accident
Semester
Maturity (in
Months)
Reported Claim
Counts
Reported Claim
Counts Development
Method
Selected Ultimate
Claim Counts Prior Difference
1998.2 240 1,644 1,644 1,644 1,644 0
1999.1 234 1,486 1,486 1,486 1,486 0
1999.2 228 1,780 1,780 1,780 1,780 0
2000.1 222 1,590 1,590 1,590 1,590 0
2000.2 216 1,874 1,874 1,874 1,874 0
2001.1 210 1,726 1,726 1,726 1,726 (0)
2001.2 204 1,854 1,854 1,854 1,854 0
2002.1 198 1,560 1,560 1,560 1,560 (0)
2002.2 192 1,669 1,669 1,669 1,669 (0)
2003.1 186 1,475 1,475 1,475 1,475 (0)
2003.2 180 1,292 1,292 1,292 1,292 (0)
2004.1 174 1,203 1,203 1,203 1,203 0
2004.2 168 1,442 1,442 1,442 1,442 (0)
2005.1 162 1,292 1,292 1,292 1,292 (0)
2005.2 156 1,328 1,328 1,328 1,328 0
2006.1 150 1,124 1,124 1,124 1,124 0
2006.2 144 1,366 1,365 1,365 1,366 (0)
2007.1 138 1,133 1,133 1,133 1,133 (0)
2007.2 132 1,243 1,243 1,243 1,243 0
2008.1 126 896 896 896 896 (0)
2008.2 120 1,079 1,079 1,079 1,080 (1)
2009.1 114 1,020 1,020 1,020 1,020 0
2009.2 108 1,172 1,172 1,172 1,172 (0)
2010.1 102 1,055 1,054 1,054 1,053 1
2010.2 96 1,222 1,221 1,221 1,221 (0)
2011.1 90 1,038 1,037 1,037 1,035 2
2011.2 84 1,252 1,250 1,250 1,252 (1)
2012.1 78 1,106 1,105 1,105 1,102 3
2012.2 72 1,198 1,195 1,195 1,195 0
2013.1 66 1,209 1,203 1,203 1,205 (2)
2013.2 60 1,384 1,378 1,378 1,380 (3)
2014.1 54 1,112 1,102 1,102 1,118 (15)
2014.2 48 1,214 1,206 1,206 1,223 (16)
2015.1 42 1,255 1,244 1,244 1,252 (8)
2015.2 36 1,348 1,342 1,342 1,353 (11)
2016.1 30 1,163 1,159 1,159 1,168 (9)
2016.2 24 1,317 1,323 1,323 1,353 (30)
2017.1 18 1,194 1,201 1,201 1,246 (45)
2017.2 12 1,291 1,278 1,278 1,426 (148)
2018.1 6 1,003 1,044 1,044
Total 52,609 52,590 52,590 51,829 (283)
Appendix D Page 1
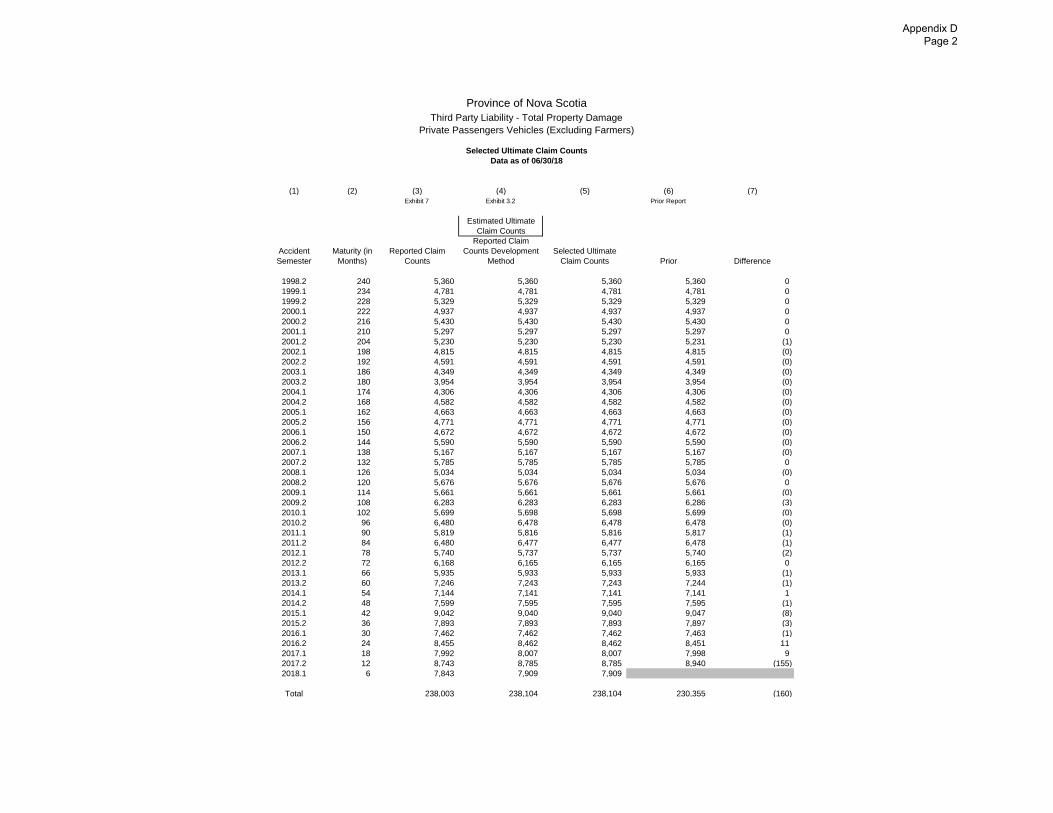
Province of Nova Scotia
Third Party Liability - Total Property Damage
Private Passengers Vehicles (Excluding Farmers)
Selected Ultimate Claim Counts
Data as of 06/30/18
(1) (2) (3) (4) (5) (6) (7)
Exhibit 7 Exhibit 3.2 Prior Report
Estimated Ultimate
Claim Counts
Accident
Semester
Maturity (in
Months)
Reported Claim
Counts
Reported Claim
Counts Development
Method
Selected Ultimate
Claim Counts Prior Difference
1998.2 240 5,360 5,360 5,360 5,360 0
1999.1 234 4,781 4,781 4,781 4,781 0
1999.2 228 5,329 5,329 5,329 5,329 0
2000.1 222 4,937 4,937 4,937 4,937 0
2000.2 216 5,430 5,430 5,430 5,430 0
2001.1 210 5,297 5,297 5,297 5,297 0
2001.2 204 5,230 5,230 5,230 5,231 (1)
2002.1 198 4,815 4,815 4,815 4,815 (0)
2002.2 192 4,591 4,591 4,591 4,591 (0)
2003.1 186 4,349 4,349 4,349 4,349 (0)
2003.2 180 3,954 3,954 3,954 3,954 (0)
2004.1 174 4,306 4,306 4,306 4,306 (0)
2004.2 168 4,582 4,582 4,582 4,582 (0)
2005.1 162 4,663 4,663 4,663 4,663 (0)
2005.2 156 4,771 4,771 4,771 4,771 (0)
2006.1 150 4,672 4,672 4,672 4,672 (0)
2006.2 144 5,590 5,590 5,590 5,590 (0)
2007.1 138 5,167 5,167 5,167 5,167 (0)
2007.2 132 5,785 5,785 5,785 5,785 0
2008.1 126 5,034 5,034 5,034 5,034 (0)
2008.2 120 5,676 5,676 5,676 5,676 0
2009.1 114 5,661 5,661 5,661 5,661 (0)
2009.2 108 6,283 6,283 6,283 6,286 (3)
2010.1 102 5,699 5,698 5,698 5,699 (0)
2010.2 96 6,480 6,478 6,478 6,478 (0)
2011.1 90 5,819 5,816 5,816 5,817 (1)
2011.2 84 6,480 6,477 6,477 6,478 (1)
2012.1 78 5,740 5,737 5,737 5,740 (2)
2012.2 72 6,168 6,165 6,165 6,165 0
2013.1 66 5,935 5,933 5,933 5,933 (1)
2013.2 60 7,246 7,243 7,243 7,244 (1)
2014.1 54 7,144 7,141 7,141 7,141 1
2014.2 48 7,599 7,595 7,595 7,595 (1)
2015.1 42 9,042 9,040 9,040 9,047 (8)
2015.2 36 7,893 7,893 7,893 7,897 (3)
2016.1 30 7,462 7,462 7,462 7,463 (1)
2016.2 24 8,455 8,462 8,462 8,451 11
2017.1 18 7,992 8,007 8,007 7,998 9
2017.2 12 8,743 8,785 8,785 8,940 (155)
2018.1 6 7,843 7,909 7,909
Total 238,003 238,104 238,104 230,355 (160)
Appendix D Page 2

Province of Nova Scotia
Accident Benefits - Death Benefits
Private Passengers Vehicles (Excluding Farmers)
Selected Ultimate Claim Counts
Data as of 06/30/18
(1) (2) (3) (4) (5) (6) (7)
Exhibit 7 Exhibit 3.2 Prior Report
Estimated Ultimate
Claim Counts
Accident
Semester
Maturity (in
Months)
Reported Claim
Counts
Reported Claim
Counts Development
Method
Selected Ultimate
Claim Counts Prior Difference
1998.2 240 16 16 16 16 0
1999.1 234 16 16 16 16 0
1999.2 228 15 15 15 15 0
2000.1 222 9 9 9 9 0
2000.2 216 19 19 19 19 0
2001.1 210 5 5 5 5 0
2001.2 204 18 18 18 18 0
2002.1 198 8 8 8 8 0
2002.2 192 23 23 23 23 0
2003.1 186 11 11 11 11 0
2003.2 180 14 14 14 14 0
2004.1 174 19 19 19 19 0
2004.2 168 18 18 18 18 0
2005.1 162 14 14 14 14 0
2005.2 156 15 15 15 15 0
2006.1 150 14 14 14 14 0
2006.2 144 14 14 14 14 0
2007.1 138 18 18 18 18 0
2007.2 132 13 13 13 13 0
2008.1 126 11 11 11 11 0
2008.2 120 19 19 19 19 0
2009.1 114 14 14 14 14 0
2009.2 108 10 10 10 10 0
2010.1 102 8 8 8 8 0
2010.2 96 12 12 12 12 0
2011.1 90 12 12 12 11 1
2011.2 84 11 11 11 11 0
2012.1 78 7 7 7 7 0
2012.2 72 17 17 17 17 0
2013.1 66 9 9 9 9 (0)
2013.2 60 16 16 16 16 0
2014.1 54 4 4 4 4 0
2014.2 48 13 13 13 13 0
2015.1 42 8 8 8 7 1
2015.2 36 8 8 8 9 (1)
2016.1 30 7 7 7 7 0
2016.2 24 11 11 11 11 0
2017.1 18 7 7 7 6 0
2017.2 12 15 14 14 10 4
2018.1 6 10 9 9
Total 508 506 506 491 6
Appendix D Page 3

Province of Nova Scotia
Accident Benefits - All Disability Income
Private Passengers Vehicles (Excluding Farmers)
Selected Ultimate Claim Counts
Data as of 06/30/18
(1) (2) (3) (4) (5) (6) (7)
Exhibit 7 Exhibit 3.2 Prior Report
Estimated Ultimate
Claim Counts
Accident
Semester
Maturity (in
Months)
Reported Claim
Counts
Reported Claim
Counts Development
Method
Selected Ultimate
Claim Counts Prior Difference
1998.2 240 531 531 531 531 0
1999.1 234 476 476 476 476 0
1999.2 228 613 613 613 613 0
2000.1 222 459 459 459 459 0
2000.2 216 652 652 652 652 0
2001.1 210 547 547 547 547 0
2001.2 204 526 526 526 526 0
2002.1 198 436 436 436 436 0
2002.2 192 502 502 502 502 0
2003.1 186 366 366 366 366 0
2003.2 180 388 388 388 388 0
2004.1 174 344 344 344 344 0
2004.2 168 409 409 409 409 0
2005.1 162 367 367 367 367 0
2005.2 156 406 406 406 406 0
2006.1 150 354 354 354 354 0
2006.2 144 350 350 350 350 0
2007.1 138 329 329 329 329 0
2007.2 132 338 338 338 338 0
2008.1 126 247 247 247 247 0
2008.2 120 295 295 295 295 0
2009.1 114 269 269 269 269 0
2009.2 108 284 284 284 284 0
2010.1 102 225 225 225 224 1
2010.2 96 312 312 312 312 0
2011.1 90 246 246 246 245 1
2011.2 84 309 309 309 308 1
2012.1 78 291 291 291 291 (0)
2012.2 72 312 312 312 311 1
2013.1 66 272 272 272 272 0
2013.2 60 304 304 304 304 1
2014.1 54 239 239 239 239 0
2014.2 48 273 273 273 273 (1)
2015.1 42 265 264 264 264 0
2015.2 36 293 291 291 294 (2)
2016.1 30 253 251 251 248 3
2016.2 24 270 266 266 261 5
2017.1 18 215 208 208 215 (7)
2017.2 12 320 297 297 277 20
2018.1 6 283 243 243
Total 14,170 14,092 14,092 13,827 23
Appendix D Page 4
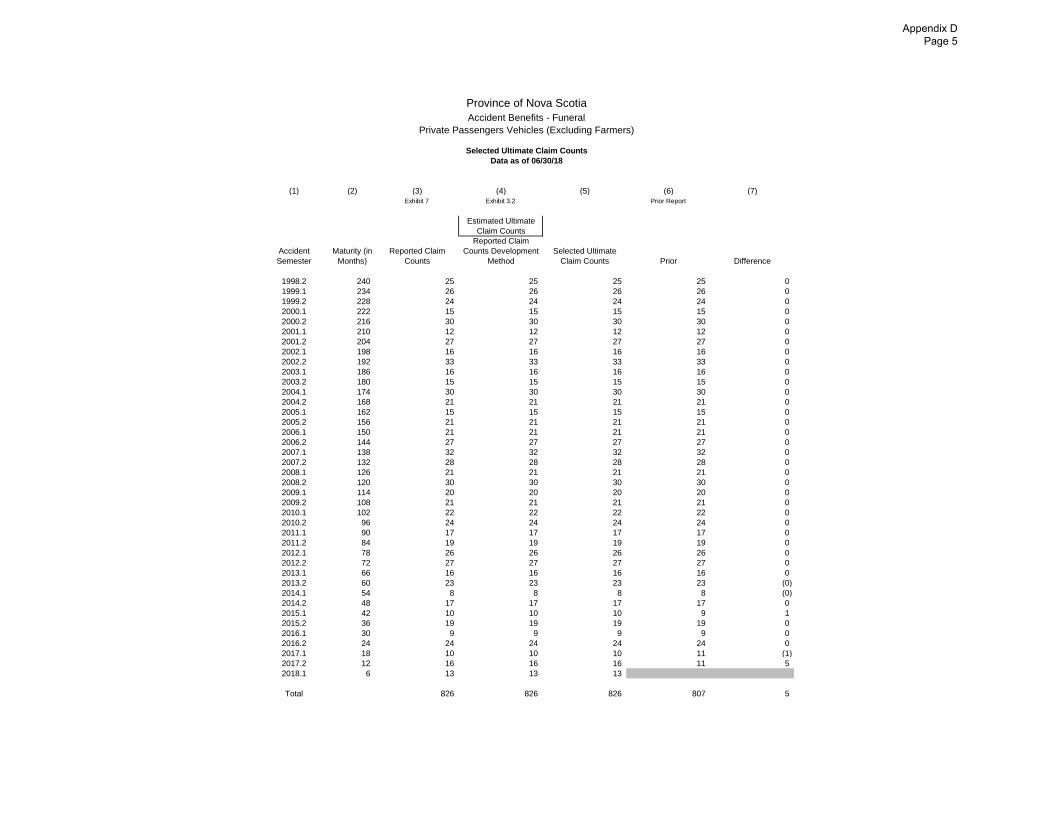
Province of Nova Scotia
Accident Benefits - Funeral
Private Passengers Vehicles (Excluding Farmers)
Selected Ultimate Claim Counts
Data as of 06/30/18
(1) (2) (3) (4) (5) (6) (7)
Exhibit 7 Exhibit 3.2 Prior Report
Estimated Ultimate
Claim Counts
Accident
Semester
Maturity (in
Months)
Reported Claim
Counts
Reported Claim
Counts Development
Method
Selected Ultimate
Claim Counts Prior Difference
1998.2 240 25 25 25 25 0
1999.1 234 26 26 26 26 0
1999.2 228 24 24 24 24 0
2000.1 222 15 15 15 15 0
2000.2 216 30 30 30 30 0
2001.1 210 12 12 12 12 0
2001.2 204 27 27 27 27 0
2002.1 198 16 16 16 16 0
2002.2 192 33 33 33 33 0
2003.1 186 16 16 16 16 0
2003.2 180 15 15 15 15 0
2004.1 174 30 30 30 30 0
2004.2 168 21 21 21 21 0
2005.1 162 15 15 15 15 0
2005.2 156 21 21 21 21 0
2006.1 150 21 21 21 21 0
2006.2 144 27 27 27 27 0
2007.1 138 32 32 32 32 0
2007.2 132 28 28 28 28 0
2008.1 126 21 21 21 21 0
2008.2 120 30 30 30 30 0
2009.1 114 20 20 20 20 0
2009.2 108 21 21 21 21 0
2010.1 102 22 22 22 22 0
2010.2 96 24 24 24 24 0
2011.1 90 17 17 17 17 0
2011.2 84 19 19 19 19 0
2012.1 78 26 26 26 26 0
2012.2 72 27 27 27 27 0
2013.1 66 16 16 16 16 0
2013.2 60 23 23 23 23 (0)
2014.1 54 8 8 8 8 (0)
2014.2 48 17 17 17 17 0
2015.1 42 10 10 10 9 1
2015.2 36 19 19 19 19 0
2016.1 30 9 9 9 9 0
2016.2 24 24 24 24 24 0
2017.1 18 10 10 10 11 (1)
2017.2 12 16 16 16 11 5
2018.1 6 13 13 13
Total 826 826 826 807 5
Appendix D Page 5
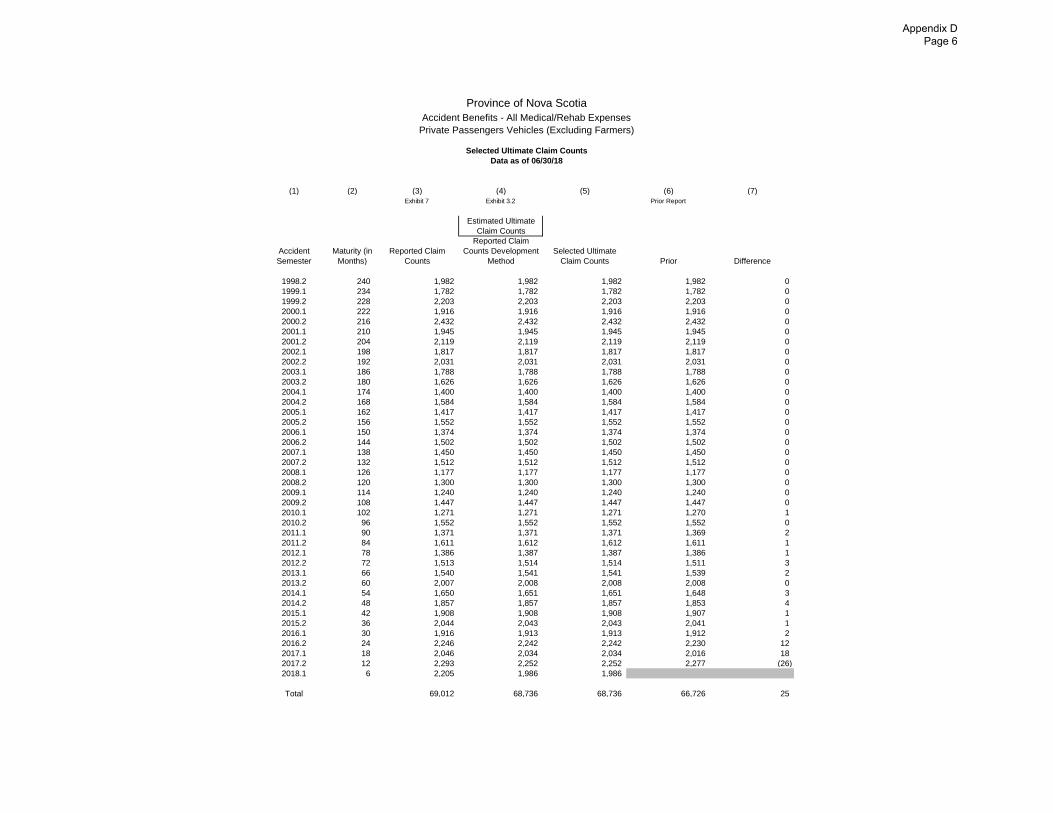
Province of Nova Scotia
Accident Benefits - All Medical/Rehab Expenses
Private Passengers Vehicles (Excluding Farmers)
Selected Ultimate Claim Counts
Data as of 06/30/18
(1) (2) (3) (4) (5) (6) (7)
Exhibit 7 Exhibit 3.2 Prior Report
Estimated Ultimate
Claim Counts
Accident
Semester
Maturity (in
Months)
Reported Claim
Counts
Reported Claim
Counts Development
Method
Selected Ultimate
Claim Counts Prior Difference
1998.2 240 1,982 1,982 1,982 1,982 0
1999.1 234 1,782 1,782 1,782 1,782 0
1999.2 228 2,203 2,203 2,203 2,203 0
2000.1 222 1,916 1,916 1,916 1,916 0
2000.2 216 2,432 2,432 2,432 2,432 0
2001.1 210 1,945 1,945 1,945 1,945 0
2001.2 204 2,119 2,119 2,119 2,119 0
2002.1 198 1,817 1,817 1,817 1,817 0
2002.2 192 2,031 2,031 2,031 2,031 0
2003.1 186 1,788 1,788 1,788 1,788 0
2003.2 180 1,626 1,626 1,626 1,626 0
2004.1 174 1,400 1,400 1,400 1,400 0
2004.2 168 1,584 1,584 1,584 1,584 0
2005.1 162 1,417 1,417 1,417 1,417 0
2005.2 156 1,552 1,552 1,552 1,552 0
2006.1 150 1,374 1,374 1,374 1,374 0
2006.2 144 1,502 1,502 1,502 1,502 0
2007.1 138 1,450 1,450 1,450 1,450 0
2007.2 132 1,512 1,512 1,512 1,512 0
2008.1 126 1,177 1,177 1,177 1,177 0
2008.2 120 1,300 1,300 1,300 1,300 0
2009.1 114 1,240 1,240 1,240 1,240 0
2009.2 108 1,447 1,447 1,447 1,447 0
2010.1 102 1,271 1,271 1,271 1,270 1
2010.2 96 1,552 1,552 1,552 1,552 0
2011.1 90 1,371 1,371 1,371 1,369 2
2011.2 84 1,611 1,612 1,612 1,611 1
2012.1 78 1,386 1,387 1,387 1,386 1
2012.2 72 1,513 1,514 1,514 1,511 3
2013.1 66 1,540 1,541 1,541 1,539 2
2013.2 60 2,007 2,008 2,008 2,008 0
2014.1 54 1,650 1,651 1,651 1,648 3
2014.2 48 1,857 1,857 1,857 1,853 4
2015.1 42 1,908 1,908 1,908 1,907 1
2015.2 36 2,044 2,043 2,043 2,041 1
2016.1 30 1,916 1,913 1,913 1,912 2
2016.2 24 2,246 2,242 2,242 2,230 12
2017.1 18 2,046 2,034 2,034 2,016 18
2017.2 12 2,293 2,252 2,252 2,277 (26)
2018.1 6 2,205 1,986 1,986
Total 69,012 68,736 68,736 66,726 25
Appendix D Page 6
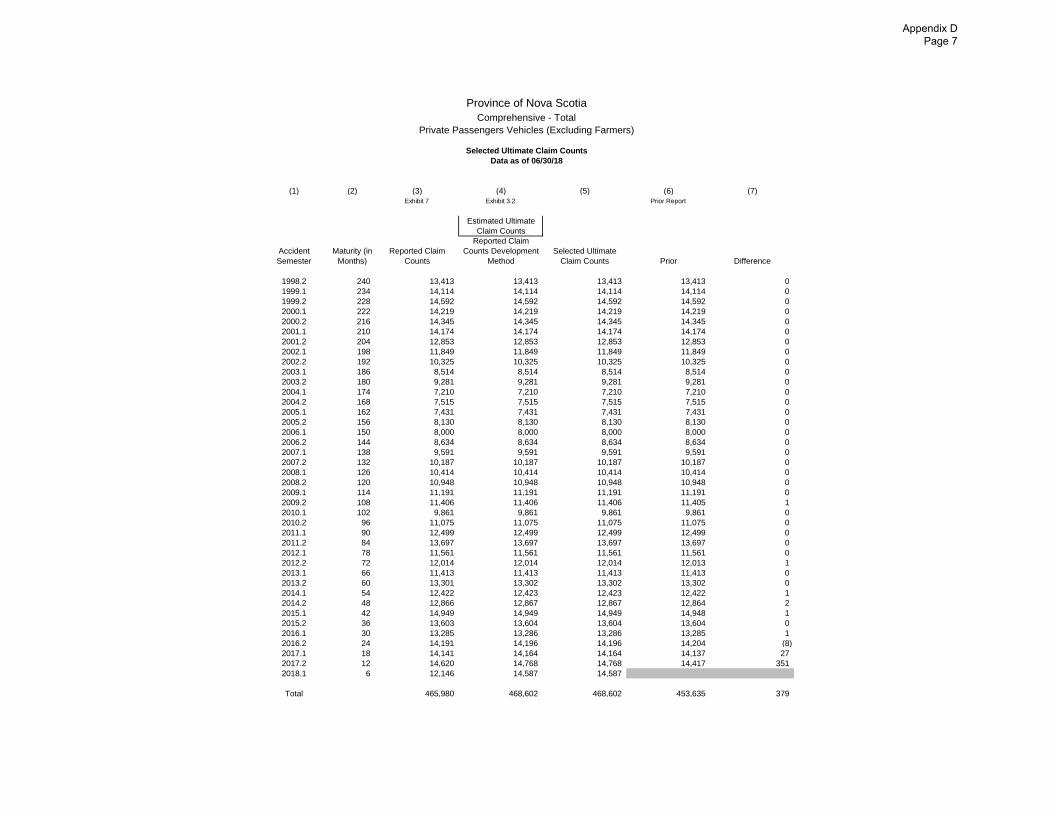
Province of Nova Scotia
Comprehensive - Total
Private Passengers Vehicles (Excluding Farmers)
Selected Ultimate Claim Counts
Data as of 06/30/18
(1) (2) (3) (4) (5) (6) (7)
Exhibit 7 Exhibit 3.2 Prior Report
Estimated Ultimate
Claim Counts
Accident
Semester
Maturity (in
Months)
Reported Claim
Counts
Reported Claim
Counts Development
Method
Selected Ultimate
Claim Counts Prior Difference
1998.2 240 13,413 13,413 13,413 13,413 0
1999.1 234 14,114 14,114 14,114 14,114 0
1999.2 228 14,592 14,592 14,592 14,592 0
2000.1 222 14,219 14,219 14,219 14,219 0
2000.2 216 14,345 14,345 14,345 14,345 0
2001.1 210 14,174 14,174 14,174 14,174 0
2001.2 204 12,853 12,853 12,853 12,853 0
2002.1 198 11,849 11,849 11,849 11,849 0
2002.2 192 10,325 10,325 10,325 10,325 0
2003.1 186 8,514 8,514 8,514 8,514 0
2003.2 180 9,281 9,281 9,281 9,281 0
2004.1 174 7,210 7,210 7,210 7,210 0
2004.2 168 7,515 7,515 7,515 7,515 0
2005.1 162 7,431 7,431 7,431 7,431 0
2005.2 156 8,130 8,130 8,130 8,130 0
2006.1 150 8,000 8,000 8,000 8,000 0
2006.2 144 8,634 8,634 8,634 8,634 0
2007.1 138 9,591 9,591 9,591 9,591 0
2007.2 132 10,187 10,187 10,187 10,187 0
2008.1 126 10,414 10,414 10,414 10,414 0
2008.2 120 10,948 10,948 10,948 10,948 0
2009.1 114 11,191 11,191 11,191 11,191 0
2009.2 108 11,406 11,406 11,406 11,405 1
2010.1 102 9,861 9,861 9,861 9,861 0
2010.2 96 11,075 11,075 11,075 11,075 0
2011.1 90 12,499 12,499 12,499 12,499 0
2011.2 84 13,697 13,697 13,697 13,697 0
2012.1 78 11,561 11,561 11,561 11,561 0
2012.2 72 12,014 12,014 12,014 12,013 1
2013.1 66 11,413 11,413 11,413 11,413 0
2013.2 60 13,301 13,302 13,302 13,302 0
2014.1 54 12,422 12,423 12,423 12,422 1
2014.2 48 12,866 12,867 12,867 12,864 2
2015.1 42 14,949 14,949 14,949 14,948 1
2015.2 36 13,603 13,604 13,604 13,604 0
2016.1 30 13,285 13,286 13,286 13,285 1
2016.2 24 14,191 14,196 14,196 14,204 (8)
2017.1 18 14,141 14,164 14,164 14,137 27
2017.2 12 14,620 14,768 14,768 14,417 351
2018.1 6 12,146 14,587 14,587
Total 465,980 468,602 468,602 453,635 379
Appendix D Page 7
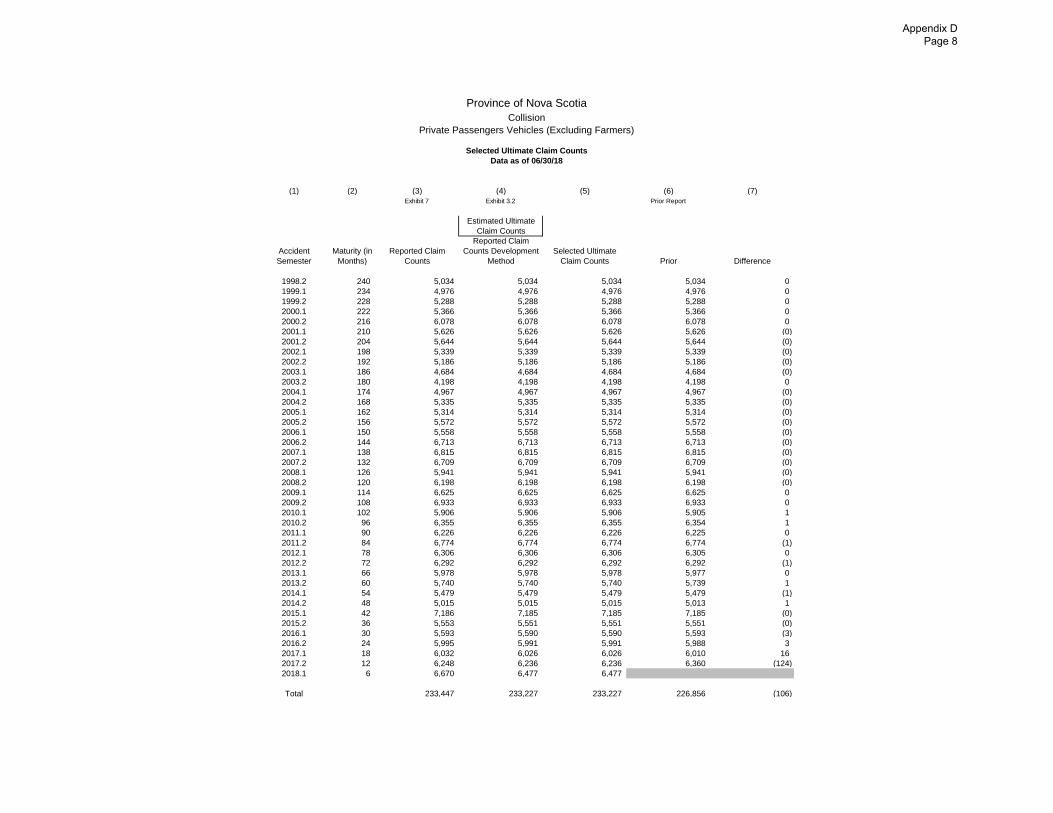
Province of Nova Scotia
Collision
Private Passengers Vehicles (Excluding Farmers)
Selected Ultimate Claim Counts
Data as of 06/30/18
(1) (2) (3) (4) (5) (6) (7)
Exhibit 7 Exhibit 3.2 Prior Report
Estimated Ultimate
Claim Counts
Accident
Semester
Maturity (in
Months)
Reported Claim
Counts
Reported Claim
Counts Development
Method
Selected Ultimate
Claim Counts Prior Difference
1998.2 240 5,034 5,034 5,034 5,034 0
1999.1 234 4,976 4,976 4,976 4,976 0
1999.2 228 5,288 5,288 5,288 5,288 0
2000.1 222 5,366 5,366 5,366 5,366 0
2000.2 216 6,078 6,078 6,078 6,078 0
2001.1 210 5,626 5,626 5,626 5,626 (0)
2001.2 204 5,644 5,644 5,644 5,644 (0)
2002.1 198 5,339 5,339 5,339 5,339 (0)
2002.2 192 5,186 5,186 5,186 5,186 (0)
2003.1 186 4,684 4,684 4,684 4,684 (0)
2003.2 180 4,198 4,198 4,198 4,198 0
2004.1 174 4,967 4,967 4,967 4,967 (0)
2004.2 168 5,335 5,335 5,335 5,335 (0)
2005.1 162 5,314 5,314 5,314 5,314 (0)
2005.2 156 5,572 5,572 5,572 5,572 (0)
2006.1 150 5,558 5,558 5,558 5,558 (0)
2006.2 144 6,713 6,713 6,713 6,713 (0)
2007.1 138 6,815 6,815 6,815 6,815 (0)
2007.2 132 6,709 6,709 6,709 6,709 (0)
2008.1 126 5,941 5,941 5,941 5,941 (0)
2008.2 120 6,198 6,198 6,198 6,198 (0)
2009.1 114 6,625 6,625 6,625 6,625 0
2009.2 108 6,933 6,933 6,933 6,933 0
2010.1 102 5,906 5,906 5,906 5,905 1
2010.2 96 6,355 6,355 6,355 6,354 1
2011.1 90 6,226 6,226 6,226 6,225 0
2011.2 84 6,774 6,774 6,774 6,774 (1)
2012.1 78 6,306 6,306 6,306 6,305 0
2012.2 72 6,292 6,292 6,292 6,292 (1)
2013.1 66 5,978 5,978 5,978 5,977 0
2013.2 60 5,740 5,740 5,740 5,739 1
2014.1 54 5,479 5,479 5,479 5,479 (1)
2014.2 48 5,015 5,015 5,015 5,013 1
2015.1 42 7,186 7,185 7,185 7,185 (0)
2015.2 36 5,553 5,551 5,551 5,551 (0)
2016.1 30 5,593 5,590 5,590 5,593 (3)
2016.2 24 5,995 5,991 5,991 5,988 3
2017.1 18 6,032 6,026 6,026 6,010 16
2017.2 12 6,248 6,236 6,236 6,360 (124)
2018.1 6 6,670 6,477 6,477
Total 233,447 233,227 233,227 226,856 (106)
Appendix D Page 8
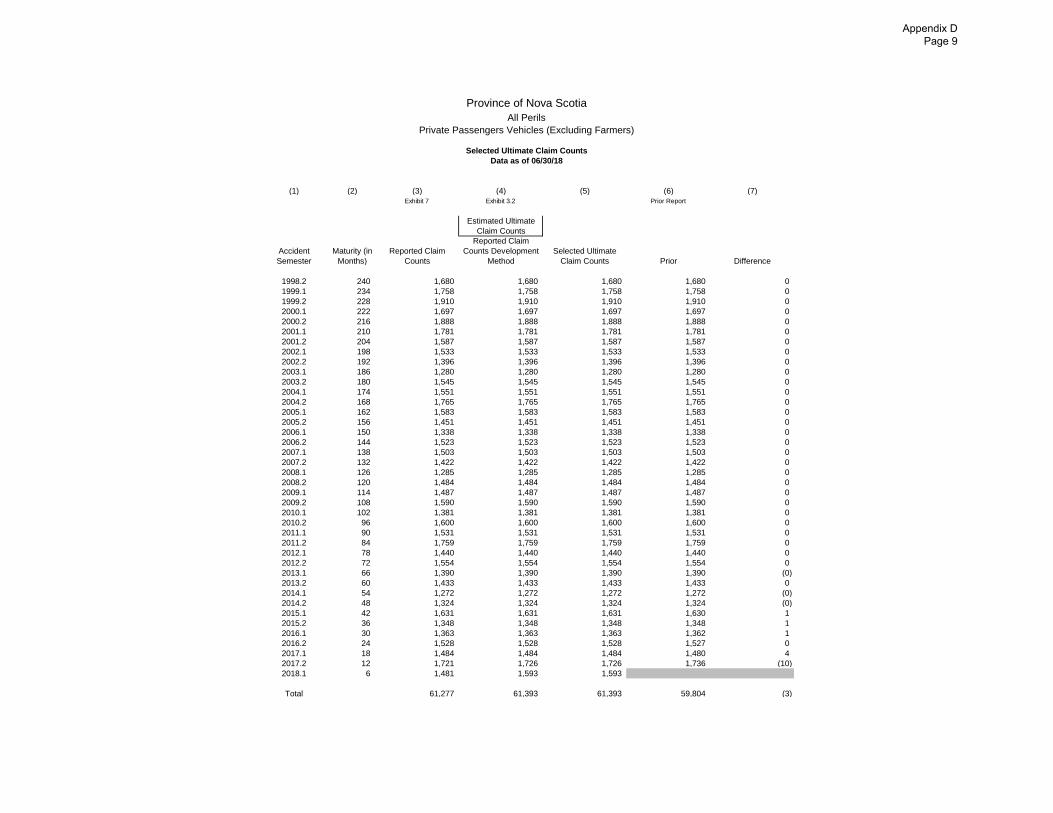
Province of Nova Scotia
All Perils
Private Passengers Vehicles (Excluding Farmers)
Selected Ultimate Claim Counts
Data as of 06/30/18
(1) (2) (3) (4) (5) (6) (7)
Exhibit 7 Exhibit 3.2 Prior Report
Estimated Ultimate
Claim Counts
Accident
Semester
Maturity (in
Months)
Reported Claim
Counts
Reported Claim
Counts Development
Method
Selected Ultimate
Claim Counts Prior Difference
1998.2 240 1,680 1,680 1,680 1,680 0
1999.1 234 1,758 1,758 1,758 1,758 0
1999.2 228 1,910 1,910 1,910 1,910 0
2000.1 222 1,697 1,697 1,697 1,697 0
2000.2 216 1,888 1,888 1,888 1,888 0
2001.1 210 1,781 1,781 1,781 1,781 0
2001.2 204 1,587 1,587 1,587 1,587 0
2002.1 198 1,533 1,533 1,533 1,533 0
2002.2 192 1,396 1,396 1,396 1,396 0
2003.1 186 1,280 1,280 1,280 1,280 0
2003.2 180 1,545 1,545 1,545 1,545 0
2004.1 174 1,551 1,551 1,551 1,551 0
2004.2 168 1,765 1,765 1,765 1,765 0
2005.1 162 1,583 1,583 1,583 1,583 0
2005.2 156 1,451 1,451 1,451 1,451 0
2006.1 150 1,338 1,338 1,338 1,338 0
2006.2 144 1,523 1,523 1,523 1,523 0
2007.1 138 1,503 1,503 1,503 1,503 0
2007.2 132 1,422 1,422 1,422 1,422 0
2008.1 126 1,285 1,285 1,285 1,285 0
2008.2 120 1,484 1,484 1,484 1,484 0
2009.1 114 1,487 1,487 1,487 1,487 0
2009.2 108 1,590 1,590 1,590 1,590 0
2010.1 102 1,381 1,381 1,381 1,381 0
2010.2 96 1,600 1,600 1,600 1,600 0
2011.1 90 1,531 1,531 1,531 1,531 0
2011.2 84 1,759 1,759 1,759 1,759 0
2012.1 78 1,440 1,440 1,440 1,440 0
2012.2 72 1,554 1,554 1,554 1,554 0
2013.1 66 1,390 1,390 1,390 1,390 (0)
2013.2 60 1,433 1,433 1,433 1,433 0
2014.1 54 1,272 1,272 1,272 1,272 (0)
2014.2 48 1,324 1,324 1,324 1,324 (0)
2015.1 42 1,631 1,631 1,631 1,630 1
2015.2 36 1,348 1,348 1,348 1,348 1
2016.1 30 1,363 1,363 1,363 1,362 1
2016.2 24 1,528 1,528 1,528 1,527 0
2017.1 18 1,484 1,484 1,484 1,480 4
2017.2 12 1,721 1,726 1,726 1,736 (10)
2018.1 6 1,481 1,593 1,593
Total 61,277 61,393 61,393 59,804 (3)
Appendix D Page 9
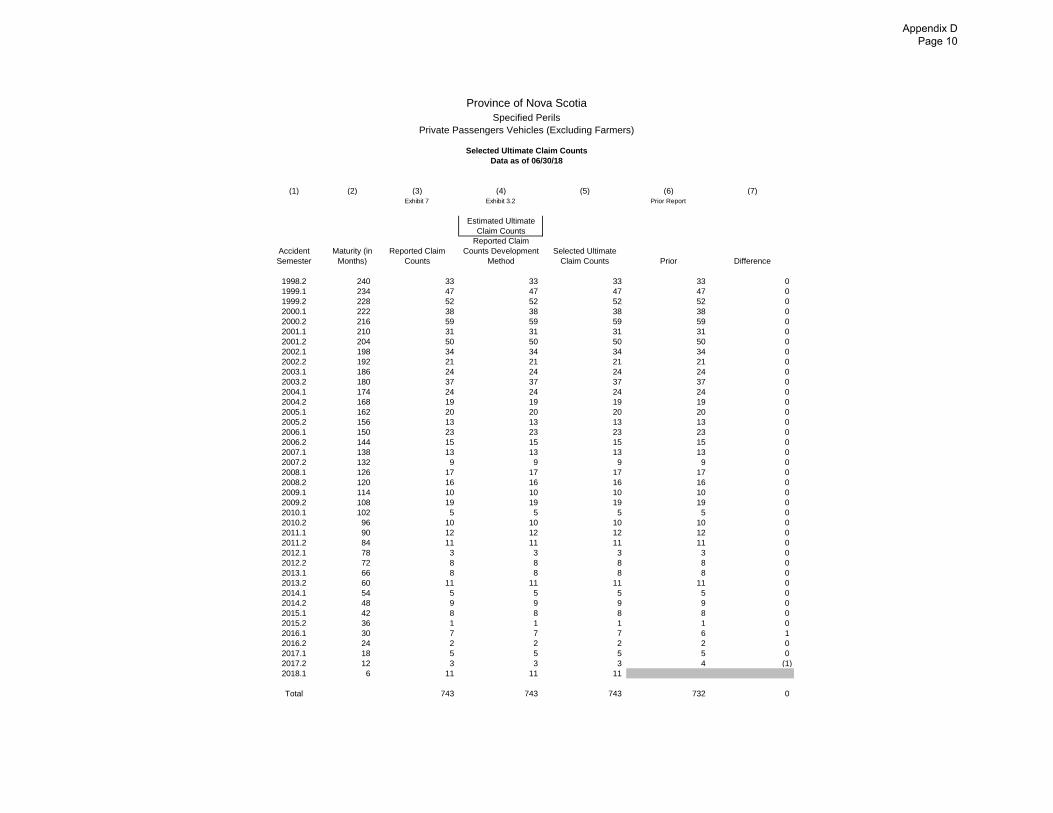
Province of Nova Scotia
Specified Perils
Private Passengers Vehicles (Excluding Farmers)
Selected Ultimate Claim Counts
Data as of 06/30/18
(1) (2) (3) (4) (5) (6) (7)
Exhibit 7 Exhibit 3.2 Prior Report
Estimated Ultimate
Claim Counts
Accident
Semester
Maturity (in
Months)
Reported Claim
Counts
Reported Claim
Counts Development
Method
Selected Ultimate
Claim Counts Prior Difference
1998.2 240 33 33 33 33 0
1999.1 234 47 47 47 47 0
1999.2 228 52 52 52 52 0
2000.1 222 38 38 38 38 0
2000.2 216 59 59 59 59 0
2001.1 210 31 31 31 31 0
2001.2 204 50 50 50 50 0
2002.1 198 34 34 34 34 0
2002.2 192 21 21 21 21 0
2003.1 186 24 24 24 24 0
2003.2 180 37 37 37 37 0
2004.1 174 24 24 24 24 0
2004.2 168 19 19 19 19 0
2005.1 162 20 20 20 20 0
2005.2 156 13 13 13 13 0
2006.1 150 23 23 23 23 0
2006.2 144 15 15 15 15 0
2007.1 138 13 13 13 13 0
2007.2 132 9 9 9 9 0
2008.1 126 17 17 17 17 0
2008.2 120 16 16 16 16 0
2009.1 114 10 10 10 10 0
2009.2 108 19 19 19 19 0
2010.1 102 5 5 5 5 0
2010.2 96 10 10 10 10 0
2011.1 90 12 12 12 12 0
2011.2 84 11 11 11 11 0
2012.1 78 3 3 3 3 0
2012.2 72 8 8 8 8 0
2013.1 66 8 8 8 8 0
2013.2 60 11 11 11 11 0
2014.1 54 5 5 5 5 0
2014.2 48 9 9 9 9 0
2015.1 42 8 8 8 8 0
2015.2 36 1 1 1 1 0
2016.1 30 7 7 7 6 1
2016.2 24 2 2 2 2 0
2017.1 18 5 5 5 5 0
2017.2 12 3 3 3 4 (1)
2018.1 6 11 11 11
Total 743 743 743 732 0
Appendix D Page 10
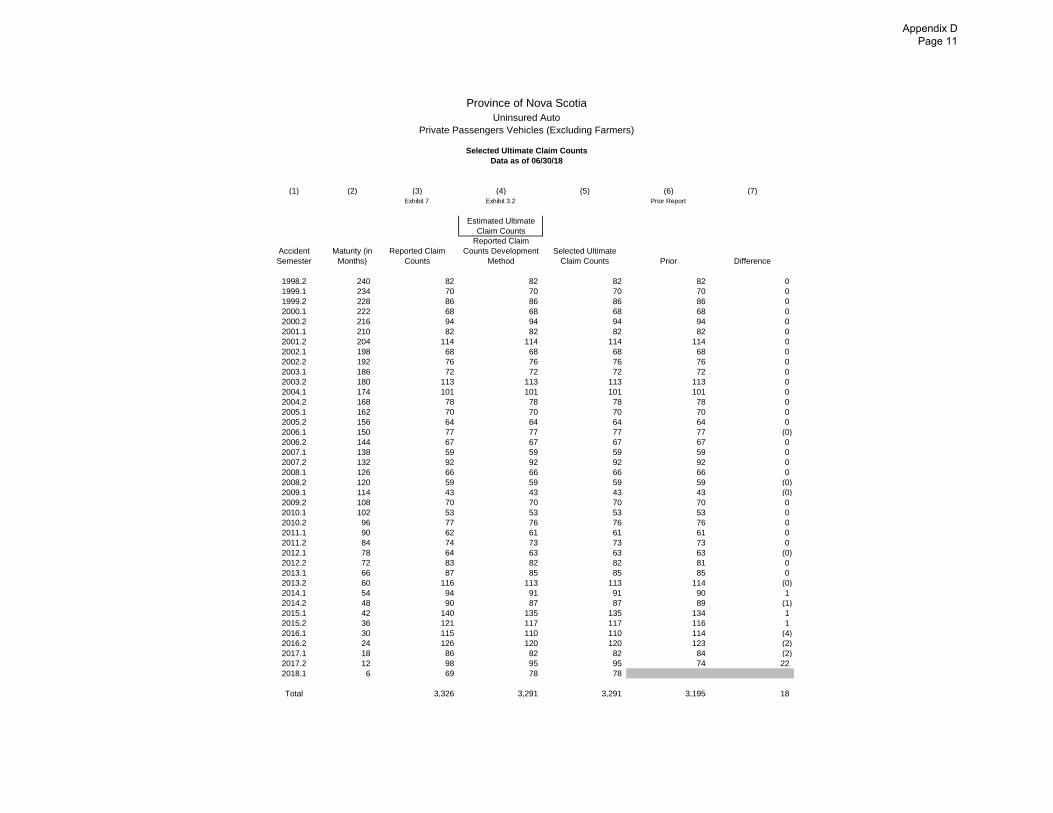
Province of Nova Scotia
Uninsured Auto
Private Passengers Vehicles (Excluding Farmers)
Selected Ultimate Claim Counts
Data as of 06/30/18
(1) (2) (3) (4) (5) (6) (7)
Exhibit 7 Exhibit 3.2 Prior Report
Estimated Ultimate
Claim Counts
Accident
Semester
Maturity (in
Months)
Reported Claim
Counts
Reported Claim
Counts Development
Method
Selected Ultimate
Claim Counts Prior Difference
1998.2 240 82 82 82 82 0
1999.1 234 70 70 70 70 0
1999.2 228 86 86 86 86 0
2000.1 222 68 68 68 68 0
2000.2 216 94 94 94 94 0
2001.1 210 82 82 82 82 0
2001.2 204 114 114 114 114 0
2002.1 198 68 68 68 68 0
2002.2 192 76 76 76 76 0
2003.1 186 72 72 72 72 0
2003.2 180 113 113 113 113 0
2004.1 174 101 101 101 101 0
2004.2 168 78 78 78 78 0
2005.1 162 70 70 70 70 0
2005.2 156 64 64 64 64 0
2006.1 150 77 77 77 77 (0)
2006.2 144 67 67 67 67 0
2007.1 138 59 59 59 59 0
2007.2 132 92 92 92 92 0
2008.1 126 66 66 66 66 0
2008.2 120 59 59 59 59 (0)
2009.1 114 43 43 43 43 (0)
2009.2 108 70 70 70 70 0
2010.1 102 53 53 53 53 0
2010.2 96 77 76 76 76 0
2011.1 90 62 61 61 61 0
2011.2 84 74 73 73 73 0
2012.1 78 64 63 63 63 (0)
2012.2 72 83 82 82 81 0
2013.1 66 87 85 85 85 0
2013.2 60 116 113 113 114 (0)
2014.1 54 94 91 91 90 1
2014.2 48 90 87 87 89 (1)
2015.1 42 140 135 135 134 1
2015.2 36 121 117 117 116 1
2016.1 30 115 110 110 114 (4)
2016.2 24 126 120 120 123 (2)
2017.1 18 86 82 82 84 (2)
2017.2 12 98 95 95 74 22
2018.1 6 69 78 78
Total 3,326 3,291 3,291 3,195 18
Appendix D Page 11
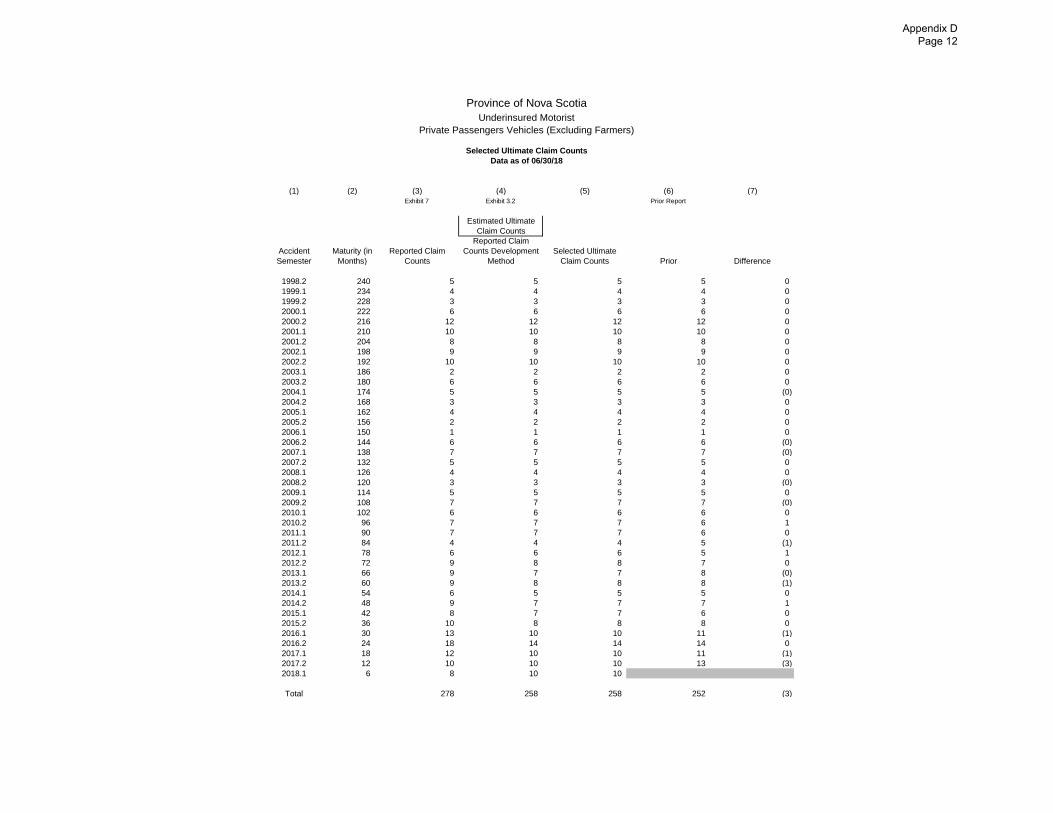
Province of Nova Scotia
Underinsured Motorist
Private Passengers Vehicles (Excluding Farmers)
Selected Ultimate Claim Counts
Data as of 06/30/18
(1) (2) (3) (4) (5) (6) (7)
Exhibit 7 Exhibit 3.2 Prior Report
Estimated Ultimate
Claim Counts
Accident
Semester
Maturity (in
Months)
Reported Claim
Counts
Reported Claim
Counts Development
Method
Selected Ultimate
Claim Counts Prior Difference
1998.2 240 5 5 5 5 0
1999.1 234 4 4 4 4 0
1999.2 228 3 3 3 3 0
2000.1 222 6 6 6 6 0
2000.2 216 12 12 12 12 0
2001.1 210 10 10 10 10 0
2001.2 204 8 8 8 8 0
2002.1 198 9 9 9 9 0
2002.2 192 10 10 10 10 0
2003.1 186 2 2 2 2 0
2003.2 180 6 6 6 6 0
2004.1 174 5 5 5 5 (0)
2004.2 168 3 3 3 3 0
2005.1 162 4 4 4 4 0
2005.2 156 2 2 2 2 0
2006.1 150 1 1 1 1 0
2006.2 144 6 6 6 6 (0)
2007.1 138 7 7 7 7 (0)
2007.2 132 5 5 5 5 0
2008.1 126 4 4 4 4 0
2008.2 120 3 3 3 3 (0)
2009.1 114 5 5 5 5 0
2009.2 108 7 7 7 7 (0)
2010.1 102 6 6 6 6 0
2010.2 96 7 7 7 6 1
2011.1 90 7 7 7 6 0
2011.2 84 4 4 4 5 (1)
2012.1 78 6 6 6 5 1
2012.2 72 9 8 8 7 0
2013.1 66 9 7 7 8 (0)
2013.2 60 9 8 8 8 (1)
2014.1 54 6 5 5 5 0
2014.2 48 9 7 7 7 1
2015.1 42 8 7 7 6 0
2015.2 36 10 8 8 8 0
2016.1 30 13 10 10 11 (1)
2016.2 24 18 14 14 14 0
2017.1 18 12 10 10 11 (1)
2017.2 12 10 10 10 13 (3)
2018.1 6 8 10 10
Total 278 258 258 252 (3)
Appendix D Page 12
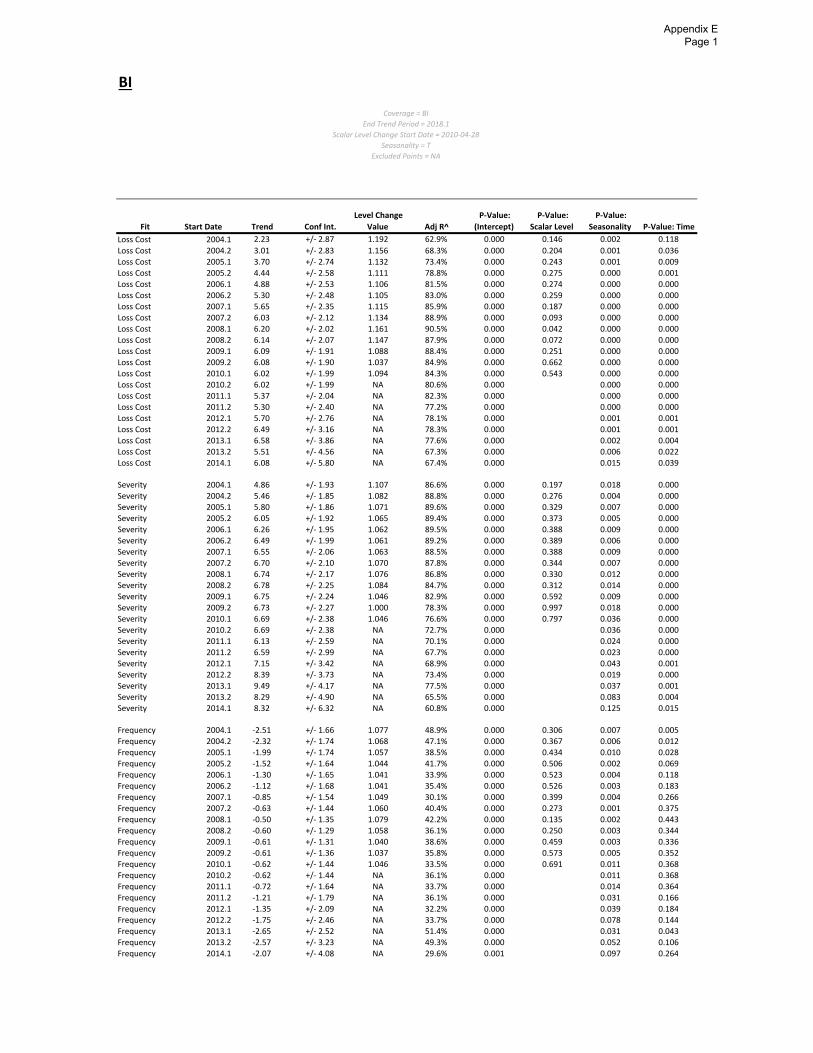
BI
Fit Start Date Trend Conf Int.
Level Change
Value Adj R^
P‐Value:
(Intercept)
P‐Value:
Scalar Level
P‐Value:
Seasonality P‐Value: Time
Loss Cost 2004.1 2.23 +/‐ 2.87 1.192 62.9% 0.000 0.146 0.002 0.118
Loss Cost 2004.2 3.01 +/‐ 2.83 1.156 68.3% 0.000 0.204 0.001 0.036
Loss Cost 2005.1 3.70 +/‐ 2.74 1.132 73.4% 0.000 0.243 0.001 0.009
Loss Cost 2005.2 4.44 +/‐ 2.58 1.111 78.8% 0.000 0.275 0.000 0.001
Loss Cost 2006.1 4.88 +/‐ 2.53 1.106 81.5% 0.000 0.274 0.000 0.000
Loss Cost 2006.2 5.30 +/‐ 2.48 1.105 83.0% 0.000 0.259 0.000 0.000
Loss Cost 2007.1 5.65 +/‐ 2.35 1.115 85.9% 0.000 0.187 0.000 0.000
Loss Cost 2007.2 6.03 +/‐ 2.12 1.134 88.9% 0.000 0.093 0.000 0.000
Loss Cost 2008.1 6.20 +/‐ 2.02 1.161 90.5% 0.000 0.042 0.000 0.000
Loss Cost 2008.2 6.14 +/‐ 2.07 1.147 87.9% 0.000 0.072 0.000 0.000
Loss Cost 2009.1 6.09 +/‐ 1.91 1.088 88.4% 0.000 0.251 0.000 0.000
Loss Cost 2009.2 6.08 +/‐ 1.90 1.037 84.9% 0.000 0.662 0.000 0.000Loss Cost 2010.1 6.02 +/‐ 1.99 1.094 84.3% 0.000 0.543 0.000 0.000Loss Cost 2010.2 6.02 +/‐ 1.99 NA 80.6% 0.000 0.000 0.000Loss Cost 2011.1 5.37 +/‐ 2.04 NA 82.3% 0.000 0.000 0.000Loss Cost 2011.2 5.30 +/‐ 2.40 NA 77.2% 0.000 0.000 0.000Loss Cost 2012.1 5.70 +/‐ 2.76 NA 78.1% 0.000 0.001 0.001Loss Cost 2012.2 6.49 +/‐ 3.16 NA 78.3% 0.000 0.001 0.001Loss Cost 2013.1 6.58 +/‐ 3.86 NA 77.6% 0.000 0.002 0.004Loss Cost 2013.2 5.51 +/‐ 4.56 NA 67.3% 0.000 0.006 0.022Loss Cost 2014.1 6.08 +/‐ 5.80 NA 67.4% 0.000 0.015 0.039
Severity 2004.1 4.86 +/‐ 1.93 1.107 86.6% 0.000 0.197 0.018 0.000Severity 2004.2 5.46 +/‐ 1.85 1.082 88.8% 0.000 0.276 0.004 0.000Severity 2005.1 5.80 +/‐ 1.86 1.071 89.6% 0.000 0.329 0.007 0.000Severity 2005.2 6.05 +/‐ 1.92 1.065 89.4% 0.000 0.373 0.005 0.000Severity 2006.1 6.26 +/‐ 1.95 1.062 89.5% 0.000 0.388 0.009 0.000Severity 2006.2 6.49 +/‐ 1.99 1.061 89.2% 0.000 0.389 0.006 0.000Severity 2007.1 6.55 +/‐ 2.06 1.063 88.5% 0.000 0.388 0.009 0.000Severity 2007.2 6.70 +/‐ 2.10 1.070 87.8% 0.000 0.344 0.007 0.000Severity 2008.1 6.74 +/‐ 2.17 1.076 86.8% 0.000 0.330 0.012 0.000Severity 2008.2 6.78 +/‐ 2.25 1.084 84.7% 0.000 0.312 0.014 0.000Severity 2009.1 6.75 +/‐ 2.24 1.046 82.9% 0.000 0.592 0.009 0.000Severity 2009.2 6.73 +/‐ 2.27 1.000 78.3% 0.000 0.997 0.018 0.000Severity 2010.1 6.69 +/‐ 2.38 1.046 76.6% 0.000 0.797 0.036 0.000Severity 2010.2 6.69 +/‐ 2.38 NA 72.7% 0.000 0.036 0.000Severity 2011.1 6.13 +/‐ 2.59 NA 70.1% 0.000 0.024 0.000Severity 2011.2 6.59 +/‐ 2.99 NA 67.7% 0.000 0.023 0.000Severity 2012.1 7.15 +/‐ 3.42 NA 68.9% 0.000 0.043 0.001Severity 2012.2 8.39 +/‐ 3.73 NA 73.4% 0.000 0.019 0.000Severity 2013.1 9.49 +/‐ 4.17 NA 77.5% 0.000 0.037 0.001Severity 2013.2 8.29 +/‐ 4.90 NA 65.5% 0.000 0.083 0.004Severity 2014.1 8.32 +/‐ 6.32 NA 60.8% 0.000 0.125 0.015
Frequency 2004.1 ‐2.51 +/‐ 1.66 1.077 48.9% 0.000 0.306 0.007 0.005
Frequency 2004.2 ‐2.32 +/‐ 1.74 1.068 47.1% 0.000 0.367 0.006 0.012Frequency 2005.1 ‐1.99 +/‐ 1.74 1.057 38.5% 0.000 0.434 0.010 0.028Frequency 2005.2 ‐1.52 +/‐ 1.64 1.044 41.7% 0.000 0.506 0.002 0.069
Frequency 2006.1 ‐1.30 +/‐ 1.65 1.041 33.9% 0.000 0.523 0.004 0.118
Frequency 2006.2 ‐1.12 +/‐ 1.68 1.041 35.4% 0.000 0.526 0.003 0.183Frequency 2007.1 ‐0.85 +/‐ 1.54 1.049 30.1% 0.000 0.399 0.004 0.266Frequency 2007.2 ‐0.63 +/‐ 1.44 1.060 40.4% 0.000 0.273 0.001 0.375
Frequency 2008.1 ‐0.50 +/‐ 1.35 1.079 42.2% 0.000 0.135 0.002 0.443
Frequency 2008.2 ‐0.60 +/‐ 1.29 1.058 36.1% 0.000 0.250 0.003 0.344
Frequency 2009.1 ‐0.61 +/‐ 1.31 1.040 38.6% 0.000 0.459 0.003 0.336Frequency 2009.2 ‐0.61 +/‐ 1.36 1.037 35.8% 0.000 0.573 0.005 0.352Frequency 2010.1 ‐0.62 +/‐ 1.44 1.046 33.5% 0.000 0.691 0.011 0.368
Frequency 2010.2 ‐0.62 +/‐ 1.44 NA 36.1% 0.000 0.011 0.368
Frequency 2011.1 ‐0.72 +/‐ 1.64 NA 33.7% 0.000 0.014 0.364
Frequency 2011.2 ‐1.21 +/‐ 1.79 NA 36.1% 0.000 0.031 0.166Frequency 2012.1 ‐1.35 +/‐ 2.09 NA 32.2% 0.000 0.039 0.184
Frequency 2012.2 ‐1.75 +/‐ 2.46 NA 33.7% 0.000 0.078 0.144Frequency 2013.1 ‐2.65 +/‐ 2.52 NA 51.4% 0.000 0.031 0.043
Frequency 2013.2 ‐2.57 +/‐ 3.23 NA 49.3% 0.000 0.052 0.106
Frequency 2014.1 ‐2.07 +/‐ 4.08 NA 29.6% 0.001 0.097 0.264
Coverage = BI
End Trend Period = 2018.1
Scalar Level Change Start Date = 2010‐04‐28
Seasonality = T
Excluded Points = NA
Appendix E Page 1
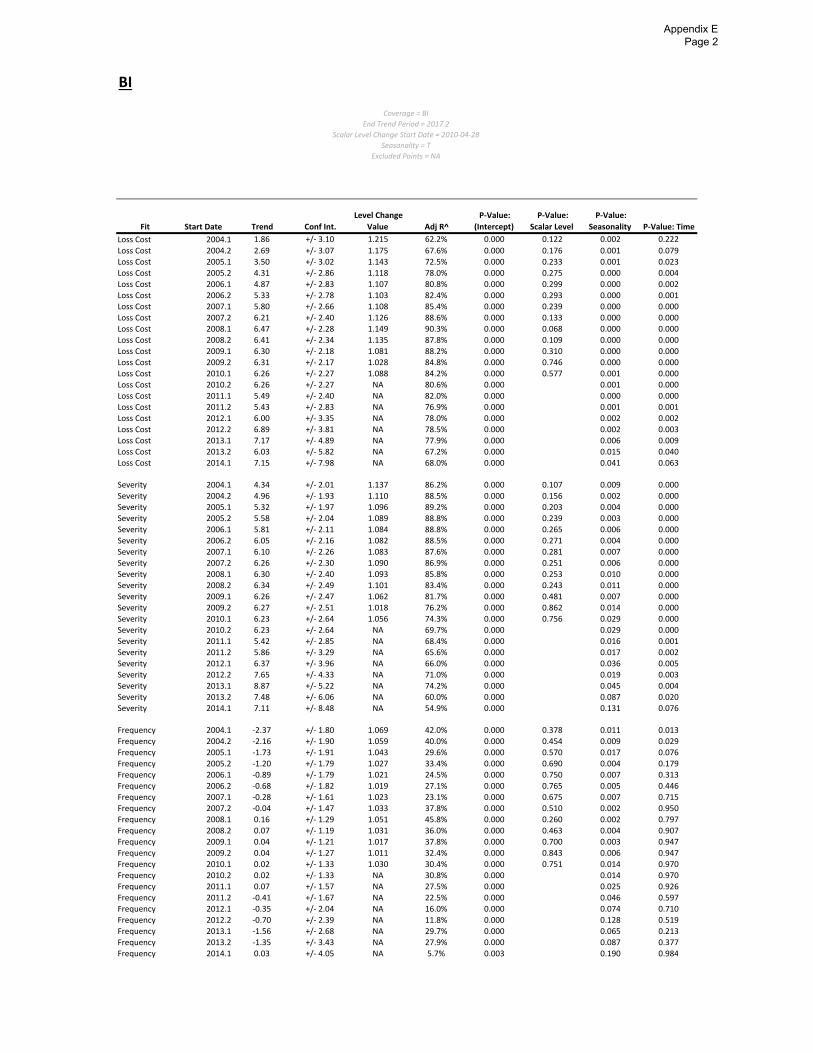
BI
Fit Start Date Trend Conf Int.
Level Change
Value Adj R^
P‐Value:
(Intercept)
P‐Value:
Scalar Level
P‐Value:
Seasonality P‐Value: Time
Loss Cost 2004.1 1.86 +/‐ 3.10 1.215 62.2% 0.000 0.122 0.002 0.222
Loss Cost 2004.2 2.69 +/‐ 3.07 1.175 67.6% 0.000 0.176 0.001 0.079
Loss Cost 2005.1 3.50 +/‐ 3.02 1.143 72.5% 0.000 0.233 0.001 0.023
Loss Cost 2005.2 4.31 +/‐ 2.86 1.118 78.0% 0.000 0.275 0.000 0.004
Loss Cost 2006.1 4.87 +/‐ 2.83 1.107 80.8% 0.000 0.299 0.000 0.002
Loss Cost 2006.2 5.33 +/‐ 2.78 1.103 82.4% 0.000 0.293 0.000 0.001
Loss Cost 2007.1 5.80 +/‐ 2.66 1.108 85.4% 0.000 0.239 0.000 0.000
Loss Cost 2007.2 6.21 +/‐ 2.40 1.126 88.6% 0.000 0.133 0.000 0.000
Loss Cost 2008.1 6.47 +/‐ 2.28 1.149 90.3% 0.000 0.068 0.000 0.000
Loss Cost 2008.2 6.41 +/‐ 2.34 1.135 87.8% 0.000 0.109 0.000 0.000
Loss Cost 2009.1 6.30 +/‐ 2.18 1.081 88.2% 0.000 0.310 0.000 0.000
Loss Cost 2009.2 6.31 +/‐ 2.17 1.028 84.8% 0.000 0.746 0.000 0.000Loss Cost 2010.1 6.26 +/‐ 2.27 1.088 84.2% 0.000 0.577 0.001 0.000Loss Cost 2010.2 6.26 +/‐ 2.27 NA 80.6% 0.000 0.001 0.000Loss Cost 2011.1 5.49 +/‐ 2.40 NA 82.0% 0.000 0.000 0.000Loss Cost 2011.2 5.43 +/‐ 2.83 NA 76.9% 0.000 0.001 0.001Loss Cost 2012.1 6.00 +/‐ 3.35 NA 78.0% 0.000 0.002 0.002Loss Cost 2012.2 6.89 +/‐ 3.81 NA 78.5% 0.000 0.002 0.003Loss Cost 2013.1 7.17 +/‐ 4.89 NA 77.9% 0.000 0.006 0.009Loss Cost 2013.2 6.03 +/‐ 5.82 NA 67.2% 0.000 0.015 0.040Loss Cost 2014.1 7.15 +/‐ 7.98 NA 68.0% 0.000 0.041 0.063
Severity 2004.1 4.34 +/‐ 2.01 1.137 86.2% 0.000 0.107 0.009 0.000Severity 2004.2 4.96 +/‐ 1.93 1.110 88.5% 0.000 0.156 0.002 0.000Severity 2005.1 5.32 +/‐ 1.97 1.096 89.2% 0.000 0.203 0.004 0.000Severity 2005.2 5.58 +/‐ 2.04 1.089 88.8% 0.000 0.239 0.003 0.000Severity 2006.1 5.81 +/‐ 2.11 1.084 88.8% 0.000 0.265 0.006 0.000Severity 2006.2 6.05 +/‐ 2.16 1.082 88.5% 0.000 0.271 0.004 0.000Severity 2007.1 6.10 +/‐ 2.26 1.083 87.6% 0.000 0.281 0.007 0.000Severity 2007.2 6.26 +/‐ 2.30 1.090 86.9% 0.000 0.251 0.006 0.000Severity 2008.1 6.30 +/‐ 2.40 1.093 85.8% 0.000 0.253 0.010 0.000Severity 2008.2 6.34 +/‐ 2.49 1.101 83.4% 0.000 0.243 0.011 0.000Severity 2009.1 6.26 +/‐ 2.47 1.062 81.7% 0.000 0.481 0.007 0.000Severity 2009.2 6.27 +/‐ 2.51 1.018 76.2% 0.000 0.862 0.014 0.000Severity 2010.1 6.23 +/‐ 2.64 1.056 74.3% 0.000 0.756 0.029 0.000Severity 2010.2 6.23 +/‐ 2.64 NA 69.7% 0.000 0.029 0.000Severity 2011.1 5.42 +/‐ 2.85 NA 68.4% 0.000 0.016 0.001Severity 2011.2 5.86 +/‐ 3.29 NA 65.6% 0.000 0.017 0.002Severity 2012.1 6.37 +/‐ 3.96 NA 66.0% 0.000 0.036 0.005Severity 2012.2 7.65 +/‐ 4.33 NA 71.0% 0.000 0.019 0.003Severity 2013.1 8.87 +/‐ 5.22 NA 74.2% 0.000 0.045 0.004Severity 2013.2 7.48 +/‐ 6.06 NA 60.0% 0.000 0.087 0.020Severity 2014.1 7.11 +/‐ 8.48 NA 54.9% 0.000 0.131 0.076
Frequency 2004.1 ‐2.37 +/‐ 1.80 1.069 42.0% 0.000 0.378 0.011 0.013
Frequency 2004.2 ‐2.16 +/‐ 1.90 1.059 40.0% 0.000 0.454 0.009 0.029Frequency 2005.1 ‐1.73 +/‐ 1.91 1.043 29.6% 0.000 0.570 0.017 0.076
Frequency 2005.2 ‐1.20 +/‐ 1.79 1.027 33.4% 0.000 0.690 0.004 0.179
Frequency 2006.1 ‐0.89 +/‐ 1.79 1.021 24.5% 0.000 0.750 0.007 0.313Frequency 2006.2 ‐0.68 +/‐ 1.82 1.019 27.1% 0.000 0.765 0.005 0.446
Frequency 2007.1 ‐0.28 +/‐ 1.61 1.023 23.1% 0.000 0.675 0.007 0.715Frequency 2007.2 ‐0.04 +/‐ 1.47 1.033 37.8% 0.000 0.510 0.002 0.950
Frequency 2008.1 0.16 +/‐ 1.29 1.051 45.8% 0.000 0.260 0.002 0.797Frequency 2008.2 0.07 +/‐ 1.19 1.031 36.0% 0.000 0.463 0.004 0.907
Frequency 2009.1 0.04 +/‐ 1.21 1.017 37.8% 0.000 0.700 0.003 0.947Frequency 2009.2 0.04 +/‐ 1.27 1.011 32.4% 0.000 0.843 0.006 0.947Frequency 2010.1 0.02 +/‐ 1.33 1.030 30.4% 0.000 0.751 0.014 0.970Frequency 2010.2 0.02 +/‐ 1.33 NA 30.8% 0.000 0.014 0.970
Frequency 2011.1 0.07 +/‐ 1.57 NA 27.5% 0.000 0.025 0.926
Frequency 2011.2 ‐0.41 +/‐ 1.67 NA 22.5% 0.000 0.046 0.597Frequency 2012.1 ‐0.35 +/‐ 2.04 NA 16.0% 0.000 0.074 0.710
Frequency 2012.2 ‐0.70 +/‐ 2.39 NA 11.8% 0.000 0.128 0.519Frequency 2013.1 ‐1.56 +/‐ 2.68 NA 29.7% 0.000 0.065 0.213
Frequency 2013.2 ‐1.35 +/‐ 3.43 NA 27.9% 0.000 0.087 0.377
Frequency 2014.1 0.03 +/‐ 4.05 NA 5.7% 0.003 0.190 0.984
Coverage = BI
End Trend Period = 2017.2
Scalar Level Change Start Date = 2010‐04‐28
Seasonality = T
Excluded Points = NA
Appendix E Page 2
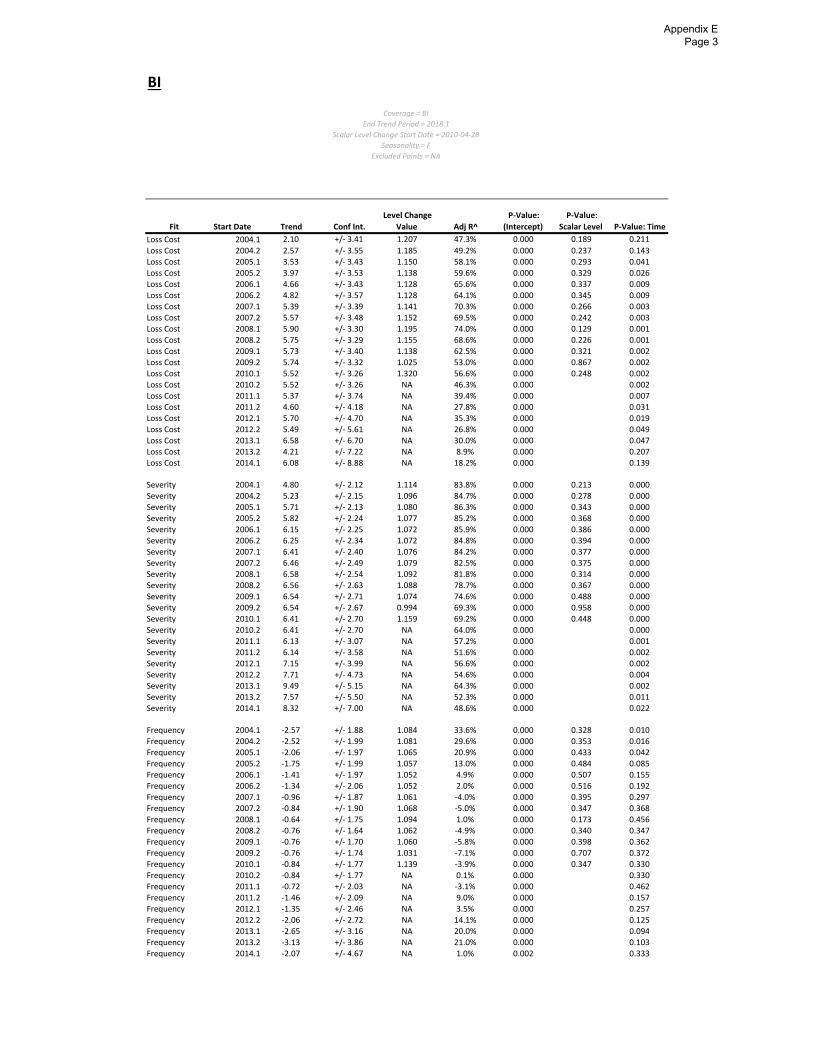
BI
Fit Start Date Trend Conf Int.
Level Change
Value Adj R^
P‐Value:
(Intercept)
P‐Value:
Scalar Level P‐Value: Time
Loss Cost 2004.1 2.10 +/‐ 3.41 1.207 47.3% 0.000 0.189 0.211
Loss Cost 2004.2 2.57 +/‐ 3.55 1.185 49.2% 0.000 0.237 0.143
Loss Cost 2005.1 3.53 +/‐ 3.43 1.150 58.1% 0.000 0.293 0.041
Loss Cost 2005.2 3.97 +/‐ 3.53 1.138 59.6% 0.000 0.329 0.026
Loss Cost 2006.1 4.66 +/‐ 3.43 1.128 65.6% 0.000 0.337 0.009
Loss Cost 2006.2 4.82 +/‐ 3.57 1.128 64.1% 0.000 0.345 0.009
Loss Cost 2007.1 5.39 +/‐ 3.39 1.141 70.3% 0.000 0.266 0.003
Loss Cost 2007.2 5.57 +/‐ 3.48 1.152 69.5% 0.000 0.242 0.003
Loss Cost 2008.1 5.90 +/‐ 3.30 1.195 74.0% 0.000 0.129 0.001
Loss Cost 2008.2 5.75 +/‐ 3.29 1.155 68.6% 0.000 0.226 0.001
Loss Cost 2009.1 5.73 +/‐ 3.40 1.138 62.5% 0.000 0.321 0.002
Loss Cost 2009.2 5.74 +/‐ 3.32 1.025 53.0% 0.000 0.867 0.002Loss Cost 2010.1 5.52 +/‐ 3.26 1.320 56.6% 0.000 0.248 0.002Loss Cost 2010.2 5.52 +/‐ 3.26 NA 46.3% 0.000 0.002Loss Cost 2011.1 5.37 +/‐ 3.74 NA 39.4% 0.000 0.007Loss Cost 2011.2 4.60 +/‐ 4.18 NA 27.8% 0.000 0.031Loss Cost 2012.1 5.70 +/‐ 4.70 NA 35.3% 0.000 0.019Loss Cost 2012.2 5.49 +/‐ 5.61 NA 26.8% 0.000 0.049Loss Cost 2013.1 6.58 +/‐ 6.70 NA 30.0% 0.000 0.047Loss Cost 2013.2 4.21 +/‐ 7.22 NA 8.9% 0.000 0.207Loss Cost 2014.1 6.08 +/‐ 8.88 NA 18.2% 0.000 0.139
Severity 2004.1 4.80 +/‐ 2.12 1.114 83.8% 0.000 0.213 0.000Severity 2004.2 5.23 +/‐ 2.15 1.096 84.7% 0.000 0.278 0.000Severity 2005.1 5.71 +/‐ 2.13 1.080 86.3% 0.000 0.343 0.000Severity 2005.2 5.82 +/‐ 2.24 1.077 85.2% 0.000 0.368 0.000Severity 2006.1 6.15 +/‐ 2.25 1.072 85.9% 0.000 0.386 0.000Severity 2006.2 6.25 +/‐ 2.34 1.072 84.8% 0.000 0.394 0.000Severity 2007.1 6.41 +/‐ 2.40 1.076 84.2% 0.000 0.377 0.000Severity 2007.2 6.46 +/‐ 2.49 1.079 82.5% 0.000 0.375 0.000Severity 2008.1 6.58 +/‐ 2.54 1.092 81.8% 0.000 0.314 0.000Severity 2008.2 6.56 +/‐ 2.63 1.088 78.7% 0.000 0.367 0.000Severity 2009.1 6.54 +/‐ 2.71 1.074 74.6% 0.000 0.488 0.000Severity 2009.2 6.54 +/‐ 2.67 0.994 69.3% 0.000 0.958 0.000Severity 2010.1 6.41 +/‐ 2.70 1.159 69.2% 0.000 0.448 0.000Severity 2010.2 6.41 +/‐ 2.70 NA 64.0% 0.000 0.000Severity 2011.1 6.13 +/‐ 3.07 NA 57.2% 0.000 0.001Severity 2011.2 6.14 +/‐ 3.58 NA 51.6% 0.000 0.002Severity 2012.1 7.15 +/‐ 3.99 NA 56.6% 0.000 0.002Severity 2012.2 7.71 +/‐ 4.73 NA 54.6% 0.000 0.004
Severity 2013.1 9.49 +/‐ 5.15 NA 64.3% 0.000 0.002Severity 2013.2 7.57 +/‐ 5.50 NA 52.3% 0.000 0.011Severity 2014.1 8.32 +/‐ 7.00 NA 48.6% 0.000 0.022
Frequency 2004.1 ‐2.57 +/‐ 1.88 1.084 33.6% 0.000 0.328 0.010Frequency 2004.2 ‐2.52 +/‐ 1.99 1.081 29.6% 0.000 0.353 0.016Frequency 2005.1 ‐2.06 +/‐ 1.97 1.065 20.9% 0.000 0.433 0.042
Frequency 2005.2 ‐1.75 +/‐ 1.99 1.057 13.0% 0.000 0.484 0.085
Frequency 2006.1 ‐1.41 +/‐ 1.97 1.052 4.9% 0.000 0.507 0.155Frequency 2006.2 ‐1.34 +/‐ 2.06 1.052 2.0% 0.000 0.516 0.192
Frequency 2007.1 ‐0.96 +/‐ 1.87 1.061 ‐4.0% 0.000 0.395 0.297Frequency 2007.2 ‐0.84 +/‐ 1.90 1.068 ‐5.0% 0.000 0.347 0.368
Frequency 2008.1 ‐0.64 +/‐ 1.75 1.094 1.0% 0.000 0.173 0.456
Frequency 2008.2 ‐0.76 +/‐ 1.64 1.062 ‐4.9% 0.000 0.340 0.347Frequency 2009.1 ‐0.76 +/‐ 1.70 1.060 ‐5.8% 0.000 0.398 0.362
Frequency 2009.2 ‐0.76 +/‐ 1.74 1.031 ‐7.1% 0.000 0.707 0.372Frequency 2010.1 ‐0.84 +/‐ 1.77 1.139 ‐3.9% 0.000 0.347 0.330
Frequency 2010.2 ‐0.84 +/‐ 1.77 NA 0.1% 0.000 0.330Frequency 2011.1 ‐0.72 +/‐ 2.03 NA ‐3.1% 0.000 0.462
Frequency 2011.2 ‐1.46 +/‐ 2.09 NA 9.0% 0.000 0.157
Frequency 2012.1 ‐1.35 +/‐ 2.46 NA 3.5% 0.000 0.257Frequency 2012.2 ‐2.06 +/‐ 2.72 NA 14.1% 0.000 0.125
Frequency 2013.1 ‐2.65 +/‐ 3.16 NA 20.0% 0.000 0.094
Frequency 2013.2 ‐3.13 +/‐ 3.86 NA 21.0% 0.000 0.103
Frequency 2014.1 ‐2.07 +/‐ 4.67 NA 1.0% 0.002 0.333
Coverage = BI
End Trend Period = 2018.1
Scalar Level Change Start Date = 2010‐04‐28
Seasonality = F
Excluded Points = NA
Appendix E Page 3
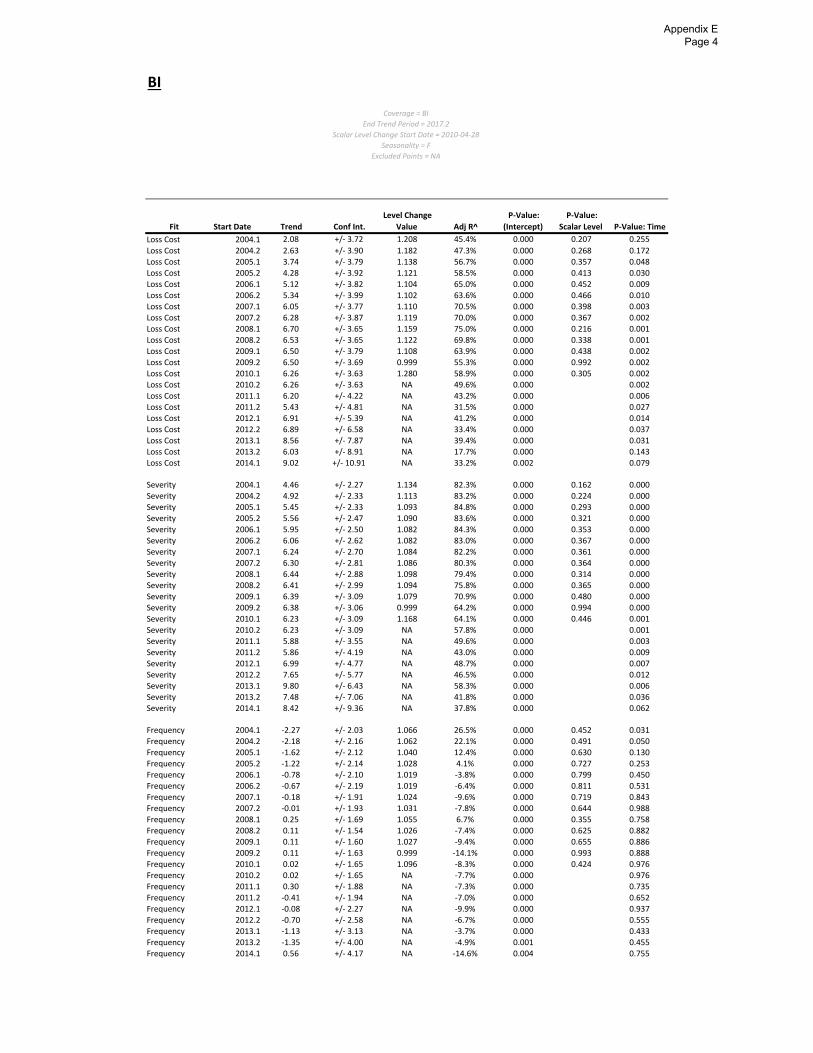
BI
Fit Start Date Trend Conf Int.
Level Change
Value Adj R^
P‐Value:
(Intercept)
P‐Value:
Scalar Level P‐Value: Time
Loss Cost 2004.1 2.08 +/‐ 3.72 1.208 45.4% 0.000 0.207 0.255
Loss Cost 2004.2 2.63 +/‐ 3.90 1.182 47.3% 0.000 0.268 0.172
Loss Cost 2005.1 3.74 +/‐ 3.79 1.138 56.7% 0.000 0.357 0.048
Loss Cost 2005.2 4.28 +/‐ 3.92 1.121 58.5% 0.000 0.413 0.030
Loss Cost 2006.1 5.12 +/‐ 3.82 1.104 65.0% 0.000 0.452 0.009
Loss Cost 2006.2 5.34 +/‐ 3.99 1.102 63.6% 0.000 0.466 0.010
Loss Cost 2007.1 6.05 +/‐ 3.77 1.110 70.5% 0.000 0.398 0.003
Loss Cost 2007.2 6.28 +/‐ 3.87 1.119 70.0% 0.000 0.367 0.002
Loss Cost 2008.1 6.70 +/‐ 3.65 1.159 75.0% 0.000 0.216 0.001
Loss Cost 2008.2 6.53 +/‐ 3.65 1.122 69.8% 0.000 0.338 0.001
Loss Cost 2009.1 6.50 +/‐ 3.79 1.108 63.9% 0.000 0.438 0.002
Loss Cost 2009.2 6.50 +/‐ 3.69 0.999 55.3% 0.000 0.992 0.002Loss Cost 2010.1 6.26 +/‐ 3.63 1.280 58.9% 0.000 0.305 0.002Loss Cost 2010.2 6.26 +/‐ 3.63 NA 49.6% 0.000 0.002Loss Cost 2011.1 6.20 +/‐ 4.22 NA 43.2% 0.000 0.006Loss Cost 2011.2 5.43 +/‐ 4.81 NA 31.5% 0.000 0.027Loss Cost 2012.1 6.91 +/‐ 5.39 NA 41.2% 0.000 0.014
Loss Cost 2012.2 6.89 +/‐ 6.58 NA 33.4% 0.000 0.037Loss Cost 2013.1 8.56 +/‐ 7.87 NA 39.4% 0.000 0.031Loss Cost 2013.2 6.03 +/‐ 8.91 NA 17.7% 0.000 0.143Loss Cost 2014.1 9.02 +/‐ 10.91 NA 33.2% 0.002 0.079
Severity 2004.1 4.46 +/‐ 2.27 1.134 82.3% 0.000 0.162 0.000Severity 2004.2 4.92 +/‐ 2.33 1.113 83.2% 0.000 0.224 0.000Severity 2005.1 5.45 +/‐ 2.33 1.093 84.8% 0.000 0.293 0.000Severity 2005.2 5.56 +/‐ 2.47 1.090 83.6% 0.000 0.321 0.000Severity 2006.1 5.95 +/‐ 2.50 1.082 84.3% 0.000 0.353 0.000Severity 2006.2 6.06 +/‐ 2.62 1.082 83.0% 0.000 0.367 0.000Severity 2007.1 6.24 +/‐ 2.70 1.084 82.2% 0.000 0.361 0.000Severity 2007.2 6.30 +/‐ 2.81 1.086 80.3% 0.000 0.364 0.000Severity 2008.1 6.44 +/‐ 2.88 1.098 79.4% 0.000 0.314 0.000Severity 2008.2 6.41 +/‐ 2.99 1.094 75.8% 0.000 0.365 0.000Severity 2009.1 6.39 +/‐ 3.09 1.079 70.9% 0.000 0.480 0.000Severity 2009.2 6.38 +/‐ 3.06 0.999 64.2% 0.000 0.994 0.000Severity 2010.1 6.23 +/‐ 3.09 1.168 64.1% 0.000 0.446 0.001Severity 2010.2 6.23 +/‐ 3.09 NA 57.8% 0.000 0.001Severity 2011.1 5.88 +/‐ 3.55 NA 49.6% 0.000 0.003Severity 2011.2 5.86 +/‐ 4.19 NA 43.0% 0.000 0.009Severity 2012.1 6.99 +/‐ 4.77 NA 48.7% 0.000 0.007Severity 2012.2 7.65 +/‐ 5.77 NA 46.5% 0.000 0.012Severity 2013.1 9.80 +/‐ 6.43 NA 58.3% 0.000 0.006
Severity 2013.2 7.48 +/‐ 7.06 NA 41.8% 0.000 0.036
Severity 2014.1 8.42 +/‐ 9.36 NA 37.8% 0.000 0.062
Frequency 2004.1 ‐2.27 +/‐ 2.03 1.066 26.5% 0.000 0.452 0.031
Frequency 2004.2 ‐2.18 +/‐ 2.16 1.062 22.1% 0.000 0.491 0.050Frequency 2005.1 ‐1.62 +/‐ 2.12 1.040 12.4% 0.000 0.630 0.130
Frequency 2005.2 ‐1.22 +/‐ 2.14 1.028 4.1% 0.000 0.727 0.253Frequency 2006.1 ‐0.78 +/‐ 2.10 1.019 ‐3.8% 0.000 0.799 0.450
Frequency 2006.2 ‐0.67 +/‐ 2.19 1.019 ‐6.4% 0.000 0.811 0.531Frequency 2007.1 ‐0.18 +/‐ 1.91 1.024 ‐9.6% 0.000 0.719 0.843Frequency 2007.2 ‐0.01 +/‐ 1.93 1.031 ‐7.8% 0.000 0.644 0.988Frequency 2008.1 0.25 +/‐ 1.69 1.055 6.7% 0.000 0.355 0.758
Frequency 2008.2 0.11 +/‐ 1.54 1.026 ‐7.4% 0.000 0.625 0.882Frequency 2009.1 0.11 +/‐ 1.60 1.027 ‐9.4% 0.000 0.655 0.886
Frequency 2009.2 0.11 +/‐ 1.63 0.999 ‐14.1% 0.000 0.993 0.888Frequency 2010.1 0.02 +/‐ 1.65 1.096 ‐8.3% 0.000 0.424 0.976Frequency 2010.2 0.02 +/‐ 1.65 NA ‐7.7% 0.000 0.976
Frequency 2011.1 0.30 +/‐ 1.88 NA ‐7.3% 0.000 0.735
Frequency 2011.2 ‐0.41 +/‐ 1.94 NA ‐7.0% 0.000 0.652Frequency 2012.1 ‐0.08 +/‐ 2.27 NA ‐9.9% 0.000 0.937
Frequency 2012.2 ‐0.70 +/‐ 2.58 NA ‐6.7% 0.000 0.555Frequency 2013.1 ‐1.13 +/‐ 3.13 NA ‐3.7% 0.000 0.433
Frequency 2013.2 ‐1.35 +/‐ 4.00 NA ‐4.9% 0.001 0.455
Frequency 2014.1 0.56 +/‐ 4.17 NA ‐14.6% 0.004 0.755
Coverage = BI
End Trend Period = 2017.2
Scalar Level Change Start Date = 2010‐04‐28
Seasonality = F
Excluded Points = NA
Appendix E Page 4
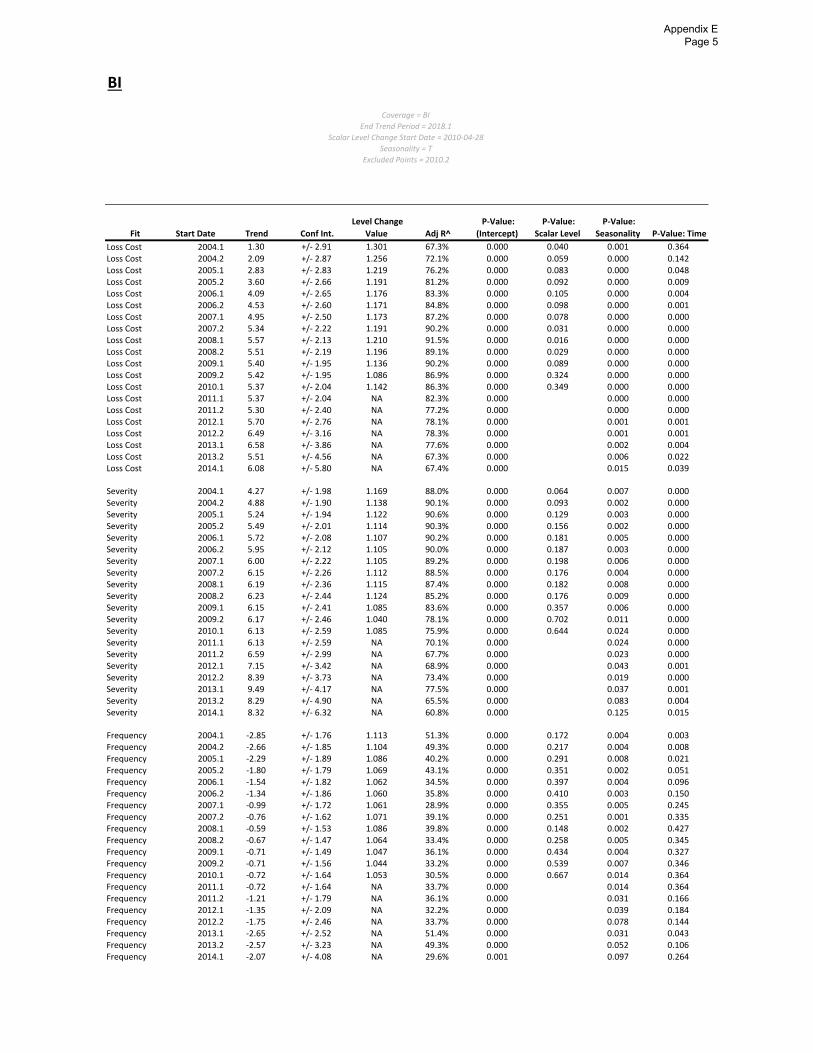
BI
Fit Start Date Trend Conf Int.
Level Change
Value Adj R^
P‐Value:
(Intercept)
P‐Value:
Scalar Level
P‐Value:
Seasonality P‐Value: Time
Loss Cost 2004.1 1.30 +/‐ 2.91 1.301 67.3% 0.000 0.040 0.001 0.364
Loss Cost 2004.2 2.09 +/‐ 2.87 1.256 72.1% 0.000 0.059 0.000 0.142Loss Cost 2005.1 2.83 +/‐ 2.83 1.219 76.2% 0.000 0.083 0.000 0.048Loss Cost 2005.2 3.60 +/‐ 2.66 1.191 81.2% 0.000 0.092 0.000 0.009Loss Cost 2006.1 4.09 +/‐ 2.65 1.176 83.3% 0.000 0.105 0.000 0.004Loss Cost 2006.2 4.53 +/‐ 2.60 1.171 84.8% 0.000 0.098 0.000 0.001Loss Cost 2007.1 4.95 +/‐ 2.50 1.173 87.2% 0.000 0.078 0.000 0.000Loss Cost 2007.2 5.34 +/‐ 2.22 1.191 90.2% 0.000 0.031 0.000 0.000Loss Cost 2008.1 5.57 +/‐ 2.13 1.210 91.5% 0.000 0.016 0.000 0.000Loss Cost 2008.2 5.51 +/‐ 2.19 1.196 89.1% 0.000 0.029 0.000 0.000Loss Cost 2009.1 5.40 +/‐ 1.95 1.136 90.2% 0.000 0.089 0.000 0.000Loss Cost 2009.2 5.42 +/‐ 1.95 1.086 86.9% 0.000 0.324 0.000 0.000Loss Cost 2010.1 5.37 +/‐ 2.04 1.142 86.3% 0.000 0.349 0.000 0.000Loss Cost 2011.1 5.37 +/‐ 2.04 NA 82.3% 0.000 0.000 0.000Loss Cost 2011.2 5.30 +/‐ 2.40 NA 77.2% 0.000 0.000 0.000Loss Cost 2012.1 5.70 +/‐ 2.76 NA 78.1% 0.000 0.001 0.001Loss Cost 2012.2 6.49 +/‐ 3.16 NA 78.3% 0.000 0.001 0.001Loss Cost 2013.1 6.58 +/‐ 3.86 NA 77.6% 0.000 0.002 0.004Loss Cost 2013.2 5.51 +/‐ 4.56 NA 67.3% 0.000 0.006 0.022Loss Cost 2014.1 6.08 +/‐ 5.80 NA 67.4% 0.000 0.015 0.039
Severity 2004.1 4.27 +/‐ 1.98 1.169 88.0% 0.000 0.064 0.007 0.000Severity 2004.2 4.88 +/‐ 1.90 1.138 90.1% 0.000 0.093 0.002 0.000Severity 2005.1 5.24 +/‐ 1.94 1.122 90.6% 0.000 0.129 0.003 0.000Severity 2005.2 5.49 +/‐ 2.01 1.114 90.3% 0.000 0.156 0.002 0.000Severity 2006.1 5.72 +/‐ 2.08 1.107 90.2% 0.000 0.181 0.005 0.000Severity 2006.2 5.95 +/‐ 2.12 1.105 90.0% 0.000 0.187 0.003 0.000Severity 2007.1 6.00 +/‐ 2.22 1.105 89.2% 0.000 0.198 0.006 0.000Severity 2007.2 6.15 +/‐ 2.26 1.112 88.5% 0.000 0.176 0.004 0.000Severity 2008.1 6.19 +/‐ 2.36 1.115 87.4% 0.000 0.182 0.008 0.000Severity 2008.2 6.23 +/‐ 2.44 1.124 85.2% 0.000 0.176 0.009 0.000Severity 2009.1 6.15 +/‐ 2.41 1.085 83.6% 0.000 0.357 0.006 0.000Severity 2009.2 6.17 +/‐ 2.46 1.040 78.1% 0.000 0.702 0.011 0.000Severity 2010.1 6.13 +/‐ 2.59 1.085 75.9% 0.000 0.644 0.024 0.000Severity 2011.1 6.13 +/‐ 2.59 NA 70.1% 0.000 0.024 0.000Severity 2011.2 6.59 +/‐ 2.99 NA 67.7% 0.000 0.023 0.000Severity 2012.1 7.15 +/‐ 3.42 NA 68.9% 0.000 0.043 0.001Severity 2012.2 8.39 +/‐ 3.73 NA 73.4% 0.000 0.019 0.000Severity 2013.1 9.49 +/‐ 4.17 NA 77.5% 0.000 0.037 0.001Severity 2013.2 8.29 +/‐ 4.90 NA 65.5% 0.000 0.083 0.004Severity 2014.1 8.32 +/‐ 6.32 NA 60.8% 0.000 0.125 0.015
Frequency 2004.1 ‐2.85 +/‐ 1.76 1.113 51.3% 0.000 0.172 0.004 0.003Frequency 2004.2 ‐2.66 +/‐ 1.85 1.104 49.3% 0.000 0.217 0.004 0.008Frequency 2005.1 ‐2.29 +/‐ 1.89 1.086 40.2% 0.000 0.291 0.008 0.021Frequency 2005.2 ‐1.80 +/‐ 1.79 1.069 43.1% 0.000 0.351 0.002 0.051Frequency 2006.1 ‐1.54 +/‐ 1.82 1.062 34.5% 0.000 0.397 0.004 0.096Frequency 2006.2 ‐1.34 +/‐ 1.86 1.060 35.8% 0.000 0.410 0.003 0.150Frequency 2007.1 ‐0.99 +/‐ 1.72 1.061 28.9% 0.000 0.355 0.005 0.245Frequency 2007.2 ‐0.76 +/‐ 1.62 1.071 39.1% 0.000 0.251 0.001 0.335Frequency 2008.1 ‐0.59 +/‐ 1.53 1.086 39.8% 0.000 0.148 0.002 0.427Frequency 2008.2 ‐0.67 +/‐ 1.47 1.064 33.4% 0.000 0.258 0.005 0.345Frequency 2009.1 ‐0.71 +/‐ 1.49 1.047 36.1% 0.000 0.434 0.004 0.327Frequency 2009.2 ‐0.71 +/‐ 1.56 1.044 33.2% 0.000 0.539 0.007 0.346Frequency 2010.1 ‐0.72 +/‐ 1.64 1.053 30.5% 0.000 0.667 0.014 0.364Frequency 2011.1 ‐0.72 +/‐ 1.64 NA 33.7% 0.000 0.014 0.364Frequency 2011.2 ‐1.21 +/‐ 1.79 NA 36.1% 0.000 0.031 0.166Frequency 2012.1 ‐1.35 +/‐ 2.09 NA 32.2% 0.000 0.039 0.184Frequency 2012.2 ‐1.75 +/‐ 2.46 NA 33.7% 0.000 0.078 0.144Frequency 2013.1 ‐2.65 +/‐ 2.52 NA 51.4% 0.000 0.031 0.043Frequency 2013.2 ‐2.57 +/‐ 3.23 NA 49.3% 0.000 0.052 0.106Frequency 2014.1 ‐2.07 +/‐ 4.08 NA 29.6% 0.001 0.097 0.264
Coverage = BI
End Trend Period = 2018.1
Scalar Level Change Start Date = 2010‐04‐28
Seasonality = T
Excluded Points = 2010.2
Appendix E Page 5
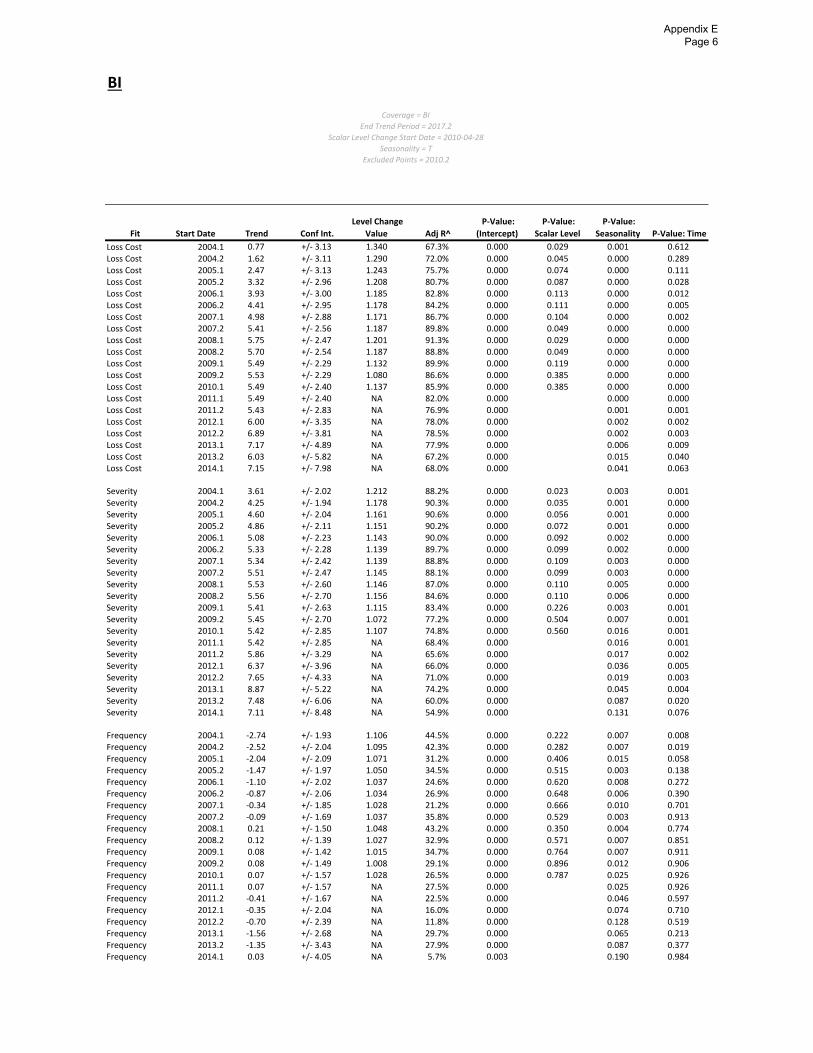
BI
Fit Start Date Trend Conf Int.
Level Change
Value Adj R^
P‐Value:
(Intercept)
P‐Value:
Scalar Level
P‐Value:
Seasonality P‐Value: Time
Loss Cost 2004.1 0.77 +/‐ 3.13 1.340 67.3% 0.000 0.029 0.001 0.612
Loss Cost 2004.2 1.62 +/‐ 3.11 1.290 72.0% 0.000 0.045 0.000 0.289Loss Cost 2005.1 2.47 +/‐ 3.13 1.243 75.7% 0.000 0.074 0.000 0.111Loss Cost 2005.2 3.32 +/‐ 2.96 1.208 80.7% 0.000 0.087 0.000 0.028Loss Cost 2006.1 3.93 +/‐ 3.00 1.185 82.8% 0.000 0.113 0.000 0.012Loss Cost 2006.2 4.41 +/‐ 2.95 1.178 84.2% 0.000 0.111 0.000 0.005Loss Cost 2007.1 4.98 +/‐ 2.88 1.171 86.7% 0.000 0.104 0.000 0.002Loss Cost 2007.2 5.41 +/‐ 2.56 1.187 89.8% 0.000 0.049 0.000 0.000Loss Cost 2008.1 5.75 +/‐ 2.47 1.201 91.3% 0.000 0.029 0.000 0.000Loss Cost 2008.2 5.70 +/‐ 2.54 1.187 88.8% 0.000 0.049 0.000 0.000Loss Cost 2009.1 5.49 +/‐ 2.29 1.132 89.9% 0.000 0.119 0.000 0.000Loss Cost 2009.2 5.53 +/‐ 2.29 1.080 86.6% 0.000 0.385 0.000 0.000Loss Cost 2010.1 5.49 +/‐ 2.40 1.137 85.9% 0.000 0.385 0.000 0.000Loss Cost 2011.1 5.49 +/‐ 2.40 NA 82.0% 0.000 0.000 0.000Loss Cost 2011.2 5.43 +/‐ 2.83 NA 76.9% 0.000 0.001 0.001Loss Cost 2012.1 6.00 +/‐ 3.35 NA 78.0% 0.000 0.002 0.002Loss Cost 2012.2 6.89 +/‐ 3.81 NA 78.5% 0.000 0.002 0.003Loss Cost 2013.1 7.17 +/‐ 4.89 NA 77.9% 0.000 0.006 0.009Loss Cost 2013.2 6.03 +/‐ 5.82 NA 67.2% 0.000 0.015 0.040Loss Cost 2014.1 7.15 +/‐ 7.98 NA 68.0% 0.000 0.041 0.063
Severity 2004.1 3.61 +/‐ 2.02 1.212 88.2% 0.000 0.023 0.003 0.001Severity 2004.2 4.25 +/‐ 1.94 1.178 90.3% 0.000 0.035 0.001 0.000Severity 2005.1 4.60 +/‐ 2.04 1.161 90.6% 0.000 0.056 0.001 0.000Severity 2005.2 4.86 +/‐ 2.11 1.151 90.2% 0.000 0.072 0.001 0.000Severity 2006.1 5.08 +/‐ 2.23 1.143 90.0% 0.000 0.092 0.002 0.000Severity 2006.2 5.33 +/‐ 2.28 1.139 89.7% 0.000 0.099 0.002 0.000Severity 2007.1 5.34 +/‐ 2.42 1.139 88.8% 0.000 0.109 0.003 0.000Severity 2007.2 5.51 +/‐ 2.47 1.145 88.1% 0.000 0.099 0.003 0.000Severity 2008.1 5.53 +/‐ 2.60 1.146 87.0% 0.000 0.110 0.005 0.000Severity 2008.2 5.56 +/‐ 2.70 1.156 84.6% 0.000 0.110 0.006 0.000Severity 2009.1 5.41 +/‐ 2.63 1.115 83.4% 0.000 0.226 0.003 0.001Severity 2009.2 5.45 +/‐ 2.70 1.072 77.2% 0.000 0.504 0.007 0.001Severity 2010.1 5.42 +/‐ 2.85 1.107 74.8% 0.000 0.560 0.016 0.001Severity 2011.1 5.42 +/‐ 2.85 NA 68.4% 0.000 0.016 0.001Severity 2011.2 5.86 +/‐ 3.29 NA 65.6% 0.000 0.017 0.002Severity 2012.1 6.37 +/‐ 3.96 NA 66.0% 0.000 0.036 0.005Severity 2012.2 7.65 +/‐ 4.33 NA 71.0% 0.000 0.019 0.003Severity 2013.1 8.87 +/‐ 5.22 NA 74.2% 0.000 0.045 0.004Severity 2013.2 7.48 +/‐ 6.06 NA 60.0% 0.000 0.087 0.020Severity 2014.1 7.11 +/‐ 8.48 NA 54.9% 0.000 0.131 0.076
Frequency 2004.1 ‐2.74 +/‐ 1.93 1.106 44.5% 0.000 0.222 0.007 0.008Frequency 2004.2 ‐2.52 +/‐ 2.04 1.095 42.3% 0.000 0.282 0.007 0.019Frequency 2005.1 ‐2.04 +/‐ 2.09 1.071 31.2% 0.000 0.406 0.015 0.058Frequency 2005.2 ‐1.47 +/‐ 1.97 1.050 34.5% 0.000 0.515 0.003 0.138Frequency 2006.1 ‐1.10 +/‐ 2.02 1.037 24.6% 0.000 0.620 0.008 0.272Frequency 2006.2 ‐0.87 +/‐ 2.06 1.034 26.9% 0.000 0.648 0.006 0.390Frequency 2007.1 ‐0.34 +/‐ 1.85 1.028 21.2% 0.000 0.666 0.010 0.701Frequency 2007.2 ‐0.09 +/‐ 1.69 1.037 35.8% 0.000 0.529 0.003 0.913Frequency 2008.1 0.21 +/‐ 1.50 1.048 43.2% 0.000 0.350 0.004 0.774Frequency 2008.2 0.12 +/‐ 1.39 1.027 32.9% 0.000 0.571 0.007 0.851Frequency 2009.1 0.08 +/‐ 1.42 1.015 34.7% 0.000 0.764 0.007 0.911Frequency 2009.2 0.08 +/‐ 1.49 1.008 29.1% 0.000 0.896 0.012 0.906Frequency 2010.1 0.07 +/‐ 1.57 1.028 26.5% 0.000 0.787 0.025 0.926Frequency 2011.1 0.07 +/‐ 1.57 NA 27.5% 0.000 0.025 0.926Frequency 2011.2 ‐0.41 +/‐ 1.67 NA 22.5% 0.000 0.046 0.597Frequency 2012.1 ‐0.35 +/‐ 2.04 NA 16.0% 0.000 0.074 0.710Frequency 2012.2 ‐0.70 +/‐ 2.39 NA 11.8% 0.000 0.128 0.519Frequency 2013.1 ‐1.56 +/‐ 2.68 NA 29.7% 0.000 0.065 0.213Frequency 2013.2 ‐1.35 +/‐ 3.43 NA 27.9% 0.000 0.087 0.377Frequency 2014.1 0.03 +/‐ 4.05 NA 5.7% 0.003 0.190 0.984
Coverage = BI
End Trend Period = 2017.2
Scalar Level Change Start Date = 2010‐04‐28
Seasonality = T
Excluded Points = 2010.2
Appendix E Page 6
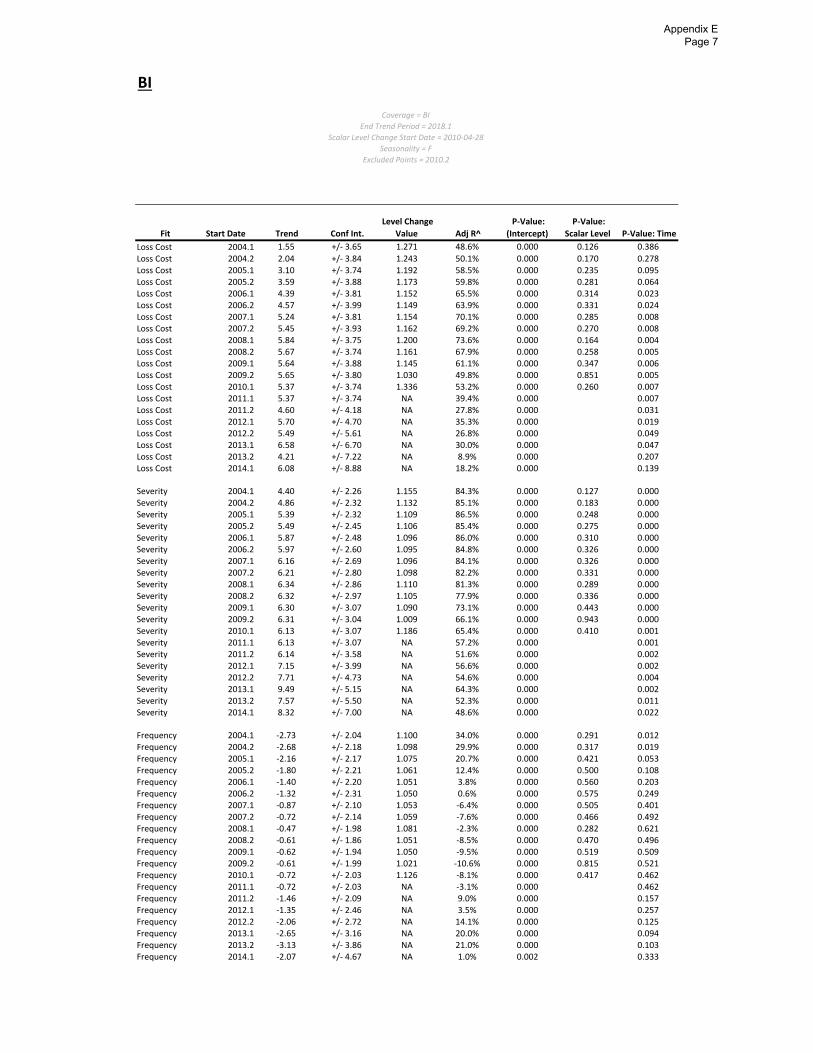
BI
Fit Start Date Trend Conf Int.
Level Change
Value Adj R^
P‐Value:
(Intercept)
P‐Value:
Scalar Level P‐Value: Time
Loss Cost 2004.1 1.55 +/‐ 3.65 1.271 48.6% 0.000 0.126 0.386
Loss Cost 2004.2 2.04 +/‐ 3.84 1.243 50.1% 0.000 0.170 0.278Loss Cost 2005.1 3.10 +/‐ 3.74 1.192 58.5% 0.000 0.235 0.095Loss Cost 2005.2 3.59 +/‐ 3.88 1.173 59.8% 0.000 0.281 0.064Loss Cost 2006.1 4.39 +/‐ 3.81 1.152 65.5% 0.000 0.314 0.023Loss Cost 2006.2 4.57 +/‐ 3.99 1.149 63.9% 0.000 0.331 0.024Loss Cost 2007.1 5.24 +/‐ 3.81 1.154 70.1% 0.000 0.285 0.008Loss Cost 2007.2 5.45 +/‐ 3.93 1.162 69.2% 0.000 0.270 0.008Loss Cost 2008.1 5.84 +/‐ 3.75 1.200 73.6% 0.000 0.164 0.004Loss Cost 2008.2 5.67 +/‐ 3.74 1.161 67.9% 0.000 0.258 0.005Loss Cost 2009.1 5.64 +/‐ 3.88 1.145 61.1% 0.000 0.347 0.006Loss Cost 2009.2 5.65 +/‐ 3.80 1.030 49.8% 0.000 0.851 0.005Loss Cost 2010.1 5.37 +/‐ 3.74 1.336 53.2% 0.000 0.260 0.007Loss Cost 2011.1 5.37 +/‐ 3.74 NA 39.4% 0.000 0.007Loss Cost 2011.2 4.60 +/‐ 4.18 NA 27.8% 0.000 0.031Loss Cost 2012.1 5.70 +/‐ 4.70 NA 35.3% 0.000 0.019Loss Cost 2012.2 5.49 +/‐ 5.61 NA 26.8% 0.000 0.049Loss Cost 2013.1 6.58 +/‐ 6.70 NA 30.0% 0.000 0.047Loss Cost 2013.2 4.21 +/‐ 7.22 NA 8.9% 0.000 0.207Loss Cost 2014.1 6.08 +/‐ 8.88 NA 18.2% 0.000 0.139
Severity 2004.1 4.40 +/‐ 2.26 1.155 84.3% 0.000 0.127 0.000Severity 2004.2 4.86 +/‐ 2.32 1.132 85.1% 0.000 0.183 0.000Severity 2005.1 5.39 +/‐ 2.32 1.109 86.5% 0.000 0.248 0.000Severity 2005.2 5.49 +/‐ 2.45 1.106 85.4% 0.000 0.275 0.000Severity 2006.1 5.87 +/‐ 2.48 1.096 86.0% 0.000 0.310 0.000Severity 2006.2 5.97 +/‐ 2.60 1.095 84.8% 0.000 0.326 0.000Severity 2007.1 6.16 +/‐ 2.69 1.096 84.1% 0.000 0.326 0.000Severity 2007.2 6.21 +/‐ 2.80 1.098 82.2% 0.000 0.331 0.000Severity 2008.1 6.34 +/‐ 2.86 1.110 81.3% 0.000 0.289 0.000Severity 2008.2 6.32 +/‐ 2.97 1.105 77.9% 0.000 0.336 0.000Severity 2009.1 6.30 +/‐ 3.07 1.090 73.1% 0.000 0.443 0.000Severity 2009.2 6.31 +/‐ 3.04 1.009 66.1% 0.000 0.943 0.000Severity 2010.1 6.13 +/‐ 3.07 1.186 65.4% 0.000 0.410 0.001Severity 2011.1 6.13 +/‐ 3.07 NA 57.2% 0.000 0.001Severity 2011.2 6.14 +/‐ 3.58 NA 51.6% 0.000 0.002Severity 2012.1 7.15 +/‐ 3.99 NA 56.6% 0.000 0.002Severity 2012.2 7.71 +/‐ 4.73 NA 54.6% 0.000 0.004Severity 2013.1 9.49 +/‐ 5.15 NA 64.3% 0.000 0.002Severity 2013.2 7.57 +/‐ 5.50 NA 52.3% 0.000 0.011Severity 2014.1 8.32 +/‐ 7.00 NA 48.6% 0.000 0.022
Frequency 2004.1 ‐2.73 +/‐ 2.04 1.100 34.0% 0.000 0.291 0.012Frequency 2004.2 ‐2.68 +/‐ 2.18 1.098 29.9% 0.000 0.317 0.019Frequency 2005.1 ‐2.16 +/‐ 2.17 1.075 20.7% 0.000 0.421 0.053Frequency 2005.2 ‐1.80 +/‐ 2.21 1.061 12.4% 0.000 0.500 0.108Frequency 2006.1 ‐1.40 +/‐ 2.20 1.051 3.8% 0.000 0.560 0.203Frequency 2006.2 ‐1.32 +/‐ 2.31 1.050 0.6% 0.000 0.575 0.249Frequency 2007.1 ‐0.87 +/‐ 2.10 1.053 ‐6.4% 0.000 0.505 0.401Frequency 2007.2 ‐0.72 +/‐ 2.14 1.059 ‐7.6% 0.000 0.466 0.492Frequency 2008.1 ‐0.47 +/‐ 1.98 1.081 ‐2.3% 0.000 0.282 0.621Frequency 2008.2 ‐0.61 +/‐ 1.86 1.051 ‐8.5% 0.000 0.470 0.496Frequency 2009.1 ‐0.62 +/‐ 1.94 1.050 ‐9.5% 0.000 0.519 0.509Frequency 2009.2 ‐0.61 +/‐ 1.99 1.021 ‐10.6% 0.000 0.815 0.521Frequency 2010.1 ‐0.72 +/‐ 2.03 1.126 ‐8.1% 0.000 0.417 0.462Frequency 2011.1 ‐0.72 +/‐ 2.03 NA ‐3.1% 0.000 0.462Frequency 2011.2 ‐1.46 +/‐ 2.09 NA 9.0% 0.000 0.157Frequency 2012.1 ‐1.35 +/‐ 2.46 NA 3.5% 0.000 0.257Frequency 2012.2 ‐2.06 +/‐ 2.72 NA 14.1% 0.000 0.125Frequency 2013.1 ‐2.65 +/‐ 3.16 NA 20.0% 0.000 0.094Frequency 2013.2 ‐3.13 +/‐ 3.86 NA 21.0% 0.000 0.103Frequency 2014.1 ‐2.07 +/‐ 4.67 NA 1.0% 0.002 0.333
Coverage = BI
End Trend Period = 2018.1
Scalar Level Change Start Date = 2010‐04‐28
Seasonality = F
Excluded Points = 2010.2
Appendix E Page 7
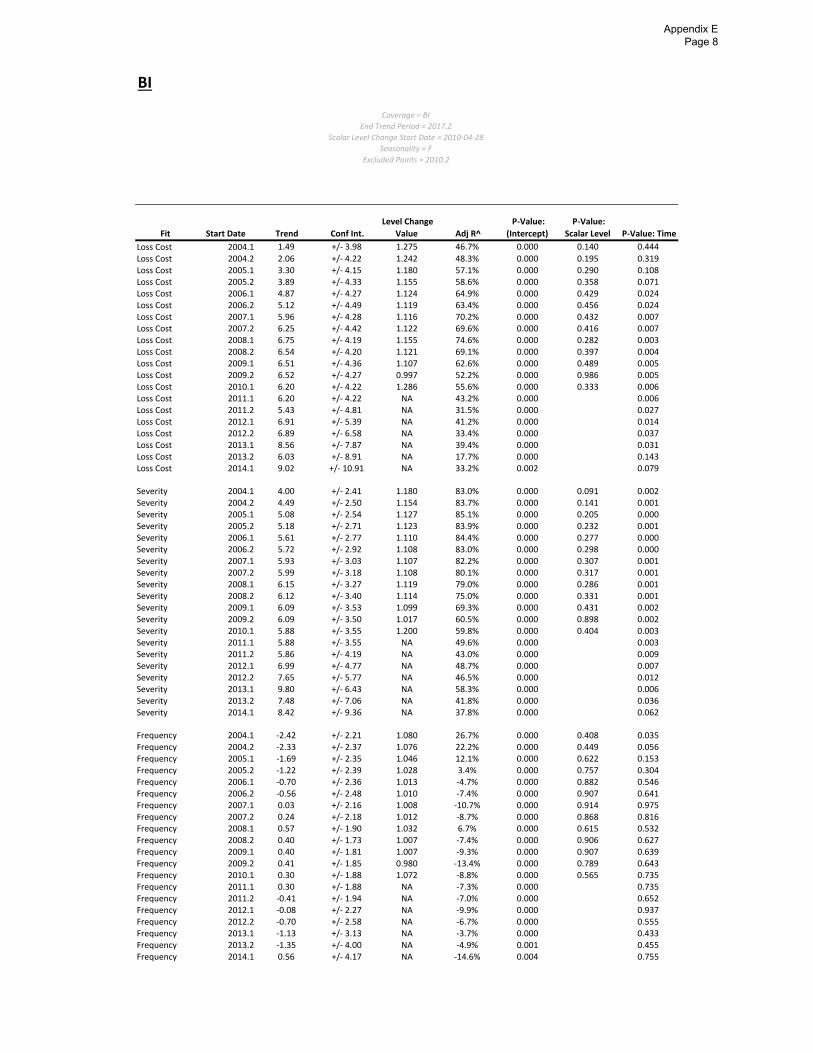
BI
Fit Start Date Trend Conf Int.
Level Change
Value Adj R^
P‐Value:
(Intercept)
P‐Value:
Scalar Level P‐Value: Time
Loss Cost 2004.1 1.49 +/‐ 3.98 1.275 46.7% 0.000 0.140 0.444
Loss Cost 2004.2 2.06 +/‐ 4.22 1.242 48.3% 0.000 0.195 0.319Loss Cost 2005.1 3.30 +/‐ 4.15 1.180 57.1% 0.000 0.290 0.108Loss Cost 2005.2 3.89 +/‐ 4.33 1.155 58.6% 0.000 0.358 0.071Loss Cost 2006.1 4.87 +/‐ 4.27 1.124 64.9% 0.000 0.429 0.024Loss Cost 2006.2 5.12 +/‐ 4.49 1.119 63.4% 0.000 0.456 0.024Loss Cost 2007.1 5.96 +/‐ 4.28 1.116 70.2% 0.000 0.432 0.007Loss Cost 2007.2 6.25 +/‐ 4.42 1.122 69.6% 0.000 0.416 0.007Loss Cost 2008.1 6.75 +/‐ 4.19 1.155 74.6% 0.000 0.282 0.003Loss Cost 2008.2 6.54 +/‐ 4.20 1.121 69.1% 0.000 0.397 0.004Loss Cost 2009.1 6.51 +/‐ 4.36 1.107 62.6% 0.000 0.489 0.005Loss Cost 2009.2 6.52 +/‐ 4.27 0.997 52.2% 0.000 0.986 0.005Loss Cost 2010.1 6.20 +/‐ 4.22 1.286 55.6% 0.000 0.333 0.006Loss Cost 2011.1 6.20 +/‐ 4.22 NA 43.2% 0.000 0.006Loss Cost 2011.2 5.43 +/‐ 4.81 NA 31.5% 0.000 0.027Loss Cost 2012.1 6.91 +/‐ 5.39 NA 41.2% 0.000 0.014Loss Cost 2012.2 6.89 +/‐ 6.58 NA 33.4% 0.000 0.037Loss Cost 2013.1 8.56 +/‐ 7.87 NA 39.4% 0.000 0.031Loss Cost 2013.2 6.03 +/‐ 8.91 NA 17.7% 0.000 0.143Loss Cost 2014.1 9.02 +/‐ 10.91 NA 33.2% 0.002 0.079
Severity 2004.1 4.00 +/‐ 2.41 1.180 83.0% 0.000 0.091 0.002Severity 2004.2 4.49 +/‐ 2.50 1.154 83.7% 0.000 0.141 0.001Severity 2005.1 5.08 +/‐ 2.54 1.127 85.1% 0.000 0.205 0.000Severity 2005.2 5.18 +/‐ 2.71 1.123 83.9% 0.000 0.232 0.001Severity 2006.1 5.61 +/‐ 2.77 1.110 84.4% 0.000 0.277 0.000Severity 2006.2 5.72 +/‐ 2.92 1.108 83.0% 0.000 0.298 0.000Severity 2007.1 5.93 +/‐ 3.03 1.107 82.2% 0.000 0.307 0.001Severity 2007.2 5.99 +/‐ 3.18 1.108 80.1% 0.000 0.317 0.001Severity 2008.1 6.15 +/‐ 3.27 1.119 79.0% 0.000 0.286 0.001Severity 2008.2 6.12 +/‐ 3.40 1.114 75.0% 0.000 0.331 0.001Severity 2009.1 6.09 +/‐ 3.53 1.099 69.3% 0.000 0.431 0.002Severity 2009.2 6.09 +/‐ 3.50 1.017 60.5% 0.000 0.898 0.002Severity 2010.1 5.88 +/‐ 3.55 1.200 59.8% 0.000 0.404 0.003Severity 2011.1 5.88 +/‐ 3.55 NA 49.6% 0.000 0.003Severity 2011.2 5.86 +/‐ 4.19 NA 43.0% 0.000 0.009Severity 2012.1 6.99 +/‐ 4.77 NA 48.7% 0.000 0.007Severity 2012.2 7.65 +/‐ 5.77 NA 46.5% 0.000 0.012Severity 2013.1 9.80 +/‐ 6.43 NA 58.3% 0.000 0.006Severity 2013.2 7.48 +/‐ 7.06 NA 41.8% 0.000 0.036Severity 2014.1 8.42 +/‐ 9.36 NA 37.8% 0.000 0.062
Frequency 2004.1 ‐2.42 +/‐ 2.21 1.080 26.7% 0.000 0.408 0.035Frequency 2004.2 ‐2.33 +/‐ 2.37 1.076 22.2% 0.000 0.449 0.056Frequency 2005.1 ‐1.69 +/‐ 2.35 1.046 12.1% 0.000 0.622 0.153Frequency 2005.2 ‐1.22 +/‐ 2.39 1.028 3.4% 0.000 0.757 0.304Frequency 2006.1 ‐0.70 +/‐ 2.36 1.013 ‐4.7% 0.000 0.882 0.546Frequency 2006.2 ‐0.56 +/‐ 2.48 1.010 ‐7.4% 0.000 0.907 0.641Frequency 2007.1 0.03 +/‐ 2.16 1.008 ‐10.7% 0.000 0.914 0.975Frequency 2007.2 0.24 +/‐ 2.18 1.012 ‐8.7% 0.000 0.868 0.816Frequency 2008.1 0.57 +/‐ 1.90 1.032 6.7% 0.000 0.615 0.532Frequency 2008.2 0.40 +/‐ 1.73 1.007 ‐7.4% 0.000 0.906 0.627Frequency 2009.1 0.40 +/‐ 1.81 1.007 ‐9.3% 0.000 0.907 0.639Frequency 2009.2 0.41 +/‐ 1.85 0.980 ‐13.4% 0.000 0.789 0.643Frequency 2010.1 0.30 +/‐ 1.88 1.072 ‐8.8% 0.000 0.565 0.735Frequency 2011.1 0.30 +/‐ 1.88 NA ‐7.3% 0.000 0.735Frequency 2011.2 ‐0.41 +/‐ 1.94 NA ‐7.0% 0.000 0.652Frequency 2012.1 ‐0.08 +/‐ 2.27 NA ‐9.9% 0.000 0.937Frequency 2012.2 ‐0.70 +/‐ 2.58 NA ‐6.7% 0.000 0.555Frequency 2013.1 ‐1.13 +/‐ 3.13 NA ‐3.7% 0.000 0.433Frequency 2013.2 ‐1.35 +/‐ 4.00 NA ‐4.9% 0.001 0.455Frequency 2014.1 0.56 +/‐ 4.17 NA ‐14.6% 0.004 0.755
Coverage = BI
End Trend Period = 2017.2
Scalar Level Change Start Date = 2010‐04‐28
Seasonality = F
Excluded Points = 2010.2
Appendix E Page 8
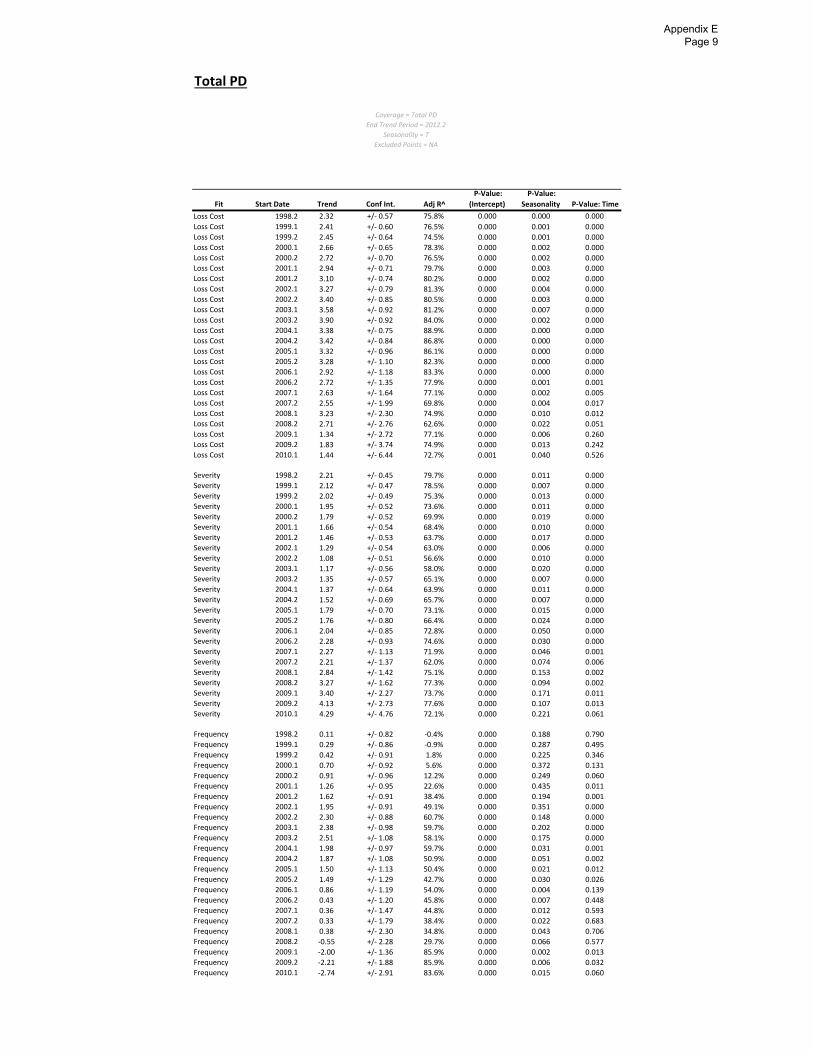
Total PD
Fit Start Date Trend Conf Int. Adj R^
P‐Value:
(Intercept)
P‐Value:
Seasonality P‐Value: Time
Loss Cost 1998.2 2.32 +/‐ 0.57 75.8% 0.000 0.000 0.000
Loss Cost 1999.1 2.41 +/‐ 0.60 76.5% 0.000 0.001 0.000
Loss Cost 1999.2 2.45 +/‐ 0.64 74.5% 0.000 0.001 0.000
Loss Cost 2000.1 2.66 +/‐ 0.65 78.3% 0.000 0.002 0.000
Loss Cost 2000.2 2.72 +/‐ 0.70 76.5% 0.000 0.002 0.000
Loss Cost 2001.1 2.94 +/‐ 0.71 79.7% 0.000 0.003 0.000
Loss Cost 2001.2 3.10 +/‐ 0.74 80.2% 0.000 0.002 0.000
Loss Cost 2002.1 3.27 +/‐ 0.79 81.3% 0.000 0.004 0.000
Loss Cost 2002.2 3.40 +/‐ 0.85 80.5% 0.000 0.003 0.000
Loss Cost 2003.1 3.58 +/‐ 0.92 81.2% 0.000 0.007 0.000
Loss Cost 2003.2 3.90 +/‐ 0.92 84.0% 0.000 0.002 0.000
Loss Cost 2004.1 3.38 +/‐ 0.75 88.9% 0.000 0.000 0.000
Loss Cost 2004.2 3.42 +/‐ 0.84 86.8% 0.000 0.000 0.000
Loss Cost 2005.1 3.32 +/‐ 0.96 86.1% 0.000 0.000 0.000
Loss Cost 2005.2 3.28 +/‐ 1.10 82.3% 0.000 0.000 0.000
Loss Cost 2006.1 2.92 +/‐ 1.18 83.3% 0.000 0.000 0.000
Loss Cost 2006.2 2.72 +/‐ 1.35 77.9% 0.000 0.001 0.001
Loss Cost 2007.1 2.63 +/‐ 1.64 77.1% 0.000 0.002 0.005
Loss Cost 2007.2 2.55 +/‐ 1.99 69.8% 0.000 0.004 0.017
Loss Cost 2008.1 3.23 +/‐ 2.30 74.9% 0.000 0.010 0.012
Loss Cost 2008.2 2.71 +/‐ 2.76 62.6% 0.000 0.022 0.051
Loss Cost 2009.1 1.34 +/‐ 2.72 77.1% 0.000 0.006 0.260
Loss Cost 2009.2 1.83 +/‐ 3.74 74.9% 0.000 0.013 0.242
Loss Cost 2010.1 1.44 +/‐ 6.44 72.7% 0.001 0.040 0.526
Severity 1998.2 2.21 +/‐ 0.45 79.7% 0.000 0.011 0.000
Severity 1999.1 2.12 +/‐ 0.47 78.5% 0.000 0.007 0.000
Severity 1999.2 2.02 +/‐ 0.49 75.3% 0.000 0.013 0.000
Severity 2000.1 1.95 +/‐ 0.52 73.6% 0.000 0.011 0.000
Severity 2000.2 1.79 +/‐ 0.52 69.9% 0.000 0.019 0.000
Severity 2001.1 1.66 +/‐ 0.54 68.4% 0.000 0.010 0.000
Severity 2001.2 1.46 +/‐ 0.53 63.7% 0.000 0.017 0.000
Severity 2002.1 1.29 +/‐ 0.54 63.0% 0.000 0.006 0.000
Severity 2002.2 1.08 +/‐ 0.51 56.6% 0.000 0.010 0.000
Severity 2003.1 1.17 +/‐ 0.56 58.0% 0.000 0.020 0.000
Severity 2003.2 1.35 +/‐ 0.57 65.1% 0.000 0.007 0.000
Severity 2004.1 1.37 +/‐ 0.64 63.9% 0.000 0.011 0.000
Severity 2004.2 1.52 +/‐ 0.69 65.7% 0.000 0.007 0.000
Severity 2005.1 1.79 +/‐ 0.70 73.1% 0.000 0.015 0.000
Severity 2005.2 1.76 +/‐ 0.80 66.4% 0.000 0.024 0.000
Severity 2006.1 2.04 +/‐ 0.85 72.8% 0.000 0.050 0.000
Severity 2006.2 2.28 +/‐ 0.93 74.6% 0.000 0.030 0.000
Severity 2007.1 2.27 +/‐ 1.13 71.9% 0.000 0.046 0.001
Severity 2007.2 2.21 +/‐ 1.37 62.0% 0.000 0.074 0.006
Severity 2008.1 2.84 +/‐ 1.42 75.1% 0.000 0.153 0.002
Severity 2008.2 3.27 +/‐ 1.62 77.3% 0.000 0.094 0.002
Severity 2009.1 3.40 +/‐ 2.27 73.7% 0.000 0.171 0.011
Severity 2009.2 4.13 +/‐ 2.73 77.6% 0.000 0.107 0.013
Severity 2010.1 4.29 +/‐ 4.76 72.1% 0.000 0.221 0.061
Frequency 1998.2 0.11 +/‐ 0.82 ‐0.4% 0.000 0.188 0.790
Frequency 1999.1 0.29 +/‐ 0.86 ‐0.9% 0.000 0.287 0.495
Frequency 1999.2 0.42 +/‐ 0.91 1.8% 0.000 0.225 0.346
Frequency 2000.1 0.70 +/‐ 0.92 5.6% 0.000 0.372 0.131
Frequency 2000.2 0.91 +/‐ 0.96 12.2% 0.000 0.249 0.060
Frequency 2001.1 1.26 +/‐ 0.95 22.6% 0.000 0.435 0.011
Frequency 2001.2 1.62 +/‐ 0.91 38.4% 0.000 0.194 0.001
Frequency 2002.1 1.95 +/‐ 0.91 49.1% 0.000 0.351 0.000
Frequency 2002.2 2.30 +/‐ 0.88 60.7% 0.000 0.148 0.000
Frequency 2003.1 2.38 +/‐ 0.98 59.7% 0.000 0.202 0.000
Frequency 2003.2 2.51 +/‐ 1.08 58.1% 0.000 0.175 0.000
Frequency 2004.1 1.98 +/‐ 0.97 59.7% 0.000 0.031 0.001
Frequency 2004.2 1.87 +/‐ 1.08 50.9% 0.000 0.051 0.002
Frequency 2005.1 1.50 +/‐ 1.13 50.4% 0.000 0.021 0.012
Frequency 2005.2 1.49 +/‐ 1.29 42.7% 0.000 0.030 0.026
Frequency 2006.1 0.86 +/‐ 1.19 54.0% 0.000 0.004 0.139
Frequency 2006.2 0.43 +/‐ 1.20 45.8% 0.000 0.007 0.448
Frequency 2007.1 0.36 +/‐ 1.47 44.8% 0.000 0.012 0.593
Frequency 2007.2 0.33 +/‐ 1.79 38.4% 0.000 0.022 0.683
Frequency 2008.1 0.38 +/‐ 2.30 34.8% 0.000 0.043 0.706
Frequency 2008.2 ‐0.55 +/‐ 2.28 29.7% 0.000 0.066 0.577
Frequency 2009.1 ‐2.00 +/‐ 1.36 85.9% 0.000 0.002 0.013
Frequency 2009.2 ‐2.21 +/‐ 1.88 85.9% 0.000 0.006 0.032
Frequency 2010.1 ‐2.74 +/‐ 2.91 83.6% 0.000 0.015 0.060
Coverage = Total PD
End Trend Period = 2012.2
Seasonality = T
Excluded Points = NA
Appendix E Page 9
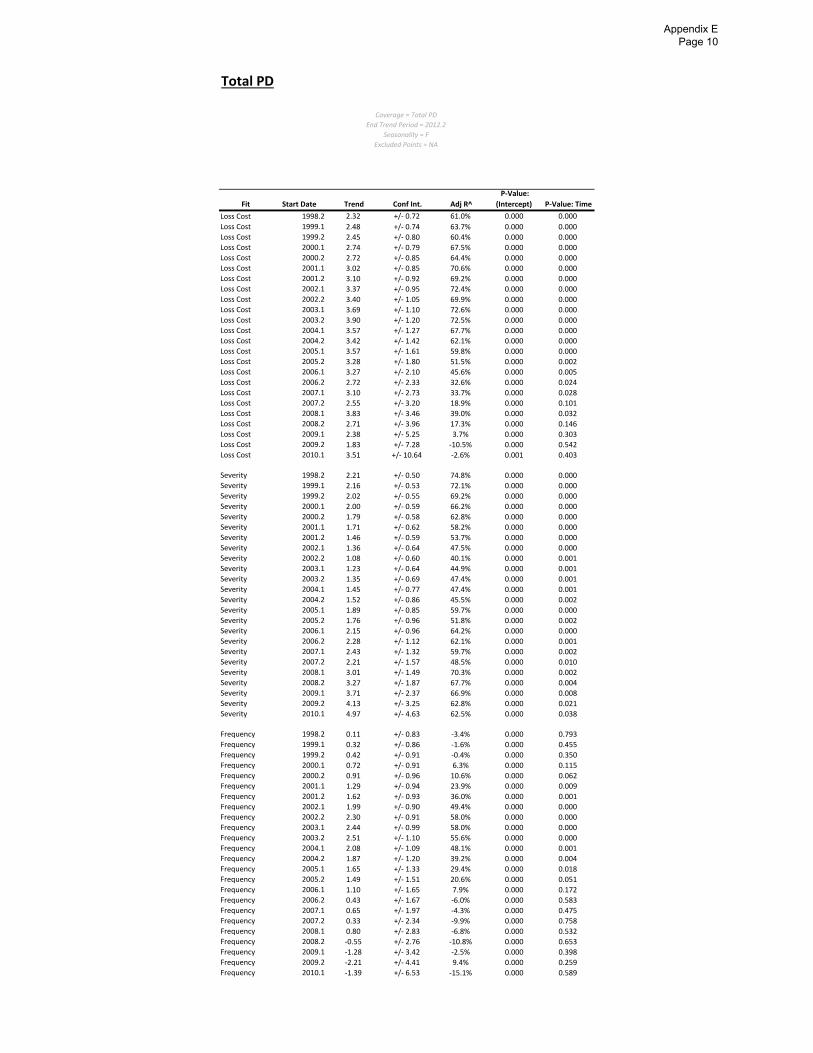
Total PD
Fit Start Date Trend Conf Int. Adj R^
P‐Value:
(Intercept) P‐Value: Time
Loss Cost 1998.2 2.32 +/‐ 0.72 61.0% 0.000 0.000
Loss Cost 1999.1 2.48 +/‐ 0.74 63.7% 0.000 0.000
Loss Cost 1999.2 2.45 +/‐ 0.80 60.4% 0.000 0.000
Loss Cost 2000.1 2.74 +/‐ 0.79 67.5% 0.000 0.000
Loss Cost 2000.2 2.72 +/‐ 0.85 64.4% 0.000 0.000
Loss Cost 2001.1 3.02 +/‐ 0.85 70.6% 0.000 0.000
Loss Cost 2001.2 3.10 +/‐ 0.92 69.2% 0.000 0.000
Loss Cost 2002.1 3.37 +/‐ 0.95 72.4% 0.000 0.000
Loss Cost 2002.2 3.40 +/‐ 1.05 69.9% 0.000 0.000
Loss Cost 2003.1 3.69 +/‐ 1.10 72.6% 0.000 0.000
Loss Cost 2003.2 3.90 +/‐ 1.20 72.5% 0.000 0.000
Loss Cost 2004.1 3.57 +/‐ 1.27 67.7% 0.000 0.000
Loss Cost 2004.2 3.42 +/‐ 1.42 62.1% 0.000 0.000
Loss Cost 2005.1 3.57 +/‐ 1.61 59.8% 0.000 0.000
Loss Cost 2005.2 3.28 +/‐ 1.80 51.5% 0.000 0.002
Loss Cost 2006.1 3.27 +/‐ 2.10 45.6% 0.000 0.005
Loss Cost 2006.2 2.72 +/‐ 2.33 32.6% 0.000 0.024
Loss Cost 2007.1 3.10 +/‐ 2.73 33.7% 0.000 0.028
Loss Cost 2007.2 2.55 +/‐ 3.20 18.9% 0.000 0.101
Loss Cost 2008.1 3.83 +/‐ 3.46 39.0% 0.000 0.032
Loss Cost 2008.2 2.71 +/‐ 3.96 17.3% 0.000 0.146
Loss Cost 2009.1 2.38 +/‐ 5.25 3.7% 0.000 0.303
Loss Cost 2009.2 1.83 +/‐ 7.28 ‐10.5% 0.000 0.542
Loss Cost 2010.1 3.51 +/‐ 10.64 ‐2.6% 0.001 0.403
Severity 1998.2 2.21 +/‐ 0.50 74.8% 0.000 0.000
Severity 1999.1 2.16 +/‐ 0.53 72.1% 0.000 0.000
Severity 1999.2 2.02 +/‐ 0.55 69.2% 0.000 0.000
Severity 2000.1 2.00 +/‐ 0.59 66.2% 0.000 0.000
Severity 2000.2 1.79 +/‐ 0.58 62.8% 0.000 0.000
Severity 2001.1 1.71 +/‐ 0.62 58.2% 0.000 0.000
Severity 2001.2 1.46 +/‐ 0.59 53.7% 0.000 0.000
Severity 2002.1 1.36 +/‐ 0.64 47.5% 0.000 0.000
Severity 2002.2 1.08 +/‐ 0.60 40.1% 0.000 0.001
Severity 2003.1 1.23 +/‐ 0.64 44.9% 0.000 0.001
Severity 2003.2 1.35 +/‐ 0.69 47.4% 0.000 0.001
Severity 2004.1 1.45 +/‐ 0.77 47.4% 0.000 0.001
Severity 2004.2 1.52 +/‐ 0.86 45.5% 0.000 0.002
Severity 2005.1 1.89 +/‐ 0.85 59.7% 0.000 0.000
Severity 2005.2 1.76 +/‐ 0.96 51.8% 0.000 0.002
Severity 2006.1 2.15 +/‐ 0.96 64.2% 0.000 0.000
Severity 2006.2 2.28 +/‐ 1.12 62.1% 0.000 0.001
Severity 2007.1 2.43 +/‐ 1.32 59.7% 0.000 0.002
Severity 2007.2 2.21 +/‐ 1.57 48.5% 0.000 0.010
Severity 2008.1 3.01 +/‐ 1.49 70.3% 0.000 0.002
Severity 2008.2 3.27 +/‐ 1.87 67.7% 0.000 0.004
Severity 2009.1 3.71 +/‐ 2.37 66.9% 0.000 0.008
Severity 2009.2 4.13 +/‐ 3.25 62.8% 0.000 0.021
Severity 2010.1 4.97 +/‐ 4.63 62.5% 0.000 0.038
Frequency 1998.2 0.11 +/‐ 0.83 ‐3.4% 0.000 0.793
Frequency 1999.1 0.32 +/‐ 0.86 ‐1.6% 0.000 0.455
Frequency 1999.2 0.42 +/‐ 0.91 ‐0.4% 0.000 0.350
Frequency 2000.1 0.72 +/‐ 0.91 6.3% 0.000 0.115
Frequency 2000.2 0.91 +/‐ 0.96 10.6% 0.000 0.062
Frequency 2001.1 1.29 +/‐ 0.94 23.9% 0.000 0.009
Frequency 2001.2 1.62 +/‐ 0.93 36.0% 0.000 0.001
Frequency 2002.1 1.99 +/‐ 0.90 49.4% 0.000 0.000
Frequency 2002.2 2.30 +/‐ 0.91 58.0% 0.000 0.000
Frequency 2003.1 2.44 +/‐ 0.99 58.0% 0.000 0.000
Frequency 2003.2 2.51 +/‐ 1.10 55.6% 0.000 0.000
Frequency 2004.1 2.08 +/‐ 1.09 48.1% 0.000 0.001
Frequency 2004.2 1.87 +/‐ 1.20 39.2% 0.000 0.004
Frequency 2005.1 1.65 +/‐ 1.33 29.4% 0.000 0.018
Frequency 2005.2 1.49 +/‐ 1.51 20.6% 0.000 0.051
Frequency 2006.1 1.10 +/‐ 1.65 7.9% 0.000 0.172
Frequency 2006.2 0.43 +/‐ 1.67 ‐6.0% 0.000 0.583
Frequency 2007.1 0.65 +/‐ 1.97 ‐4.3% 0.000 0.475
Frequency 2007.2 0.33 +/‐ 2.34 ‐9.9% 0.000 0.758
Frequency 2008.1 0.80 +/‐ 2.83 ‐6.8% 0.000 0.532
Frequency 2008.2 ‐0.55 +/‐ 2.76 ‐10.8% 0.000 0.653
Frequency 2009.1 ‐1.28 +/‐ 3.42 ‐2.5% 0.000 0.398
Frequency 2009.2 ‐2.21 +/‐ 4.41 9.4% 0.000 0.259
Frequency 2010.1 ‐1.39 +/‐ 6.53 ‐15.1% 0.000 0.589
Coverage = Total PD
End Trend Period = 2012.2
Seasonality = F
Excluded Points = NA
Appendix E Page 10
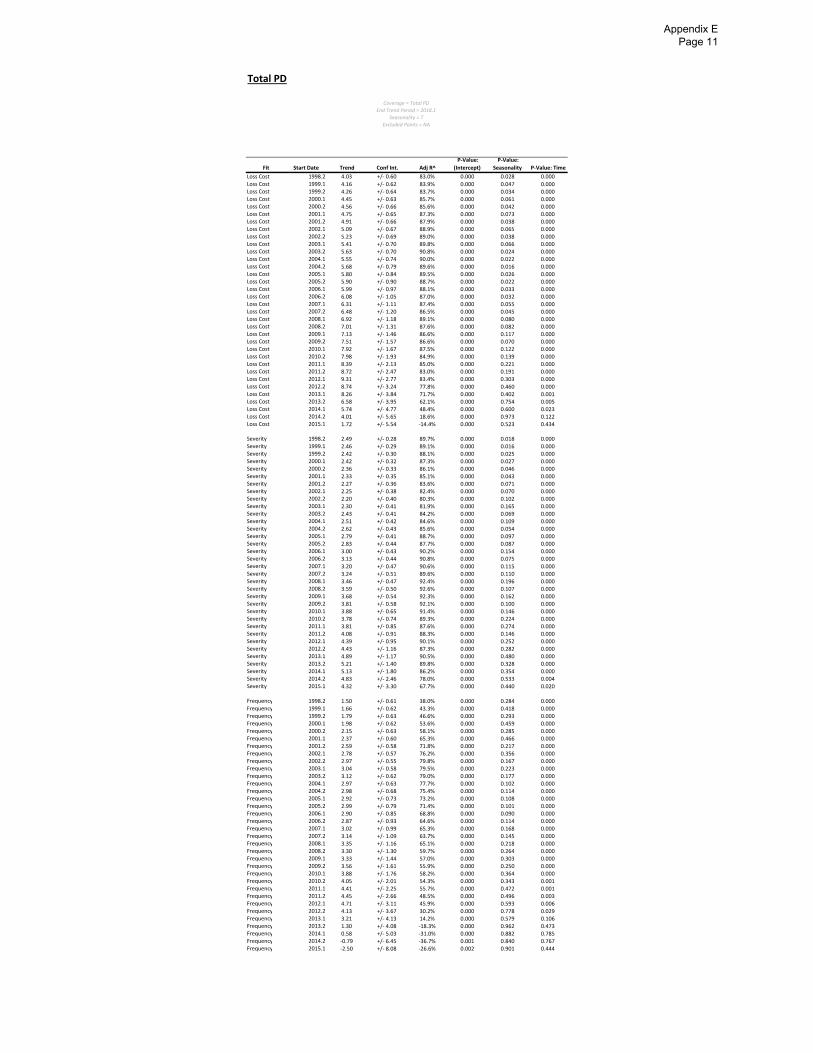
Total PD
Fit Start Date Trend Conf Int. Adj R^
P‐Value:
(Intercept)
P‐Value:
Seasonality P‐Value: Time
Loss Cost 1998.2 4.03 +/‐ 0.60 83.0% 0.000 0.028 0.000Loss Cost 1999.1 4.16 +/‐ 0.62 83.9% 0.000 0.047 0.000Loss Cost 1999.2 4.26 +/‐ 0.64 83.7% 0.000 0.034 0.000Loss Cost 2000.1 4.45 +/‐ 0.63 85.7% 0.000 0.061 0.000Loss Cost 2000.2 4.56 +/‐ 0.66 85.6% 0.000 0.042 0.000Loss Cost 2001.1 4.75 +/‐ 0.65 87.3% 0.000 0.073 0.000Loss Cost 2001.2 4.91 +/‐ 0.66 87.9% 0.000 0.038 0.000Loss Cost 2002.1 5.09 +/‐ 0.67 88.9% 0.000 0.065 0.000Loss Cost 2002.2 5.23 +/‐ 0.69 89.0% 0.000 0.038 0.000Loss Cost 2003.1 5.41 +/‐ 0.70 89.8% 0.000 0.066 0.000Loss Cost 2003.2 5.63 +/‐ 0.70 90.8% 0.000 0.024 0.000Loss Cost 2004.1 5.55 +/‐ 0.74 90.0% 0.000 0.022 0.000Loss Cost 2004.2 5.68 +/‐ 0.79 89.6% 0.000 0.016 0.000Loss Cost 2005.1 5.80 +/‐ 0.84 89.5% 0.000 0.026 0.000Loss Cost 2005.2 5.90 +/‐ 0.90 88.7% 0.000 0.022 0.000Loss Cost 2006.1 5.99 +/‐ 0.97 88.1% 0.000 0.033 0.000Loss Cost 2006.2 6.08 +/‐ 1.05 87.0% 0.000 0.032 0.000Loss Cost 2007.1 6.31 +/‐ 1.11 87.4% 0.000 0.055 0.000Loss Cost 2007.2 6.48 +/‐ 1.20 86.5% 0.000 0.045 0.000Loss Cost 2008.1 6.92 +/‐ 1.18 89.1% 0.000 0.080 0.000Loss Cost 2008.2 7.01 +/‐ 1.31 87.6% 0.000 0.082 0.000Loss Cost 2009.1 7.13 +/‐ 1.46 86.6% 0.000 0.117 0.000Loss Cost 2009.2 7.51 +/‐ 1.57 86.6% 0.000 0.070 0.000Loss Cost 2010.1 7.92 +/‐ 1.67 87.5% 0.000 0.122 0.000Loss Cost 2010.2 7.98 +/‐ 1.93 84.9% 0.000 0.139 0.000Loss Cost 2011.1 8.39 +/‐ 2.13 85.0% 0.000 0.221 0.000Loss Cost 2011.2 8.72 +/‐ 2.47 83.0% 0.000 0.191 0.000Loss Cost 2012.1 9.31 +/‐ 2.77 83.4% 0.000 0.303 0.000Loss Cost 2012.2 8.74 +/‐ 3.24 77.8% 0.000 0.460 0.000Loss Cost 2013.1 8.26 +/‐ 3.84 71.7% 0.000 0.402 0.001Loss Cost 2013.2 6.58 +/‐ 3.95 62.1% 0.000 0.754 0.005Loss Cost 2014.1 5.74 +/‐ 4.77 48.4% 0.000 0.600 0.023Loss Cost 2014.2 4.01 +/‐ 5.65 18.6% 0.000 0.973 0.122Loss Cost 2015.1 1.72 +/‐ 5.54 ‐14.4% 0.000 0.523 0.434
Severity 1998.2 2.49 +/‐ 0.28 89.7% 0.000 0.018 0.000Severity 1999.1 2.46 +/‐ 0.29 89.1% 0.000 0.016 0.000Severity 1999.2 2.42 +/‐ 0.30 88.1% 0.000 0.025 0.000Severity 2000.1 2.42 +/‐ 0.32 87.3% 0.000 0.027 0.000Severity 2000.2 2.36 +/‐ 0.33 86.1% 0.000 0.046 0.000Severity 2001.1 2.33 +/‐ 0.35 85.1% 0.000 0.043 0.000Severity 2001.2 2.27 +/‐ 0.36 83.6% 0.000 0.071 0.000Severity 2002.1 2.25 +/‐ 0.38 82.4% 0.000 0.070 0.000Severity 2002.2 2.20 +/‐ 0.40 80.3% 0.000 0.102 0.000Severity 2003.1 2.30 +/‐ 0.41 81.9% 0.000 0.165 0.000Severity 2003.2 2.43 +/‐ 0.41 84.2% 0.000 0.069 0.000Severity 2004.1 2.51 +/‐ 0.42 84.6% 0.000 0.109 0.000Severity 2004.2 2.62 +/‐ 0.43 85.6% 0.000 0.054 0.000Severity 2005.1 2.79 +/‐ 0.41 88.7% 0.000 0.097 0.000Severity 2005.2 2.83 +/‐ 0.44 87.7% 0.000 0.087 0.000Severity 2006.1 3.00 +/‐ 0.43 90.2% 0.000 0.154 0.000Severity 2006.2 3.13 +/‐ 0.44 90.8% 0.000 0.075 0.000Severity 2007.1 3.20 +/‐ 0.47 90.6% 0.000 0.115 0.000Severity 2007.2 3.24 +/‐ 0.51 89.6% 0.000 0.110 0.000Severity 2008.1 3.46 +/‐ 0.47 92.4% 0.000 0.196 0.000Severity 2008.2 3.59 +/‐ 0.50 92.6% 0.000 0.107 0.000Severity 2009.1 3.68 +/‐ 0.54 92.3% 0.000 0.162 0.000Severity 2009.2 3.81 +/‐ 0.58 92.1% 0.000 0.100 0.000Severity 2010.1 3.88 +/‐ 0.65 91.4% 0.000 0.146 0.000Severity 2010.2 3.78 +/‐ 0.74 89.3% 0.000 0.224 0.000Severity 2011.1 3.81 +/‐ 0.85 87.6% 0.000 0.274 0.000Severity 2011.2 4.08 +/‐ 0.91 88.3% 0.000 0.146 0.000Severity 2012.1 4.39 +/‐ 0.95 90.1% 0.000 0.252 0.000Severity 2012.2 4.43 +/‐ 1.16 87.3% 0.000 0.282 0.000Severity 2013.1 4.89 +/‐ 1.17 90.5% 0.000 0.480 0.000Severity 2013.2 5.21 +/‐ 1.40 89.8% 0.000 0.328 0.000Severity 2014.1 5.13 +/‐ 1.80 86.2% 0.000 0.354 0.000Severity 2014.2 4.83 +/‐ 2.46 78.0% 0.000 0.533 0.004Severity 2015.1 4.32 +/‐ 3.30 67.7% 0.000 0.440 0.020
Frequency 1998.2 1.50 +/‐ 0.61 38.0% 0.000 0.284 0.000Frequency 1999.1 1.66 +/‐ 0.62 43.3% 0.000 0.418 0.000Frequency 1999.2 1.79 +/‐ 0.63 46.6% 0.000 0.293 0.000Frequency 2000.1 1.98 +/‐ 0.62 53.6% 0.000 0.459 0.000Frequency 2000.2 2.15 +/‐ 0.63 58.1% 0.000 0.285 0.000Frequency 2001.1 2.37 +/‐ 0.60 65.3% 0.000 0.466 0.000Frequency 2001.2 2.59 +/‐ 0.58 71.8% 0.000 0.217 0.000Frequency 2002.1 2.78 +/‐ 0.57 76.2% 0.000 0.356 0.000Frequency 2002.2 2.97 +/‐ 0.55 79.8% 0.000 0.167 0.000Frequency 2003.1 3.04 +/‐ 0.58 79.5% 0.000 0.223 0.000Frequency 2003.2 3.12 +/‐ 0.62 79.0% 0.000 0.177 0.000Frequency 2004.1 2.97 +/‐ 0.63 77.7% 0.000 0.102 0.000Frequency 2004.2 2.98 +/‐ 0.68 75.4% 0.000 0.114 0.000Frequency 2005.1 2.92 +/‐ 0.73 73.2% 0.000 0.108 0.000Frequency 2005.2 2.99 +/‐ 0.79 71.4% 0.000 0.101 0.000Frequency 2006.1 2.90 +/‐ 0.85 68.8% 0.000 0.090 0.000Frequency 2006.2 2.87 +/‐ 0.93 64.6% 0.000 0.114 0.000Frequency 2007.1 3.02 +/‐ 0.99 65.3% 0.000 0.168 0.000Frequency 2007.2 3.14 +/‐ 1.09 63.7% 0.000 0.145 0.000Frequency 2008.1 3.35 +/‐ 1.16 65.1% 0.000 0.218 0.000Frequency 2008.2 3.30 +/‐ 1.30 59.7% 0.000 0.264 0.000Frequency 2009.1 3.33 +/‐ 1.44 57.0% 0.000 0.303 0.000Frequency 2009.2 3.56 +/‐ 1.61 55.9% 0.000 0.250 0.000Frequency 2010.1 3.88 +/‐ 1.76 58.2% 0.000 0.364 0.000Frequency 2010.2 4.05 +/‐ 2.01 54.3% 0.000 0.343 0.001Frequency 2011.1 4.41 +/‐ 2.25 55.7% 0.000 0.472 0.001Frequency 2011.2 4.45 +/‐ 2.66 48.5% 0.000 0.496 0.003Frequency 2012.1 4.71 +/‐ 3.11 45.9% 0.000 0.593 0.006Frequency 2012.2 4.13 +/‐ 3.67 30.2% 0.000 0.778 0.029Frequency 2013.1 3.21 +/‐ 4.13 14.2% 0.000 0.579 0.106Frequency 2013.2 1.30 +/‐ 4.08 ‐18.3% 0.000 0.962 0.473Frequency 2014.1 0.58 +/‐ 5.03 ‐31.0% 0.000 0.882 0.785Frequency 2014.2 ‐0.79 +/‐ 6.45 ‐36.7% 0.001 0.840 0.767Frequency 2015.1 ‐2.50 +/‐ 8.08 ‐26.6% 0.002 0.901 0.444
Coverage = Total PD
End Trend Period = 2018.1
Seasonality = T
Excluded Points = NA
Appendix E Page 11
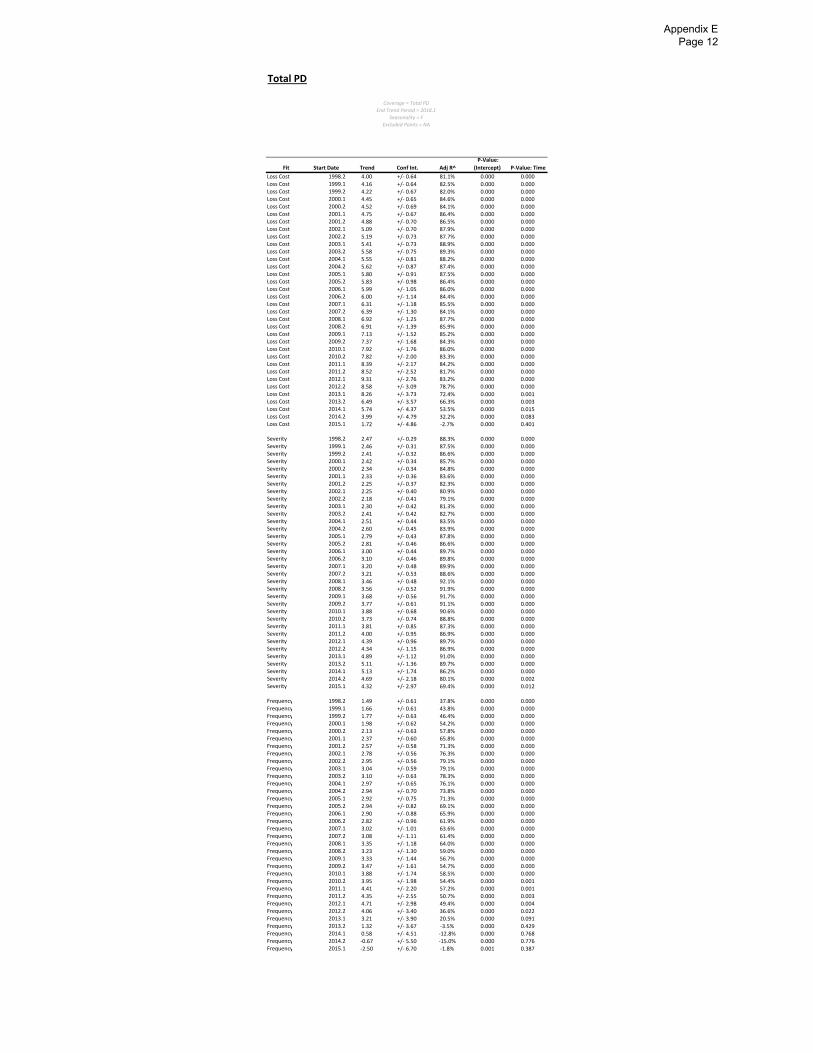
Total PD
Fit Start Date Trend Conf Int. Adj R^
P‐Value:
(Intercept) P‐Value: Time
Loss Cost 1998.2 4.00 +/‐ 0.64 81.1% 0.000 0.000Loss Cost 1999.1 4.16 +/‐ 0.64 82.5% 0.000 0.000Loss Cost 1999.2 4.22 +/‐ 0.67 82.0% 0.000 0.000Loss Cost 2000.1 4.45 +/‐ 0.65 84.6% 0.000 0.000Loss Cost 2000.2 4.52 +/‐ 0.69 84.1% 0.000 0.000Loss Cost 2001.1 4.75 +/‐ 0.67 86.4% 0.000 0.000Loss Cost 2001.2 4.88 +/‐ 0.70 86.5% 0.000 0.000Loss Cost 2002.1 5.09 +/‐ 0.70 87.9% 0.000 0.000Loss Cost 2002.2 5.19 +/‐ 0.73 87.7% 0.000 0.000Loss Cost 2003.1 5.41 +/‐ 0.73 88.9% 0.000 0.000Loss Cost 2003.2 5.58 +/‐ 0.75 89.3% 0.000 0.000Loss Cost 2004.1 5.55 +/‐ 0.81 88.2% 0.000 0.000Loss Cost 2004.2 5.62 +/‐ 0.87 87.4% 0.000 0.000Loss Cost 2005.1 5.80 +/‐ 0.91 87.5% 0.000 0.000Loss Cost 2005.2 5.83 +/‐ 0.98 86.4% 0.000 0.000Loss Cost 2006.1 5.99 +/‐ 1.05 86.0% 0.000 0.000Loss Cost 2006.2 6.00 +/‐ 1.14 84.4% 0.000 0.000Loss Cost 2007.1 6.31 +/‐ 1.18 85.5% 0.000 0.000Loss Cost 2007.2 6.39 +/‐ 1.30 84.1% 0.000 0.000Loss Cost 2008.1 6.92 +/‐ 1.25 87.7% 0.000 0.000Loss Cost 2008.2 6.91 +/‐ 1.39 85.9% 0.000 0.000Loss Cost 2009.1 7.13 +/‐ 1.52 85.2% 0.000 0.000Loss Cost 2009.2 7.37 +/‐ 1.68 84.3% 0.000 0.000Loss Cost 2010.1 7.92 +/‐ 1.76 86.0% 0.000 0.000Loss Cost 2010.2 7.82 +/‐ 2.00 83.3% 0.000 0.000Loss Cost 2011.1 8.39 +/‐ 2.17 84.2% 0.000 0.000Loss Cost 2011.2 8.52 +/‐ 2.52 81.7% 0.000 0.000Loss Cost 2012.1 9.31 +/‐ 2.76 83.2% 0.000 0.000Loss Cost 2012.2 8.58 +/‐ 3.09 78.7% 0.000 0.000Loss Cost 2013.1 8.26 +/‐ 3.73 72.4% 0.000 0.001Loss Cost 2013.2 6.49 +/‐ 3.57 66.3% 0.000 0.003Loss Cost 2014.1 5.74 +/‐ 4.37 53.5% 0.000 0.015Loss Cost 2014.2 3.99 +/‐ 4.79 32.2% 0.000 0.083Loss Cost 2015.1 1.72 +/‐ 4.86 ‐2.7% 0.000 0.401
Severity 1998.2 2.47 +/‐ 0.29 88.3% 0.000 0.000Severity 1999.1 2.46 +/‐ 0.31 87.5% 0.000 0.000Severity 1999.2 2.41 +/‐ 0.32 86.6% 0.000 0.000Severity 2000.1 2.42 +/‐ 0.34 85.7% 0.000 0.000Severity 2000.2 2.34 +/‐ 0.34 84.8% 0.000 0.000Severity 2001.1 2.33 +/‐ 0.36 83.6% 0.000 0.000Severity 2001.2 2.25 +/‐ 0.37 82.3% 0.000 0.000Severity 2002.1 2.25 +/‐ 0.40 80.9% 0.000 0.000Severity 2002.2 2.18 +/‐ 0.41 79.1% 0.000 0.000Severity 2003.1 2.30 +/‐ 0.42 81.3% 0.000 0.000Severity 2003.2 2.41 +/‐ 0.42 82.7% 0.000 0.000Severity 2004.1 2.51 +/‐ 0.44 83.5% 0.000 0.000Severity 2004.2 2.60 +/‐ 0.45 83.9% 0.000 0.000Severity 2005.1 2.79 +/‐ 0.43 87.8% 0.000 0.000Severity 2005.2 2.81 +/‐ 0.46 86.6% 0.000 0.000Severity 2006.1 3.00 +/‐ 0.44 89.7% 0.000 0.000Severity 2006.2 3.10 +/‐ 0.46 89.8% 0.000 0.000Severity 2007.1 3.20 +/‐ 0.48 89.9% 0.000 0.000Severity 2007.2 3.21 +/‐ 0.53 88.6% 0.000 0.000Severity 2008.1 3.46 +/‐ 0.48 92.1% 0.000 0.000Severity 2008.2 3.56 +/‐ 0.52 91.9% 0.000 0.000Severity 2009.1 3.68 +/‐ 0.56 91.7% 0.000 0.000Severity 2009.2 3.77 +/‐ 0.61 91.1% 0.000 0.000Severity 2010.1 3.88 +/‐ 0.68 90.6% 0.000 0.000Severity 2010.2 3.73 +/‐ 0.74 88.8% 0.000 0.000Severity 2011.1 3.81 +/‐ 0.85 87.3% 0.000 0.000Severity 2011.2 4.00 +/‐ 0.95 86.9% 0.000 0.000Severity 2012.1 4.39 +/‐ 0.96 89.7% 0.000 0.000Severity 2012.2 4.34 +/‐ 1.15 86.9% 0.000 0.000Severity 2013.1 4.89 +/‐ 1.12 91.0% 0.000 0.000Severity 2013.2 5.11 +/‐ 1.36 89.7% 0.000 0.000Severity 2014.1 5.13 +/‐ 1.74 86.2% 0.000 0.000Severity 2014.2 4.69 +/‐ 2.18 80.1% 0.000 0.002Severity 2015.1 4.32 +/‐ 2.97 69.4% 0.000 0.012
Frequency 1998.2 1.49 +/‐ 0.61 37.8% 0.000 0.000Frequency 1999.1 1.66 +/‐ 0.61 43.8% 0.000 0.000Frequency 1999.2 1.77 +/‐ 0.63 46.4% 0.000 0.000Frequency 2000.1 1.98 +/‐ 0.62 54.2% 0.000 0.000Frequency 2000.2 2.13 +/‐ 0.63 57.8% 0.000 0.000Frequency 2001.1 2.37 +/‐ 0.60 65.8% 0.000 0.000Frequency 2001.2 2.57 +/‐ 0.58 71.3% 0.000 0.000Frequency 2002.1 2.78 +/‐ 0.56 76.3% 0.000 0.000Frequency 2002.2 2.95 +/‐ 0.56 79.1% 0.000 0.000Frequency 2003.1 3.04 +/‐ 0.59 79.1% 0.000 0.000Frequency 2003.2 3.10 +/‐ 0.63 78.3% 0.000 0.000Frequency 2004.1 2.97 +/‐ 0.65 76.1% 0.000 0.000Frequency 2004.2 2.94 +/‐ 0.70 73.8% 0.000 0.000Frequency 2005.1 2.92 +/‐ 0.75 71.3% 0.000 0.000Frequency 2005.2 2.94 +/‐ 0.82 69.1% 0.000 0.000Frequency 2006.1 2.90 +/‐ 0.88 65.9% 0.000 0.000Frequency 2006.2 2.82 +/‐ 0.96 61.9% 0.000 0.000Frequency 2007.1 3.02 +/‐ 1.01 63.6% 0.000 0.000Frequency 2007.2 3.08 +/‐ 1.11 61.4% 0.000 0.000Frequency 2008.1 3.35 +/‐ 1.18 64.0% 0.000 0.000Frequency 2008.2 3.23 +/‐ 1.30 59.0% 0.000 0.000Frequency 2009.1 3.33 +/‐ 1.44 56.7% 0.000 0.000Frequency 2009.2 3.47 +/‐ 1.61 54.7% 0.000 0.000Frequency 2010.1 3.88 +/‐ 1.74 58.5% 0.000 0.000Frequency 2010.2 3.95 +/‐ 1.98 54.4% 0.000 0.001Frequency 2011.1 4.41 +/‐ 2.20 57.2% 0.000 0.001Frequency 2011.2 4.35 +/‐ 2.55 50.7% 0.000 0.003Frequency 2012.1 4.71 +/‐ 2.98 49.4% 0.000 0.004Frequency 2012.2 4.06 +/‐ 3.40 36.6% 0.000 0.022Frequency 2013.1 3.21 +/‐ 3.90 20.5% 0.000 0.091Frequency 2013.2 1.32 +/‐ 3.67 ‐3.5% 0.000 0.429Frequency 2014.1 0.58 +/‐ 4.51 ‐12.8% 0.000 0.768Frequency 2014.2 ‐0.67 +/‐ 5.50 ‐15.0% 0.000 0.776Frequency 2015.1 ‐2.50 +/‐ 6.70 ‐1.8% 0.001 0.387
Coverage = Total PD
End Trend Period = 2018.1
Seasonality = F
Excluded Points = NA
Appendix E Page 12
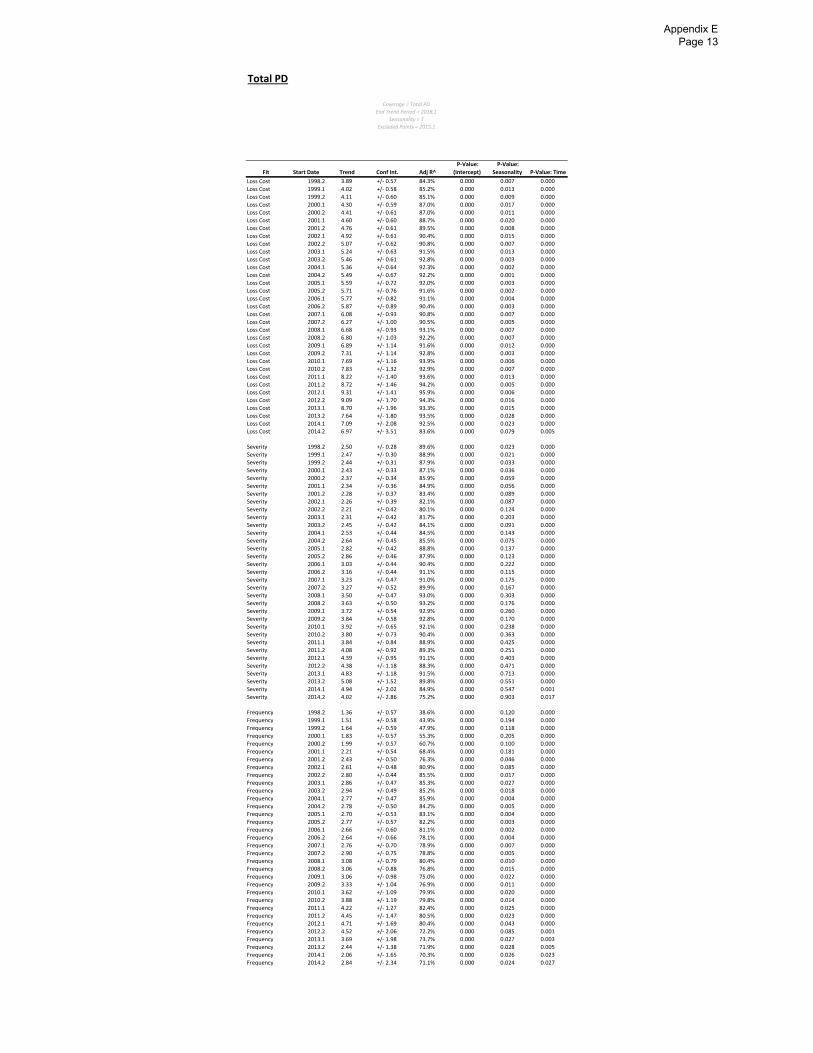
Total PD
Fit Start Date Trend Conf Int. Adj R^
P‐Value:
(Intercept)
P‐Value:
Seasonality P‐Value: Time
Loss Cost 1998.2 3.89 +/‐ 0.57 84.3% 0.000 0.007 0.000
Loss Cost 1999.1 4.02 +/‐ 0.58 85.2% 0.000 0.013 0.000
Loss Cost 1999.2 4.11 +/‐ 0.60 85.1% 0.000 0.009 0.000
Loss Cost 2000.1 4.30 +/‐ 0.59 87.0% 0.000 0.017 0.000
Loss Cost 2000.2 4.41 +/‐ 0.61 87.0% 0.000 0.011 0.000
Loss Cost 2001.1 4.60 +/‐ 0.60 88.7% 0.000 0.020 0.000
Loss Cost 2001.2 4.76 +/‐ 0.61 89.5% 0.000 0.008 0.000
Loss Cost 2002.1 4.92 +/‐ 0.61 90.4% 0.000 0.015 0.000
Loss Cost 2002.2 5.07 +/‐ 0.62 90.8% 0.000 0.007 0.000
Loss Cost 2003.1 5.24 +/‐ 0.63 91.5% 0.000 0.013 0.000
Loss Cost 2003.2 5.46 +/‐ 0.61 92.8% 0.000 0.003 0.000
Loss Cost 2004.1 5.36 +/‐ 0.64 92.3% 0.000 0.002 0.000
Loss Cost 2004.2 5.49 +/‐ 0.67 92.2% 0.000 0.001 0.000
Loss Cost 2005.1 5.59 +/‐ 0.72 92.0% 0.000 0.003 0.000
Loss Cost 2005.2 5.71 +/‐ 0.76 91.6% 0.000 0.002 0.000
Loss Cost 2006.1 5.77 +/‐ 0.82 91.1% 0.000 0.004 0.000
Loss Cost 2006.2 5.87 +/‐ 0.89 90.4% 0.000 0.003 0.000
Loss Cost 2007.1 6.08 +/‐ 0.93 90.8% 0.000 0.007 0.000
Loss Cost 2007.2 6.27 +/‐ 1.00 90.5% 0.000 0.005 0.000
Loss Cost 2008.1 6.68 +/‐ 0.93 93.1% 0.000 0.007 0.000
Loss Cost 2008.2 6.80 +/‐ 1.03 92.2% 0.000 0.007 0.000
Loss Cost 2009.1 6.89 +/‐ 1.14 91.6% 0.000 0.012 0.000
Loss Cost 2009.2 7.31 +/‐ 1.14 92.8% 0.000 0.003 0.000
Loss Cost 2010.1 7.69 +/‐ 1.16 93.9% 0.000 0.006 0.000
Loss Cost 2010.2 7.83 +/‐ 1.32 92.9% 0.000 0.007 0.000
Loss Cost 2011.1 8.22 +/‐ 1.40 93.6% 0.000 0.013 0.000
Loss Cost 2011.2 8.72 +/‐ 1.46 94.2% 0.000 0.005 0.000
Loss Cost 2012.1 9.31 +/‐ 1.41 95.9% 0.000 0.006 0.000
Loss Cost 2012.2 9.09 +/‐ 1.70 94.3% 0.000 0.016 0.000
Loss Cost 2013.1 8.70 +/‐ 1.96 93.3% 0.000 0.015 0.000
Loss Cost 2013.2 7.64 +/‐ 1.80 93.5% 0.000 0.028 0.000
Loss Cost 2014.1 7.09 +/‐ 2.08 92.5% 0.000 0.023 0.000
Loss Cost 2014.2 6.97 +/‐ 3.51 83.6% 0.000 0.079 0.005
Severity 1998.2 2.50 +/‐ 0.28 89.6% 0.000 0.023 0.000
Severity 1999.1 2.47 +/‐ 0.30 88.9% 0.000 0.021 0.000
Severity 1999.2 2.44 +/‐ 0.31 87.9% 0.000 0.033 0.000
Severity 2000.1 2.43 +/‐ 0.33 87.1% 0.000 0.036 0.000
Severity 2000.2 2.37 +/‐ 0.34 85.9% 0.000 0.059 0.000
Severity 2001.1 2.34 +/‐ 0.36 84.9% 0.000 0.056 0.000
Severity 2001.2 2.28 +/‐ 0.37 83.4% 0.000 0.089 0.000
Severity 2002.1 2.26 +/‐ 0.39 82.1% 0.000 0.087 0.000
Severity 2002.2 2.21 +/‐ 0.42 80.1% 0.000 0.124 0.000
Severity 2003.1 2.31 +/‐ 0.42 81.7% 0.000 0.203 0.000
Severity 2003.2 2.45 +/‐ 0.42 84.1% 0.000 0.091 0.000
Severity 2004.1 2.53 +/‐ 0.44 84.5% 0.000 0.143 0.000
Severity 2004.2 2.64 +/‐ 0.45 85.5% 0.000 0.075 0.000
Severity 2005.1 2.82 +/‐ 0.42 88.8% 0.000 0.137 0.000
Severity 2005.2 2.86 +/‐ 0.46 87.9% 0.000 0.123 0.000
Severity 2006.1 3.03 +/‐ 0.44 90.4% 0.000 0.222 0.000
Severity 2006.2 3.16 +/‐ 0.44 91.1% 0.000 0.115 0.000
Severity 2007.1 3.23 +/‐ 0.47 91.0% 0.000 0.175 0.000
Severity 2007.2 3.27 +/‐ 0.52 89.9% 0.000 0.167 0.000
Severity 2008.1 3.50 +/‐ 0.47 93.0% 0.000 0.303 0.000
Severity 2008.2 3.63 +/‐ 0.50 93.2% 0.000 0.176 0.000
Severity 2009.1 3.72 +/‐ 0.54 92.9% 0.000 0.260 0.000
Severity 2009.2 3.84 +/‐ 0.58 92.8% 0.000 0.170 0.000
Severity 2010.1 3.92 +/‐ 0.65 92.1% 0.000 0.238 0.000
Severity 2010.2 3.80 +/‐ 0.73 90.4% 0.000 0.363 0.000
Severity 2011.1 3.84 +/‐ 0.84 88.9% 0.000 0.425 0.000
Severity 2011.2 4.08 +/‐ 0.92 89.3% 0.000 0.251 0.000
Severity 2012.1 4.39 +/‐ 0.95 91.1% 0.000 0.403 0.000
Severity 2012.2 4.38 +/‐ 1.18 88.3% 0.000 0.471 0.000
Severity 2013.1 4.83 +/‐ 1.18 91.5% 0.000 0.713 0.000
Severity 2013.2 5.08 +/‐ 1.52 89.8% 0.000 0.551 0.000
Severity 2014.1 4.94 +/‐ 2.02 84.9% 0.000 0.547 0.001
Severity 2014.2 4.02 +/‐ 2.86 75.2% 0.000 0.903 0.017
Frequency 1998.2 1.36 +/‐ 0.57 38.6% 0.000 0.120 0.000
Frequency 1999.1 1.51 +/‐ 0.58 43.9% 0.000 0.194 0.000
Frequency 1999.2 1.64 +/‐ 0.59 47.9% 0.000 0.118 0.000
Frequency 2000.1 1.83 +/‐ 0.57 55.3% 0.000 0.205 0.000
Frequency 2000.2 1.99 +/‐ 0.57 60.7% 0.000 0.100 0.000
Frequency 2001.1 2.21 +/‐ 0.54 68.4% 0.000 0.181 0.000
Frequency 2001.2 2.43 +/‐ 0.50 76.3% 0.000 0.046 0.000
Frequency 2002.1 2.61 +/‐ 0.48 80.9% 0.000 0.085 0.000
Frequency 2002.2 2.80 +/‐ 0.44 85.5% 0.000 0.017 0.000
Frequency 2003.1 2.86 +/‐ 0.47 85.3% 0.000 0.027 0.000
Frequency 2003.2 2.94 +/‐ 0.49 85.2% 0.000 0.018 0.000
Frequency 2004.1 2.77 +/‐ 0.47 85.9% 0.000 0.004 0.000
Frequency 2004.2 2.78 +/‐ 0.50 84.2% 0.000 0.005 0.000
Frequency 2005.1 2.70 +/‐ 0.53 83.1% 0.000 0.004 0.000
Frequency 2005.2 2.77 +/‐ 0.57 82.2% 0.000 0.003 0.000
Frequency 2006.1 2.66 +/‐ 0.60 81.1% 0.000 0.002 0.000
Frequency 2006.2 2.64 +/‐ 0.66 78.1% 0.000 0.004 0.000
Frequency 2007.1 2.76 +/‐ 0.70 78.9% 0.000 0.007 0.000
Frequency 2007.2 2.90 +/‐ 0.75 78.8% 0.000 0.005 0.000
Frequency 2008.1 3.08 +/‐ 0.79 80.4% 0.000 0.010 0.000
Frequency 2008.2 3.06 +/‐ 0.88 76.8% 0.000 0.015 0.000
Frequency 2009.1 3.06 +/‐ 0.98 75.0% 0.000 0.022 0.000
Frequency 2009.2 3.33 +/‐ 1.04 76.9% 0.000 0.011 0.000
Frequency 2010.1 3.62 +/‐ 1.09 79.9% 0.000 0.020 0.000
Frequency 2010.2 3.88 +/‐ 1.19 79.8% 0.000 0.014 0.000
Frequency 2011.1 4.22 +/‐ 1.27 82.4% 0.000 0.025 0.000
Frequency 2011.2 4.45 +/‐ 1.47 80.5% 0.000 0.023 0.000
Frequency 2012.1 4.71 +/‐ 1.69 80.4% 0.000 0.043 0.000
Frequency 2012.2 4.52 +/‐ 2.06 72.2% 0.000 0.085 0.001
Frequency 2013.1 3.69 +/‐ 1.98 73.7% 0.000 0.027 0.003
Frequency 2013.2 2.44 +/‐ 1.38 71.9% 0.000 0.028 0.005
Frequency 2014.1 2.06 +/‐ 1.65 70.3% 0.000 0.026 0.023
Frequency 2014.2 2.84 +/‐ 2.34 71.1% 0.000 0.024 0.027
Coverage = Total PD
End Trend Period = 2018.1
Seasonality = T
Excluded Points = 2015.1
Appendix E Page 13
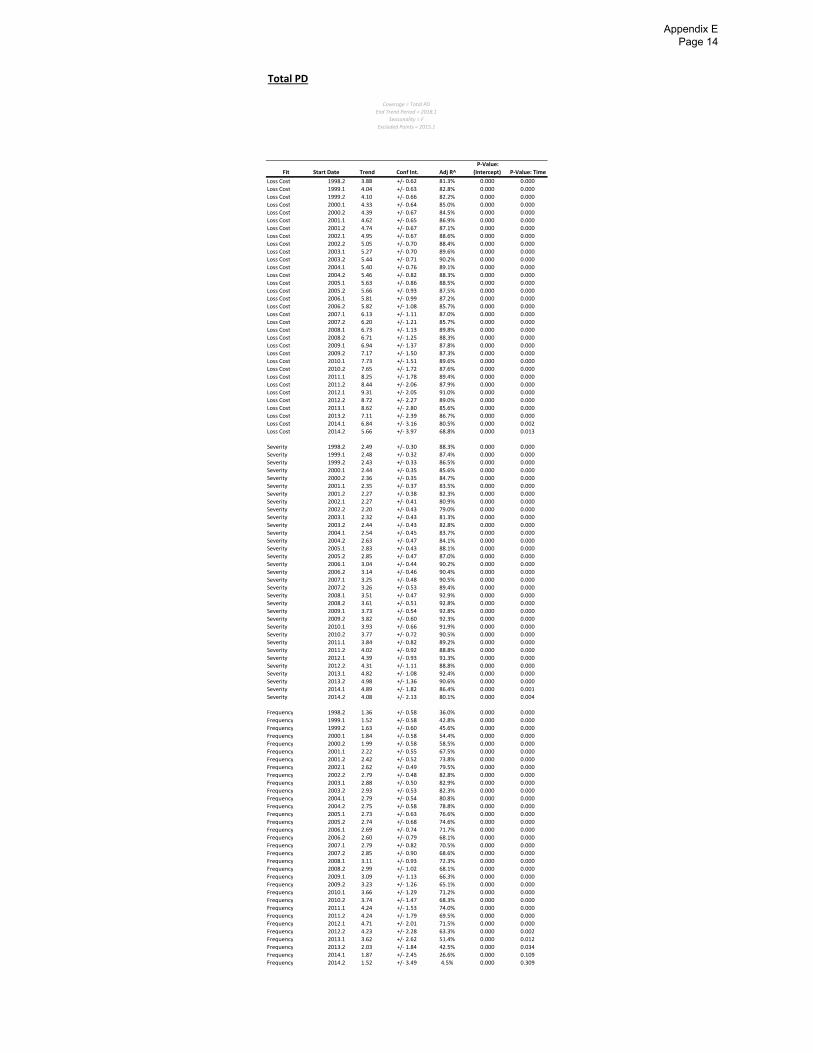
Total PD
Fit Start Date Trend Conf Int. Adj R^
P‐Value:
(Intercept) P‐Value: Time
Loss Cost 1998.2 3.88 +/‐ 0.62 81.3% 0.000 0.000
Loss Cost 1999.1 4.04 +/‐ 0.63 82.8% 0.000 0.000
Loss Cost 1999.2 4.10 +/‐ 0.66 82.2% 0.000 0.000
Loss Cost 2000.1 4.33 +/‐ 0.64 85.0% 0.000 0.000
Loss Cost 2000.2 4.39 +/‐ 0.67 84.5% 0.000 0.000
Loss Cost 2001.1 4.62 +/‐ 0.65 86.9% 0.000 0.000
Loss Cost 2001.2 4.74 +/‐ 0.67 87.1% 0.000 0.000
Loss Cost 2002.1 4.95 +/‐ 0.67 88.6% 0.000 0.000
Loss Cost 2002.2 5.05 +/‐ 0.70 88.4% 0.000 0.000
Loss Cost 2003.1 5.27 +/‐ 0.70 89.6% 0.000 0.000
Loss Cost 2003.2 5.44 +/‐ 0.71 90.2% 0.000 0.000
Loss Cost 2004.1 5.40 +/‐ 0.76 89.1% 0.000 0.000
Loss Cost 2004.2 5.46 +/‐ 0.82 88.3% 0.000 0.000
Loss Cost 2005.1 5.63 +/‐ 0.86 88.5% 0.000 0.000
Loss Cost 2005.2 5.66 +/‐ 0.93 87.5% 0.000 0.000
Loss Cost 2006.1 5.81 +/‐ 0.99 87.2% 0.000 0.000
Loss Cost 2006.2 5.82 +/‐ 1.08 85.7% 0.000 0.000
Loss Cost 2007.1 6.13 +/‐ 1.11 87.0% 0.000 0.000
Loss Cost 2007.2 6.20 +/‐ 1.21 85.7% 0.000 0.000
Loss Cost 2008.1 6.73 +/‐ 1.13 89.8% 0.000 0.000
Loss Cost 2008.2 6.71 +/‐ 1.25 88.3% 0.000 0.000
Loss Cost 2009.1 6.94 +/‐ 1.37 87.8% 0.000 0.000
Loss Cost 2009.2 7.17 +/‐ 1.50 87.3% 0.000 0.000
Loss Cost 2010.1 7.73 +/‐ 1.51 89.6% 0.000 0.000
Loss Cost 2010.2 7.65 +/‐ 1.72 87.6% 0.000 0.000
Loss Cost 2011.1 8.25 +/‐ 1.78 89.4% 0.000 0.000
Loss Cost 2011.2 8.44 +/‐ 2.06 87.9% 0.000 0.000
Loss Cost 2012.1 9.31 +/‐ 2.05 91.0% 0.000 0.000
Loss Cost 2012.2 8.72 +/‐ 2.27 89.0% 0.000 0.000
Loss Cost 2013.1 8.62 +/‐ 2.80 85.6% 0.000 0.000
Loss Cost 2013.2 7.11 +/‐ 2.39 86.7% 0.000 0.000
Loss Cost 2014.1 6.84 +/‐ 3.16 80.5% 0.000 0.002
Loss Cost 2014.2 5.66 +/‐ 3.97 68.8% 0.000 0.013
Severity 1998.2 2.49 +/‐ 0.30 88.3% 0.000 0.000
Severity 1999.1 2.48 +/‐ 0.32 87.4% 0.000 0.000
Severity 1999.2 2.43 +/‐ 0.33 86.5% 0.000 0.000
Severity 2000.1 2.44 +/‐ 0.35 85.6% 0.000 0.000
Severity 2000.2 2.36 +/‐ 0.35 84.7% 0.000 0.000
Severity 2001.1 2.35 +/‐ 0.37 83.5% 0.000 0.000
Severity 2001.2 2.27 +/‐ 0.38 82.3% 0.000 0.000
Severity 2002.1 2.27 +/‐ 0.41 80.9% 0.000 0.000
Severity 2002.2 2.20 +/‐ 0.43 79.0% 0.000 0.000
Severity 2003.1 2.32 +/‐ 0.43 81.3% 0.000 0.000
Severity 2003.2 2.44 +/‐ 0.43 82.8% 0.000 0.000
Severity 2004.1 2.54 +/‐ 0.45 83.7% 0.000 0.000
Severity 2004.2 2.63 +/‐ 0.47 84.1% 0.000 0.000
Severity 2005.1 2.83 +/‐ 0.43 88.1% 0.000 0.000
Severity 2005.2 2.85 +/‐ 0.47 87.0% 0.000 0.000
Severity 2006.1 3.04 +/‐ 0.44 90.2% 0.000 0.000
Severity 2006.2 3.14 +/‐ 0.46 90.4% 0.000 0.000
Severity 2007.1 3.25 +/‐ 0.48 90.5% 0.000 0.000
Severity 2007.2 3.26 +/‐ 0.53 89.4% 0.000 0.000
Severity 2008.1 3.51 +/‐ 0.47 92.9% 0.000 0.000
Severity 2008.2 3.61 +/‐ 0.51 92.8% 0.000 0.000
Severity 2009.1 3.73 +/‐ 0.54 92.8% 0.000 0.000
Severity 2009.2 3.82 +/‐ 0.60 92.3% 0.000 0.000
Severity 2010.1 3.93 +/‐ 0.66 91.9% 0.000 0.000
Severity 2010.2 3.77 +/‐ 0.72 90.5% 0.000 0.000
Severity 2011.1 3.84 +/‐ 0.82 89.2% 0.000 0.000
Severity 2011.2 4.02 +/‐ 0.92 88.8% 0.000 0.000
Severity 2012.1 4.39 +/‐ 0.93 91.3% 0.000 0.000
Severity 2012.2 4.31 +/‐ 1.11 88.8% 0.000 0.000
Severity 2013.1 4.82 +/‐ 1.08 92.4% 0.000 0.000
Severity 2013.2 4.98 +/‐ 1.36 90.6% 0.000 0.000
Severity 2014.1 4.89 +/‐ 1.82 86.4% 0.000 0.001
Severity 2014.2 4.08 +/‐ 2.13 80.1% 0.000 0.004
Frequency 1998.2 1.36 +/‐ 0.58 36.0% 0.000 0.000
Frequency 1999.1 1.52 +/‐ 0.58 42.8% 0.000 0.000
Frequency 1999.2 1.63 +/‐ 0.60 45.6% 0.000 0.000
Frequency 2000.1 1.84 +/‐ 0.58 54.4% 0.000 0.000
Frequency 2000.2 1.99 +/‐ 0.58 58.5% 0.000 0.000
Frequency 2001.1 2.22 +/‐ 0.55 67.5% 0.000 0.000
Frequency 2001.2 2.42 +/‐ 0.52 73.8% 0.000 0.000
Frequency 2002.1 2.62 +/‐ 0.49 79.5% 0.000 0.000
Frequency 2002.2 2.79 +/‐ 0.48 82.8% 0.000 0.000
Frequency 2003.1 2.88 +/‐ 0.50 82.9% 0.000 0.000
Frequency 2003.2 2.93 +/‐ 0.53 82.3% 0.000 0.000
Frequency 2004.1 2.79 +/‐ 0.54 80.8% 0.000 0.000
Frequency 2004.2 2.75 +/‐ 0.58 78.8% 0.000 0.000
Frequency 2005.1 2.73 +/‐ 0.63 76.6% 0.000 0.000
Frequency 2005.2 2.74 +/‐ 0.68 74.6% 0.000 0.000
Frequency 2006.1 2.69 +/‐ 0.74 71.7% 0.000 0.000
Frequency 2006.2 2.60 +/‐ 0.79 68.1% 0.000 0.000
Frequency 2007.1 2.79 +/‐ 0.82 70.5% 0.000 0.000
Frequency 2007.2 2.85 +/‐ 0.90 68.6% 0.000 0.000
Frequency 2008.1 3.11 +/‐ 0.93 72.3% 0.000 0.000
Frequency 2008.2 2.99 +/‐ 1.02 68.1% 0.000 0.000
Frequency 2009.1 3.09 +/‐ 1.13 66.3% 0.000 0.000
Frequency 2009.2 3.23 +/‐ 1.26 65.1% 0.000 0.000
Frequency 2010.1 3.66 +/‐ 1.29 71.2% 0.000 0.000
Frequency 2010.2 3.74 +/‐ 1.47 68.3% 0.000 0.000
Frequency 2011.1 4.24 +/‐ 1.53 74.0% 0.000 0.000
Frequency 2011.2 4.24 +/‐ 1.79 69.5% 0.000 0.000
Frequency 2012.1 4.71 +/‐ 2.01 71.5% 0.000 0.000
Frequency 2012.2 4.23 +/‐ 2.28 63.3% 0.000 0.002
Frequency 2013.1 3.62 +/‐ 2.62 51.4% 0.000 0.012
Frequency 2013.2 2.03 +/‐ 1.84 42.5% 0.000 0.034
Frequency 2014.1 1.87 +/‐ 2.45 26.6% 0.000 0.109
Frequency 2014.2 1.52 +/‐ 3.49 4.5% 0.000 0.309
Coverage = Total PD
End Trend Period = 2018.1
Seasonality = F
Excluded Points = 2015.1
Appendix E Page 14

AB DI
Fit Start Date Trend Conf Int.
Level Change
Value Adj R^
P‐Value:
(Intercept)
P‐Value:
Scalar Level
P‐Value:
Seasonality P‐Value: Time
Loss Cost 1998.2 ‐3.43 +/‐ 2.54 2.243 43.5% 0.000 0.000 0.064 0.011
Loss Cost 1999.1 ‐3.40 +/‐ 2.72 2.237 43.0% 0.000 0.000 0.073 0.017Loss Cost 1999.2 ‐3.34 +/‐ 2.91 2.227 42.9% 0.000 0.000 0.078 0.028Loss Cost 2000.1 ‐2.65 +/‐ 3.05 2.113 43.3% 0.000 0.000 0.119 0.091Loss Cost 2000.2 ‐2.44 +/‐ 3.29 2.081 43.4% 0.000 0.000 0.115 0.145Loss Cost 2001.1 ‐1.83 +/‐ 3.50 1.992 44.2% 0.000 0.001 0.163 0.298Loss Cost 2001.2 ‐1.50 +/‐ 3.78 1.947 44.6% 0.000 0.002 0.148 0.429Loss Cost 2002.1 ‐1.54 +/‐ 4.09 1.953 44.3% 0.000 0.003 0.158 0.451Loss Cost 2002.2 ‐1.36 +/‐ 4.45 1.930 44.0% 0.000 0.004 0.159 0.540Loss Cost 2003.1 ‐0.85 +/‐ 4.82 1.870 44.5% 0.000 0.008 0.203 0.721Loss Cost 2003.2 ‐1.70 +/‐ 5.13 1.968 43.0% 0.000 0.006 0.282 0.504Loss Cost 2004.1 ‐1.83 +/‐ 5.58 1.982 42.6% 0.000 0.008 0.289 0.510Loss Cost 2004.2 ‐0.96 +/‐ 6.08 1.889 43.9% 0.000 0.016 0.235 0.750Loss Cost 2005.1 ‐0.07 +/‐ 6.61 1.802 45.1% 0.000 0.030 0.306 0.983Loss Cost 2005.2 1.22 +/‐ 7.17 1.692 47.5% 0.000 0.056 0.228 0.726Loss Cost 2006.1 2.29 +/‐ 7.78 1.611 48.9% 0.000 0.091 0.303 0.542Loss Cost 2006.2 4.13 +/‐ 8.31 1.491 52.8% 0.000 0.155 0.196 0.302Loss Cost 2007.1 6.20 +/‐ 8.67 1.380 57.9% 0.001 0.239 0.302 0.139Loss Cost 2007.2 7.35 +/‐ 9.38 1.329 57.8% 0.003 0.310 0.244 0.105Loss Cost 2008.1 8.10 +/‐ 10.09 1.302 57.2% 0.009 0.358 0.310 0.096Loss Cost 2008.2 6.54 +/‐ 10.33 1.345 49.7% 0.006 0.303 0.456 0.184Loss Cost 2009.1 5.69 +/‐ 10.73 1.356 43.9% 0.006 0.299 0.386 0.263Loss Cost 2009.2 5.30 +/‐ 11.36 1.354 35.4% 0.008 0.316 0.460 0.321Loss Cost 2010.1 3.40 +/‐ 9.03 1.256 32.4% 0.001 0.347 0.129 0.423Loss Cost 2010.2 3.85 +/‐ 9.36 1.301 32.2% 0.001 0.296 0.107 0.379Loss Cost 2011.1 3.69 +/‐ 9.64 1.220 25.7% 0.002 0.463 0.093 0.408Loss Cost 2011.2 3.68 +/‐ 10.21 1.169 8.1% 0.003 0.634 0.136 0.432Loss Cost 2012.1 3.98 +/‐ 11.24 0.999 3.6% 0.010 0.999 0.161 0.434Loss Cost 2012.2 3.98 +/‐ 11.24 NA 6.0% 0.013 0.161 0.434Loss Cost 2013.1 6.18 +/‐ 13.45 NA 6.6% 0.058 0.255 0.305
Severity 1998.2 4.36 +/‐ 2.47 1.691 77.9% 0.000 0.001 0.592 0.001Severity 1999.1 4.64 +/‐ 2.63 1.657 77.8% 0.000 0.002 0.673 0.001Severity 1999.2 4.84 +/‐ 2.82 1.634 77.3% 0.000 0.004 0.629 0.001Severity 2000.1 5.44 +/‐ 2.96 1.566 78.2% 0.000 0.008 0.780 0.001Severity 2000.2 5.80 +/‐ 3.18 1.529 78.0% 0.000 0.014 0.696 0.001Severity 2001.1 6.05 +/‐ 3.42 1.503 77.4% 0.000 0.022 0.758 0.001Severity 2001.2 5.94 +/‐ 3.70 1.514 76.2% 0.000 0.025 0.790 0.002Severity 2002.1 5.70 +/‐ 3.98 1.537 74.8% 0.000 0.026 0.751 0.005Severity 2002.2 5.68 +/‐ 4.32 1.539 73.5% 0.000 0.033 0.764 0.010Severity 2003.1 5.85 +/‐ 4.70 1.524 72.5% 0.000 0.045 0.798 0.014Severity 2003.2 4.91 +/‐ 4.98 1.606 70.7% 0.000 0.030 0.960 0.048Severity 2004.1 4.94 +/‐ 5.43 1.603 69.3% 0.000 0.038 0.967 0.066Severity 2004.2 5.93 +/‐ 5.89 1.523 69.9% 0.000 0.071 0.820 0.043Severity 2005.1 6.71 +/‐ 6.40 1.466 69.8% 0.000 0.111 0.926 0.035Severity 2005.2 7.57 +/‐ 7.00 1.408 69.5% 0.000 0.167 0.814 0.030Severity 2006.1 8.20 +/‐ 7.64 1.370 68.5% 0.000 0.221 0.892 0.030Severity 2006.2 9.31 +/‐ 8.33 1.311 68.4% 0.000 0.306 0.764 0.024Severity 2007.1 11.24 +/‐ 8.74 1.224 70.9% 0.000 0.438 0.976 0.011Severity 2007.2 11.50 +/‐ 9.54 1.214 68.4% 0.000 0.475 0.946 0.015Severity 2008.1 11.85 +/‐ 10.30 1.203 65.9% 0.000 0.511 0.989 0.020Severity 2008.2 10.50 +/‐ 10.68 1.236 60.7% 0.000 0.457 0.838 0.043Severity 2009.1 9.75 +/‐ 11.17 1.244 54.3% 0.000 0.453 0.949 0.070Severity 2009.2 9.18 +/‐ 11.76 1.242 47.3% 0.000 0.468 0.861 0.102Severity 2010.1 7.36 +/‐ 9.83 1.159 38.6% 0.000 0.557 0.697 0.117Severity 2010.2 8.16 +/‐ 9.76 1.233 45.6% 0.000 0.401 0.471 0.082Severity 2011.1 8.00 +/‐ 10.04 1.156 34.5% 0.000 0.591 0.392 0.095Severity 2011.2 8.01 +/‐ 10.66 1.177 22.6% 0.000 0.621 0.416 0.112Severity 2012.1 7.99 +/‐ 11.74 1.186 12.0% 0.000 0.812 0.478 0.143Severity 2012.2 7.99 +/‐ 11.74 NA 7.0% 0.000 0.478 0.143Severity 2013.1 10.11 +/‐ 14.12 NA 11.2% 0.000 0.634 0.121
Frequency 1998.2 ‐7.47 +/‐ 0.86 1.326 93.3% 0.000 0.000 0.000 0.000Frequency 1999.1 ‐7.68 +/‐ 0.89 1.350 93.3% 0.000 0.000 0.000 0.000Frequency 1999.2 ‐7.79 +/‐ 0.94 1.363 93.0% 0.000 0.000 0.000 0.000Frequency 2000.1 ‐7.67 +/‐ 1.01 1.349 92.0% 0.000 0.000 0.000 0.000Frequency 2000.2 ‐7.79 +/‐ 1.07 1.362 91.6% 0.000 0.000 0.001 0.000Frequency 2001.1 ‐7.43 +/‐ 1.09 1.325 91.0% 0.000 0.000 0.002 0.000Frequency 2001.2 ‐7.01 +/‐ 1.09 1.286 90.9% 0.000 0.000 0.000 0.000Frequency 2002.1 ‐6.85 +/‐ 1.17 1.271 89.6% 0.000 0.001 0.001 0.000Frequency 2002.2 ‐6.66 +/‐ 1.26 1.254 88.6% 0.000 0.001 0.001 0.000Frequency 2003.1 ‐6.33 +/‐ 1.32 1.227 87.0% 0.000 0.003 0.001 0.000Frequency 2003.2 ‐6.31 +/‐ 1.44 1.226 85.8% 0.000 0.005 0.001 0.000Frequency 2004.1 ‐6.45 +/‐ 1.56 1.237 84.3% 0.000 0.005 0.001 0.000Frequency 2004.2 ‐6.50 +/‐ 1.70 1.240 83.0% 0.000 0.007 0.002 0.000Frequency 2005.1 ‐6.35 +/‐ 1.85 1.230 79.8% 0.000 0.012 0.004 0.000Frequency 2005.2 ‐5.90 +/‐ 1.97 1.201 78.2% 0.000 0.026 0.002 0.000Frequency 2006.1 ‐5.46 +/‐ 2.08 1.175 73.6% 0.000 0.050 0.004 0.000Frequency 2006.2 ‐4.74 +/‐ 2.07 1.137 73.4% 0.000 0.097 0.001 0.000Frequency 2007.1 ‐4.53 +/‐ 2.24 1.127 67.9% 0.000 0.133 0.002 0.001Frequency 2007.2 ‐3.72 +/‐ 2.12 1.094 70.5% 0.000 0.205 0.000 0.002Frequency 2008.1 ‐3.36 +/‐ 2.20 1.083 64.2% 0.001 0.260 0.001 0.006Frequency 2008.2 ‐3.58 +/‐ 2.33 1.088 65.0% 0.001 0.241 0.001 0.005Frequency 2009.1 ‐3.70 +/‐ 2.46 1.090 61.8% 0.002 0.248 0.002 0.007Frequency 2009.2 ‐3.55 +/‐ 2.60 1.090 61.1% 0.004 0.257 0.002 0.012Frequency 2010.1 ‐3.69 +/‐ 2.69 1.084 60.2% 0.004 0.301 0.002 0.012Frequency 2010.2 ‐3.99 +/‐ 2.44 1.055 68.9% 0.001 0.445 0.004 0.004Frequency 2011.1 ‐3.99 +/‐ 2.57 1.056 63.4% 0.002 0.488 0.007 0.007Frequency 2011.2 ‐4.01 +/‐ 2.50 0.993 68.5% 0.002 0.940 0.015 0.006Frequency 2012.1 ‐3.71 +/‐ 2.59 0.842 66.9% 0.002 0.346 0.012 0.011Frequency 2012.2 ‐3.71 +/‐ 2.59 NA 66.0% 0.011 0.012 0.011Frequency 2013.1 ‐3.56 +/‐ 3.16 NA 55.3% 0.038 0.023 0.034
Coverage = AB DI
End Trend Period = 2018.1
Scalar Level Change Start Date = 2012‐04‐01
Seasonality = T
Excluded Points = NA
Appendix E Page 15

AB DI
Fit Start Date Trend Conf Int.
Level Change
Value Adj R^
P‐Value:
(Intercept)
P‐Value:
Scalar Level P‐Value: Time
Loss Cost 1998.2 ‐3.52 +/‐ 2.62 2.253 39.5% 0.000 0.000 0.011
Loss Cost 1999.1 ‐3.36 +/‐ 2.80 2.225 39.2% 0.000 0.000 0.022Loss Cost 1999.2 ‐3.44 +/‐ 3.00 2.239 39.1% 0.000 0.000 0.028Loss Cost 2000.1 ‐2.62 +/‐ 3.12 2.103 40.7% 0.000 0.000 0.102Loss Cost 2000.2 ‐2.55 +/‐ 3.36 2.094 40.6% 0.000 0.000 0.136Loss Cost 2001.1 ‐1.80 +/‐ 3.55 1.984 42.4% 0.000 0.001 0.314Loss Cost 2001.2 ‐1.62 +/‐ 3.84 1.960 42.4% 0.000 0.002 0.398Loss Cost 2002.1 ‐1.50 +/‐ 4.16 1.945 42.3% 0.000 0.003 0.469Loss Cost 2002.2 ‐1.52 +/‐ 4.51 1.946 41.9% 0.000 0.004 0.500Loss Cost 2003.1 ‐0.82 +/‐ 4.87 1.863 43.2% 0.000 0.009 0.734Loss Cost 2003.2 ‐1.86 +/‐ 5.12 1.984 42.6% 0.000 0.006 0.467Loss Cost 2004.1 ‐1.80 +/‐ 5.59 1.977 42.2% 0.000 0.008 0.517Loss Cost 2004.2 ‐1.18 +/‐ 6.10 1.910 42.9% 0.000 0.015 0.696Loss Cost 2005.1 ‐0.05 +/‐ 6.61 1.800 44.9% 0.000 0.030 0.987Loss Cost 2005.2 0.93 +/‐ 7.20 1.715 46.2% 0.000 0.052 0.791Loss Cost 2006.1 2.29 +/‐ 7.78 1.611 48.6% 0.000 0.091 0.543Loss Cost 2006.2 3.73 +/‐ 8.38 1.516 51.0% 0.000 0.145 0.356Loss Cost 2007.1 6.16 +/‐ 8.66 1.383 57.6% 0.001 0.237 0.142Loss Cost 2007.2 6.92 +/‐ 9.39 1.349 56.8% 0.003 0.289 0.127Loss Cost 2008.1 8.01 +/‐ 10.07 1.310 57.0% 0.011 0.348 0.099Loss Cost 2008.2 6.24 +/‐ 10.09 1.358 50.9% 0.005 0.282 0.196Loss Cost 2009.1 5.56 +/‐ 10.59 1.368 44.6% 0.006 0.282 0.269Loss Cost 2009.2 4.98 +/‐ 11.06 1.364 37.2% 0.007 0.298 0.340Loss Cost 2010.1 3.11 +/‐ 9.44 1.282 24.6% 0.001 0.330 0.484Loss Cost 2010.2 3.29 +/‐ 9.91 1.303 21.6% 0.002 0.325 0.479Loss Cost 2011.1 3.21 +/‐ 10.39 1.272 10.9% 0.003 0.414 0.507Loss Cost 2011.2 3.22 +/‐ 10.74 1.129 ‐5.6% 0.004 0.728 0.515Loss Cost 2012.1 2.89 +/‐ 11.54 1.374 ‐9.4% 0.018 0.660 0.583Loss Cost 2012.2 2.89 +/‐ 11.54 NA ‐6.6% 0.014 0.583Loss Cost 2013.1 6.18 +/‐ 13.56 NA 1.3% 0.071 0.314
Severity 1998.2 4.34 +/‐ 2.44 1.693 78.4% 0.000 0.001 0.001Severity 1999.1 4.65 +/‐ 2.60 1.655 78.3% 0.000 0.002 0.001Severity 1999.2 4.81 +/‐ 2.78 1.636 77.8% 0.000 0.003 0.001Severity 2000.1 5.44 +/‐ 2.92 1.565 78.8% 0.000 0.007 0.000Severity 2000.2 5.77 +/‐ 3.13 1.531 78.5% 0.000 0.013 0.001Severity 2001.1 6.05 +/‐ 3.37 1.502 78.1% 0.000 0.021 0.001Severity 2001.2 5.91 +/‐ 3.63 1.516 76.9% 0.000 0.023 0.002Severity 2002.1 5.71 +/‐ 3.91 1.535 75.6% 0.000 0.024 0.005Severity 2002.2 5.65 +/‐ 4.24 1.541 74.3% 0.000 0.030 0.009Severity 2003.1 5.85 +/‐ 4.62 1.523 73.4% 0.000 0.042 0.012Severity 2003.2 4.91 +/‐ 4.87 1.606 71.8% 0.000 0.026 0.043Severity 2004.1 4.95 +/‐ 5.31 1.603 70.5% 0.000 0.035 0.061Severity 2004.2 5.89 +/‐ 5.75 1.526 71.1% 0.000 0.064 0.040Severity 2005.1 6.71 +/‐ 6.26 1.465 71.1% 0.000 0.104 0.031Severity 2005.2 7.52 +/‐ 6.82 1.412 70.8% 0.000 0.155 0.027Severity 2006.1 8.20 +/‐ 7.45 1.371 69.9% 0.000 0.210 0.027Severity 2006.2 9.22 +/‐ 8.09 1.316 69.7% 0.000 0.288 0.022Severity 2007.1 11.23 +/‐ 8.49 1.224 72.4% 0.000 0.426 0.009Severity 2007.2 11.47 +/‐ 9.22 1.215 70.1% 0.000 0.461 0.013Severity 2008.1 11.85 +/‐ 9.96 1.203 67.8% 0.000 0.499 0.016Severity 2008.2 10.59 +/‐ 10.30 1.233 62.9% 0.000 0.448 0.036Severity 2009.1 9.76 +/‐ 10.75 1.244 57.2% 0.000 0.439 0.061Severity 2009.2 9.25 +/‐ 11.27 1.240 50.7% 0.000 0.456 0.087Severity 2010.1 7.28 +/‐ 9.45 1.165 42.3% 0.000 0.529 0.109Severity 2010.2 7.92 +/‐ 9.46 1.234 47.4% 0.000 0.390 0.083Severity 2011.1 7.76 +/‐ 9.82 1.180 35.6% 0.000 0.534 0.099Severity 2011.2 7.76 +/‐ 10.35 1.156 24.6% 0.000 0.655 0.114Severity 2012.1 7.44 +/‐ 11.13 1.385 16.0% 0.000 0.626 0.153Severity 2012.2 7.44 +/‐ 11.13 NA 11.2% 0.000 0.153Severity 2013.1 10.11 +/‐ 13.26 NA 18.6% 0.000 0.103
Frequency 1998.2 ‐7.53 +/‐ 1.02 1.331 90.5% 0.000 0.000 0.000Frequency 1999.1 ‐7.65 +/‐ 1.08 1.344 90.0% 0.000 0.000 0.000Frequency 1999.2 ‐7.87 +/‐ 1.13 1.368 89.8% 0.000 0.000 0.000Frequency 2000.1 ‐7.64 +/‐ 1.19 1.344 88.8% 0.000 0.000 0.000Frequency 2000.2 ‐7.87 +/‐ 1.26 1.368 88.5% 0.000 0.000 0.000Frequency 2001.1 ‐7.41 +/‐ 1.26 1.321 87.8% 0.000 0.000 0.000Frequency 2001.2 ‐7.12 +/‐ 1.33 1.293 86.4% 0.000 0.001 0.000Frequency 2002.1 ‐6.82 +/‐ 1.41 1.267 84.8% 0.000 0.003 0.000Frequency 2002.2 ‐6.78 +/‐ 1.53 1.263 83.0% 0.000 0.005 0.000Frequency 2003.1 ‐6.30 +/‐ 1.59 1.224 81.1% 0.000 0.013 0.000Frequency 2003.2 ‐6.45 +/‐ 1.72 1.235 79.6% 0.000 0.013 0.000Frequency 2004.1 ‐6.43 +/‐ 1.87 1.234 77.1% 0.000 0.019 0.000Frequency 2004.2 ‐6.67 +/‐ 2.02 1.251 75.9% 0.000 0.016 0.000Frequency 2005.1 ‐6.34 +/‐ 2.18 1.228 72.0% 0.000 0.031 0.000Frequency 2005.2 ‐6.13 +/‐ 2.37 1.215 67.7% 0.000 0.049 0.000Frequency 2006.1 ‐5.47 +/‐ 2.47 1.175 62.4% 0.000 0.095 0.000Frequency 2006.2 ‐5.02 +/‐ 2.64 1.152 56.1% 0.000 0.150 0.001Frequency 2007.1 ‐4.56 +/‐ 2.82 1.130 48.8% 0.001 0.219 0.004Frequency 2007.2 ‐4.08 +/‐ 2.98 1.110 40.5% 0.005 0.295 0.011Frequency 2008.1 ‐3.43 +/‐ 3.04 1.089 30.4% 0.020 0.382 0.032Frequency 2008.2 ‐3.93 +/‐ 3.11 1.101 35.8% 0.011 0.320 0.018Frequency 2009.1 ‐3.83 +/‐ 3.32 1.100 29.7% 0.021 0.340 0.029Frequency 2009.2 ‐3.91 +/‐ 3.51 1.099 27.2% 0.027 0.358 0.034Frequency 2010.1 ‐3.89 +/‐ 3.70 1.100 22.8% 0.040 0.373 0.044Frequency 2010.2 ‐4.29 +/‐ 3.30 1.056 41.1% 0.010 0.569 0.017Frequency 2011.1 ‐4.22 +/‐ 3.42 1.079 33.4% 0.019 0.468 0.022Frequency 2011.2 ‐4.21 +/‐ 3.19 0.977 47.0% 0.007 0.836 0.016Frequency 2012.1 ‐4.23 +/‐ 3.45 0.992 37.6% 0.025 0.971 0.023Frequency 2012.2 ‐4.23 +/‐ 3.45 NA 35.9% 0.035 0.023Frequency 2013.1 ‐3.56 +/‐ 4.11 NA 21.3% 0.128 0.086
Coverage = AB DI
End Trend Period = 2018.1
Scalar Level Change Start Date = 2012‐04‐01
Seasonality = F
Excluded Points = NA
Appendix E Page 16
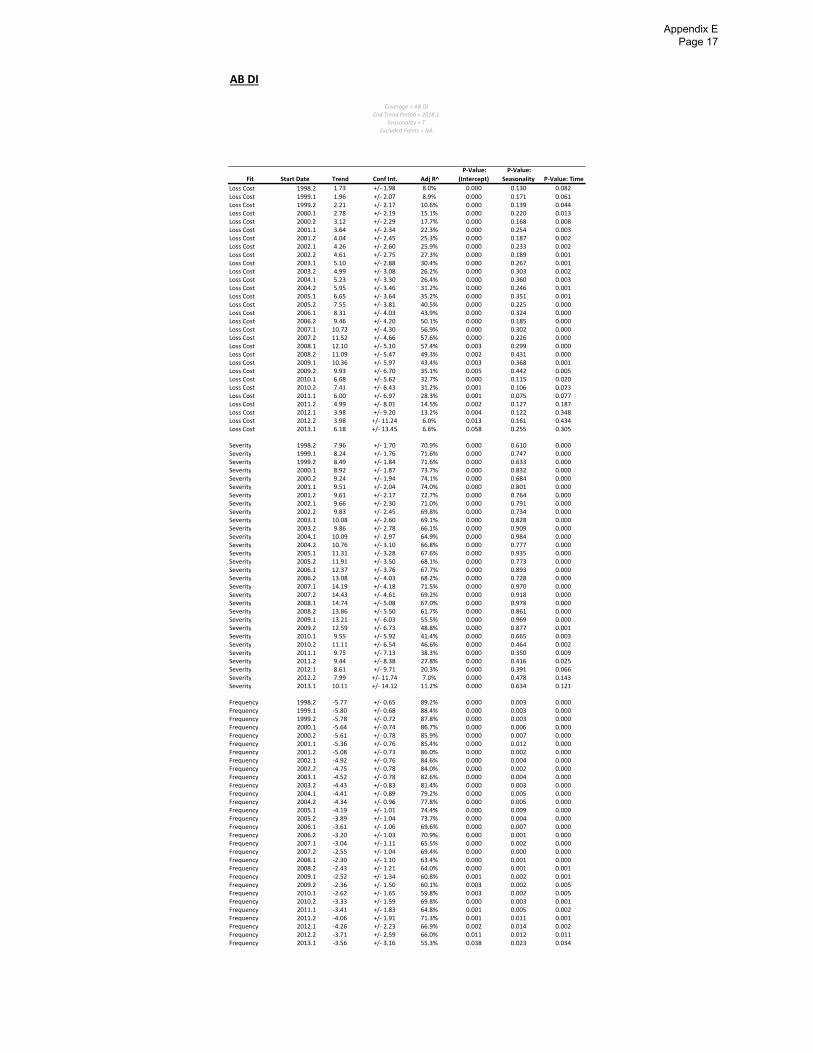
AB DI
Fit Start Date Trend Conf Int. Adj R^
P‐Value:
(Intercept)
P‐Value:
Seasonality P‐Value: Time
Loss Cost 1998.2 1.73 +/‐ 1.98 8.0% 0.000 0.130 0.082
Loss Cost 1999.1 1.96 +/‐ 2.07 8.9% 0.000 0.171 0.061Loss Cost 1999.2 2.21 +/‐ 2.17 10.6% 0.000 0.139 0.044Loss Cost 2000.1 2.78 +/‐ 2.19 15.1% 0.000 0.220 0.013Loss Cost 2000.2 3.12 +/‐ 2.29 17.7% 0.000 0.168 0.008Loss Cost 2001.1 3.64 +/‐ 2.34 22.3% 0.000 0.254 0.003Loss Cost 2001.2 4.04 +/‐ 2.45 25.3% 0.000 0.187 0.002Loss Cost 2002.1 4.26 +/‐ 2.60 25.9% 0.000 0.233 0.002Loss Cost 2002.2 4.61 +/‐ 2.75 27.3% 0.000 0.189 0.001Loss Cost 2003.1 5.10 +/‐ 2.88 30.4% 0.000 0.267 0.001Loss Cost 2003.2 4.99 +/‐ 3.08 26.2% 0.000 0.303 0.002Loss Cost 2004.1 5.23 +/‐ 3.30 26.4% 0.000 0.360 0.003Loss Cost 2004.2 5.95 +/‐ 3.46 31.2% 0.000 0.246 0.001Loss Cost 2005.1 6.65 +/‐ 3.64 35.2% 0.000 0.351 0.001Loss Cost 2005.2 7.55 +/‐ 3.81 40.5% 0.000 0.225 0.000Loss Cost 2006.1 8.31 +/‐ 4.03 43.9% 0.000 0.324 0.000Loss Cost 2006.2 9.46 +/‐ 4.20 50.1% 0.000 0.185 0.000Loss Cost 2007.1 10.72 +/‐ 4.30 56.9% 0.000 0.302 0.000Loss Cost 2007.2 11.52 +/‐ 4.66 57.6% 0.000 0.226 0.000Loss Cost 2008.1 12.10 +/‐ 5.10 57.4% 0.003 0.299 0.000Loss Cost 2008.2 11.09 +/‐ 5.47 49.3% 0.002 0.431 0.000Loss Cost 2009.1 10.36 +/‐ 5.97 43.4% 0.003 0.368 0.001Loss Cost 2009.2 9.93 +/‐ 6.70 35.1% 0.005 0.442 0.005Loss Cost 2010.1 6.68 +/‐ 5.62 32.7% 0.000 0.115 0.020Loss Cost 2010.2 7.41 +/‐ 6.43 31.2% 0.001 0.106 0.023Loss Cost 2011.1 6.00 +/‐ 6.97 28.3% 0.001 0.075 0.077Loss Cost 2011.2 4.99 +/‐ 8.01 14.5% 0.002 0.127 0.187Loss Cost 2012.1 3.98 +/‐ 9.20 13.2% 0.004 0.122 0.348Loss Cost 2012.2 3.98 +/‐ 11.24 6.0% 0.013 0.161 0.434Loss Cost 2013.1 6.18 +/‐ 13.45 6.6% 0.058 0.255 0.305
Severity 1998.2 7.96 +/‐ 1.70 70.9% 0.000 0.610 0.000Severity 1999.1 8.24 +/‐ 1.76 71.6% 0.000 0.747 0.000Severity 1999.2 8.49 +/‐ 1.84 71.6% 0.000 0.633 0.000Severity 2000.1 8.92 +/‐ 1.87 73.7% 0.000 0.832 0.000Severity 2000.2 9.24 +/‐ 1.94 74.1% 0.000 0.684 0.000Severity 2001.1 9.51 +/‐ 2.04 74.0% 0.000 0.801 0.000Severity 2001.2 9.61 +/‐ 2.17 72.7% 0.000 0.764 0.000Severity 2002.1 9.66 +/‐ 2.30 71.0% 0.000 0.791 0.000Severity 2002.2 9.83 +/‐ 2.45 69.8% 0.000 0.734 0.000Severity 2003.1 10.08 +/‐ 2.60 69.1% 0.000 0.828 0.000Severity 2003.2 9.86 +/‐ 2.78 66.1% 0.000 0.909 0.000Severity 2004.1 10.09 +/‐ 2.97 64.9% 0.000 0.984 0.000Severity 2004.2 10.76 +/‐ 3.10 66.8% 0.000 0.777 0.000Severity 2005.1 11.31 +/‐ 3.28 67.6% 0.000 0.935 0.000Severity 2005.2 11.91 +/‐ 3.50 68.1% 0.000 0.773 0.000Severity 2006.1 12.37 +/‐ 3.76 67.7% 0.000 0.893 0.000Severity 2006.2 13.08 +/‐ 4.03 68.2% 0.000 0.728 0.000Severity 2007.1 14.19 +/‐ 4.18 71.5% 0.000 0.970 0.000Severity 2007.2 14.43 +/‐ 4.61 69.2% 0.000 0.918 0.000Severity 2008.1 14.74 +/‐ 5.08 67.0% 0.000 0.978 0.000Severity 2008.2 13.86 +/‐ 5.50 61.7% 0.000 0.861 0.000Severity 2009.1 13.21 +/‐ 6.03 55.5% 0.000 0.969 0.000Severity 2009.2 12.59 +/‐ 6.73 48.8% 0.000 0.877 0.001Severity 2010.1 9.55 +/‐ 5.92 41.4% 0.000 0.665 0.003Severity 2010.2 11.11 +/‐ 6.54 46.6% 0.000 0.464 0.002Severity 2011.1 9.75 +/‐ 7.13 38.3% 0.000 0.350 0.009Severity 2011.2 9.44 +/‐ 8.38 27.8% 0.000 0.416 0.025Severity 2012.1 8.61 +/‐ 9.71 20.3% 0.000 0.391 0.066Severity 2012.2 7.99 +/‐ 11.74 7.0% 0.000 0.478 0.143Severity 2013.1 10.11 +/‐ 14.12 11.2% 0.000 0.634 0.121
Frequency 1998.2 ‐5.77 +/‐ 0.65 89.2% 0.000 0.003 0.000Frequency 1999.1 ‐5.80 +/‐ 0.68 88.4% 0.000 0.003 0.000Frequency 1999.2 ‐5.78 +/‐ 0.72 87.8% 0.000 0.003 0.000Frequency 2000.1 ‐5.64 +/‐ 0.74 86.7% 0.000 0.006 0.000Frequency 2000.2 ‐5.61 +/‐ 0.78 85.9% 0.000 0.007 0.000Frequency 2001.1 ‐5.36 +/‐ 0.76 85.4% 0.000 0.012 0.000Frequency 2001.2 ‐5.08 +/‐ 0.73 86.0% 0.000 0.002 0.000Frequency 2002.1 ‐4.92 +/‐ 0.76 84.6% 0.000 0.004 0.000Frequency 2002.2 ‐4.75 +/‐ 0.78 84.0% 0.000 0.002 0.000Frequency 2003.1 ‐4.52 +/‐ 0.78 82.6% 0.000 0.004 0.000Frequency 2003.2 ‐4.43 +/‐ 0.83 81.4% 0.000 0.003 0.000Frequency 2004.1 ‐4.41 +/‐ 0.89 79.2% 0.000 0.005 0.000Frequency 2004.2 ‐4.34 +/‐ 0.96 77.8% 0.000 0.005 0.000Frequency 2005.1 ‐4.19 +/‐ 1.01 74.4% 0.000 0.009 0.000Frequency 2005.2 ‐3.89 +/‐ 1.04 73.7% 0.000 0.004 0.000Frequency 2006.1 ‐3.61 +/‐ 1.06 69.6% 0.000 0.007 0.000Frequency 2006.2 ‐3.20 +/‐ 1.03 70.9% 0.000 0.001 0.000Frequency 2007.1 ‐3.04 +/‐ 1.11 65.5% 0.000 0.002 0.000Frequency 2007.2 ‐2.55 +/‐ 1.04 69.4% 0.000 0.000 0.000Frequency 2008.1 ‐2.30 +/‐ 1.10 63.4% 0.000 0.001 0.000Frequency 2008.2 ‐2.43 +/‐ 1.21 64.0% 0.000 0.001 0.001Frequency 2009.1 ‐2.52 +/‐ 1.34 60.8% 0.001 0.002 0.001Frequency 2009.2 ‐2.36 +/‐ 1.50 60.1% 0.003 0.002 0.005Frequency 2010.1 ‐2.62 +/‐ 1.65 59.8% 0.003 0.002 0.005Frequency 2010.2 ‐3.33 +/‐ 1.59 69.8% 0.000 0.003 0.001Frequency 2011.1 ‐3.41 +/‐ 1.83 64.8% 0.001 0.005 0.002Frequency 2011.2 ‐4.06 +/‐ 1.91 71.3% 0.001 0.011 0.001Frequency 2012.1 ‐4.26 +/‐ 2.23 66.9% 0.002 0.014 0.002Frequency 2012.2 ‐3.71 +/‐ 2.59 66.0% 0.011 0.012 0.011Frequency 2013.1 ‐3.56 +/‐ 3.16 55.3% 0.038 0.023 0.034
Coverage = AB DI
End Trend Period = 2018.1
Seasonality = T
Excluded Points = NA
Appendix E Page 17
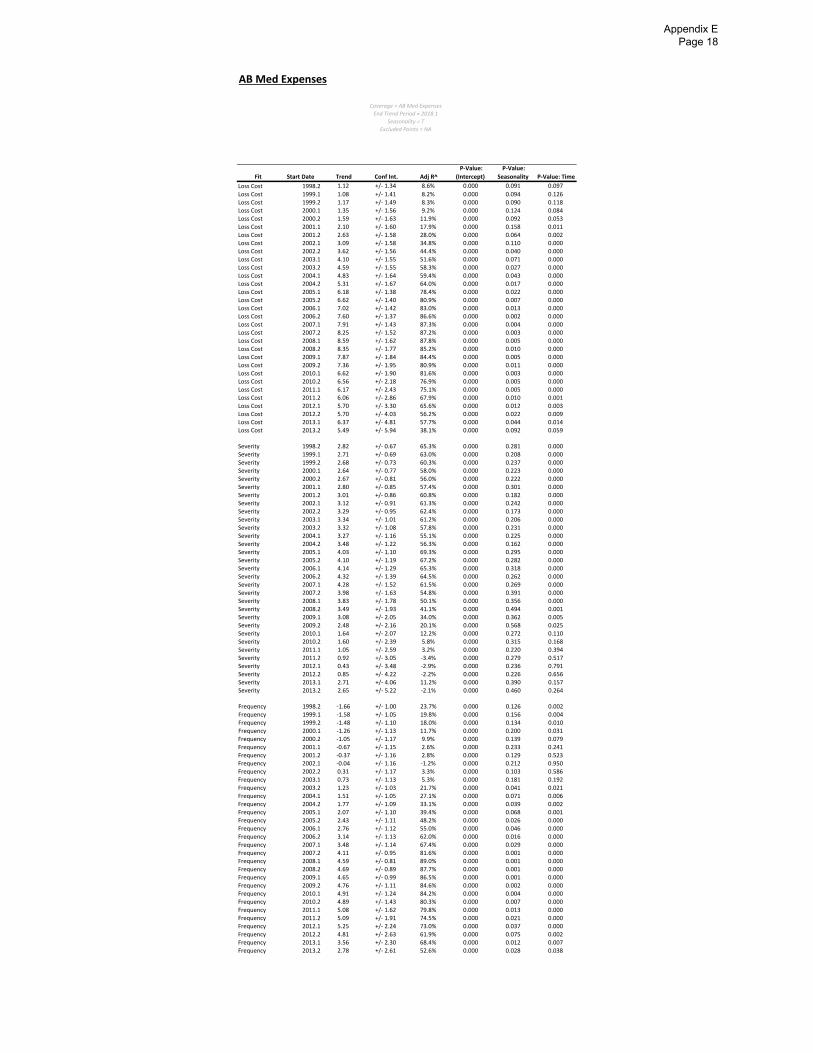
AB Med Expenses
Fit Start Date Trend Conf Int. Adj R^
P‐Value:
(Intercept)
P‐Value:
Seasonality P‐Value: Time
Loss Cost 1998.2 1.12 +/‐ 1.34 8.6% 0.000 0.091 0.097
Loss Cost 1999.1 1.08 +/‐ 1.41 8.2% 0.000 0.094 0.126Loss Cost 1999.2 1.17 +/‐ 1.49 8.3% 0.000 0.090 0.118Loss Cost 2000.1 1.35 +/‐ 1.56 9.2% 0.000 0.124 0.084Loss Cost 2000.2 1.59 +/‐ 1.63 11.9% 0.000 0.092 0.053Loss Cost 2001.1 2.10 +/‐ 1.60 17.9% 0.000 0.158 0.011Loss Cost 2001.2 2.63 +/‐ 1.58 28.0% 0.000 0.064 0.002Loss Cost 2002.1 3.09 +/‐ 1.58 34.8% 0.000 0.110 0.000Loss Cost 2002.2 3.62 +/‐ 1.56 44.4% 0.000 0.040 0.000Loss Cost 2003.1 4.10 +/‐ 1.55 51.6% 0.000 0.071 0.000Loss Cost 2003.2 4.59 +/‐ 1.55 58.3% 0.000 0.027 0.000Loss Cost 2004.1 4.83 +/‐ 1.64 59.4% 0.000 0.043 0.000Loss Cost 2004.2 5.31 +/‐ 1.67 64.0% 0.000 0.017 0.000Loss Cost 2005.1 6.18 +/‐ 1.38 78.4% 0.000 0.022 0.000Loss Cost 2005.2 6.62 +/‐ 1.40 80.9% 0.000 0.007 0.000Loss Cost 2006.1 7.02 +/‐ 1.42 83.0% 0.000 0.013 0.000Loss Cost 2006.2 7.60 +/‐ 1.37 86.6% 0.000 0.002 0.000Loss Cost 2007.1 7.91 +/‐ 1.43 87.3% 0.000 0.004 0.000Loss Cost 2007.2 8.25 +/‐ 1.52 87.2% 0.000 0.003 0.000Loss Cost 2008.1 8.59 +/‐ 1.62 87.8% 0.000 0.005 0.000Loss Cost 2008.2 8.35 +/‐ 1.77 85.2% 0.000 0.010 0.000Loss Cost 2009.1 7.87 +/‐ 1.84 84.4% 0.000 0.005 0.000Loss Cost 2009.2 7.36 +/‐ 1.95 80.9% 0.000 0.011 0.000Loss Cost 2010.1 6.62 +/‐ 1.90 81.6% 0.000 0.003 0.000Loss Cost 2010.2 6.56 +/‐ 2.18 76.9% 0.000 0.005 0.000Loss Cost 2011.1 6.17 +/‐ 2.43 75.1% 0.000 0.005 0.000Loss Cost 2011.2 6.06 +/‐ 2.86 67.9% 0.000 0.010 0.001Loss Cost 2012.1 5.70 +/‐ 3.30 65.6% 0.000 0.012 0.003Loss Cost 2012.2 5.70 +/‐ 4.03 56.2% 0.000 0.022 0.009Loss Cost 2013.1 6.37 +/‐ 4.81 57.7% 0.000 0.044 0.014Loss Cost 2013.2 5.49 +/‐ 5.94 38.1% 0.000 0.092 0.059
Severity 1998.2 2.82 +/‐ 0.67 65.3% 0.000 0.281 0.000Severity 1999.1 2.71 +/‐ 0.69 63.0% 0.000 0.208 0.000Severity 1999.2 2.68 +/‐ 0.73 60.3% 0.000 0.237 0.000Severity 2000.1 2.64 +/‐ 0.77 58.0% 0.000 0.223 0.000Severity 2000.2 2.67 +/‐ 0.81 56.0% 0.000 0.222 0.000Severity 2001.1 2.80 +/‐ 0.85 57.4% 0.000 0.301 0.000Severity 2001.2 3.01 +/‐ 0.86 60.8% 0.000 0.182 0.000Severity 2002.1 3.12 +/‐ 0.91 61.3% 0.000 0.242 0.000Severity 2002.2 3.29 +/‐ 0.95 62.4% 0.000 0.173 0.000Severity 2003.1 3.34 +/‐ 1.01 61.2% 0.000 0.206 0.000Severity 2003.2 3.32 +/‐ 1.08 57.8% 0.000 0.231 0.000Severity 2004.1 3.27 +/‐ 1.16 55.1% 0.000 0.225 0.000Severity 2004.2 3.48 +/‐ 1.22 56.3% 0.000 0.162 0.000Severity 2005.1 4.03 +/‐ 1.10 69.3% 0.000 0.295 0.000Severity 2005.2 4.10 +/‐ 1.19 67.2% 0.000 0.282 0.000Severity 2006.1 4.14 +/‐ 1.29 65.3% 0.000 0.318 0.000Severity 2006.2 4.32 +/‐ 1.39 64.5% 0.000 0.262 0.000Severity 2007.1 4.28 +/‐ 1.52 61.5% 0.000 0.269 0.000Severity 2007.2 3.98 +/‐ 1.63 54.8% 0.000 0.391 0.000Severity 2008.1 3.83 +/‐ 1.78 50.1% 0.000 0.356 0.000Severity 2008.2 3.49 +/‐ 1.93 41.1% 0.000 0.494 0.001Severity 2009.1 3.08 +/‐ 2.05 34.0% 0.000 0.362 0.005Severity 2009.2 2.48 +/‐ 2.16 20.1% 0.000 0.568 0.025Severity 2010.1 1.64 +/‐ 2.07 12.2% 0.000 0.272 0.110Severity 2010.2 1.60 +/‐ 2.39 5.8% 0.000 0.315 0.168Severity 2011.1 1.05 +/‐ 2.59 3.2% 0.000 0.220 0.394Severity 2011.2 0.92 +/‐ 3.05 ‐3.4% 0.000 0.279 0.517Severity 2012.1 0.43 +/‐ 3.48 ‐2.9% 0.000 0.236 0.791Severity 2012.2 0.85 +/‐ 4.22 ‐2.2% 0.000 0.226 0.656Severity 2013.1 2.71 +/‐ 4.06 11.2% 0.000 0.390 0.157Severity 2013.2 2.65 +/‐ 5.22 ‐2.1% 0.000 0.460 0.264
Frequency 1998.2 ‐1.66 +/‐ 1.00 23.7% 0.000 0.126 0.002Frequency 1999.1 ‐1.58 +/‐ 1.05 19.8% 0.000 0.156 0.004Frequency 1999.2 ‐1.48 +/‐ 1.10 18.0% 0.000 0.134 0.010Frequency 2000.1 ‐1.26 +/‐ 1.13 11.7% 0.000 0.200 0.031Frequency 2000.2 ‐1.05 +/‐ 1.17 9.9% 0.000 0.139 0.079Frequency 2001.1 ‐0.67 +/‐ 1.15 2.6% 0.000 0.233 0.241Frequency 2001.2 ‐0.37 +/‐ 1.16 2.8% 0.000 0.129 0.523Frequency 2002.1 ‐0.04 +/‐ 1.16 ‐1.2% 0.000 0.212 0.950Frequency 2002.2 0.31 +/‐ 1.17 3.3% 0.000 0.103 0.586Frequency 2003.1 0.73 +/‐ 1.13 5.3% 0.000 0.181 0.192Frequency 2003.2 1.23 +/‐ 1.03 21.7% 0.000 0.041 0.021Frequency 2004.1 1.51 +/‐ 1.05 27.1% 0.000 0.071 0.006Frequency 2004.2 1.77 +/‐ 1.09 33.1% 0.000 0.039 0.002Frequency 2005.1 2.07 +/‐ 1.10 39.4% 0.000 0.068 0.001Frequency 2005.2 2.43 +/‐ 1.11 48.2% 0.000 0.026 0.000Frequency 2006.1 2.76 +/‐ 1.12 55.0% 0.000 0.046 0.000Frequency 2006.2 3.14 +/‐ 1.13 62.0% 0.000 0.016 0.000Frequency 2007.1 3.48 +/‐ 1.14 67.4% 0.000 0.029 0.000Frequency 2007.2 4.11 +/‐ 0.95 81.6% 0.000 0.001 0.000Frequency 2008.1 4.59 +/‐ 0.81 89.0% 0.000 0.001 0.000Frequency 2008.2 4.69 +/‐ 0.89 87.7% 0.000 0.001 0.000Frequency 2009.1 4.65 +/‐ 0.99 86.5% 0.000 0.001 0.000Frequency 2009.2 4.76 +/‐ 1.11 84.6% 0.000 0.002 0.000Frequency 2010.1 4.91 +/‐ 1.24 84.2% 0.000 0.004 0.000Frequency 2010.2 4.89 +/‐ 1.43 80.3% 0.000 0.007 0.000Frequency 2011.1 5.08 +/‐ 1.62 79.8% 0.000 0.013 0.000Frequency 2011.2 5.09 +/‐ 1.91 74.5% 0.000 0.021 0.000Frequency 2012.1 5.25 +/‐ 2.24 73.0% 0.000 0.037 0.000Frequency 2012.2 4.81 +/‐ 2.63 61.9% 0.000 0.075 0.002Frequency 2013.1 3.56 +/‐ 2.30 68.4% 0.000 0.012 0.007Frequency 2013.2 2.78 +/‐ 2.61 52.6% 0.000 0.028 0.038
Coverage = AB Med Expenses
End Trend Period = 2018.1
Seasonality = T
Excluded Points = NA
Appendix E Page 18
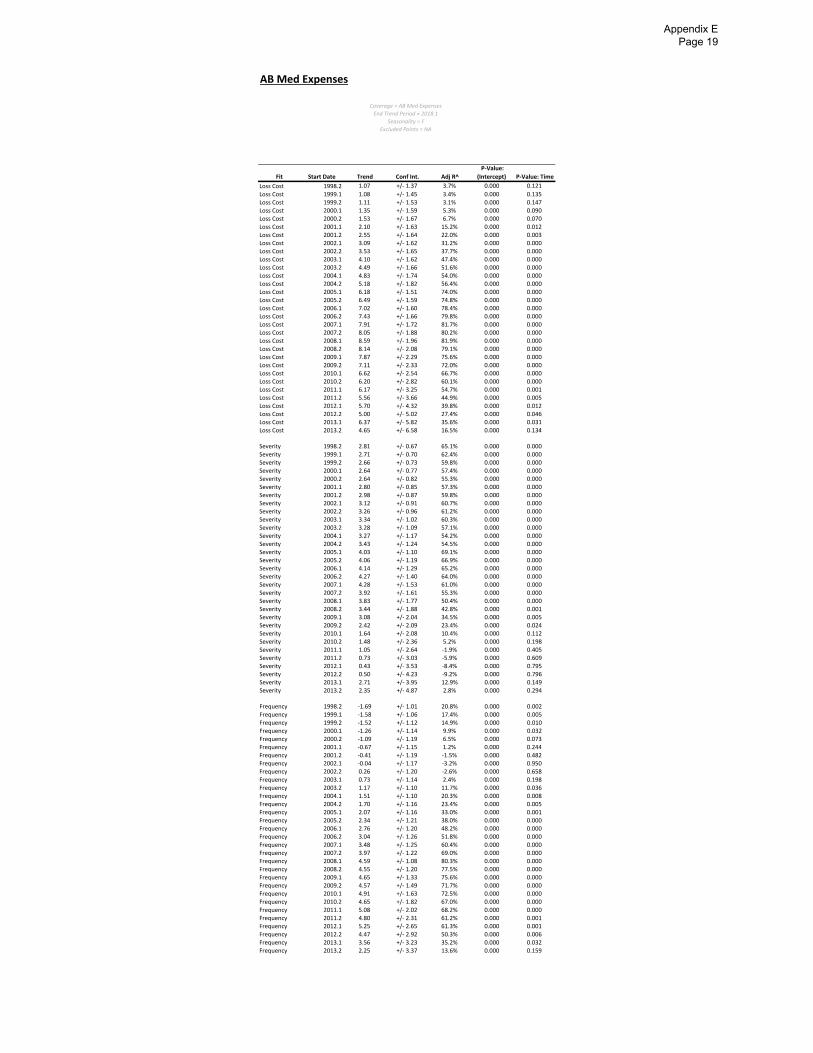
AB Med Expenses
Fit Start Date Trend Conf Int. Adj R^
P‐Value:
(Intercept) P‐Value: Time
Loss Cost 1998.2 1.07 +/‐ 1.37 3.7% 0.000 0.121
Loss Cost 1999.1 1.08 +/‐ 1.45 3.4% 0.000 0.135Loss Cost 1999.2 1.11 +/‐ 1.53 3.1% 0.000 0.147Loss Cost 2000.1 1.35 +/‐ 1.59 5.3% 0.000 0.090Loss Cost 2000.2 1.53 +/‐ 1.67 6.7% 0.000 0.070Loss Cost 2001.1 2.10 +/‐ 1.63 15.2% 0.000 0.012Loss Cost 2001.2 2.55 +/‐ 1.64 22.0% 0.000 0.003Loss Cost 2002.1 3.09 +/‐ 1.62 31.2% 0.000 0.000Loss Cost 2002.2 3.53 +/‐ 1.65 37.7% 0.000 0.000Loss Cost 2003.1 4.10 +/‐ 1.62 47.4% 0.000 0.000Loss Cost 2003.2 4.49 +/‐ 1.66 51.6% 0.000 0.000Loss Cost 2004.1 4.83 +/‐ 1.74 54.0% 0.000 0.000Loss Cost 2004.2 5.18 +/‐ 1.82 56.4% 0.000 0.000Loss Cost 2005.1 6.18 +/‐ 1.51 74.0% 0.000 0.000Loss Cost 2005.2 6.49 +/‐ 1.59 74.8% 0.000 0.000Loss Cost 2006.1 7.02 +/‐ 1.60 78.4% 0.000 0.000Loss Cost 2006.2 7.43 +/‐ 1.66 79.8% 0.000 0.000Loss Cost 2007.1 7.91 +/‐ 1.72 81.7% 0.000 0.000Loss Cost 2007.2 8.05 +/‐ 1.88 80.2% 0.000 0.000Loss Cost 2008.1 8.59 +/‐ 1.96 81.9% 0.000 0.000Loss Cost 2008.2 8.14 +/‐ 2.08 79.1% 0.000 0.000Loss Cost 2009.1 7.87 +/‐ 2.29 75.6% 0.000 0.000Loss Cost 2009.2 7.11 +/‐ 2.33 72.0% 0.000 0.000Loss Cost 2010.1 6.62 +/‐ 2.54 66.7% 0.000 0.000Loss Cost 2010.2 6.20 +/‐ 2.82 60.1% 0.000 0.000Loss Cost 2011.1 6.17 +/‐ 3.25 54.7% 0.000 0.001Loss Cost 2011.2 5.56 +/‐ 3.66 44.9% 0.000 0.005Loss Cost 2012.1 5.70 +/‐ 4.32 39.8% 0.000 0.012Loss Cost 2012.2 5.00 +/‐ 5.02 27.4% 0.000 0.046Loss Cost 2013.1 6.37 +/‐ 5.82 35.6% 0.000 0.031Loss Cost 2013.2 4.65 +/‐ 6.58 16.5% 0.000 0.134
Severity 1998.2 2.81 +/‐ 0.67 65.1% 0.000 0.000Severity 1999.1 2.71 +/‐ 0.70 62.4% 0.000 0.000Severity 1999.2 2.66 +/‐ 0.73 59.8% 0.000 0.000Severity 2000.1 2.64 +/‐ 0.77 57.4% 0.000 0.000Severity 2000.2 2.64 +/‐ 0.82 55.3% 0.000 0.000Severity 2001.1 2.80 +/‐ 0.85 57.3% 0.000 0.000Severity 2001.2 2.98 +/‐ 0.87 59.8% 0.000 0.000Severity 2002.1 3.12 +/‐ 0.91 60.7% 0.000 0.000Severity 2002.2 3.26 +/‐ 0.96 61.2% 0.000 0.000Severity 2003.1 3.34 +/‐ 1.02 60.3% 0.000 0.000Severity 2003.2 3.28 +/‐ 1.09 57.1% 0.000 0.000Severity 2004.1 3.27 +/‐ 1.17 54.2% 0.000 0.000Severity 2004.2 3.43 +/‐ 1.24 54.5% 0.000 0.000Severity 2005.1 4.03 +/‐ 1.10 69.1% 0.000 0.000Severity 2005.2 4.06 +/‐ 1.19 66.9% 0.000 0.000Severity 2006.1 4.14 +/‐ 1.29 65.2% 0.000 0.000Severity 2006.2 4.27 +/‐ 1.40 64.0% 0.000 0.000Severity 2007.1 4.28 +/‐ 1.53 61.0% 0.000 0.000Severity 2007.2 3.92 +/‐ 1.61 55.3% 0.000 0.000Severity 2008.1 3.83 +/‐ 1.77 50.4% 0.000 0.000Severity 2008.2 3.44 +/‐ 1.88 42.8% 0.000 0.001Severity 2009.1 3.08 +/‐ 2.04 34.5% 0.000 0.005Severity 2009.2 2.42 +/‐ 2.09 23.4% 0.000 0.024Severity 2010.1 1.64 +/‐ 2.08 10.4% 0.000 0.112Severity 2010.2 1.48 +/‐ 2.36 5.2% 0.000 0.198Severity 2011.1 1.05 +/‐ 2.64 ‐1.9% 0.000 0.405Severity 2011.2 0.73 +/‐ 3.03 ‐5.9% 0.000 0.609Severity 2012.1 0.43 +/‐ 3.53 ‐8.4% 0.000 0.795Severity 2012.2 0.50 +/‐ 4.23 ‐9.2% 0.000 0.796Severity 2013.1 2.71 +/‐ 3.95 12.9% 0.000 0.149Severity 2013.2 2.35 +/‐ 4.87 2.8% 0.000 0.294
Frequency 1998.2 ‐1.69 +/‐ 1.01 20.8% 0.000 0.002Frequency 1999.1 ‐1.58 +/‐ 1.06 17.4% 0.000 0.005Frequency 1999.2 ‐1.52 +/‐ 1.12 14.9% 0.000 0.010Frequency 2000.1 ‐1.26 +/‐ 1.14 9.9% 0.000 0.032Frequency 2000.2 ‐1.09 +/‐ 1.19 6.5% 0.000 0.073Frequency 2001.1 ‐0.67 +/‐ 1.15 1.2% 0.000 0.244Frequency 2001.2 ‐0.41 +/‐ 1.19 ‐1.5% 0.000 0.482Frequency 2002.1 ‐0.04 +/‐ 1.17 ‐3.2% 0.000 0.950Frequency 2002.2 0.26 +/‐ 1.20 ‐2.6% 0.000 0.658Frequency 2003.1 0.73 +/‐ 1.14 2.4% 0.000 0.198Frequency 2003.2 1.17 +/‐ 1.10 11.7% 0.000 0.036Frequency 2004.1 1.51 +/‐ 1.10 20.3% 0.000 0.008Frequency 2004.2 1.70 +/‐ 1.16 23.4% 0.000 0.005Frequency 2005.1 2.07 +/‐ 1.16 33.0% 0.000 0.001Frequency 2005.2 2.34 +/‐ 1.21 38.0% 0.000 0.000Frequency 2006.1 2.76 +/‐ 1.20 48.2% 0.000 0.000Frequency 2006.2 3.04 +/‐ 1.26 51.8% 0.000 0.000Frequency 2007.1 3.48 +/‐ 1.25 60.4% 0.000 0.000Frequency 2007.2 3.97 +/‐ 1.22 69.0% 0.000 0.000Frequency 2008.1 4.59 +/‐ 1.08 80.3% 0.000 0.000Frequency 2008.2 4.55 +/‐ 1.20 77.5% 0.000 0.000Frequency 2009.1 4.65 +/‐ 1.33 75.6% 0.000 0.000Frequency 2009.2 4.57 +/‐ 1.49 71.7% 0.000 0.000Frequency 2010.1 4.91 +/‐ 1.63 72.5% 0.000 0.000Frequency 2010.2 4.65 +/‐ 1.82 67.0% 0.000 0.000Frequency 2011.1 5.08 +/‐ 2.02 68.2% 0.000 0.000Frequency 2011.2 4.80 +/‐ 2.31 61.2% 0.000 0.001Frequency 2012.1 5.25 +/‐ 2.65 61.3% 0.000 0.001Frequency 2012.2 4.47 +/‐ 2.92 50.3% 0.000 0.006Frequency 2013.1 3.56 +/‐ 3.23 35.2% 0.000 0.032Frequency 2013.2 2.25 +/‐ 3.37 13.6% 0.000 0.159
Coverage = AB Med Expenses
End Trend Period = 2018.1
Seasonality = F
Excluded Points = NA
Appendix E Page 19

AB Med Expenses
Fit Start Date Trend Conf Int.
Level Change
Value Adj R^
P‐Value:
(Intercept)
P‐Value:
Scalar Level
P‐Value:
Seasonality P‐Value: Time
Loss Cost 1998.2 ‐2.69 +/‐ 1.64 1.813 50.4% 0.000 0.000 0.029 0.002
Loss Cost 1999.1 ‐3.06 +/‐ 1.69 1.869 52.9% 0.000 0.000 0.017 0.001Loss Cost 1999.2 ‐3.24 +/‐ 1.80 1.895 53.3% 0.000 0.000 0.025 0.001Loss Cost 2000.1 ‐3.24 +/‐ 1.93 1.894 52.6% 0.000 0.000 0.030 0.002Loss Cost 2000.2 ‐3.15 +/‐ 2.08 1.881 52.5% 0.000 0.000 0.031 0.005Loss Cost 2001.1 ‐2.49 +/‐ 2.14 1.794 53.8% 0.000 0.000 0.054 0.026Loss Cost 2001.2 ‐1.80 +/‐ 2.20 1.711 57.5% 0.000 0.000 0.023 0.109Loss Cost 2002.1 ‐1.21 +/‐ 2.30 1.645 59.4% 0.000 0.000 0.040 0.293Loss Cost 2002.2 ‐0.47 +/‐ 2.38 1.569 63.5% 0.000 0.000 0.017 0.689Loss Cost 2003.1 0.22 +/‐ 2.48 1.503 66.4% 0.000 0.001 0.030 0.854Loss Cost 2003.2 0.94 +/‐ 2.59 1.441 69.3% 0.000 0.003 0.014 0.461Loss Cost 2004.1 1.11 +/‐ 2.83 1.427 69.2% 0.000 0.005 0.020 0.422Loss Cost 2004.2 1.83 +/‐ 3.00 1.372 71.1% 0.000 0.013 0.011 0.216Loss Cost 2005.1 3.50 +/‐ 2.60 1.260 81.9% 0.000 0.025 0.013 0.009Loss Cost 2005.2 4.24 +/‐ 2.72 1.217 83.2% 0.000 0.053 0.006 0.003Loss Cost 2006.1 4.90 +/‐ 2.86 1.182 84.4% 0.000 0.098 0.011 0.001Loss Cost 2006.2 5.95 +/‐ 2.82 1.132 87.1% 0.000 0.186 0.002 0.000Loss Cost 2007.1 6.47 +/‐ 2.98 1.110 87.5% 0.000 0.266 0.005 0.000Loss Cost 2007.2 7.00 +/‐ 3.16 1.091 87.2% 0.000 0.358 0.003 0.000Loss Cost 2008.1 7.50 +/‐ 3.31 1.076 87.5% 0.000 0.436 0.006 0.000Loss Cost 2008.2 7.11 +/‐ 3.48 1.085 85.0% 0.000 0.396 0.012 0.000Loss Cost 2009.1 6.55 +/‐ 3.43 1.090 84.3% 0.000 0.351 0.006 0.001Loss Cost 2009.2 6.07 +/‐ 3.42 1.089 80.8% 0.000 0.346 0.013 0.002Loss Cost 2010.1 5.63 +/‐ 3.14 1.070 81.2% 0.000 0.408 0.004 0.002Loss Cost 2010.2 5.64 +/‐ 3.33 1.071 76.2% 0.000 0.434 0.006 0.003Loss Cost 2011.1 5.59 +/‐ 3.46 1.051 73.5% 0.000 0.600 0.008 0.004Loss Cost 2011.2 5.59 +/‐ 3.67 1.056 65.5% 0.000 0.638 0.013 0.006Loss Cost 2012.1 5.70 +/‐ 4.03 1.000 61.8% 0.000 0.999 0.022 0.009Loss Cost 2012.2 5.70 +/‐ 4.03 NA 56.2% 0.000 0.022 0.009Loss Cost 2013.1 6.37 +/‐ 4.81 NA 57.7% 0.000 0.044 0.014Loss Cost 2013.2 5.49 +/‐ 5.94 NA 38.1% 0.000 0.092 0.059
Severity 1998.2 1.98 +/‐ 1.11 1.136 67.5% 0.000 0.067 0.277 0.001Severity 1999.1 1.68 +/‐ 1.13 1.163 66.7% 0.000 0.031 0.173 0.005Severity 1999.2 1.54 +/‐ 1.20 1.175 64.8% 0.000 0.026 0.224 0.013Severity 2000.1 1.34 +/‐ 1.27 1.192 63.5% 0.000 0.018 0.179 0.038Severity 2000.2 1.28 +/‐ 1.37 1.197 61.8% 0.000 0.020 0.207 0.063Severity 2001.1 1.45 +/‐ 1.47 1.183 62.1% 0.000 0.034 0.259 0.051Severity 2001.2 1.78 +/‐ 1.55 1.157 63.9% 0.000 0.067 0.179 0.024Severity 2002.1 1.92 +/‐ 1.67 1.147 63.6% 0.000 0.097 0.219 0.024Severity 2002.2 2.18 +/‐ 1.79 1.128 63.8% 0.000 0.154 0.177 0.018Severity 2003.1 2.19 +/‐ 1.95 1.128 62.5% 0.000 0.175 0.193 0.027Severity 2003.2 2.02 +/‐ 2.11 1.139 59.5% 0.000 0.160 0.240 0.058Severity 2004.1 1.76 +/‐ 2.28 1.156 57.4% 0.000 0.133 0.209 0.121Severity 2004.2 2.10 +/‐ 2.47 1.135 57.5% 0.000 0.203 0.171 0.089Severity 2005.1 3.26 +/‐ 2.32 1.070 68.8% 0.000 0.442 0.297 0.007Severity 2005.2 3.34 +/‐ 2.54 1.066 66.4% 0.000 0.490 0.301 0.011Severity 2006.1 3.36 +/‐ 2.78 1.064 64.4% 0.000 0.518 0.325 0.018Severity 2006.2 3.69 +/‐ 3.02 1.050 63.2% 0.000 0.625 0.281 0.017Severity 2007.1 3.56 +/‐ 3.27 1.055 60.1% 0.000 0.607 0.280 0.032Severity 2007.2 2.94 +/‐ 3.42 1.078 53.6% 0.000 0.478 0.416 0.083Severity 2008.1 2.64 +/‐ 3.63 1.087 49.1% 0.000 0.444 0.370 0.138Severity 2008.2 2.12 +/‐ 3.77 1.099 40.4% 0.000 0.388 0.521 0.245Severity 2009.1 1.64 +/‐ 3.83 1.104 33.6% 0.000 0.361 0.382 0.373Severity 2009.2 1.08 +/‐ 3.78 1.102 19.7% 0.000 0.353 0.589 0.549Severity 2010.1 0.57 +/‐ 3.43 1.080 10.3% 0.000 0.415 0.298 0.724Severity 2010.2 0.59 +/‐ 3.63 1.081 3.2% 0.000 0.435 0.324 0.729Severity 2011.1 0.52 +/‐ 3.71 1.048 ‐3.7% 0.000 0.657 0.253 0.763Severity 2011.2 0.52 +/‐ 3.94 1.051 ‐12.0% 0.000 0.703 0.290 0.774Severity 2012.1 0.85 +/‐ 4.22 0.880 ‐11.4% 0.000 0.643 0.226 0.656Severity 2012.2 0.85 +/‐ 4.22 NA ‐2.2% 0.000 0.226 0.656Severity 2013.1 2.71 +/‐ 4.06 NA 11.2% 0.000 0.390 0.157Severity 2013.2 2.65 +/‐ 5.22 NA ‐2.1% 0.000 0.460 0.264
Frequency 1998.2 ‐4.58 +/‐ 1.20 1.596 60.7% 0.000 0.000 0.043 0.000Frequency 1999.1 ‐4.66 +/‐ 1.27 1.607 58.6% 0.000 0.000 0.042 0.000Frequency 1999.2 ‐4.71 +/‐ 1.36 1.613 57.1% 0.000 0.000 0.051 0.000Frequency 2000.1 ‐4.52 +/‐ 1.45 1.589 51.8% 0.000 0.000 0.072 0.000Frequency 2000.2 ‐4.37 +/‐ 1.56 1.572 48.9% 0.000 0.000 0.065 0.000Frequency 2001.1 ‐3.87 +/‐ 1.59 1.516 42.2% 0.000 0.000 0.109 0.000Frequency 2001.2 ‐3.52 +/‐ 1.68 1.479 39.3% 0.000 0.000 0.071 0.000Frequency 2002.1 ‐3.08 +/‐ 1.76 1.435 33.4% 0.000 0.000 0.114 0.001Frequency 2002.2 ‐2.60 +/‐ 1.85 1.390 32.8% 0.000 0.001 0.065 0.008Frequency 2003.1 ‐1.93 +/‐ 1.87 1.333 30.5% 0.000 0.002 0.112 0.045Frequency 2003.2 ‐1.06 +/‐ 1.80 1.265 39.4% 0.000 0.006 0.027 0.239Frequency 2004.1 ‐0.63 +/‐ 1.90 1.234 40.6% 0.000 0.014 0.045 0.500Frequency 2004.2 ‐0.26 +/‐ 2.04 1.209 43.0% 0.000 0.030 0.032 0.796Frequency 2005.1 0.24 +/‐ 2.16 1.178 46.0% 0.000 0.060 0.053 0.821Frequency 2005.2 0.87 +/‐ 2.25 1.142 51.6% 0.000 0.121 0.025 0.429Frequency 2006.1 1.48 +/‐ 2.33 1.110 56.3% 0.000 0.213 0.044 0.197Frequency 2006.2 2.18 +/‐ 2.39 1.078 61.8% 0.000 0.358 0.018 0.069Frequency 2007.1 2.81 +/‐ 2.44 1.052 66.5% 0.000 0.521 0.032 0.025Frequency 2007.2 3.95 +/‐ 2.04 1.012 80.6% 0.000 0.847 0.002 0.001Frequency 2008.1 4.73 +/‐ 1.70 0.990 88.4% 0.000 0.846 0.001 0.000Frequency 2008.2 4.88 +/‐ 1.82 0.987 87.0% 0.000 0.799 0.001 0.000Frequency 2009.1 4.83 +/‐ 1.93 0.988 85.7% 0.000 0.812 0.002 0.000Frequency 2009.2 4.94 +/‐ 2.04 0.988 83.6% 0.000 0.821 0.002 0.000Frequency 2010.1 5.03 +/‐ 2.13 0.991 83.0% 0.000 0.875 0.005 0.000Frequency 2010.2 5.02 +/‐ 2.26 0.990 78.7% 0.000 0.867 0.009 0.000Frequency 2011.1 5.05 +/‐ 2.35 1.002 78.0% 0.000 0.970 0.018 0.001Frequency 2011.2 5.05 +/‐ 2.49 1.005 71.9% 0.000 0.950 0.028 0.001Frequency 2012.1 4.81 +/‐ 2.63 1.136 72.0% 0.000 0.447 0.075 0.002Frequency 2012.2 4.81 +/‐ 2.63 NA 61.9% 0.000 0.075 0.002Frequency 2013.1 3.56 +/‐ 2.30 NA 68.4% 0.000 0.012 0.007Frequency 2013.2 2.78 +/‐ 2.61 NA 52.6% 0.000 0.028 0.038
Coverage = AB Med Expenses
End Trend Period = 2018.1
Scalar Level Change Start Date = 2012‐04‐01
Seasonality = T
Excluded Points = NA
Appendix E Page 20

AB Med Expenses
Fit Start Date Trend Conf Int.
Level Change
Value Adj R^
P‐Value:
(Intercept)
P‐Value:
Scalar Level P‐Value: Time
Loss Cost 1998.2 ‐2.75 +/‐ 1.72 1.819 44.8% 0.000 0.000 0.003
Loss Cost 1999.1 ‐3.03 +/‐ 1.81 1.860 46.0% 0.000 0.000 0.002Loss Cost 1999.2 ‐3.33 +/‐ 1.91 1.903 47.3% 0.000 0.000 0.001Loss Cost 2000.1 ‐3.21 +/‐ 2.05 1.886 46.8% 0.000 0.000 0.004Loss Cost 2000.2 ‐3.24 +/‐ 2.20 1.891 46.6% 0.000 0.000 0.006Loss Cost 2001.1 ‐2.46 +/‐ 2.23 1.788 49.4% 0.000 0.000 0.034Loss Cost 2001.2 ‐1.92 +/‐ 2.35 1.722 51.0% 0.000 0.000 0.110Loss Cost 2002.1 ‐1.18 +/‐ 2.43 1.639 54.5% 0.000 0.000 0.332Loss Cost 2002.2 ‐0.62 +/‐ 2.58 1.581 56.6% 0.000 0.001 0.627Loss Cost 2003.1 0.25 +/‐ 2.65 1.498 61.3% 0.000 0.002 0.846Loss Cost 2003.2 0.75 +/‐ 2.85 1.454 62.6% 0.000 0.005 0.590Loss Cost 2004.1 1.14 +/‐ 3.09 1.423 63.1% 0.000 0.010 0.451Loss Cost 2004.2 1.58 +/‐ 3.35 1.389 63.6% 0.000 0.020 0.335Loss Cost 2005.1 3.52 +/‐ 2.91 1.258 77.2% 0.000 0.045 0.018Loss Cost 2005.2 3.96 +/‐ 3.15 1.232 77.2% 0.000 0.076 0.014Loss Cost 2006.1 4.90 +/‐ 3.26 1.182 79.5% 0.000 0.145 0.004Loss Cost 2006.2 5.60 +/‐ 3.46 1.148 80.3% 0.000 0.229 0.002Loss Cost 2007.1 6.43 +/‐ 3.60 1.113 81.6% 0.000 0.344 0.001Loss Cost 2007.2 6.60 +/‐ 3.90 1.107 80.0% 0.000 0.387 0.002Loss Cost 2008.1 7.41 +/‐ 4.01 1.082 81.4% 0.000 0.490 0.001Loss Cost 2008.2 6.74 +/‐ 4.08 1.097 78.8% 0.000 0.414 0.002Loss Cost 2009.1 6.40 +/‐ 4.28 1.101 75.2% 0.000 0.405 0.005Loss Cost 2009.2 5.71 +/‐ 4.11 1.097 71.6% 0.000 0.395 0.008Loss Cost 2010.1 5.41 +/‐ 4.20 1.087 65.8% 0.000 0.450 0.013Loss Cost 2010.2 5.26 +/‐ 4.35 1.072 58.2% 0.000 0.546 0.019Loss Cost 2011.1 5.28 +/‐ 4.57 1.079 52.4% 0.000 0.548 0.024Loss Cost 2011.2 5.29 +/‐ 4.75 1.032 40.2% 0.000 0.834 0.029Loss Cost 2012.1 5.00 +/‐ 5.02 1.224 36.7% 0.000 0.516 0.046Loss Cost 2012.2 5.00 +/‐ 5.02 NA 27.4% 0.000 0.046Loss Cost 2013.1 6.37 +/‐ 5.82 NA 35.6% 0.000 0.031Loss Cost 2013.2 4.65 +/‐ 6.58 NA 16.5% 0.000 0.134
Severity 1998.2 1.96 +/‐ 1.11 1.137 67.4% 0.000 0.066 0.001Severity 1999.1 1.69 +/‐ 1.15 1.161 65.9% 0.000 0.035 0.005Severity 1999.2 1.51 +/‐ 1.21 1.177 64.2% 0.000 0.025 0.016Severity 2000.1 1.36 +/‐ 1.29 1.190 62.6% 0.000 0.021 0.038Severity 2000.2 1.25 +/‐ 1.38 1.199 61.0% 0.000 0.020 0.073Severity 2001.1 1.46 +/‐ 1.47 1.182 61.7% 0.000 0.036 0.051Severity 2001.2 1.73 +/‐ 1.56 1.160 62.8% 0.000 0.066 0.030Severity 2002.1 1.93 +/‐ 1.68 1.145 62.9% 0.000 0.103 0.024Severity 2002.2 2.12 +/‐ 1.82 1.132 62.6% 0.000 0.149 0.022Severity 2003.1 2.21 +/‐ 1.97 1.126 61.5% 0.000 0.185 0.028Severity 2003.2 1.95 +/‐ 2.12 1.143 58.8% 0.000 0.152 0.068Severity 2004.1 1.77 +/‐ 2.30 1.155 56.3% 0.000 0.141 0.123Severity 2004.2 1.99 +/‐ 2.51 1.141 55.9% 0.000 0.194 0.111Severity 2005.1 3.26 +/‐ 2.32 1.069 68.6% 0.000 0.446 0.007Severity 2005.2 3.25 +/‐ 2.53 1.070 66.3% 0.000 0.464 0.013Severity 2006.1 3.36 +/‐ 2.77 1.064 64.3% 0.000 0.518 0.018Severity 2006.2 3.57 +/‐ 3.01 1.055 62.8% 0.000 0.592 0.021Severity 2007.1 3.54 +/‐ 3.28 1.056 59.6% 0.000 0.602 0.033Severity 2007.2 2.83 +/‐ 3.36 1.082 54.4% 0.000 0.450 0.090Severity 2008.1 2.62 +/‐ 3.60 1.089 49.5% 0.000 0.431 0.139Severity 2008.2 2.03 +/‐ 3.68 1.102 42.4% 0.000 0.364 0.256Severity 2009.1 1.59 +/‐ 3.78 1.108 34.3% 0.000 0.342 0.382Severity 2009.2 1.00 +/‐ 3.66 1.104 23.4% 0.000 0.332 0.567Severity 2010.1 0.50 +/‐ 3.42 1.086 9.2% 0.000 0.386 0.759Severity 2010.2 0.46 +/‐ 3.60 1.082 2.8% 0.000 0.432 0.786Severity 2011.1 0.40 +/‐ 3.73 1.060 ‐7.6% 0.000 0.590 0.820Severity 2011.2 0.40 +/‐ 3.92 1.041 ‐14.5% 0.000 0.759 0.827Severity 2012.1 0.50 +/‐ 4.23 0.977 ‐19.1% 0.000 0.931 0.796Severity 2012.2 0.50 +/‐ 4.23 NA ‐9.2% 0.000 0.796Severity 2013.1 2.71 +/‐ 3.95 NA 12.9% 0.000 0.149Severity 2013.2 2.35 +/‐ 4.87 NA 2.8% 0.000 0.294
Frequency 1998.2 ‐4.62 +/‐ 1.25 1.600 57.1% 0.000 0.000 0.000Frequency 1999.1 ‐4.64 +/‐ 1.33 1.602 54.6% 0.000 0.000 0.000Frequency 1999.2 ‐4.76 +/‐ 1.42 1.617 53.3% 0.000 0.000 0.000Frequency 2000.1 ‐4.50 +/‐ 1.50 1.585 48.3% 0.000 0.000 0.000Frequency 2000.2 ‐4.44 +/‐ 1.61 1.577 44.8% 0.000 0.000 0.000Frequency 2001.1 ‐3.86 +/‐ 1.63 1.513 39.0% 0.000 0.000 0.000Frequency 2001.2 ‐3.59 +/‐ 1.74 1.484 34.5% 0.000 0.000 0.000Frequency 2002.1 ‐3.06 +/‐ 1.81 1.432 29.8% 0.000 0.000 0.002Frequency 2002.2 ‐2.69 +/‐ 1.92 1.397 26.6% 0.000 0.001 0.009Frequency 2003.1 ‐1.91 +/‐ 1.92 1.330 26.3% 0.000 0.003 0.053Frequency 2003.2 ‐1.17 +/‐ 1.93 1.272 29.4% 0.000 0.009 0.226Frequency 2004.1 ‐0.62 +/‐ 2.02 1.232 32.8% 0.000 0.021 0.537Frequency 2004.2 ‐0.40 +/‐ 2.20 1.217 33.5% 0.000 0.036 0.712Frequency 2005.1 0.25 +/‐ 2.29 1.177 38.9% 0.000 0.077 0.824Frequency 2005.2 0.69 +/‐ 2.46 1.151 41.5% 0.000 0.132 0.564Frequency 2006.1 1.48 +/‐ 2.51 1.110 49.1% 0.000 0.246 0.230Frequency 2006.2 1.96 +/‐ 2.67 1.088 51.5% 0.000 0.357 0.139Frequency 2007.1 2.79 +/‐ 2.69 1.054 59.1% 0.000 0.548 0.040Frequency 2007.2 3.66 +/‐ 2.61 1.023 67.5% 0.000 0.778 0.008Frequency 2008.1 4.67 +/‐ 2.27 0.994 79.2% 0.000 0.930 0.000Frequency 2008.2 4.61 +/‐ 2.43 0.995 76.2% 0.000 0.947 0.001Frequency 2009.1 4.73 +/‐ 2.59 0.994 74.1% 0.000 0.934 0.001Frequency 2009.2 4.66 +/‐ 2.73 0.994 69.9% 0.000 0.932 0.002Frequency 2010.1 4.89 +/‐ 2.78 1.001 70.6% 0.000 0.987 0.002Frequency 2010.2 4.78 +/‐ 2.87 0.991 64.5% 0.000 0.903 0.003Frequency 2011.1 4.87 +/‐ 2.89 1.018 65.7% 0.000 0.824 0.003Frequency 2011.2 4.87 +/‐ 3.01 0.992 57.7% 0.000 0.931 0.004Frequency 2012.1 4.47 +/‐ 2.92 1.253 63.5% 0.001 0.227 0.006Frequency 2012.2 4.47 +/‐ 2.92 NA 50.3% 0.000 0.006Frequency 2013.1 3.56 +/‐ 3.23 NA 35.2% 0.000 0.032Frequency 2013.2 2.25 +/‐ 3.37 NA 13.6% 0.000 0.159
Coverage = AB Med Expenses
End Trend Period = 2018.1
Scalar Level Change Start Date = 2012‐04‐01
Seasonality = F
Excluded Points = NA
Appendix E Page 21

AB Med Expenses
Fit Start Date Trend Conf Int.
Level Change
Value Adj R^
P‐Value:
(Intercept)
P‐Value:
Scalar Level
P‐Value:
Seasonality P‐Value: Time
Loss Cost 1998.2 ‐2.62 +/‐ 2.14 1.681 35.3% 0.000 0.000 0.065 0.019
Loss Cost 1999.1 ‐2.97 +/‐ 2.24 1.727 36.9% 0.000 0.000 0.049 0.012Loss Cost 1999.2 ‐3.11 +/‐ 2.39 1.745 36.9% 0.000 0.000 0.062 0.014Loss Cost 2000.1 ‐3.01 +/‐ 2.55 1.732 36.1% 0.000 0.000 0.075 0.024Loss Cost 2000.2 ‐2.81 +/‐ 2.72 1.709 36.3% 0.000 0.001 0.071 0.046Loss Cost 2001.1 ‐2.01 +/‐ 2.76 1.619 38.2% 0.000 0.002 0.116 0.152Loss Cost 2001.2 ‐1.17 +/‐ 2.81 1.534 43.6% 0.000 0.004 0.053 0.404Loss Cost 2002.1 ‐0.46 +/‐ 2.88 1.469 47.0% 0.000 0.009 0.086 0.748Loss Cost 2002.2 0.41 +/‐ 2.91 1.398 53.1% 0.000 0.017 0.036 0.777Loss Cost 2003.1 1.18 +/‐ 2.93 1.343 58.0% 0.000 0.030 0.061 0.414Loss Cost 2003.2 1.96 +/‐ 2.97 1.292 62.7% 0.000 0.050 0.026 0.182Loss Cost 2004.1 2.26 +/‐ 3.12 1.276 63.2% 0.000 0.067 0.039 0.145Loss Cost 2004.2 2.96 +/‐ 3.16 1.241 66.7% 0.000 0.094 0.018 0.061Loss Cost 2005.1 4.18 +/‐ 2.55 1.196 80.4% 0.000 0.075 0.020 0.002Loss Cost 2005.2 4.74 +/‐ 2.51 1.179 82.6% 0.000 0.084 0.007 0.001Loss Cost 2006.1 5.17 +/‐ 2.46 1.174 84.7% 0.000 0.079 0.012 0.000Loss Cost 2006.2 5.75 +/‐ 2.22 1.172 88.4% 0.000 0.050 0.002 0.000Loss Cost 2007.1 6.01 +/‐ 2.17 1.181 89.5% 0.000 0.035 0.003 0.000Loss Cost 2007.2 6.27 +/‐ 2.11 1.194 90.0% 0.000 0.021 0.001 0.000Loss Cost 2008.1 6.45 +/‐ 1.96 1.224 91.7% 0.000 0.007 0.002 0.000Loss Cost 2008.2 6.44 +/‐ 2.04 1.220 89.5% 0.000 0.012 0.004 0.000Loss Cost 2009.1 6.42 +/‐ 2.08 1.196 87.8% 0.000 0.034 0.004 0.000Loss Cost 2009.2 6.41 +/‐ 2.16 1.175 83.2% 0.000 0.102 0.007 0.000Loss Cost 2010.1 6.56 +/‐ 2.18 1.023 80.2% 0.000 0.888 0.005 0.000Loss Cost 2010.2 6.56 +/‐ 2.18 NA 76.9% 0.000 0.005 0.000Loss Cost 2011.1 6.17 +/‐ 2.43 NA 75.1% 0.000 0.005 0.000Loss Cost 2011.2 6.06 +/‐ 2.86 NA 67.9% 0.000 0.010 0.001Loss Cost 2012.1 5.70 +/‐ 3.30 NA 65.6% 0.000 0.012 0.003Loss Cost 2012.2 5.70 +/‐ 4.03 NA 56.2% 0.000 0.022 0.009Loss Cost 2013.1 6.37 +/‐ 4.81 NA 57.7% 0.000 0.044 0.014Loss Cost 2013.2 5.49 +/‐ 5.94 NA 38.1% 0.000 0.092 0.059
Severity 1998.2 1.17 +/‐ 1.15 1.251 72.9% 0.000 0.002 0.275 0.046Severity 1999.1 0.79 +/‐ 1.14 1.287 73.5% 0.000 0.000 0.146 0.169Severity 1999.2 0.58 +/‐ 1.20 1.307 72.6% 0.000 0.000 0.210 0.334Severity 2000.1 0.32 +/‐ 1.24 1.331 72.4% 0.000 0.000 0.147 0.599Severity 2000.2 0.20 +/‐ 1.32 1.342 71.3% 0.000 0.000 0.189 0.759Severity 2001.1 0.32 +/‐ 1.40 1.332 71.4% 0.000 0.000 0.230 0.648Severity 2001.2 0.60 +/‐ 1.47 1.308 72.6% 0.000 0.001 0.160 0.411Severity 2002.1 0.68 +/‐ 1.56 1.302 72.3% 0.000 0.001 0.190 0.379Severity 2002.2 0.87 +/‐ 1.66 1.288 72.2% 0.000 0.002 0.159 0.293Severity 2003.1 0.83 +/‐ 1.77 1.290 71.3% 0.000 0.003 0.166 0.340Severity 2003.2 0.64 +/‐ 1.87 1.303 69.3% 0.000 0.003 0.223 0.484Severity 2004.1 0.43 +/‐ 1.95 1.315 68.0% 0.000 0.002 0.184 0.652Severity 2004.2 0.67 +/‐ 2.04 1.302 68.3% 0.000 0.004 0.145 0.506Severity 2005.1 1.40 +/‐ 1.72 1.273 79.6% 0.000 0.001 0.253 0.105Severity 2005.2 1.43 +/‐ 1.82 1.272 78.1% 0.000 0.002 0.260 0.115Severity 2006.1 1.46 +/‐ 1.91 1.272 76.7% 0.000 0.002 0.292 0.124Severity 2006.2 1.64 +/‐ 1.96 1.271 76.5% 0.000 0.003 0.226 0.095Severity 2007.1 1.64 +/‐ 2.04 1.271 74.4% 0.000 0.004 0.248 0.108Severity 2007.2 1.48 +/‐ 2.07 1.262 69.7% 0.000 0.005 0.355 0.147Severity 2008.1 1.48 +/‐ 2.15 1.261 66.0% 0.000 0.007 0.375 0.162Severity 2008.2 1.44 +/‐ 2.22 1.251 58.0% 0.000 0.013 0.448 0.187Severity 2009.1 1.43 +/‐ 2.30 1.238 49.1% 0.000 0.030 0.431 0.203Severity 2009.2 1.42 +/‐ 2.38 1.208 30.1% 0.000 0.098 0.514 0.218Severity 2010.1 1.60 +/‐ 2.39 1.014 5.5% 0.000 0.939 0.315 0.168Severity 2010.2 1.60 +/‐ 2.39 NA 5.8% 0.000 0.315 0.168Severity 2011.1 1.05 +/‐ 2.59 NA 3.2% 0.000 0.220 0.394Severity 2011.2 0.92 +/‐ 3.05 NA ‐3.4% 0.000 0.279 0.517Severity 2012.1 0.43 +/‐ 3.48 NA ‐2.9% 0.000 0.236 0.791Severity 2012.2 0.85 +/‐ 4.22 NA ‐2.2% 0.000 0.226 0.656Severity 2013.1 2.71 +/‐ 4.06 NA 11.2% 0.000 0.390 0.157Severity 2013.2 2.65 +/‐ 5.22 NA ‐2.1% 0.000 0.460 0.264
Frequency 1998.2 ‐3.74 +/‐ 1.77 1.344 35.1% 0.000 0.010 0.120 0.000Frequency 1999.1 ‐3.73 +/‐ 1.89 1.342 31.2% 0.000 0.012 0.132 0.000Frequency 1999.2 ‐3.66 +/‐ 2.02 1.335 28.7% 0.000 0.017 0.133 0.001Frequency 2000.1 ‐3.32 +/‐ 2.12 1.302 21.1% 0.000 0.032 0.183 0.004Frequency 2000.2 ‐3.00 +/‐ 2.26 1.273 17.5% 0.000 0.053 0.146 0.012Frequency 2001.1 ‐2.32 +/‐ 2.28 1.216 7.7% 0.000 0.105 0.230 0.049Frequency 2001.2 ‐1.76 +/‐ 2.36 1.173 5.4% 0.000 0.184 0.141 0.142Frequency 2002.1 ‐1.13 +/‐ 2.40 1.129 ‐0.8% 0.000 0.299 0.219 0.346Frequency 2002.2 ‐0.46 +/‐ 2.45 1.086 1.7% 0.000 0.470 0.114 0.706Frequency 2003.1 0.34 +/‐ 2.38 1.041 2.3% 0.000 0.707 0.191 0.768Frequency 2003.2 1.31 +/‐ 2.19 0.992 18.7% 0.000 0.932 0.045 0.227Frequency 2004.1 1.82 +/‐ 2.20 0.970 24.5% 0.000 0.741 0.075 0.097Frequency 2004.2 2.28 +/‐ 2.24 0.953 31.2% 0.000 0.589 0.039 0.044Frequency 2005.1 2.75 +/‐ 2.22 0.940 38.2% 0.000 0.468 0.067 0.016Frequency 2005.2 3.27 +/‐ 2.15 0.927 48.0% 0.000 0.351 0.024 0.004Frequency 2006.1 3.66 +/‐ 2.09 0.923 55.3% 0.000 0.298 0.042 0.001Frequency 2006.2 4.05 +/‐ 2.00 0.922 62.6% 0.000 0.260 0.014 0.000Frequency 2007.1 4.31 +/‐ 1.93 0.929 67.8% 0.000 0.280 0.025 0.000Frequency 2007.2 4.72 +/‐ 1.52 0.946 81.8% 0.000 0.292 0.001 0.000Frequency 2008.1 4.90 +/‐ 1.23 0.970 88.7% 0.000 0.481 0.001 0.000Frequency 2008.2 4.93 +/‐ 1.28 0.975 87.2% 0.000 0.578 0.001 0.000Frequency 2009.1 4.92 +/‐ 1.31 0.966 86.1% 0.000 0.492 0.002 0.000Frequency 2009.2 4.92 +/‐ 1.37 0.973 83.8% 0.000 0.649 0.002 0.000Frequency 2010.1 4.89 +/‐ 1.43 1.008 83.0% 0.000 0.938 0.007 0.000Frequency 2010.2 4.89 +/‐ 1.43 NA 80.3% 0.000 0.007 0.000Frequency 2011.1 5.08 +/‐ 1.62 NA 79.8% 0.000 0.013 0.000Frequency 2011.2 5.09 +/‐ 1.91 NA 74.5% 0.000 0.021 0.000Frequency 2012.1 5.25 +/‐ 2.24 NA 73.0% 0.000 0.037 0.000Frequency 2012.2 4.81 +/‐ 2.63 NA 61.9% 0.000 0.075 0.002Frequency 2013.1 3.56 +/‐ 2.30 NA 68.4% 0.000 0.012 0.007Frequency 2013.2 2.78 +/‐ 2.61 NA 52.6% 0.000 0.028 0.038
Coverage = AB Med Expenses
End Trend Period = 2018.1
Scalar Level Change Start Date = 2010‐04‐28
Seasonality = T
Excluded Points = NA
Appendix E Page 22

AB Med Expenses
Fit Start Date Trend Conf Int.
Level Change
Value Adj R^
P‐Value:
(Intercept)
P‐Value:
Scalar Level P‐Value: Time
Loss Cost 1998.2 ‐2.73 +/‐ 2.21 1.697 30.7% 0.000 0.000 0.018
Loss Cost 1999.1 ‐2.99 +/‐ 2.33 1.731 31.4% 0.000 0.000 0.015Loss Cost 1999.2 ‐3.24 +/‐ 2.47 1.764 32.0% 0.000 0.000 0.013Loss Cost 2000.1 ‐3.03 +/‐ 2.63 1.737 31.6% 0.000 0.001 0.027Loss Cost 2000.2 ‐2.97 +/‐ 2.81 1.730 31.5% 0.000 0.001 0.042Loss Cost 2001.1 ‐2.04 +/‐ 2.83 1.624 35.1% 0.000 0.002 0.156Loss Cost 2001.2 ‐1.36 +/‐ 2.93 1.555 38.0% 0.000 0.005 0.355Loss Cost 2002.1 ‐0.50 +/‐ 2.98 1.476 43.2% 0.000 0.010 0.735Loss Cost 2002.2 0.18 +/‐ 3.08 1.420 46.9% 0.000 0.019 0.906Loss Cost 2003.1 1.12 +/‐ 3.07 1.351 53.8% 0.000 0.034 0.459Loss Cost 2003.2 1.70 +/‐ 3.19 1.313 56.4% 0.000 0.053 0.279Loss Cost 2004.1 2.17 +/‐ 3.33 1.287 57.9% 0.000 0.075 0.187Loss Cost 2004.2 2.65 +/‐ 3.46 1.263 59.4% 0.000 0.100 0.122Loss Cost 2005.1 4.08 +/‐ 2.81 1.207 76.1% 0.000 0.088 0.005Loss Cost 2005.2 4.45 +/‐ 2.88 1.197 76.7% 0.000 0.102 0.003Loss Cost 2006.1 5.04 +/‐ 2.78 1.188 80.1% 0.000 0.096 0.001Loss Cost 2006.2 5.44 +/‐ 2.76 1.188 81.7% 0.000 0.086 0.000Loss Cost 2007.1 5.84 +/‐ 2.66 1.198 84.0% 0.000 0.059 0.000Loss Cost 2007.2 5.97 +/‐ 2.73 1.206 82.9% 0.000 0.056 0.000Loss Cost 2008.1 6.26 +/‐ 2.51 1.246 86.1% 0.000 0.018 0.000Loss Cost 2008.2 6.19 +/‐ 2.56 1.225 83.1% 0.000 0.035 0.000Loss Cost 2009.1 6.20 +/‐ 2.66 1.229 79.7% 0.000 0.052 0.000Loss Cost 2009.2 6.20 +/‐ 2.69 1.167 73.3% 0.000 0.204 0.000Loss Cost 2010.1 6.20 +/‐ 2.82 1.170 65.8% 0.000 0.441 0.000Loss Cost 2010.2 6.20 +/‐ 2.82 NA 60.1% 0.000 0.000Loss Cost 2011.1 6.17 +/‐ 3.25 NA 54.7% 0.000 0.001Loss Cost 2011.2 5.56 +/‐ 3.66 NA 44.9% 0.000 0.005Loss Cost 2012.1 5.70 +/‐ 4.32 NA 39.8% 0.000 0.012Loss Cost 2012.2 5.00 +/‐ 5.02 NA 27.4% 0.000 0.046Loss Cost 2013.1 6.37 +/‐ 5.82 NA 35.6% 0.000 0.031Loss Cost 2013.2 4.65 +/‐ 6.58 NA 16.5% 0.000 0.134
Severity 1998.2 1.13 +/‐ 1.15 1.255 72.7% 0.000 0.002 0.052Severity 1999.1 0.78 +/‐ 1.16 1.288 72.6% 0.000 0.000 0.179Severity 1999.2 0.53 +/‐ 1.20 1.312 72.1% 0.000 0.000 0.375Severity 2000.1 0.32 +/‐ 1.26 1.332 71.4% 0.000 0.000 0.614Severity 2000.2 0.15 +/‐ 1.33 1.347 70.6% 0.000 0.000 0.825Severity 2001.1 0.31 +/‐ 1.41 1.333 70.9% 0.000 0.000 0.661Severity 2001.2 0.53 +/‐ 1.49 1.315 71.6% 0.000 0.001 0.474Severity 2002.1 0.66 +/‐ 1.58 1.304 71.5% 0.000 0.001 0.396Severity 2002.2 0.78 +/‐ 1.68 1.296 71.2% 0.000 0.002 0.349Severity 2003.1 0.81 +/‐ 1.80 1.294 70.2% 0.000 0.003 0.363Severity 2003.2 0.56 +/‐ 1.88 1.310 68.6% 0.000 0.002 0.547Severity 2004.1 0.40 +/‐ 1.97 1.319 66.9% 0.000 0.002 0.683Severity 2004.2 0.55 +/‐ 2.08 1.311 66.7% 0.000 0.003 0.592Severity 2005.1 1.36 +/‐ 1.73 1.277 79.3% 0.000 0.001 0.115Severity 2005.2 1.35 +/‐ 1.82 1.278 77.7% 0.000 0.002 0.137Severity 2006.1 1.42 +/‐ 1.91 1.276 76.6% 0.000 0.002 0.135Severity 2006.2 1.54 +/‐ 1.97 1.277 75.9% 0.000 0.002 0.117Severity 2007.1 1.58 +/‐ 2.06 1.278 73.9% 0.000 0.003 0.122Severity 2007.2 1.41 +/‐ 2.05 1.266 69.9% 0.000 0.004 0.164Severity 2008.1 1.43 +/‐ 2.13 1.268 66.3% 0.000 0.005 0.173Severity 2008.2 1.38 +/‐ 2.18 1.253 59.0% 0.000 0.011 0.198Severity 2009.1 1.37 +/‐ 2.26 1.247 50.2% 0.000 0.023 0.214Severity 2009.2 1.37 +/‐ 2.32 1.206 32.6% 0.000 0.094 0.223Severity 2010.1 1.48 +/‐ 2.36 1.064 4.9% 0.000 0.725 0.198Severity 2010.2 1.48 +/‐ 2.36 NA 5.2% 0.000 0.198Severity 2011.1 1.05 +/‐ 2.64 NA ‐1.9% 0.000 0.405Severity 2011.2 0.73 +/‐ 3.03 NA ‐5.9% 0.000 0.609Severity 2012.1 0.43 +/‐ 3.53 NA ‐8.4% 0.000 0.795Severity 2012.2 0.50 +/‐ 4.23 NA ‐9.2% 0.000 0.796Severity 2013.1 2.71 +/‐ 3.95 NA 12.9% 0.000 0.149Severity 2013.2 2.35 +/‐ 4.87 NA 2.8% 0.000 0.294
Frequency 1998.2 ‐3.82 +/‐ 1.80 1.352 32.4% 0.000 0.009 0.000Frequency 1999.1 ‐3.74 +/‐ 1.92 1.344 28.6% 0.000 0.013 0.000Frequency 1999.2 ‐3.75 +/‐ 2.05 1.345 25.9% 0.000 0.016 0.001Frequency 2000.1 ‐3.33 +/‐ 2.15 1.304 19.1% 0.000 0.032 0.004Frequency 2000.2 ‐3.11 +/‐ 2.29 1.284 14.4% 0.000 0.050 0.010Frequency 2001.1 ‐2.33 +/‐ 2.29 1.218 6.3% 0.000 0.104 0.048Frequency 2001.2 ‐1.88 +/‐ 2.40 1.183 1.5% 0.000 0.169 0.124Frequency 2002.1 ‐1.16 +/‐ 2.42 1.132 ‐2.7% 0.000 0.293 0.340Frequency 2002.2 ‐0.60 +/‐ 2.50 1.096 ‐3.9% 0.000 0.432 0.630Frequency 2003.1 0.31 +/‐ 2.41 1.044 ‐0.5% 0.000 0.687 0.793Frequency 2003.2 1.14 +/‐ 2.31 1.003 8.4% 0.000 0.977 0.318Frequency 2004.1 1.77 +/‐ 2.29 0.975 17.4% 0.000 0.794 0.122Frequency 2004.2 2.10 +/‐ 2.38 0.963 20.8% 0.000 0.695 0.079Frequency 2005.1 2.68 +/‐ 2.33 0.945 31.3% 0.000 0.535 0.024Frequency 2005.2 3.06 +/‐ 2.35 0.937 36.9% 0.000 0.463 0.012Frequency 2006.1 3.57 +/‐ 2.24 0.931 47.7% 0.000 0.383 0.003Frequency 2006.2 3.84 +/‐ 2.26 0.931 51.4% 0.000 0.377 0.002Frequency 2007.1 4.20 +/‐ 2.14 0.938 59.9% 0.000 0.395 0.000Frequency 2007.2 4.50 +/‐ 1.98 0.953 68.2% 0.000 0.486 0.000Frequency 2008.1 4.77 +/‐ 1.66 0.983 79.3% 0.000 0.761 0.000Frequency 2008.2 4.75 +/‐ 1.72 0.978 76.3% 0.000 0.720 0.000Frequency 2009.1 4.76 +/‐ 1.78 0.985 74.1% 0.000 0.828 0.000Frequency 2009.2 4.76 +/‐ 1.83 0.967 70.2% 0.000 0.686 0.000Frequency 2010.1 4.65 +/‐ 1.82 1.099 71.6% 0.000 0.477 0.000Frequency 2010.2 4.65 +/‐ 1.82 NA 67.0% 0.000 0.000Frequency 2011.1 5.08 +/‐ 2.02 NA 68.2% 0.000 0.000Frequency 2011.2 4.80 +/‐ 2.31 NA 61.2% 0.000 0.001Frequency 2012.1 5.25 +/‐ 2.65 NA 61.3% 0.000 0.001Frequency 2012.2 4.47 +/‐ 2.92 NA 50.3% 0.000 0.006Frequency 2013.1 3.56 +/‐ 3.23 NA 35.2% 0.000 0.032Frequency 2013.2 2.25 +/‐ 3.37 NA 13.6% 0.000 0.159
Coverage = AB Med Expenses
End Trend Period = 2018.1
Scalar Level Change Start Date = 2010‐04‐28
Seasonality = F
Excluded Points = NA
Appendix E Page 23
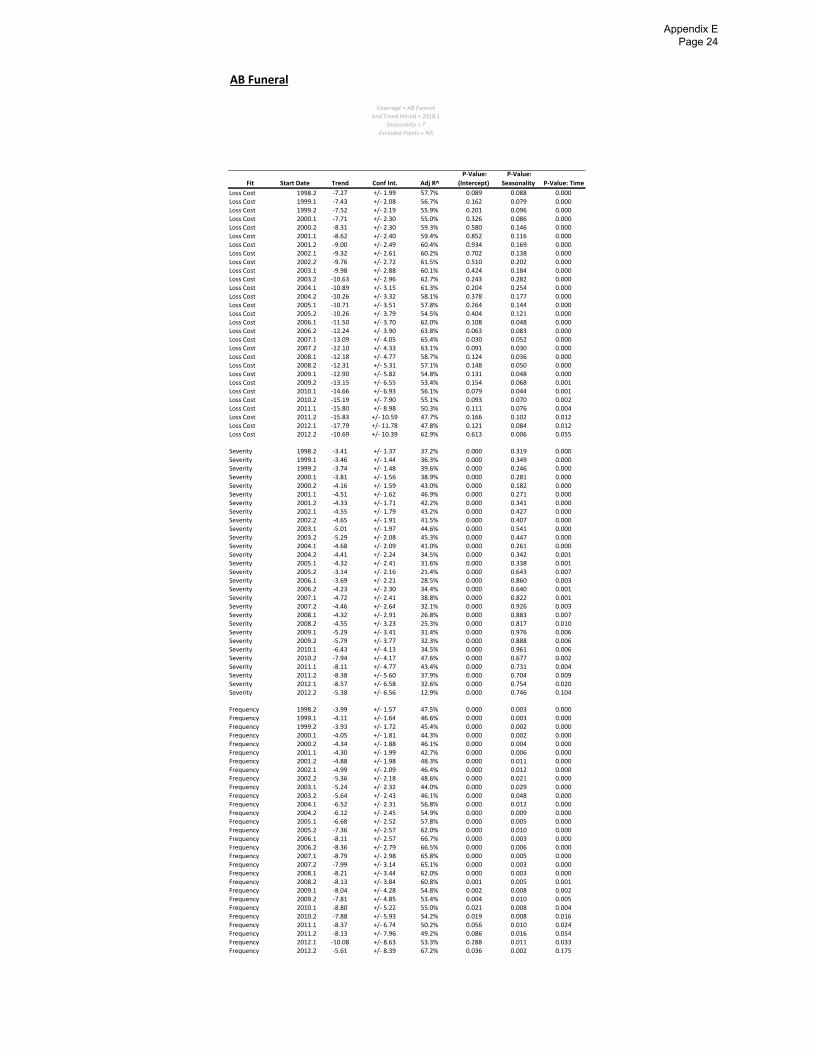
AB Funeral
Fit Start Date Trend Conf Int. Adj R^
P‐Value:
(Intercept)
P‐Value:
Seasonality P‐Value: Time
Loss Cost 1998.2 ‐7.27 +/‐ 1.99 57.7% 0.089 0.088 0.000Loss Cost 1999.1 ‐7.43 +/‐ 2.08 56.7% 0.162 0.079 0.000Loss Cost 1999.2 ‐7.52 +/‐ 2.19 55.9% 0.201 0.096 0.000Loss Cost 2000.1 ‐7.71 +/‐ 2.30 55.0% 0.326 0.086 0.000Loss Cost 2000.2 ‐8.31 +/‐ 2.30 59.3% 0.580 0.146 0.000Loss Cost 2001.1 ‐8.62 +/‐ 2.40 59.4% 0.852 0.116 0.000Loss Cost 2001.2 ‐9.00 +/‐ 2.49 60.4% 0.934 0.169 0.000Loss Cost 2002.1 ‐9.32 +/‐ 2.61 60.2% 0.702 0.138 0.000Loss Cost 2002.2 ‐9.76 +/‐ 2.72 61.5% 0.510 0.202 0.000Loss Cost 2003.1 ‐9.98 +/‐ 2.88 60.1% 0.424 0.184 0.000Loss Cost 2003.2 ‐10.63 +/‐ 2.96 62.7% 0.243 0.282 0.000Loss Cost 2004.1 ‐10.89 +/‐ 3.15 61.3% 0.204 0.254 0.000Loss Cost 2004.2 ‐10.26 +/‐ 3.32 58.1% 0.378 0.177 0.000Loss Cost 2005.1 ‐10.71 +/‐ 3.51 57.8% 0.264 0.144 0.000Loss Cost 2005.2 ‐10.26 +/‐ 3.79 54.5% 0.404 0.121 0.000Loss Cost 2006.1 ‐11.50 +/‐ 3.70 62.0% 0.108 0.048 0.000Loss Cost 2006.2 ‐12.24 +/‐ 3.90 63.8% 0.063 0.083 0.000Loss Cost 2007.1 ‐13.09 +/‐ 4.05 65.4% 0.030 0.052 0.000Loss Cost 2007.2 ‐12.10 +/‐ 4.33 63.1% 0.091 0.030 0.000Loss Cost 2008.1 ‐12.18 +/‐ 4.77 58.7% 0.124 0.036 0.000Loss Cost 2008.2 ‐12.31 +/‐ 5.31 57.1% 0.148 0.050 0.000Loss Cost 2009.1 ‐12.90 +/‐ 5.82 54.8% 0.131 0.048 0.000Loss Cost 2009.2 ‐13.15 +/‐ 6.55 53.4% 0.154 0.068 0.001Loss Cost 2010.1 ‐14.66 +/‐ 6.93 56.1% 0.079 0.044 0.001Loss Cost 2010.2 ‐15.19 +/‐ 7.90 55.1% 0.093 0.070 0.002Loss Cost 2011.1 ‐15.80 +/‐ 8.98 50.3% 0.111 0.076 0.004Loss Cost 2011.2 ‐15.83 +/‐ 10.59 47.7% 0.166 0.102 0.012Loss Cost 2012.1 ‐17.79 +/‐ 11.78 47.8% 0.121 0.084 0.012Loss Cost 2012.2 ‐10.69 +/‐ 10.39 62.9% 0.613 0.006 0.055
Severity 1998.2 ‐3.41 +/‐ 1.37 37.2% 0.000 0.319 0.000Severity 1999.1 ‐3.46 +/‐ 1.44 36.3% 0.000 0.349 0.000Severity 1999.2 ‐3.74 +/‐ 1.48 39.6% 0.000 0.246 0.000Severity 2000.1 ‐3.81 +/‐ 1.56 38.9% 0.000 0.281 0.000Severity 2000.2 ‐4.16 +/‐ 1.59 43.0% 0.000 0.182 0.000Severity 2001.1 ‐4.51 +/‐ 1.62 46.9% 0.000 0.271 0.000Severity 2001.2 ‐4.33 +/‐ 1.71 42.2% 0.000 0.341 0.000Severity 2002.1 ‐4.55 +/‐ 1.79 43.2% 0.000 0.427 0.000Severity 2002.2 ‐4.65 +/‐ 1.91 41.5% 0.000 0.407 0.000Severity 2003.1 ‐5.01 +/‐ 1.97 44.6% 0.000 0.541 0.000Severity 2003.2 ‐5.29 +/‐ 2.08 45.3% 0.000 0.447 0.000Severity 2004.1 ‐4.68 +/‐ 2.09 41.0% 0.000 0.261 0.000Severity 2004.2 ‐4.41 +/‐ 2.24 34.5% 0.000 0.342 0.001Severity 2005.1 ‐4.32 +/‐ 2.41 31.6% 0.000 0.338 0.001Severity 2005.2 ‐3.14 +/‐ 2.16 21.4% 0.000 0.643 0.007Severity 2006.1 ‐3.69 +/‐ 2.21 28.5% 0.000 0.860 0.003Severity 2006.2 ‐4.23 +/‐ 2.30 34.4% 0.000 0.640 0.001Severity 2007.1 ‐4.72 +/‐ 2.41 38.8% 0.000 0.822 0.001Severity 2007.2 ‐4.46 +/‐ 2.64 32.1% 0.000 0.926 0.003Severity 2008.1 ‐4.32 +/‐ 2.91 26.8% 0.000 0.883 0.007Severity 2008.2 ‐4.55 +/‐ 3.23 25.3% 0.000 0.817 0.010Severity 2009.1 ‐5.29 +/‐ 3.41 31.4% 0.000 0.976 0.006Severity 2009.2 ‐5.79 +/‐ 3.77 32.3% 0.000 0.888 0.006Severity 2010.1 ‐6.43 +/‐ 4.13 34.5% 0.000 0.961 0.006Severity 2010.2 ‐7.94 +/‐ 4.17 47.6% 0.000 0.677 0.002Severity 2011.1 ‐8.11 +/‐ 4.77 43.4% 0.000 0.731 0.004Severity 2011.2 ‐8.38 +/‐ 5.60 37.9% 0.000 0.704 0.009Severity 2012.1 ‐8.57 +/‐ 6.58 32.6% 0.000 0.754 0.020Severity 2012.2 ‐5.38 +/‐ 6.56 12.9% 0.000 0.746 0.104
Frequency 1998.2 ‐3.99 +/‐ 1.57 47.5% 0.000 0.003 0.000Frequency 1999.1 ‐4.11 +/‐ 1.64 46.6% 0.000 0.003 0.000Frequency 1999.2 ‐3.93 +/‐ 1.72 45.4% 0.000 0.002 0.000Frequency 2000.1 ‐4.05 +/‐ 1.81 44.3% 0.000 0.002 0.000Frequency 2000.2 ‐4.34 +/‐ 1.88 46.1% 0.000 0.004 0.000Frequency 2001.1 ‐4.30 +/‐ 1.99 42.7% 0.000 0.006 0.000Frequency 2001.2 ‐4.88 +/‐ 1.98 48.3% 0.000 0.011 0.000Frequency 2002.1 ‐4.99 +/‐ 2.09 46.4% 0.000 0.012 0.000Frequency 2002.2 ‐5.36 +/‐ 2.18 48.6% 0.000 0.021 0.000Frequency 2003.1 ‐5.24 +/‐ 2.32 44.0% 0.000 0.029 0.000Frequency 2003.2 ‐5.64 +/‐ 2.43 46.1% 0.000 0.048 0.000Frequency 2004.1 ‐6.52 +/‐ 2.31 56.8% 0.000 0.012 0.000Frequency 2004.2 ‐6.12 +/‐ 2.45 54.9% 0.000 0.009 0.000Frequency 2005.1 ‐6.68 +/‐ 2.52 57.8% 0.000 0.005 0.000Frequency 2005.2 ‐7.36 +/‐ 2.57 62.0% 0.000 0.010 0.000Frequency 2006.1 ‐8.11 +/‐ 2.57 66.7% 0.000 0.003 0.000Frequency 2006.2 ‐8.36 +/‐ 2.79 66.5% 0.000 0.006 0.000Frequency 2007.1 ‐8.79 +/‐ 2.98 65.8% 0.000 0.005 0.000Frequency 2007.2 ‐7.99 +/‐ 3.14 65.1% 0.000 0.003 0.000Frequency 2008.1 ‐8.21 +/‐ 3.44 62.0% 0.000 0.003 0.000Frequency 2008.2 ‐8.13 +/‐ 3.84 60.8% 0.001 0.005 0.001Frequency 2009.1 ‐8.04 +/‐ 4.28 54.8% 0.002 0.008 0.002Frequency 2009.2 ‐7.81 +/‐ 4.85 53.4% 0.004 0.010 0.005Frequency 2010.1 ‐8.80 +/‐ 5.22 55.0% 0.021 0.008 0.004Frequency 2010.2 ‐7.88 +/‐ 5.93 54.2% 0.019 0.008 0.016Frequency 2011.1 ‐8.37 +/‐ 6.74 50.2% 0.056 0.010 0.024Frequency 2011.2 ‐8.13 +/‐ 7.96 49.2% 0.086 0.016 0.054Frequency 2012.1 ‐10.08 +/‐ 8.63 53.3% 0.288 0.011 0.033Frequency 2012.2 ‐5.61 +/‐ 8.39 67.2% 0.036 0.002 0.175
Coverage = AB Funeral
End Trend Period = 2018.1
Seasonality = T
Excluded Points = NA
Appendix E Page 24
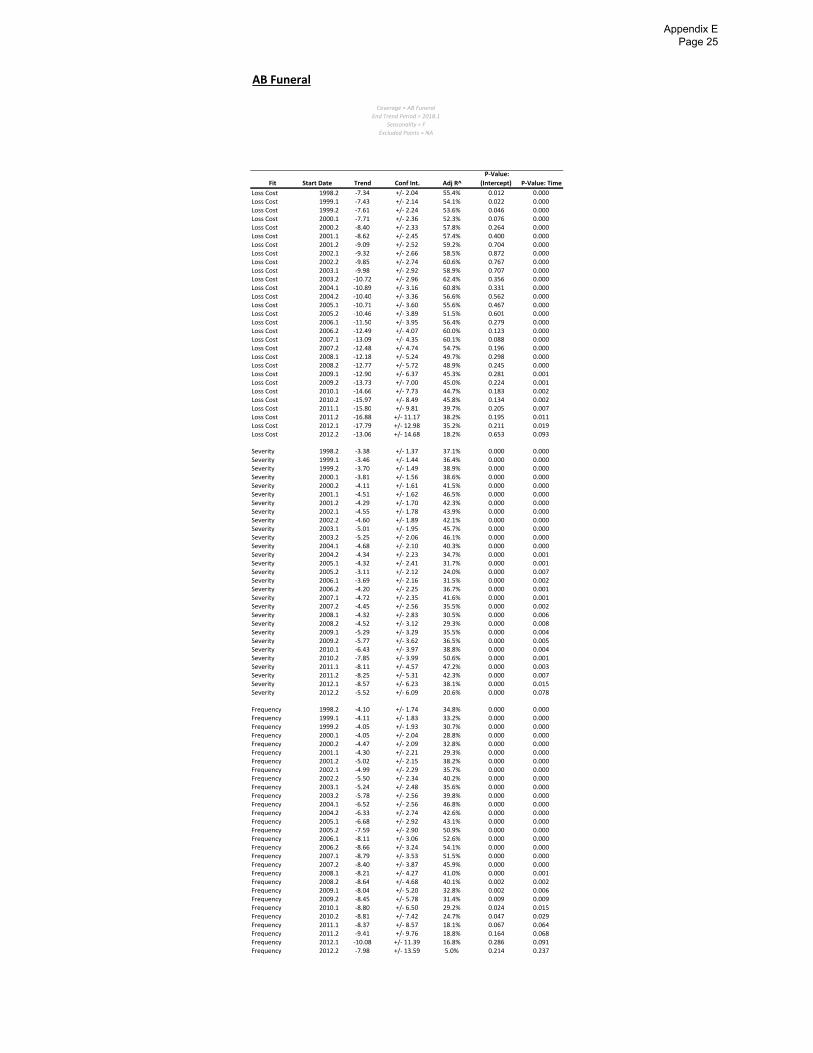
AB Funeral
Fit Start Date Trend Conf Int. Adj R^
P‐Value:
(Intercept) P‐Value: Time
Loss Cost 1998.2 ‐7.34 +/‐ 2.04 55.4% 0.012 0.000Loss Cost 1999.1 ‐7.43 +/‐ 2.14 54.1% 0.022 0.000Loss Cost 1999.2 ‐7.61 +/‐ 2.24 53.6% 0.046 0.000Loss Cost 2000.1 ‐7.71 +/‐ 2.36 52.3% 0.076 0.000Loss Cost 2000.2 ‐8.40 +/‐ 2.33 57.8% 0.264 0.000Loss Cost 2001.1 ‐8.62 +/‐ 2.45 57.4% 0.400 0.000Loss Cost 2001.2 ‐9.09 +/‐ 2.52 59.2% 0.704 0.000Loss Cost 2002.1 ‐9.32 +/‐ 2.66 58.5% 0.872 0.000Loss Cost 2002.2 ‐9.85 +/‐ 2.74 60.6% 0.767 0.000Loss Cost 2003.1 ‐9.98 +/‐ 2.92 58.9% 0.707 0.000Loss Cost 2003.2 ‐10.72 +/‐ 2.96 62.4% 0.356 0.000Loss Cost 2004.1 ‐10.89 +/‐ 3.16 60.8% 0.331 0.000Loss Cost 2004.2 ‐10.40 +/‐ 3.36 56.6% 0.562 0.000Loss Cost 2005.1 ‐10.71 +/‐ 3.60 55.6% 0.467 0.000Loss Cost 2005.2 ‐10.46 +/‐ 3.89 51.5% 0.601 0.000Loss Cost 2006.1 ‐11.50 +/‐ 3.95 56.4% 0.279 0.000Loss Cost 2006.2 ‐12.49 +/‐ 4.07 60.0% 0.123 0.000Loss Cost 2007.1 ‐13.09 +/‐ 4.35 60.1% 0.088 0.000Loss Cost 2007.2 ‐12.48 +/‐ 4.74 54.7% 0.196 0.000Loss Cost 2008.1 ‐12.18 +/‐ 5.24 49.7% 0.298 0.000Loss Cost 2008.2 ‐12.77 +/‐ 5.72 48.9% 0.245 0.000Loss Cost 2009.1 ‐12.90 +/‐ 6.37 45.3% 0.281 0.001Loss Cost 2009.2 ‐13.73 +/‐ 7.00 45.0% 0.224 0.001Loss Cost 2010.1 ‐14.66 +/‐ 7.73 44.7% 0.183 0.002Loss Cost 2010.2 ‐15.97 +/‐ 8.49 45.8% 0.134 0.002Loss Cost 2011.1 ‐15.80 +/‐ 9.81 39.7% 0.205 0.007Loss Cost 2011.2 ‐16.88 +/‐ 11.17 38.2% 0.195 0.011Loss Cost 2012.1 ‐17.79 +/‐ 12.98 35.2% 0.211 0.019Loss Cost 2012.2 ‐13.06 +/‐ 14.68 18.2% 0.653 0.093
Severity 1998.2 ‐3.38 +/‐ 1.37 37.1% 0.000 0.000Severity 1999.1 ‐3.46 +/‐ 1.44 36.4% 0.000 0.000Severity 1999.2 ‐3.70 +/‐ 1.49 38.9% 0.000 0.000Severity 2000.1 ‐3.81 +/‐ 1.56 38.6% 0.000 0.000Severity 2000.2 ‐4.11 +/‐ 1.61 41.5% 0.000 0.000Severity 2001.1 ‐4.51 +/‐ 1.62 46.5% 0.000 0.000Severity 2001.2 ‐4.29 +/‐ 1.70 42.3% 0.000 0.000Severity 2002.1 ‐4.55 +/‐ 1.78 43.9% 0.000 0.000Severity 2002.2 ‐4.60 +/‐ 1.89 42.1% 0.000 0.000Severity 2003.1 ‐5.01 +/‐ 1.95 45.7% 0.000 0.000Severity 2003.2 ‐5.25 +/‐ 2.06 46.1% 0.000 0.000Severity 2004.1 ‐4.68 +/‐ 2.10 40.3% 0.000 0.000Severity 2004.2 ‐4.34 +/‐ 2.23 34.7% 0.000 0.001Severity 2005.1 ‐4.32 +/‐ 2.41 31.7% 0.000 0.001Severity 2005.2 ‐3.11 +/‐ 2.12 24.0% 0.000 0.007Severity 2006.1 ‐3.69 +/‐ 2.16 31.5% 0.000 0.002Severity 2006.2 ‐4.20 +/‐ 2.25 36.7% 0.000 0.001Severity 2007.1 ‐4.72 +/‐ 2.35 41.6% 0.000 0.001Severity 2007.2 ‐4.45 +/‐ 2.56 35.5% 0.000 0.002Severity 2008.1 ‐4.32 +/‐ 2.83 30.5% 0.000 0.006Severity 2008.2 ‐4.52 +/‐ 3.12 29.3% 0.000 0.008Severity 2009.1 ‐5.29 +/‐ 3.29 35.5% 0.000 0.004Severity 2009.2 ‐5.77 +/‐ 3.62 36.5% 0.000 0.005Severity 2010.1 ‐6.43 +/‐ 3.97 38.8% 0.000 0.004Severity 2010.2 ‐7.85 +/‐ 3.99 50.6% 0.000 0.001Severity 2011.1 ‐8.11 +/‐ 4.57 47.2% 0.000 0.003Severity 2011.2 ‐8.25 +/‐ 5.31 42.3% 0.000 0.007Severity 2012.1 ‐8.57 +/‐ 6.23 38.1% 0.000 0.015Severity 2012.2 ‐5.52 +/‐ 6.09 20.6% 0.000 0.078
Frequency 1998.2 ‐4.10 +/‐ 1.74 34.8% 0.000 0.000Frequency 1999.1 ‐4.11 +/‐ 1.83 33.2% 0.000 0.000Frequency 1999.2 ‐4.05 +/‐ 1.93 30.7% 0.000 0.000Frequency 2000.1 ‐4.05 +/‐ 2.04 28.8% 0.000 0.000Frequency 2000.2 ‐4.47 +/‐ 2.09 32.8% 0.000 0.000Frequency 2001.1 ‐4.30 +/‐ 2.21 29.3% 0.000 0.000Frequency 2001.2 ‐5.02 +/‐ 2.15 38.2% 0.000 0.000Frequency 2002.1 ‐4.99 +/‐ 2.29 35.7% 0.000 0.000Frequency 2002.2 ‐5.50 +/‐ 2.34 40.2% 0.000 0.000Frequency 2003.1 ‐5.24 +/‐ 2.48 35.6% 0.000 0.000Frequency 2003.2 ‐5.78 +/‐ 2.56 39.8% 0.000 0.000Frequency 2004.1 ‐6.52 +/‐ 2.56 46.8% 0.000 0.000Frequency 2004.2 ‐6.33 +/‐ 2.74 42.6% 0.000 0.000Frequency 2005.1 ‐6.68 +/‐ 2.92 43.1% 0.000 0.000Frequency 2005.2 ‐7.59 +/‐ 2.90 50.9% 0.000 0.000Frequency 2006.1 ‐8.11 +/‐ 3.06 52.6% 0.000 0.000Frequency 2006.2 ‐8.66 +/‐ 3.24 54.1% 0.000 0.000Frequency 2007.1 ‐8.79 +/‐ 3.53 51.5% 0.000 0.000Frequency 2007.2 ‐8.40 +/‐ 3.87 45.9% 0.000 0.000Frequency 2008.1 ‐8.21 +/‐ 4.27 41.0% 0.000 0.001Frequency 2008.2 ‐8.64 +/‐ 4.68 40.1% 0.002 0.002Frequency 2009.1 ‐8.04 +/‐ 5.20 32.8% 0.002 0.006Frequency 2009.2 ‐8.45 +/‐ 5.78 31.4% 0.009 0.009Frequency 2010.1 ‐8.80 +/‐ 6.50 29.2% 0.024 0.015Frequency 2010.2 ‐8.81 +/‐ 7.42 24.7% 0.047 0.029Frequency 2011.1 ‐8.37 +/‐ 8.57 18.1% 0.067 0.064Frequency 2011.2 ‐9.41 +/‐ 9.76 18.8% 0.164 0.068Frequency 2012.1 ‐10.08 +/‐ 11.39 16.8% 0.286 0.091Frequency 2012.2 ‐7.98 +/‐ 13.59 5.0% 0.214 0.237
Coverage = AB Funeral
End Trend Period = 2018.1
Seasonality = F
Excluded Points = NA
Appendix E Page 25
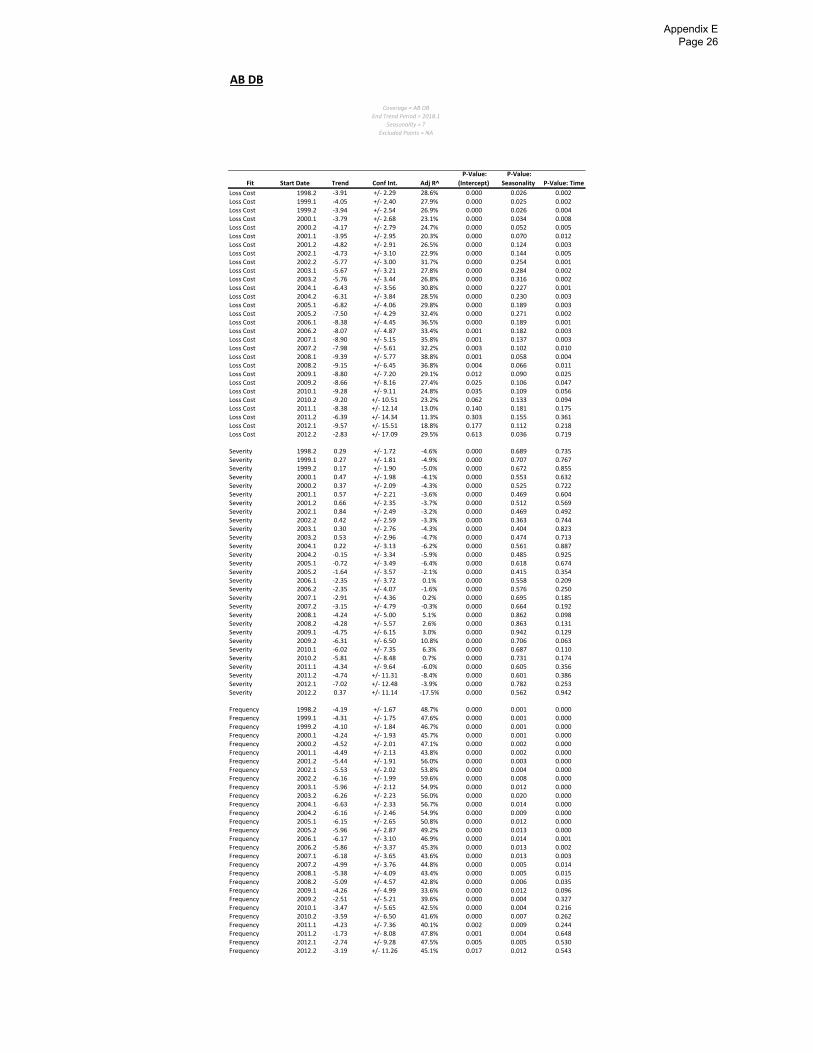
AB DB
Fit Start Date Trend Conf Int. Adj R^
P‐Value:
(Intercept)
P‐Value:
Seasonality P‐Value: Time
Loss Cost 1998.2 ‐3.91 +/‐ 2.29 28.6% 0.000 0.026 0.002Loss Cost 1999.1 ‐4.05 +/‐ 2.40 27.9% 0.000 0.025 0.002Loss Cost 1999.2 ‐3.94 +/‐ 2.54 26.9% 0.000 0.026 0.004Loss Cost 2000.1 ‐3.79 +/‐ 2.68 23.1% 0.000 0.034 0.008Loss Cost 2000.2 ‐4.17 +/‐ 2.79 24.7% 0.000 0.052 0.005Loss Cost 2001.1 ‐3.95 +/‐ 2.95 20.3% 0.000 0.070 0.012Loss Cost 2001.2 ‐4.82 +/‐ 2.91 26.5% 0.000 0.124 0.003Loss Cost 2002.1 ‐4.73 +/‐ 3.10 22.9% 0.000 0.144 0.005Loss Cost 2002.2 ‐5.77 +/‐ 3.00 31.7% 0.000 0.254 0.001Loss Cost 2003.1 ‐5.67 +/‐ 3.21 27.8% 0.000 0.284 0.002Loss Cost 2003.2 ‐5.76 +/‐ 3.44 26.8% 0.000 0.316 0.002Loss Cost 2004.1 ‐6.43 +/‐ 3.56 30.8% 0.000 0.227 0.001Loss Cost 2004.2 ‐6.31 +/‐ 3.84 28.5% 0.000 0.230 0.003Loss Cost 2005.1 ‐6.82 +/‐ 4.06 29.8% 0.000 0.189 0.003Loss Cost 2005.2 ‐7.50 +/‐ 4.29 32.4% 0.000 0.271 0.002Loss Cost 2006.1 ‐8.38 +/‐ 4.45 36.5% 0.000 0.189 0.001Loss Cost 2006.2 ‐8.07 +/‐ 4.87 33.4% 0.001 0.182 0.003Loss Cost 2007.1 ‐8.90 +/‐ 5.15 35.8% 0.001 0.137 0.003Loss Cost 2007.2 ‐7.98 +/‐ 5.61 32.2% 0.003 0.102 0.010Loss Cost 2008.1 ‐9.39 +/‐ 5.77 38.8% 0.001 0.058 0.004Loss Cost 2008.2 ‐9.15 +/‐ 6.45 36.8% 0.004 0.066 0.011Loss Cost 2009.1 ‐8.80 +/‐ 7.20 29.1% 0.012 0.090 0.025Loss Cost 2009.2 ‐8.66 +/‐ 8.16 27.4% 0.025 0.106 0.047Loss Cost 2010.1 ‐9.28 +/‐ 9.11 24.8% 0.035 0.109 0.056Loss Cost 2010.2 ‐9.20 +/‐ 10.51 23.2% 0.062 0.133 0.094Loss Cost 2011.1 ‐8.38 +/‐ 12.14 13.0% 0.140 0.181 0.175Loss Cost 2011.2 ‐6.39 +/‐ 14.34 11.3% 0.303 0.155 0.361Loss Cost 2012.1 ‐9.57 +/‐ 15.51 18.8% 0.177 0.112 0.218Loss Cost 2012.2 ‐2.83 +/‐ 17.09 29.5% 0.613 0.036 0.719
Severity 1998.2 0.29 +/‐ 1.72 ‐4.6% 0.000 0.689 0.735Severity 1999.1 0.27 +/‐ 1.81 ‐4.9% 0.000 0.707 0.767Severity 1999.2 0.17 +/‐ 1.90 ‐5.0% 0.000 0.672 0.855Severity 2000.1 0.47 +/‐ 1.98 ‐4.1% 0.000 0.553 0.632Severity 2000.2 0.37 +/‐ 2.09 ‐4.3% 0.000 0.525 0.722Severity 2001.1 0.57 +/‐ 2.21 ‐3.6% 0.000 0.469 0.604Severity 2001.2 0.66 +/‐ 2.35 ‐3.7% 0.000 0.512 0.569Severity 2002.1 0.84 +/‐ 2.49 ‐3.2% 0.000 0.469 0.492Severity 2002.2 0.42 +/‐ 2.59 ‐3.3% 0.000 0.363 0.744Severity 2003.1 0.30 +/‐ 2.76 ‐4.3% 0.000 0.404 0.823Severity 2003.2 0.53 +/‐ 2.96 ‐4.7% 0.000 0.474 0.713Severity 2004.1 0.22 +/‐ 3.13 ‐6.2% 0.000 0.561 0.887Severity 2004.2 ‐0.15 +/‐ 3.34 ‐5.9% 0.000 0.485 0.925Severity 2005.1 ‐0.72 +/‐ 3.49 ‐6.4% 0.000 0.618 0.674Severity 2005.2 ‐1.64 +/‐ 3.57 ‐2.1% 0.000 0.415 0.354Severity 2006.1 ‐2.35 +/‐ 3.72 0.1% 0.000 0.558 0.209Severity 2006.2 ‐2.35 +/‐ 4.07 ‐1.6% 0.000 0.576 0.250Severity 2007.1 ‐2.91 +/‐ 4.36 0.2% 0.000 0.695 0.185Severity 2007.2 ‐3.15 +/‐ 4.79 ‐0.3% 0.000 0.664 0.192Severity 2008.1 ‐4.24 +/‐ 5.00 5.1% 0.000 0.862 0.098Severity 2008.2 ‐4.28 +/‐ 5.57 2.6% 0.000 0.863 0.131Severity 2009.1 ‐4.75 +/‐ 6.15 3.0% 0.000 0.942 0.129Severity 2009.2 ‐6.31 +/‐ 6.50 10.8% 0.000 0.706 0.063Severity 2010.1 ‐6.02 +/‐ 7.35 6.3% 0.000 0.687 0.110Severity 2010.2 ‐5.81 +/‐ 8.48 0.7% 0.000 0.731 0.174Severity 2011.1 ‐4.34 +/‐ 9.64 ‐6.0% 0.000 0.605 0.356Severity 2011.2 ‐4.74 +/‐ 11.31 ‐8.4% 0.000 0.601 0.386Severity 2012.1 ‐7.02 +/‐ 12.48 ‐3.9% 0.000 0.782 0.253Severity 2012.2 0.37 +/‐ 11.14 ‐17.5% 0.000 0.562 0.942
Frequency 1998.2 ‐4.19 +/‐ 1.67 48.7% 0.000 0.001 0.000Frequency 1999.1 ‐4.31 +/‐ 1.75 47.6% 0.000 0.001 0.000Frequency 1999.2 ‐4.10 +/‐ 1.84 46.7% 0.000 0.001 0.000Frequency 2000.1 ‐4.24 +/‐ 1.93 45.7% 0.000 0.001 0.000Frequency 2000.2 ‐4.52 +/‐ 2.01 47.1% 0.000 0.002 0.000Frequency 2001.1 ‐4.49 +/‐ 2.13 43.8% 0.000 0.002 0.000Frequency 2001.2 ‐5.44 +/‐ 1.91 56.0% 0.000 0.003 0.000Frequency 2002.1 ‐5.53 +/‐ 2.02 53.8% 0.000 0.004 0.000Frequency 2002.2 ‐6.16 +/‐ 1.99 59.6% 0.000 0.008 0.000Frequency 2003.1 ‐5.96 +/‐ 2.12 54.9% 0.000 0.012 0.000Frequency 2003.2 ‐6.26 +/‐ 2.23 56.0% 0.000 0.020 0.000Frequency 2004.1 ‐6.63 +/‐ 2.33 56.7% 0.000 0.014 0.000Frequency 2004.2 ‐6.16 +/‐ 2.46 54.9% 0.000 0.009 0.000Frequency 2005.1 ‐6.15 +/‐ 2.65 50.8% 0.000 0.012 0.000Frequency 2005.2 ‐5.96 +/‐ 2.87 49.2% 0.000 0.013 0.000Frequency 2006.1 ‐6.17 +/‐ 3.10 46.9% 0.000 0.014 0.001Frequency 2006.2 ‐5.86 +/‐ 3.37 45.3% 0.000 0.013 0.002Frequency 2007.1 ‐6.18 +/‐ 3.65 43.6% 0.000 0.013 0.003Frequency 2007.2 ‐4.99 +/‐ 3.76 44.8% 0.000 0.005 0.014Frequency 2008.1 ‐5.38 +/‐ 4.09 43.4% 0.000 0.005 0.015Frequency 2008.2 ‐5.09 +/‐ 4.57 42.8% 0.000 0.006 0.035Frequency 2009.1 ‐4.26 +/‐ 4.99 33.6% 0.000 0.012 0.096Frequency 2009.2 ‐2.51 +/‐ 5.21 39.6% 0.000 0.004 0.327Frequency 2010.1 ‐3.47 +/‐ 5.65 42.5% 0.000 0.004 0.216Frequency 2010.2 ‐3.59 +/‐ 6.50 41.6% 0.000 0.007 0.262Frequency 2011.1 ‐4.23 +/‐ 7.36 40.1% 0.002 0.009 0.244Frequency 2011.2 ‐1.73 +/‐ 8.08 47.8% 0.001 0.004 0.648Frequency 2012.1 ‐2.74 +/‐ 9.28 47.5% 0.005 0.005 0.530Frequency 2012.2 ‐3.19 +/‐ 11.26 45.1% 0.017 0.012 0.543
Coverage = AB DB
End Trend Period = 2018.1
Seasonality = T
Excluded Points = NA
Appendix E Page 26
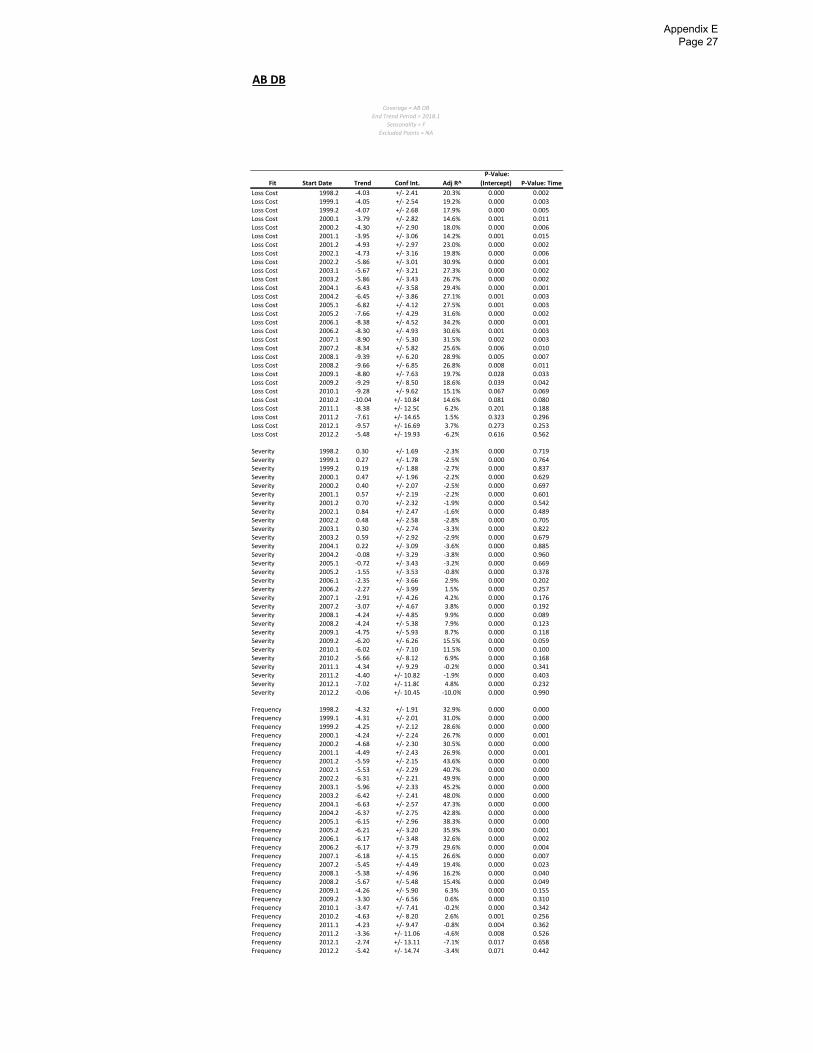
AB DB
Fit Start Date Trend Conf Int. Adj R^
P‐Value:
(Intercept) P‐Value: Time
Loss Cost 1998.2 ‐4.03 +/‐ 2.41 20.3% 0.000 0.002Loss Cost 1999.1 ‐4.05 +/‐ 2.54 19.2% 0.000 0.003Loss Cost 1999.2 ‐4.07 +/‐ 2.68 17.9% 0.000 0.005Loss Cost 2000.1 ‐3.79 +/‐ 2.82 14.6% 0.001 0.011Loss Cost 2000.2 ‐4.30 +/‐ 2.90 18.0% 0.000 0.006Loss Cost 2001.1 ‐3.95 +/‐ 3.06 14.2% 0.001 0.015Loss Cost 2001.2 ‐4.93 +/‐ 2.97 23.0% 0.000 0.002Loss Cost 2002.1 ‐4.73 +/‐ 3.16 19.8% 0.000 0.006Loss Cost 2002.2 ‐5.86 +/‐ 3.01 30.9% 0.000 0.001Loss Cost 2003.1 ‐5.67 +/‐ 3.21 27.3% 0.000 0.002Loss Cost 2003.2 ‐5.86 +/‐ 3.43 26.7% 0.000 0.002Loss Cost 2004.1 ‐6.43 +/‐ 3.58 29.4% 0.000 0.001Loss Cost 2004.2 ‐6.45 +/‐ 3.86 27.1% 0.001 0.003Loss Cost 2005.1 ‐6.82 +/‐ 4.12 27.5% 0.001 0.003Loss Cost 2005.2 ‐7.66 +/‐ 4.29 31.6% 0.000 0.002Loss Cost 2006.1 ‐8.38 +/‐ 4.52 34.2% 0.000 0.001Loss Cost 2006.2 ‐8.30 +/‐ 4.93 30.6% 0.001 0.003Loss Cost 2007.1 ‐8.90 +/‐ 5.30 31.5% 0.002 0.003Loss Cost 2007.2 ‐8.34 +/‐ 5.82 25.6% 0.006 0.010Loss Cost 2008.1 ‐9.39 +/‐ 6.20 28.9% 0.005 0.007Loss Cost 2008.2 ‐9.66 +/‐ 6.85 26.8% 0.008 0.011Loss Cost 2009.1 ‐8.80 +/‐ 7.63 19.7% 0.028 0.033Loss Cost 2009.2 ‐9.29 +/‐ 8.50 18.6% 0.039 0.042Loss Cost 2010.1 ‐9.28 +/‐ 9.62 15.1% 0.067 0.069Loss Cost 2010.2 ‐10.04 +/‐ 10.84 14.6% 0.081 0.080Loss Cost 2011.1 ‐8.38 +/‐ 12.50 6.2% 0.201 0.188Loss Cost 2011.2 ‐7.61 +/‐ 14.65 1.5% 0.323 0.296Loss Cost 2012.1 ‐9.57 +/‐ 16.69 3.7% 0.273 0.253Loss Cost 2012.2 ‐5.48 +/‐ 19.93 ‐6.2% 0.616 0.562
Severity 1998.2 0.30 +/‐ 1.69 ‐2.3% 0.000 0.719Severity 1999.1 0.27 +/‐ 1.78 ‐2.5% 0.000 0.764Severity 1999.2 0.19 +/‐ 1.88 ‐2.7% 0.000 0.837Severity 2000.1 0.47 +/‐ 1.96 ‐2.2% 0.000 0.629Severity 2000.2 0.40 +/‐ 2.07 ‐2.5% 0.000 0.697Severity 2001.1 0.57 +/‐ 2.19 ‐2.2% 0.000 0.601Severity 2001.2 0.70 +/‐ 2.32 ‐1.9% 0.000 0.542Severity 2002.1 0.84 +/‐ 2.47 ‐1.6% 0.000 0.489Severity 2002.2 0.48 +/‐ 2.58 ‐2.8% 0.000 0.705Severity 2003.1 0.30 +/‐ 2.74 ‐3.3% 0.000 0.822Severity 2003.2 0.59 +/‐ 2.92 ‐2.9% 0.000 0.679Severity 2004.1 0.22 +/‐ 3.09 ‐3.6% 0.000 0.885Severity 2004.2 ‐0.08 +/‐ 3.29 ‐3.8% 0.000 0.960Severity 2005.1 ‐0.72 +/‐ 3.43 ‐3.2% 0.000 0.669Severity 2005.2 ‐1.55 +/‐ 3.53 ‐0.8% 0.000 0.378Severity 2006.1 ‐2.35 +/‐ 3.66 2.9% 0.000 0.202Severity 2006.2 ‐2.27 +/‐ 3.99 1.5% 0.000 0.257Severity 2007.1 ‐2.91 +/‐ 4.26 4.2% 0.000 0.176Severity 2007.2 ‐3.07 +/‐ 4.67 3.8% 0.000 0.192Severity 2008.1 ‐4.24 +/‐ 4.85 9.9% 0.000 0.089Severity 2008.2 ‐4.24 +/‐ 5.38 7.9% 0.000 0.123Severity 2009.1 ‐4.75 +/‐ 5.93 8.7% 0.000 0.118Severity 2009.2 ‐6.20 +/‐ 6.26 15.5% 0.000 0.059Severity 2010.1 ‐6.02 +/‐ 7.10 11.5% 0.000 0.100Severity 2010.2 ‐5.66 +/‐ 8.12 6.9% 0.000 0.168Severity 2011.1 ‐4.34 +/‐ 9.29 ‐0.2% 0.000 0.341Severity 2011.2 ‐4.40 +/‐ 10.82 ‐1.9% 0.000 0.403Severity 2012.1 ‐7.02 +/‐ 11.80 4.8% 0.000 0.232Severity 2012.2 ‐0.06 +/‐ 10.45 ‐10.0% 0.000 0.990
Frequency 1998.2 ‐4.32 +/‐ 1.91 32.9% 0.000 0.000Frequency 1999.1 ‐4.31 +/‐ 2.01 31.0% 0.000 0.000Frequency 1999.2 ‐4.25 +/‐ 2.12 28.6% 0.000 0.000Frequency 2000.1 ‐4.24 +/‐ 2.24 26.7% 0.000 0.001Frequency 2000.2 ‐4.68 +/‐ 2.30 30.5% 0.000 0.000Frequency 2001.1 ‐4.49 +/‐ 2.43 26.9% 0.000 0.001Frequency 2001.2 ‐5.59 +/‐ 2.15 43.6% 0.000 0.000Frequency 2002.1 ‐5.53 +/‐ 2.29 40.7% 0.000 0.000Frequency 2002.2 ‐6.31 +/‐ 2.21 49.9% 0.000 0.000Frequency 2003.1 ‐5.96 +/‐ 2.33 45.2% 0.000 0.000Frequency 2003.2 ‐6.42 +/‐ 2.41 48.0% 0.000 0.000Frequency 2004.1 ‐6.63 +/‐ 2.57 47.3% 0.000 0.000Frequency 2004.2 ‐6.37 +/‐ 2.75 42.8% 0.000 0.000Frequency 2005.1 ‐6.15 +/‐ 2.96 38.3% 0.000 0.000Frequency 2005.2 ‐6.21 +/‐ 3.20 35.9% 0.000 0.001Frequency 2006.1 ‐6.17 +/‐ 3.48 32.6% 0.000 0.002Frequency 2006.2 ‐6.17 +/‐ 3.79 29.6% 0.000 0.004Frequency 2007.1 ‐6.18 +/‐ 4.15 26.6% 0.000 0.007Frequency 2007.2 ‐5.45 +/‐ 4.49 19.4% 0.000 0.023Frequency 2008.1 ‐5.38 +/‐ 4.96 16.2% 0.000 0.040Frequency 2008.2 ‐5.67 +/‐ 5.48 15.4% 0.000 0.049Frequency 2009.1 ‐4.26 +/‐ 5.90 6.3% 0.000 0.155Frequency 2009.2 ‐3.30 +/‐ 6.56 0.6% 0.000 0.310Frequency 2010.1 ‐3.47 +/‐ 7.41 ‐0.2% 0.000 0.342Frequency 2010.2 ‐4.63 +/‐ 8.20 2.6% 0.001 0.256Frequency 2011.1 ‐4.23 +/‐ 9.47 ‐0.8% 0.004 0.362Frequency 2011.2 ‐3.36 +/‐ 11.06 ‐4.6% 0.008 0.526Frequency 2012.1 ‐2.74 +/‐ 13.11 ‐7.1% 0.017 0.658Frequency 2012.2 ‐5.42 +/‐ 14.74 ‐3.4% 0.071 0.442
Coverage = AB DB
End Trend Period = 2018.1
Seasonality = F
Excluded Points = NA
Appendix E Page 27
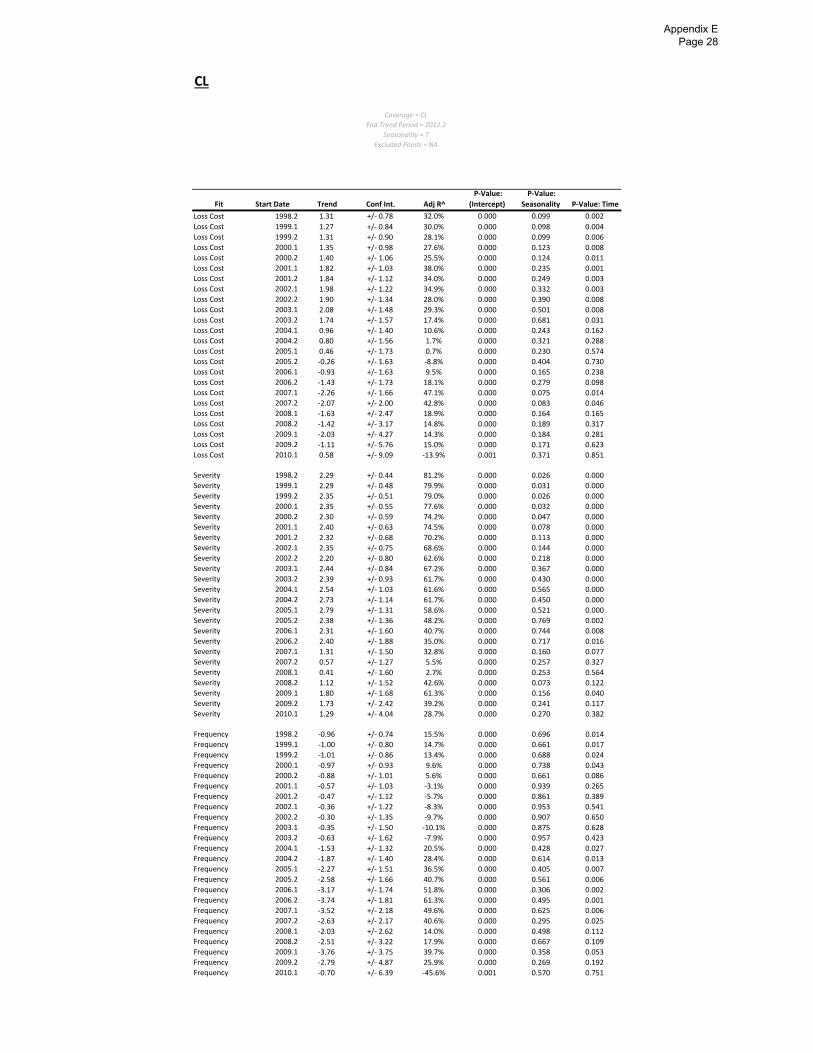
CL
Fit Start Date Trend Conf Int. Adj R^
P‐Value:
(Intercept)
P‐Value:
Seasonality P‐Value: Time
Loss Cost 1998.2 1.31 +/‐ 0.78 32.0% 0.000 0.099 0.002
Loss Cost 1999.1 1.27 +/‐ 0.84 30.0% 0.000 0.098 0.004
Loss Cost 1999.2 1.31 +/‐ 0.90 28.1% 0.000 0.099 0.006
Loss Cost 2000.1 1.35 +/‐ 0.98 27.6% 0.000 0.123 0.008
Loss Cost 2000.2 1.40 +/‐ 1.06 25.5% 0.000 0.124 0.011
Loss Cost 2001.1 1.82 +/‐ 1.03 38.0% 0.000 0.235 0.001
Loss Cost 2001.2 1.84 +/‐ 1.12 34.0% 0.000 0.249 0.003
Loss Cost 2002.1 1.98 +/‐ 1.22 34.9% 0.000 0.332 0.003
Loss Cost 2002.2 1.90 +/‐ 1.34 28.0% 0.000 0.390 0.008
Loss Cost 2003.1 2.08 +/‐ 1.48 29.3% 0.000 0.501 0.008
Loss Cost 2003.2 1.74 +/‐ 1.57 17.4% 0.000 0.681 0.031
Loss Cost 2004.1 0.96 +/‐ 1.40 10.6% 0.000 0.243 0.162
Loss Cost 2004.2 0.80 +/‐ 1.56 1.7% 0.000 0.321 0.288
Loss Cost 2005.1 0.46 +/‐ 1.73 0.7% 0.000 0.230 0.574
Loss Cost 2005.2 ‐0.26 +/‐ 1.63 ‐8.8% 0.000 0.404 0.730
Loss Cost 2006.1 ‐0.93 +/‐ 1.63 9.5% 0.000 0.165 0.238
Loss Cost 2006.2 ‐1.43 +/‐ 1.73 18.1% 0.000 0.279 0.098
Loss Cost 2007.1 ‐2.26 +/‐ 1.66 47.1% 0.000 0.075 0.014
Loss Cost 2007.2 ‐2.07 +/‐ 2.00 42.8% 0.000 0.083 0.046
Loss Cost 2008.1 ‐1.63 +/‐ 2.47 18.9% 0.000 0.164 0.165
Loss Cost 2008.2 ‐1.42 +/‐ 3.17 14.8% 0.000 0.189 0.317
Loss Cost 2009.1 ‐2.03 +/‐ 4.27 14.3% 0.000 0.184 0.281
Loss Cost 2009.2 ‐1.11 +/‐ 5.76 15.0% 0.000 0.171 0.623
Loss Cost 2010.1 0.58 +/‐ 9.09 ‐13.9% 0.001 0.371 0.851
Severity 1998.2 2.29 +/‐ 0.44 81.2% 0.000 0.026 0.000
Severity 1999.1 2.29 +/‐ 0.48 79.9% 0.000 0.031 0.000
Severity 1999.2 2.35 +/‐ 0.51 79.0% 0.000 0.026 0.000
Severity 2000.1 2.35 +/‐ 0.55 77.6% 0.000 0.032 0.000
Severity 2000.2 2.30 +/‐ 0.59 74.2% 0.000 0.047 0.000
Severity 2001.1 2.40 +/‐ 0.63 74.5% 0.000 0.078 0.000
Severity 2001.2 2.32 +/‐ 0.68 70.2% 0.000 0.113 0.000
Severity 2002.1 2.35 +/‐ 0.75 68.6% 0.000 0.144 0.000
Severity 2002.2 2.20 +/‐ 0.80 62.6% 0.000 0.218 0.000
Severity 2003.1 2.44 +/‐ 0.84 67.2% 0.000 0.367 0.000
Severity 2003.2 2.39 +/‐ 0.93 61.7% 0.000 0.430 0.000
Severity 2004.1 2.54 +/‐ 1.03 61.6% 0.000 0.565 0.000
Severity 2004.2 2.73 +/‐ 1.14 61.7% 0.000 0.450 0.000
Severity 2005.1 2.79 +/‐ 1.31 58.6% 0.000 0.521 0.000
Severity 2005.2 2.38 +/‐ 1.36 48.2% 0.000 0.769 0.002
Severity 2006.1 2.31 +/‐ 1.60 40.7% 0.000 0.744 0.008
Severity 2006.2 2.40 +/‐ 1.88 35.0% 0.000 0.717 0.016
Severity 2007.1 1.31 +/‐ 1.50 32.8% 0.000 0.160 0.077
Severity 2007.2 0.57 +/‐ 1.27 5.5% 0.000 0.257 0.327
Severity 2008.1 0.41 +/‐ 1.60 2.7% 0.000 0.253 0.564
Severity 2008.2 1.12 +/‐ 1.52 42.6% 0.000 0.073 0.122
Severity 2009.1 1.80 +/‐ 1.68 61.3% 0.000 0.156 0.040
Severity 2009.2 1.73 +/‐ 2.42 39.2% 0.000 0.241 0.117
Severity 2010.1 1.29 +/‐ 4.04 28.7% 0.000 0.270 0.382
Frequency 1998.2 ‐0.96 +/‐ 0.74 15.5% 0.000 0.696 0.014
Frequency 1999.1 ‐1.00 +/‐ 0.80 14.7% 0.000 0.661 0.017
Frequency 1999.2 ‐1.01 +/‐ 0.86 13.4% 0.000 0.688 0.024
Frequency 2000.1 ‐0.97 +/‐ 0.93 9.6% 0.000 0.738 0.043
Frequency 2000.2 ‐0.88 +/‐ 1.01 5.6% 0.000 0.661 0.086
Frequency 2001.1 ‐0.57 +/‐ 1.03 ‐3.1% 0.000 0.939 0.265
Frequency 2001.2 ‐0.47 +/‐ 1.12 ‐5.7% 0.000 0.861 0.389
Frequency 2002.1 ‐0.36 +/‐ 1.22 ‐8.3% 0.000 0.953 0.541
Frequency 2002.2 ‐0.30 +/‐ 1.35 ‐9.7% 0.000 0.907 0.650
Frequency 2003.1 ‐0.35 +/‐ 1.50 ‐10.1% 0.000 0.875 0.628
Frequency 2003.2 ‐0.63 +/‐ 1.62 ‐7.9% 0.000 0.957 0.423
Frequency 2004.1 ‐1.53 +/‐ 1.32 20.5% 0.000 0.428 0.027
Frequency 2004.2 ‐1.87 +/‐ 1.40 28.4% 0.000 0.614 0.013
Frequency 2005.1 ‐2.27 +/‐ 1.51 36.5% 0.000 0.405 0.007
Frequency 2005.2 ‐2.58 +/‐ 1.66 40.7% 0.000 0.561 0.006
Frequency 2006.1 ‐3.17 +/‐ 1.74 51.8% 0.000 0.306 0.002
Frequency 2006.2 ‐3.74 +/‐ 1.81 61.3% 0.000 0.495 0.001
Frequency 2007.1 ‐3.52 +/‐ 2.18 49.6% 0.000 0.625 0.006
Frequency 2007.2 ‐2.63 +/‐ 2.17 40.6% 0.000 0.295 0.025
Frequency 2008.1 ‐2.03 +/‐ 2.62 14.0% 0.000 0.498 0.112
Frequency 2008.2 ‐2.51 +/‐ 3.22 17.9% 0.000 0.667 0.109
Frequency 2009.1 ‐3.76 +/‐ 3.75 39.7% 0.000 0.358 0.053
Frequency 2009.2 ‐2.79 +/‐ 4.87 25.9% 0.000 0.269 0.192
Frequency 2010.1 ‐0.70 +/‐ 6.39 ‐45.6% 0.001 0.570 0.751
Coverage = CL
End Trend Period = 2012.2
Seasonality = T
Excluded Points = NA
Appendix E Page 28
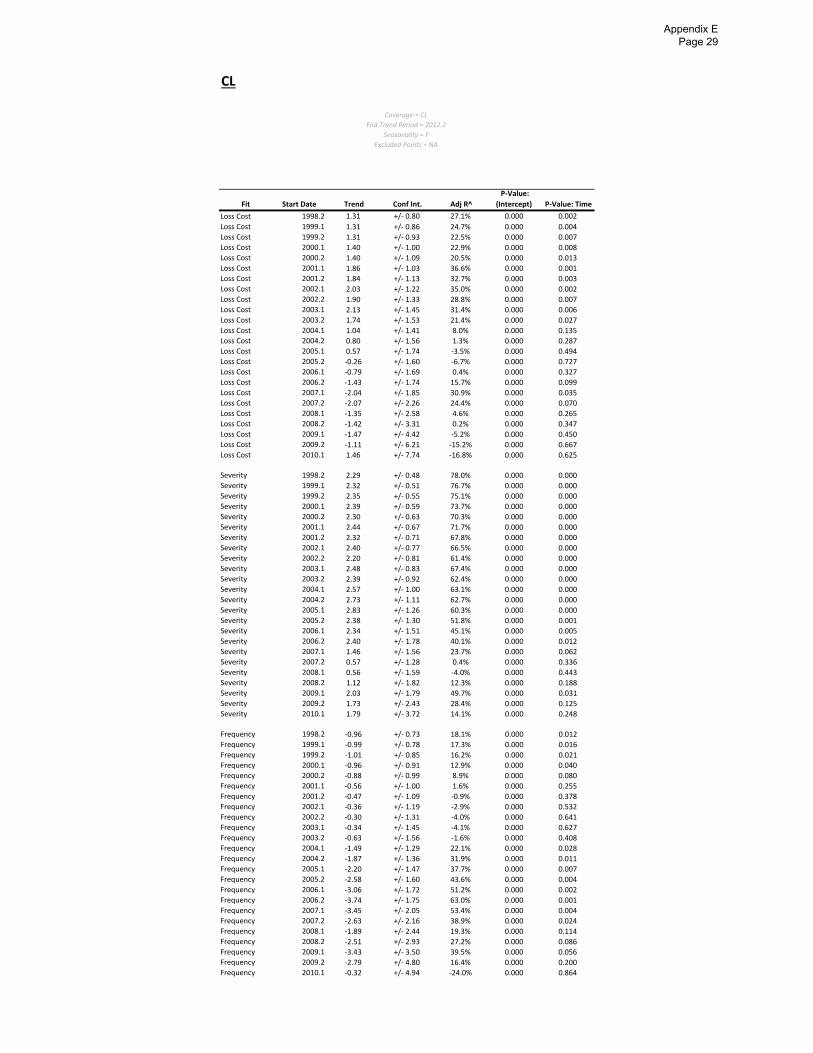
CL
Fit Start Date Trend Conf Int. Adj R^
P‐Value:
(Intercept) P‐Value: Time
Loss Cost 1998.2 1.31 +/‐ 0.80 27.1% 0.000 0.002
Loss Cost 1999.1 1.31 +/‐ 0.86 24.7% 0.000 0.004
Loss Cost 1999.2 1.31 +/‐ 0.93 22.5% 0.000 0.007
Loss Cost 2000.1 1.40 +/‐ 1.00 22.9% 0.000 0.008
Loss Cost 2000.2 1.40 +/‐ 1.09 20.5% 0.000 0.013
Loss Cost 2001.1 1.86 +/‐ 1.03 36.6% 0.000 0.001
Loss Cost 2001.2 1.84 +/‐ 1.13 32.7% 0.000 0.003
Loss Cost 2002.1 2.03 +/‐ 1.22 35.0% 0.000 0.002
Loss Cost 2002.2 1.90 +/‐ 1.33 28.8% 0.000 0.007
Loss Cost 2003.1 2.13 +/‐ 1.45 31.4% 0.000 0.006
Loss Cost 2003.2 1.74 +/‐ 1.53 21.4% 0.000 0.027
Loss Cost 2004.1 1.04 +/‐ 1.41 8.0% 0.000 0.135
Loss Cost 2004.2 0.80 +/‐ 1.56 1.3% 0.000 0.287
Loss Cost 2005.1 0.57 +/‐ 1.74 ‐3.5% 0.000 0.494
Loss Cost 2005.2 ‐0.26 +/‐ 1.60 ‐6.7% 0.000 0.727
Loss Cost 2006.1 ‐0.79 +/‐ 1.69 0.4% 0.000 0.327
Loss Cost 2006.2 ‐1.43 +/‐ 1.74 15.7% 0.000 0.099
Loss Cost 2007.1 ‐2.04 +/‐ 1.85 30.9% 0.000 0.035
Loss Cost 2007.2 ‐2.07 +/‐ 2.26 24.4% 0.000 0.070
Loss Cost 2008.1 ‐1.35 +/‐ 2.58 4.6% 0.000 0.265
Loss Cost 2008.2 ‐1.42 +/‐ 3.31 0.2% 0.000 0.347
Loss Cost 2009.1 ‐1.47 +/‐ 4.42 ‐5.2% 0.000 0.450
Loss Cost 2009.2 ‐1.11 +/‐ 6.21 ‐15.2% 0.000 0.667
Loss Cost 2010.1 1.46 +/‐ 7.74 ‐16.8% 0.000 0.625
Severity 1998.2 2.29 +/‐ 0.48 78.0% 0.000 0.000
Severity 1999.1 2.32 +/‐ 0.51 76.7% 0.000 0.000
Severity 1999.2 2.35 +/‐ 0.55 75.1% 0.000 0.000
Severity 2000.1 2.39 +/‐ 0.59 73.7% 0.000 0.000
Severity 2000.2 2.30 +/‐ 0.63 70.3% 0.000 0.000
Severity 2001.1 2.44 +/‐ 0.67 71.7% 0.000 0.000
Severity 2001.2 2.32 +/‐ 0.71 67.8% 0.000 0.000
Severity 2002.1 2.40 +/‐ 0.77 66.5% 0.000 0.000
Severity 2002.2 2.20 +/‐ 0.81 61.4% 0.000 0.000
Severity 2003.1 2.48 +/‐ 0.83 67.4% 0.000 0.000
Severity 2003.2 2.39 +/‐ 0.92 62.4% 0.000 0.000
Severity 2004.1 2.57 +/‐ 1.00 63.1% 0.000 0.000
Severity 2004.2 2.73 +/‐ 1.11 62.7% 0.000 0.000
Severity 2005.1 2.83 +/‐ 1.26 60.3% 0.000 0.000
Severity 2005.2 2.38 +/‐ 1.30 51.8% 0.000 0.001
Severity 2006.1 2.34 +/‐ 1.51 45.1% 0.000 0.005
Severity 2006.2 2.40 +/‐ 1.78 40.1% 0.000 0.012
Severity 2007.1 1.46 +/‐ 1.56 23.7% 0.000 0.062
Severity 2007.2 0.57 +/‐ 1.28 0.4% 0.000 0.336
Severity 2008.1 0.56 +/‐ 1.59 ‐4.0% 0.000 0.443
Severity 2008.2 1.12 +/‐ 1.82 12.3% 0.000 0.188
Severity 2009.1 2.03 +/‐ 1.79 49.7% 0.000 0.031
Severity 2009.2 1.73 +/‐ 2.43 28.4% 0.000 0.125
Severity 2010.1 1.79 +/‐ 3.72 14.1% 0.000 0.248
Frequency 1998.2 ‐0.96 +/‐ 0.73 18.1% 0.000 0.012
Frequency 1999.1 ‐0.99 +/‐ 0.78 17.3% 0.000 0.016
Frequency 1999.2 ‐1.01 +/‐ 0.85 16.2% 0.000 0.021
Frequency 2000.1 ‐0.96 +/‐ 0.91 12.9% 0.000 0.040
Frequency 2000.2 ‐0.88 +/‐ 0.99 8.9% 0.000 0.080
Frequency 2001.1 ‐0.56 +/‐ 1.00 1.6% 0.000 0.255
Frequency 2001.2 ‐0.47 +/‐ 1.09 ‐0.9% 0.000 0.378
Frequency 2002.1 ‐0.36 +/‐ 1.19 ‐2.9% 0.000 0.532
Frequency 2002.2 ‐0.30 +/‐ 1.31 ‐4.0% 0.000 0.641
Frequency 2003.1 ‐0.34 +/‐ 1.45 ‐4.1% 0.000 0.627
Frequency 2003.2 ‐0.63 +/‐ 1.56 ‐1.6% 0.000 0.408
Frequency 2004.1 ‐1.49 +/‐ 1.29 22.1% 0.000 0.028
Frequency 2004.2 ‐1.87 +/‐ 1.36 31.9% 0.000 0.011
Frequency 2005.1 ‐2.20 +/‐ 1.47 37.7% 0.000 0.007
Frequency 2005.2 ‐2.58 +/‐ 1.60 43.6% 0.000 0.004
Frequency 2006.1 ‐3.06 +/‐ 1.72 51.2% 0.000 0.002
Frequency 2006.2 ‐3.74 +/‐ 1.75 63.0% 0.000 0.001
Frequency 2007.1 ‐3.45 +/‐ 2.05 53.4% 0.000 0.004
Frequency 2007.2 ‐2.63 +/‐ 2.16 38.9% 0.000 0.024
Frequency 2008.1 ‐1.89 +/‐ 2.44 19.3% 0.000 0.114
Frequency 2008.2 ‐2.51 +/‐ 2.93 27.2% 0.000 0.086
Frequency 2009.1 ‐3.43 +/‐ 3.50 39.5% 0.000 0.056
Frequency 2009.2 ‐2.79 +/‐ 4.80 16.4% 0.000 0.200
Frequency 2010.1 ‐0.32 +/‐ 4.94 ‐24.0% 0.000 0.864
Coverage = CL
End Trend Period = 2012.2
Seasonality = F
Excluded Points = NA
Appendix E Page 29
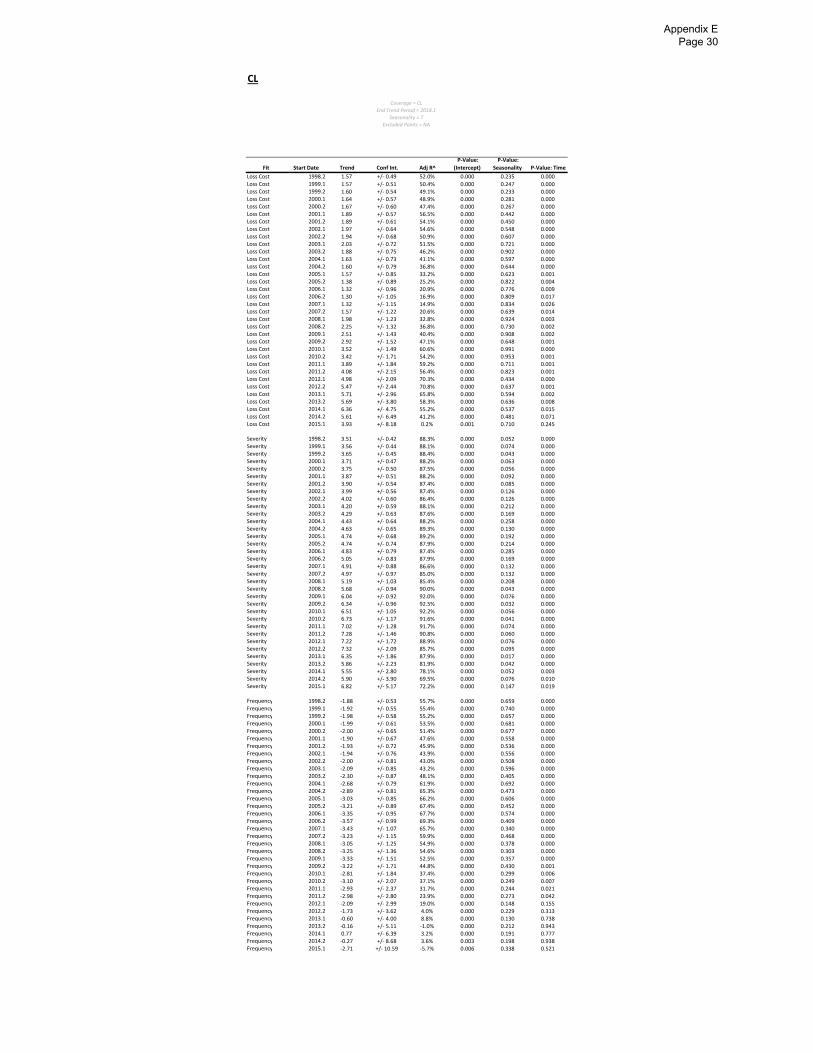
CL
Fit Start Date Trend Conf Int. Adj R^
P‐Value:
(Intercept)
P‐Value:
Seasonality P‐Value: Time
Loss Cost 1998.2 1.57 +/‐ 0.49 52.0% 0.000 0.235 0.000Loss Cost 1999.1 1.57 +/‐ 0.51 50.4% 0.000 0.247 0.000Loss Cost 1999.2 1.60 +/‐ 0.54 49.1% 0.000 0.233 0.000Loss Cost 2000.1 1.64 +/‐ 0.57 48.9% 0.000 0.281 0.000Loss Cost 2000.2 1.67 +/‐ 0.60 47.4% 0.000 0.267 0.000Loss Cost 2001.1 1.89 +/‐ 0.57 56.5% 0.000 0.442 0.000Loss Cost 2001.2 1.89 +/‐ 0.61 54.1% 0.000 0.450 0.000Loss Cost 2002.1 1.97 +/‐ 0.64 54.6% 0.000 0.548 0.000Loss Cost 2002.2 1.94 +/‐ 0.68 50.9% 0.000 0.607 0.000Loss Cost 2003.1 2.03 +/‐ 0.72 51.5% 0.000 0.721 0.000Loss Cost 2003.2 1.88 +/‐ 0.75 46.2% 0.000 0.902 0.000Loss Cost 2004.1 1.63 +/‐ 0.73 41.1% 0.000 0.597 0.000Loss Cost 2004.2 1.60 +/‐ 0.79 36.8% 0.000 0.644 0.000Loss Cost 2005.1 1.57 +/‐ 0.85 33.2% 0.000 0.623 0.001Loss Cost 2005.2 1.38 +/‐ 0.89 25.2% 0.000 0.822 0.004Loss Cost 2006.1 1.32 +/‐ 0.96 20.9% 0.000 0.776 0.009Loss Cost 2006.2 1.30 +/‐ 1.05 16.9% 0.000 0.809 0.017Loss Cost 2007.1 1.32 +/‐ 1.15 14.9% 0.000 0.834 0.026Loss Cost 2007.2 1.57 +/‐ 1.22 20.6% 0.000 0.639 0.014Loss Cost 2008.1 1.98 +/‐ 1.23 32.8% 0.000 0.924 0.003Loss Cost 2008.2 2.25 +/‐ 1.32 36.8% 0.000 0.730 0.002Loss Cost 2009.1 2.51 +/‐ 1.43 40.4% 0.000 0.908 0.002Loss Cost 2009.2 2.92 +/‐ 1.52 47.1% 0.000 0.648 0.001Loss Cost 2010.1 3.52 +/‐ 1.49 60.6% 0.000 0.991 0.000Loss Cost 2010.2 3.42 +/‐ 1.71 54.2% 0.000 0.953 0.001Loss Cost 2011.1 3.89 +/‐ 1.84 59.2% 0.000 0.711 0.001Loss Cost 2011.2 4.08 +/‐ 2.15 56.4% 0.000 0.823 0.001Loss Cost 2012.1 4.98 +/‐ 2.09 70.3% 0.000 0.434 0.000Loss Cost 2012.2 5.47 +/‐ 2.44 70.8% 0.000 0.637 0.001Loss Cost 2013.1 5.71 +/‐ 2.96 65.8% 0.000 0.594 0.002Loss Cost 2013.2 5.69 +/‐ 3.80 58.3% 0.000 0.636 0.008Loss Cost 2014.1 6.36 +/‐ 4.75 55.2% 0.000 0.537 0.015Loss Cost 2014.2 5.61 +/‐ 6.49 41.2% 0.000 0.481 0.071Loss Cost 2015.1 3.93 +/‐ 8.18 0.2% 0.001 0.710 0.245
Severity 1998.2 3.51 +/‐ 0.42 88.3% 0.000 0.052 0.000Severity 1999.1 3.56 +/‐ 0.44 88.1% 0.000 0.074 0.000Severity 1999.2 3.65 +/‐ 0.45 88.4% 0.000 0.043 0.000Severity 2000.1 3.71 +/‐ 0.47 88.2% 0.000 0.063 0.000Severity 2000.2 3.75 +/‐ 0.50 87.5% 0.000 0.056 0.000Severity 2001.1 3.87 +/‐ 0.51 88.2% 0.000 0.092 0.000Severity 2001.2 3.90 +/‐ 0.54 87.4% 0.000 0.085 0.000Severity 2002.1 3.99 +/‐ 0.56 87.4% 0.000 0.126 0.000Severity 2002.2 4.02 +/‐ 0.60 86.4% 0.000 0.126 0.000Severity 2003.1 4.20 +/‐ 0.59 88.1% 0.000 0.212 0.000Severity 2003.2 4.29 +/‐ 0.63 87.6% 0.000 0.169 0.000Severity 2004.1 4.43 +/‐ 0.64 88.2% 0.000 0.258 0.000Severity 2004.2 4.63 +/‐ 0.65 89.3% 0.000 0.130 0.000Severity 2005.1 4.74 +/‐ 0.68 89.2% 0.000 0.192 0.000Severity 2005.2 4.74 +/‐ 0.74 87.9% 0.000 0.214 0.000Severity 2006.1 4.83 +/‐ 0.79 87.4% 0.000 0.285 0.000Severity 2006.2 5.05 +/‐ 0.83 87.9% 0.000 0.169 0.000Severity 2007.1 4.91 +/‐ 0.88 86.6% 0.000 0.132 0.000Severity 2007.2 4.97 +/‐ 0.97 85.0% 0.000 0.132 0.000Severity 2008.1 5.19 +/‐ 1.03 85.4% 0.000 0.208 0.000Severity 2008.2 5.68 +/‐ 0.94 90.0% 0.000 0.043 0.000Severity 2009.1 6.04 +/‐ 0.92 92.0% 0.000 0.076 0.000Severity 2009.2 6.34 +/‐ 0.96 92.5% 0.000 0.032 0.000Severity 2010.1 6.51 +/‐ 1.05 92.2% 0.000 0.056 0.000Severity 2010.2 6.73 +/‐ 1.17 91.6% 0.000 0.041 0.000Severity 2011.1 7.02 +/‐ 1.28 91.7% 0.000 0.074 0.000Severity 2011.2 7.28 +/‐ 1.46 90.8% 0.000 0.060 0.000Severity 2012.1 7.22 +/‐ 1.72 88.9% 0.000 0.076 0.000Severity 2012.2 7.32 +/‐ 2.09 85.7% 0.000 0.095 0.000Severity 2013.1 6.35 +/‐ 1.86 87.9% 0.000 0.017 0.000Severity 2013.2 5.86 +/‐ 2.23 81.9% 0.000 0.042 0.000Severity 2014.1 5.55 +/‐ 2.80 78.1% 0.000 0.052 0.003Severity 2014.2 5.90 +/‐ 3.90 69.5% 0.000 0.076 0.010Severity 2015.1 6.82 +/‐ 5.17 72.2% 0.000 0.147 0.019
Frequency 1998.2 ‐1.88 +/‐ 0.53 55.7% 0.000 0.659 0.000Frequency 1999.1 ‐1.92 +/‐ 0.55 55.4% 0.000 0.740 0.000Frequency 1999.2 ‐1.98 +/‐ 0.58 55.2% 0.000 0.657 0.000Frequency 2000.1 ‐1.99 +/‐ 0.61 53.5% 0.000 0.681 0.000Frequency 2000.2 ‐2.00 +/‐ 0.65 51.4% 0.000 0.677 0.000Frequency 2001.1 ‐1.90 +/‐ 0.67 47.6% 0.000 0.558 0.000Frequency 2001.2 ‐1.93 +/‐ 0.72 45.9% 0.000 0.536 0.000Frequency 2002.1 ‐1.94 +/‐ 0.76 43.9% 0.000 0.556 0.000Frequency 2002.2 ‐2.00 +/‐ 0.81 43.0% 0.000 0.508 0.000Frequency 2003.1 ‐2.09 +/‐ 0.85 43.2% 0.000 0.596 0.000Frequency 2003.2 ‐2.30 +/‐ 0.87 48.1% 0.000 0.405 0.000Frequency 2004.1 ‐2.68 +/‐ 0.79 61.9% 0.000 0.692 0.000Frequency 2004.2 ‐2.89 +/‐ 0.81 65.3% 0.000 0.473 0.000Frequency 2005.1 ‐3.03 +/‐ 0.85 66.2% 0.000 0.606 0.000Frequency 2005.2 ‐3.21 +/‐ 0.89 67.4% 0.000 0.452 0.000Frequency 2006.1 ‐3.35 +/‐ 0.95 67.7% 0.000 0.574 0.000Frequency 2006.2 ‐3.57 +/‐ 0.99 69.3% 0.000 0.409 0.000Frequency 2007.1 ‐3.43 +/‐ 1.07 65.7% 0.000 0.340 0.000Frequency 2007.2 ‐3.23 +/‐ 1.15 59.9% 0.000 0.468 0.000Frequency 2008.1 ‐3.05 +/‐ 1.25 54.9% 0.000 0.378 0.000Frequency 2008.2 ‐3.25 +/‐ 1.36 54.6% 0.000 0.303 0.000Frequency 2009.1 ‐3.33 +/‐ 1.51 52.5% 0.000 0.357 0.000Frequency 2009.2 ‐3.22 +/‐ 1.71 44.8% 0.000 0.430 0.001Frequency 2010.1 ‐2.81 +/‐ 1.84 37.4% 0.000 0.299 0.006Frequency 2010.2 ‐3.10 +/‐ 2.07 37.1% 0.000 0.249 0.007Frequency 2011.1 ‐2.93 +/‐ 2.37 31.7% 0.000 0.244 0.021Frequency 2011.2 ‐2.98 +/‐ 2.80 23.9% 0.000 0.273 0.042Frequency 2012.1 ‐2.09 +/‐ 2.99 19.0% 0.000 0.148 0.155Frequency 2012.2 ‐1.73 +/‐ 3.62 4.0% 0.000 0.229 0.313Frequency 2013.1 ‐0.60 +/‐ 4.00 8.8% 0.000 0.130 0.738Frequency 2013.2 ‐0.16 +/‐ 5.11 ‐1.0% 0.000 0.212 0.943Frequency 2014.1 0.77 +/‐ 6.39 3.2% 0.000 0.191 0.777Frequency 2014.2 ‐0.27 +/‐ 8.68 3.6% 0.003 0.198 0.938Frequency 2015.1 ‐2.71 +/‐ 10.59 ‐5.7% 0.006 0.338 0.521
Coverage = CL
End Trend Period = 2018.1
Seasonality = T
Excluded Points = NA
Appendix E Page 30

CL
Fit Start Date Trend Conf Int. Adj R^
P‐Value:
(Intercept) P‐Value: Time
Loss Cost 1998.2 1.56 +/‐ 0.49 51.4% 0.000 0.000Loss Cost 1999.1 1.57 +/‐ 0.51 49.9% 0.000 0.000Loss Cost 1999.2 1.58 +/‐ 0.54 48.4% 0.000 0.000Loss Cost 2000.1 1.64 +/‐ 0.57 48.6% 0.000 0.000Loss Cost 2000.2 1.66 +/‐ 0.60 46.9% 0.000 0.000Loss Cost 2001.1 1.89 +/‐ 0.57 57.1% 0.000 0.000Loss Cost 2001.2 1.88 +/‐ 0.61 54.7% 0.000 0.000Loss Cost 2002.1 1.97 +/‐ 0.64 55.5% 0.000 0.000Loss Cost 2002.2 1.93 +/‐ 0.67 52.1% 0.000 0.000Loss Cost 2003.1 2.03 +/‐ 0.71 53.0% 0.000 0.000Loss Cost 2003.2 1.88 +/‐ 0.74 48.1% 0.000 0.000Loss Cost 2004.1 1.63 +/‐ 0.72 42.6% 0.000 0.000Loss Cost 2004.2 1.59 +/‐ 0.78 38.7% 0.000 0.000Loss Cost 2005.1 1.57 +/‐ 0.84 35.2% 0.000 0.001Loss Cost 2005.2 1.37 +/‐ 0.87 28.1% 0.000 0.003Loss Cost 2006.1 1.32 +/‐ 0.94 24.0% 0.000 0.008Loss Cost 2006.2 1.29 +/‐ 1.02 20.4% 0.000 0.015Loss Cost 2007.1 1.32 +/‐ 1.12 18.8% 0.000 0.022Loss Cost 2007.2 1.55 +/‐ 1.19 23.7% 0.000 0.013Loss Cost 2008.1 1.98 +/‐ 1.19 36.3% 0.000 0.002Loss Cost 2008.2 2.23 +/‐ 1.28 39.9% 0.000 0.002Loss Cost 2009.1 2.51 +/‐ 1.38 43.8% 0.000 0.001Loss Cost 2009.2 2.88 +/‐ 1.47 49.7% 0.000 0.001Loss Cost 2010.1 3.52 +/‐ 1.43 63.2% 0.000 0.000Loss Cost 2010.2 3.43 +/‐ 1.62 57.4% 0.000 0.000Loss Cost 2011.1 3.89 +/‐ 1.76 61.9% 0.000 0.000Loss Cost 2011.2 4.11 +/‐ 2.03 59.8% 0.000 0.001Loss Cost 2012.1 4.98 +/‐ 2.03 71.2% 0.000 0.000Loss Cost 2012.2 5.55 +/‐ 2.29 73.0% 0.000 0.000Loss Cost 2013.1 5.71 +/‐ 2.79 68.4% 0.000 0.001Loss Cost 2013.2 5.83 +/‐ 3.48 62.2% 0.000 0.004Loss Cost 2014.1 6.36 +/‐ 4.40 58.8% 0.000 0.010Loss Cost 2014.2 6.03 +/‐ 5.83 45.3% 0.000 0.040Loss Cost 2015.1 3.93 +/‐ 6.90 16.9% 0.000 0.196
Severity 1998.2 3.49 +/‐ 0.44 87.4% 0.000 0.000Severity 1999.1 3.56 +/‐ 0.45 87.4% 0.000 0.000Severity 1999.2 3.63 +/‐ 0.47 87.3% 0.000 0.000Severity 2000.1 3.71 +/‐ 0.49 87.3% 0.000 0.000Severity 2000.2 3.73 +/‐ 0.51 86.5% 0.000 0.000Severity 2001.1 3.87 +/‐ 0.52 87.4% 0.000 0.000Severity 2001.2 3.88 +/‐ 0.55 86.5% 0.000 0.000Severity 2002.1 3.99 +/‐ 0.57 86.8% 0.000 0.000Severity 2002.2 3.99 +/‐ 0.61 85.7% 0.000 0.000Severity 2003.1 4.20 +/‐ 0.60 87.8% 0.000 0.000Severity 2003.2 4.26 +/‐ 0.63 87.1% 0.000 0.000Severity 2004.1 4.43 +/‐ 0.65 88.0% 0.000 0.000Severity 2004.2 4.60 +/‐ 0.66 88.7% 0.000 0.000Severity 2005.1 4.74 +/‐ 0.69 88.9% 0.000 0.000Severity 2005.2 4.71 +/‐ 0.75 87.5% 0.000 0.000Severity 2006.1 4.83 +/‐ 0.80 87.3% 0.000 0.000Severity 2006.2 5.00 +/‐ 0.84 87.4% 0.000 0.000Severity 2007.1 4.91 +/‐ 0.91 85.6% 0.000 0.000Severity 2007.2 4.91 +/‐ 1.00 83.9% 0.000 0.000Severity 2008.1 5.19 +/‐ 1.05 84.9% 0.000 0.000Severity 2008.2 5.59 +/‐ 1.03 87.8% 0.000 0.000Severity 2009.1 6.04 +/‐ 0.98 90.8% 0.000 0.000Severity 2009.2 6.24 +/‐ 1.07 90.4% 0.000 0.000Severity 2010.1 6.51 +/‐ 1.16 90.5% 0.000 0.000Severity 2010.2 6.60 +/‐ 1.31 89.1% 0.000 0.000Severity 2011.1 7.02 +/‐ 1.40 90.0% 0.000 0.000Severity 2011.2 7.10 +/‐ 1.62 88.1% 0.000 0.000Severity 2012.1 7.22 +/‐ 1.91 86.0% 0.000 0.000Severity 2012.2 7.07 +/‐ 2.27 82.2% 0.000 0.000Severity 2013.1 6.35 +/‐ 2.51 77.2% 0.000 0.000Severity 2013.2 5.46 +/‐ 2.74 70.2% 0.000 0.002Severity 2014.1 5.55 +/‐ 3.52 63.0% 0.000 0.007Severity 2014.2 5.17 +/‐ 4.64 49.3% 0.000 0.031Severity 2015.1 6.82 +/‐ 5.75 59.8% 0.000 0.025
Frequency 1998.2 ‐1.87 +/‐ 0.52 56.7% 0.000 0.000Frequency 1999.1 ‐1.92 +/‐ 0.54 56.5% 0.000 0.000Frequency 1999.2 ‐1.98 +/‐ 0.57 56.2% 0.000 0.000Frequency 2000.1 ‐1.99 +/‐ 0.60 54.6% 0.000 0.000Frequency 2000.2 ‐2.00 +/‐ 0.64 52.5% 0.000 0.000Frequency 2001.1 ‐1.90 +/‐ 0.67 48.6% 0.000 0.000Frequency 2001.2 ‐1.92 +/‐ 0.71 46.9% 0.000 0.000Frequency 2002.1 ‐1.94 +/‐ 0.75 45.1% 0.000 0.000Frequency 2002.2 ‐1.99 +/‐ 0.80 44.0% 0.000 0.000Frequency 2003.1 ‐2.09 +/‐ 0.84 44.6% 0.000 0.000Frequency 2003.2 ‐2.28 +/‐ 0.87 48.7% 0.000 0.000Frequency 2004.1 ‐2.68 +/‐ 0.78 63.0% 0.000 0.000Frequency 2004.2 ‐2.87 +/‐ 0.80 66.0% 0.000 0.000Frequency 2005.1 ‐3.03 +/‐ 0.84 67.1% 0.000 0.000Frequency 2005.2 ‐3.19 +/‐ 0.88 68.0% 0.000 0.000Frequency 2006.1 ‐3.35 +/‐ 0.93 68.7% 0.000 0.000Frequency 2006.2 ‐3.54 +/‐ 0.98 69.7% 0.000 0.000Frequency 2007.1 ‐3.43 +/‐ 1.07 65.8% 0.000 0.000Frequency 2007.2 ‐3.20 +/‐ 1.13 60.8% 0.000 0.000Frequency 2008.1 ‐3.05 +/‐ 1.24 55.3% 0.000 0.000Frequency 2008.2 ‐3.19 +/‐ 1.36 54.3% 0.000 0.000Frequency 2009.1 ‐3.33 +/‐ 1.50 52.8% 0.000 0.000Frequency 2009.2 ‐3.15 +/‐ 1.67 46.0% 0.000 0.001Frequency 2010.1 ‐2.81 +/‐ 1.84 36.8% 0.000 0.006Frequency 2010.2 ‐2.97 +/‐ 2.08 35.0% 0.000 0.009Frequency 2011.1 ‐2.93 +/‐ 2.40 29.1% 0.000 0.022Frequency 2011.2 ‐2.79 +/‐ 2.79 21.8% 0.000 0.053Frequency 2012.1 ‐2.09 +/‐ 3.15 8.3% 0.000 0.176Frequency 2012.2 ‐1.43 +/‐ 3.66 ‐2.4% 0.000 0.408Frequency 2013.1 ‐0.60 +/‐ 4.31 ‐9.9% 0.000 0.759Frequency 2013.2 0.36 +/‐ 5.20 ‐12.1% 0.000 0.878Frequency 2014.1 0.77 +/‐ 6.68 ‐13.1% 0.000 0.792Frequency 2014.2 0.82 +/‐ 8.93 ‐15.7% 0.003 0.828Frequency 2015.1 ‐2.71 +/‐ 9.98 ‐9.6% 0.003 0.521
Coverage = CL
End Trend Period = 2018.1
Seasonality = F
Excluded Points = NA
Appendix E Page 31
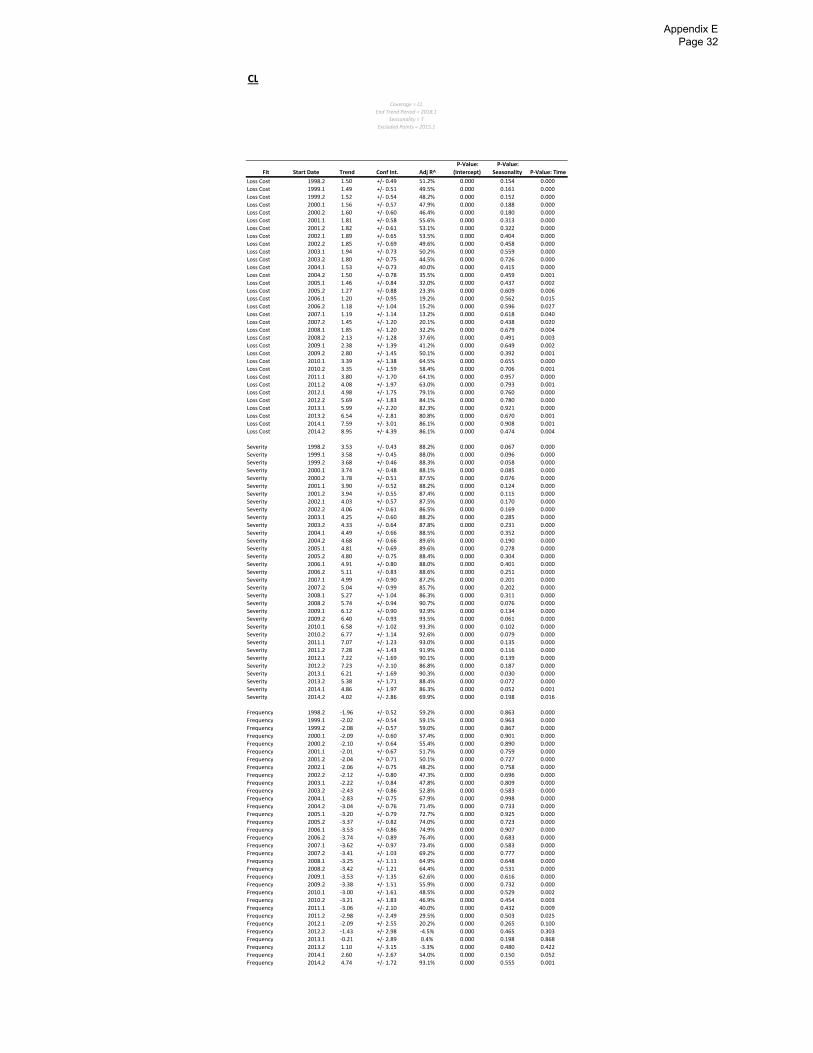
CL
Fit Start Date Trend Conf Int. Adj R^
P‐Value:
(Intercept)
P‐Value:
Seasonality P‐Value: Time
Loss Cost 1998.2 1.50 +/‐ 0.49 51.2% 0.000 0.154 0.000
Loss Cost 1999.1 1.49 +/‐ 0.51 49.5% 0.000 0.161 0.000
Loss Cost 1999.2 1.52 +/‐ 0.54 48.2% 0.000 0.152 0.000
Loss Cost 2000.1 1.56 +/‐ 0.57 47.9% 0.000 0.188 0.000
Loss Cost 2000.2 1.60 +/‐ 0.60 46.4% 0.000 0.180 0.000
Loss Cost 2001.1 1.81 +/‐ 0.58 55.6% 0.000 0.313 0.000
Loss Cost 2001.2 1.82 +/‐ 0.61 53.1% 0.000 0.322 0.000
Loss Cost 2002.1 1.89 +/‐ 0.65 53.5% 0.000 0.404 0.000
Loss Cost 2002.2 1.85 +/‐ 0.69 49.6% 0.000 0.458 0.000
Loss Cost 2003.1 1.94 +/‐ 0.73 50.2% 0.000 0.559 0.000
Loss Cost 2003.2 1.80 +/‐ 0.75 44.5% 0.000 0.726 0.000
Loss Cost 2004.1 1.53 +/‐ 0.73 40.0% 0.000 0.415 0.000
Loss Cost 2004.2 1.50 +/‐ 0.78 35.5% 0.000 0.459 0.001
Loss Cost 2005.1 1.46 +/‐ 0.84 32.0% 0.000 0.437 0.002
Loss Cost 2005.2 1.27 +/‐ 0.88 23.3% 0.000 0.609 0.006
Loss Cost 2006.1 1.20 +/‐ 0.95 19.2% 0.000 0.562 0.015
Loss Cost 2006.2 1.18 +/‐ 1.04 15.2% 0.000 0.596 0.027
Loss Cost 2007.1 1.19 +/‐ 1.14 13.2% 0.000 0.618 0.040
Loss Cost 2007.2 1.45 +/‐ 1.20 20.1% 0.000 0.438 0.020
Loss Cost 2008.1 1.85 +/‐ 1.20 32.2% 0.000 0.679 0.004
Loss Cost 2008.2 2.13 +/‐ 1.28 37.6% 0.000 0.491 0.003
Loss Cost 2009.1 2.38 +/‐ 1.39 41.2% 0.000 0.649 0.002
Loss Cost 2009.2 2.80 +/‐ 1.45 50.1% 0.000 0.392 0.001
Loss Cost 2010.1 3.39 +/‐ 1.38 64.5% 0.000 0.655 0.000
Loss Cost 2010.2 3.35 +/‐ 1.59 58.4% 0.000 0.706 0.001
Loss Cost 2011.1 3.80 +/‐ 1.70 64.1% 0.000 0.957 0.000
Loss Cost 2011.2 4.08 +/‐ 1.97 63.0% 0.000 0.793 0.001
Loss Cost 2012.1 4.98 +/‐ 1.75 79.1% 0.000 0.760 0.000
Loss Cost 2012.2 5.69 +/‐ 1.83 84.1% 0.000 0.780 0.000
Loss Cost 2013.1 5.99 +/‐ 2.20 82.3% 0.000 0.921 0.000
Loss Cost 2013.2 6.54 +/‐ 2.81 80.8% 0.000 0.670 0.001
Loss Cost 2014.1 7.59 +/‐ 3.01 86.1% 0.000 0.908 0.001
Loss Cost 2014.2 8.95 +/‐ 4.39 86.1% 0.000 0.474 0.004
Severity 1998.2 3.53 +/‐ 0.43 88.2% 0.000 0.067 0.000
Severity 1999.1 3.58 +/‐ 0.45 88.0% 0.000 0.096 0.000
Severity 1999.2 3.68 +/‐ 0.46 88.3% 0.000 0.058 0.000
Severity 2000.1 3.74 +/‐ 0.48 88.1% 0.000 0.085 0.000
Severity 2000.2 3.78 +/‐ 0.51 87.5% 0.000 0.076 0.000
Severity 2001.1 3.90 +/‐ 0.52 88.2% 0.000 0.124 0.000
Severity 2001.2 3.94 +/‐ 0.55 87.4% 0.000 0.115 0.000
Severity 2002.1 4.03 +/‐ 0.57 87.5% 0.000 0.170 0.000
Severity 2002.2 4.06 +/‐ 0.61 86.5% 0.000 0.169 0.000
Severity 2003.1 4.25 +/‐ 0.60 88.2% 0.000 0.285 0.000
Severity 2003.2 4.33 +/‐ 0.64 87.8% 0.000 0.231 0.000
Severity 2004.1 4.49 +/‐ 0.66 88.5% 0.000 0.352 0.000
Severity 2004.2 4.68 +/‐ 0.66 89.6% 0.000 0.190 0.000
Severity 2005.1 4.81 +/‐ 0.69 89.6% 0.000 0.278 0.000
Severity 2005.2 4.80 +/‐ 0.75 88.4% 0.000 0.304 0.000
Severity 2006.1 4.91 +/‐ 0.80 88.0% 0.000 0.401 0.000
Severity 2006.2 5.11 +/‐ 0.83 88.6% 0.000 0.251 0.000
Severity 2007.1 4.99 +/‐ 0.90 87.2% 0.000 0.201 0.000
Severity 2007.2 5.04 +/‐ 0.99 85.7% 0.000 0.202 0.000
Severity 2008.1 5.27 +/‐ 1.04 86.3% 0.000 0.311 0.000
Severity 2008.2 5.74 +/‐ 0.94 90.7% 0.000 0.076 0.000
Severity 2009.1 6.12 +/‐ 0.90 92.9% 0.000 0.134 0.000
Severity 2009.2 6.40 +/‐ 0.93 93.5% 0.000 0.061 0.000
Severity 2010.1 6.58 +/‐ 1.02 93.3% 0.000 0.102 0.000
Severity 2010.2 6.77 +/‐ 1.14 92.6% 0.000 0.079 0.000
Severity 2011.1 7.07 +/‐ 1.23 93.0% 0.000 0.135 0.000
Severity 2011.2 7.28 +/‐ 1.43 91.9% 0.000 0.116 0.000
Severity 2012.1 7.22 +/‐ 1.69 90.1% 0.000 0.139 0.000
Severity 2012.2 7.23 +/‐ 2.10 86.8% 0.000 0.187 0.000
Severity 2013.1 6.21 +/‐ 1.69 90.3% 0.000 0.030 0.000
Severity 2013.2 5.38 +/‐ 1.71 88.4% 0.000 0.072 0.000
Severity 2014.1 4.86 +/‐ 1.97 86.3% 0.000 0.052 0.001
Severity 2014.2 4.02 +/‐ 2.86 69.9% 0.000 0.198 0.016
Frequency 1998.2 ‐1.96 +/‐ 0.52 59.2% 0.000 0.863 0.000
Frequency 1999.1 ‐2.02 +/‐ 0.54 59.1% 0.000 0.963 0.000
Frequency 1999.2 ‐2.08 +/‐ 0.57 59.0% 0.000 0.867 0.000
Frequency 2000.1 ‐2.09 +/‐ 0.60 57.4% 0.000 0.901 0.000
Frequency 2000.2 ‐2.10 +/‐ 0.64 55.4% 0.000 0.890 0.000
Frequency 2001.1 ‐2.01 +/‐ 0.67 51.7% 0.000 0.759 0.000
Frequency 2001.2 ‐2.04 +/‐ 0.71 50.1% 0.000 0.727 0.000
Frequency 2002.1 ‐2.06 +/‐ 0.75 48.2% 0.000 0.758 0.000
Frequency 2002.2 ‐2.12 +/‐ 0.80 47.3% 0.000 0.696 0.000
Frequency 2003.1 ‐2.22 +/‐ 0.84 47.8% 0.000 0.809 0.000
Frequency 2003.2 ‐2.43 +/‐ 0.86 52.8% 0.000 0.583 0.000
Frequency 2004.1 ‐2.83 +/‐ 0.75 67.9% 0.000 0.998 0.000
Frequency 2004.2 ‐3.04 +/‐ 0.76 71.4% 0.000 0.733 0.000
Frequency 2005.1 ‐3.20 +/‐ 0.79 72.7% 0.000 0.925 0.000
Frequency 2005.2 ‐3.37 +/‐ 0.82 74.0% 0.000 0.723 0.000
Frequency 2006.1 ‐3.53 +/‐ 0.86 74.9% 0.000 0.907 0.000
Frequency 2006.2 ‐3.74 +/‐ 0.89 76.4% 0.000 0.683 0.000
Frequency 2007.1 ‐3.62 +/‐ 0.97 73.4% 0.000 0.583 0.000
Frequency 2007.2 ‐3.41 +/‐ 1.03 69.2% 0.000 0.777 0.000
Frequency 2008.1 ‐3.25 +/‐ 1.11 64.9% 0.000 0.648 0.000
Frequency 2008.2 ‐3.42 +/‐ 1.21 64.4% 0.000 0.531 0.000
Frequency 2009.1 ‐3.53 +/‐ 1.35 62.6% 0.000 0.616 0.000
Frequency 2009.2 ‐3.38 +/‐ 1.51 55.9% 0.000 0.732 0.000
Frequency 2010.1 ‐3.00 +/‐ 1.61 48.5% 0.000 0.529 0.002
Frequency 2010.2 ‐3.21 +/‐ 1.83 46.9% 0.000 0.454 0.003
Frequency 2011.1 ‐3.06 +/‐ 2.10 40.0% 0.000 0.432 0.009
Frequency 2011.2 ‐2.98 +/‐ 2.49 29.5% 0.000 0.503 0.025
Frequency 2012.1 ‐2.09 +/‐ 2.55 20.2% 0.000 0.265 0.100
Frequency 2012.2 ‐1.43 +/‐ 2.98 ‐4.5% 0.000 0.465 0.303
Frequency 2013.1 ‐0.21 +/‐ 2.89 0.4% 0.000 0.198 0.868
Frequency 2013.2 1.10 +/‐ 3.15 ‐3.3% 0.000 0.480 0.422
Frequency 2014.1 2.60 +/‐ 2.67 54.0% 0.000 0.150 0.052
Frequency 2014.2 4.74 +/‐ 1.72 93.1% 0.000 0.555 0.001
Coverage = CL
End Trend Period = 2018.1
Seasonality = T
Excluded Points = 2015.1
Appendix E Page 32
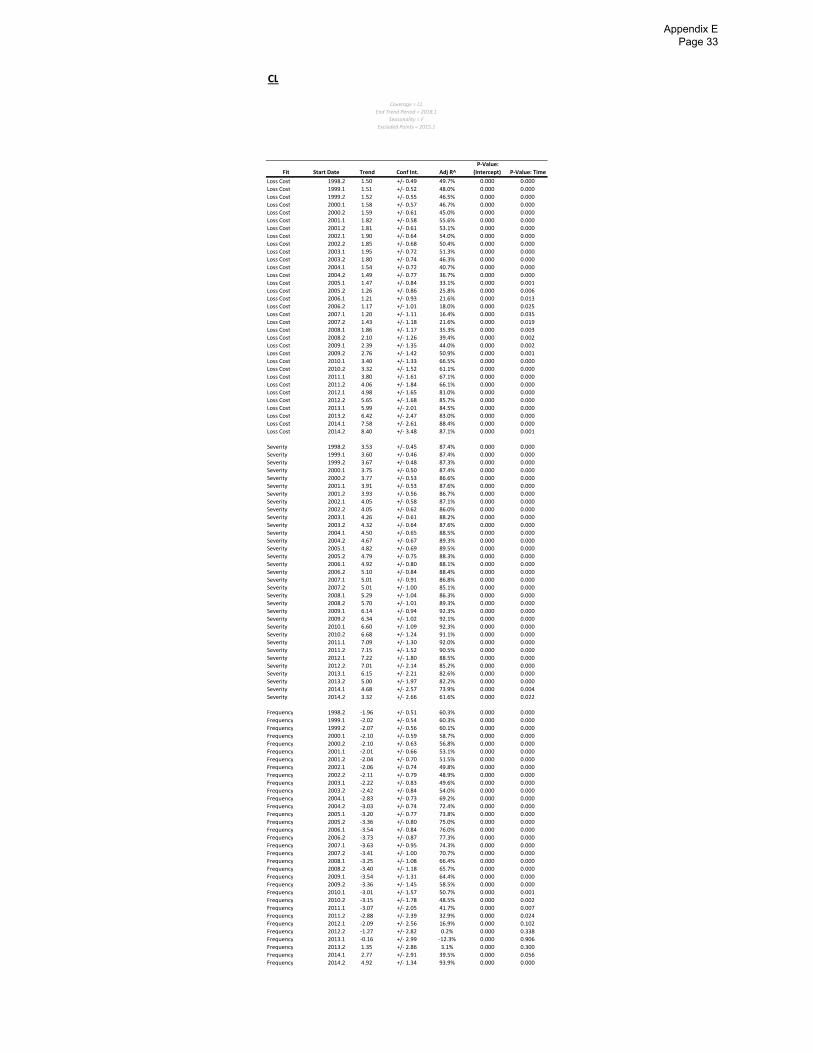
CL
Fit Start Date Trend Conf Int. Adj R^
P‐Value:
(Intercept) P‐Value: Time
Loss Cost 1998.2 1.50 +/‐ 0.49 49.7% 0.000 0.000
Loss Cost 1999.1 1.51 +/‐ 0.52 48.0% 0.000 0.000
Loss Cost 1999.2 1.52 +/‐ 0.55 46.5% 0.000 0.000
Loss Cost 2000.1 1.58 +/‐ 0.57 46.7% 0.000 0.000
Loss Cost 2000.2 1.59 +/‐ 0.61 45.0% 0.000 0.000
Loss Cost 2001.1 1.82 +/‐ 0.58 55.6% 0.000 0.000
Loss Cost 2001.2 1.81 +/‐ 0.61 53.1% 0.000 0.000
Loss Cost 2002.1 1.90 +/‐ 0.64 54.0% 0.000 0.000
Loss Cost 2002.2 1.85 +/‐ 0.68 50.4% 0.000 0.000
Loss Cost 2003.1 1.95 +/‐ 0.72 51.3% 0.000 0.000
Loss Cost 2003.2 1.80 +/‐ 0.74 46.3% 0.000 0.000
Loss Cost 2004.1 1.54 +/‐ 0.72 40.7% 0.000 0.000
Loss Cost 2004.2 1.49 +/‐ 0.77 36.7% 0.000 0.000
Loss Cost 2005.1 1.47 +/‐ 0.84 33.1% 0.000 0.001
Loss Cost 2005.2 1.26 +/‐ 0.86 25.8% 0.000 0.006
Loss Cost 2006.1 1.21 +/‐ 0.93 21.6% 0.000 0.013
Loss Cost 2006.2 1.17 +/‐ 1.01 18.0% 0.000 0.025
Loss Cost 2007.1 1.20 +/‐ 1.11 16.4% 0.000 0.035
Loss Cost 2007.2 1.43 +/‐ 1.18 21.6% 0.000 0.019
Loss Cost 2008.1 1.86 +/‐ 1.17 35.3% 0.000 0.003
Loss Cost 2008.2 2.10 +/‐ 1.26 39.4% 0.000 0.002
Loss Cost 2009.1 2.39 +/‐ 1.35 44.0% 0.000 0.002
Loss Cost 2009.2 2.76 +/‐ 1.42 50.9% 0.000 0.001
Loss Cost 2010.1 3.40 +/‐ 1.33 66.5% 0.000 0.000
Loss Cost 2010.2 3.32 +/‐ 1.52 61.1% 0.000 0.000
Loss Cost 2011.1 3.80 +/‐ 1.61 67.1% 0.000 0.000
Loss Cost 2011.2 4.06 +/‐ 1.84 66.1% 0.000 0.000
Loss Cost 2012.1 4.98 +/‐ 1.65 81.0% 0.000 0.000
Loss Cost 2012.2 5.65 +/‐ 1.68 85.7% 0.000 0.000
Loss Cost 2013.1 5.99 +/‐ 2.01 84.5% 0.000 0.000
Loss Cost 2013.2 6.42 +/‐ 2.47 83.0% 0.000 0.000
Loss Cost 2014.1 7.58 +/‐ 2.61 88.4% 0.000 0.000
Loss Cost 2014.2 8.40 +/‐ 3.48 87.1% 0.000 0.001
Severity 1998.2 3.53 +/‐ 0.45 87.4% 0.000 0.000
Severity 1999.1 3.60 +/‐ 0.46 87.4% 0.000 0.000
Severity 1999.2 3.67 +/‐ 0.48 87.3% 0.000 0.000
Severity 2000.1 3.75 +/‐ 0.50 87.4% 0.000 0.000
Severity 2000.2 3.77 +/‐ 0.53 86.6% 0.000 0.000
Severity 2001.1 3.91 +/‐ 0.53 87.6% 0.000 0.000
Severity 2001.2 3.93 +/‐ 0.56 86.7% 0.000 0.000
Severity 2002.1 4.05 +/‐ 0.58 87.1% 0.000 0.000
Severity 2002.2 4.05 +/‐ 0.62 86.0% 0.000 0.000
Severity 2003.1 4.26 +/‐ 0.61 88.2% 0.000 0.000
Severity 2003.2 4.32 +/‐ 0.64 87.6% 0.000 0.000
Severity 2004.1 4.50 +/‐ 0.65 88.5% 0.000 0.000
Severity 2004.2 4.67 +/‐ 0.67 89.3% 0.000 0.000
Severity 2005.1 4.82 +/‐ 0.69 89.5% 0.000 0.000
Severity 2005.2 4.79 +/‐ 0.75 88.3% 0.000 0.000
Severity 2006.1 4.92 +/‐ 0.80 88.1% 0.000 0.000
Severity 2006.2 5.10 +/‐ 0.84 88.4% 0.000 0.000
Severity 2007.1 5.01 +/‐ 0.91 86.8% 0.000 0.000
Severity 2007.2 5.01 +/‐ 1.00 85.1% 0.000 0.000
Severity 2008.1 5.29 +/‐ 1.04 86.3% 0.000 0.000
Severity 2008.2 5.70 +/‐ 1.01 89.3% 0.000 0.000
Severity 2009.1 6.14 +/‐ 0.94 92.3% 0.000 0.000
Severity 2009.2 6.34 +/‐ 1.02 92.1% 0.000 0.000
Severity 2010.1 6.60 +/‐ 1.09 92.3% 0.000 0.000
Severity 2010.2 6.68 +/‐ 1.24 91.1% 0.000 0.000
Severity 2011.1 7.09 +/‐ 1.30 92.0% 0.000 0.000
Severity 2011.2 7.15 +/‐ 1.52 90.5% 0.000 0.000
Severity 2012.1 7.22 +/‐ 1.80 88.5% 0.000 0.000
Severity 2012.2 7.01 +/‐ 2.14 85.2% 0.000 0.000
Severity 2013.1 6.15 +/‐ 2.21 82.6% 0.000 0.000
Severity 2013.2 5.00 +/‐ 1.97 82.2% 0.000 0.000
Severity 2014.1 4.68 +/‐ 2.57 73.9% 0.000 0.004
Severity 2014.2 3.32 +/‐ 2.66 61.6% 0.000 0.022
Frequency 1998.2 ‐1.96 +/‐ 0.51 60.3% 0.000 0.000
Frequency 1999.1 ‐2.02 +/‐ 0.54 60.3% 0.000 0.000
Frequency 1999.2 ‐2.07 +/‐ 0.56 60.1% 0.000 0.000
Frequency 2000.1 ‐2.10 +/‐ 0.59 58.7% 0.000 0.000
Frequency 2000.2 ‐2.10 +/‐ 0.63 56.8% 0.000 0.000
Frequency 2001.1 ‐2.01 +/‐ 0.66 53.1% 0.000 0.000
Frequency 2001.2 ‐2.04 +/‐ 0.70 51.5% 0.000 0.000
Frequency 2002.1 ‐2.06 +/‐ 0.74 49.8% 0.000 0.000
Frequency 2002.2 ‐2.11 +/‐ 0.79 48.9% 0.000 0.000
Frequency 2003.1 ‐2.22 +/‐ 0.83 49.6% 0.000 0.000
Frequency 2003.2 ‐2.42 +/‐ 0.84 54.0% 0.000 0.000
Frequency 2004.1 ‐2.83 +/‐ 0.73 69.2% 0.000 0.000
Frequency 2004.2 ‐3.03 +/‐ 0.74 72.4% 0.000 0.000
Frequency 2005.1 ‐3.20 +/‐ 0.77 73.8% 0.000 0.000
Frequency 2005.2 ‐3.36 +/‐ 0.80 75.0% 0.000 0.000
Frequency 2006.1 ‐3.54 +/‐ 0.84 76.0% 0.000 0.000
Frequency 2006.2 ‐3.73 +/‐ 0.87 77.3% 0.000 0.000
Frequency 2007.1 ‐3.63 +/‐ 0.95 74.3% 0.000 0.000
Frequency 2007.2 ‐3.41 +/‐ 1.00 70.7% 0.000 0.000
Frequency 2008.1 ‐3.25 +/‐ 1.08 66.4% 0.000 0.000
Frequency 2008.2 ‐3.40 +/‐ 1.18 65.7% 0.000 0.000
Frequency 2009.1 ‐3.54 +/‐ 1.31 64.4% 0.000 0.000
Frequency 2009.2 ‐3.36 +/‐ 1.45 58.5% 0.000 0.000
Frequency 2010.1 ‐3.01 +/‐ 1.57 50.7% 0.000 0.001
Frequency 2010.2 ‐3.15 +/‐ 1.78 48.5% 0.000 0.002
Frequency 2011.1 ‐3.07 +/‐ 2.05 41.7% 0.000 0.007
Frequency 2011.2 ‐2.88 +/‐ 2.39 32.9% 0.000 0.024
Frequency 2012.1 ‐2.09 +/‐ 2.56 16.9% 0.000 0.102
Frequency 2012.2 ‐1.27 +/‐ 2.82 0.2% 0.000 0.338
Frequency 2013.1 ‐0.16 +/‐ 2.99 ‐12.3% 0.000 0.906
Frequency 2013.2 1.35 +/‐ 2.86 3.1% 0.000 0.300
Frequency 2014.1 2.77 +/‐ 2.91 39.5% 0.000 0.056
Frequency 2014.2 4.92 +/‐ 1.34 93.9% 0.000 0.000
Coverage = CL
End Trend Period = 2018.1
Seasonality = F
Excluded Points = 2015.1
Appendix E Page 33
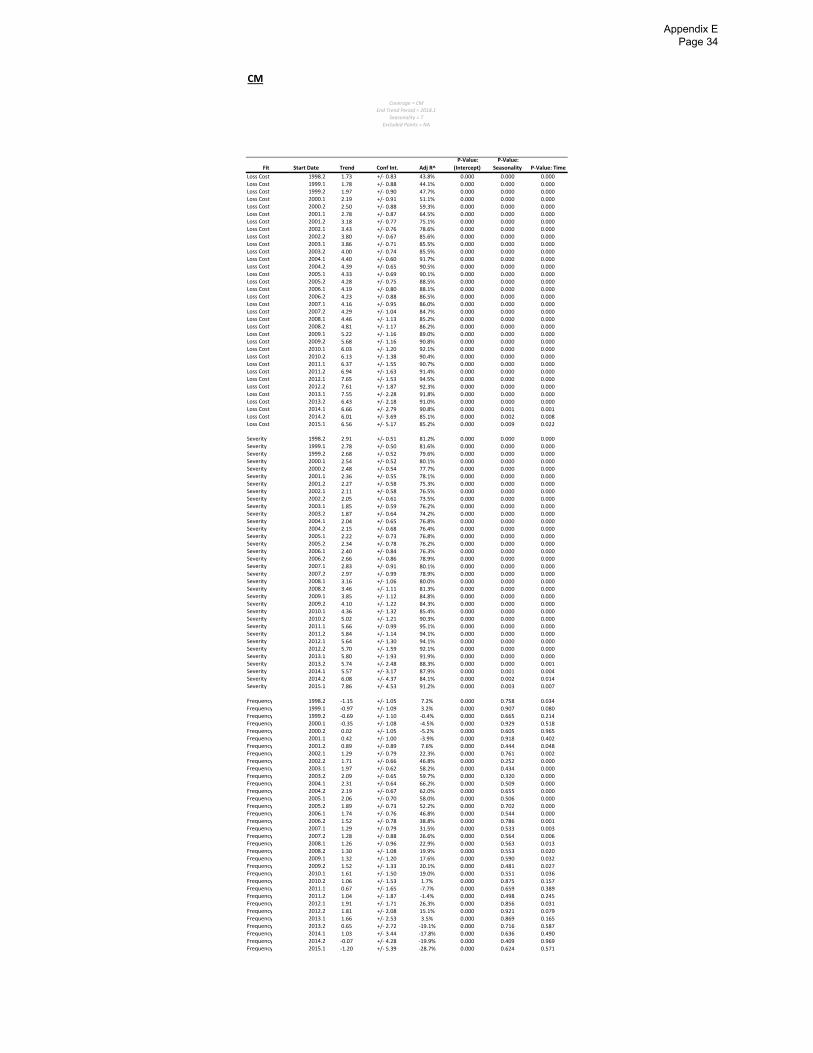
CM
Fit Start Date Trend Conf Int. Adj R^
P‐Value:
(Intercept)
P‐Value:
Seasonality P‐Value: Time
Loss Cost 1998.2 1.73 +/‐ 0.83 43.8% 0.000 0.000 0.000Loss Cost 1999.1 1.78 +/‐ 0.88 44.1% 0.000 0.000 0.000Loss Cost 1999.2 1.97 +/‐ 0.90 47.7% 0.000 0.000 0.000Loss Cost 2000.1 2.19 +/‐ 0.91 51.1% 0.000 0.000 0.000Loss Cost 2000.2 2.50 +/‐ 0.88 59.3% 0.000 0.000 0.000Loss Cost 2001.1 2.78 +/‐ 0.87 64.5% 0.000 0.000 0.000Loss Cost 2001.2 3.18 +/‐ 0.77 75.1% 0.000 0.000 0.000Loss Cost 2002.1 3.43 +/‐ 0.76 78.6% 0.000 0.000 0.000Loss Cost 2002.2 3.80 +/‐ 0.67 85.6% 0.000 0.000 0.000Loss Cost 2003.1 3.86 +/‐ 0.71 85.5% 0.000 0.000 0.000Loss Cost 2003.2 4.00 +/‐ 0.74 85.5% 0.000 0.000 0.000Loss Cost 2004.1 4.40 +/‐ 0.60 91.7% 0.000 0.000 0.000Loss Cost 2004.2 4.39 +/‐ 0.65 90.5% 0.000 0.000 0.000Loss Cost 2005.1 4.33 +/‐ 0.69 90.1% 0.000 0.000 0.000Loss Cost 2005.2 4.28 +/‐ 0.75 88.5% 0.000 0.000 0.000Loss Cost 2006.1 4.19 +/‐ 0.80 88.1% 0.000 0.000 0.000Loss Cost 2006.2 4.23 +/‐ 0.88 86.5% 0.000 0.000 0.000Loss Cost 2007.1 4.16 +/‐ 0.95 86.0% 0.000 0.000 0.000Loss Cost 2007.2 4.29 +/‐ 1.04 84.7% 0.000 0.000 0.000Loss Cost 2008.1 4.46 +/‐ 1.13 85.2% 0.000 0.000 0.000Loss Cost 2008.2 4.81 +/‐ 1.17 86.2% 0.000 0.000 0.000Loss Cost 2009.1 5.22 +/‐ 1.16 89.0% 0.000 0.000 0.000Loss Cost 2009.2 5.68 +/‐ 1.16 90.8% 0.000 0.000 0.000Loss Cost 2010.1 6.03 +/‐ 1.20 92.1% 0.000 0.000 0.000Loss Cost 2010.2 6.13 +/‐ 1.38 90.4% 0.000 0.000 0.000Loss Cost 2011.1 6.37 +/‐ 1.55 90.7% 0.000 0.000 0.000Loss Cost 2011.2 6.94 +/‐ 1.63 91.4% 0.000 0.000 0.000Loss Cost 2012.1 7.65 +/‐ 1.53 94.5% 0.000 0.000 0.000Loss Cost 2012.2 7.61 +/‐ 1.87 92.3% 0.000 0.000 0.000Loss Cost 2013.1 7.55 +/‐ 2.28 91.8% 0.000 0.000 0.000Loss Cost 2013.2 6.43 +/‐ 2.18 91.0% 0.000 0.000 0.000Loss Cost 2014.1 6.66 +/‐ 2.79 90.8% 0.000 0.001 0.001Loss Cost 2014.2 6.01 +/‐ 3.69 85.1% 0.000 0.002 0.008Loss Cost 2015.1 6.56 +/‐ 5.17 85.2% 0.000 0.009 0.022
Severity 1998.2 2.91 +/‐ 0.51 81.2% 0.000 0.000 0.000Severity 1999.1 2.78 +/‐ 0.50 81.6% 0.000 0.000 0.000Severity 1999.2 2.68 +/‐ 0.52 79.6% 0.000 0.000 0.000Severity 2000.1 2.54 +/‐ 0.52 80.1% 0.000 0.000 0.000Severity 2000.2 2.48 +/‐ 0.54 77.7% 0.000 0.000 0.000Severity 2001.1 2.36 +/‐ 0.55 78.1% 0.000 0.000 0.000Severity 2001.2 2.27 +/‐ 0.58 75.3% 0.000 0.000 0.000Severity 2002.1 2.11 +/‐ 0.58 76.5% 0.000 0.000 0.000Severity 2002.2 2.05 +/‐ 0.61 73.5% 0.000 0.000 0.000Severity 2003.1 1.85 +/‐ 0.59 76.2% 0.000 0.000 0.000Severity 2003.2 1.87 +/‐ 0.64 74.2% 0.000 0.000 0.000Severity 2004.1 2.04 +/‐ 0.65 76.8% 0.000 0.000 0.000Severity 2004.2 2.15 +/‐ 0.68 76.4% 0.000 0.000 0.000Severity 2005.1 2.22 +/‐ 0.73 76.8% 0.000 0.000 0.000Severity 2005.2 2.34 +/‐ 0.78 76.2% 0.000 0.000 0.000Severity 2006.1 2.40 +/‐ 0.84 76.3% 0.000 0.000 0.000Severity 2006.2 2.66 +/‐ 0.86 78.9% 0.000 0.000 0.000Severity 2007.1 2.83 +/‐ 0.91 80.1% 0.000 0.000 0.000Severity 2007.2 2.97 +/‐ 0.99 78.9% 0.000 0.000 0.000Severity 2008.1 3.16 +/‐ 1.06 80.0% 0.000 0.000 0.000Severity 2008.2 3.46 +/‐ 1.11 81.3% 0.000 0.000 0.000Severity 2009.1 3.85 +/‐ 1.12 84.8% 0.000 0.000 0.000Severity 2009.2 4.10 +/‐ 1.22 84.3% 0.000 0.000 0.000Severity 2010.1 4.36 +/‐ 1.32 85.4% 0.000 0.000 0.000Severity 2010.2 5.02 +/‐ 1.21 90.3% 0.000 0.000 0.000Severity 2011.1 5.66 +/‐ 0.99 95.1% 0.000 0.000 0.000Severity 2011.2 5.84 +/‐ 1.14 94.1% 0.000 0.000 0.000Severity 2012.1 5.64 +/‐ 1.30 94.1% 0.000 0.000 0.000Severity 2012.2 5.70 +/‐ 1.59 92.1% 0.000 0.000 0.000Severity 2013.1 5.80 +/‐ 1.93 91.9% 0.000 0.000 0.000Severity 2013.2 5.74 +/‐ 2.48 88.3% 0.000 0.000 0.001Severity 2014.1 5.57 +/‐ 3.17 87.9% 0.000 0.001 0.004Severity 2014.2 6.08 +/‐ 4.37 84.1% 0.000 0.002 0.014Severity 2015.1 7.86 +/‐ 4.53 91.2% 0.000 0.003 0.007
Frequency 1998.2 ‐1.15 +/‐ 1.05 7.2% 0.000 0.758 0.034Frequency 1999.1 ‐0.97 +/‐ 1.09 3.2% 0.000 0.907 0.080Frequency 1999.2 ‐0.69 +/‐ 1.10 ‐0.4% 0.000 0.665 0.214Frequency 2000.1 ‐0.35 +/‐ 1.08 ‐4.5% 0.000 0.929 0.518Frequency 2000.2 0.02 +/‐ 1.05 ‐5.2% 0.000 0.605 0.965Frequency 2001.1 0.42 +/‐ 1.00 ‐3.9% 0.000 0.918 0.402Frequency 2001.2 0.89 +/‐ 0.89 7.6% 0.000 0.444 0.048Frequency 2002.1 1.29 +/‐ 0.79 22.3% 0.000 0.761 0.002Frequency 2002.2 1.71 +/‐ 0.66 46.8% 0.000 0.252 0.000Frequency 2003.1 1.97 +/‐ 0.62 58.2% 0.000 0.434 0.000Frequency 2003.2 2.09 +/‐ 0.65 59.7% 0.000 0.320 0.000Frequency 2004.1 2.31 +/‐ 0.64 66.2% 0.000 0.509 0.000Frequency 2004.2 2.19 +/‐ 0.67 62.0% 0.000 0.655 0.000Frequency 2005.1 2.06 +/‐ 0.70 58.0% 0.000 0.506 0.000Frequency 2005.2 1.89 +/‐ 0.73 52.2% 0.000 0.702 0.000Frequency 2006.1 1.74 +/‐ 0.76 46.8% 0.000 0.544 0.000Frequency 2006.2 1.52 +/‐ 0.78 38.8% 0.000 0.786 0.001Frequency 2007.1 1.29 +/‐ 0.79 31.5% 0.000 0.533 0.003Frequency 2007.2 1.28 +/‐ 0.88 26.6% 0.000 0.564 0.006Frequency 2008.1 1.26 +/‐ 0.96 22.9% 0.000 0.563 0.013Frequency 2008.2 1.30 +/‐ 1.08 19.9% 0.000 0.553 0.020Frequency 2009.1 1.32 +/‐ 1.20 17.6% 0.000 0.590 0.032Frequency 2009.2 1.52 +/‐ 1.33 20.1% 0.000 0.481 0.027Frequency 2010.1 1.61 +/‐ 1.50 19.0% 0.000 0.551 0.036Frequency 2010.2 1.06 +/‐ 1.53 1.7% 0.000 0.875 0.157Frequency 2011.1 0.67 +/‐ 1.65 ‐7.7% 0.000 0.659 0.389Frequency 2011.2 1.04 +/‐ 1.87 ‐1.4% 0.000 0.498 0.245Frequency 2012.1 1.91 +/‐ 1.71 26.3% 0.000 0.856 0.031Frequency 2012.2 1.81 +/‐ 2.08 15.1% 0.000 0.921 0.079Frequency 2013.1 1.66 +/‐ 2.53 3.5% 0.000 0.869 0.165Frequency 2013.2 0.65 +/‐ 2.72 ‐19.1% 0.000 0.716 0.587Frequency 2014.1 1.03 +/‐ 3.44 ‐17.8% 0.000 0.636 0.490Frequency 2014.2 ‐0.07 +/‐ 4.28 ‐19.9% 0.000 0.409 0.969Frequency 2015.1 ‐1.20 +/‐ 5.39 ‐28.7% 0.000 0.624 0.571
Coverage = CM
End Trend Period = 2018.1
Seasonality = T
Excluded Points = NA
Appendix E Page 34
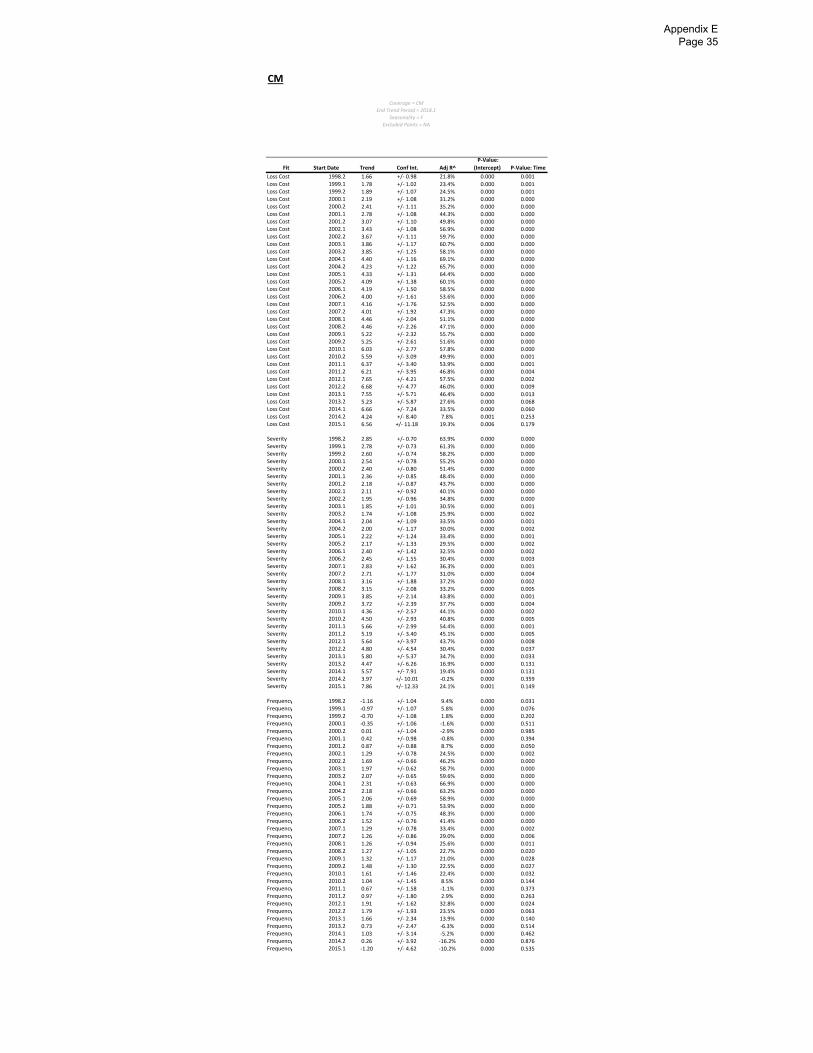
CM
Fit Start Date Trend Conf Int. Adj R^
P‐Value:
(Intercept) P‐Value: Time
Loss Cost 1998.2 1.66 +/‐ 0.98 21.8% 0.000 0.001Loss Cost 1999.1 1.78 +/‐ 1.02 23.4% 0.000 0.001Loss Cost 1999.2 1.89 +/‐ 1.07 24.5% 0.000 0.001Loss Cost 2000.1 2.19 +/‐ 1.08 31.2% 0.000 0.000Loss Cost 2000.2 2.41 +/‐ 1.11 35.2% 0.000 0.000Loss Cost 2001.1 2.78 +/‐ 1.08 44.3% 0.000 0.000Loss Cost 2001.2 3.07 +/‐ 1.10 49.8% 0.000 0.000Loss Cost 2002.1 3.43 +/‐ 1.08 56.9% 0.000 0.000Loss Cost 2002.2 3.67 +/‐ 1.11 59.7% 0.000 0.000Loss Cost 2003.1 3.86 +/‐ 1.17 60.7% 0.000 0.000Loss Cost 2003.2 3.85 +/‐ 1.25 58.1% 0.000 0.000Loss Cost 2004.1 4.40 +/‐ 1.16 69.1% 0.000 0.000Loss Cost 2004.2 4.23 +/‐ 1.22 65.7% 0.000 0.000Loss Cost 2005.1 4.33 +/‐ 1.31 64.4% 0.000 0.000Loss Cost 2005.2 4.09 +/‐ 1.38 60.1% 0.000 0.000Loss Cost 2006.1 4.19 +/‐ 1.50 58.5% 0.000 0.000Loss Cost 2006.2 4.00 +/‐ 1.61 53.6% 0.000 0.000Loss Cost 2007.1 4.16 +/‐ 1.76 52.5% 0.000 0.000Loss Cost 2007.2 4.01 +/‐ 1.92 47.3% 0.000 0.000Loss Cost 2008.1 4.46 +/‐ 2.04 51.1% 0.000 0.000Loss Cost 2008.2 4.46 +/‐ 2.26 47.1% 0.000 0.000Loss Cost 2009.1 5.22 +/‐ 2.32 55.7% 0.000 0.000Loss Cost 2009.2 5.25 +/‐ 2.61 51.6% 0.000 0.000Loss Cost 2010.1 6.03 +/‐ 2.77 57.8% 0.000 0.000Loss Cost 2010.2 5.59 +/‐ 3.09 49.9% 0.000 0.001Loss Cost 2011.1 6.37 +/‐ 3.40 53.9% 0.000 0.001Loss Cost 2011.2 6.21 +/‐ 3.95 46.8% 0.000 0.004Loss Cost 2012.1 7.65 +/‐ 4.21 57.5% 0.000 0.002Loss Cost 2012.2 6.68 +/‐ 4.77 46.0% 0.000 0.009Loss Cost 2013.1 7.55 +/‐ 5.71 46.4% 0.000 0.013Loss Cost 2013.2 5.23 +/‐ 5.87 27.6% 0.000 0.068Loss Cost 2014.1 6.66 +/‐ 7.24 33.5% 0.000 0.060Loss Cost 2014.2 4.24 +/‐ 8.40 7.8% 0.001 0.253Loss Cost 2015.1 6.56 +/‐ 11.18 19.3% 0.006 0.179
Severity 1998.2 2.85 +/‐ 0.70 63.9% 0.000 0.000Severity 1999.1 2.78 +/‐ 0.73 61.3% 0.000 0.000Severity 1999.2 2.60 +/‐ 0.74 58.2% 0.000 0.000Severity 2000.1 2.54 +/‐ 0.78 55.2% 0.000 0.000Severity 2000.2 2.40 +/‐ 0.80 51.4% 0.000 0.000Severity 2001.1 2.36 +/‐ 0.85 48.4% 0.000 0.000Severity 2001.2 2.18 +/‐ 0.87 43.7% 0.000 0.000Severity 2002.1 2.11 +/‐ 0.92 40.1% 0.000 0.000Severity 2002.2 1.95 +/‐ 0.96 34.8% 0.000 0.000Severity 2003.1 1.85 +/‐ 1.01 30.5% 0.000 0.001Severity 2003.2 1.74 +/‐ 1.08 25.9% 0.000 0.002Severity 2004.1 2.04 +/‐ 1.09 33.5% 0.000 0.001Severity 2004.2 2.00 +/‐ 1.17 30.0% 0.000 0.002Severity 2005.1 2.22 +/‐ 1.24 33.4% 0.000 0.001Severity 2005.2 2.17 +/‐ 1.33 29.5% 0.000 0.002Severity 2006.1 2.40 +/‐ 1.42 32.5% 0.000 0.002Severity 2006.2 2.45 +/‐ 1.55 30.4% 0.000 0.003Severity 2007.1 2.83 +/‐ 1.62 36.3% 0.000 0.001Severity 2007.2 2.71 +/‐ 1.77 31.0% 0.000 0.004Severity 2008.1 3.16 +/‐ 1.88 37.2% 0.000 0.002Severity 2008.2 3.15 +/‐ 2.08 33.2% 0.000 0.005Severity 2009.1 3.85 +/‐ 2.14 43.8% 0.000 0.001Severity 2009.2 3.72 +/‐ 2.39 37.7% 0.000 0.004Severity 2010.1 4.36 +/‐ 2.57 44.1% 0.000 0.002Severity 2010.2 4.50 +/‐ 2.93 40.8% 0.000 0.005Severity 2011.1 5.66 +/‐ 2.99 54.4% 0.000 0.001Severity 2011.2 5.19 +/‐ 3.40 45.1% 0.000 0.005Severity 2012.1 5.64 +/‐ 3.97 43.7% 0.000 0.008Severity 2012.2 4.80 +/‐ 4.54 30.4% 0.000 0.037Severity 2013.1 5.80 +/‐ 5.37 34.7% 0.000 0.033Severity 2013.2 4.47 +/‐ 6.26 16.9% 0.000 0.131Severity 2014.1 5.57 +/‐ 7.91 19.4% 0.000 0.131Severity 2014.2 3.97 +/‐ 10.01 ‐0.2% 0.000 0.359Severity 2015.1 7.86 +/‐ 12.33 24.1% 0.001 0.149
Frequency 1998.2 ‐1.16 +/‐ 1.04 9.4% 0.000 0.031Frequency 1999.1 ‐0.97 +/‐ 1.07 5.8% 0.000 0.076Frequency 1999.2 ‐0.70 +/‐ 1.08 1.8% 0.000 0.202Frequency 2000.1 ‐0.35 +/‐ 1.06 ‐1.6% 0.000 0.511Frequency 2000.2 0.01 +/‐ 1.04 ‐2.9% 0.000 0.985Frequency 2001.1 0.42 +/‐ 0.98 ‐0.8% 0.000 0.394Frequency 2001.2 0.87 +/‐ 0.88 8.7% 0.000 0.050Frequency 2002.1 1.29 +/‐ 0.78 24.5% 0.000 0.002Frequency 2002.2 1.69 +/‐ 0.66 46.2% 0.000 0.000Frequency 2003.1 1.97 +/‐ 0.62 58.7% 0.000 0.000Frequency 2003.2 2.07 +/‐ 0.65 59.6% 0.000 0.000Frequency 2004.1 2.31 +/‐ 0.63 66.9% 0.000 0.000Frequency 2004.2 2.18 +/‐ 0.66 63.2% 0.000 0.000Frequency 2005.1 2.06 +/‐ 0.69 58.9% 0.000 0.000Frequency 2005.2 1.88 +/‐ 0.71 53.9% 0.000 0.000Frequency 2006.1 1.74 +/‐ 0.75 48.3% 0.000 0.000Frequency 2006.2 1.52 +/‐ 0.76 41.4% 0.000 0.000Frequency 2007.1 1.29 +/‐ 0.78 33.4% 0.000 0.002Frequency 2007.2 1.26 +/‐ 0.86 29.0% 0.000 0.006Frequency 2008.1 1.26 +/‐ 0.94 25.6% 0.000 0.011Frequency 2008.2 1.27 +/‐ 1.05 22.7% 0.000 0.020Frequency 2009.1 1.32 +/‐ 1.17 21.0% 0.000 0.028Frequency 2009.2 1.48 +/‐ 1.30 22.5% 0.000 0.027Frequency 2010.1 1.61 +/‐ 1.46 22.4% 0.000 0.032Frequency 2010.2 1.04 +/‐ 1.45 8.5% 0.000 0.144Frequency 2011.1 0.67 +/‐ 1.58 ‐1.1% 0.000 0.373Frequency 2011.2 0.97 +/‐ 1.80 2.9% 0.000 0.263Frequency 2012.1 1.91 +/‐ 1.62 32.8% 0.000 0.024Frequency 2012.2 1.79 +/‐ 1.93 23.5% 0.000 0.063Frequency 2013.1 1.66 +/‐ 2.34 13.9% 0.000 0.140Frequency 2013.2 0.73 +/‐ 2.47 ‐6.3% 0.000 0.514Frequency 2014.1 1.03 +/‐ 3.14 ‐5.2% 0.000 0.462Frequency 2014.2 0.26 +/‐ 3.92 ‐16.2% 0.000 0.876Frequency 2015.1 ‐1.20 +/‐ 4.62 ‐10.2% 0.000 0.535
Coverage = CM
End Trend Period = 2018.1
Seasonality = F
Excluded Points = NA
Appendix E Page 35
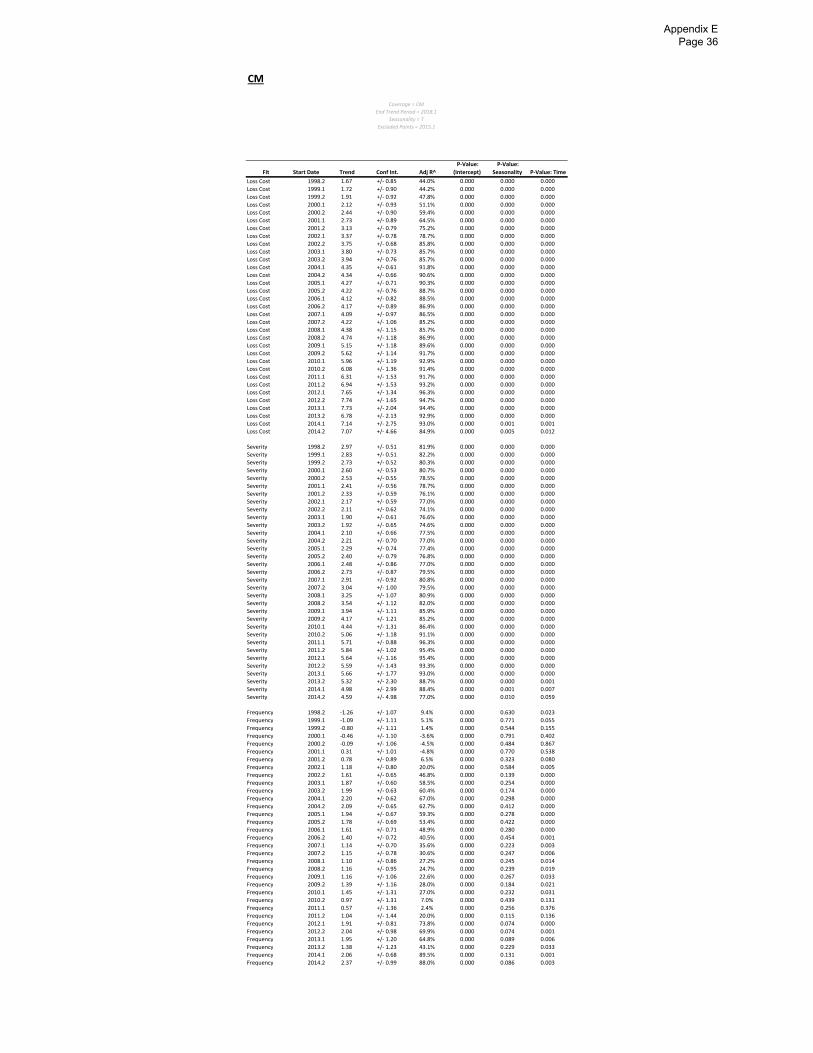
CM
Fit Start Date Trend Conf Int. Adj R^
P‐Value:
(Intercept)
P‐Value:
Seasonality P‐Value: Time
Loss Cost 1998.2 1.67 +/‐ 0.85 44.0% 0.000 0.000 0.000
Loss Cost 1999.1 1.72 +/‐ 0.90 44.2% 0.000 0.000 0.000
Loss Cost 1999.2 1.91 +/‐ 0.92 47.8% 0.000 0.000 0.000
Loss Cost 2000.1 2.12 +/‐ 0.93 51.1% 0.000 0.000 0.000
Loss Cost 2000.2 2.44 +/‐ 0.90 59.4% 0.000 0.000 0.000
Loss Cost 2001.1 2.73 +/‐ 0.89 64.5% 0.000 0.000 0.000
Loss Cost 2001.2 3.13 +/‐ 0.79 75.2% 0.000 0.000 0.000
Loss Cost 2002.1 3.37 +/‐ 0.78 78.7% 0.000 0.000 0.000
Loss Cost 2002.2 3.75 +/‐ 0.68 85.8% 0.000 0.000 0.000
Loss Cost 2003.1 3.80 +/‐ 0.73 85.7% 0.000 0.000 0.000
Loss Cost 2003.2 3.94 +/‐ 0.76 85.7% 0.000 0.000 0.000
Loss Cost 2004.1 4.35 +/‐ 0.61 91.8% 0.000 0.000 0.000
Loss Cost 2004.2 4.34 +/‐ 0.66 90.6% 0.000 0.000 0.000
Loss Cost 2005.1 4.27 +/‐ 0.71 90.3% 0.000 0.000 0.000
Loss Cost 2005.2 4.22 +/‐ 0.76 88.7% 0.000 0.000 0.000
Loss Cost 2006.1 4.12 +/‐ 0.82 88.5% 0.000 0.000 0.000
Loss Cost 2006.2 4.17 +/‐ 0.89 86.9% 0.000 0.000 0.000
Loss Cost 2007.1 4.09 +/‐ 0.97 86.5% 0.000 0.000 0.000
Loss Cost 2007.2 4.22 +/‐ 1.06 85.2% 0.000 0.000 0.000
Loss Cost 2008.1 4.38 +/‐ 1.15 85.7% 0.000 0.000 0.000
Loss Cost 2008.2 4.74 +/‐ 1.18 86.9% 0.000 0.000 0.000
Loss Cost 2009.1 5.15 +/‐ 1.18 89.6% 0.000 0.000 0.000
Loss Cost 2009.2 5.62 +/‐ 1.14 91.7% 0.000 0.000 0.000
Loss Cost 2010.1 5.96 +/‐ 1.19 92.9% 0.000 0.000 0.000
Loss Cost 2010.2 6.08 +/‐ 1.36 91.4% 0.000 0.000 0.000
Loss Cost 2011.1 6.31 +/‐ 1.53 91.7% 0.000 0.000 0.000
Loss Cost 2011.2 6.94 +/‐ 1.53 93.2% 0.000 0.000 0.000
Loss Cost 2012.1 7.65 +/‐ 1.34 96.3% 0.000 0.000 0.000
Loss Cost 2012.2 7.74 +/‐ 1.65 94.7% 0.000 0.000 0.000
Loss Cost 2013.1 7.73 +/‐ 2.04 94.4% 0.000 0.000 0.000
Loss Cost 2013.2 6.78 +/‐ 2.13 92.9% 0.000 0.000 0.000
Loss Cost 2014.1 7.14 +/‐ 2.75 93.0% 0.000 0.001 0.001
Loss Cost 2014.2 7.07 +/‐ 4.66 84.9% 0.000 0.005 0.012
Severity 1998.2 2.97 +/‐ 0.51 81.9% 0.000 0.000 0.000
Severity 1999.1 2.83 +/‐ 0.51 82.2% 0.000 0.000 0.000
Severity 1999.2 2.73 +/‐ 0.52 80.3% 0.000 0.000 0.000
Severity 2000.1 2.60 +/‐ 0.53 80.7% 0.000 0.000 0.000
Severity 2000.2 2.53 +/‐ 0.55 78.5% 0.000 0.000 0.000
Severity 2001.1 2.41 +/‐ 0.56 78.7% 0.000 0.000 0.000
Severity 2001.2 2.33 +/‐ 0.59 76.1% 0.000 0.000 0.000
Severity 2002.1 2.17 +/‐ 0.59 77.0% 0.000 0.000 0.000
Severity 2002.2 2.11 +/‐ 0.62 74.1% 0.000 0.000 0.000
Severity 2003.1 1.90 +/‐ 0.61 76.6% 0.000 0.000 0.000
Severity 2003.2 1.92 +/‐ 0.65 74.6% 0.000 0.000 0.000
Severity 2004.1 2.10 +/‐ 0.66 77.5% 0.000 0.000 0.000
Severity 2004.2 2.21 +/‐ 0.70 77.0% 0.000 0.000 0.000
Severity 2005.1 2.29 +/‐ 0.74 77.4% 0.000 0.000 0.000
Severity 2005.2 2.40 +/‐ 0.79 76.8% 0.000 0.000 0.000
Severity 2006.1 2.48 +/‐ 0.86 77.0% 0.000 0.000 0.000
Severity 2006.2 2.73 +/‐ 0.87 79.5% 0.000 0.000 0.000
Severity 2007.1 2.91 +/‐ 0.92 80.8% 0.000 0.000 0.000
Severity 2007.2 3.04 +/‐ 1.00 79.5% 0.000 0.000 0.000
Severity 2008.1 3.25 +/‐ 1.07 80.9% 0.000 0.000 0.000
Severity 2008.2 3.54 +/‐ 1.12 82.0% 0.000 0.000 0.000
Severity 2009.1 3.94 +/‐ 1.11 85.9% 0.000 0.000 0.000
Severity 2009.2 4.17 +/‐ 1.21 85.2% 0.000 0.000 0.000
Severity 2010.1 4.44 +/‐ 1.31 86.4% 0.000 0.000 0.000
Severity 2010.2 5.06 +/‐ 1.18 91.1% 0.000 0.000 0.000
Severity 2011.1 5.71 +/‐ 0.88 96.3% 0.000 0.000 0.000
Severity 2011.2 5.84 +/‐ 1.02 95.4% 0.000 0.000 0.000
Severity 2012.1 5.64 +/‐ 1.16 95.4% 0.000 0.000 0.000
Severity 2012.2 5.59 +/‐ 1.43 93.3% 0.000 0.000 0.000
Severity 2013.1 5.66 +/‐ 1.77 93.0% 0.000 0.000 0.000
Severity 2013.2 5.32 +/‐ 2.30 88.7% 0.000 0.000 0.001
Severity 2014.1 4.98 +/‐ 2.99 88.4% 0.000 0.001 0.007
Severity 2014.2 4.59 +/‐ 4.98 77.0% 0.000 0.010 0.059
Frequency 1998.2 ‐1.26 +/‐ 1.07 9.4% 0.000 0.630 0.023
Frequency 1999.1 ‐1.09 +/‐ 1.11 5.1% 0.000 0.771 0.055
Frequency 1999.2 ‐0.80 +/‐ 1.11 1.4% 0.000 0.544 0.155
Frequency 2000.1 ‐0.46 +/‐ 1.10 ‐3.6% 0.000 0.791 0.402
Frequency 2000.2 ‐0.09 +/‐ 1.06 ‐4.5% 0.000 0.484 0.867
Frequency 2001.1 0.31 +/‐ 1.01 ‐4.8% 0.000 0.770 0.538
Frequency 2001.2 0.78 +/‐ 0.89 6.5% 0.000 0.323 0.080
Frequency 2002.1 1.18 +/‐ 0.80 20.0% 0.000 0.584 0.005
Frequency 2002.2 1.61 +/‐ 0.65 46.8% 0.000 0.139 0.000
Frequency 2003.1 1.87 +/‐ 0.60 58.5% 0.000 0.254 0.000
Frequency 2003.2 1.99 +/‐ 0.63 60.4% 0.000 0.174 0.000
Frequency 2004.1 2.20 +/‐ 0.62 67.0% 0.000 0.298 0.000
Frequency 2004.2 2.09 +/‐ 0.65 62.7% 0.000 0.412 0.000
Frequency 2005.1 1.94 +/‐ 0.67 59.3% 0.000 0.278 0.000
Frequency 2005.2 1.78 +/‐ 0.69 53.4% 0.000 0.422 0.000
Frequency 2006.1 1.61 +/‐ 0.71 48.9% 0.000 0.280 0.000
Frequency 2006.2 1.40 +/‐ 0.72 40.5% 0.000 0.454 0.001
Frequency 2007.1 1.14 +/‐ 0.70 35.6% 0.000 0.223 0.003
Frequency 2007.2 1.15 +/‐ 0.78 30.6% 0.000 0.247 0.006
Frequency 2008.1 1.10 +/‐ 0.86 27.2% 0.000 0.245 0.014
Frequency 2008.2 1.16 +/‐ 0.95 24.7% 0.000 0.239 0.019
Frequency 2009.1 1.16 +/‐ 1.06 22.6% 0.000 0.267 0.033
Frequency 2009.2 1.39 +/‐ 1.16 28.0% 0.000 0.184 0.021
Frequency 2010.1 1.45 +/‐ 1.31 27.0% 0.000 0.232 0.031
Frequency 2010.2 0.97 +/‐ 1.31 7.0% 0.000 0.439 0.131
Frequency 2011.1 0.57 +/‐ 1.36 2.4% 0.000 0.256 0.376
Frequency 2011.2 1.04 +/‐ 1.44 20.0% 0.000 0.115 0.136
Frequency 2012.1 1.91 +/‐ 0.81 73.8% 0.000 0.074 0.000
Frequency 2012.2 2.04 +/‐ 0.98 69.9% 0.000 0.074 0.001
Frequency 2013.1 1.95 +/‐ 1.20 64.8% 0.000 0.089 0.006
Frequency 2013.2 1.38 +/‐ 1.23 43.1% 0.000 0.229 0.033
Frequency 2014.1 2.06 +/‐ 0.68 89.5% 0.000 0.131 0.001
Frequency 2014.2 2.37 +/‐ 0.99 88.0% 0.000 0.086 0.003
Coverage = CM
End Trend Period = 2018.1
Seasonality = T
Excluded Points = 2015.1
Appendix E Page 36

CM
Fit Start Date Trend Conf Int. Adj R^
P‐Value:
(Intercept) P‐Value: Time
Loss Cost 1998.2 1.65 +/‐ 1.01 20.8% 0.000 0.002
Loss Cost 1999.1 1.77 +/‐ 1.06 22.4% 0.000 0.002
Loss Cost 1999.2 1.88 +/‐ 1.11 23.5% 0.000 0.001
Loss Cost 2000.1 2.18 +/‐ 1.11 30.3% 0.000 0.000
Loss Cost 2000.2 2.41 +/‐ 1.15 34.3% 0.000 0.000
Loss Cost 2001.1 2.79 +/‐ 1.12 43.5% 0.000 0.000
Loss Cost 2001.2 3.08 +/‐ 1.13 49.0% 0.000 0.000
Loss Cost 2002.1 3.45 +/‐ 1.12 56.3% 0.000 0.000
Loss Cost 2002.2 3.69 +/‐ 1.15 59.1% 0.000 0.000
Loss Cost 2003.1 3.88 +/‐ 1.21 60.2% 0.000 0.000
Loss Cost 2003.2 3.88 +/‐ 1.30 57.6% 0.000 0.000
Loss Cost 2004.1 4.44 +/‐ 1.20 68.8% 0.000 0.000
Loss Cost 2004.2 4.27 +/‐ 1.27 65.4% 0.000 0.000
Loss Cost 2005.1 4.37 +/‐ 1.36 64.2% 0.000 0.000
Loss Cost 2005.2 4.13 +/‐ 1.44 59.9% 0.000 0.000
Loss Cost 2006.1 4.23 +/‐ 1.56 58.2% 0.000 0.000
Loss Cost 2006.2 4.04 +/‐ 1.68 53.4% 0.000 0.000
Loss Cost 2007.1 4.20 +/‐ 1.82 52.3% 0.000 0.000
Loss Cost 2007.2 4.05 +/‐ 1.99 47.2% 0.000 0.000
Loss Cost 2008.1 4.50 +/‐ 2.12 51.0% 0.000 0.000
Loss Cost 2008.2 4.51 +/‐ 2.36 47.1% 0.000 0.001
Loss Cost 2009.1 5.27 +/‐ 2.42 55.8% 0.000 0.000
Loss Cost 2009.2 5.30 +/‐ 2.72 51.7% 0.000 0.001
Loss Cost 2010.1 6.08 +/‐ 2.89 57.8% 0.000 0.000
Loss Cost 2010.2 5.63 +/‐ 3.23 50.1% 0.000 0.002
Loss Cost 2011.1 6.40 +/‐ 3.57 53.9% 0.000 0.002
Loss Cost 2011.2 6.23 +/‐ 4.16 46.8% 0.000 0.006
Loss Cost 2012.1 7.65 +/‐ 4.46 57.3% 0.000 0.003
Loss Cost 2012.2 6.65 +/‐ 5.09 45.5% 0.000 0.014
Loss Cost 2013.1 7.51 +/‐ 6.19 45.2% 0.000 0.020
Loss Cost 2013.2 4.99 +/‐ 6.41 24.3% 0.000 0.101
Loss Cost 2014.1 6.38 +/‐ 8.34 28.1% 0.001 0.102
Loss Cost 2014.2 2.99 +/‐ 9.89 ‐6.7% 0.002 0.466
Severity 1998.2 2.95 +/‐ 0.70 66.1% 0.000 0.000
Severity 1999.1 2.88 +/‐ 0.73 63.5% 0.000 0.000
Severity 1999.2 2.71 +/‐ 0.74 60.7% 0.000 0.000
Severity 2000.1 2.65 +/‐ 0.78 57.8% 0.000 0.000
Severity 2000.2 2.51 +/‐ 0.80 54.2% 0.000 0.000
Severity 2001.1 2.47 +/‐ 0.85 51.3% 0.000 0.000
Severity 2001.2 2.29 +/‐ 0.87 46.9% 0.000 0.000
Severity 2002.1 2.23 +/‐ 0.93 43.3% 0.000 0.000
Severity 2002.2 2.06 +/‐ 0.96 38.3% 0.000 0.000
Severity 2003.1 1.97 +/‐ 1.02 33.9% 0.000 0.000
Severity 2003.2 1.86 +/‐ 1.08 29.4% 0.000 0.001
Severity 2004.1 2.18 +/‐ 1.09 37.4% 0.000 0.000
Severity 2004.2 2.14 +/‐ 1.18 33.9% 0.000 0.001
Severity 2005.1 2.37 +/‐ 1.24 37.6% 0.000 0.001
Severity 2005.2 2.32 +/‐ 1.34 33.7% 0.000 0.001
Severity 2006.1 2.56 +/‐ 1.42 36.9% 0.000 0.001
Severity 2006.2 2.62 +/‐ 1.55 34.8% 0.000 0.002
Severity 2007.1 3.01 +/‐ 1.61 41.1% 0.000 0.001
Severity 2007.2 2.89 +/‐ 1.76 35.8% 0.000 0.002
Severity 2008.1 3.35 +/‐ 1.85 42.2% 0.000 0.001
Severity 2008.2 3.34 +/‐ 2.06 38.2% 0.000 0.003
Severity 2009.1 4.04 +/‐ 2.09 49.2% 0.000 0.001
Severity 2009.2 3.91 +/‐ 2.34 43.2% 0.000 0.002
Severity 2010.1 4.53 +/‐ 2.50 49.6% 0.000 0.001
Severity 2010.2 4.66 +/‐ 2.86 46.1% 0.000 0.003
Severity 2011.1 5.78 +/‐ 2.88 59.8% 0.000 0.001
Severity 2011.2 5.27 +/‐ 3.25 50.8% 0.000 0.004
Severity 2012.1 5.64 +/‐ 3.83 48.5% 0.000 0.007
Severity 2012.2 4.67 +/‐ 4.31 34.6% 0.000 0.033
Severity 2013.1 5.48 +/‐ 5.20 36.7% 0.000 0.037
Severity 2013.2 3.73 +/‐ 5.81 14.8% 0.000 0.166
Severity 2014.1 4.28 +/‐ 7.78 11.3% 0.000 0.218
Severity 2014.2 0.96 +/‐ 9.04 ‐18.2% 0.000 0.795
Frequency 1998.2 ‐1.26 +/‐ 1.05 11.3% 0.000 0.021
Frequency 1999.1 ‐1.08 +/‐ 1.09 7.5% 0.000 0.053
Frequency 1999.2 ‐0.80 +/‐ 1.10 3.2% 0.000 0.148
Frequency 2000.1 ‐0.45 +/‐ 1.08 ‐0.8% 0.000 0.400
Frequency 2000.2 ‐0.09 +/‐ 1.05 ‐2.9% 0.000 0.856
Frequency 2001.1 0.31 +/‐ 1.00 ‐1.8% 0.000 0.525
Frequency 2001.2 0.78 +/‐ 0.89 6.5% 0.000 0.083
Frequency 2002.1 1.19 +/‐ 0.79 21.9% 0.000 0.004
Frequency 2002.2 1.60 +/‐ 0.66 44.4% 0.000 0.000
Frequency 2003.1 1.88 +/‐ 0.61 57.9% 0.000 0.000
Frequency 2003.2 1.98 +/‐ 0.64 59.0% 0.000 0.000
Frequency 2004.1 2.21 +/‐ 0.62 66.9% 0.000 0.000
Frequency 2004.2 2.08 +/‐ 0.64 63.2% 0.000 0.000
Frequency 2005.1 1.95 +/‐ 0.67 58.9% 0.000 0.000
Frequency 2005.2 1.77 +/‐ 0.68 54.0% 0.000 0.000
Frequency 2006.1 1.62 +/‐ 0.71 48.3% 0.000 0.000
Frequency 2006.2 1.39 +/‐ 0.71 41.6% 0.000 0.001
Frequency 2007.1 1.16 +/‐ 0.71 33.7% 0.000 0.003
Frequency 2007.2 1.12 +/‐ 0.78 29.0% 0.000 0.007
Frequency 2008.1 1.12 +/‐ 0.86 25.4% 0.000 0.014
Frequency 2008.2 1.13 +/‐ 0.96 22.5% 0.000 0.023
Frequency 2009.1 1.18 +/‐ 1.07 21.0% 0.000 0.032
Frequency 2009.2 1.34 +/‐ 1.18 23.4% 0.000 0.028
Frequency 2010.1 1.47 +/‐ 1.33 24.1% 0.000 0.031
Frequency 2010.2 0.93 +/‐ 1.27 9.6% 0.000 0.139
Frequency 2011.1 0.58 +/‐ 1.37 ‐1.1% 0.000 0.373
Frequency 2011.2 0.91 +/‐ 1.53 5.7% 0.000 0.216
Frequency 2012.1 1.91 +/‐ 0.91 65.8% 0.000 0.001
Frequency 2012.2 1.90 +/‐ 1.10 59.1% 0.000 0.003
Frequency 2013.1 1.92 +/‐ 1.36 52.2% 0.000 0.011
Frequency 2013.2 1.21 +/‐ 1.21 36.7% 0.000 0.049
Frequency 2014.1 2.01 +/‐ 0.76 85.6% 0.000 0.001
Frequency 2014.2 2.01 +/‐ 1.10 78.0% 0.000 0.005
Coverage = CM
End Trend Period = 2018.1
Seasonality = F
Excluded Points = 2015.1
Appendix E Page 37
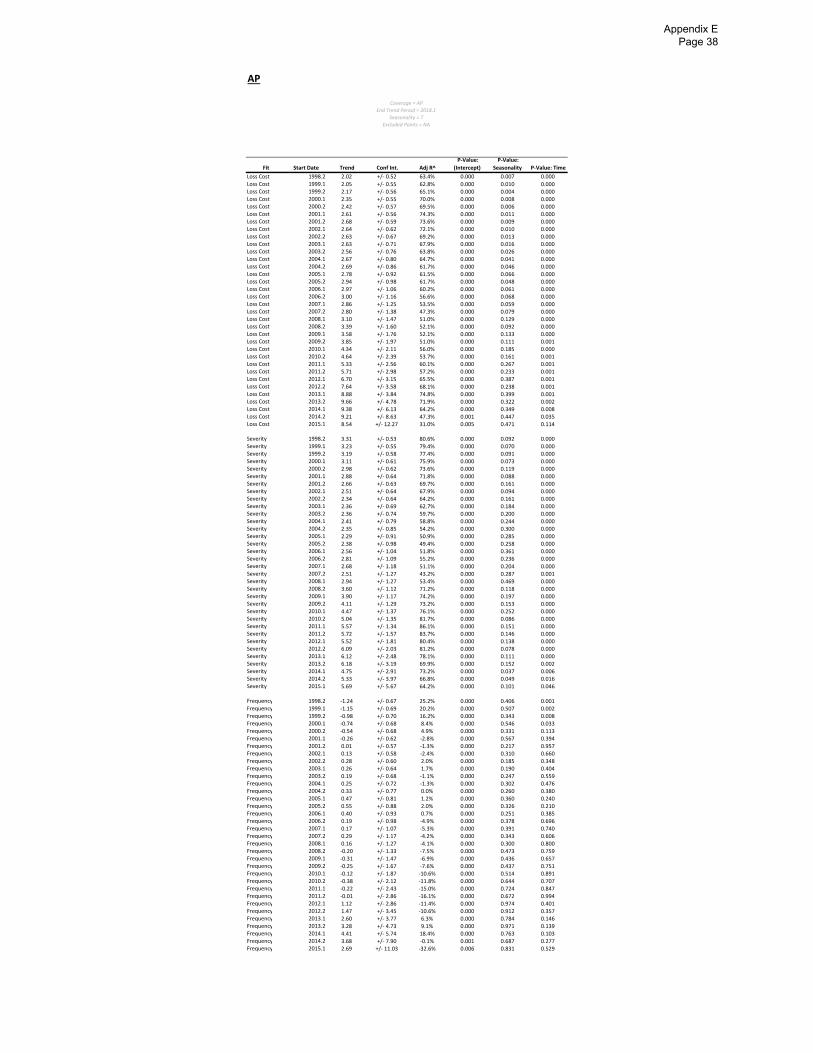
AP
Fit Start Date Trend Conf Int. Adj R^
P‐Value:
(Intercept)
P‐Value:
Seasonality P‐Value: Time
Loss Cost 1998.2 2.02 +/‐ 0.52 63.4% 0.000 0.007 0.000Loss Cost 1999.1 2.05 +/‐ 0.55 62.8% 0.000 0.010 0.000Loss Cost 1999.2 2.17 +/‐ 0.56 65.1% 0.000 0.004 0.000Loss Cost 2000.1 2.35 +/‐ 0.55 70.0% 0.000 0.008 0.000Loss Cost 2000.2 2.42 +/‐ 0.57 69.5% 0.000 0.006 0.000Loss Cost 2001.1 2.61 +/‐ 0.56 74.3% 0.000 0.011 0.000Loss Cost 2001.2 2.68 +/‐ 0.59 73.6% 0.000 0.009 0.000Loss Cost 2002.1 2.64 +/‐ 0.62 72.1% 0.000 0.010 0.000Loss Cost 2002.2 2.63 +/‐ 0.67 69.2% 0.000 0.013 0.000Loss Cost 2003.1 2.63 +/‐ 0.71 67.9% 0.000 0.016 0.000Loss Cost 2003.2 2.56 +/‐ 0.76 63.8% 0.000 0.026 0.000Loss Cost 2004.1 2.67 +/‐ 0.80 64.7% 0.000 0.041 0.000Loss Cost 2004.2 2.69 +/‐ 0.86 61.7% 0.000 0.046 0.000Loss Cost 2005.1 2.78 +/‐ 0.92 61.5% 0.000 0.066 0.000Loss Cost 2005.2 2.94 +/‐ 0.98 61.7% 0.000 0.048 0.000Loss Cost 2006.1 2.97 +/‐ 1.06 60.2% 0.000 0.061 0.000Loss Cost 2006.2 3.00 +/‐ 1.16 56.6% 0.000 0.068 0.000Loss Cost 2007.1 2.86 +/‐ 1.25 53.5% 0.000 0.059 0.000Loss Cost 2007.2 2.80 +/‐ 1.38 47.3% 0.000 0.079 0.000Loss Cost 2008.1 3.10 +/‐ 1.47 51.0% 0.000 0.129 0.000Loss Cost 2008.2 3.39 +/‐ 1.60 52.1% 0.000 0.092 0.000Loss Cost 2009.1 3.58 +/‐ 1.76 52.1% 0.000 0.133 0.000Loss Cost 2009.2 3.85 +/‐ 1.97 51.0% 0.000 0.111 0.001Loss Cost 2010.1 4.34 +/‐ 2.11 56.0% 0.000 0.185 0.000Loss Cost 2010.2 4.64 +/‐ 2.39 53.7% 0.000 0.161 0.001Loss Cost 2011.1 5.33 +/‐ 2.56 60.1% 0.000 0.267 0.001Loss Cost 2011.2 5.71 +/‐ 2.98 57.2% 0.000 0.233 0.001Loss Cost 2012.1 6.70 +/‐ 3.15 65.5% 0.000 0.387 0.001Loss Cost 2012.2 7.64 +/‐ 3.58 68.1% 0.000 0.238 0.001Loss Cost 2013.1 8.88 +/‐ 3.84 74.8% 0.000 0.399 0.001Loss Cost 2013.2 9.66 +/‐ 4.78 71.9% 0.000 0.322 0.002Loss Cost 2014.1 9.38 +/‐ 6.13 64.2% 0.000 0.349 0.008Loss Cost 2014.2 9.21 +/‐ 8.63 47.3% 0.001 0.447 0.035Loss Cost 2015.1 8.54 +/‐ 12.27 31.0% 0.005 0.471 0.114
Severity 1998.2 3.31 +/‐ 0.53 80.6% 0.000 0.092 0.000Severity 1999.1 3.23 +/‐ 0.55 79.4% 0.000 0.070 0.000Severity 1999.2 3.19 +/‐ 0.58 77.4% 0.000 0.091 0.000Severity 2000.1 3.11 +/‐ 0.61 75.9% 0.000 0.073 0.000Severity 2000.2 2.98 +/‐ 0.62 73.6% 0.000 0.119 0.000Severity 2001.1 2.88 +/‐ 0.64 71.8% 0.000 0.088 0.000Severity 2001.2 2.66 +/‐ 0.63 69.7% 0.000 0.161 0.000Severity 2002.1 2.51 +/‐ 0.64 67.9% 0.000 0.094 0.000Severity 2002.2 2.34 +/‐ 0.64 64.2% 0.000 0.161 0.000Severity 2003.1 2.36 +/‐ 0.69 62.7% 0.000 0.184 0.000Severity 2003.2 2.36 +/‐ 0.74 59.7% 0.000 0.200 0.000Severity 2004.1 2.41 +/‐ 0.79 58.8% 0.000 0.244 0.000Severity 2004.2 2.35 +/‐ 0.85 54.2% 0.000 0.300 0.000Severity 2005.1 2.29 +/‐ 0.91 50.9% 0.000 0.285 0.000Severity 2005.2 2.38 +/‐ 0.98 49.4% 0.000 0.258 0.000Severity 2006.1 2.56 +/‐ 1.04 51.8% 0.000 0.361 0.000Severity 2006.2 2.81 +/‐ 1.09 55.2% 0.000 0.236 0.000Severity 2007.1 2.68 +/‐ 1.18 51.1% 0.000 0.204 0.000Severity 2007.2 2.51 +/‐ 1.27 43.2% 0.000 0.287 0.001Severity 2008.1 2.94 +/‐ 1.27 53.4% 0.000 0.469 0.000Severity 2008.2 3.60 +/‐ 1.12 71.2% 0.000 0.118 0.000Severity 2009.1 3.90 +/‐ 1.17 74.2% 0.000 0.197 0.000Severity 2009.2 4.11 +/‐ 1.29 73.2% 0.000 0.153 0.000Severity 2010.1 4.47 +/‐ 1.37 76.1% 0.000 0.252 0.000Severity 2010.2 5.04 +/‐ 1.35 81.7% 0.000 0.086 0.000Severity 2011.1 5.57 +/‐ 1.34 86.1% 0.000 0.151 0.000Severity 2011.2 5.72 +/‐ 1.57 83.7% 0.000 0.146 0.000Severity 2012.1 5.52 +/‐ 1.81 80.4% 0.000 0.138 0.000Severity 2012.2 6.09 +/‐ 2.03 81.2% 0.000 0.078 0.000Severity 2013.1 6.12 +/‐ 2.48 78.1% 0.000 0.111 0.000Severity 2013.2 6.18 +/‐ 3.19 69.9% 0.000 0.152 0.002Severity 2014.1 4.75 +/‐ 2.91 73.2% 0.000 0.037 0.006Severity 2014.2 5.33 +/‐ 3.97 66.8% 0.000 0.049 0.016Severity 2015.1 5.69 +/‐ 5.67 64.2% 0.000 0.101 0.046
Frequency 1998.2 ‐1.24 +/‐ 0.67 25.2% 0.000 0.406 0.001Frequency 1999.1 ‐1.15 +/‐ 0.69 20.2% 0.000 0.507 0.002Frequency 1999.2 ‐0.98 +/‐ 0.70 16.2% 0.000 0.343 0.008Frequency 2000.1 ‐0.74 +/‐ 0.68 8.4% 0.000 0.546 0.033Frequency 2000.2 ‐0.54 +/‐ 0.68 4.9% 0.000 0.331 0.113Frequency 2001.1 ‐0.26 +/‐ 0.62 ‐2.8% 0.000 0.567 0.394Frequency 2001.2 0.01 +/‐ 0.57 ‐1.3% 0.000 0.217 0.957Frequency 2002.1 0.13 +/‐ 0.58 ‐2.4% 0.000 0.310 0.660Frequency 2002.2 0.28 +/‐ 0.60 2.0% 0.000 0.185 0.348Frequency 2003.1 0.26 +/‐ 0.64 1.7% 0.000 0.190 0.404Frequency 2003.2 0.19 +/‐ 0.68 ‐1.1% 0.000 0.247 0.559Frequency 2004.1 0.25 +/‐ 0.72 ‐1.3% 0.000 0.302 0.476Frequency 2004.2 0.33 +/‐ 0.77 0.0% 0.000 0.260 0.380Frequency 2005.1 0.47 +/‐ 0.81 1.2% 0.000 0.360 0.240Frequency 2005.2 0.55 +/‐ 0.88 2.0% 0.000 0.326 0.210Frequency 2006.1 0.40 +/‐ 0.93 0.7% 0.000 0.251 0.385Frequency 2006.2 0.19 +/‐ 0.98 ‐4.9% 0.000 0.378 0.696Frequency 2007.1 0.17 +/‐ 1.07 ‐5.3% 0.000 0.391 0.740Frequency 2007.2 0.29 +/‐ 1.17 ‐4.2% 0.000 0.343 0.606Frequency 2008.1 0.16 +/‐ 1.27 ‐4.1% 0.000 0.300 0.800Frequency 2008.2 ‐0.20 +/‐ 1.33 ‐7.5% 0.000 0.473 0.759Frequency 2009.1 ‐0.31 +/‐ 1.47 ‐6.9% 0.000 0.436 0.657Frequency 2009.2 ‐0.25 +/‐ 1.67 ‐7.6% 0.000 0.437 0.751Frequency 2010.1 ‐0.12 +/‐ 1.87 ‐10.6% 0.000 0.514 0.891Frequency 2010.2 ‐0.38 +/‐ 2.12 ‐11.8% 0.000 0.644 0.707Frequency 2011.1 ‐0.22 +/‐ 2.43 ‐15.0% 0.000 0.724 0.847Frequency 2011.2 ‐0.01 +/‐ 2.86 ‐16.1% 0.000 0.672 0.994Frequency 2012.1 1.12 +/‐ 2.86 ‐11.4% 0.000 0.974 0.401Frequency 2012.2 1.47 +/‐ 3.45 ‐10.6% 0.000 0.912 0.357Frequency 2013.1 2.60 +/‐ 3.77 6.3% 0.000 0.784 0.146Frequency 2013.2 3.28 +/‐ 4.73 9.1% 0.000 0.971 0.139Frequency 2014.1 4.41 +/‐ 5.74 18.4% 0.000 0.763 0.103Frequency 2014.2 3.68 +/‐ 7.90 ‐0.1% 0.001 0.687 0.277Frequency 2015.1 2.69 +/‐ 11.03 ‐32.6% 0.006 0.831 0.529
Coverage = AP
End Trend Period = 2018.1
Seasonality = T
Excluded Points = NA
Appendix E Page 38
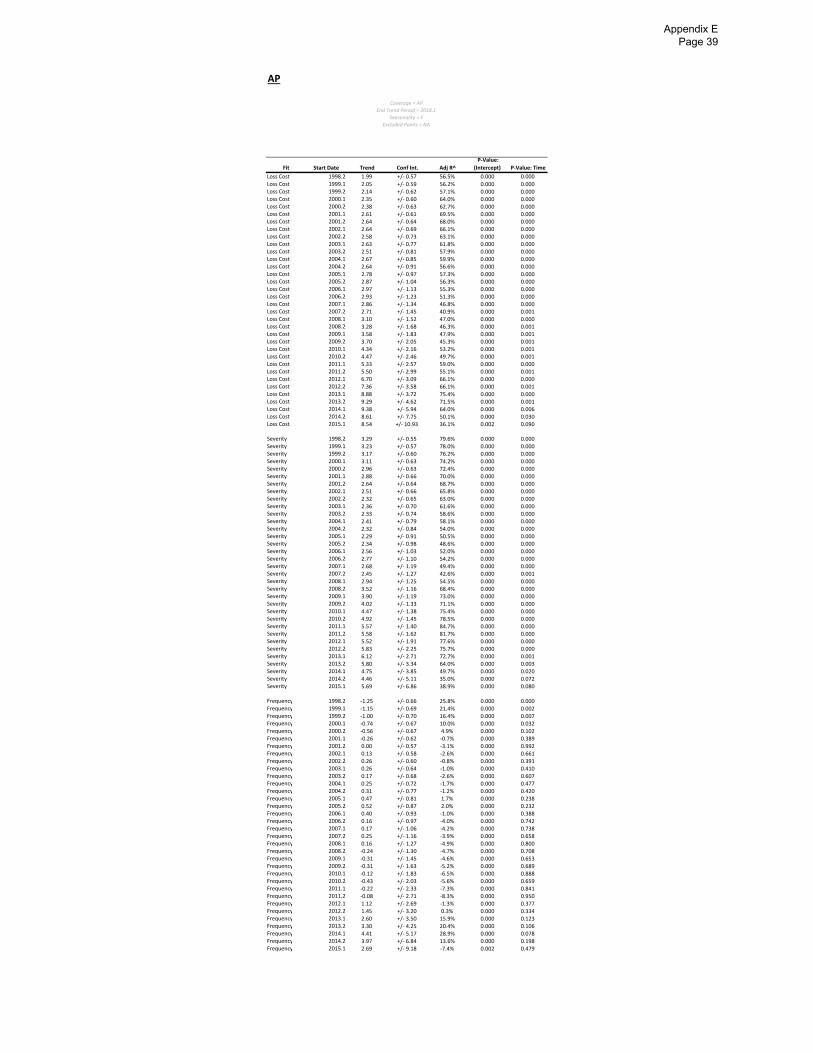
AP
Fit Start Date Trend Conf Int. Adj R^
P‐Value:
(Intercept) P‐Value: Time
Loss Cost 1998.2 1.99 +/‐ 0.57 56.5% 0.000 0.000Loss Cost 1999.1 2.05 +/‐ 0.59 56.2% 0.000 0.000Loss Cost 1999.2 2.14 +/‐ 0.62 57.1% 0.000 0.000Loss Cost 2000.1 2.35 +/‐ 0.60 64.0% 0.000 0.000Loss Cost 2000.2 2.38 +/‐ 0.63 62.7% 0.000 0.000Loss Cost 2001.1 2.61 +/‐ 0.61 69.5% 0.000 0.000Loss Cost 2001.2 2.64 +/‐ 0.64 68.0% 0.000 0.000Loss Cost 2002.1 2.64 +/‐ 0.69 66.1% 0.000 0.000Loss Cost 2002.2 2.58 +/‐ 0.73 63.1% 0.000 0.000Loss Cost 2003.1 2.63 +/‐ 0.77 61.8% 0.000 0.000Loss Cost 2003.2 2.51 +/‐ 0.81 57.9% 0.000 0.000Loss Cost 2004.1 2.67 +/‐ 0.85 59.9% 0.000 0.000Loss Cost 2004.2 2.64 +/‐ 0.91 56.6% 0.000 0.000Loss Cost 2005.1 2.78 +/‐ 0.97 57.3% 0.000 0.000Loss Cost 2005.2 2.87 +/‐ 1.04 56.3% 0.000 0.000Loss Cost 2006.1 2.97 +/‐ 1.13 55.3% 0.000 0.000Loss Cost 2006.2 2.93 +/‐ 1.23 51.3% 0.000 0.000Loss Cost 2007.1 2.86 +/‐ 1.34 46.8% 0.000 0.000Loss Cost 2007.2 2.71 +/‐ 1.45 40.9% 0.000 0.001Loss Cost 2008.1 3.10 +/‐ 1.52 47.0% 0.000 0.000Loss Cost 2008.2 3.28 +/‐ 1.68 46.3% 0.000 0.001Loss Cost 2009.1 3.58 +/‐ 1.83 47.9% 0.000 0.001Loss Cost 2009.2 3.70 +/‐ 2.05 45.3% 0.000 0.001Loss Cost 2010.1 4.34 +/‐ 2.16 53.2% 0.000 0.001Loss Cost 2010.2 4.47 +/‐ 2.46 49.7% 0.000 0.001Loss Cost 2011.1 5.33 +/‐ 2.57 59.0% 0.000 0.000Loss Cost 2011.2 5.50 +/‐ 2.99 55.1% 0.000 0.001Loss Cost 2012.1 6.70 +/‐ 3.09 66.1% 0.000 0.000Loss Cost 2012.2 7.36 +/‐ 3.58 66.1% 0.000 0.001Loss Cost 2013.1 8.88 +/‐ 3.72 75.4% 0.000 0.000Loss Cost 2013.2 9.29 +/‐ 4.62 71.5% 0.000 0.001Loss Cost 2014.1 9.38 +/‐ 5.94 64.0% 0.000 0.006Loss Cost 2014.2 8.61 +/‐ 7.75 50.1% 0.000 0.030Loss Cost 2015.1 8.54 +/‐ 10.93 36.1% 0.002 0.090
Severity 1998.2 3.29 +/‐ 0.55 79.6% 0.000 0.000Severity 1999.1 3.23 +/‐ 0.57 78.0% 0.000 0.000Severity 1999.2 3.17 +/‐ 0.60 76.2% 0.000 0.000Severity 2000.1 3.11 +/‐ 0.63 74.2% 0.000 0.000Severity 2000.2 2.96 +/‐ 0.63 72.4% 0.000 0.000Severity 2001.1 2.88 +/‐ 0.66 70.0% 0.000 0.000Severity 2001.2 2.64 +/‐ 0.64 68.7% 0.000 0.000Severity 2002.1 2.51 +/‐ 0.66 65.8% 0.000 0.000Severity 2002.2 2.32 +/‐ 0.65 63.0% 0.000 0.000Severity 2003.1 2.36 +/‐ 0.70 61.6% 0.000 0.000Severity 2003.2 2.33 +/‐ 0.74 58.6% 0.000 0.000Severity 2004.1 2.41 +/‐ 0.79 58.1% 0.000 0.000Severity 2004.2 2.32 +/‐ 0.84 54.0% 0.000 0.000Severity 2005.1 2.29 +/‐ 0.91 50.5% 0.000 0.000Severity 2005.2 2.34 +/‐ 0.98 48.6% 0.000 0.000Severity 2006.1 2.56 +/‐ 1.03 52.0% 0.000 0.000Severity 2006.2 2.77 +/‐ 1.10 54.2% 0.000 0.000Severity 2007.1 2.68 +/‐ 1.19 49.4% 0.000 0.000Severity 2007.2 2.45 +/‐ 1.27 42.6% 0.000 0.001Severity 2008.1 2.94 +/‐ 1.25 54.5% 0.000 0.000Severity 2008.2 3.52 +/‐ 1.16 68.4% 0.000 0.000Severity 2009.1 3.90 +/‐ 1.19 73.0% 0.000 0.000Severity 2009.2 4.02 +/‐ 1.33 71.1% 0.000 0.000Severity 2010.1 4.47 +/‐ 1.38 75.4% 0.000 0.000Severity 2010.2 4.92 +/‐ 1.45 78.5% 0.000 0.000Severity 2011.1 5.57 +/‐ 1.40 84.7% 0.000 0.000Severity 2011.2 5.58 +/‐ 1.62 81.7% 0.000 0.000Severity 2012.1 5.52 +/‐ 1.91 77.6% 0.000 0.000Severity 2012.2 5.83 +/‐ 2.25 75.7% 0.000 0.000Severity 2013.1 6.12 +/‐ 2.71 72.7% 0.000 0.001Severity 2013.2 5.80 +/‐ 3.34 64.0% 0.000 0.003Severity 2014.1 4.75 +/‐ 3.85 49.7% 0.000 0.020Severity 2014.2 4.46 +/‐ 5.11 35.0% 0.000 0.072Severity 2015.1 5.69 +/‐ 6.86 38.9% 0.000 0.080
Frequency 1998.2 ‐1.25 +/‐ 0.66 25.8% 0.000 0.000Frequency 1999.1 ‐1.15 +/‐ 0.69 21.4% 0.000 0.002Frequency 1999.2 ‐1.00 +/‐ 0.70 16.4% 0.000 0.007Frequency 2000.1 ‐0.74 +/‐ 0.67 10.0% 0.000 0.032Frequency 2000.2 ‐0.56 +/‐ 0.67 4.9% 0.000 0.102Frequency 2001.1 ‐0.26 +/‐ 0.62 ‐0.7% 0.000 0.389Frequency 2001.2 0.00 +/‐ 0.57 ‐3.1% 0.000 0.992Frequency 2002.1 0.13 +/‐ 0.58 ‐2.6% 0.000 0.661Frequency 2002.2 0.26 +/‐ 0.60 ‐0.8% 0.000 0.391Frequency 2003.1 0.26 +/‐ 0.64 ‐1.0% 0.000 0.410Frequency 2003.2 0.17 +/‐ 0.68 ‐2.6% 0.000 0.607Frequency 2004.1 0.25 +/‐ 0.72 ‐1.7% 0.000 0.477Frequency 2004.2 0.31 +/‐ 0.77 ‐1.2% 0.000 0.420Frequency 2005.1 0.47 +/‐ 0.81 1.7% 0.000 0.238Frequency 2005.2 0.52 +/‐ 0.87 2.0% 0.000 0.232Frequency 2006.1 0.40 +/‐ 0.93 ‐1.0% 0.000 0.388Frequency 2006.2 0.16 +/‐ 0.97 ‐4.0% 0.000 0.742Frequency 2007.1 0.17 +/‐ 1.06 ‐4.2% 0.000 0.738Frequency 2007.2 0.25 +/‐ 1.16 ‐3.9% 0.000 0.658Frequency 2008.1 0.16 +/‐ 1.27 ‐4.9% 0.000 0.800Frequency 2008.2 ‐0.24 +/‐ 1.30 ‐4.7% 0.000 0.708Frequency 2009.1 ‐0.31 +/‐ 1.45 ‐4.6% 0.000 0.653Frequency 2009.2 ‐0.31 +/‐ 1.63 ‐5.2% 0.000 0.689Frequency 2010.1 ‐0.12 +/‐ 1.83 ‐6.5% 0.000 0.888Frequency 2010.2 ‐0.43 +/‐ 2.03 ‐5.6% 0.000 0.659Frequency 2011.1 ‐0.22 +/‐ 2.33 ‐7.3% 0.000 0.841Frequency 2011.2 ‐0.08 +/‐ 2.71 ‐8.3% 0.000 0.950Frequency 2012.1 1.12 +/‐ 2.69 ‐1.3% 0.000 0.377Frequency 2012.2 1.45 +/‐ 3.20 0.3% 0.000 0.334Frequency 2013.1 2.60 +/‐ 3.50 15.9% 0.000 0.123Frequency 2013.2 3.30 +/‐ 4.25 20.4% 0.000 0.106Frequency 2014.1 4.41 +/‐ 5.17 28.9% 0.000 0.078Frequency 2014.2 3.97 +/‐ 6.84 13.6% 0.000 0.198Frequency 2015.1 2.69 +/‐ 9.18 ‐7.4% 0.002 0.479
Coverage = AP
End Trend Period = 2018.1
Seasonality = F
Excluded Points = NA
Appendix E Page 39
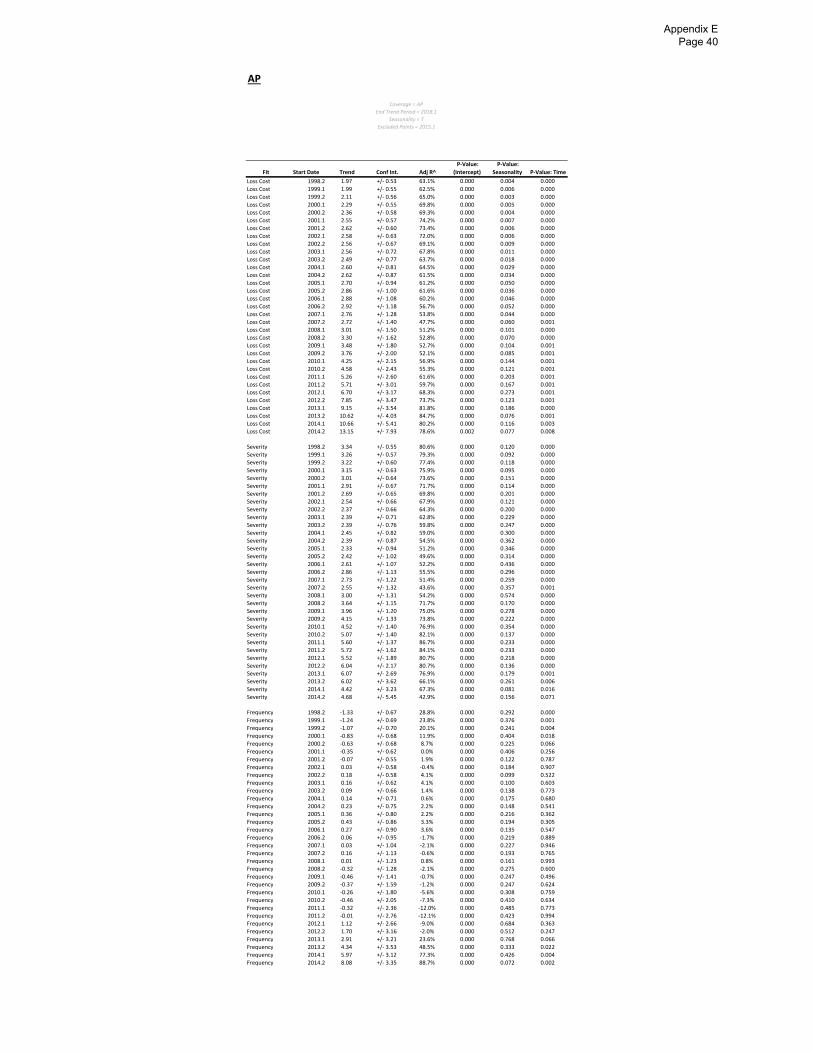
AP
Fit Start Date Trend Conf Int. Adj R^
P‐Value:
(Intercept)
P‐Value:
Seasonality P‐Value: Time
Loss Cost 1998.2 1.97 +/‐ 0.53 63.1% 0.000 0.004 0.000
Loss Cost 1999.1 1.99 +/‐ 0.55 62.5% 0.000 0.006 0.000
Loss Cost 1999.2 2.11 +/‐ 0.56 65.0% 0.000 0.003 0.000
Loss Cost 2000.1 2.29 +/‐ 0.55 69.8% 0.000 0.005 0.000
Loss Cost 2000.2 2.36 +/‐ 0.58 69.3% 0.000 0.004 0.000
Loss Cost 2001.1 2.55 +/‐ 0.57 74.2% 0.000 0.007 0.000
Loss Cost 2001.2 2.62 +/‐ 0.60 73.4% 0.000 0.006 0.000
Loss Cost 2002.1 2.58 +/‐ 0.63 72.0% 0.000 0.006 0.000
Loss Cost 2002.2 2.56 +/‐ 0.67 69.1% 0.000 0.009 0.000
Loss Cost 2003.1 2.56 +/‐ 0.72 67.8% 0.000 0.011 0.000
Loss Cost 2003.2 2.49 +/‐ 0.77 63.7% 0.000 0.018 0.000
Loss Cost 2004.1 2.60 +/‐ 0.81 64.5% 0.000 0.029 0.000
Loss Cost 2004.2 2.62 +/‐ 0.87 61.5% 0.000 0.034 0.000
Loss Cost 2005.1 2.70 +/‐ 0.94 61.2% 0.000 0.050 0.000
Loss Cost 2005.2 2.86 +/‐ 1.00 61.6% 0.000 0.036 0.000
Loss Cost 2006.1 2.88 +/‐ 1.08 60.2% 0.000 0.046 0.000
Loss Cost 2006.2 2.92 +/‐ 1.18 56.7% 0.000 0.052 0.000
Loss Cost 2007.1 2.76 +/‐ 1.28 53.8% 0.000 0.044 0.000
Loss Cost 2007.2 2.72 +/‐ 1.40 47.7% 0.000 0.060 0.001
Loss Cost 2008.1 3.01 +/‐ 1.50 51.2% 0.000 0.101 0.000
Loss Cost 2008.2 3.30 +/‐ 1.62 52.8% 0.000 0.070 0.000
Loss Cost 2009.1 3.48 +/‐ 1.80 52.7% 0.000 0.104 0.001
Loss Cost 2009.2 3.76 +/‐ 2.00 52.1% 0.000 0.085 0.001
Loss Cost 2010.1 4.25 +/‐ 2.15 56.9% 0.000 0.144 0.001
Loss Cost 2010.2 4.58 +/‐ 2.43 55.3% 0.000 0.121 0.001
Loss Cost 2011.1 5.26 +/‐ 2.60 61.6% 0.000 0.203 0.001
Loss Cost 2011.2 5.71 +/‐ 3.01 59.7% 0.000 0.167 0.001
Loss Cost 2012.1 6.70 +/‐ 3.17 68.3% 0.000 0.273 0.001
Loss Cost 2012.2 7.85 +/‐ 3.47 73.7% 0.000 0.123 0.001
Loss Cost 2013.1 9.15 +/‐ 3.54 81.8% 0.000 0.186 0.000
Loss Cost 2013.2 10.62 +/‐ 4.03 84.7% 0.000 0.076 0.001
Loss Cost 2014.1 10.66 +/‐ 5.41 80.2% 0.000 0.116 0.003
Loss Cost 2014.2 13.15 +/‐ 7.93 78.6% 0.002 0.077 0.008
Severity 1998.2 3.34 +/‐ 0.55 80.6% 0.000 0.120 0.000
Severity 1999.1 3.26 +/‐ 0.57 79.3% 0.000 0.092 0.000
Severity 1999.2 3.22 +/‐ 0.60 77.4% 0.000 0.118 0.000
Severity 2000.1 3.15 +/‐ 0.63 75.9% 0.000 0.095 0.000
Severity 2000.2 3.01 +/‐ 0.64 73.6% 0.000 0.151 0.000
Severity 2001.1 2.91 +/‐ 0.67 71.7% 0.000 0.114 0.000
Severity 2001.2 2.69 +/‐ 0.65 69.8% 0.000 0.201 0.000
Severity 2002.1 2.54 +/‐ 0.66 67.9% 0.000 0.121 0.000
Severity 2002.2 2.37 +/‐ 0.66 64.3% 0.000 0.200 0.000
Severity 2003.1 2.39 +/‐ 0.71 62.8% 0.000 0.229 0.000
Severity 2003.2 2.39 +/‐ 0.76 59.8% 0.000 0.247 0.000
Severity 2004.1 2.45 +/‐ 0.82 59.0% 0.000 0.300 0.000
Severity 2004.2 2.39 +/‐ 0.87 54.5% 0.000 0.362 0.000
Severity 2005.1 2.33 +/‐ 0.94 51.2% 0.000 0.346 0.000
Severity 2005.2 2.42 +/‐ 1.02 49.6% 0.000 0.314 0.000
Severity 2006.1 2.61 +/‐ 1.07 52.2% 0.000 0.436 0.000
Severity 2006.2 2.86 +/‐ 1.13 55.5% 0.000 0.296 0.000
Severity 2007.1 2.73 +/‐ 1.22 51.4% 0.000 0.259 0.000
Severity 2007.2 2.55 +/‐ 1.32 43.6% 0.000 0.357 0.001
Severity 2008.1 3.00 +/‐ 1.31 54.2% 0.000 0.574 0.000
Severity 2008.2 3.64 +/‐ 1.15 71.7% 0.000 0.170 0.000
Severity 2009.1 3.96 +/‐ 1.20 75.0% 0.000 0.278 0.000
Severity 2009.2 4.15 +/‐ 1.33 73.8% 0.000 0.222 0.000
Severity 2010.1 4.52 +/‐ 1.40 76.9% 0.000 0.354 0.000
Severity 2010.2 5.07 +/‐ 1.40 82.1% 0.000 0.137 0.000
Severity 2011.1 5.60 +/‐ 1.37 86.7% 0.000 0.233 0.000
Severity 2011.2 5.72 +/‐ 1.62 84.1% 0.000 0.233 0.000
Severity 2012.1 5.52 +/‐ 1.89 80.7% 0.000 0.218 0.000
Severity 2012.2 6.04 +/‐ 2.17 80.7% 0.000 0.136 0.000
Severity 2013.1 6.07 +/‐ 2.69 76.9% 0.000 0.179 0.001
Severity 2013.2 6.02 +/‐ 3.62 66.1% 0.000 0.261 0.006
Severity 2014.1 4.42 +/‐ 3.23 67.3% 0.000 0.081 0.016
Severity 2014.2 4.68 +/‐ 5.45 42.9% 0.000 0.156 0.071
Frequency 1998.2 ‐1.33 +/‐ 0.67 28.8% 0.000 0.292 0.000
Frequency 1999.1 ‐1.24 +/‐ 0.69 23.8% 0.000 0.376 0.001
Frequency 1999.2 ‐1.07 +/‐ 0.70 20.1% 0.000 0.241 0.004
Frequency 2000.1 ‐0.83 +/‐ 0.68 11.9% 0.000 0.404 0.018
Frequency 2000.2 ‐0.63 +/‐ 0.68 8.7% 0.000 0.225 0.066
Frequency 2001.1 ‐0.35 +/‐ 0.62 0.0% 0.000 0.406 0.256
Frequency 2001.2 ‐0.07 +/‐ 0.55 1.9% 0.000 0.122 0.787
Frequency 2002.1 0.03 +/‐ 0.58 ‐0.4% 0.000 0.184 0.907
Frequency 2002.2 0.18 +/‐ 0.58 4.1% 0.000 0.099 0.522
Frequency 2003.1 0.16 +/‐ 0.62 4.1% 0.000 0.100 0.603
Frequency 2003.2 0.09 +/‐ 0.66 1.4% 0.000 0.138 0.773
Frequency 2004.1 0.14 +/‐ 0.71 0.6% 0.000 0.175 0.680
Frequency 2004.2 0.23 +/‐ 0.75 2.2% 0.000 0.148 0.541
Frequency 2005.1 0.36 +/‐ 0.80 2.2% 0.000 0.216 0.362
Frequency 2005.2 0.43 +/‐ 0.86 3.3% 0.000 0.194 0.305
Frequency 2006.1 0.27 +/‐ 0.90 3.6% 0.000 0.135 0.547
Frequency 2006.2 0.06 +/‐ 0.95 ‐1.7% 0.000 0.219 0.889
Frequency 2007.1 0.03 +/‐ 1.04 ‐2.1% 0.000 0.227 0.946
Frequency 2007.2 0.16 +/‐ 1.13 ‐0.6% 0.000 0.193 0.765
Frequency 2008.1 0.01 +/‐ 1.23 0.8% 0.000 0.161 0.993
Frequency 2008.2 ‐0.32 +/‐ 1.28 ‐2.1% 0.000 0.275 0.600
Frequency 2009.1 ‐0.46 +/‐ 1.41 ‐0.7% 0.000 0.247 0.496
Frequency 2009.2 ‐0.37 +/‐ 1.59 ‐1.2% 0.000 0.247 0.624
Frequency 2010.1 ‐0.26 +/‐ 1.80 ‐5.6% 0.000 0.308 0.759
Frequency 2010.2 ‐0.46 +/‐ 2.05 ‐7.3% 0.000 0.410 0.634
Frequency 2011.1 ‐0.32 +/‐ 2.36 ‐12.0% 0.000 0.485 0.773
Frequency 2011.2 ‐0.01 +/‐ 2.76 ‐12.1% 0.000 0.423 0.994
Frequency 2012.1 1.12 +/‐ 2.66 ‐9.0% 0.000 0.684 0.363
Frequency 2012.2 1.70 +/‐ 3.16 ‐2.0% 0.000 0.512 0.247
Frequency 2013.1 2.91 +/‐ 3.21 23.6% 0.000 0.768 0.066
Frequency 2013.2 4.34 +/‐ 3.53 48.5% 0.000 0.333 0.022
Frequency 2014.1 5.97 +/‐ 3.12 77.3% 0.000 0.426 0.004
Frequency 2014.2 8.08 +/‐ 3.35 88.7% 0.000 0.072 0.002
Coverage = AP
End Trend Period = 2018.1
Seasonality = T
Excluded Points = 2015.1
Appendix E Page 40

AP
Fit Start Date Trend Conf Int. Adj R^
P‐Value:
(Intercept) P‐Value: Time
Loss Cost 1998.2 1.95 +/‐ 0.58 54.9% 0.000 0.000
Loss Cost 1999.1 2.01 +/‐ 0.61 54.7% 0.000 0.000
Loss Cost 1999.2 2.10 +/‐ 0.63 55.6% 0.000 0.000
Loss Cost 2000.1 2.31 +/‐ 0.61 62.7% 0.000 0.000
Loss Cost 2000.2 2.34 +/‐ 0.65 61.4% 0.000 0.000
Loss Cost 2001.1 2.58 +/‐ 0.62 68.4% 0.000 0.000
Loss Cost 2001.2 2.60 +/‐ 0.66 66.9% 0.000 0.000
Loss Cost 2002.1 2.61 +/‐ 0.71 64.9% 0.000 0.000
Loss Cost 2002.2 2.54 +/‐ 0.75 61.8% 0.000 0.000
Loss Cost 2003.1 2.59 +/‐ 0.80 60.5% 0.000 0.000
Loss Cost 2003.2 2.46 +/‐ 0.84 56.5% 0.000 0.000
Loss Cost 2004.1 2.63 +/‐ 0.88 58.5% 0.000 0.000
Loss Cost 2004.2 2.59 +/‐ 0.94 55.2% 0.000 0.000
Loss Cost 2005.1 2.73 +/‐ 1.00 55.9% 0.000 0.000
Loss Cost 2005.2 2.82 +/‐ 1.08 55.0% 0.000 0.000
Loss Cost 2006.1 2.92 +/‐ 1.16 53.9% 0.000 0.000
Loss Cost 2006.2 2.88 +/‐ 1.27 49.9% 0.000 0.000
Loss Cost 2007.1 2.81 +/‐ 1.38 45.4% 0.000 0.000
Loss Cost 2007.2 2.65 +/‐ 1.50 39.4% 0.000 0.001
Loss Cost 2008.1 3.05 +/‐ 1.58 45.7% 0.000 0.001
Loss Cost 2008.2 3.22 +/‐ 1.74 45.1% 0.000 0.001
Loss Cost 2009.1 3.52 +/‐ 1.90 46.9% 0.000 0.001
Loss Cost 2009.2 3.64 +/‐ 2.13 44.3% 0.000 0.002
Loss Cost 2010.1 4.29 +/‐ 2.24 52.6% 0.000 0.001
Loss Cost 2010.2 4.42 +/‐ 2.55 49.2% 0.000 0.002
Loss Cost 2011.1 5.29 +/‐ 2.66 59.0% 0.000 0.001
Loss Cost 2011.2 5.47 +/‐ 3.11 55.3% 0.000 0.002
Loss Cost 2012.1 6.70 +/‐ 3.18 67.2% 0.000 0.001
Loss Cost 2012.2 7.42 +/‐ 3.69 68.0% 0.000 0.001
Loss Cost 2013.1 9.08 +/‐ 3.68 79.2% 0.000 0.000
Loss Cost 2013.2 9.74 +/‐ 4.60 76.8% 0.000 0.001
Loss Cost 2014.1 10.28 +/‐ 6.13 71.5% 0.000 0.005
Loss Cost 2014.2 10.18 +/‐ 8.89 58.8% 0.001 0.027
Severity 1998.2 3.33 +/‐ 0.56 79.8% 0.000 0.000
Severity 1999.1 3.28 +/‐ 0.58 78.2% 0.000 0.000
Severity 1999.2 3.21 +/‐ 0.61 76.4% 0.000 0.000
Severity 2000.1 3.16 +/‐ 0.64 74.5% 0.000 0.000
Severity 2000.2 3.00 +/‐ 0.65 72.7% 0.000 0.000
Severity 2001.1 2.93 +/‐ 0.68 70.3% 0.000 0.000
Severity 2001.2 2.69 +/‐ 0.65 69.1% 0.000 0.000
Severity 2002.1 2.56 +/‐ 0.67 66.2% 0.000 0.000
Severity 2002.2 2.36 +/‐ 0.67 63.4% 0.000 0.000
Severity 2003.1 2.41 +/‐ 0.72 62.2% 0.000 0.000
Severity 2003.2 2.38 +/‐ 0.77 59.2% 0.000 0.000
Severity 2004.1 2.46 +/‐ 0.82 58.8% 0.000 0.000
Severity 2004.2 2.37 +/‐ 0.87 54.7% 0.000 0.000
Severity 2005.1 2.35 +/‐ 0.94 51.3% 0.000 0.000
Severity 2005.2 2.40 +/‐ 1.01 49.5% 0.000 0.000
Severity 2006.1 2.62 +/‐ 1.06 53.0% 0.000 0.000
Severity 2006.2 2.83 +/‐ 1.13 55.2% 0.000 0.000
Severity 2007.1 2.75 +/‐ 1.23 50.6% 0.000 0.000
Severity 2007.2 2.52 +/‐ 1.31 43.9% 0.000 0.001
Severity 2008.1 3.01 +/‐ 1.28 55.9% 0.000 0.000
Severity 2008.2 3.59 +/‐ 1.18 69.9% 0.000 0.000
Severity 2009.1 3.98 +/‐ 1.21 74.5% 0.000 0.000
Severity 2009.2 4.09 +/‐ 1.35 72.7% 0.000 0.000
Severity 2010.1 4.54 +/‐ 1.39 77.0% 0.000 0.000
Severity 2010.2 4.98 +/‐ 1.46 80.0% 0.000 0.000
Severity 2011.1 5.61 +/‐ 1.39 86.1% 0.000 0.000
Severity 2011.2 5.61 +/‐ 1.63 83.3% 0.000 0.000
Severity 2012.1 5.52 +/‐ 1.93 79.2% 0.000 0.000
Severity 2012.2 5.78 +/‐ 2.29 77.0% 0.000 0.000
Severity 2013.1 6.02 +/‐ 2.82 73.3% 0.000 0.001
Severity 2013.2 5.56 +/‐ 3.50 63.5% 0.000 0.006
Severity 2014.1 4.16 +/‐ 3.89 46.7% 0.000 0.037
Severity 2014.2 3.18 +/‐ 5.29 19.6% 0.000 0.177
Frequency 1998.2 ‐1.34 +/‐ 0.67 28.6% 0.000 0.000
Frequency 1999.1 ‐1.23 +/‐ 0.69 24.2% 0.000 0.001
Frequency 1999.2 ‐1.08 +/‐ 0.71 19.1% 0.000 0.004
Frequency 2000.1 ‐0.82 +/‐ 0.68 12.7% 0.000 0.019
Frequency 2000.2 ‐0.64 +/‐ 0.68 7.3% 0.000 0.065
Frequency 2001.1 ‐0.35 +/‐ 0.62 0.9% 0.000 0.265
Frequency 2001.2 ‐0.08 +/‐ 0.57 ‐2.9% 0.000 0.769
Frequency 2002.1 0.05 +/‐ 0.58 ‐3.2% 0.000 0.873
Frequency 2002.2 0.17 +/‐ 0.60 ‐2.2% 0.000 0.558
Frequency 2003.1 0.18 +/‐ 0.64 ‐2.4% 0.000 0.577
Frequency 2003.2 0.08 +/‐ 0.67 ‐3.5% 0.000 0.807
Frequency 2004.1 0.16 +/‐ 0.72 ‐3.0% 0.000 0.651
Frequency 2004.2 0.21 +/‐ 0.77 ‐2.7% 0.000 0.578
Frequency 2005.1 0.37 +/‐ 0.81 ‐0.3% 0.000 0.346
Frequency 2005.2 0.42 +/‐ 0.87 ‐0.1% 0.000 0.333
Frequency 2006.1 0.29 +/‐ 0.93 ‐2.6% 0.000 0.525
Frequency 2006.2 0.04 +/‐ 0.96 ‐4.7% 0.000 0.928
Frequency 2007.1 0.06 +/‐ 1.05 ‐4.9% 0.000 0.914
Frequency 2007.2 0.13 +/‐ 1.15 ‐5.0% 0.000 0.816
Frequency 2008.1 0.03 +/‐ 1.26 ‐5.5% 0.000 0.957
Frequency 2008.2 ‐0.36 +/‐ 1.28 ‐3.7% 0.000 0.559
Frequency 2009.1 ‐0.44 +/‐ 1.42 ‐3.5% 0.000 0.523
Frequency 2009.2 ‐0.44 +/‐ 1.60 ‐4.3% 0.000 0.571
Frequency 2010.1 ‐0.24 +/‐ 1.79 ‐6.5% 0.000 0.779
Frequency 2010.2 ‐0.53 +/‐ 2.00 ‐5.0% 0.000 0.576
Frequency 2011.1 ‐0.31 +/‐ 2.29 ‐7.6% 0.000 0.776
Frequency 2011.2 ‐0.13 +/‐ 2.67 ‐9.0% 0.000 0.914
Frequency 2012.1 1.12 +/‐ 2.51 0.0% 0.000 0.341
Frequency 2012.2 1.54 +/‐ 2.96 3.9% 0.000 0.265
Frequency 2013.1 2.89 +/‐ 2.94 32.3% 0.000 0.050
Frequency 2013.2 3.96 +/‐ 3.32 47.7% 0.000 0.024
Frequency 2014.1 5.87 +/‐ 2.89 78.2% 0.000 0.002
Frequency 2014.2 6.79 +/‐ 3.87 77.6% 0.000 0.006
Coverage = AP
End Trend Period = 2018.1
Seasonality = F
Excluded Points = 2015.1
Appendix E Page 41

UA
Fit Start Date Trend Conf Int. Adj R^
P‐Value:
(Intercept)
P‐Value:
Seasonality P‐Value: Time
Loss Cost 1998.2 ‐0.53 +/‐ 2.37 ‐0.6% 0.000 0.226 0.657
Loss Cost 1999.1 ‐0.23 +/‐ 2.48 ‐2.2% 0.000 0.291 0.855
Loss Cost 1999.2 0.06 +/‐ 2.60 ‐1.6% 0.000 0.245 0.964
Loss Cost 2000.1 ‐0.07 +/‐ 2.74 ‐1.5% 0.000 0.235 0.960
Loss Cost 2000.2 0.42 +/‐ 2.85 0.1% 0.000 0.168 0.764
Loss Cost 2001.1 1.18 +/‐ 2.88 0.0% 0.000 0.265 0.410
Loss Cost 2001.2 1.77 +/‐ 3.00 3.5% 0.000 0.179 0.234
Loss Cost 2002.1 2.68 +/‐ 2.99 7.5% 0.000 0.293 0.073
Loss Cost 2002.2 3.28 +/‐ 3.12 11.9% 0.000 0.204 0.037
Loss Cost 2003.1 4.05 +/‐ 3.20 16.8% 0.000 0.311 0.013
Loss Cost 2003.2 4.87 +/‐ 3.30 23.7% 0.000 0.188 0.004
Loss Cost 2004.1 5.71 +/‐ 3.39 29.7% 0.000 0.290 0.001
Loss Cost 2004.2 6.82 +/‐ 3.41 39.7% 0.000 0.138 0.000
Loss Cost 2005.1 7.18 +/‐ 3.65 40.2% 0.000 0.183 0.000
Loss Cost 2005.2 7.99 +/‐ 3.86 43.9% 0.001 0.118 0.000
Loss Cost 2006.1 8.18 +/‐ 4.18 43.0% 0.003 0.145 0.000
Loss Cost 2006.2 8.73 +/‐ 4.55 42.6% 0.010 0.122 0.000
Loss Cost 2007.1 9.39 +/‐ 4.91 44.1% 0.037 0.176 0.000
Loss Cost 2007.2 9.29 +/‐ 5.42 38.5% 0.051 0.205 0.001
Loss Cost 2008.1 9.92 +/‐ 5.94 39.0% 0.127 0.271 0.002
Loss Cost 2008.2 11.16 +/‐ 6.49 41.9% 0.284 0.192 0.001
Loss Cost 2009.1 8.82 +/‐ 6.25 38.8% 0.061 0.074 0.007
Loss Cost 2009.2 7.45 +/‐ 6.73 25.7% 0.037 0.130 0.027
Severity 1998.2 0.60 +/‐ 1.70 ‐3.5% 0.000 0.682 0.476
Severity 1999.1 0.82 +/‐ 1.77 ‐2.8% 0.000 0.795 0.351
Severity 1999.2 1.04 +/‐ 1.86 ‐1.6% 0.000 0.693 0.261
Severity 2000.1 0.80 +/‐ 1.93 ‐2.9% 0.000 0.596 0.404
Severity 2000.2 1.29 +/‐ 1.97 1.2% 0.000 0.403 0.187
Severity 2001.1 1.86 +/‐ 1.96 5.8% 0.000 0.594 0.060
Severity 2001.2 2.23 +/‐ 2.05 9.5% 0.000 0.457 0.032
Severity 2002.1 2.66 +/‐ 2.11 13.6% 0.000 0.610 0.014
Severity 2002.2 3.13 +/‐ 2.19 19.0% 0.000 0.441 0.006
Severity 2003.1 3.78 +/‐ 2.19 27.2% 0.000 0.648 0.001
Severity 2003.2 4.34 +/‐ 2.25 33.4% 0.000 0.448 0.000
Severity 2004.1 4.40 +/‐ 2.42 31.9% 0.000 0.482 0.001
Severity 2004.2 4.58 +/‐ 2.60 30.9% 0.000 0.445 0.001
Severity 2005.1 4.56 +/‐ 2.80 28.5% 0.000 0.457 0.002
Severity 2005.2 4.86 +/‐ 3.03 28.4% 0.000 0.404 0.002
Severity 2006.1 4.99 +/‐ 3.29 27.3% 0.000 0.449 0.004
Severity 2006.2 4.72 +/‐ 3.57 21.0% 0.000 0.526 0.010
Severity 2007.1 5.20 +/‐ 3.86 22.8% 0.000 0.638 0.009
Severity 2007.2 4.83 +/‐ 4.22 16.1% 0.000 0.732 0.024
Severity 2008.1 4.37 +/‐ 4.59 10.6% 0.000 0.655 0.056
Severity 2008.2 4.79 +/‐ 5.11 10.5% 0.000 0.597 0.059
Severity 2009.1 2.74 +/‐ 4.76 4.2% 0.000 0.279 0.234
Severity 2009.2 2.42 +/‐ 5.36 ‐1.5% 0.000 0.343 0.345
Frequency 1998.2 ‐1.12 +/‐ 1.32 9.3% 0.000 0.103 0.096
Frequency 1999.1 ‐1.04 +/‐ 1.39 6.7% 0.000 0.126 0.140
Frequency 1999.2 ‐0.97 +/‐ 1.47 6.3% 0.000 0.123 0.190
Frequency 2000.1 ‐0.86 +/‐ 1.55 3.8% 0.000 0.153 0.266
Frequency 2000.2 ‐0.86 +/‐ 1.64 3.6% 0.000 0.164 0.296
Frequency 2001.1 ‐0.67 +/‐ 1.72 0.7% 0.000 0.214 0.434
Frequency 2001.2 ‐0.45 +/‐ 1.82 0.8% 0.000 0.174 0.617
Frequency 2002.1 0.03 +/‐ 1.84 ‐2.4% 0.000 0.273 0.978
Frequency 2002.2 0.14 +/‐ 1.96 ‐2.2% 0.000 0.257 0.883
Frequency 2003.1 0.26 +/‐ 2.09 ‐2.8% 0.000 0.300 0.799
Frequency 2003.2 0.51 +/‐ 2.23 ‐1.6% 0.000 0.253 0.639
Frequency 2004.1 1.25 +/‐ 2.20 0.3% 0.000 0.412 0.251
Frequency 2004.2 2.14 +/‐ 2.10 13.4% 0.000 0.163 0.044
Frequency 2005.1 2.50 +/‐ 2.22 16.2% 0.000 0.233 0.027
Frequency 2005.2 2.99 +/‐ 2.34 21.5% 0.000 0.154 0.013
Frequency 2006.1 3.04 +/‐ 2.54 20.7% 0.000 0.179 0.019
Frequency 2006.2 3.83 +/‐ 2.61 30.7% 0.000 0.085 0.005
Frequency 2007.1 3.99 +/‐ 2.84 30.5% 0.000 0.112 0.007
Frequency 2007.2 4.26 +/‐ 3.13 29.2% 0.000 0.105 0.009
Frequency 2008.1 5.32 +/‐ 3.15 39.8% 0.000 0.183 0.002
Frequency 2008.2 6.08 +/‐ 3.38 44.2% 0.000 0.115 0.001
Frequency 2009.1 5.92 +/‐ 3.76 40.9% 0.000 0.123 0.003
Frequency 2009.2 4.91 +/‐ 3.97 27.2% 0.000 0.216 0.017
Coverage = UA
End Trend Period = 2018.1
Seasonality = T
Excluded Points = NA
Appendix E Page 42

UA
Fit Start Date Trend Conf Int. Adj R^
P‐Value:
(Intercept) P‐Value: Time
Loss Cost 1998.2 ‐0.59 +/‐ 2.38 ‐2.0% 0.000 0.621
Loss Cost 1999.1 ‐0.23 +/‐ 2.48 ‐2.6% 0.000 0.855
Loss Cost 1999.2 ‐0.01 +/‐ 2.61 ‐2.8% 0.000 0.993
Loss Cost 2000.1 ‐0.07 +/‐ 2.75 ‐2.8% 0.000 0.960
Loss Cost 2000.2 0.33 +/‐ 2.88 ‐2.8% 0.000 0.818
Loss Cost 2001.1 1.18 +/‐ 2.89 ‐0.9% 0.000 0.411
Loss Cost 2001.2 1.67 +/‐ 3.03 0.8% 0.000 0.267
Loss Cost 2002.1 2.68 +/‐ 2.99 7.1% 0.000 0.073
Loss Cost 2002.2 3.17 +/‐ 3.14 9.9% 0.000 0.045
Loss Cost 2003.1 4.05 +/‐ 3.20 16.6% 0.000 0.013
Loss Cost 2003.2 4.75 +/‐ 3.33 21.5% 0.000 0.006
Loss Cost 2004.1 5.71 +/‐ 3.39 29.2% 0.000 0.001
Loss Cost 2004.2 6.66 +/‐ 3.48 36.6% 0.000 0.000
Loss Cost 2005.1 7.18 +/‐ 3.71 38.1% 0.000 0.000
Loss Cost 2005.2 7.79 +/‐ 3.96 40.1% 0.002 0.000
Loss Cost 2006.1 8.18 +/‐ 4.29 39.8% 0.007 0.000
Loss Cost 2006.2 8.48 +/‐ 4.67 38.4% 0.019 0.001
Loss Cost 2007.1 9.39 +/‐ 5.01 41.5% 0.067 0.001
Loss Cost 2007.2 9.03 +/‐ 5.47 36.2% 0.072 0.002
Loss Cost 2008.1 9.92 +/‐ 5.97 38.1% 0.181 0.002
Loss Cost 2008.2 10.80 +/‐ 6.57 39.2% 0.354 0.002
Loss Cost 2009.1 8.82 +/‐ 6.69 29.2% 0.133 0.010
Loss Cost 2009.2 6.96 +/‐ 6.94 18.4% 0.053 0.043
Severity 1998.2 0.59 +/‐ 1.68 ‐1.3% 0.000 0.481
Severity 1999.1 0.82 +/‐ 1.75 ‐0.2% 0.000 0.345
Severity 1999.2 1.02 +/‐ 1.83 0.8% 0.000 0.263
Severity 2000.1 0.80 +/‐ 1.91 ‐0.8% 0.000 0.399
Severity 2000.2 1.25 +/‐ 1.95 2.0% 0.000 0.198
Severity 2001.1 1.86 +/‐ 1.94 7.8% 0.000 0.057
Severity 2001.2 2.19 +/‐ 2.03 10.7% 0.000 0.033
Severity 2002.1 2.66 +/‐ 2.08 15.7% 0.000 0.013
Severity 2002.2 3.09 +/‐ 2.16 20.0% 0.000 0.006
Severity 2003.1 3.78 +/‐ 2.16 29.1% 0.000 0.001
Severity 2003.2 4.29 +/‐ 2.23 34.4% 0.000 0.000
Severity 2004.1 4.40 +/‐ 2.39 33.2% 0.000 0.001
Severity 2004.2 4.52 +/‐ 2.57 31.9% 0.000 0.001
Severity 2005.1 4.56 +/‐ 2.77 29.7% 0.000 0.002
Severity 2005.2 4.77 +/‐ 3.00 29.2% 0.000 0.003
Severity 2006.1 4.99 +/‐ 3.25 28.6% 0.000 0.003
Severity 2006.2 4.64 +/‐ 3.50 23.1% 0.000 0.010
Severity 2007.1 5.20 +/‐ 3.78 25.7% 0.000 0.008
Severity 2007.2 4.77 +/‐ 4.10 19.8% 0.000 0.022
Severity 2008.1 4.37 +/‐ 4.48 14.4% 0.000 0.051
Severity 2008.2 4.68 +/‐ 4.97 14.0% 0.000 0.058
Severity 2009.1 2.74 +/‐ 4.78 2.7% 0.000 0.237
Severity 2009.2 2.18 +/‐ 5.28 ‐1.3% 0.000 0.389
Frequency 1998.2 ‐1.17 +/‐ 1.35 5.0% 0.000 0.090
Frequency 1999.1 ‐1.04 +/‐ 1.42 3.0% 0.000 0.148
Frequency 1999.2 ‐1.02 +/‐ 1.49 2.4% 0.000 0.175
Frequency 2000.1 ‐0.86 +/‐ 1.57 0.7% 0.000 0.274
Frequency 2000.2 ‐0.91 +/‐ 1.66 0.7% 0.000 0.272
Frequency 2001.1 ‐0.67 +/‐ 1.74 ‐1.1% 0.000 0.438
Frequency 2001.2 ‐0.51 +/‐ 1.84 ‐2.1% 0.000 0.574
Frequency 2002.1 0.03 +/‐ 1.84 ‐3.2% 0.000 0.978
Frequency 2002.2 0.08 +/‐ 1.97 ‐3.3% 0.000 0.932
Frequency 2003.1 0.26 +/‐ 2.09 ‐3.2% 0.000 0.799
Frequency 2003.2 0.44 +/‐ 2.23 ‐3.0% 0.000 0.688
Frequency 2004.1 1.25 +/‐ 2.18 1.4% 0.000 0.248
Frequency 2004.2 2.05 +/‐ 2.14 9.9% 0.000 0.057
Frequency 2005.1 2.50 +/‐ 2.24 14.5% 0.000 0.028
Frequency 2005.2 2.88 +/‐ 2.39 17.7% 0.000 0.019
Frequency 2006.1 3.04 +/‐ 2.59 17.5% 0.000 0.021
Frequency 2006.2 3.66 +/‐ 2.72 23.6% 0.000 0.009
Frequency 2007.1 3.99 +/‐ 2.95 24.7% 0.000 0.009
Frequency 2007.2 4.06 +/‐ 3.24 22.5% 0.000 0.015
Frequency 2008.1 5.32 +/‐ 3.21 36.8% 0.000 0.002
Frequency 2008.2 5.85 +/‐ 3.51 38.7% 0.000 0.002
Frequency 2009.1 5.92 +/‐ 3.92 35.2% 0.000 0.004
Frequency 2009.2 4.68 +/‐ 4.01 24.1% 0.000 0.022
Coverage = UA
End Trend Period = 2018.1
Seasonality = F
Excluded Points = NA
Appendix E Page 43
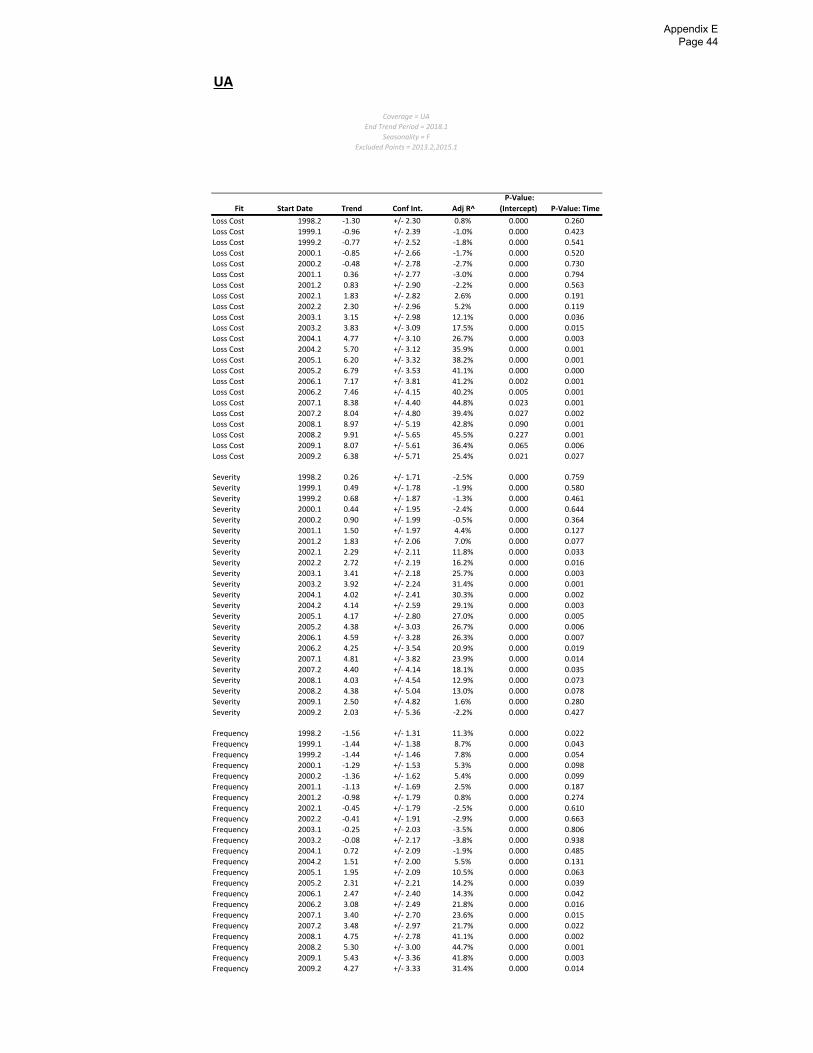
UA
Fit Start Date Trend Conf Int. Adj R^
P‐Value:
(Intercept) P‐Value: Time
Loss Cost 1998.2 ‐1.30 +/‐ 2.30 0.8% 0.000 0.260
Loss Cost 1999.1 ‐0.96 +/‐ 2.39 ‐1.0% 0.000 0.423
Loss Cost 1999.2 ‐0.77 +/‐ 2.52 ‐1.8% 0.000 0.541
Loss Cost 2000.1 ‐0.85 +/‐ 2.66 ‐1.7% 0.000 0.520
Loss Cost 2000.2 ‐0.48 +/‐ 2.78 ‐2.7% 0.000 0.730
Loss Cost 2001.1 0.36 +/‐ 2.77 ‐3.0% 0.000 0.794
Loss Cost 2001.2 0.83 +/‐ 2.90 ‐2.2% 0.000 0.563
Loss Cost 2002.1 1.83 +/‐ 2.82 2.6% 0.000 0.191
Loss Cost 2002.2 2.30 +/‐ 2.96 5.2% 0.000 0.119
Loss Cost 2003.1 3.15 +/‐ 2.98 12.1% 0.000 0.036
Loss Cost 2003.2 3.83 +/‐ 3.09 17.5% 0.000 0.015
Loss Cost 2004.1 4.77 +/‐ 3.10 26.7% 0.000 0.003
Loss Cost 2004.2 5.70 +/‐ 3.12 35.9% 0.000 0.001
Loss Cost 2005.1 6.20 +/‐ 3.32 38.2% 0.000 0.001
Loss Cost 2005.2 6.79 +/‐ 3.53 41.1% 0.000 0.000
Loss Cost 2006.1 7.17 +/‐ 3.81 41.2% 0.002 0.001
Loss Cost 2006.2 7.46 +/‐ 4.15 40.2% 0.005 0.001
Loss Cost 2007.1 8.38 +/‐ 4.40 44.8% 0.023 0.001
Loss Cost 2007.2 8.04 +/‐ 4.80 39.4% 0.027 0.002
Loss Cost 2008.1 8.97 +/‐ 5.19 42.8% 0.090 0.001
Loss Cost 2008.2 9.91 +/‐ 5.65 45.5% 0.227 0.001
Loss Cost 2009.1 8.07 +/‐ 5.61 36.4% 0.065 0.006
Loss Cost 2009.2 6.38 +/‐ 5.71 25.4% 0.021 0.027
Severity 1998.2 0.26 +/‐ 1.71 ‐2.5% 0.000 0.759
Severity 1999.1 0.49 +/‐ 1.78 ‐1.9% 0.000 0.580
Severity 1999.2 0.68 +/‐ 1.87 ‐1.3% 0.000 0.461
Severity 2000.1 0.44 +/‐ 1.95 ‐2.4% 0.000 0.644
Severity 2000.2 0.90 +/‐ 1.99 ‐0.5% 0.000 0.364
Severity 2001.1 1.50 +/‐ 1.97 4.4% 0.000 0.127
Severity 2001.2 1.83 +/‐ 2.06 7.0% 0.000 0.077
Severity 2002.1 2.29 +/‐ 2.11 11.8% 0.000 0.033
Severity 2002.2 2.72 +/‐ 2.19 16.2% 0.000 0.016
Severity 2003.1 3.41 +/‐ 2.18 25.7% 0.000 0.003
Severity 2003.2 3.92 +/‐ 2.24 31.4% 0.000 0.001
Severity 2004.1 4.02 +/‐ 2.41 30.3% 0.000 0.002
Severity 2004.2 4.14 +/‐ 2.59 29.1% 0.000 0.003
Severity 2005.1 4.17 +/‐ 2.80 27.0% 0.000 0.005
Severity 2005.2 4.38 +/‐ 3.03 26.7% 0.000 0.006
Severity 2006.1 4.59 +/‐ 3.28 26.3% 0.000 0.007
Severity 2006.2 4.25 +/‐ 3.54 20.9% 0.000 0.019
Severity 2007.1 4.81 +/‐ 3.82 23.9% 0.000 0.014
Severity 2007.2 4.40 +/‐ 4.14 18.1% 0.000 0.035
Severity 2008.1 4.03 +/‐ 4.54 12.9% 0.000 0.073
Severity 2008.2 4.38 +/‐ 5.04 13.0% 0.000 0.078
Severity 2009.1 2.50 +/‐ 4.82 1.6% 0.000 0.280
Severity 2009.2 2.03 +/‐ 5.36 ‐2.2% 0.000 0.427
Frequency 1998.2 ‐1.56 +/‐ 1.31 11.3% 0.000 0.022
Frequency 1999.1 ‐1.44 +/‐ 1.38 8.7% 0.000 0.043
Frequency 1999.2 ‐1.44 +/‐ 1.46 7.8% 0.000 0.054
Frequency 2000.1 ‐1.29 +/‐ 1.53 5.3% 0.000 0.098
Frequency 2000.2 ‐1.36 +/‐ 1.62 5.4% 0.000 0.099
Frequency 2001.1 ‐1.13 +/‐ 1.69 2.5% 0.000 0.187
Frequency 2001.2 ‐0.98 +/‐ 1.79 0.8% 0.000 0.274
Frequency 2002.1 ‐0.45 +/‐ 1.79 ‐2.5% 0.000 0.610
Frequency 2002.2 ‐0.41 +/‐ 1.91 ‐2.9% 0.000 0.663
Frequency 2003.1 ‐0.25 +/‐ 2.03 ‐3.5% 0.000 0.806
Frequency 2003.2 ‐0.08 +/‐ 2.17 ‐3.8% 0.000 0.938
Frequency 2004.1 0.72 +/‐ 2.09 ‐1.9% 0.000 0.485
Frequency 2004.2 1.51 +/‐ 2.00 5.5% 0.000 0.131
Frequency 2005.1 1.95 +/‐ 2.09 10.5% 0.000 0.063
Frequency 2005.2 2.31 +/‐ 2.21 14.2% 0.000 0.039
Frequency 2006.1 2.47 +/‐ 2.40 14.3% 0.000 0.042
Frequency 2006.2 3.08 +/‐ 2.49 21.8% 0.000 0.016
Frequency 2007.1 3.40 +/‐ 2.70 23.6% 0.000 0.015
Frequency 2007.2 3.48 +/‐ 2.97 21.7% 0.000 0.022
Frequency 2008.1 4.75 +/‐ 2.78 41.1% 0.000 0.002
Frequency 2008.2 5.30 +/‐ 3.00 44.7% 0.000 0.001
Frequency 2009.1 5.43 +/‐ 3.36 41.8% 0.000 0.003
Frequency 2009.2 4.27 +/‐ 3.33 31.4% 0.000 0.014
Coverage = UA
End Trend Period = 2018.1
Seasonality = F
Excluded Points = 2013.2,2015.1
Appendix E Page 44