Embed Size (px)
Citation preview

1
Journal of Geophysical Research Solid Earth
Supporting Information for
Rupture Characteristics of Major and Great (Mw ≥ 7.0) Megathrust Earthquakes from 1990-2015: 1. Source Parameter Scaling Relationships
Lingling Ye1,2, Thorne Lay1, Hiroo Kanamori2, Luis Rivera3
1. Department of Earth and Planetary Sciences, University of California Santa Cruz, Santa Cruz, CA 95064, USA.
2. Seismological Laboratory, California Institute of Technology, Pasadena, CA 91125 USA.
3. Institut de Physique du Globe de Strasbourg, Université de Strasbourg/CNRS, Strasbourg, France.
Contents of this file Figures S1 to S6 Tables S1 to S2 Description of Supplement S1 Description of Supplement S2 Additional Supporting Information (Files uploaded separately) Supplement S1 – Finite-fault models for group 1 Supplement S2 – Finite-fault models for group 2

2
Figure S1. (a) Source time function centroid times, Tc, from finite-fault inversions assuming Vr = 2.5 km/s (circles) or independent determinations of Vr (stars) plotted as functions M01/3. The red and blue lines indicate linearly regressions of Tc ~ M01/3 with non-zero intercept (green equation) and zero intercept (purple equation), respectively. Events with anomalously long centroid times are all tsunami earthquakes (red stars), have long intervals of weak initial slip (2001 Peru and 2006 Kuril events), or are doublet ruptures (2007 Solomon and 2007 Peru event). (b) The predicted time shifts with zero intercept versus values with intercept, ~ 2 s.

3
Figure S2. Source time function centroid times, Tc, from finite-fault inversions assuming Vr = 2.5 km/s (circles) or independent determinations of Vr (stars) normalized by the duration (Tr) estimated by regression of Tc and M01/3 with non-zero intercept, plotted as functions of (a) MW and (b) time. Events with anomalously large or small ratios are labeled. The long-duration events tend to be tsunami earthquakes (red stars), or have long intervals of weak initial slip (e.g., 2001 Peru event), or are doublet ruptures (2007 Peru and 2007 Solomon Islands events).
4
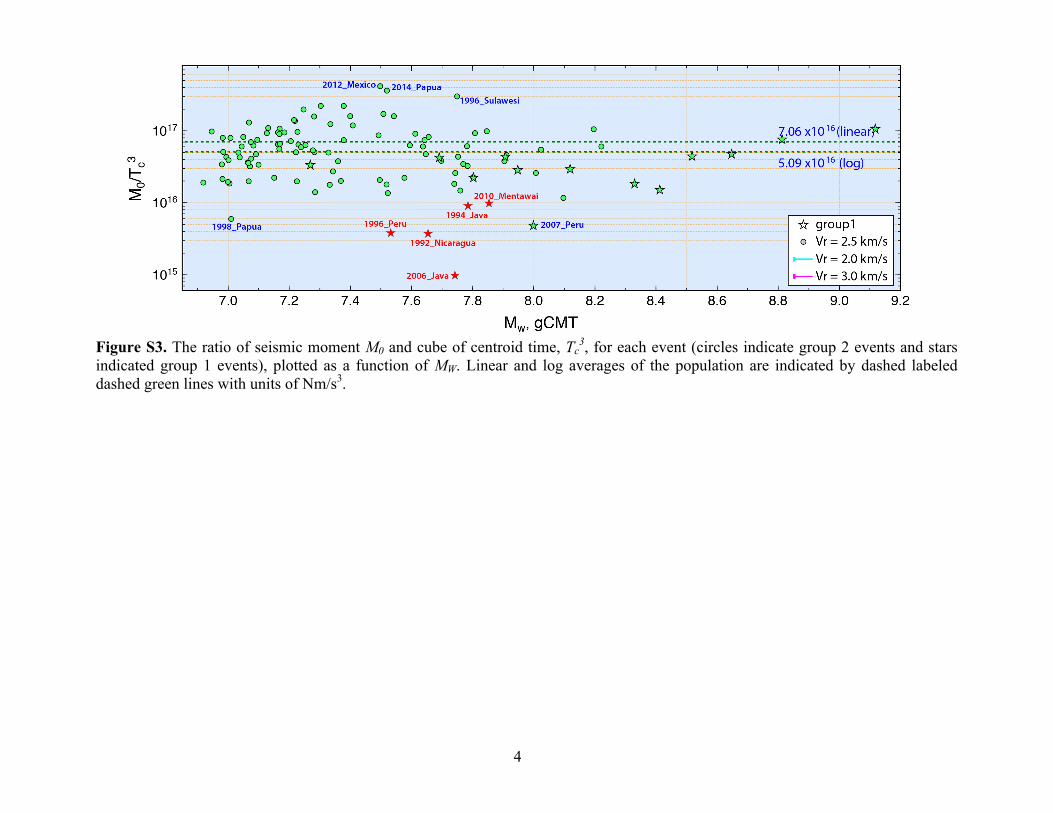
Figure S3. The ratio of seismic moment M0 and cube of centroid time, Tc3, for each event (circles indicate group 2 events and stars indicated group 1 events), plotted as a function of MW. Linear and log averages of the population are indicated by dashed labeled dashed green lines with units of Nm/s3.

5
Figure S4. (a) Estimated stress drop ΔσT,G calculated using seismic moment and centroid source duration with constant geometrical factors for a reference model (C = 1, γ = 2, α = 3), and (b) estimated stress drop Δση with constant radiation efficiency of 0.5 calculated using the moment-scaled radiated energy for each event, plotted relative to the stress drop ΔσE for finite source models for both group 1 (stars) and group 2 events (circles, Vr = 2.5 km/s). The size of symbols is proportional to the earthquake magnitude. Tsunami earthquakes are highlighted in red stars. Outliers are labeled in both panels. Dashed green lines have slope of unity.

6
Figure S5. Radiation efficiency versus (a) energy-based static stress drop ΔσE estimated from finite-fault models, (b) moment-scaled radiated energy, and (c) apparent stress.

7
Figure S6. Re-sampling of the population of major and great earthquake population estimates of stress drop to explore whether the small scatter in large event stress drops is due to the limited number of events. The standard deviation for each re-sampled population is given for stress drop and radiation efficiency estimates. While small samples of the major earthquake estimates can have scatter as small as for the great earthquakes, the standard deviation is on average higher across the re-sampled population.

8
Table S1. Earthquake Information for group 1 events
Date Time Location Lat(°) Lon(°) Hc
(km) Mw M0
(1020Nm) Td(s) Tc(s) ΔσE
(MPa) Ath
*
(104km2) Dth
* (m)
Vr3 ΔσE (km3MPa)
ER (1015J)
ER/M0 *10-‐5
σa (MPa) ηR
n0 (Brune)
n1 (0.3-‐1Hz)
n2 (0.3-‐2Hz)
r1 (0.3-‐1Hz)
r2 (0.3-‐2Hz)
1992-‐09-‐02 00:16 Nicaragua 11.74 -‐87.34 12.4 7.65 3.40 100.0 45.0 0.78 1.04 0.75 3.19 0.41 0.12 0.05 0.19 1.87 1.96 1.41 0.055 0.09
1994-‐06-‐02 18:17 Java -‐10.41 112.94 15.4 7.79 5.34 64.0 38.9 0.65 1.60 0.72 5.20 1.25 0.23 0.11 0.23 2.08 1.69 1.26 0.036 0.07
1996-‐02-‐21 12:51 Peru -‐9.59 -‐79.59 13.6 7.53 2.23 79.0 38.8 0.76 0.80 0.80 2.57 0.82 0.37 0.12 0.38 1.65 2.01 1.83 0.144 0.18
2001-‐06-‐23 20:33 Peru -‐16.38 -‐73.50 18.1 8.41 46.70 109.5 67.7 3.05 2.39 5.62 42.16 51.60 1.10 0.36 0.14 1.46 1.74 1.58 0.171 0.23
2005-‐03-‐28 16:09 Sumatra 2.05 97.06 28.3 8.65 105.00 142.0 60.5 1.20 7.69 2.39 13.67 114.00 1.09 0.58 0.84 1.54 1.62 1.31 0.162 0.26
82.0
2006-‐07-‐17 08:19 Java -‐9.32 107.33 11.9 7.74 4.61 144.5 77.9 1.66 0.77 1.32 3.24 1.33 0.29 0.10 0.14 1.29 1.19 1.00 0.201 0.38
2006-‐11-‐15 11:14 Kuril 46.58 153.27 15.0 8.33 35.10 113.5 57.7 3.40 1.84 3.70 19.83 25.70 0.73 0.35 0.27 1.57 1.64 1.38 0.085 0.14
2007-‐08-‐15 23:40 Peru -‐13.38 -‐76.61 29.4 8.00 11.20 107.0 61.5 21.08 0.25 7.98 21.08 19.20 1.71 0.65 0.05 1.44 1.83 1.58 0.173 0.24
2007-‐09-‐02 01:05 SantaCruz -‐11.62 165.84 10.5 7.27 0.90 25.5 13.9 16.06 0.06 4.49 128.48 1.04 1.16 0.32 0.12 2.05 2.06 1.57 0.071 0.10
2007-‐09-‐12 11:10 Sumatra -‐4.44 101.37 30.9 8.52 67.10 109.0 53.4 3.19 2.95 3.09 44.10 74.80 1.11 0.71 0.67 1.40 1.44 1.17 0.145 0.26
2007-‐09-‐12 23:49 Sumatra -‐2.66 100.83 34.1 7.91 8.13 71.0 26.5 10.77 0.32 2.96 168.28 16.20 1.99 1.24 0.10 1.49 1.55 1.07 0.301 0.50
2010-‐02-‐27 06:34 Chile -‐36.12 -‐72.90 28.3 8.81 186.00 122.0 62.6 3.16 5.95 5.65 49.38 270.00 1.45 0.74 0.47 1.51 1.61 1.60 0.142 0.20
210.0
2010-‐10-‐25 14:42 Mentawai -‐3.49 100.08 12.3 7.85 6.77 97.5 41.0 0.86 1.54 1.26 2.90 2.13 0.32 0.09 0.09 1.45 2.12 1.75 0.23 0.28
2011-‐03-‐11 05:46 Tohoku 38.30 142.37 16.1 9.12 531.00 157.5 79.4 12.50 4.72 26.80 42.19 951.00 1.79 0.63 0.18 2.06 1.52 1.39 0.028 0.05
418 0.79 0.28 0.08
2012-‐10-‐28 03:04 HaidaGwaii 52.79 -‐132.10 8.8 7.80 5.68 51.0 29.4 5.54 0.40 4.38 67.41 8.42 1.48 0.44 0.32 1.99 1.76 1.81 0.069 0.09
2013-‐02-‐06 01:12 SantaCruz -‐10.74 165.14 16.6 7.95 9.37 70.0 32.1 5.23 0.58 2.45 17.65 5.36 0.57 0.31 0.06 2.01 1.78 1.45 0.058 0.09
2014-‐04-‐01 23:46 Nchile -‐19.64 -‐70.82 27.5 8.12 16.90 77.5 38.7 7.66 0.65 4.93 25.85 39.80 2.36 1.13 0.49 1.62 1.53 1.22 0.131 0.23
2014-‐04-‐03 02:43 Nchile -‐20.52 -‐70.50 31.7 7.69 3.86 45.0 20.9 4.28 0.36 1.88 22.94 10.60 2.75 1.38 1.01 1.52 1.79 1.21 0.18 0.32
1. Ath* and Dth* are effective rupture area and corresponding average slip from the slip models with trimming factors that provide circular rupture models
with uniform average slip that give stress drops that match ΔσE calculations.
2. Values given in red are radiated energy estimates from previous studies (Lay et al., 2012) for events with MW > 8.5.
3. Examples of events for which constraints on the rupture expansion velocity from previous studies are considered in developing our preferred final
inversion models include the 2 June 1994 MW 7.6 Java tsunami earthquake [Abercrombie et al., 2001], the 21 February 1996 MW 7.6 Java tsunami
earthquake [Ihmle et al., 1998], the 28 March 2005, MW 8.6 Sumatra earthquake [Banerjee et al., 2007]. 12 September 2007 MW 8.5 and MW 7.9

9
Sumatra earthquakes [Konca et al., 2008], and the 17 July 2006 MW 7.8 Java tsunami earthquake [Ammon et al., 2006]. Several finite-fault models
using the same finite-fault inversion methodology previously performed by the authors with other collaborators are adopted here for the: 2 September
1992 MW 7.6 Nicaragua [Ye et al., 2013]; 23 June 2001 MW 8.4 and 15 August 2007 MW 8.0 Peru earthquakes [Lay et al., 2010b]; 15 November 2006
MW 8.3 Kuril earthquake [Lay et al., 2009]; 27 February 2010 MW 8.8 Chile earthquake [Lay et al., 2010a]; 25 October 2010 MW 7.8 Mentawai tsunami
Chile earthquake [Lay et al., 2011b]; 11 March 2011 MW 9.0 Tohoku earthquake [Lay et al., 2011a]; 28 October 2012 MW 7.8 Haida Gwaii earthquake
[Lay et al., 2013b]; and 6 February 2013 MW 8.0 Santa Cruz Islands earthquake [Lay et al., 2013a]; 1 April 2014 MW 8.1 N.Chile (Iquique) earthquake
[Bai et al., 2015].
4. Strong reverberation is included in the 2 September 2007 MW 7.3 earthquake. The low rupture expansion velocity is needed to model the teleseismic
data for the 3 April 2014, N.Chile MW 7.7 earthquake.
References
Abercrombie, R. E., M. Antolik, K. Felzer, and G. Ekström (2001), The 1994 Java tsunami earthquake: Slip over a subducting seamount, J. Geophys.
Res., 106(B4), 6595–6607, doi:10.1029/2000JB900403.
Ammon, C. J., H. Kanamori, T. Lay, and A. A. Velasco (2006), The 17 July 2006 Java tsunami earthquake, Geophys. Res. Lett., 233, L234308,
doi:10.10239/2006GL028005.
Bai, Y., K. F. Cheung, Y. Yamazaki, T. Lay, and L. Ye (2014). Tsunami surges around the Hawaiian Islands from the 1 April 2014 North Chile Mw 8.1
earthquake. Geophys. Res. Lett., 41(23), 8512-8521.
Banerjee, P., F. Pollitz, B. Nagarajan, and R. Bürgmann, (2007). Coseismic slip distributions of the 26 December 2004 Sumatra–Andaman and 28 March
2005 Nias earthquakes from GPS static offsets. Bull. Seism. Soc. Am., 97(1A), S86-S102.
Ihmlé, P. F., J. M. Gomez, P. Heinrich, and S. Guibourg. The 1996 Peru tsunamigenic earthquake: Broadband source process. Geophys. Res. Lett.,
2691-2694.
Konca, A. O., J. P. Avouac, A. Sladen, A., A. J. Meltzner, et al. (2008), Partial rupture of a locked patch of the Sumatra megathrust during the 2007
earthquake sequence, Nature, 456(7222), 631-635, doi: 10.1038/nature07572.
Lay, T., H. Kanamori, C. J. Ammon, A. R. Hutko, K. Furlong, and L. Rivera (2009), The 2006-2007 Kuril Islands great earthquake sequence, J. Geophys.
Res., 114, B113208, doi:10.1029/2008JB006280.
Lay, T., C. J. Ammon, H. Kanamori, K. D. Koper, O. Sufri, and A. R. Hutko (2010a), Teleseismic inversion for rupture process of the 27 February 2010
Chile (Mw 8.8) earthquake, Geophys. Res. Lett., 37, L13301, doi:10.1029/2010GL043379.
Lay, T., C. J. Ammon, A. R. Hutko, and H. Kanamori (2010b), Effects of kinematic constraints on teleseismic finite-source rupture inversions: Great
Peruvian earthquakes of 23 June 2001 and 15 August 2007, Bull. Seism. Soc. Am., 100, 969-994, doi:10.1785/0120090274

10
Lay, T., C. J. Ammon, H. Kanamori, L. Xue, and M. J. Kim (2011a), Possible large near-trench slip during the 2011 Mw 9.0 off the Pacific coast of Tohoku
Earthquake, Earth, Planets, and Space, 63(7), doi:10.5047/eps.2011.05.033, 687-692.
Lay, T., Ammon, C. J., Kanamori, H., Yamazaki, Y., Cheung, K. F., & Hutko, A. R. (2011b). The 25 October 2010 Mentawai tsunami earthquake (Mw 7.8)
and the tsunami hazard presented by shallow megathrust ruptures. Geophys. Res. Lett., 38(6).
Lay, T., H. Kanamori, C. J. Ammon, K. D. Koper, A. R. Hutko, L. Ye, H. Yue, and T. Rushing (2012), Depth-varying rupture properties of subduction zone
megathrust faults, J. Geophys. Res., 117, B04311, doi: 10.1029/2011JB009133.
Lay, T., L. Ye, H. Kanamori, Y. Yamazaki, K. F. Cheung, and C. J. Ammon (2013a), The February 6, 2013 Mw 8.0 Santa Cruz Islands earthquake and
tsunami, Tectonophysics, 608, 1109-1121..
Lay, T., L. Ye, H. Kanamori, Y. Yamazaki, K. F. Cheung, K. D. Koper, and K. Kwong (2013b), The October 28, 2012 Mw 7.8 Haida Gwaii underthrusting
earthquake and tsunami: Slip partitioning along the Queen Charlotte Fault transpressional plate boundary, Earth Planet. Sci. Lett., 375, 57-70.
Ye, L., T. Lay, and H. Kanamori (2013), Large earthquake rupture process variations on the Middle America megathrust, Earth Planet. Sci. Lett., 381,147-
155.

11
Table S2. Earthquake Information for group 2 events
Date Time Location Lat(°) Lon(°) Hc
(km) Mw M0
(1020Nm) Td(s) Tc(s) ΔσE
2.0
(MPa) ΔσE
2.5
(MPa) ΔσE
3.0
(MPa) Ath
*
(104km2) Dth
* (m)
ER (1015J)
ER/M0 *10-‐5
σa (MPa) ηR
n0 (Brune)
n1 (0.3-‐1Hz)
n2 (0.3-‐2Hz)
r1 (0.3-‐1Hz)
r2 (0.3-‐2Hz)
1990-‐03-‐05 16:38 Vanuatu -‐18.32 168.16 25.4 6.98 0.34 15.5 7.5 14.53 7.31 4.11 0.05 0.95 0.27 0.80 0.54 0.15 2.15 1.67 1.24 0.10 0.18
1990-‐03-‐25 13:22 CostaRica 9.94 -‐84.78 16.9 7.33 1.10 30.0 13.0 4.85 2.23 1.09 0.24 0.83 0.46 0.42 0.20 0.18 1.93 1.80 1.60 0.16 0.23
1990-‐04-‐18 13:39 Sulawesi 1.20 122.82 21.7 7.65 3.31 37.0 19.1 7.71 3.70 1.99 0.36 1.64 2.42 0.73 0.35 0.31 1.63 1.17 1.21 0.29 0.43
1991-‐06-‐20 05:18 Sulawesi 1.21 122.77 28.8 7.54 2.31 29.0 11.3 24.39 10.73 5.81 0.14 2.11 2.13 0.92 0.53 0.03 1.74 1.21 1.11 0.24 0.39
1991-‐11-‐19 22:28 Colombia 4.55 -‐77.36 20.8 7.23 0.79 22.5 10.7 7.85 3.91 2.38 0.13 1.09 1.15 1.46 0.72 0.35 1.68 1.45 1.57 0.25 0.32
1991-‐12-‐22 08:43 Kuril 45.59 151.04 23.4 7.60 2.77 32.0 16.4 5.10 2.02 1.21 0.48 0.98 2.00 0.72 0.37 0.61 1.79 1.34 0.98 0.22 0.42
1992-‐04-‐25 18:06 California 40.35 -‐124.07 8.3 7.18 0.67 22.0 8.9 11.59 5.78 3.35 0.09 1.96 1.50 2.24 0.71 0.20 2.02 1.80 1.86 0.11 0.13
1992-‐05-‐15 07:05 Guinea -‐6.06 147.62 34.4 7.24 0.81 23.0 11.1 5.65 3.85 2.39 0.14 0.92 0.98 1.21 0.64 0.41 1.62 1.59 1.03 0.32 0.53
1992-‐05-‐17 09:49 Mindanao 7.33 126.67 38.7 7.10 0.49 17.5 8.7 9.14 4.75 2.54 0.09 0.79 0.32 0.64 0.43 0.13 1.69 1.56 0.78 0.32 0.62
1992-‐12-‐12 05:29 Indonesia -‐8.50 121.83 17.4 7.77 5.06 51.0 24.5 18.36 9.91 7.38 0.25 3.31 15.10 2.98 1.44 0.41 1.29 1.89 1.53 0.28 0.36
1993-‐05-‐11 18:26 Mindanao 7.25 126.62 51.9 6.98 0.34 14.5 8.7 4.35 2.53 1.54 0.11 0.50 0.17 0.50 0.34 0.22 1.71 1.41 0.96 0.27 0.52
1993-‐08-‐10 00:51 NewZealand -‐45.22 167.01 25.2 6.98 0.33 25.0 9.9 4.24 2.14 1.39 0.11 0.45 0.75 2.27 1.30 1.18 1.58 1.78 1.42 0.37 0.48
1993-‐09-‐10 19:12 Mexico 14.76 -‐92.64 29.4 7.25 0.83 13.0 7.5 19.04 9.39 5.23 0.08 1.52 1.01 1.21 0.80 0.18 2.07 1.63 1.11 0.08 0.16
1993-‐11-‐13 01:18 Kamchatka 51.94 158.63 45.7 7.04 0.40 21.5 9.8 5.17 2.65 1.46 0.11 0.56 0.36 0.89 0.60 0.33 1.50 0.90 1.02 0.48 0.68
1994-‐10-‐09 07:55 Kuril 43.97 147.89 35.7 7.28 0.94 16.5 8.4 11.62 6.38 3.57 0.11 1.21 0.90 0.96 0.65 0.24 1.64 1.53 1.05 0.40 0.60
1994-‐12-‐28 12:19 Honshu 40.54 143.43 27.6 7.76 4.89 35.0 32.1 6.27 3.28 1.90 0.50 1.38 6.98 1.43 0.92 0.51 1.70 1.42 1.16 0.26 0.43
1995-‐05-‐05 03:53 Samar 12.66 125.22 26.1 7.07 0.45 13.5 11.2 4.79 2.13 0.97 0.14 0.53 0.68 1.51 0.89 1.34 1.73 1.57 1.26 0.26 0.39
1995-‐07-‐03 19:50 Kermadec -‐29.40 -‐177.45 44.6 7.16 0.62 20.0 9.9 7.23 3.78 2.21 0.12 0.74 0.56 0.90 0.61 0.33 1.61 1.24 0.74 0.36 0.66
1995-‐07-‐30 05:11 Chile -‐23.34 -‐70.27 37.0 8.02 12.20 62.5 28.2 7.34 3.83 2.20 0.84 1.78 11.00 0.90 0.61 0.61 1.32 1.53 1.42 0.38 0.51
1995-‐08-‐16 10:27 Solomon -‐5.78 154.29 45.4 7.74 4.62 46.0 26.1 7.64 3.39 2.06 0.48 1.08 4.07 0.88 0.55 0.40 1.50 1.33 0.66 0.33 0.67
1995-‐09-‐14 14:04 Mexico 16.85 -‐98.51 20.4 7.38 1.31 17.0 8.4 21.02 10.29 6.85 0.10 2.73 2.40 1.83 0.75 0.11 2.15 1.81 1.65 0.05 0.07
1995-‐10-‐09 15:35 Mexico 19.05 -‐104.21 15.5 8.01 11.50 79.5 35.4 4.19 1.99 1.24 1.26 1.66 6.47 0.56 0.24 0.25 1.51 1.46 1.69 0.12 0.16
1995-‐12-‐03 18:02 Kuril 44.71 149.26 25.5 7.91 8.24 51.0 26.2 4.77 2.38 1.33 0.89 1.26 4.74 0.58 0.34 0.18 1.64 1.23 1.05 0.19 0.36
1996-‐01-‐01 08:05 Sulawesi 0.71 119.90 19.8 7.75 4.71 26.0 11.6 28.36 13.85 7.28 0.19 4.80 8.50 1.80 0.74 0.07 2.08 1.61 1.47 0.06 0.10
1996-‐02-‐07 21:36 Kuril 45.37 149.90 35.8 7.17 0.64 18.5 9.9 6.79 3.71 2.13 0.13 0.77 0.48 0.75 0.48 0.29 1.63 1.21 0.92 0.39 0.63
1996-‐02-‐17 05:59 Indonesia -‐0.92 136.98 14.9 8.22 24.10 71.0 34.2 10.29 5.22 3.04 1.08 4.04 42.90 1.78 0.76 0.53 1.87 2.09 1.64 0.08 0.11
1996-‐02-‐25 03:08 Mexico 15.93 -‐98.11 17.8 7.13 0.55 14.5 8.4 6.18 3.08 1.72 0.12 0.64 0.30 0.55 0.37 0.23 2.14 2.22 2.00 0.08 0.10
1996-‐04-‐29 14:40 Papua -‐6.54 155.10 52.8 7.22 0.76 18.5 8.2 12.49 6.51 3.76 0.09 1.18 0.69 0.91 0.62 0.10 1.72 1.50 1.43 0.27 0.37
1996-‐06-‐10 04:03 Aleutian 51.59 -‐177.59 21.7 7.90 8.05 53.5 27.7 4.87 2.50 1.32 0.85 1.66 6.55 0.81 0.37 0.53 1.52 1.25 0.95 0.25 0.47

12
Date Time Location Lat(°) Lon(°) Hc
(km) Mw M0
(1020Nm) Td(s) Tc(s) ΔσE
2.0
(MPa) ΔσE
2.5
(MPa) ΔσE
3.0
(MPa) Ath
*
(104km2) Dth
* (m)
ER (1015J)
ER/M0 *10-‐5
σa (MPa) ηR
n0 (Brune)
n1 (0.3-‐1Hz)
n2 (0.3-‐2Hz)
r1 (0.3-‐1Hz)
r2 (0.3-‐2Hz)
1996-‐06-‐10 15:24 Aleutian 51.43 -‐176.84 30.1 7.25 0.85 22.0 11.0 8.23 3.66 1.80 0.15 0.95 0.88 1.04 0.60 0.30 1.82 1.10 0.74 0.19 0.44
1996-‐06-‐11 18:22 Samar 12.68 125.12 28.0 7.09 0.49 19.0 10.1 5.13 2.34 1.18 0.14 0.54 0.40 0.81 0.50 0.75 1.69 1.45 1.26 0.35 0.49
1996-‐07-‐22 14:19 Sulawesi 1.02 120.41 29.9 7.01 0.36 23.5 12.5 1.69 0.82 0.40 0.23 0.27 0.25 0.70 0.38 1.55 1.60 1.36 1.27 0.42 0.57
1996-‐11-‐12 16:59 Peru -‐14.96 -‐75.56 34.2 7.74 4.57 45.0 29.2 6.71 3.21 1.84 0.49 1.18 8.32 1.82 1.06 0.78 1.52 1.85 1.75 0.23 0.29
1997-‐09-‐20 16:11 Kermadec -‐28.80 -‐177.44 32.0 6.99 0.35 15.0 9.3 12.55 6.83 4.03 0.05 1.01 0.53 1.53 1.04 0.27 1.61 1.17 0.97 0.36 0.58
1997-‐11-‐25 12:14 Sulawesi 1.20 122.49 25.5 7.04 0.41 18.5 8.8 6.48 3.42 1.85 0.10 0.82 0.74 1.78 0.87 0.55 1.80 1.72 1.18 0.24 0.39
1997-‐12-‐05 11:26 Kamchatka 54.80 162.00 42.8 7.78 5.32 52.0 25.4 4.51 2.20 1.25 0.71 0.93 3.08 0.58 0.39 0.44 1.37 1.21 0.90 0.36 0.61
1998-‐01-‐30 12:16 Chile -‐23.85 -‐70.15 42.9 7.06 0.44 20.0 10.7 4.34 2.24 1.31 0.14 0.49 0.85 1.92 1.30 1.69 1.34 1.32 1.20 0.64 0.77
1998-‐04-‐01 17:56 Indonesia -‐0.56 99.20 35.9 6.98 0.33 21.0 11.6 2.44 1.27 0.85 0.16 0.31 0.23 0.70 0.46 1.10 1.37 1.40 1.12 0.69 0.83
1998-‐07-‐17 08:49 Papua -‐2.98 142.69 15.3 7.01 0.37 25.0 18.3 1.84 0.63 0.61 0.27 0.29 0.21 0.56 0.25 1.01 1.71 1.37 1.29 0.27 0.39
1998-‐08-‐04 18:59 Ecuador -‐0.60 -‐80.31 25.8 7.17 0.64 17.5 8.4 10.16 5.20 2.81 0.10 0.96 1.21 1.90 1.14 0.40 1.87 1.61 1.54 0.18 0.25
1999-‐05-‐16 00:51 Papua -‐4.71 152.61 47.8 7.07 0.45 21.5 13.1 1.93 0.97 0.66 0.23 0.27 0.19 0.43 0.29 0.97 1.59 1.03 0.67 0.42 0.74
1999-‐11-‐19 13:56 Papua -‐6.36 148.81 45.0 7.03 0.40 18.5 9.3 6.89 3.22 1.74 0.10 0.46 0.12 0.31 0.21 0.08 1.68 1.17 0.77 0.27 0.55
2000-‐11-‐17 21:01 Papua -‐5.49 151.88 16.1 7.80 5.64 61.5 29.2 5.51 3.49 1.40 0.53 2.14 1.35 0.24 0.09 0.09 1.66 1.16 0.85 0.22 0.46
2001-‐02-‐13 19:28 Indonesia -‐4.83 102.32 21.5 7.34 1.16 24.5 16.2 6.18 3.26 1.87 0.20 0.93 1.09 0.94 0.48 0.66 1.61 1.39 0.86 0.41 0.68
2001-‐02-‐24 07:23 Molucca 1.33 126.27 42.9 7.07 0.45 19.5 7.0 23.91 11.68 5.85 0.05 1.27 0.96 2.15 1.41 0.13 1.43 1.00 0.86 0.45 0.70
2001-‐07-‐07 09:38 Peru -‐17.53 -‐71.93 24.8 7.64 3.20 45.0 17.4 5.05 2.36 1.20 0.48 1.16 4.06 1.27 0.61 0.40 1.72 1.37 1.33 0.17 0.27
2002-‐01-‐02 17:22 Vanuatu -‐17.59 167.97 38.2 7.23 0.77 32.0 15.7 10.23 4.96 2.85 0.11 1.05 1.62 2.10 1.42 0.79 1.54 1.42 1.17 0.30 0.46
2002-‐03-‐05 21:16 Mindanao 6.02 124.21 28.5 7.49 1.94 31.5 13.1 13.05 6.18 3.07 0.18 1.53 2.05 1.06 0.55 0.14 1.63 1.50 1.26 0.33 0.48
2002-‐09-‐08 18:44 Papua -‐3.26 142.98 18.7 7.61 2.94 33.5 14.8 10.44 4.15 3.57 0.31 1.62 6.56 2.23 1.08 0.45 1.78 2.08 1.64 0.13 0.17
2003-‐01-‐22 02:06 Mexico 18.90 -‐104.06 25.8 7.51 2.05 22.0 10.6 15.67 7.00 3.73 0.18 1.76 4.03 1.97 1.25 0.38 2.01 1.79 1.55 0.10 0.15
2003-‐03-‐17 16:36 Alaska 51.28 177.93 29.0 7.05 0.42 17.0 8.0 7.96 3.81 2.09 0.09 0.61 0.20 0.49 0.31 0.07 1.70 1.65 2.77 0.32 0.35
2003-‐08-‐21 12:12 NewZealand -‐45.20 167.14 27.1 7.22 0.75 12.0 8.1 9.48 4.99 2.15 0.11 1.02 1.60 2.14 1.37 0.41 1.56 1.19 1.45 0.44 0.55
2003-‐09-‐25 19:50 Hokkaido 41.86 143.87 28.7 8.20 22.10 57.0 27.6 13.54 5.94 3.20 0.94 3.89 35.60 1.61 0.85 0.24 1.72 1.70 1.25 0.15 0.26
2003-‐10-‐31 01:06 Houshu 37.87 142.59 16.2 7.00 0.35 23.0 12.2 2.31 1.20 0.69 0.17 0.47 0.19 0.53 0.21 0.34 1.54 1.51 1.39 0.45 0.58
2003-‐11-‐17 06:43 Aleutian 51.12 178.65 24.6 7.78 5.28 39.0 20.5 4.94 2.41 1.54 0.66 1.28 5.07 0.96 0.52 0.32 1.66 1.31 1.03 0.31 0.52
2003-‐12-‐27 16:01 Loyalty -‐21.97 169.86 20.4 7.29 0.95 39.5 18.9 1.86 1.20 0.95 0.33 0.40 0.80 0.84 0.42 1.41 1.69 1.79 1.29 0.17 0.27
2004-‐11-‐11 21:26 Indonesia -‐8.18 124.71 13.4 7.58 2.60 41.5 22.7 1.63 0.85 0.50 0.83 0.69 3.44 1.32 0.49 1.13 1.46 1.51 1.38 0.31 0.44
2004-‐11-‐22 20:26 NewZealand -‐46.70 164.82 36.2 7.13 0.56 17.0 8.0 10.89 5.10 2.82 0.09 0.87 1.18 2.12 1.44 0.48 1.50 1.89 1.87 0.51 0.57
2004-‐11-‐28 18:32 Hokkaido 43.02 145.15 41.5 7.01 0.37 11.0 7.7 11.54 5.70 3.26 0.06 0.93 1.37 3.75 2.54 0.64 2.02 1.89 1.46 0.33 0.44

13
Date Time Location Lat(°) Lon(°) Hc
(km) Mw M0
(1020Nm) Td(s) Tc(s) ΔσE
2.0
(MPa) ΔσE
2.5
(MPa) ΔσE
3.0
(MPa) Ath
*
(104km2) Dth
* (m)
ER (1015J)
ER/M0 *10-‐5
σa (MPa) ηR
n0 (Brune)
n1 (0.3-‐1Hz)
n2 (0.3-‐2Hz)
r1 (0.3-‐1Hz)
r2 (0.3-‐2Hz)
2005-‐08-‐16 02:46 Honshu 38.27 142.03 42.8 7.22 0.76 23.5 11.5 7.37 3.79 2.23 0.13 0.66 0.83 1.09 0.74 0.21 1.42 1.19 1.05 0.53 0.72
2007-‐01-‐21 11:27 Molucca 1.12 126.34 18.9 7.50 1.97 35.5 21.2 4.10 2.17 1.37 0.37 1.15 5.09 2.58 1.12 2.61 1.39 1.01 0.92 0.54 0.76
2007-‐03-‐25 00:40 Vanuatu -‐20.62 169.41 33.5 7.16 0.62 17.5 8.7 6.50 3.10 1.88 0.13 0.71 1.16 1.86 1.26 0.78 1.52 1.60 1.19 0.49 0.67
2007-‐04-‐01 20:39 Solomon -‐8.43 157.06 14.8 8.10 15.70 104.5 51.2 10.55 7.62 5.63 0.62 4.72 19.10 1.22 0.50 0.27 1.39 1.89 1.43 0.17 0.25
2007-‐09-‐13 03:35 Mentawai -‐2.15 99.61 21.8 7.08 0.47 17.5 9.1 6.75 3.44 2.10 0.10 0.68 0.69 1.47 1.00 0.39 1.71 1.50 1.14 0.35 0.54
2007-‐11-‐14 15:40 Chile -‐22.25 -‐69.89 36.7 7.75 4.76 44.5 22.2 8.58 4.13 2.13 0.43 2.18 8.91 1.87 0.76 0.53 1.16 1.53 1.21 0.48 0.65
2007-‐12-‐19 09:30 Aleutian 51.36 -‐179.51 30.8 7.21 0.72 21.0 10.0 7.00 3.22 1.80 0.14 0.67 0.46 0.64 0.39 0.10 1.60 1.19 0.85 0.43 0.68
2008-‐02-‐20 08:08 Simeulue 2.77 95.96 29.0 7.33 1.12 26.0 18.5 2.99 1.46 0.80 0.33 0.47 1.31 1.17 0.79 1.47 1.60 1.07 1.04 0.38 0.58
2008-‐02-‐25 08:36 Mentawai -‐2.49 99.97 25.5 7.23 0.78 18.5 9.3 9.27 4.06 2.26 0.13 0.82 1.10 1.42 0.96 0.53 1.71 1.44 1.20 0.33 0.49
2008-‐04-‐09 12:46 Loyalty -‐20.07 168.89 29.6 7.34 1.13 19.0 9.7 13.10 6.25 3.26 0.12 1.24 1.54 1.36 0.92 0.43 1.88 1.30 1.03 0.14 0.27
2008-‐07-‐19 02:39 Honshu 37.55 142.21 22.9 6.95 0.29 12.5 6.7 7.76 3.91 2.22 0.07 0.95 0.40 1.37 0.66 0.27 1.67 1.39 1.28 0.33 0.47
2008-‐09-‐29 15:19 Kermadec -‐29.76 -‐177.68 42.1 7.07 0.45 23.5 10.8 3.05 1.55 0.94 0.17 0.38 0.59 1.31 0.89 0.86 1.32 0.77 0.84 0.67 0.84
2008-‐11-‐16 17:02 Sulawesi 1.27 122.09 30.9 7.38 1.31 29.0 12.1 9.35 4.40 2.46 0.17 1.11 1.66 1.27 0.73 0.35 1.63 1.48 1.24 0.34 0.50
2009-‐01-‐03 19:43 Papua -‐0.41 132.89 14.2 7.70 3.94 51.0 21.8 4.02 1.75 0.91 0.68 1.46 8.51 2.16 0.77 1.48 1.65 1.71 1.45 0.19 0.27
2009-‐01-‐03 22:33 Papua -‐0.69 133.31 19.4 7.40 1.41 24.5 9.6 21.46 10.09 5.04 0.11 2.47 3.47 2.46 0.95 0.10 1.75 1.96 1.50 0.20 0.27
2009-‐07-‐15 09:22 NewZealand -‐45.76 166.56 17.6 7.81 5.79 30.0 18.4 11.27 4.97 3.16 0.43 2.76 10.20 1.76 0.81 0.35 2.02 1.69 1.65 0.08 0.11
2009-‐10-‐07 22:03 Vanuatu -‐13.01 166.51 35.4 7.64 3.27 40.0 16.4 8.67 3.44 2.40 0.37 1.17 2.56 0.78 0.49 0.30 1.66 1.33 1.00 0.24 0.44
2010-‐04-‐06 22:15 NSumatra 2.38 97.05 29.1 7.85 6.59 37.5 18.8 14.23 6.61 3.70 0.39 2.02 7.47 1.13 0.77 0.27 1.76 1.55 1.30 0.19 0.30
2010-‐05-‐09 05:59 NSumatra 3.75 96.02 37.2 7.28 0.94 23.5 12.3 5.44 2.66 1.48 0.20 0.66 1.19 1.26 0.85 1.17 1.50 1.30 0.95 0.54 0.75
2010-‐08-‐04 22:01 Guinea -‐5.75 150.77 27.4 6.92 0.27 23.5 11.2 2.30 0.97 0.55 0.17 0.32 0.12 0.45 0.21 0.54 1.60 1.50 1.08 0.42 0.62
2010-‐08-‐10 05:23 Vanuatu -‐17.54 168.07 30.7 7.30 1.01 19.0 7.7 35.37 15.65 8.73 0.06 2.15 2.33 2.31 1.57 0.14 1.84 1.63 1.36 0.19 0.28
2011-‐01-‐02 20:20 Chile -‐38.36 -‐73.33 23.9 7.17 0.63 18.0 8.9 9.86 4.88 2.63 0.10 1.25 0.82 1.29 0.53 0.22 1.81 2.03 1.53 0.29 0.37
2011-‐03-‐09 02:45 Honshu 38.44 142.84 18.1 7.36 1.23 22.5 14.8 3.40 1.78 1.05 0.30 0.93 1.19 0.97 0.41 0.59 1.69 1.26 1.31 0.29 0.41
2011-‐08-‐20 16:55 Vanuatu -‐18.37 168.14 29.4 7.17 0.63 17.5 10.4 6.85 3.25 1.79 0.13 0.75 0.56 0.89 0.60 0.81 1.86 1.44 1.23 0.16 0.27
2011-‐08-‐20 18:19 Vanuatu -‐18.31 168.22 30.5 7.08 0.46 18.5 10.4 5.24 2.65 1.57 0.12 0.54 0.67 1.45 0.98 1.23 1.76 1.39 0.89 0.18 0.39
2012-‐03-‐20 18:02 Mexico 16.66 -‐98.19 20.0 7.50 1.98 16.0 7.8 43.04 21.04 11.32 0.08 4.65 5.86 2.96 1.26 0.10 2.38 2.12 1.76 0.04 0.05
2012-‐03-‐25 22:37 Chile -‐35.18 -‐71.79 33.4 7.15 0.60 31.5 13.9 3.17 1.54 0.79 0.21 0.60 0.71 1.19 0.47 0.96 1.52 1.44 1.18 0.31 0.50
2012-‐08-‐27 04:37 ElSalvador 12.28 -‐88.53 10.5 7.37 1.27 34.5 18.5 1.32 0.72 0.50 0.57 0.59 0.54 0.43 0.16 0.38 2.13 1.70 1.35 0.02 0.04
2012-‐09-‐05 14:42 CostaRica 10.12 -‐85.35 22.3 7.66 3.42 35.5 16.1 6.85 3.41 1.94 0.39 1.96 3.60 1.05 0.46 0.41 1.84 1.47 1.83 0.10 0.13
2012-‐11-‐07 16:35 Guatemala 14.08 -‐91.92 19.1 7.41 1.45 25.5 10.7 12.03 5.52 2.73 0.16 1.56 1.54 1.06 0.48 0.13 1.71 1.34 1.19 0.18 0.30

14
Date Time Location Lat(°) Lon(°) Hc
(km) Mw M0
(1020Nm) Td(s) Tc(s) ΔσE
2.0
(MPa) ΔσE
2.5
(MPa) ΔσE
3.0
(MPa) Ath
*
(104km2) Dth
* (m)
ER (1015J)
ER/M0 *10-‐5
σa (MPa) ηR
n0 (Brune)
n1 (0.3-‐1Hz)
n2 (0.3-‐2Hz)
r1 (0.3-‐1Hz)
r2 (0.3-‐2Hz)
2013-‐08-‐30 16:25 Alaska 51.55 -‐175.23 30.2 7.00 0.36 18.0 9.7 3.94 2.11 1.14 0.12 0.43 0.25 0.70 0.48 0.70 1.57 0.87 0.74 0.44 0.71
2013-‐09-‐25 16:42 Peru -‐15.84 -‐74.51 39.6 7.08 0.46 15.0 8.7 12.23 6.34 3.33 0.07 1.04 1.11 2.41 1.52 0.62 1.99 1.44 1.32 0.18 0.28
2014-‐04-‐11 07:07 Papua -‐6.63 155.06 46.4 7.10 0.50 25.0 11.4 4.08 1.95 1.19 0.16 0.40 0.52 1.03 0.70 0.60 1.33 1.42 0.84 0.58 0.81
2014-‐04-‐18 14:27 Guerrero 17.55 -‐100.82 22.9 7.28 0.93 24.5 12.0 6.36 2.94 1.63 0.18 0.80 0.95 1.03 0.53 0.25 1.69 1.50 1.32 0.25 0.37
2014-‐04-‐19 13:27 Papua -‐6.72 154.93 44.6 7.52 2.14 21.0 8.4 35.11 16.65 9.08 0.10 2.59 2.78 1.30 0.88 0.08 1.45 1.29 0.64 0.15 0.42
2015-‐03-‐29 23:48 Papua -‐4.76 152.56 28.7 7.52 2.16 30.5 25.1 3.41 1.99 1.68 0.41 0.79 1.27 0.59 0.33 0.49 1.69 1.23 0.95 0.27 0.49
2015-‐05-‐05 01:44 Papua -‐5.47 151.89 39.0 7.52 2.12 56.5 22.8 1.70 0.83 0.57 0.73 0.41 0.76 0.36 0.21 0.57 1.49 1.02 0.75 0.44 0.73
1. ΔσE2.0, ΔσE
2.5, and ΔσE3.0 are ΔσE calculated from the slip models with Vr 2.0, 2.5 and 3.0 km/s, respectively. All other parameters are from the
finite-‐fault slip models with Vr 2.5 km/s. 2. Ath
* and Dth* are effective rupture area and corresponding average slip from the slip models with Vr 2.5 km/s and the trimming factors that
provide circular rupture models with uniform average slip that give stress drops that match ΔσE calculations.

1
Supplement S1. Finite-fault solutions for each group 1 event for its preferred rupture velocity. Solution parameters are listed in Table S1. The moment rate function for each inversion is shown at the top left. Blue ticks indicate the time span used to determine total duration, Td, and the centroid time, Tc, is indicated by the red tick. The broadband source spectrum is shown next to the moment rate function with fitting parameters discussed in the main text being indicated. The second row shows the subfault grid, with average subfault slip direction and magnitude indicated by the vectors, and slip magnitude is color-coded. Dashed circles indicated rupture front position in 5 s intervals. The average focal mechanism with double couple strike (φ), dip (δ), and rake (λ) is shown next to the slip model. The bottom row shows the average stress vector at the center of each subfault used to compute stress drop for the variable slip solution. Comparisons of all observed (black) and predicted (red) P and SH waveforms are shown in columns on the right. Below each station name the azimuth and distance of the station relative to the source is indicated. The peak-to-peak amplitude of the data trace in microns is shown in blue; each waveform is normalized to uniform amplitude.
Supplement S2. Finite-fault solutions for each group 2 event for a rupture velocity of 2.5 km/s. Solution parameters are listed in Table S2. The moment rate function for each inversion is shown at the top left. Blue ticks indicate the time span used to determine total duration, Td, and the centroid time, Tc, is indicated by the red tick. The broadband source spectrum is shown next to the moment rate function with fitting parameters discussed in the main text being indicated. The second row shows the subfault grid, with average subfault slip direction and magnitude indicated by the vectors, and slip magnitude is color-coded. Dashed circles indicated rupture front position in 5 s intervals. The average focal mechanism with double couple strike (φ), dip (δ), and rake (λ) is shown next to the slip model. The bottom row shows the average stress vector at the center of each subfault used to compute stress drop for the variable slip solution. Comparisons of all observed (black) and predicted (red) P and SH waveforms are shown in columns on the right. Below each station name the azimuth and distance of the station relative to the source is indicated. The peak-to-peak amplitude of the data trace in microns is shown in blue; each waveform is normalized to uniform amplitude.