Embed Size (px)
Citation preview
Supplemental Materials 1
2
Title: Epigenetic mechanisms underlying maternal diabetes-associated risk of congenital heart disease 3
4
Authors: Madhumita Basu,1 Jun-Yi Zhu,2 Stephanie LaHaye1,3, Uddalak Majumdar1, Kai Jiao4, Zhe 5
Han,2 and Vidu Garg 1,3,5 6
7
Affiliations: 8
1Center for Cardiovascular Research and The Heart Center, Nationwide Children’s Hospital, Columbus, 9
OH 43205 10
2Center for Genetic Medicine Research, Children's National Health System, Washington, DC 20010, 11
USA 12
3Department of Molecular Genetics, The Ohio State University, Columbus, OH 43210, USA 13
4Department of Genetics, The University of Alabama at Birmingham, Birmingham, AL 35294, USA. 14
5Departments of Pediatrics, The Ohio State University, Columbus, OH 43210, USA 15
16
17
18
19
20
21
Supplemental Figure and Figure Legends: 22
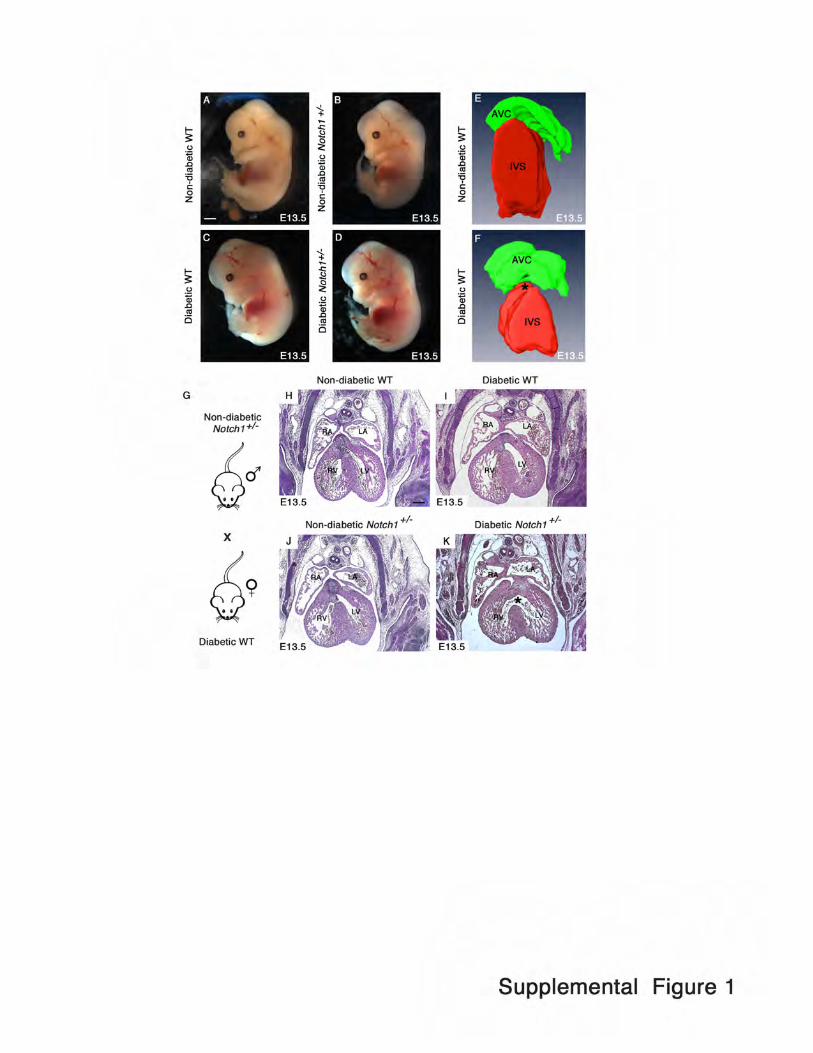
Supplemental Figure 1: Gene-environment interaction between MDM and Notch1. (A-D) 23
Representative images of wildtype (WT) and Notch1+/- E13.5 embryos from non-diabetic and diabetic 24
mothers show no apparent growth retardation. (E, F) Three-dimensional reconstruction of E13.5 non-25
diabetic and diabetic WT heart (N=1 per group) using AMIRAv5.5 software showed the 26
perimembranous VSD (*). AVC, Atrioventricular cushion (green); IVS, interventricular septum (red). 27
(G) Breeding scheme showing non-diabetic Notch1+/- males crossed with diabetic (hyperglycemic, 28
blood glucose >200mg/dl) WT females to test that resultant CHD phenotype is independent of maternal 29
genetic background. (H-K) Representative histologic sections showing location of VSD (*) in E13.5 30
hearts (WT and Notch1+/-) exposed to maternal diabetes as compared to non-diabetic controls. Scale 31
bars: (A-D) 1 mm and (H-K) 200 µm. RA, right atrium, LA, left atrium; RV, right ventricle; LV, left 32
ventricle. 33
34
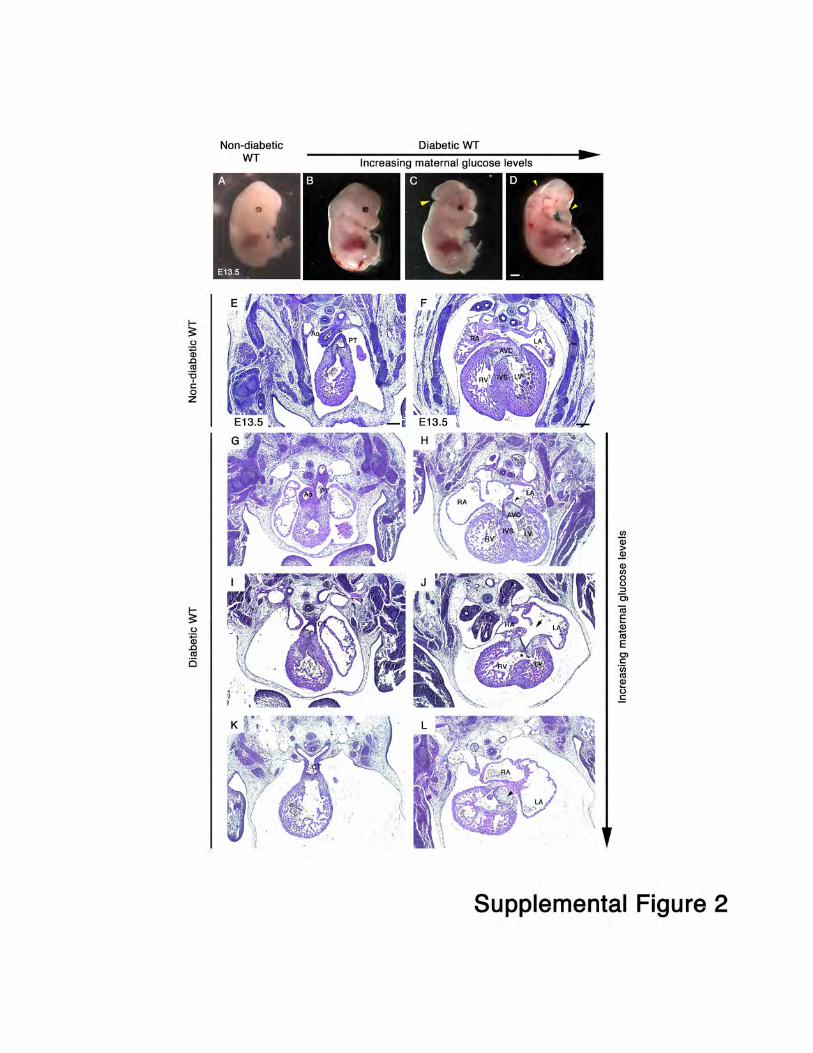
Supplemental Figure 2: Maternal hyperglycemic stress results in spectrum of birth defects in 35
developing embryos. (B-D) General appearance of E13.5 embryos exposed to increasing level of 36
maternal glucose (N=3, range of maternal blood glucose (mg/dl) = 389-787 mg/dl at time of embryo 37
collection) compared to non-diabetic wildtype (WT) control (A). Yellow arrowheads indicate 38
craniofacial and neural tube defects (C, D). (E-L) Representative hematoxylin & eosin images of E13.5 39
heart sections demonstrate improper septation of outflow tract (I, K) compared to E and G, enlarged AV 40
cushion (H, L, black arrowheads), septal defects (J, asterisk and black arrow) and myocardial wall 41
thinning (H, J, L) compared to control embryos (E, F). Scale bars: (A-D) 1 mm and (E-L) 200 µm. RA, 42
right atrium, LA, left atrium; RV, right ventricle; LV, left ventricle; Ao, Aorta; PT, Pulmonary trunk; 43
CT, common trunk; AVC, Atrioventricular cushion; IVS, Intervetricular septum. 44
45
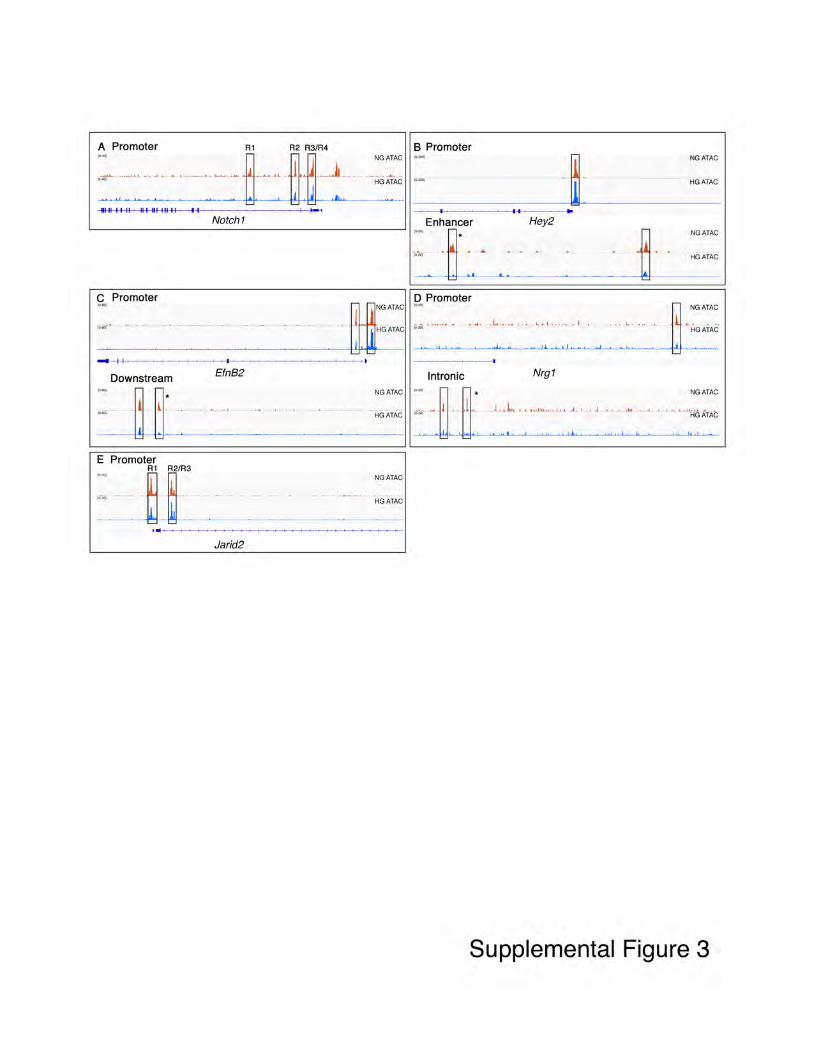
Supplemental Figure 3: Chromatin accessibility at Notch1 and its downstream target loci. (A) 46
Integrative Genome Viewer (IGV) tracks showing ATAC-seq signals for four open regions (R1-R4) at 47
Notch1 loci in NG (red) and HG (blue). (B-E) Chromatin accessibility at the proximal promoter regions 48
of Hey2, EfnB2, Nrg1 and Jarid2 loci remain unaltered in HG compared in NG. Statistically significant 49
changes in chromatin accessibility were found at the enhancer, downstream and intronic regions of 50
Hey2, Efnb2 and Nrg1 respectively (peaks shown with asterisks). 51
52
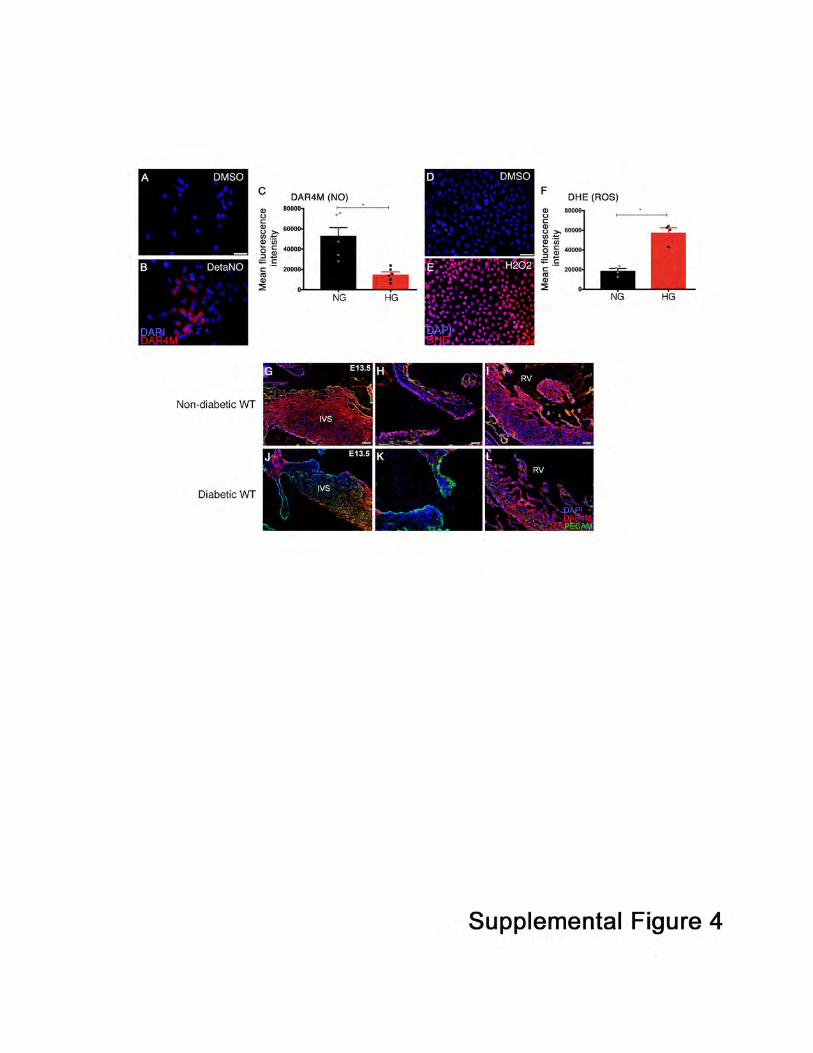
Supplemental Figure 4: Specificity of the probes and quantification of DAR-4M AM+ and DHE+ 53
cells. AVM cells treated with (A, D) DMSO, (B) 250µM DetaNONOate and (E) 300µM H2O2 served as 54
negative and positive controls for DAR-4M AM and DHE staining, respectively, indicating the 55
specificity of the dyes. (C, F) Quantification of mean fluorescence intensity of DAR4M+ and DHE+ cells 56
in NG and HG (N>4). Data presented as mean±SEM; *, p-value <0.05 by 2-tailed Student’s t test. Scale 57
bars: 50µm (A, B) and 100µm (D, E). (G-I) and (J-L) Endothelial cell-specific NO production was 58
measured using DAR4M AM (red) staining in E13.5 non-diabetic and diabetes exposed embryos (N=1 59
per group) co-stained with PECAM (green) and nuclei stained with DAPI (blue). Scale bars: 100µm (G, 60
I, J, L) and 50µm (H, K). 61
62
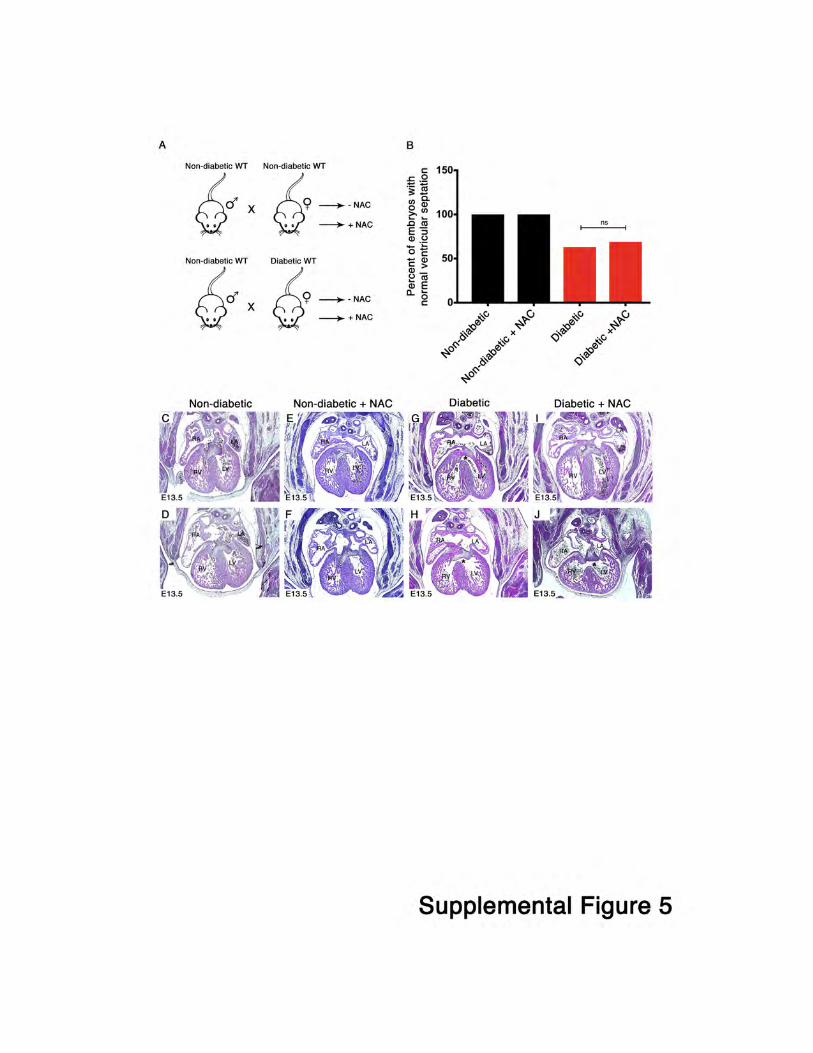
Supplemental Figure 5: Inability of N-acetyl cysteine mediated rescue of VSD phenotype in vivo: 63
(A) Breeding scheme showing non-diabetic wildtype (WT) males crossed with non-diabetic (blood 64
glucose = 165-189 mg/dl at time of embryo harvest) and diabetic (blood glucose=229-389 mg/dl at time 65
of embryo harvest) WT females and subset of these females were treated with N-acetyl cysteine (NAC). 66
(B) No significant rescue was observed in the incidence of VSD among diabetic groups with (31%) or 67
without (37%) treatment of NAC. No VSD was observed in non-diabetic control groups (0%). (G-J) 68
Histologic sections showing location of ventricular septal defects (VSD, *) in E13.5 hearts from two 69
representative embryos exposed to maternal diabetes with or without NAC treatment. Non-diabetic 70
wildtype (WT) control embryos are shown with normal ventricular septation. RA, right atrium, LA, left 71
atrium; RV, right ventricle; LV, left ventricle. Scale bar: 200 µm. 72
73
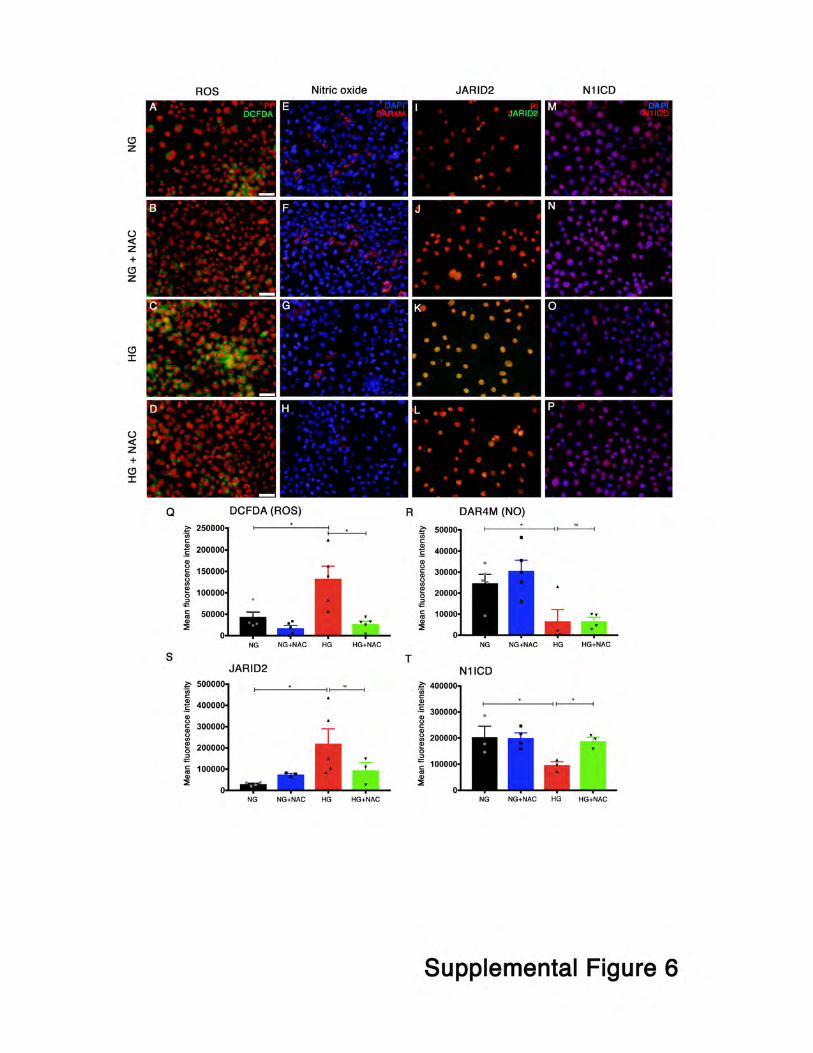
Supplemental Figure 6: N-acetyl cysteine mediated rescue in vitro. AVM cells maintained in NG 74
and HG were stained for (A-D) ROS generation using H2DCFDA (green) and (E-H) NO detected using 75
DAR4M AM (red) after treatment with 5mM NAC and compared to untreated controls. (I-L) and (M-P) 76
Immunofluorescent staining demonstrate JARID2 (green) and active NOTCH1 (N1ICD, red) expression 77
in presence and absence of NAC. Propidium iodide (red, A-D; I-L) and DAPI (blue, E-H; M-P) stain the 78
nuclei. Scale bar: 50µm. (Q-T) Quantification of mean fluorescent intensity of DCFDA, DAR4M, 79
JARID2 and N1ICD staining by ImageJ. N>3, Data presented as mean±SEM; *, p-value <0.05 by 2-80
tailed Student’s t test. 81
82
83
84
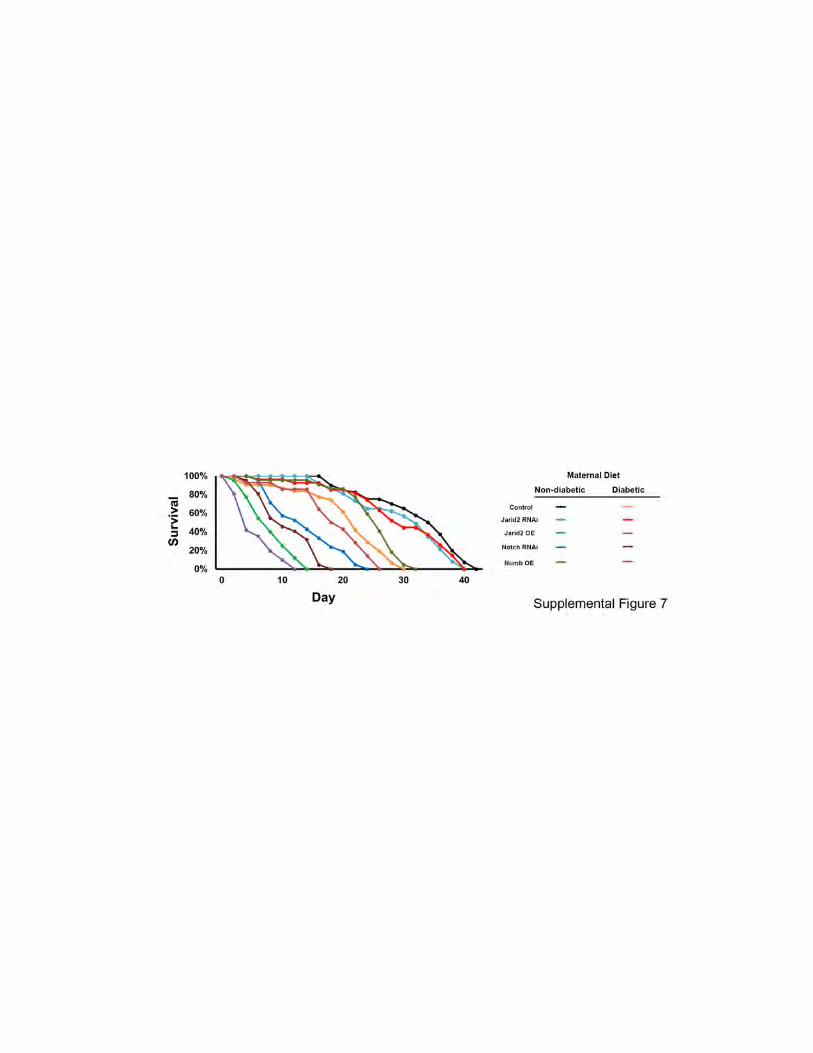
Supplemental Figure 7: RNAi transgene rescues shorter lifespan and cardiac phenotype in 85
Drosophila maternal diabetic model. Survival curves for adult progenies those overexpressing heart 86
specific Jarid2, Numb, Notch RNAi and Jarid2 RNAi transgenes are shown. Color-coding identifies 87
exposure to maternal diabetes and presence of transgenes. 88
89
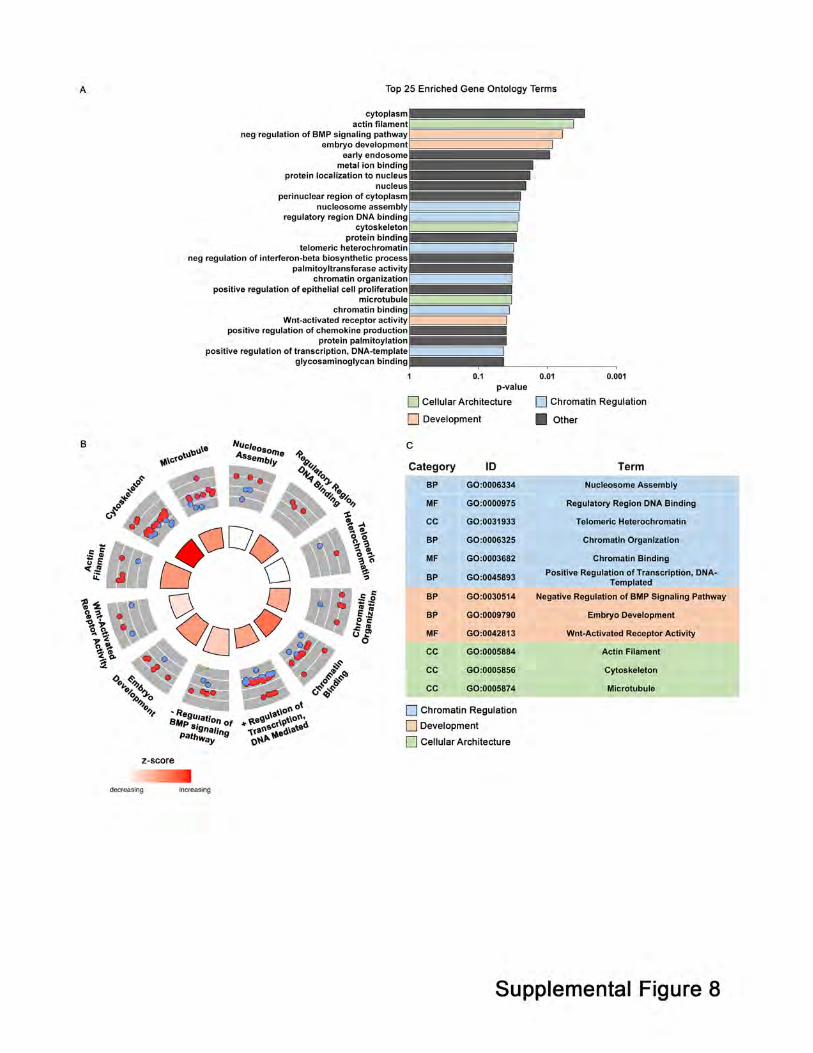
Supplemental Figure 8: In vitro ATAC-seq highlights top GO enriched terms altered in 90
hyperglycemic stress. (A) Gene ontology analysis performed on genes associated with peaks in 91
“promoter” regions, with p-value <0.05 and >1.5 fold change, highlights the 25 most significant GO 92
terms. Green: Cellular Architecture, Blue: Chromatin Regulation, Pink: Development, Grey: Other. (B) 93
Circle plot generated to highlight the 12 GO terms that fall within Chromatin Regulation (Blue), 94
Development (Pink), or Cellular Architecture (Green) classifications (C). Within the circle plot, the 95
colored dots represent gene associated peaks that are more open in high glucose (red) or more open in 96
normal glucose (blue) within each GO term. The size of the rectangle in the inner circle represents the p-97
value, with larger rectangles equating to lower p-values. The color of the rectangle represents the z-98
score, blue and red representing low and high z-scores respectively. The z-score used in this analysis 99
refers to the following equation: z-score = (# of peaks up - # of peaks down)/ (sqrt of total count), 100
allowing for an inference in the overall change of the biological function. 101
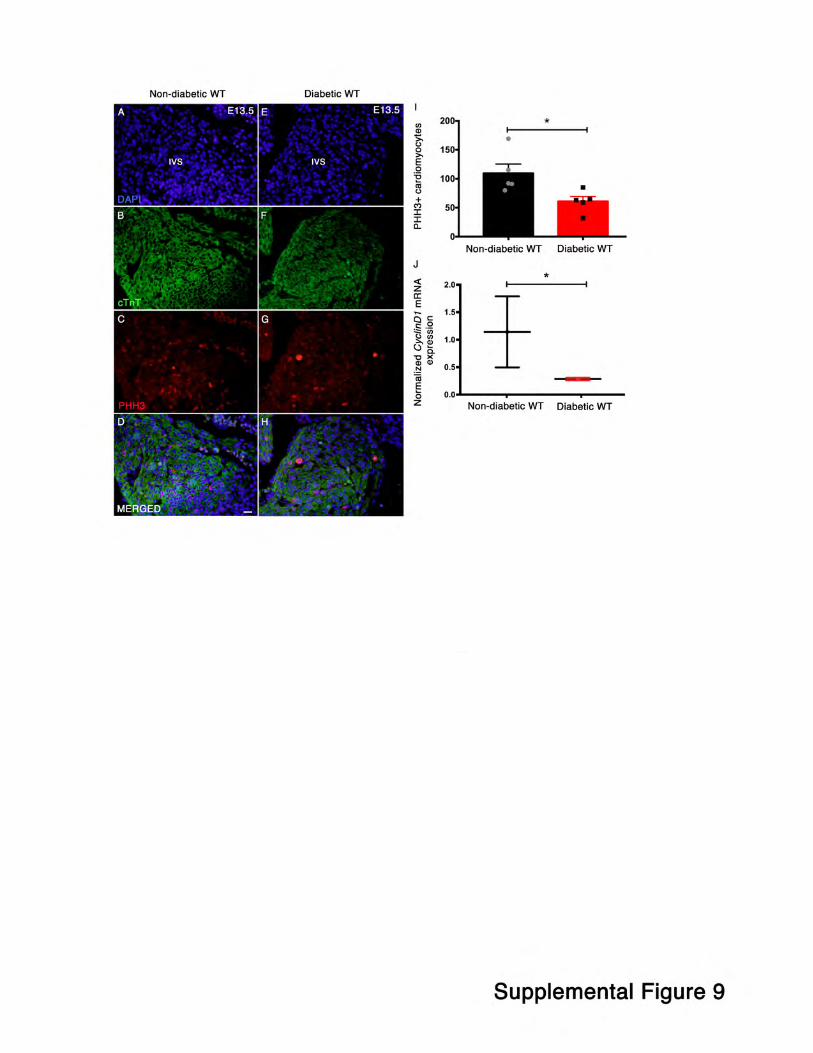
Supplemental Figure 9: Hyperglycemia reduces cardiomyocytes proliferation at E13.5 embryos. 102
(A-H) Immunofluorescent staining using phospho-histone H3 (PHH3, Ser10, red) demonstrates 103
decreased cardiomyocyte proliferation in the interventricular septum (IVS) of the diabetic E13.5 WT 104
embryonic hearts compared to non-diabetic controls (N=3 each group). cTnT staining (green) is shown 105
to label cardiomyocytes and corresponding nucleus stained with DAPI (blue). Scale bar (A-H): 20 µm. 106
(I) Quantitation of PHH3+ cardiomyocytes demonstrated downregulation of cardiomyocyte proliferation 107
between two groups. N=5. Data presented as mean±SEM; * , p-value <0.05 by 2-tailed Student’s t test. 108
(J) Transcript expression of CyclinD1 is reduced in diabetic WT E13.5 embryonic hearts with respect to 109
non-diabetic controls (N=6 whole hearts pooled together/ group) as measured with qRT-PCR. Data 110
shown as average± SD; *, p-value <0.05 by 2-tailed Student’s t test. 111
112
Supplemental Tables: 113
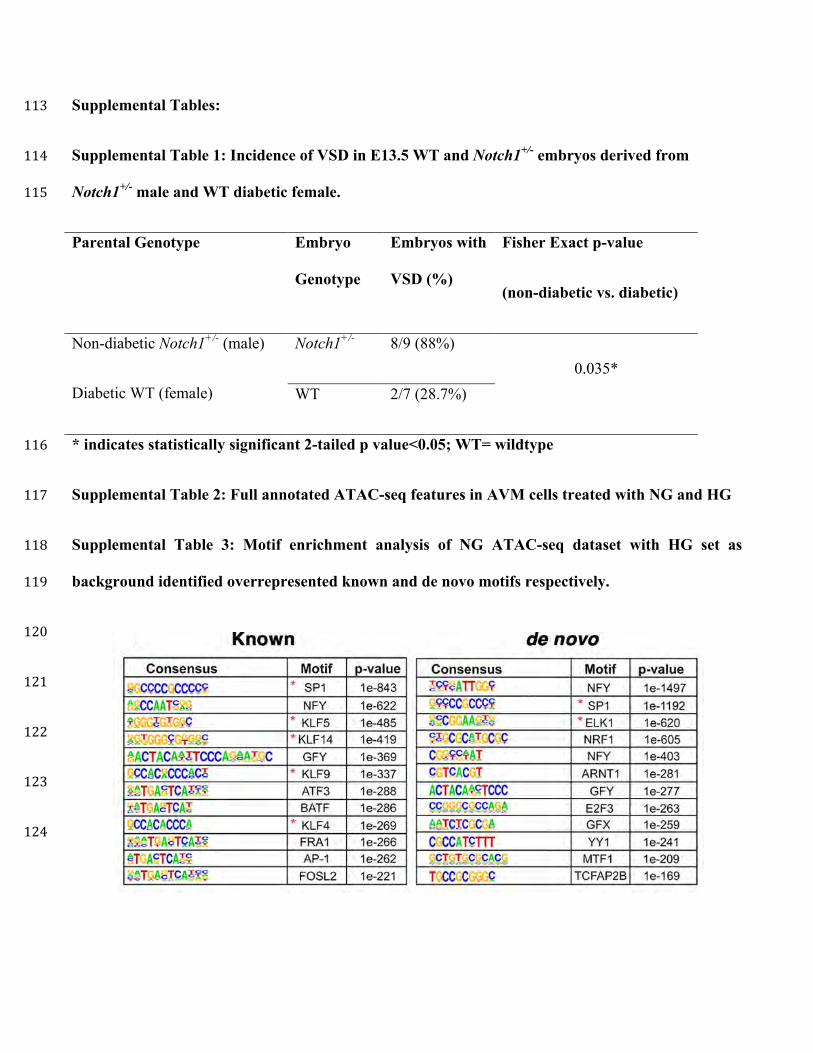
Supplemental Table 1: Incidence of VSD in E13.5 WT and Notch1+/- embryos derived from 114
Notch1+/- male and WT diabetic female. 115
Parental Genotype Embryo
Genotype
Embryos with
VSD (%)
Fisher Exact p-value
(non-diabetic vs. diabetic)
Non-diabetic Notch1+/- (male)
Diabetic WT (female)
Notch1+/- 8/9 (88%) 0.035*
WT 2/7 (28.7%)
* indicates statistically significant 2-tailed p value<0.05; WT= wildtype 116
Supplemental Table 2: Full annotated ATAC-seq features in AVM cells treated with NG and HG 117
Supplemental Table 3: Motif enrichment analysis of NG ATAC-seq dataset with HG set as 118
background identified overrepresented known and de novo motifs respectively. 119
120
121
122
123
124
Supplemental Table 4: Known and de novo transcription factor binding motifs enriched in NG 125
compared to HG 126
Supplemental Table 5: TFBS profile for Nos3_R1 127
Supplemental Table 6: TFBS profile for Nos3_R2 128
Supplemental Table 7: TFBS profile for Nos3_R3 129
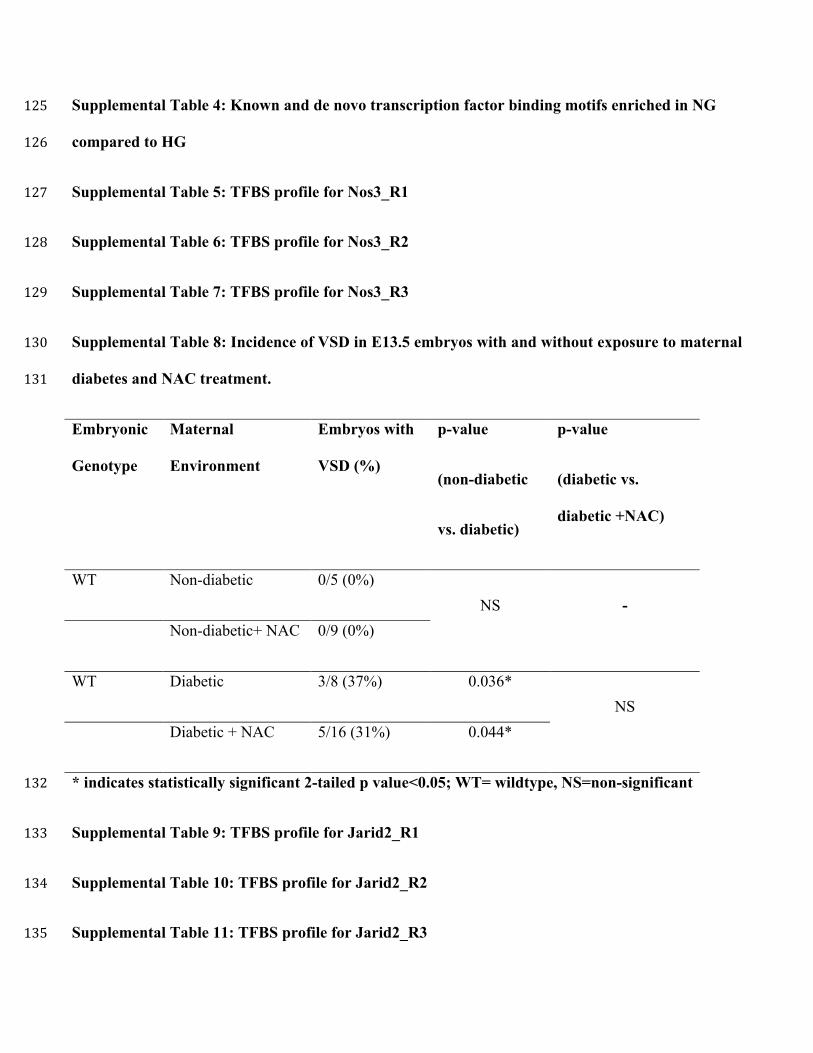
Supplemental Table 8: Incidence of VSD in E13.5 embryos with and without exposure to maternal 130
diabetes and NAC treatment. 131
Embryonic
Genotype
Maternal
Environment
Embryos with
VSD (%)
p-value
(non-diabetic
vs. diabetic)
p-value
(diabetic vs.
diabetic +NAC)
WT Non-diabetic 0/5 (0%) NS -
Non-diabetic+ NAC 0/9 (0%)
WT Diabetic 3/8 (37%) 0.036* NS
Diabetic + NAC 5/16 (31%) 0.044*
* indicates statistically significant 2-tailed p value<0.05; WT= wildtype, NS=non-significant 132
Supplemental Table 9: TFBS profile for Jarid2_R1 133
Supplemental Table 10: TFBS profile for Jarid2_R2 134
Supplemental Table 11: TFBS profile for Jarid2_R3 135
Supplemental Table 12: TFBS profile for Notch1_R1 136
Supplemental Table 13: TFBS profile for Notch1_R2 137
Supplemental Table 14: TFBS profile for Notch1_R3 138
Supplemental Table 15: TFBS profile for Notch1_R4 139
Supplemental Table 16: Differential peaks within 1.5kb upstream and downstream of TSS, P-140
value<0.05 and >1.5fold change between NG and HG 141
Supplemental Table 17: Gene Ontology enriched terms 142
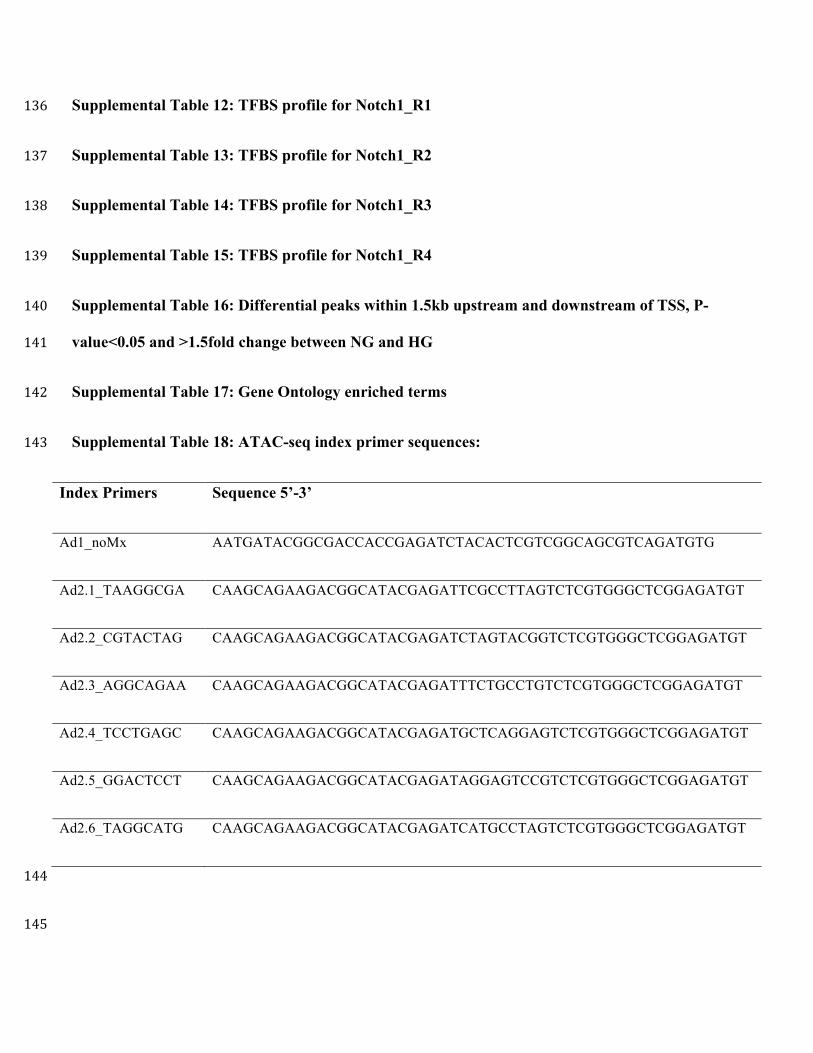
Supplemental Table 18: ATAC-seq index primer sequences: 143
Index Primers Sequence 5’-3’
Ad1_noMx AATGATACGGCGACCACCGAGATCTACACTCGTCGGCAGCGTCAGATGTG
Ad2.1_TAAGGCGA CAAGCAGAAGACGGCATACGAGATTCGCCTTAGTCTCGTGGGCTCGGAGATGT
Ad2.2_CGTACTAG CAAGCAGAAGACGGCATACGAGATCTAGTACGGTCTCGTGGGCTCGGAGATGT
Ad2.3_AGGCAGAA CAAGCAGAAGACGGCATACGAGATTTCTGCCTGTCTCGTGGGCTCGGAGATGT
Ad2.4_TCCTGAGC CAAGCAGAAGACGGCATACGAGATGCTCAGGAGTCTCGTGGGCTCGGAGATGT
Ad2.5_GGACTCCT CAAGCAGAAGACGGCATACGAGATAGGAGTCCGTCTCGTGGGCTCGGAGATGT
Ad2.6_TAGGCATG CAAGCAGAAGACGGCATACGAGATCATGCCTAGTCTCGTGGGCTCGGAGATGT
144
145
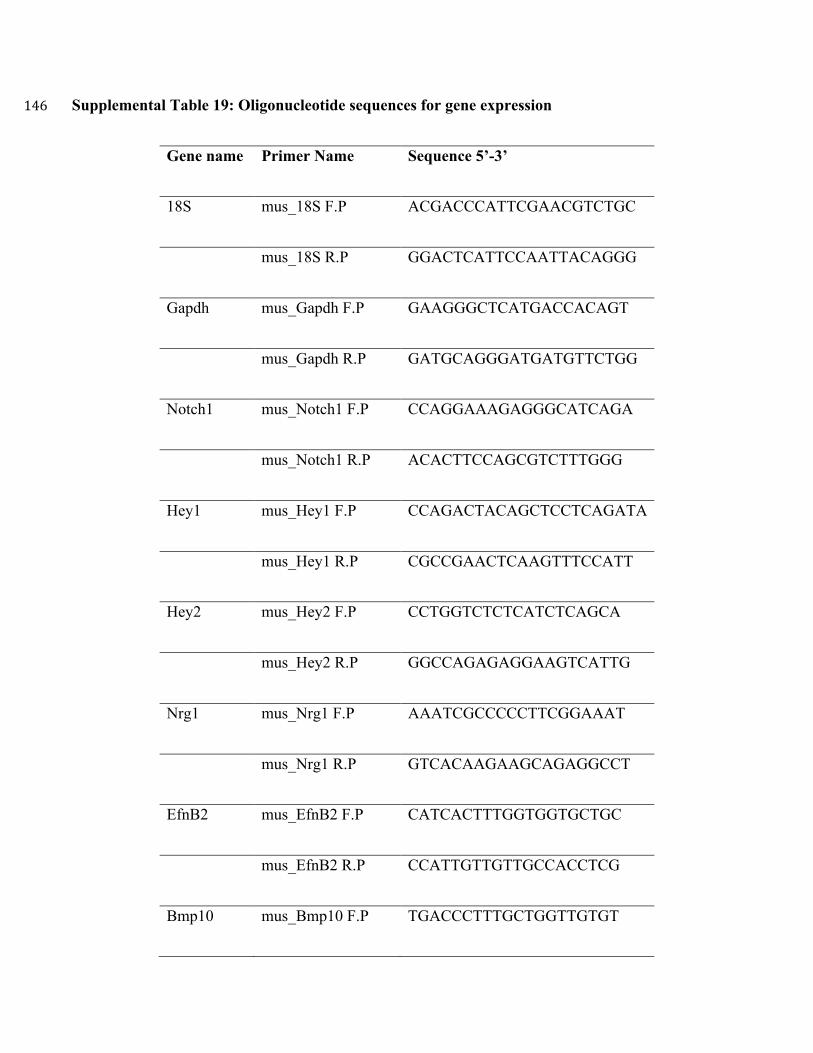
Supplemental Table 19: Oligonucleotide sequences for gene expression 146
Gene name Primer Name Sequence 5’-3’
18S mus_18S F.P ACGACCCATTCGAACGTCTGC
mus_18S R.P GGACTCATTCCAATTACAGGG
Gapdh mus_Gapdh F.P GAAGGGCTCATGACCACAGT
mus_Gapdh R.P GATGCAGGGATGATGTTCTGG
Notch1 mus_Notch1 F.P CCAGGAAAGAGGGCATCAGA
mus_Notch1 R.P ACACTTCCAGCGTCTTTGGG
Hey1 mus_Hey1 F.P CCAGACTACAGCTCCTCAGATA
mus_Hey1 R.P CGCCGAACTCAAGTTTCCATT
Hey2 mus_Hey2 F.P CCTGGTCTCTCATCTCAGCA
mus_Hey2 R.P GGCCAGAGAGGAAGTCATTG
Nrg1 mus_Nrg1 F.P AAATCGCCCCCTTCGGAAAT
mus_Nrg1 R.P GTCACAAGAAGCAGAGGCCT
EfnB2 mus_EfnB2 F.P CATCACTTTGGTGGTGCTGC
mus_EfnB2 R.P CCATTGTTGTTGCCACCTCG
Bmp10 mus_Bmp10 F.P TGACCCTTTGCTGGTTGTGT
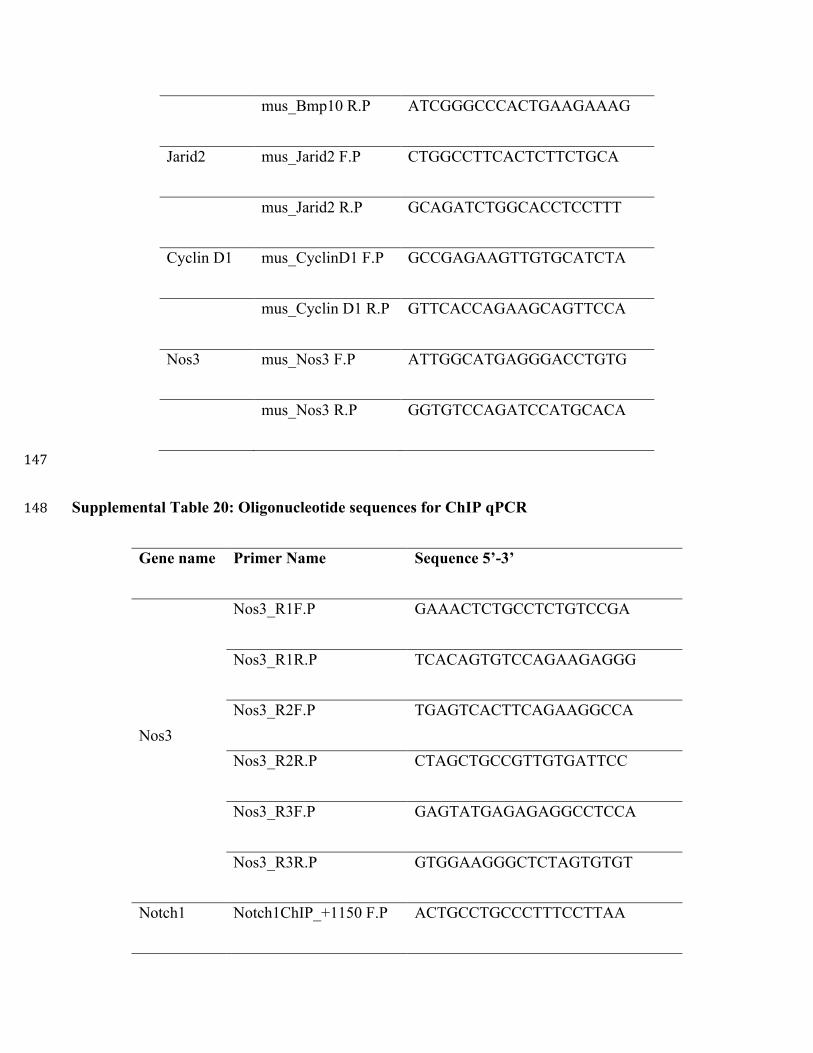
mus_Bmp10 R.P ATCGGGCCCACTGAAGAAAG
Jarid2 mus_Jarid2 F.P CTGGCCTTCACTCTTCTGCA
mus_Jarid2 R.P GCAGATCTGGCACCTCCTTT
Cyclin D1 mus_CyclinD1 F.P GCCGAGAAGTTGTGCATCTA
mus_Cyclin D1 R.P GTTCACCAGAAGCAGTTCCA
Nos3 mus_Nos3 F.P ATTGGCATGAGGGACCTGTG
mus_Nos3 R.P GGTGTCCAGATCCATGCACA
147
Supplemental Table 20: Oligonucleotide sequences for ChIP qPCR 148
Gene name Primer Name Sequence 5’-3’
Nos3
Nos3_R1F.P GAAACTCTGCCTCTGTCCGA
Nos3_R1R.P TCACAGTGTCCAGAAGAGGG
Nos3_R2F.P TGAGTCACTTCAGAAGGCCA
Nos3_R2R.P CTAGCTGCCGTTGTGATTCC
Nos3_R3F.P GAGTATGAGAGAGGCCTCCA
Nos3_R3R.P GTGGAAGGGCTCTAGTGTGT
Notch1 Notch1ChIP_+1150 F.P ACTGCCTGCCCTTTCCTTAA

Notch1ChIP_+1150 R.P CCCACGCCATCTTAAAGAGC
149