Embed Size (px)
Citation preview

1
The Impact of The Global Crisis on
Central and Eastern Europe by
Tonny LybekIMF’s Resident Representative in Bulgaria and Romania
at
Romanian Financial and Banking Analyst Association
BucharestDecember 8, 2009

2
Agenda
I: World Economic Outlook– Uneven signs of recovery but no time for
complacency
II: Regional Economic Outlook– From excessive credit growth to a credit crunch
III: Global Measures: Role of The IMF
IV: European Bank Coordination Initiative
– Romania’s Economic Program
V: Conclusion

3
I.1 The Global Crisis Deepest global recession since the
1930’s: In 2009, world growth is expected to decline
(1.1 percent) for the first time in 60 years! International trade declining
The phases: Sub-prime in the USA
-> Financial fragility increases (from local to global)
Sep. 15, 2008: Lehman’s Bankruptcy -> Global uncertainty and downturn
March 2009: Downturn looses speed -> Global measures, but uneven recovery

4
I.2 How Long Will It Last?
Financial shocks: Financial shocks typically lasts longer! Global integration larger than most realized!
No obvious locomotive: Unemployment is lagging! Non-performing loans (NPLs) are lagging!
Normalization of activity? Re-stocking!
Positive signs, but no time for complacency! Cautious exit of anti-crisis programs (G20 on Nov
6–7): http://www.imf.org/external/np/g20/110709.htm

5
I.3 World Economic Outlook
2007 2008Time of projection: April June Sep April June Sep
World output 5.2 3.0 -1.3 -1.4 -1.1 1.9 2.5 3.1
Advanced economies 2.7 0.6 -3.8 -3.8 -3.4 0.0 0.6 1.3 United States 2.1 0.4 -2.8 -2.6 -2.7 0.0 0.8 1.5 Euro area 2.7 0.7 -4.2 -4.8 -4.2 -0.4 -0.3 0.3 Germany 2.5 1.2 -5.6 -6.2 -5.3 -1.0 -0.6 0.3 France 2.3 0.3 -3.0 -3.0 -2.4 0.4 0.5 0.9 Italy 1.6 -1.0 -4.4 -5.1 -5.1 -0.4 -0.1 0.2 Spain 3.6 0.9 -3.0 -4.0 -3.8 -0.7 -0.8 -0.7 Japan 2.3 -0.7 -6.2 -6.0 -5.4 0.5 1.7 1.7 United Kingdom 2.6 0.7 -4.1 -3.8 -4.4 -0.4 0.1 0.9 European Union 3.1 1.0 -4.0 -4.6 -4.2 -0.3 -0.1 0.5
World trade volume 7.3 3.0 -11.0 -12.2 -11.9 0.6 1.0 2.5 Imports of advanced economies 4.7 0.5 -12.1 -13.5 -13.7 0.4 0.6 1.2 Imports of emerg. & dev. countries 13.8 9.4 -8.8 -9.6 -9.5 0.6 0.8 4.6 Exports of advanced economies 6.3 1.9 -13.5 -14.9 -13.6 0.5 1.3 2.0 Exports of emerg. & dev. countries 9.8 4.6 -6.4 -6.5 -7.2 1.2 1.4 3.6
Source: Table 1.1 in World Economic Outlook, April 2009; Table 1 in World Economic Outlook Update , July 2009,
IMF; and Table 1.1 in World Economic Outlook, October 2009 , IMF.
2009 2010
Real GDP and World Trade, Annual Change in Percent

6
II.1 Central and Eastern Europe
The Good Times 2003–07—Catching-up: Vulnerabilities were building-up!
Private sector imbalances growing rapidly!– Increasing current account deficits– Increasing exposures to Western banks
Public finances looked much better than they were! Convergence process not fully appreciated!
Crisis came late to the region: Initial denial made it difficult to take early
action! The five stages: Denial -> Resentment -> Bargaining -> Depression -> Acceptance!

7
II.2 Current Account Deficits Increased

8
II.3 Current Account Deficits Fueled by Capital Inflows
Cumulative net capital inflows, 2003-07(Percent of 2003 GDP)
-50
0
50
100
150
200
Czech Republic Poland Hungary Slovak Republic Lithuania Estonia Romania Latvia Bulgaria
Other FDI Portfolio Total

9
II.4 Increasing Exposure to Western Banks

10
II.5 The Credit Boom Was Fueled by Western European
BanksChange in exposure Western Banks and Change in Credit to GDP ratio, 2003-08(Percent of GDP)
Slovakia
Romania
Poland
Lithuania
Latvia
Hungary
Estonia
Czech Republic
Bulgaria
0
10
20
30
40
50
60
0 10 20 30 40 50 60
Change in exposure Western Banks
Ch
ange
in C
red
it t
o G
DP
rat
io

11
II.6 Exposures During Previous Crises: Lessons To Be Learned?
Figure 12. Exposure of Western Banks to Selected Regions(Billions of US dollars, adjusted for exchange rate changes.
Source: BIS, locational statistics.
Eight New Member States
0
50
100
150
200
250
300
350
400
450
500
Dec.2002 Dec.2004 Dec.2006 Dec.2008
Emerging Europe
0
100
200
300
400
500
600
700
800
900
1000
Dec.2002 Dec.2004 Dec.2006 Dec.2008
Asia
0
50
100
150
200
250
300
350
400
450
500
Mar.1992 Sep.1993 Mar.1995 Sep.1996 Mar.1998 Sep.1999
Latin America
0
50
100
150
200
250
Dec.1977 Sep.1979 Jun.1981 Mar.1983 Dec.1984

12
II.7 Much of The Lending in FX

13
II.8 Impact of The Global Crisis
Shock I: Lower external demand Shock II: Slowdown in capital inflows:
Foreign direct investment (FDI) Funding of—mainly foreign-owned—banks! Direct borrowing by non-financial companies
Slow-down in domestic demand: Delaying investments, particularly construction Uncertainty about employment Slower wage growth and lower remittances Wealth effects (asset prices) => From excessive credit growth to a credit crunch!
Some already ripe for a home-grown crisis: Imbalances differed among CEE countries Cushions differed among countries => IMF has tried to stress differences in the region!

14
II.9 Vulnerabilities and Severity of Recessions
Have Varied

15
II.10 Regional Economic Outlook
2007 2008Time of projection April June Sep Nov April June Sep Nov
Baltics Estonia 7.2 -3.6 -10.0 … -14.0 … -1.0 … -2.6 … Latvia 10.0 -4.6 -12.0 … -18.0 … -2.0 … -4.0 … Lithuania 8.9 3.0 -10.0 … -18.5 … -3.0 … -4.0 …
Central Europe Hungary 1.2 0.6 -3.3 … -6.7 … -0.4 … -0.9 … Poland 6.8 4.9 -0.7 … 1.0 … 1.3 … 2.2 …
Southeastern Europe Bulgaria 6.2 6.0 -3.5 -7.0 -6.5 … -1.0 -2.5 -2.5 … Croatia 5.5 2.4 -3.5 … -5.2 … 0.3 … 0.4 … Romania 6.2 7.1 -4.1 -8.0 -8.5 -7.8 0.0 1.7 0.5 0.5
Source: Table 2.4 in World Economic Outlook, April 2009; Table 1 in World Economic Outlook Update ,
July 2009, IMF; and Table A4 in World Economic Outlook, October 2009, IMF.
2009 2010
Real GDP, Annual Change in Percent
16
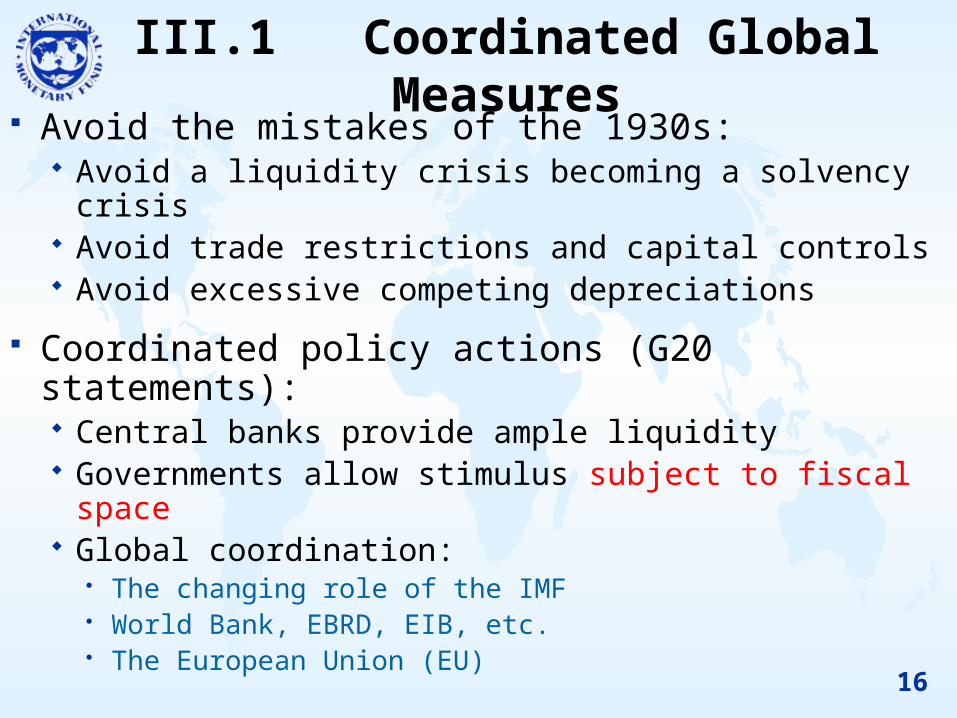
III.1 Coordinated Global Measures
Avoid the mistakes of the 1930s: Avoid a liquidity crisis becoming a solvency crisis Avoid trade restrictions and capital controls Avoid excessive competing depreciations
Coordinated policy actions (G20 statements): Central banks provide ample liquidity Governments allow stimulus subject to fiscal
space Global coordination:
The changing role of the IMF World Bank, EBRD, EIB, etc. The European Union (EU)
17
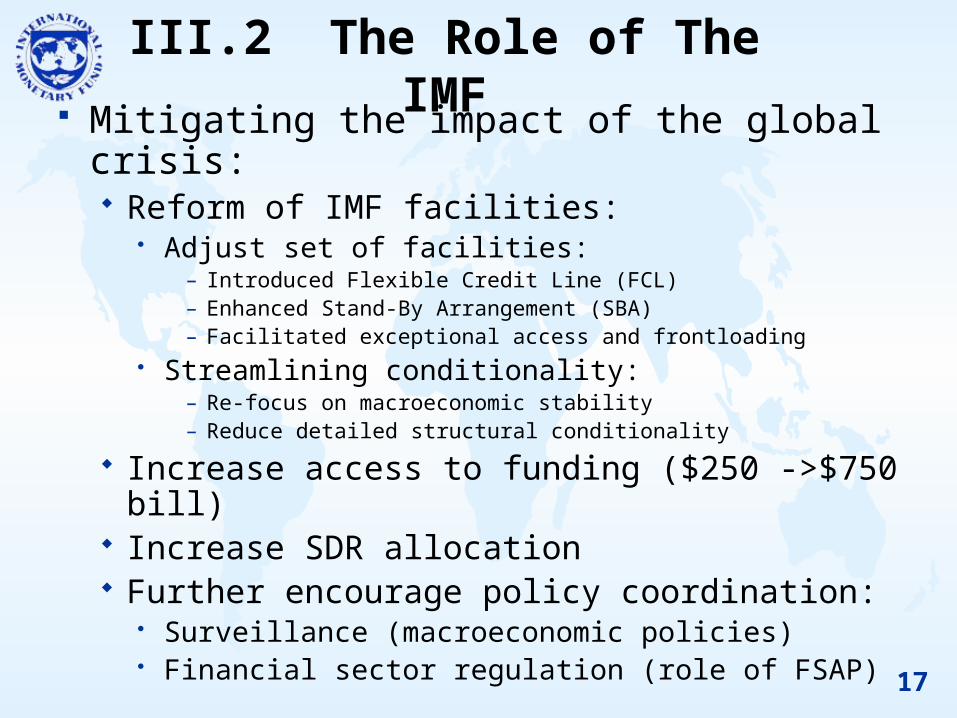
III.2 The Role of The IMF Mitigating the impact of the global crisis:
Reform of IMF facilities: Adjust set of facilities:
– Introduced Flexible Credit Line (FCL) – Enhanced Stand-By Arrangement (SBA)– Facilitated exceptional access and frontloading
Streamlining conditionality:– Re-focus on macroeconomic stability– Reduce detailed structural conditionality
Increase access to funding ($250 ->$750 bill)
Increase SDR allocation Further encourage policy coordination:
Surveillance (macroeconomic policies) Financial sector regulation (role of FSAP)

18
III.3 IMF Assistance Suddenly Needed
Access levels and growth declines in Fund arrangements
MNG
THA
IDN
KOR
ARG
PHL
IDN
UKR
BRA MEX
RUS
TUR
IDN
ARG
BRA
TUR
URY
BRA
COL
ARG ARG
TUR
IRQ
LVA
ISL ROM
HUN MEX
POL
COL
UKR
BIH
SRB
PAK
BLR
ARM
LKA
GEO
SLV CRI
GTM
SYC
-30
-25
-20
-15
-10
-5
0
5
10
1997 1999 2001 2003 2005 2007 2009
Perc
en
t ch
an
ge i
n r
eal
GD
P 1
/
Sources: WEO and staff calculations.1/ Maximum cumulative decline in three years from program inception; projected changes for current programs.

19
III.4 IMF Lending Activities
Member Date of Expiration Total Amount Undrawn OutstandingArrangement
Belarus SBA 12-Jan-09 11-Apr-10 2.3 0.9 1.4Bosnia and Herzegovina SBA 8-Jul-09 30-Jun-10 1.0 0.8 0.2Hungary SBA 6-Nov-08 5-Apr-10 10.5 2.9 7.6Iceland SBA 19-Nov-08 31-May-11 1.4 0.7 0.7Latvia SBA 23-Dec-08 22-Mar-11 1.5 0.8 0.7Romania SBA 4-May-09 3-May-11 11.4 5.4 6.1Serbia SBA 16-Jan-09 15-Apr-11 2.6 1.9 0.7Ukraine SBA 5-Nov-08 4-Nov-10 11.0 4.0 7.0Poland FCL 6-May-09 5-May-10 13.7 13.7 0.0Total Europe 55.5 31.1 24.4Total 108.8 78.6 30.9 o/w Europe in percent 51.0 39.6 79.0
Source: International Monetary Fund.Note: 1 SDR = 1.08804 € on October 31, 2009.
In billions of SDR
IMF Lending Arrangements, October 31, 2009

20
IV.1 Romania: A Case in Point
Global crisis made it increasingly difficult to secure external financing: Large short-term private debt
Large fiscal imbalances even in good years, make financing challenging during a recession
=> Emerging credibility problem!
=> In need of a “safety belt”!!
21
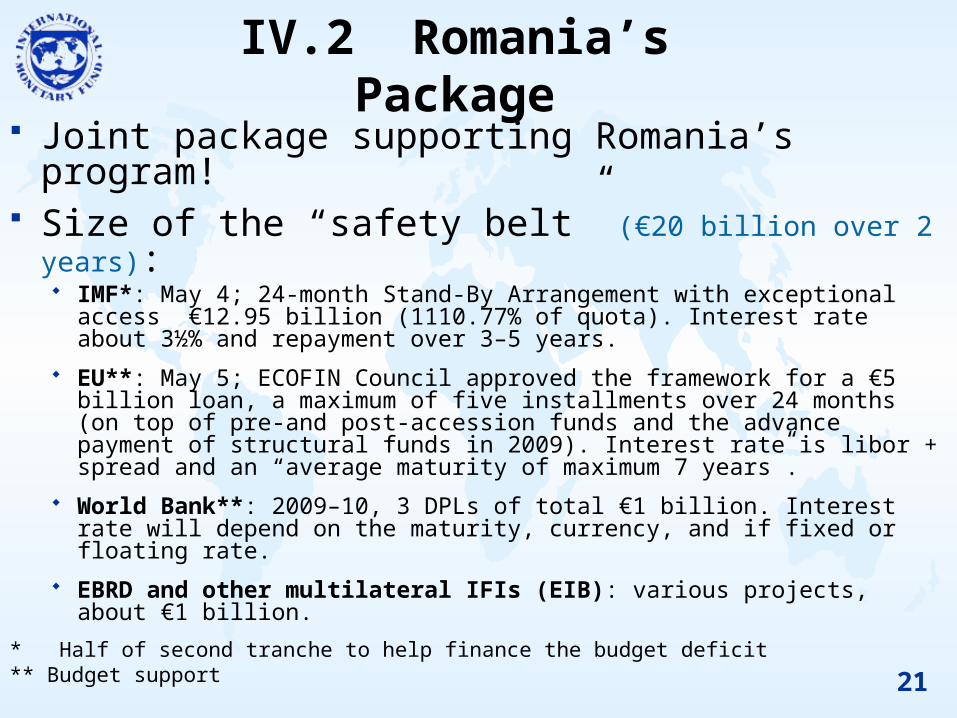
IV.2 Romania’s Package
Joint package supporting Romania’s program!
Size of the “safety belt” (€20 billion over 2 years): IMF*: May 4; 24-month Stand-By Arrangement with exceptional
access €12.95 billion (1110.77% of quota). Interest rate about 3½% and repayment over 3–5 years.
EU**: May 5; ECOFIN Council approved the framework for a €5 billion loan, a maximum of five installments over 24 months (on top of pre-and post-accession funds and the advance payment of structural funds in 2009). Interest rate is libor + spread and an “average maturity of maximum 7 years”.
World Bank**: 2009–10, 3 DPLs of total €1 billion. Interest rate will depend on the maturity, currency, and if fixed or floating rate.
EBRD and other multilateral IFIs (EIB): various projects, about €1 billion.
* Half of second tranche to help finance the budget deficit** Budget support

22
IV.3 Romania’s Economic Program
A: “European Bank Coordination Initiative”: foreign- owned banks remain committed to Romania!
B: Government addresses fiscal imbalances: Fiscal consolidation: ensure sustainability! Improve fiscal governance: ensure predictability!
C: NBR continues to maintain sound banking system: Ensure prompt and early action
D: Price stability remains primary objective of monetary policy (inflation-targeting)

23
IV.4 European Bank Coordination Initiative
For instance, part of programs in: Romania, Hungary, Serbia, Bosnia & Herzegovina
Romania: Nine largest foreign-owned banks committed to: (i) maintain exposure to Romania, and (ii) increase capital (CAR 8% -> 10) in line with
stress tests during the program period:– Vienna meeting on March 26, 2009– Brussels meeting on May 19, 2009– Bucharest meeting on August 6, 2009– Brussels meeting on November 18, 2009

24
IV.5 Market ReactionsEURNM CDS Spreads 5-year(In basis points)
0
200
400
600
800
1000
1200
1400
Jun-08 Sep-08 Dec-08 Mar-09 Jun-09 Sep-09 Dec-09
Bulgaria
Czech Republic
Estonia
Latvia
Lithuania
Hungary
Poland
Romania
Slovak Republic
Source: Bloomberg
September 15, 2008Lehmann Brothers files for bankruptcy
March 25, 2009 Agreement at staff level on Romania's Economic Program
April 2, 2009 G20 Statement
in London
October 1, 2009 Romania's coalition government splits

25
V Conclusion Global financial crisis is deep!
Financial integration is significant! Positive signs, but not time for complacency!
The IMF is mitigating the crisis by: Intensified coordination:
member countries, other IFIs, EU, and banks Providing financing to smooth the
adjustment:– Should not be an excuse to delay structural reforms!
Functioning as an external anchor provided authorities are committed!

26
Thank you very much for your attention