Embed Size (px)
Citation preview

1
The Swiss Chemical andPharmaceutical Industry
Zurich, April 2012
2
Source: ACC, CEFIC
Chemicals in Consumer Products
-10.020.030.040.050.060.070.080.090.0
100.0
Lacq
uers
& d
yes
Pharm
aceu
ticals
Cleanin
g ag
ents
Cosm
etics
Tyres
Photo
prin
ts
Carpe
ts
Stock
ings
CD's an
d ta
pes
Curta
ining
Shoes
Batte
ries
Uphols
tery
Clothin
g
Mat
tress
es
Boats
Food
Fuels
3
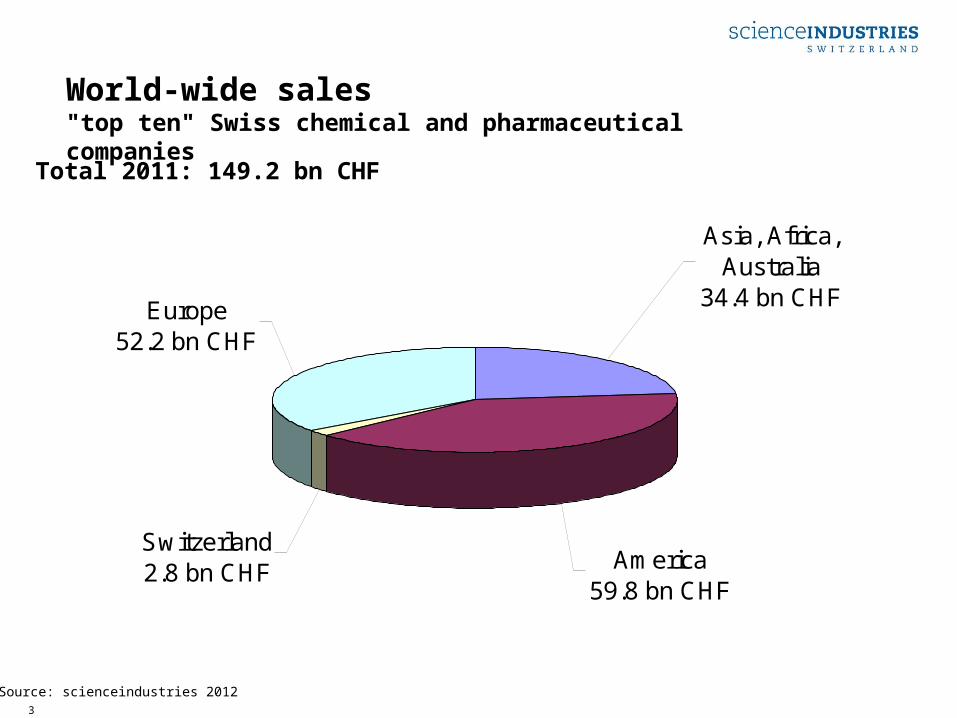
America59.8 bn CHF
Asia, Africa, Australia
34.4 bn CHF
Switzerland2.8 bn CHF
Europe52.2 bn CHF
World-wide sales"top ten" Swiss chemical and pharmaceutical companies
Total 2011: 149.2 bn CHF
Source: scienceindustries 2012
4
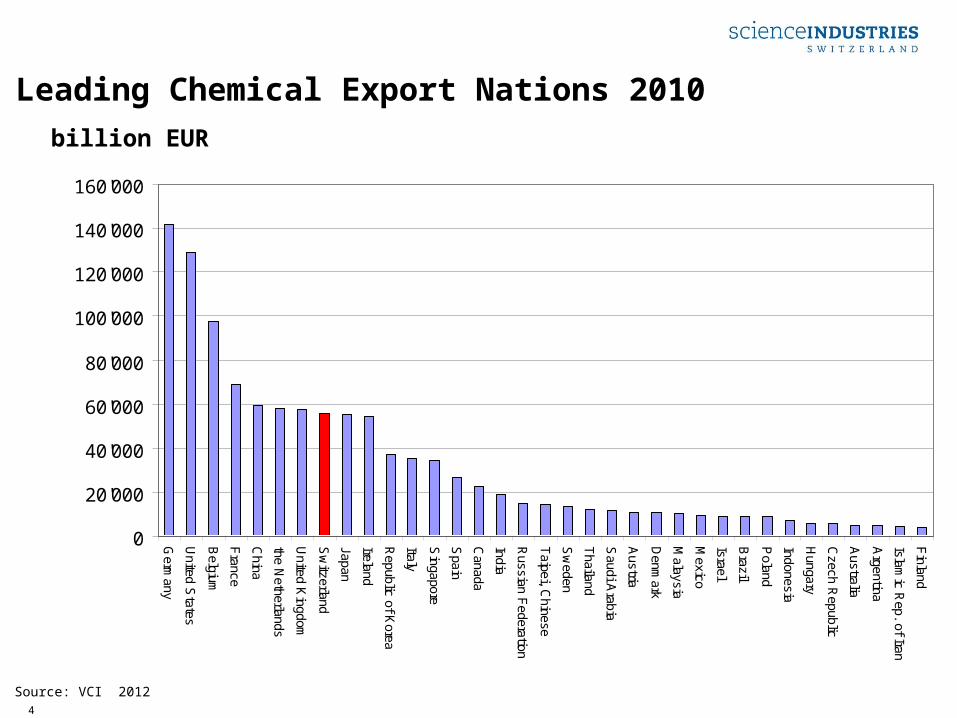
Leading Chemical Export Nations 2010
Source: VCI 2012
billion EUR
0
20'000
40'000
60'000
80'000
100'000
120'000
140'000
160'000
Germ
any
United S
tates
Belgium
France
China
the Netherlands
United K
ingdom
Sw
itzerland
Japan
Ireland
Republic of K
orea
Italy
Singapore
Spain
Canada
India
Russian F
ederation
Taipei, C
hinese
Sw
eden
Thailand
Saudi A
rabia
Austria
Denm
ark
Malaysia
Mexico
Israel
Brazil
Poland
Indonesia
Hungary
Czech R
epublic
Australia
Argentina
Islamic R
ep. of Iran
Finland
5
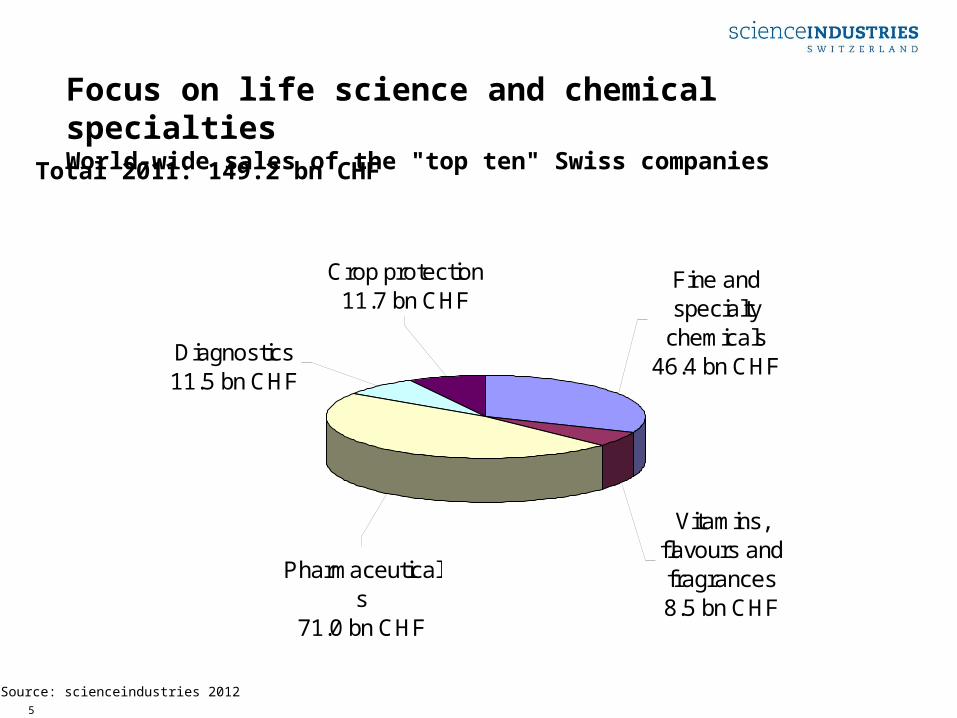
Crop protection11.7 bn CHF
Diagnostics11.5 bn CHF
Pharmaceuticals
71.0 bn CHF
Vitamins, flavours and fragrances8.5 bn CHF
Fine and specialty
chemicals46.4 bn CHF
Focus on life science and chemical specialties World-wide sales of the "top ten" Swiss companies
Total 2011: 149.2 bn CHF
Source: scienceindustries 2012
6
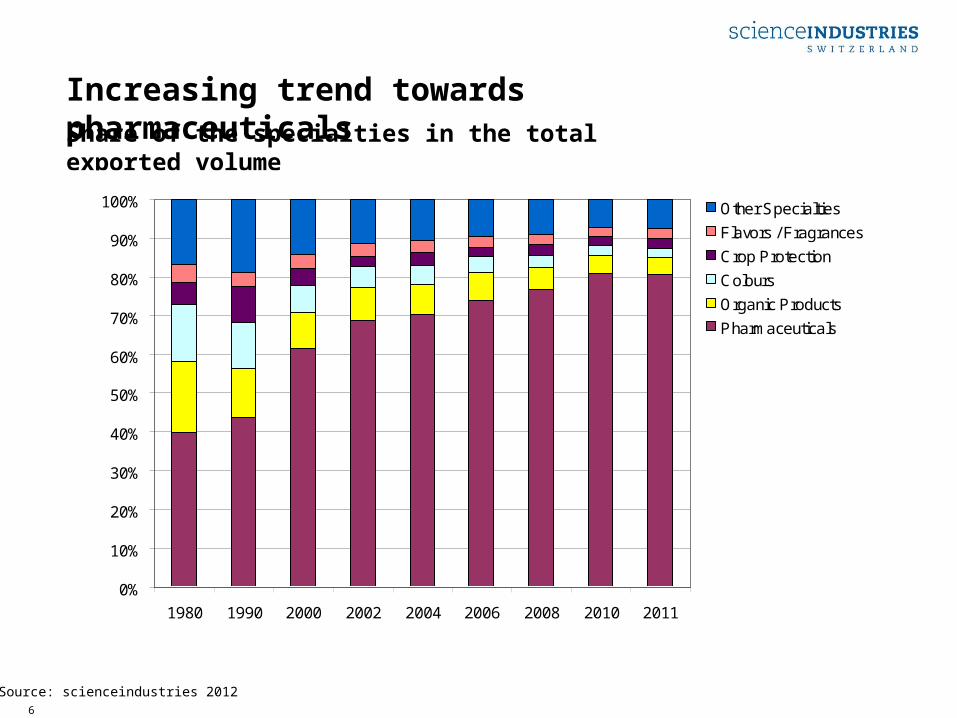
Increasing trend towards pharmaceuticalsShare of the specialties in the total exported volume
Source: scienceindustries 2012
0%
10%
20%
30%
40%
50%
60%
70%
80%
90%
100%
1980 1990 2000 2002 2004 2006 2008 2010 2011
Other Specialties
Flavors / Fragrances
Crop Protection
Colours
Organic Products
Pharmaceuticals
7
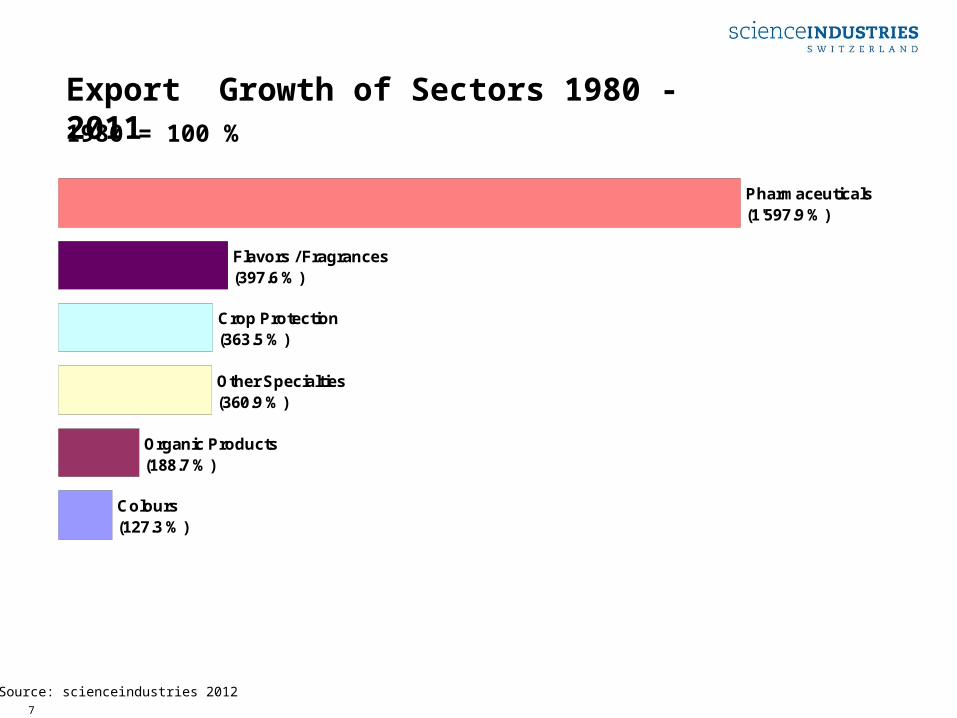
Export Growth of Sectors 1980 - 20111980 = 100 %
Source: scienceindustries 2012
Colours(127.3 %)
Organic Products(188.7 %)
Other Specialties(360.9 %)
Crop Protection (363.5 %)
Flavors / Fragrances(397.6 %)
Pharmaceuticals (1'597.9 %)
Pharmaceuticals / Vitamines and Crop Protection Products:until 1988 excluding intermediates
Organic Products:until 1988 including intermediates
8
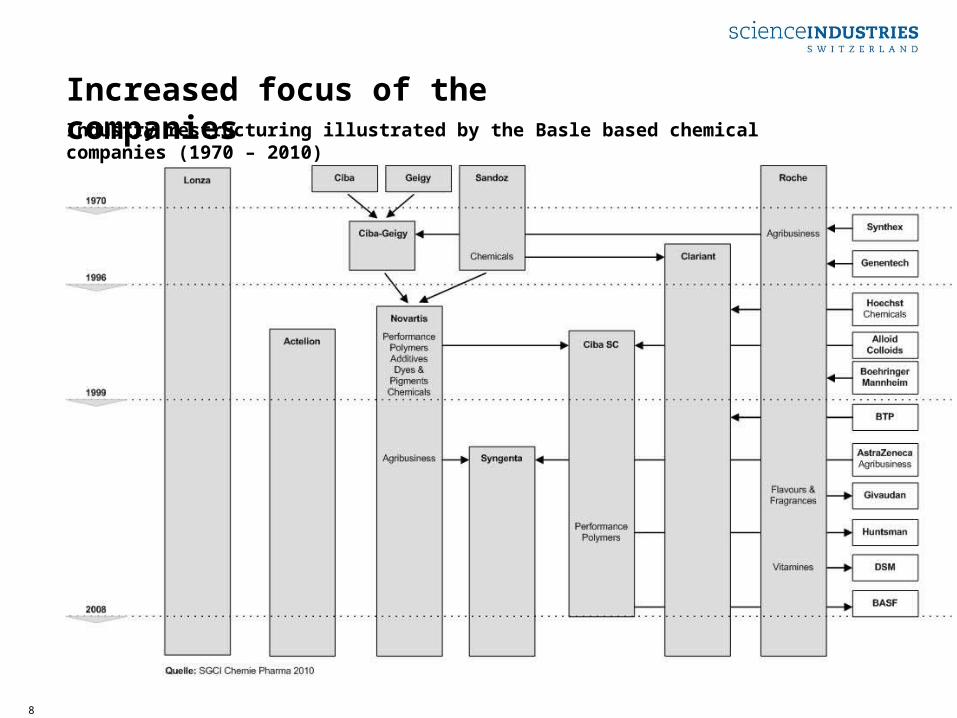
Increased focus of the companiesIndustry restructuring illustrated by the Basle based chemical companies (1970 – 2010)
9
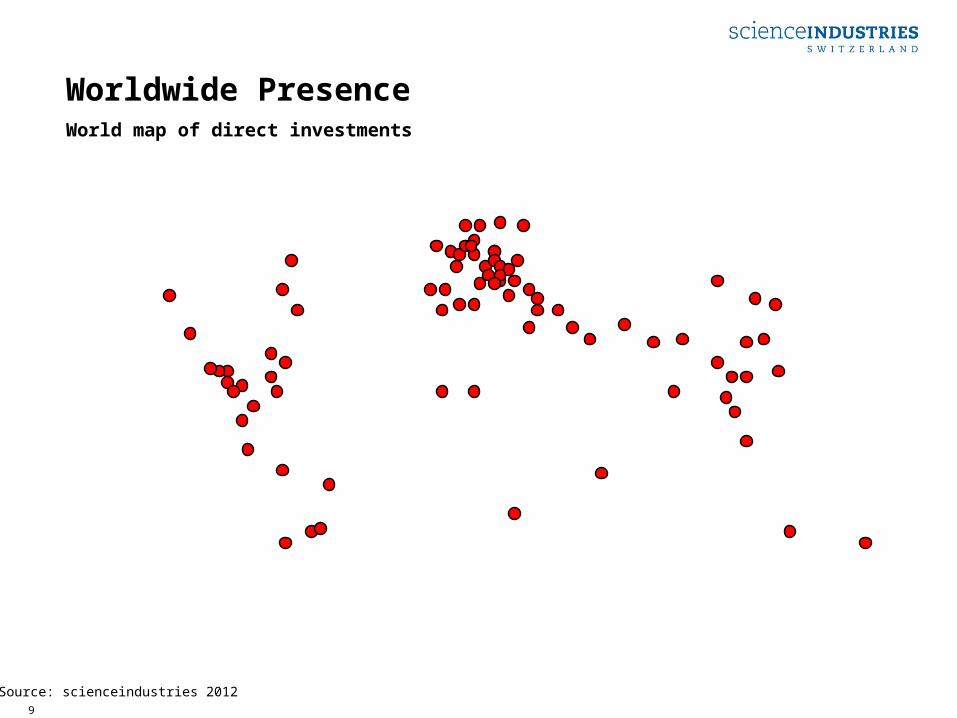
Worldwide PresenceWorld map of direct investments
Source: scienceindustries 2012
10
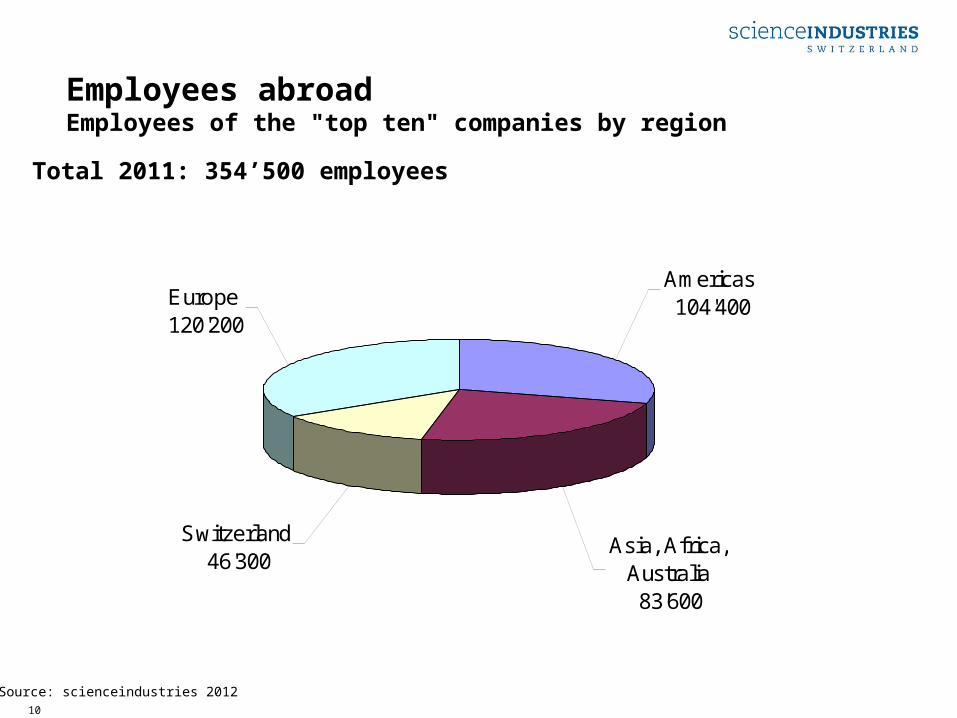
Employees abroadEmployees of the "top ten" companies by region
Total 2011: 354’500 employees
Source: scienceindustries 2012
Americas 104'400
Asia, Africa, Australia 83'600
Switzerland 46'300
Europe 120'200
11
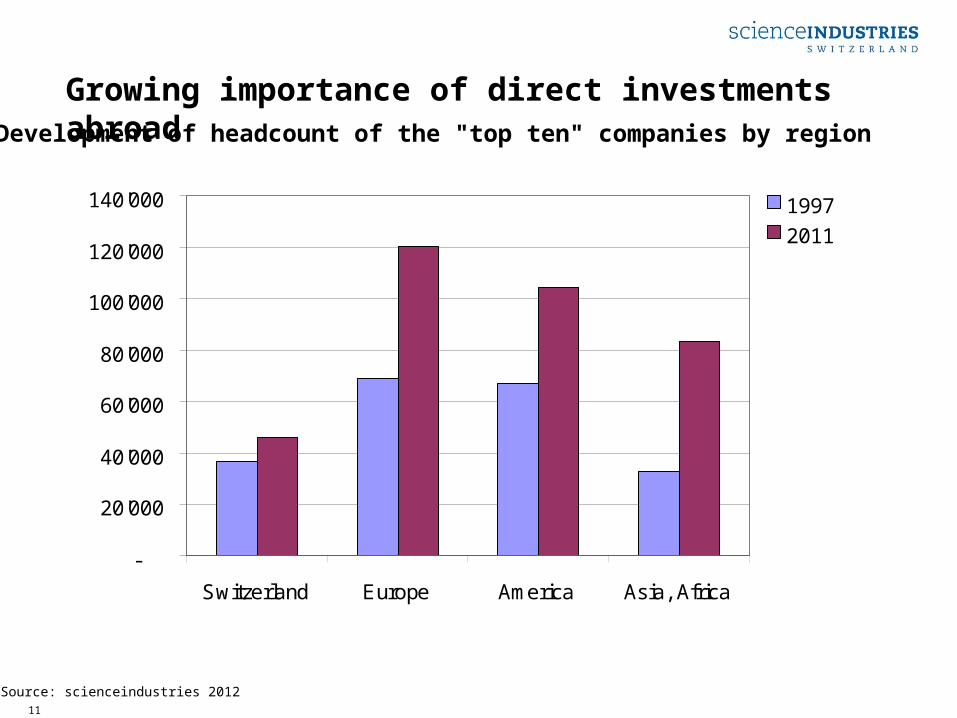
Growing importance of direct investments abroad Development of headcount of the "top ten" companies by region
Source: scienceindustries 2012
-
20'000
40'000
60'000
80'000
100'000
120'000
140'000
Switzerland Europe America Asia, Africa
1997
2011

12
High research intensityInternational comparison of research intensity (R&D / turnover) in 2004
Source: CEFIC 2006
-
1.00
2.00
3.00
4.00
5.00
6.00
7.00
8.00
Switzerland Japan USA EU 15

13
-
2.00
4.00
6.00
8.00
10.00
12.00
14.00
16.00
2003 2004 2005 2006 2007 2008 2009 2010 2011
abroad Switzerland
Internationally integrated researchR & D expenditures
Total 2011: 20.7 bn CHF
Source: scienceindustries 2012
14
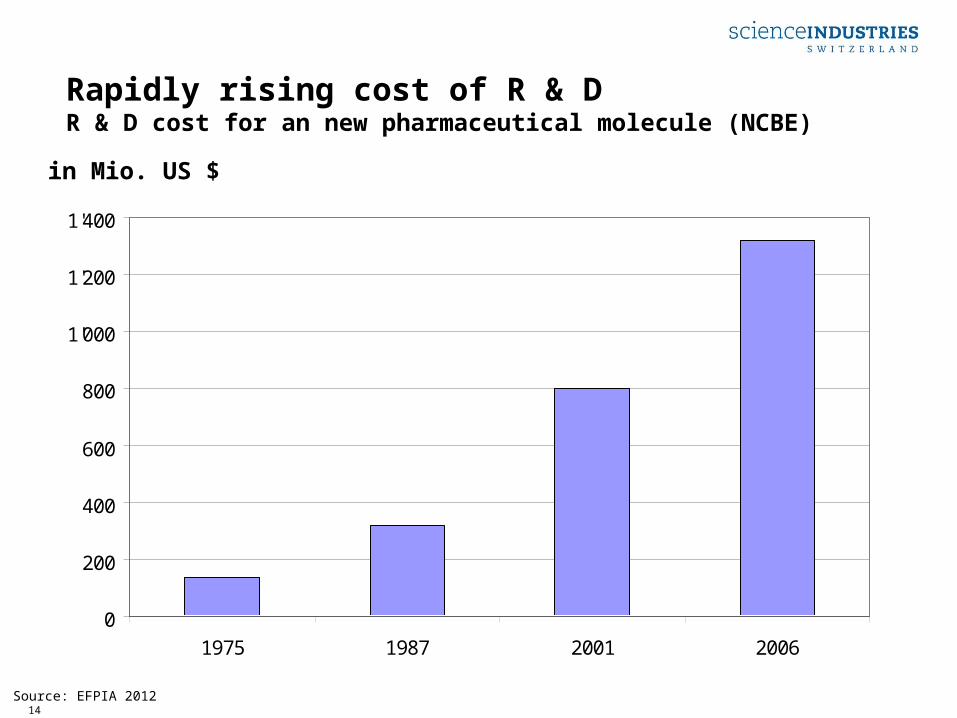
Rapidly rising cost of R & DR & D cost for an new pharmaceutical molecule (NCBE)
in Mio. US $
Source: EFPIA 2012
0
200
400
600
800
1'000
1'200
1'400
1975 1987 2001 2006
15
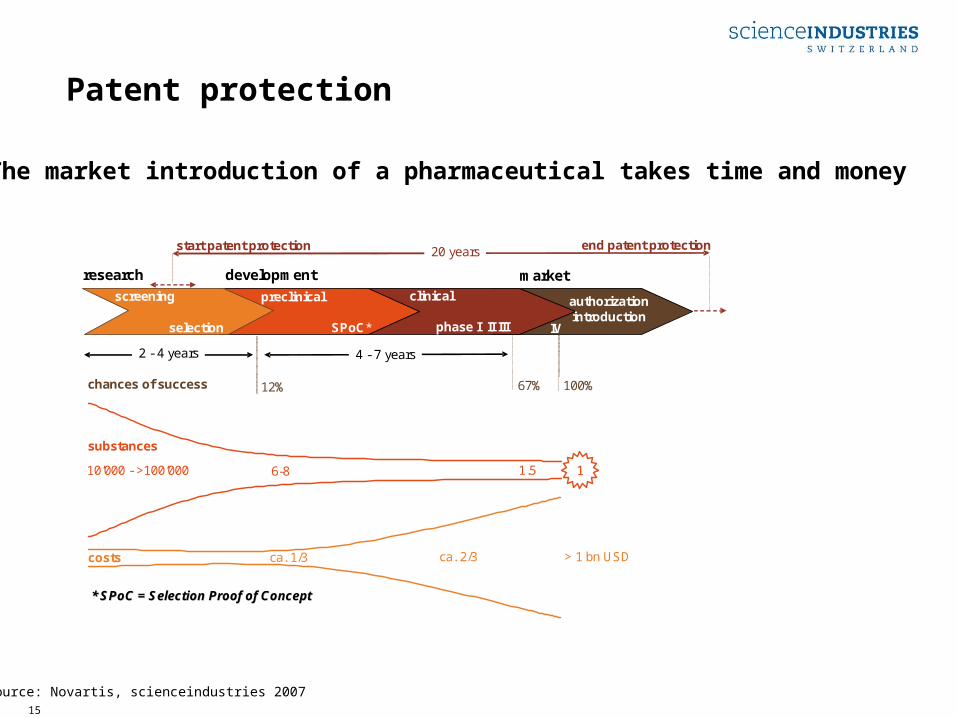
100%%12%%
costs
chances of success
SPoC*selection
preclinical clinical
phase I II III IV
research development marketscreening
10’000 - >100’000
substances
67%%
11
ca. 1/3 ca. 2/3
authorizationintroduction
6-8 1.5
2 - 4 years 4 - 7 years
* * SPoCSPoC = Selection Proof of Concept= Selection Proof of Concept
end patent protectionstart patent protection
> 1 bn USD
20 years
Patent protection
The market introduction of a pharmaceutical takes time and money
Source: Novartis, scienceindustries 2007
16
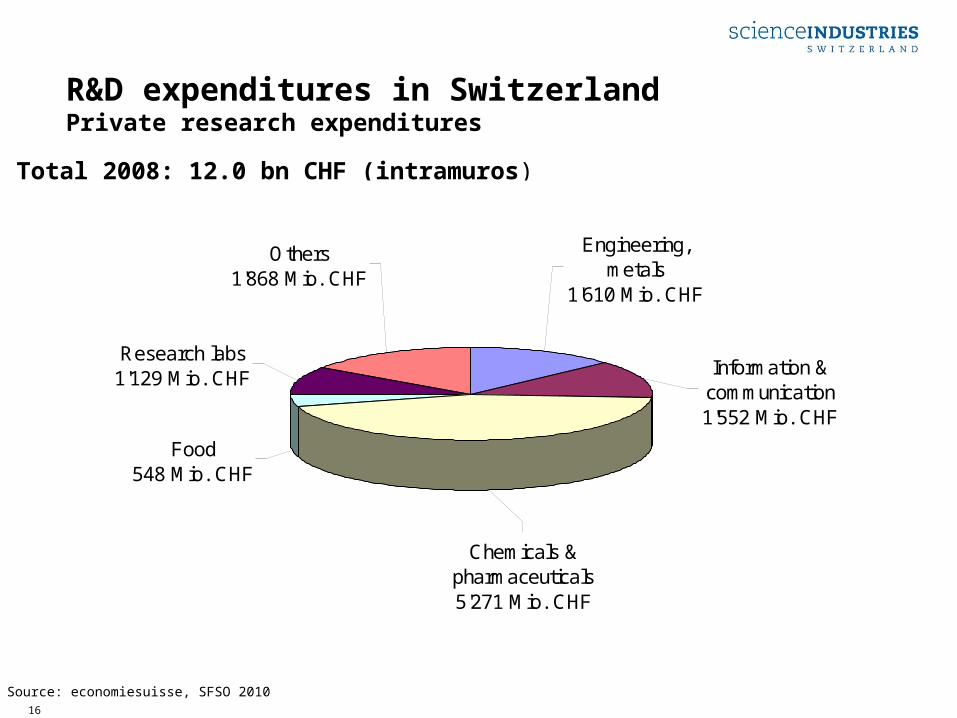
R&D expenditures in SwitzerlandPrivate research expenditures
Total 2008: 12.0 bn CHF (intramuros)
Source: economiesuisse, SFSO 2010
Engineering, metals
1'610 Mio. CHF
Information & communication1'552 Mio. CHF
Chemicals & pharmaceuticals 5'271 Mio. CHF
Food 548 Mio. CHF
Research labs 1'129 Mio. CHF
Others 1'868 Mio. CHF
17
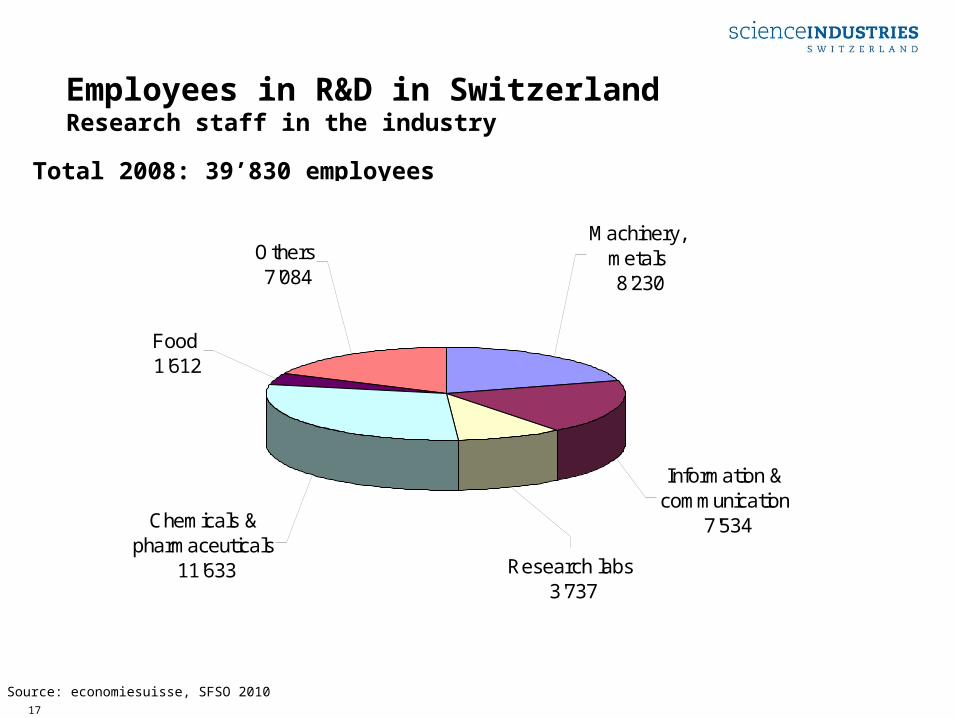
Employees in R&D in SwitzerlandResearch staff in the industry
Total 2008: 39’830 employees
Source: economiesuisse, SFSO 2010
Information & communication
7'534
Research labs 3'737
Chemicals & pharmaceuticals
11'633
Food 1'612
Others 7'084
Machinery, metals 8'230
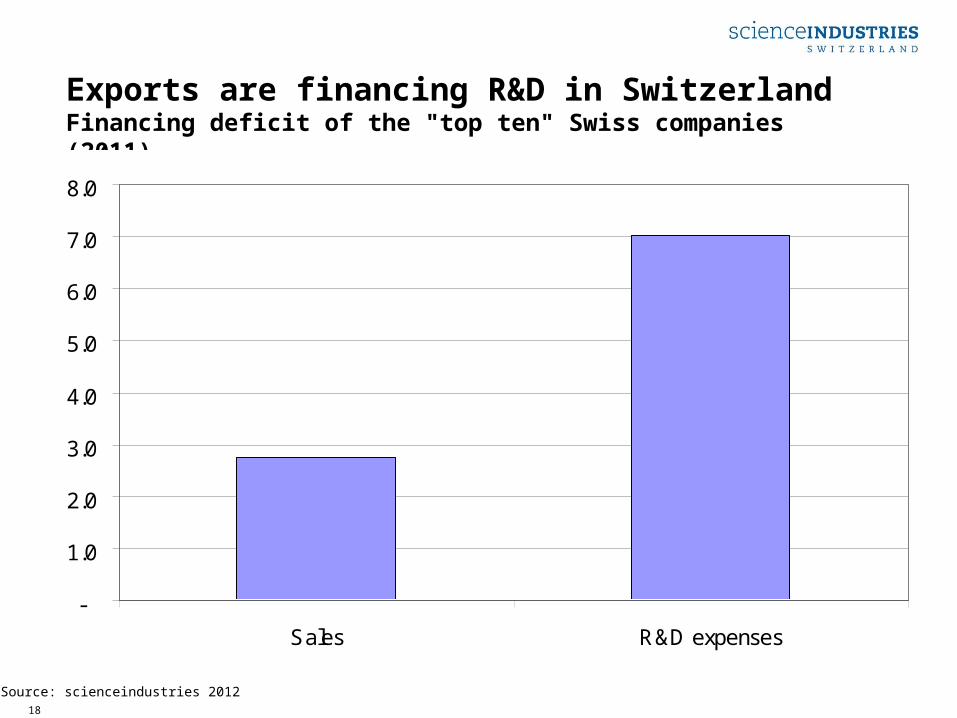
18
Exports are financing R&D in SwitzerlandFinancing deficit of the "top ten" Swiss companies (2011)
in billion CHF
Source: scienceindustries 2012
-
1.0
2.0
3.0
4.0
5.0
6.0
7.0
8.0
Sales R&D expenses
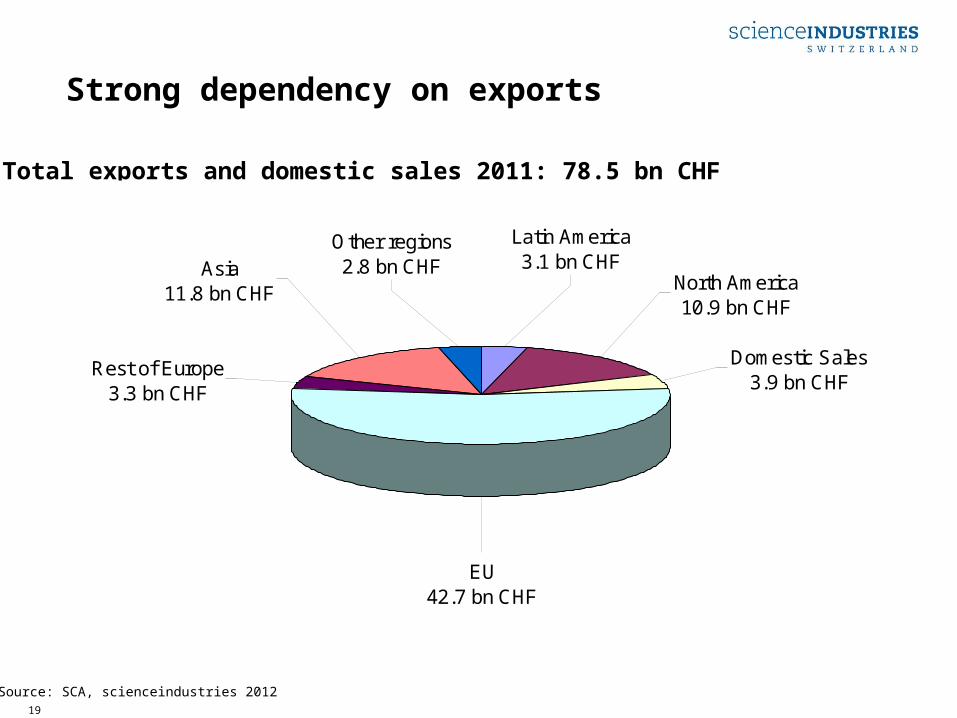
19
Strong dependency on exports
Total exports and domestic sales 2011: 78.5 bn CHF
Source: SCA, scienceindustries 2012
Other regions2.8 bn CHF
Latin America3.1 bn CHF
Domestic Sales3.9 bn CHF
North America10.9 bn CHF
Asia11.8 bn CHF
Rest of Europe3.3 bn CHF
EU42.7 bn CHF

20
Others34.9 bn CHF
Food, beverages,
tobacco7.4 bn CHFMetals &
machinery68.6 bn CHF
Textiles & clothing
3.2 bn CHF Watches19.3 bn CHF
Chemicals & pharmaceutic
als74.6 bn CHF
Important export industryTotal Swiss exports
Total 2011: 208.1 bn CHF
Source: SCA 2012
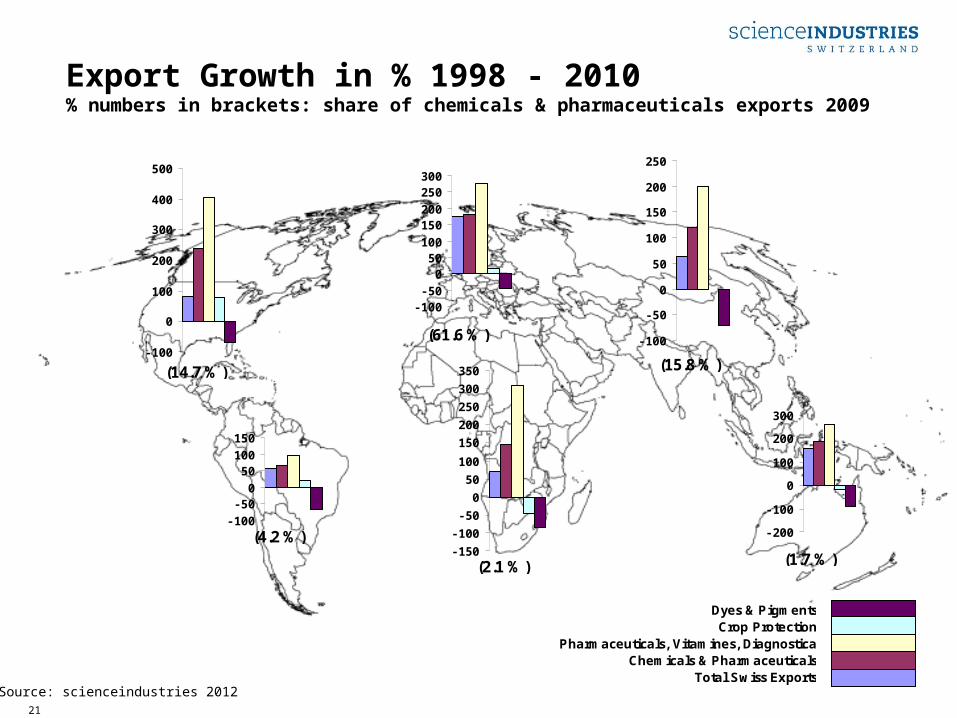
21
Export Growth in % 1998 - 2010% numbers in brackets: share of chemicals & pharmaceuticals exports 2009
Dyes & PigmentsCrop Protection
Pharmaceuticals, Vitamines, DiagnosticaChemicals & Pharmaceuticals
Total Swiss ExportsSource: scienceindustries 2012
- 100
- 50
0
50
100
150
200
250
- 100
0
100
200
300
400
500
- 100
- 500
50100
150
- 150
- 100
- 50
0
50
100
150
200
250
300
350
- 100- 50
050
100
150200
250300
- 200
- 100
0
100
200
300
(61.6 %)
(15.8 %)
(2.1 %)
(4.2 %)
(14.7 %)
(1.7 %)

22
Growing importance of exportsShare of chemicals and pharmaceuticals in total Swiss exports
%
Source: scienceindustries 2012
-
5.0
10.0
15.0
20.0
25.0
30.0
35.0
40.0
1980 1990 2000 2002 2004 2006 2008 2010 2011
23
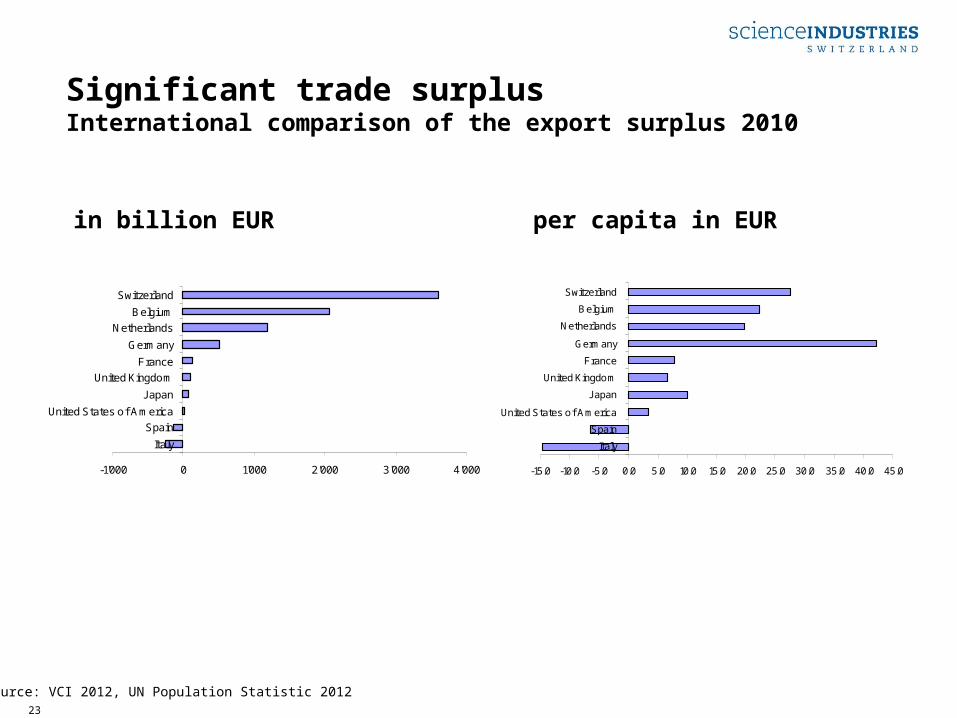
Significant trade surplusInternational comparison of the export surplus 2010
in billion EUR
Source: VCI 2012, UN Population Statistic 2012
per capita in EUR
-1'000 0 1'000 2'000 3'000 4'000
Italy
SpainUnited States of America
J apan
United KingdomFrance
Germany
NetherlandsBelgium
Switzerland
-15.0 -10.0 -5.0 0.0 5.0 10.0 15.0 20.0 25.0 30.0 35.0 40.0 45.0
Italy
Spain
United States of America
J apan
United Kingdom
France
Germany
Netherlands
Belgium
Switzerland
24
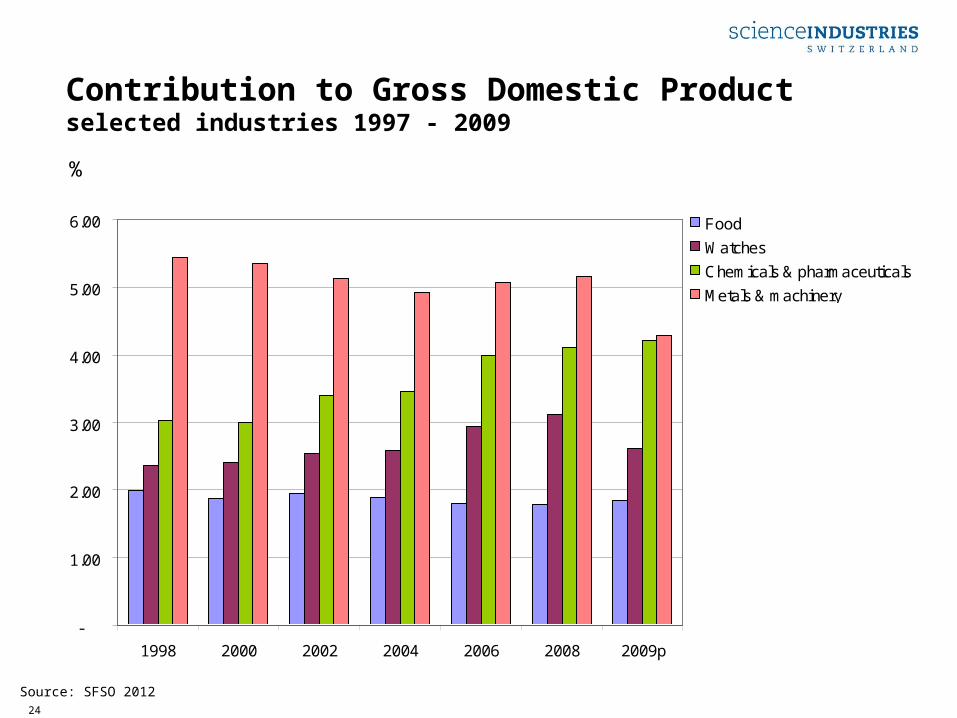
Contribution to Gross Domestic Productselected industries 1997 - 2009
%
Source: SFSO 2012
-
1.00
2.00
3.00
4.00
5.00
6.00
1998 2000 2002 2004 2006 2008 2009p
Food
Watches
Chemicals & pharmaceuticals
Metals & machinery
25
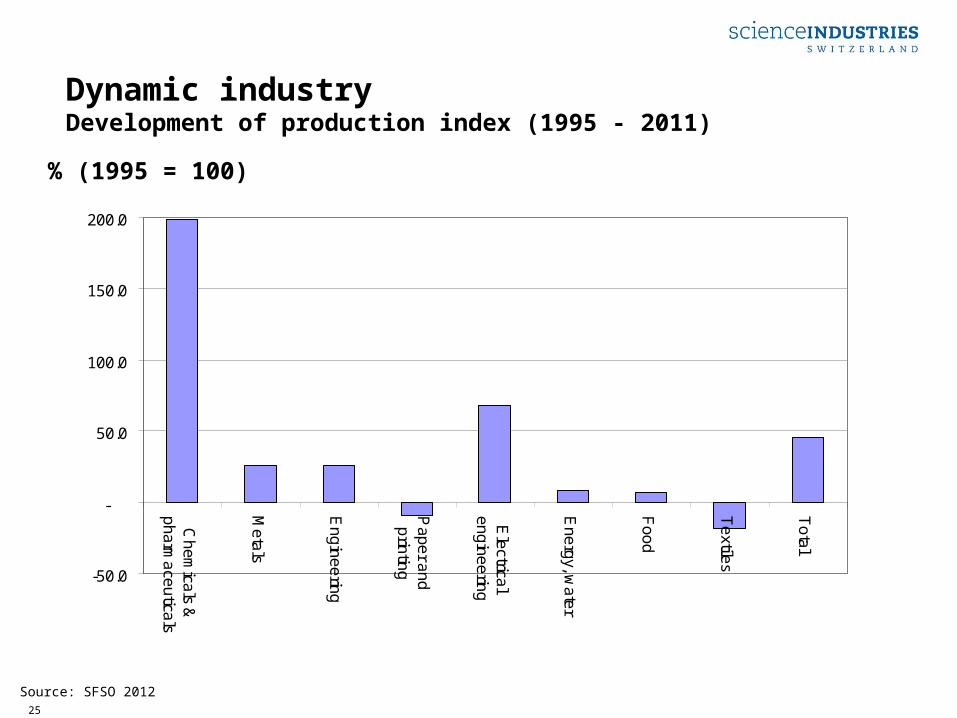
Dynamic industryDevelopment of production index (1995 - 2011)
% (1995 = 100)
Source: SFSO 2012
-50.0
-
50.0
100.0
150.0
200.0
Ch
em
icals &
ph
arm
ace
utica
ls
Me
tals
En
gin
ee
ring
Pa
pe
r an
dp
rintin
g
Ele
ctrical
en
gin
ee
ring
En
erg
y, wa
ter
Fo
od
Te
xtiles
To
tal

26
Major employer in industryEmployees by industry sector in %
Total of industry: 629’500 (2011)
Source: SFSO 2012
Others19.0 %
Engineering13.0 %
Electrical equipment
5.8 %
Data Processing Equipment &
Watches16.4 %
Metals15.2 %
Pharmaceuticals5.8 %
Mineral Oil & Chemicals
4.5 %
Food & Tabaco9.5 %
Wood, Paper & Printing10.9 %
27
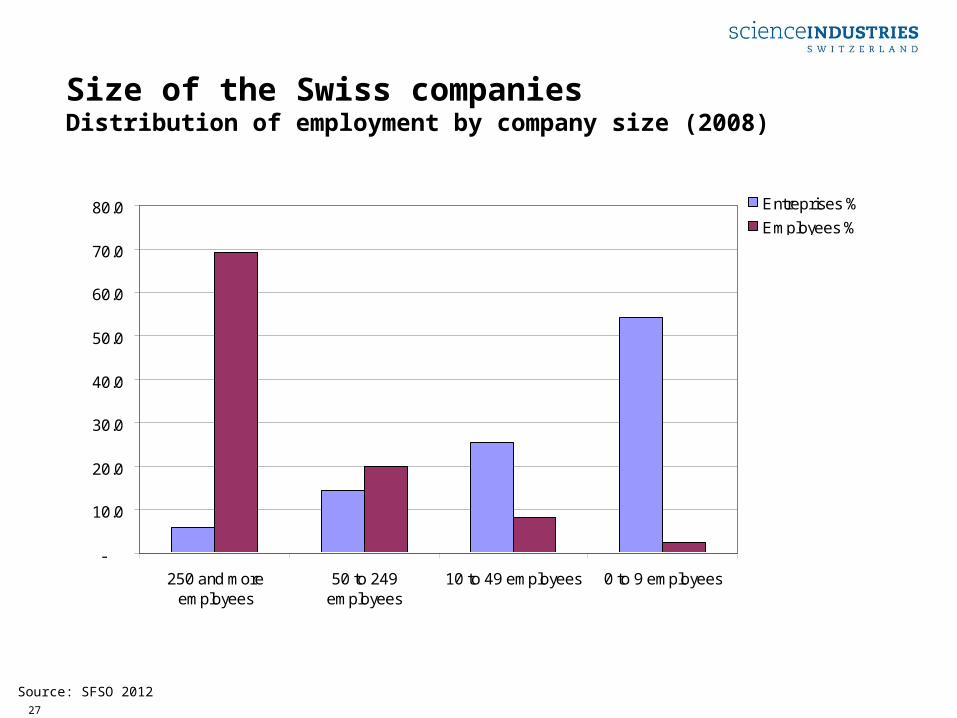
Size of the Swiss companiesDistribution of employment by company size (2008)
Source: SFSO 2012
-
10.0
20.0
30.0
40.0
50.0
60.0
70.0
80.0
250 and moreemployees
50 to 249employees
10 to 49 employees 0 to 9 employees
Entreprises %
Employees %

28
Size of the Swiss companiesDistribution of employment by company size (2008)
Source: SFSO 2012
0 to 9 employees (452 enterprises)
1'774
10 to 49 employees (212
enterprises)5'810
50 to 249 employees (120
enterprises)14'145
more than 249 employees (50
enterprises)49'045
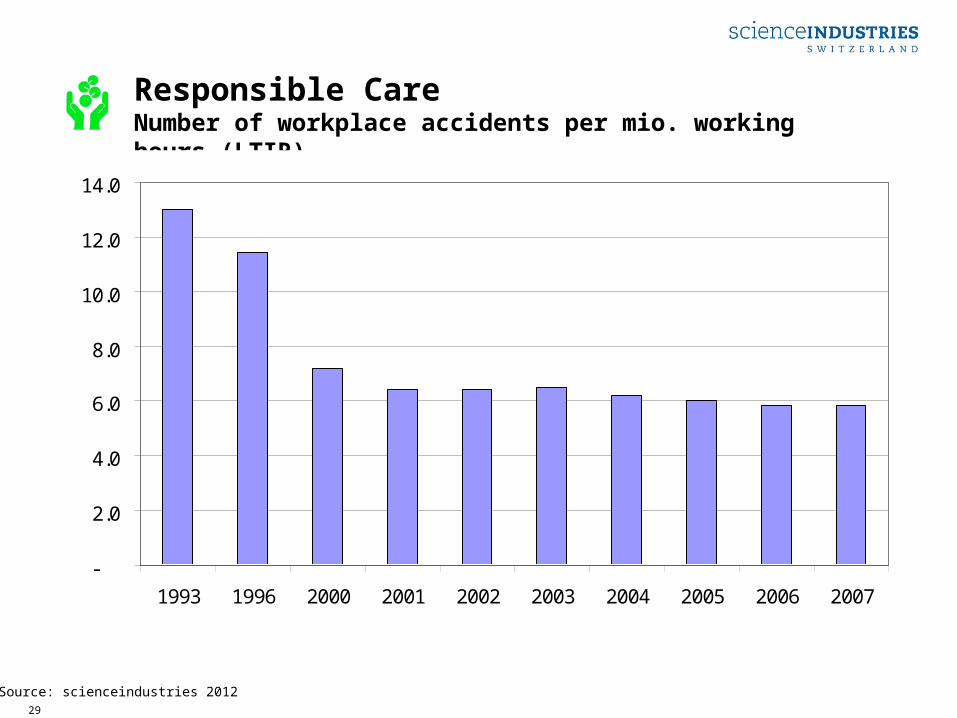
29
Responsible CareNumber of workplace accidents per mio. working hours (LTIR)
Source: scienceindustries 2012
-
2.0
4.0
6.0
8.0
10.0
12.0
14.0
1993 1996 2000 2001 2002 2003 2004 2005 2006 2007

30
Responsible CareEnergy consumption in terajoules per production unit
Source: scienceindustries 2012
0.0
20.0
40.0
60.0
80.0
100.0
120.0
2002 2003 2004 2005 2006 2007
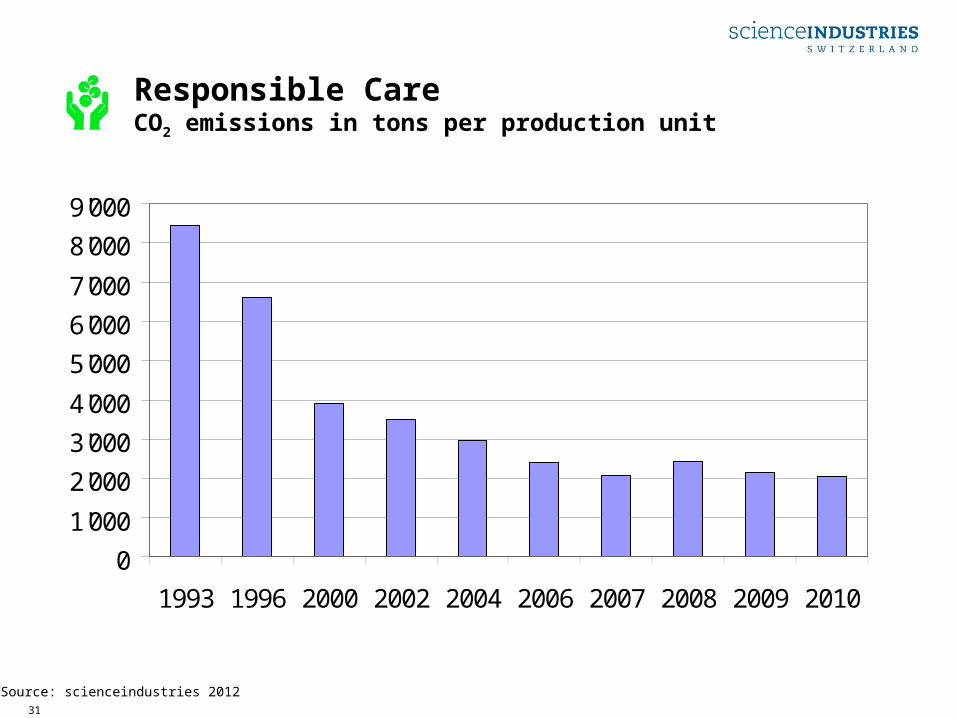
31
Responsible CareCO2 emissions in tons per production unit
Source: scienceindustries 2012
0
1'000
2'000
3'000
4'000
5'000
6'000
7'000
8'000
9'000
1993 1996 2000 2002 2004 2006 2007 2008 2009 2010

32
Responsible CareVOC emissions
Source: scienceindustries 2012
0
500
1'000
1'500
2'000
2'500
3'000
3'500
4'000
1993 1996 2000 2002 2004 2006 2007 2008 2009 2010
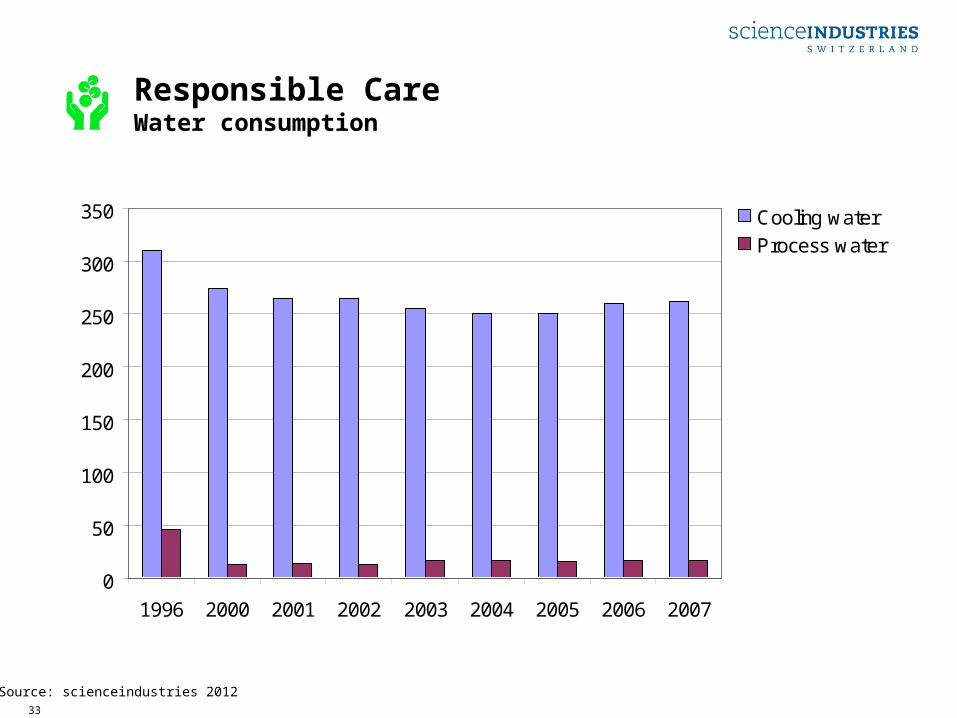
33
Responsible CareWater consumption
Source: scienceindustries 2012
0
50
100
150
200
250
300
350
1996 2000 2001 2002 2003 2004 2005 2006 2007
Cooling water
Process water