Embed Size (px)
Citation preview
Jackson Hydroelectric Project
Addendum to Study 22: Sultan River Physical Process Studies Page 1 October 2008
1.0 2008 FOLLOW-UP STUDIES
This report details studies that that were previously incomplete because of their dependence on seasonal discharge, or because they were not completed in 2007. This report constitutes the final component of Study 22: Sultan River Physical Process Studies.
1.1 Tracer Rocks The position of tracer rocks that were deployed at four sites in autumn 2007 were measured in late summer 2008 to determine if any of the tracers had moved downstream by high stream flows over the winter.
1.1.1 Methods The position of the tracer rocks were measured by spanning a measuring tape across the channel between two rebar pins that were driven into the banks in 2007 when the tracers were initially deployed. The measuring tape was set up in the same orientation and with the graduations aligned in the same way as they were in 2007. The position of the tracers with respect to the tape was then read directly and the upstream or downstream position was measured with a stadia rod. We estimate that the measurement error in the tracer rock position is approximately + or – 15 cm (6 in). Tracer rocks are considered to have been transported by the flow when they have moved more than 1 m (3 ft).
1.1.2 Results • At the Upstream site, 1 of 12 tracer rocks deployed had translated downstream. • At the Diversion Dam sites, none of the 41 tracer rocks deployed had translated
downstream. • At the Chaplain Creek site, 4 of the 40 tracer rocks deployed had translated
downstream, and 8 of the 40 tracer rocks deployed were missing. There was evidence of heavy spawning at this site that is the most likely reason for the moved and missing tracer rocks.
• At the Kien’s Bar site, 6 of the 28 tracer rocks deployed had translated downstream.
Results of the tracer rock Survey are presented in Table 1 through 4.

Jackson Hydroelectric Project
Page 2 Addendum to Study 22: Sultan River Physical Process Studies October 1, 2008
Table 1. Results of tracer rock transport study for the Upper Site.
1Negative transport distance indicates downstream movement. Table 2. Results of tracer rock transport study for the Diversion Dam Site.
2007 2008
Tape Position (ft) Distance From
Tape (ft) Tape Position (ft) Distance From
Tape (ft) Transport
Distance1 (ft) 69.60 -0.33 - -0.33 0.00 71.40 -0.66 - -0.52 0.13 72.30 -0.66 - -0.46 0.20 73.30 0.33 - 0.33 0.00 74.40 0.49 - 0.39 -0.10 76.40 -2.13 - -2.62 -0.49 78.00 0.00 - 0.00 0.00 79.30 1.31 - 0.98 -0.33 80.50 -1.31 - -1.48 -0.16 82.50 0.82 - 0.85 0.03 84.00 0.66 - 1.12 0.46 85.30 0.98 - 2.13 1.15 86.90 0.00 - 0.82 0.82 88.10 0.82 - 1.48 0.66 89.30 -0.33 - 0.00 0.33
2007 2008
Tape Position (ft) Distance From
Tape (ft) Tape Position (ft) Distance From
Tape (ft) Transport
Distance1 (ft) 65.4 -0.82 - -0.66 0.16 66.1 0.66 - 0.49 -0.16 67.5 0.49 - 0.33 -0.16 70.4 2.95 - 0.00 -2.95 71.9 0.00 - 2.30 2.30 72.6 2.62 - 0.49 -2.13 73.5 1.64 - 3.61 1.97 74.8 0.49 - 1.15 0.66 76.4 3.61 - 0.66 -2.95 78.2 3.45 84.40 -6.89 -10.34 78.7 0.66 - 0.49 -0.16 81.5 0.49 - 0.33 -0.16

Jackson Hydroelectric Project
Addendum to Study 22: Sultan River Physical Process Studies Page 3 October 2008
91.10 0.98 - 1.71 0.72 92.20 0.49 - 0.98 0.49 94.00 0.00 - 0.33 0.33 95.10 0.00 - 0.33 0.33 96.30 0.49 - 0.66 0.16 97.70 0.98 - 0.72 -0.26 99.90 1.15 - 0.49 -0.66 99.00 0.98 - 0.82 -0.16
101.90 0.66 - 0.82 0.16 102.20 0.00 - 0.00 0.00 103.10 -1.15 - -1.48 -0.33 104.90 -0.72 - -1.12 -0.39 105.80 -0.33 - -0.33 0.00 106.50 -0.43 - -0.82 -0.39 107.40 0.00 - 0.00 0.00 108.30 0.00 - 0.00 0.00 109.20 -0.59 - 0.33 0.92 110.10 0.00 - -0.98 -0.98 111.40 0.69 - 0.00 -0.69 112.60 0.00 - -0.89 -0.89 113.60 0.00 - -0.66 -0.66 114.50 0.72 - 0.00 -0.72 115.30 0.49 - -0.49 -0.98 115.80 0.49 - 0.00 -0.49 117.00 0.66 - 0.00 -0.66 117.90 0.92 - 0.33 -0.59
1Negative transport distance indicates downstream movement. Table 3. Results of tracer rock transport study for the Chaplain Creek Site.
2007 2008
Tape Position (ft) Distance From
Tape (ft) Tape Position (ft) Distance From
Tape (ft) Transport
Distance1 (ft) 177.0 3.28 - 3.61 0.33 175.2 3.28 - 3.61 0.33 172.8 3.28 - 2.95 -0.33 170.4 1.64 - 1.64 0.00 167.4 0.66 - 1.80 1.15 165.9 0.66 - 1.97 1.31

Jackson Hydroelectric Project
Page 4 Addendum to Study 22: Sultan River Physical Process Studies October 1, 2008
164.0 3.28 - 4.27 0.98 162.4 0.00 - 1.97 1.97 160.0 1.64 - 4.59 2.95 157.8 -0.98 - -0.66 0.33 155.3 -1.64 - 0.00 1.64 152.8 -1.64 - -0.33 1.31 149.0 -1.64 - gone NA 146.8 -3.28 - -1.64 1.64 142.3 -0.66 143.00 -14.76 -14.11 140.7 -0.66 - gone NA 135.8 -6.56 - gone NA 133.5 -0.33 134.50 -16.41 -16.08 131.8 -0.33 - gone NA 130.0 -1.31 - gone NA 128.0 0.00 - gone NA 126.0 0.00 - gone NA 124.4 -0.33 - -1.31 -0.98 122.0 -0.98 - -1.31 -0.33 120.5 -0.98 - -1.31 -0.33 117.7 -2.30 120.30 -3.94 -1.64 117.6 -3.28 112.50 -9.19 -5.91 113.7 -1.97 111.80 -10.66 -8.69 111.0 -1.64 110.20 -4.27 -2.62 109.2 -1.31 110.00 -4.20 -2.89 107.9 -1.31 107.90 -2.95 -1.64 104.5 -0.98 - gone NA 102.7 0.00 - 1.64 1.64 99.2 -1.97 - -0.66 1.31 96.0 -1.97 - -0.98 0.98 92.2 -3.28 - -2.30 0.98 90.6 -1.31 - -0.66 0.66 88.0 -0.98 - -0.66 0.33 88.5 -1.64 - -0.98 0.66 82.5 -0.98 - -0.49 0.49
1Negative transport distance indicates downstream movement. Table 3. Results of tracer rock transport study for the Kien’s Bar Site.
2007 2008

Jackson Hydroelectric Project
Addendum to Study 22: Sultan River Physical Process Studies Page 5 October 2008
Tape Position (ft) Distance From
Tape (ft) Tape Position (ft) Distance From
Tape (ft) Transport
Distance1 (ft) 63.0 0.00 - -3.61 -3.61 67.0 0.00 - -2.95 -2.95 69.8 0.00 - -3.28 -3.28 75.7 0.33 - -0.66 -0.98 79.1 -0.33 - -4.59 -4.27 82.0 -0.49 - -2.95 -2.46 86.5 -1.97 - -4.92 -2.95 89.5 -1.97 - -3.61 -1.64 92.5 -3.28 - -4.92 -1.64 94.7 0.00 - -0.82 -0.82 97.6 0.00 - -2.30 -2.30
100.9 0.98 - -7.55 -8.53 104.0 0.66 - -0.98 -1.64 107.8 1.64 - 0.66 -0.98 109.5 1.64 - 0.33 -1.31 111.5 0.98 - 0.00 -0.98 113.5 0.66 - -0.66 -1.31 115.8 0.00 - -1.64 -1.64 118.3 0.00 - -2.62 -2.62 121.3 -0.66 - -3.97 -3.31 123.7 0.00 - -3.28 -3.28 127.6 0.00 - -1.64 -1.64 129.8 4.27 - 3.28 -0.98 133.6 3.61 - 0.66 -2.95 135.2 2.13 - 0.00 -2.13 137.4 0.98 - -0.49 -1.48 141.3 0.00 - -1.64 -1.64 144.3 1.31 - -0.49 -1.80
1Negative transport distance indicates downstream movement.
1.2 Diversion Dam Sedimentation Study Since there was no appreciable movement of the tracer rocks upstream of the Diversion Dam, it is unlikely that any sediment was transported and deposited in the Diversion Dam pool. Hence, the resurvey of the Diversion Dam pool bathymetry to determine the volume of sediment deposited in the pool was not undertaken.

Jackson Hydroelectric Project
Page 6 Addendum to Study 22: Sultan River Physical Process Studies October 1, 2008
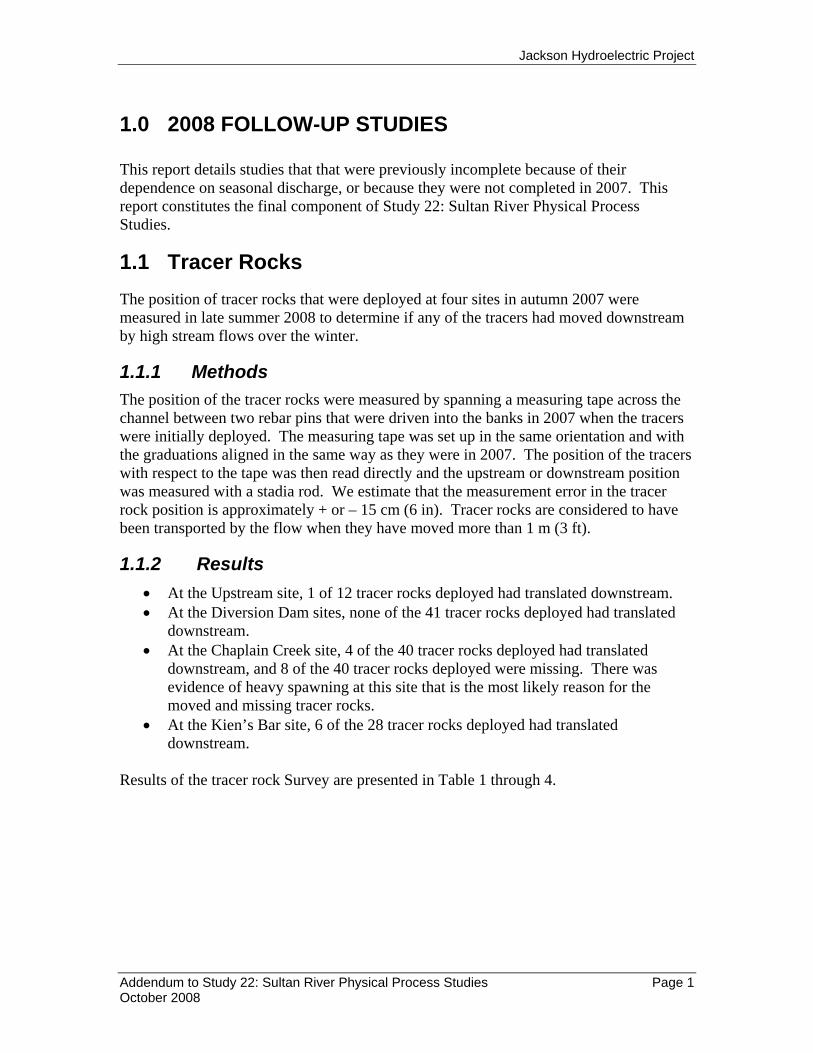
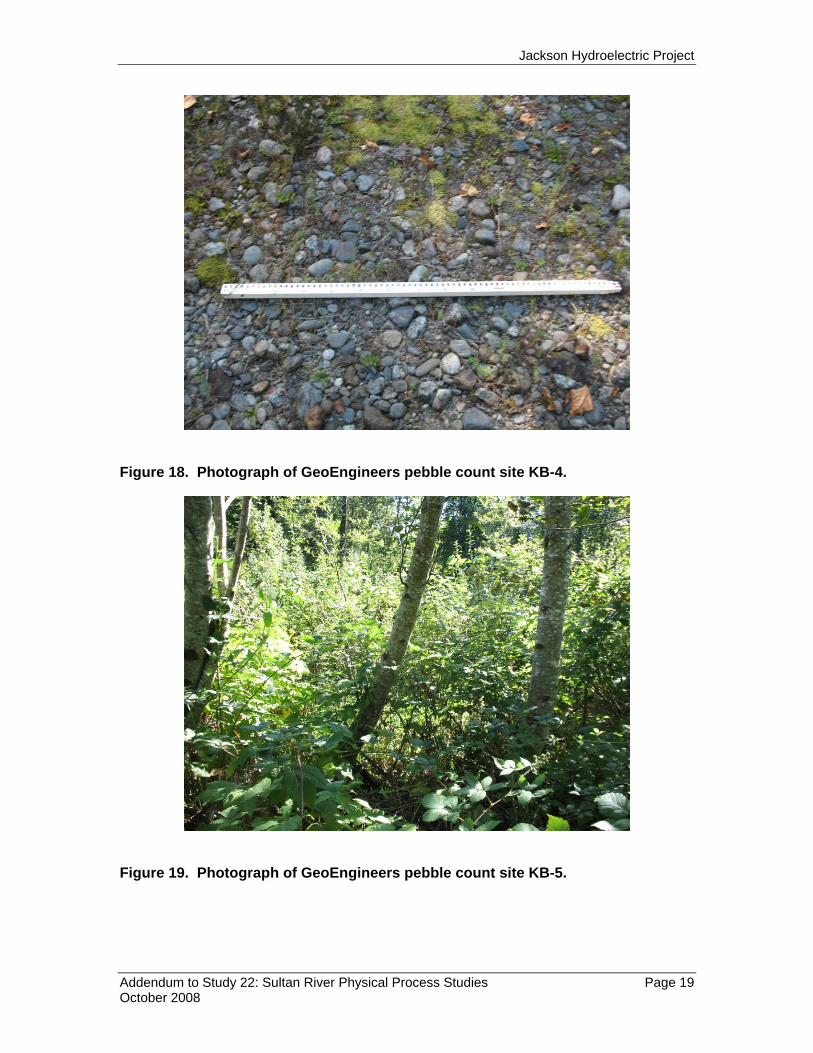
1.3 Pebble Counts In 1984, GeoEngineers conducted 20 pebble counts that were part of baseline physical studies accompanying raising the crest elevation of Culmback Dam. Repeat pebble counts at the same sites were conducted in late summer 2008. Using maps published by GeoEngineers (Figures 9, 11, 12 in GeoEngineers 1984), the site of each 1984 pebble count was located as best as possible. In many cases vegetation had completely overgrown the site of the 1984 pebble counts; at these sites, no pebble count was made.
Pebble counts for each of the repeat pebble counts are presented in Table 4. Photographs of each pebble count site are presented in Figures 2 through 25 at the end of the document.
1.3.1 Discussion In general, the ideal location to sample the bed surface particle size distribution is near the head of an active gravel bar as shown in Figure 1. The rationale for choosing this location is that the bedload is frequently transported and deposited at these locations and therefore is representative of the typical caliber of coarse sediment being transported by the river. In 1984, the pebble count locations were generally made at locations similar to those presented in Figure 1. Under present conditions, however, vegetation has encroached on most of the 1984 pebble count locations (Figures 2 to 25). A major contributing factor to vegetation encroachment in the Sultan River below Culmback Dam is almost certainly its altered hydrograph. In the years following 1984, flow regulation altered the hydrograph of the Sultan River, changing both the magnitude and frequency of large floods. Longer times between large floods have allowed riparian vegetation to gain a foothold and become more resistant to scour by floods. The result is that formerly active gravel bars are no longer an expression of the modern coarse bedload of the river. Rather, these vegetated bars now form discrete units of stored sediment in the valley bottom, adjacent to an inset active channel.
The recent pebble counts demonstrate this vegetated condition by showing that the vegetation that has grown over formerly active gravel bars through out the Sultan River below Culmback Dam. The size distribution of the pebble counts that were repeated in 2008 broadly match those completed in 1984, but they represent a sample of relict coarse gravel bed surfaces rather than sample of the active bed, particularly at the Kien’s Bar site. Pebble counts completed for Study 18 (Riverine, riparian, and wetland habitat assessment) and Study 22 (Sultan River Physical Process Studies), as well as gravel studies (e.g., R2 Resource Consultants, 2006) in the Sultan since 1984 show that the texture of both the bed surface and the active bedload of the Sultan River are broadly similar to that reported in 1984.
The repeat pebble counts of 2008 support 4 conclusions presented in Study 22:
• Riparian vegetation has colonized formerly active gravel bars in the Sultan River.
• The gravel bars that were “sampling” the bedload in 1984 are no longer doing so.

Jackson Hydroelectric Project
Addendum to Study 22: Sultan River Physical Process Studies Page 7 October 2008
• The sediment that forms the vegetated gravel bars is not immediately available to the sediment budget of the river because it is being stored, in situ, in transport-resistant vegetated gravel bars.
• The gravel stored in the vegetated gravel bars helps explain why “excess coarse sediment” is not a problem in the lower Sultan River; sediment that may have available to aggrade and form braids, for example, is simply in channel storage.
Figure 1. A copy of Figure 13 from GeoEngineers, 1984. This figure represents an active gravel bar and depicts the ideal location to sample the bed surface particle size distribution.

Jackson Hydroelectric Project
Page 8 Addendum to Study 22: Sultan River Physical Process Studies October 1, 2008
Table 5. Results of the 2008 repeat pebble counts at 1984 GeoEngineers sites. Point Count and Location Number Particle Diameter in mm Kien's Bar Site D85 D60 D50 D40 D25 D15 D10 KB-1 NA NA NA NA NA NA NA KB-2 NA NA NA NA NA NA NA KB-3 NA NA NA NA NA NA NA KB-4 9 12 20 28 35 42 62 KB-5 NA NA NA NA NA NA NA KB-6 12 18 22 34 43 48 67 KB-7 NA NA NA NA NA NA NA KB-8 NA NA NA NA NA NA NA KB-9 NA NA NA NA NA NA NA KB-10 NA NA NA NA NA NA NA Chaplain Creek Site CCB-1 NA NA NA NA NA NA NA CCB-2 NA NA NA NA NA NA NA CCB-3 NA NA NA NA NA NA NA CCB-4 NA NA NA NA NA NA NA CCB-5 NA NA NA NA NA NA NA CCB-6 NA NA NA NA NA NA NA Upper Site UB-1 56 33 29 26 19 14 10 UB-2 NA NA NA NA NA NA NA UB-3 13 16 19 24 29 35 53 UB-4 10 11 21 30 42 55 101 Kien's Bar Average 65 45 39 31 21 15 11 Chaplain Creek Site Average NA NA NA NA NA NA NA
Upstream Site Average 55 35 30 27 26 23 20
1.4 Sediment Transport Analysis The movement of six tracer rocks at the Kien’s Bar site suggests that the onset of sediment transport (i.e., incipient motion) may have been reached during water year 2008

Jackson Hydroelectric Project
Addendum to Study 22: Sultan River Physical Process Studies Page 9 October 2008
(WY 2008). The maximum daily discharge during WY 2008 was 2310 cfs and the peak discharge was 2950 cfs. Incipient motion is the point at which the shear stress associated with the discharge is just high enough to cause particles on the bed surface to be dislodged and translate downstream. Little appreciable sediment transport occurs at incipient motion. Incipient motion is distinct from the condition of measurable bedload transport, when the entire bed surface is in motion and appreciable sediment transport is taking place.
Here we present data from our previous EASI modeling alongside WY 2008 discharge data as a check on how closely our modeling predicted the onset of sediment transport, and therefore its reliability in predicting average annual sediment discharge. We also present a brief comparison of modeled annual sediment transport rates in PR1 using our data and the 1984 GeoEngineers data.
1.4.1 Methods To compare calculated sediment transport rates between 1984 and current conditions, we used particle size distribution data from 1984 (Figure 14, GeoEngineers 1984), channel dimension data from 1984 aerial photography, and gage data from USGS gage 12138150 as parameters in the EASI model. We then ran the model to generate average annual sediment transport results to compare with ours.
1.4.2 Results and Discussion No tracer rocks moved during the controlled flow releases in late October 2007. During the controlled flow releases the maximum daily discharge was 1530 cfs at USGS gage 12138160 and occurred on October 22, 2007. The maximum daily discharge of 2310 cfs at USGS gage 12138160 during WY 2008 occurred on December 3, 2007. Since no tracer rock observations were possible until after discharge and turbidity were lower, we assume that the maximum daily flow experienced during WY 2008 was responsible for the onset of sediment transport.
The daily discharge of 2310 cfs is bounded by the minimum and maximum flows that we predicted would begin to transport sediment, 1700 cfs and 5600 cfs (Table 6). As stated in Appendix A of Study 22: Sultan River Physical Process Studies, results within a factor of 2 or 3 are commonly deemed acceptable for sediment transport modeling; our results range from within a factor of 1.4 to 2.4. If we use the peak discharge of 2950 cfs, which also occurred on December 3, this factor ranges from 1.7 to 1.9. Therefore, our ranges of predicted average annual sediment discharges are reasonable and constitute an acceptable level of model validation.
A comparison of the modeling results, using modern data in combination with data from 1984, show similar results: the predicted discharge at which incipient motion would have taken place in 1984 is bounded by the values from current conditions (Table 6). In other words, conditions are not appreciably different between these two years. These results support our assessment that a compensatory response in channel planform has maintained sediment transport rates in the Sultan River. Despite fewer and smaller large floods and a

Jackson Hydroelectric Project
Page 10 Addendum to Study 22: Sultan River Physical Process Studies October 1, 2008
similar rate of sediment input, the river has maintained a relatively similar average annual sediment discharge via channel narrowing.
Table 6. Comparison of EASI sediment transport analysis using modern and 1984 GeoEngineers data.
Site and Conditions
Average Annual Sediment Transport Rate (kilotons/year)
Modeled Daily Discharge at Which Onset of Sediment Transport Begins
(cfs)
Maximum Daily Discharge in WY
2008 Peak Discharge
in WY 2008 Kien’s Bar (coarse D50 = 150 mm; modern channel width; gage 12138160 daily values)
0.7 5600
Kien’s Bar (fine D50 = 47 mm; modern channel width; gage 12138160 daily values)
12 1700
1984 Kien’s Bar (fine D50 = 47 mm; 1984 channel width; gage 12138150 daily values)
15 2200
2310 2950

Jackson Hydroelectric Project
Addendum to Study 22: Sultan River Physical Process Studies Page 11 October 2008
Figure 2. Photograph of GeoEngineers pebble count site UB-1.
Figure 3. Photograph of GeoEngineers pebble count site UB-2.

Jackson Hydroelectric Project
Page 12 Addendum to Study 22: Sultan River Physical Process Studies October 1, 2008
Figure 4. Photograph of GeoEngineers pebble count site UB-2, bed surface.
Figure 5. Photograph of GeoEngineers pebble count site UB-3.

Jackson Hydroelectric Project
Addendum to Study 22: Sultan River Physical Process Studies Page 13 October 2008
Figure 6. Photograph of GeoEngineers pebble count site UB-4.
Figure 7. Photograph of GeoEngineers pebble count site UB-4, bed surface.

Jackson Hydroelectric Project
Page 14 Addendum to Study 22: Sultan River Physical Process Studies October 1, 2008
Figure 8. Photograph of GeoEngineers pebble count site CCB-1.
Figure 9. Photograph of GeoEngineers pebble count site CCB-2.

Jackson Hydroelectric Project
Addendum to Study 22: Sultan River Physical Process Studies Page 15 October 2008
Figure 10. Photograph of GeoEngineers pebble count site CCB-3.
Figure 11. Photograph of GeoEngineers pebble count site CCB-4.

Jackson Hydroelectric Project
Page 16 Addendum to Study 22: Sultan River Physical Process Studies October 1, 2008
Figure 12. Photograph of GeoEngineers pebble count site CCB-5.
Figure 13. Photograph of GeoEngineers pebble count site CCB-6.

Jackson Hydroelectric Project
Addendum to Study 22: Sultan River Physical Process Studies Page 17 October 2008
Figure 14. View from upstream of the Chaplain Creek detailed study site gravel bar in September 2008.
Figure 15. Photograph of GeoEngineers pebble count site KB-1.

Jackson Hydroelectric Project
Page 18 Addendum to Study 22: Sultan River Physical Process Studies October 1, 2008
Figure 16. Photograph of GeoEngineers pebble count site KB-2.
Figure 17. Photograph of GeoEngineers pebble count site KB-3.
Jackson Hydroelectric Project
Addendum to Study 22: Sultan River Physical Process Studies Page 19 October 2008
Figure 18. Photograph of GeoEngineers pebble count site KB-4.
Figure 19. Photograph of GeoEngineers pebble count site KB-5.

Jackson Hydroelectric Project
Page 20 Addendum to Study 22: Sultan River Physical Process Studies October 1, 2008
Figure 20. Photograph of GeoEngineers pebble count site KB-6.
Figure 21. Photograph of GeoEngineers pebble count site KB-7.

Jackson Hydroelectric Project
Addendum to Study 22: Sultan River Physical Process Studies Page 21 October 2008
Figure 22. Photograph of GeoEngineers pebble count site KB-8.
Figure 23. Photograph of GeoEngineers pebble count site KB-9.

Jackson Hydroelectric Project
Page 22 Addendum to Study 22: Sultan River Physical Process Studies October 1, 2008
Figure 24. Photograph of GeoEngineers pebble count site KB-10.
Figure 25. View of Kien’s Bar looking upstream from the high point on the interior
of the bar.

Jackson Hydroelectric Project
Addendum to Study 22: Sultan River Physical Process Studies Page 23 October 2008
1.5 References GeoEngineers. 1984. Phase 1 Report, River Gravel Quantity Study. Prepared for Public
Utility District No. 1 of Snohomish County, Everett, Washington.
R2 Resource Consultants. 2006. Spatial and temporal comparison of spawning gravel quality in the Sultan River, Washington, Henry M. Jackson Hydroelectric Project, FERC Project No. 2157. Prepared by R2 Resource Consultants, Inc., Redmond, WA.
Stillwater Sciences. 2006. Study 18: Riverine, riparian, and wetland habitat assessment. Prepared for Snohomish Public Utility District as part of their Jackson Hydropower Relicensing.
Stillwater Sciences. 2007. Study 22: Sultan River physical process studies. Prepared for Snohomish Public Utility District as part of their Jackson Hydropower Relicensing.

Study Plan 22: Sultan River Physical Process Studies Final Technical Report
Prepared for
Snohomish County Public Utility District No. 1 Everett, WA
Prepared by
Stillwater Sciences 1314 NE 43rd Street, Suite 210
Seattle, WA 98105
and
Meridian Environmental 1900 N Northlake Way Suite 211
Seattle, WA 98103
June 2008


Jackson Hydroelectric Project
Study Plan 22: Sultan River Physical Process Studies Technical Report Page i June 2008
Table of Contents
EXECUTIVE SUMMARY...........................................................................................................V
1.0 STUDY OBJECTIVES............................................................................................................1 1.1 Study Area Description and River Reach Delineation ................................................ 1
2.0 INDIVIDUAL STUDIES.........................................................................................................5 2.1 Sediment Input, Routing, and Fate .............................................................................. 5
2.1.1 Sediment Input ............................................................................................................ 5 2.1.1.1 Introduction .................................................................................................. 5 2.1.1.2 Methods for estimating sediment production ............................................... 5 2.1.1.3 Results .......................................................................................................... 6
2.1.2 Sediment Transport Capacity (EASI)........................................................................ 13 2.1.2.1 Methods...................................................................................................... 13 2.1.2.2 Results ........................................................................................................ 16
2.1.3 Cross-section Re-surveying ...................................................................................... 17 2.1.3.1 Introduction and objectives ........................................................................ 17 2.1.3.2 Methods...................................................................................................... 18 2.1.3.3 Results ........................................................................................................ 19
2.1.4 Diversion Dam Pool Sediment Study........................................................................ 22 2.1.4.1 Methods...................................................................................................... 22 2.1.4.2 Results ........................................................................................................ 23
2.1.5 Mass Balance............................................................................................................ 24 2.1.5.1 Introduction ................................................................................................ 24 2.1.5.2 Results ........................................................................................................ 24
2.2 Channel Dynamics..................................................................................................... 25 2.2.1 Island and Side Channel Formation ......................................................................... 25
2.2.1.1 Introduction ................................................................................................ 25 2.2.1.2 Progressive meander migration .................................................................. 25 2.2.1.3 Dynamics of cutoff and side-channel habitat formation............................. 26 2.2.1.4 Island Formation......................................................................................... 26 2.2.1.5 Channel Pattern .......................................................................................... 27
2.2.2 Channel Planform and Terrace Mapping................................................................. 27 2.2.2.1 Introduction ................................................................................................ 27 2.2.2.2 Methods...................................................................................................... 28 2.2.2.3 Results ........................................................................................................ 29
2.3 Large Woody Debris Study ....................................................................................... 34 2.3.1 Introduction .............................................................................................................. 34 2.3.2 Methods .................................................................................................................... 34
2.3.2.1 Wood volume estimates ............................................................................. 34 2.3.2.2 Stream power index.................................................................................... 34
2.3.3 Results....................................................................................................................... 35 2.3.4 Discussion................................................................................................................. 38
3.0 GEOMORPHIC SYNTHESIS .............................................................................................41 3.1 Sultan River Physical Process Model ........................................................................ 44
3.1.1 Geologic Setting........................................................................................................ 44 3.1.2 Process Domains in the Study Area.......................................................................... 45
4.0 CONCLUSIONS ....................................................................................................................48

Jackson Hydroelectric Project
Page ii Study 22: Sultan River Physical Process Studies Technical Report June 2008
5.0 REFERENCES.......................................................................................................................50
Appendices
Appendix A Description of EASI model formulation Appendix B EASI Model Output Appendix C 2007 Pebble Count Data Appendix D Responses to Stakeholder Comments on Draft Report
List of Figures
Figure 1-1 Overview map of the Sultan River basin, Project features, and the study area. ............................................................................................. 2
Figure 1-2 Operational reach (OR) and process reach (PR) juxtaposition downstream of Culmback Dam. River miles are noted in the horizontal bars....................................................................................... 3
Figure 2-1 Debris flow and deep-seated landslides that contribute sediment to the Sultan River channel in the study area.................................................. 7
Figure 2-2 Cross-section comparison at the Kien’s Bar Site, XS 1. Elevation is relative to the Rock BM elevation (200 ft) given in the 1984 GeoEngineers survey. ......................................................................... 19
Figure 2-3 Cross-section comparison at the Kien’s Bar Site, XS 2. Elevation is relative to the Rock BM elevation (200 ft) in XS 1. Due to the lack of surveying benchmarks at this location from the 1984 GeoEngineers survey, the two cross-sections were aligned in the horizontal based on the measured bank retreat of 21.49 ft at XS 1. Note change in Y-axis scale relative to Figure 2-2.................................................................. 20
Figure 2-4 Cross-section comparison at the Kien’s Bar Site, XS 3. Elevation is relative to the Rock BM elevation (200 ft) in XS 1. Due to the lack of surveying benchmarks at this location from the 1984 GeoEngineers survey, the two cross-sections were aligned in the horizontal based on the measured bank retreat of 21.49 ft at XS 1..................................... 20
Figure 2-5 Cross-section comparison at the Chaplain Site. Elevation is relative to the Rock BM elevation (200 ft) given in the 1984 GeoEngineers survey.................................................................................................. 21
Figure 2-6 Cross-section comparison at the Upper Site. Elevation is relative to the BM 1 and BM 2 elevations derived from the 1984 GeoEngineers survey plot........................................................................................... 22
Figure 2-7 Reservoir bathymetry for the sediment deposit behind the Diversion Dam (July 2007). The solid blue lines indicate the water surface elevation at the time of measurement. ................................................ 24
Figure 2-8 Valley bottom terrace mapping in process reach 1. The low terraces represent former channel boundaries, now abandoned by the river. .. 30
Figure 2-9 The 1965, 1983, and 2003 Sultan River channel planform overlain onto the 1919 USGS topographic map. This figure illustrates how the

Jackson Hydroelectric Project
Study Plan 22: Sultan River Physical Process Studies Technical Report Page iii June 2008
channel planform of the Sultan River has been relatively stable since before Stage 1 of the Project............................................................... 31
Figure 2-10 Vegetation encroachment of side channel 1 (~RM 0.9) between 1965 and 2003.............................................................................................. 32
Figure 2-11 Vegetation encroachment of side channel 2 (~RM 1.1) and Kien’s Bar site (RM 1.2) between 1965 and 2003. ............................................... 32
Figure 2-12 Vegetation encroachment of side channel 3 (~RM 1.8) between 1965 and 2003.............................................................................................. 33
Figure 2-13 Vegetation encroachment at the Chaplain Creek site between 1965 and 2003..................................................................................................... 33
Figure 2-14 Large woody debris volume verses an index of stream power in the Sultan River in each process reach. .................................................... 36
Figure 2-15 Normalized volume of large woody debris verses bankfull width for Washington rivers (from Fox 2001) and in the Sultan River by process reach.................................................................................................... 36
Figure 2-16 Average large woody debris volume and index of stream power by river mile in the Sultan River.............................................................. 37
Figure 2-17 Average large woody debris volume and average log jam volume by river mile in the Sultan River.............................................................. 38
Figure 2-18 Percent composition of large woody debris (LWD) and location within the channel of the Sultan River by Process Reach. Pieces within Zone 1 interact with the wetted area. Zone 2 include those pieces within the bankfull channel but that are too high to fall within the wetted area of the channel. ......................................................................................... 40
Figure 3-1 Schematic diagram showing how rock avalanche debris backs up large reservoirs of fine grained sediment in the gorge reaches of the Sultan River.................................................................................................... 46
Figure 3-2 Process Reach features and distinctions in the Sultan River. ............. 47
List of Tables
Table 2-1 Landslide frequency for mass-wasting processes occurring within the lower Sultan River basin.1..................................................................... 8
Table 2-2 Landslide sediment production for the lower Sultan River basin, based on landslide inventory data compiled by Sarikhan and Pringle (2005).............................................................................................................. 10
Table 2-3 Current and historic USGS gaging stations within the Sultan River Basin (table from Study 23)................................................................ 14
Table 2-4 Summary output of the sediment transport modeling for the Sultan River.................................................................................................... 17
Table 2-5 Summary of mass balance of sediment transport capacity and sediment input for the Sultan River.................................................................... 24
Table 2-6 Active channel area in acres by year in the lower 4 miles of the Sultan River (i.e., all of PR 1 and the lowermost end of PR 2). .................... 31

Jackson Hydroelectric Project
Page iv Study 22: Sultan River Physical Process Studies Technical Report June 2008
Table 2-7 Comparison of wood loading in Process Reach 1 and wood loading in undisturbed rivers with the same range of bankfull widths surveyed by Fox (2001)........................................................................................... 37

Jackson Hydroelectric Project
Study Plan 22: Sultan River Physical Process Studies Technical Report Page v June 2008
EXECUTIVE SUMMARY
The objective of Study Plan 22: Sultan River Physical Process Studies was to evaluate how current and proposed operations of the Henry M. Jackson Hydroelectric Project affect fluvial processes and channel morphology in the Sultan River, particularly those that affect populations of anadromous salmonids. The ultimate goal is to provide a physical process context for the Sultan River to help guide management choices for aquatic and riparian habitat in ways that benefit aquatic species.
Results from this study, as well as results from other studies conducted as part of the Henry M. Jackson Hydroelectric Project, FERC No. 2157 (the Project) relicensing process, will assess what effects Project operations have on aquatic and terrestrial resources – including anadromous fish populations.
The Study Area encompasses the lowermost 16.5 miles of the Sultan River below Culmback Dam, and is divided into three process reaches whose boundaries are determined by process and topographic differences: an alluvial valley reach from RM 0 to RM 3, a terrace bounded valley reach from RM 3 to RM 11, and V-shaped valley reach from RM 11 to RM 16.5. The alluvial valley has the characteristics of a classically-defined flood plain river with pool-riffle channel morphology. The terrace-bounded river flows through a gorge bounded by terraces, which fail by deep-seated landsliding. In the V-shaped valley, the river flows through a gorge whose steep valley walls fail by debris flow landsliding. The channel in both the terrace-bounded valley and the V-shaped valley consist variously of plane-bed, step-pool and cascade channel morphologies.
Present rates and processes of sediment input into the Sultan River in the study area are similar to pre-Project conditions. Flood frequency has decreased, though peak flood magnitudes are only modestly diminished. Results from the mass balance study, which couples sediment transport capacity with estimated rates of sediment input, suggest that rates of sediment transport remain high enough to convey all of the sediment delivered to the river. The upper 13 miles below Culmback Dam has maintained a high sediment transport capacity even with reduced flood magnitudes because of its steep and confined character, which has an inherent excess of sediment-transport capacity. Sediment transport in the alluvial reach in the lower 3 miles of the river has remained high because of narrowing of the channel by vegetation encroachment. Channel narrowing effectively increases the sediment transport capacity, and so sediment delivered from upstream continues to be routed through the reach, despite reduced flood frequency.
Side channels in the alluvial reach are a consequence of vegetation encroachment into areas that were once part of the active channel. Reduced flood frequency, a consequence of Project operations, has played a role by allowing the establishment of riparian forests on gravel bars that would otherwise remain mobile and free of vegetation.

Jackson Hydroelectric Project
Page vi Study 22: Sultan River Physical Process Studies Technical Report June 2008
The loading rate of large woody debris in the upper 13 miles of the river is similar to other Washington rivers, but the rate is lower in the alluvial reach. Throughout the river, large woody debris plays little functional role in habitat formation. In PR 2 and PR 3, high stream power, confinement, and relatively small logs interact to leave most wood deposited well above the active channel. Instead, the main pool-forming mechanism in this reach is impoundment upstream of rock-avalanche deposits.
In the lower 3 miles of the Sultan River, large woody debris is more scarce than in unmanaged western Washington rivers. We speculate that this is a consequence of the legacy of logging and active removal, in that the supply from upstream is presumably commensurate with the relatively high observed abundance of logs.
The channel planform of the alluvial reach of the Sultan River is more-or-less the same as it has been since at least 1919. The channel shifted only modestly prior to 1965, and it has been static since then. The most notable change in channel planform has been a reduction in the active channel area. Since 1984, the area of the active channel has been reduced by about one-third due to encroachment of riparian vegetation onto formerly active gravel bars. The sediment in these vegetated bars is now sequestered from active transport by the river.

Jackson Hydroelectric Project
Study Plan 22: Sultan River Physical Process Studies Technical Report Page 1 June 2008
1.0 STUDY OBJECTIVES
The objective of this study was to evaluate how current and proposed operations of the Henry M. Jackson Hydroelectric Project affect fluvial processes and channel morphology in the Sultan River, particularly those that affect populations of anadromous salmonids. The ultimate goal is to provide a physical process context for the Sultan River to help guide management choices for aquatic and riparian habitat in ways that benefit aquatic species.
Specific objectives of this study were to assess how Stage 2 Project operations have affected sediment and wood transport, storage, and deposition, and how Project operations affect channel planform, particularly the creation and maintenance of side channels in the lower river. A historical perspective was essential for predicting whether and how ongoing or modified Stage 2 operations will affect channel morphology and the riverine ecosystem. Any geomorphic processes or channel characteristics that appeared to have changed since 1984 were evaluated to assess whether they appear to be attributable to Stage 2 Project operations or to natural changes in runoff or sediment delivery.
1.1 Study Area Description and River Reach Delineation
The Study Area defined by the District includes approximately 16.5 miles of the Sultan River from Culmback Dam to its confluence with the Skykomish River (Figure 1-1). The Sultan River in the Project Area can be divided into distinct reaches based upon physical process and topographic features. Study Plan 22 initially laid out five process reaches in the Sultan River below Culmback Dam, but this study has amended that scheme by including two previously distinguished process reaches as subreaches of the three preeminent process reaches. As now defined, Process Reach 1 (PR 1) spans RM 0 to RM 3 and is the lowermost alluvial reach of the river; near the confluence with the Skykomish River flood waters can back up to form a backwater reach (RM 0 to RM 0.7). Process Reach 2 (PR 2) lies between RM 3 and RM 11 and is predominantly a confined gorge reach with a relatively high gradient, though it is punctuated by a lower gradient alluvial subreach between RM 4.5 to RM 5.4. Process Reach 3 (PR 3) lies between RM 11 and RM 16.5 and is also a confined gorge reach with relatively high gradient. An in-depth discussion of the rationale behind the process reach scheme is presented in Section 4.
The Sultan River can also be divided into sub-reaches based on Project operational structures (“operational reaches”). Operational reaches are briefly described here for informational purposes; however their designations are generally not used in this study. The uppermost operational reach (OR 3) extends from Culmback Dam (RM 16.5) downstream to the Diversion Dam (RM 9.7) (Figure 1-2). The middle operational reach (OR 2) extends from the Diversion Dam (RM 9.7) downstream to the Powerhouse (RM

Jackson Hydroelectric Project
Page 2 Study 22: Sultan River Physical Process Studies Technical Report June 2008
4.5). The lowermost operational reach (OR 1) extends from the Powerhouse (RM 4.5) to the Sultan River’s confluence with the Skykomish River (RM 0).
Figure 1-1 Overview map of the Sultan River basin, Project features, and the study area.

Jackson Hydroelectric Project
Study Plan 22: Sultan River Physical Process Studies Technical Report Page 3 June 2008
0 1 2 3 4 5 6 7 8 9 10 11 12 13 14 15 16 17 18
River Mile
OR 1 OR 3OR 2
PR 3PR 2PR 1
RM 0 - RM 4.5
RM 11 - RM 16.5RM 3 - RM 11
RM 9.7 - RM 16.5RM4.5 - RM 9.7
RM 0 - RM 3
Figure 1-2 Operational reach (OR) and process reach (PR) juxtaposition
downstream of Culmback Dam. River miles are noted in the horizontal bars.


Jackson Hydroelectric Project
Study Plan 22: Sultan River Physical Process Studies Technical Report Page 5 June 2008
2.0 INDIVIDUAL STUDIES
2.1 Sediment Input, Routing, and Deposition
2.1.1 Sediment Input 2.1.1.1 Introduction
In the Pacific Northwest, natural hillslope erosion is dominated by mass wasting, which includes deep-seated landslides (earthflows and slumps), shallow landslides (debris slides and debris avalanches), soil creep, and associated debris-flow processes. These mass-wasting processes are dynamic and interactive; instabilities in the soil mantle can cause initiation of shallow landslides and debris flows, and colluvium from slow deep-seated mass movements is delivered to stream channels in the form of rapid, shallow landslides at stream banks (Swanson and Swanston 1977) or by fluvial erosion of the oversteepened toe slopes.
The “input” component of the sediment budget assesses the average annual sediment production from these hillslope and near-channel sources into the lower Sultan River basin. Dominant erosional processes in the area include shallow landslides, deep-seated landslides, debris flows, and bank erosion. An existing air photo-based landslide inventory (Sarikhan and Pringle 2005) across the Sultan River watershed was utilized to assess landslide frequencies and derive sediment-production rates across the sample area. These predictions were compared to the literature on long-term hillslope erosion rates for areas with similar lithologic and climatic characteristics (Swanson and Swanston 1977, Kelsey 1978, Reid 1981, Hick 1982, Lehre 1982, Swanson et al. 1982, Swanson, Ziemer, and Janda 2005, Benda et al. 2005). We emphasized data from the Clearwater River basin of the Olympic Peninsula, located approximately 99 mi (160 km) west (Reid 1981) because of the high quality of the results and the similar geology and climate to that of the Sultan River watershed.
2.1.1.2 Methods for estimating sediment production Estimating total average annual sediment production from sediment sources, generally expressed in tons per year (t/yr), involved the following steps:
1) The dominant mass-wasting processes were identified from an existing landslide inventory, our past experience across this landscape and our field observations in the Sultan watershed. From these sources, the recognized processes included shallow landslides, debris slides/avalanches, rock avalanche, sporadic and persistent deep-seated landslides, earthflows, and debris flows.
2) Mass-wasting processes with similar modes of failure were grouped into three distinct categories (shallow landslides, deep-seated landslides, and debris flows).

Jackson Hydroelectric Project
Page 6 Study 22: Sultan River Physical Process Studies Technical Report June 2008
3) Within a given process-defined stream buffer adjacent to the mainstem Sultan River and its tributary channels between Culmback Dam to the Skykomish River, sediment delivery was assumed to be complete (i.e., all eroded sediment is presumed to reach the channel).
4) Sediment production from shallow landslides and debris flows was calculated by multiplying the total mapped area for slides occurring within 300 feet (100 m) of channels by an assumed landslide depth and average soil bulk density. Annual rates assumed the 47-year record (1958–2005) of the landslide inventory.
5) For deep-seated landslides, sediment production rates were calculated as the product of assumed bank exposure height, the length of channel intersecting the mapped deep-seated landslides, average soil density, and an average mass movement rate derived from published earthflow movement rates in physiographically similar regions.
6) Field-measured ratios of coarse-grained to fine-grained sediment were applied to process-specific, total sediment production rates to determine annual coarse sediment-production rates (i.e., the rate of gravel input to the channel network) for all sediment sources.
7) The range of plausible sediment production values were computed by adjusting assumed parameters based on published literature values, likely measurement errors or uncertainties, and reconnaissance-level field observations.
2.1.1.3 Results 2.1.1.3.1 Existing landslide inventory
Sarikhan and Pringle (2005) identified landslides across the entire ~37 mi2 (~97 km2) Sultan River watershed as part of the Landslide Hazard Zonation Project for the Washington Department of Natural Resources. This mapping effort applied standard methods outlined in Landslide Hazard Inventory Protocols (http://www.dnr.wa.gov/forestpractices/lhproject/lhz-protocol.doc) to characterize active mass-wasting processes and evaluate risks associated with landslide hazards. The resulting landslide inventory, based on reconnaissance-level aerial photograph analysis and selected field observations, identified individual slide types, activity styles, causal mechanisms, land usage, mapping certainty, relative time of occurrence, and sediment delivery potential. A comprehensive digital landslide database documented 510 natural and/or management-related failures and differentiated four dominant landslide types (rapid shallow landslides resulting from side-cast failures, debris flows resulting from failed culverts, debris flows resulting from loss of soil root strength, and natural deep-seated landslides).
A total of 393 landslides from this digital landslide inventory were used to assess sediment production downstream of Culmback Dam to the Skykomish River confluence, representing approximately 25 mi2 (63 km2 )of drainage area. Landslides from this

Jackson Hydroelectric Project
Study Plan 22: Sultan River Physical Process Studies Technical Report Page 7 June 2008
subsample of the landslide inventory data grouped into three distinct mass wasting categories: (1) rapid shallow landslides, (2) debris flows, and (3) deep-seated landslides (Figure 2-1).
Figure 2-1 Debris flow and deep-seated landslides that contribute sediment to the Sultan River channel in the study area.

Jackson Hydroelectric Project
Page 8 Study 22: Sultan River Physical Process Studies Technical Report June 2008
In the study area, mass-wasting processes are dominated by a concentration of debris flows along steep inner gorge slopes in PR 3and shallow and deep-seated landslides along streamside slopes in PR 2. Approximately 88% of these mapped landslides have a reasonable potential to directly deliver landslide debris to stream channels or other public resources of concern. Approximately 75% of the mapped landslides had failed before 1998 and are generally associated with past timber harvest practices and severe storm events (Table 2-1).
Table 2-1 Landslide frequency for mass-wasting processes occurring within the lower Sultan River basin.1
Landslides Photo year
Photo Period
Interval (years) Shallow
landslides Debris Flows
Deep-seated landslides
Total landslides
Average landslide rate (landslides/yr)
Average landslide rate (landslides/
mi2/yr)
1958 pre-1958 20 11 6 6 23 1 0.04
1978 1959–1978 20 32 130 40 202 10 0.4
1983 1979–1983 4 41 33 26 100 25 1.0
1991 1984–1991 7 6 26 15 47 7 0.28
1994/ 1995
1992–1995 3 1 2 - 3 1 1.0
1998 1996–1998 2 - 2 - 12 6 0.24
2004/ 2005
1999–2005 6 4 10 2 6 1 0.04
1959–2005 47 95 209 89 393 8 0.43
1 Landslide frequency data includes all mapped landslides occurring within the entire lower Sultan River basin, extending from Culmback Dam to the Skykomish River confluence (~25 mi2).
We computed sediment production from landslides that ended within 300 feet (100m) of the mainstem Sultan River and major tributary channels over a 47-year period, under the assumption that more distant slides probably do not contribute much if any sediment to the channel. Thus, the majority of sediment input from bank erosion is presumed to be incorporated in these estimates. This 300-foot zone completely includes nearly half of the landslides in the landslide inventory and most of the remaining mapped landslide areas. It excludes, however, those slides that initiated and ended on hillslopes above the river and so were assumed to not input sediment into the channel.

Jackson Hydroelectric Project
Study Plan 22: Sultan River Physical Process Studies Technical Report Page 9 June 2008
Shallow landslides Rapid, shallow landslides represent the second most frequent mass wasting process in the lower Sultan River basin but they contribute the least volume of sediment and organic debris to the channel network. Shallow landslides typically remove the thin, unconsolidated soil mantle (usually one to two-meter soil depth) along a planar slide surface overlying more competent bedrock material (Swanson et al. 1982), commonly during large rainstorms. Shallow landslides may occur anywhere on hillslopes but are usually associated with areas of convergent topography or along steep streamside slopes. Shallow landslides often occur adjacent to roads and on logged hillslopes due to changes in surface drainage, subsurface hydrology, and root strength in these areas.
For this study, we include all features identified by Sarikhan and Pringle (2005) as debris slides/avalanches, rock falls/topples, and undifferentiated rapid, shallow landslides into our “shallow landslide” category. They represent 24% of the total sample inventory and predominantly occur along stream banks downstream of the Diversion Dam.
Reported sediment-production rates from shallow landslides (including debris flows) for undisturbed watersheds in the Pacific Northwest are between 61–270 t/mi2/yr (60–115 metric tons/km2/yr) (Swanson and Dyrness 1975, Swanson and Swanston 1977, Reid 1981, Swanson et al. 1982, Lee Benda as cited in Swanson et al. 1987). Across this region, research in disturbed watersheds suggests that road construction and timber harvesting can increase sediment production from mass wasting by as much as 4.9 times that of undisturbed areas (Swanson and Dyrness 1975, Swanston and Swanson 1976, Reid 1981).
We estimate 1,620 t/yr (1,470 metric tons/yr) of sediment is delivered to the lower Sultan River from shallow landslide processes from the 300-ft (100m) stream buffer, assuming an average landslide depth of 1 m based on field reconnaissance, and an average colluvial bulk density of 0.05 t/ft3 (1.5 t/m3), based on a range of published regional values (Reid 1981, Reneau and Dietrich 1991). Nearly 80% of all shallow landslides in the total sample inventory of Sarikhan and Pringle (2005) are represented (Table 2-2).

Jackson Hydroelectric Project
Page 10 Study 22: Sultan River Physical Process Studies Technical Report June 2008
Table 2-2 Landslide sediment production for the lower Sultan River basin,
based on landslide inventory data compiled by Sarikhan and Pringle (2005).
Mass sediment production1 (t/yr)
Unit-area sediment production rate2 (t/mi2/yr)
Mass-wasting process Total
sediment Coarse
sediment only Total
sediment Coarse
sediment only Shallow landslides3 1,620 661 65 26 Debris flows4 7,859 5,897 314 236 Deep-seated landslides5 7,540 4,376 301 175
Mass wasting TOTAL 17,000 10,900 680 440 1 Mass sediment-production rates assume a 47-year period of record (1958–2005) for shallow landslides and debris flows. 2 Unit-area estimates are based a drainage area of 25 mi2 for the sample landslide inventory considered. 3 Shallow landslide rates assume a) sediment delivery is 100% for all slide areas located within a 300-ft stream buffer; b) maximum landslide depth
of 3.0 ft; c) colluvial bulk density of 0.05 t/ft3; and d) coarse:total ratio of 0.41 (based on the large data set of Reid 1981). 4 Debris flow rates assume a) sediment delivery is 100% for all debris flows terminating within a 300-ft stream buffer; b) average depth of 5.7 ft; c)
colluvial bulk density of 0.05 t/ft3; and d) measured coarse:total load ratio of 0.75 (field data, this study). 5 Deep-seated landslide rates assume a) sediment delivery is 100% for toe slopes terminating within a 300-ft stream buffer; b) bank exposure
height of 6 m; c) average colluvial bulk density of 0.05 t/ft3; d) an average mass-movement rate of 0.3 ft/yr (Swanson and Swanston 1977, Swanson et al. 1982, Pyles et al. 1987); and e) measured coarse:total load ratio of 0.58 (field data, this study).
Debris flows Debris slides in colluvial hollows can trigger rapid debris flows and torrents that transport thousands of cubic meters of colluvial and alluvial material in a slurry of water-laden sediment and organic debris (Benda et al. 2005). Debris flows typically scour hillslopes and incorporate additional material along steep channelized tracks. Where they stop, debris fans represent an important area of temporary sediment storage and can affect channel and valley-floor morphology at deposition sites for decades.
Field observations by Stillwater Sciences verified several debris-torrent deposits and run-out tracks associated with large, older flows in the lower Sultan River basin. Volumetric estimates and sediment characteristics were documented for several debris flow scars and used to estimate an average scour depth and a coarse:total ratio for the sediment delivered to the lower Sultan River by this process.
Debris flows represent 53% of the total sample inventory of Sarikhan and Pringle (2005) and are predominantly located along the left bank of the steep inner gorge of PR 2 and PR 3. To calculate the total mass of sediment delivered by debris flows under current conditions, we multiply the total area for all debris flows terminating within 300 ft (100m) from the stream channel by an average landslide depth of 5.7 ft (1.75m) and an average colluvial bulk density of 0.05 t/ft3 ( 1.5 t/m3). Approximately 13% of all debris flows mapped in the sample inventory terminate within the stream buffer. Under these assumptions, about 7,860 t/yr of sediment is delivered to the lower Sultan River from debris flow processes (Table 2-2).

Jackson Hydroelectric Project
Study Plan 22: Sultan River Physical Process Studies Technical Report Page 11 June 2008
Deep-seated landslides Deep-seated landslides are widespread, complex geomorphic features that persist through gradual mass movement of weak bedrock (Swanson et al. 1982, Selby 1993, Cruden and Varnes 1996). Deep-seated landslide morphology is characterized by arcuate scarps, flat-lying and backtilted blocks, benched topography, and lobate accumulation zone with uneven surface topography and irregular drainage patterns (Swanson et al. 1982, Selby 1993, Cruden and Varnes 1996, Roering et al. 2005). In the Sultan River watershed, Sarikhan and Pringle (2005) classified most hillslope failures occurring below the dominant vegetative rooting depth as deep-seated landslides. Streamside toe slopes of deep-seated landslides are often oversteepened by undercutting, fluvial dissection, and slope failure.
Deep-seated landslides represent approximately 22% of the total sample inventory and are rather evenly dispersed along both the right and left channel banks downstream of the Diversion Dam. To calculate sediment production from deep-seated landslides, we assumed direct delivery of sediment along the length of the channel that intersected the deep-seated feature. An average bank exposure height of 5.5 m at the toe of deep-seated landslides was estimated based on field observations, and a soil density of 0.05 t/ft3 (1.5 t/m3) was assumed (Swanson and Swanston 1977).
Regional monitoring studies across the Pacific Northwest indicate widely varying movement rates for deep-seated landslides. Published annual mass movement rates (Swanson and Swanston 1977, Swanson et al. 1982, Pyles et al. 1987) for monitored earthflows ranged from 0.02 to 0.8 ft/yr (0.005 to 0.250 m/yr); we applied an average rate of 0.3 ft/yr (0.084 m/yr) to the deep-seated landslides mapped by Sarikhan and Pringle (2005). Nearly 82% of all deep-seated landslides in the total sample inventory are found within the 100-m buffer of the channel network, and we estimate 7,540 t/yr (6,840 metric tons/yr) of sediment is delivered to the lower Sultan River by this process (Table 2-2).
A total annual sediment input of about 17,000 t/yr (15,440 metric tons/yr) is thus estimated, using the measurement and parameter assumptions discussed above. The calculated unit-area sediment-production rate from all mass-wasting processes is therefore 680 t/mi2/yr (250 metric tons/km2/yr) for the lower Sultan River basin.
Rock avalanches Rock avalanches or debris topples are an important, though relatively infrequent, contributor to the sediment budget in the Sultan River. These types of slides typically catastrophically fail in dramatic fashion. The deposits are relatively small and they erode in place slowly. Most of the erosion takes place in the first season after the slide event and thereafter erosion rates rapidly decline. Typical long-term erosion rates of coarse grained slides range from 4–51 in/yr (.1-1.3m/yr) (Brummer 2006, pers. comm. 2007). Therefore, they do not contribute much to the total bedload in any one year, particularly on the short time scale of the Project history. For example, a notable rock avalanche occurred at ~RM 7.8 in 2004 (the “Marsh Creek Slide”). The original failed volume of this slide was about 14,500 yd3 (13,259m3) After one season only about 588 yd3 (538m3) of the slide volume had eroded; the slide surface had coarsened preventing further

Jackson Hydroelectric Project
Page 12 Study 22: Sultan River Physical Process Studies Technical Report June 2008
erosion of the underlying deposit (Brummer pers. comm. 2007). For the sediment input study, rock avalanches and rock topples are treated as a negligible contributor to the total sediment input into the Sultan River. Rock avalanche deposits are much more important as roughness elements in the channel than as contributors to bedload.
2.1.1.3.2 Uncertainty in the sediment-delivery estimate To explore how uncertainties in the various parameters and assumptions affect sediment production and delivery estimates we conducted a basic sensitivity analysis. This involved varying one parameter (such as the sediment-delivery ratio) over a realistic range of values while holding all other parameters constant (e.g., landslide depth and bulk density). This was not a formal statistical analysis based on a propagation of errors, but simply an effort to acknowledge and to quantify the fact that the average values presented in this report represent ranges of credible values. The approach used is best described as a rapid evaluation of sediment input in the sense of Reid and Dunne (1996), which we deem sufficient to the needs of this report. To arrive at results with tighter estimates of actual sediment inputs would require detailed research beyond the scope of the present study.
2.1.1.3.3 Sediment delivery ratio In the above calculations 100% delivery was assumed for all mapped debris flows and shallow landslides occurring within 300-ft (100 m) from the mainstem and tributary stream channels. Of the subset of landslides within the boundary, visual inspection shows that this assumption is reasonable if we assume that the mapping is accurate and that all of the landslide material that fails is delivered to the channel. If low and high sediment-delivery ratios were assumed for all shallow landslides and debris flows, a range of sediment input would result. Similarly, to consider variations in sediment delivery for deep-seated landslides we must first assume that mass movement rates represent a reasonable proxy for sediment delivery. If mass movement rates of 0.02 ft/yr (.006m/yr) to 0.8 ft/yr (.24m/yr) (derived from published literature) were applied to deep-seated toe slopes that intersect the 300-ft (100 m) stream buffer, holding all other parameters constant, a result of total landslide production would generate a range of about 190 t/mi2/yr (306 metric tons/km2/yr) to 1290 metric tons /mi2/yr (2076 metric tons /km2/yr).
2.1.1.3.4 Landslide depths Landslide production estimates are proportional to the assumed average landslide depth. We have applied the observed depth of 5.7 ft (1.7m) for shallow landslides. Limited field observations indicated a minimum depth of 1.5 ft for shallow landslides. Therefore, a range of landslide depths from 1.5 – 5.7 ft (.46–1.7m) would result in a range of mass sediment production from shallow landslides of about 540 –1,620 t/yr (490 to 1,475 metric tons/yr).
Similarly, limited field observations suggest a maximum bank exposure height of ~30 ft (9m) for deep-seated landslides. If we consider slope failure occurs below the rooting depth of the dominant vegetation as criteria for classifying deep-seated landslides, then

Jackson Hydroelectric Project
Study Plan 22: Sultan River Physical Process Studies Technical Report Page 13 June 2008
we can assume that the minimum bank exposure height is equal to or greater than that rooting depth, ~6 ft (1.8m) for deep-seated landslides. We assumed the average exposure height of 18 ft (~5.5 m) as a representative proxy for widely variable slide depths along streamside toe slopes. Therefore, a range of bank exposure heights from 6 to 30 ft (1.8 to 9 m) would result in a range of mass sediment production from deep-seated landslides of about 2,510 to 12,570 t/yr (2,204 to 13,228 metric tons/yr).
The selection of landslide depth is most important when evaluating sediment input from debris flows which are the single largest component of the mass-wasting sediment budget. By assuming an average soil depth across the entire area of a debris flow, we are averaging the variations in sediment entrainment that typically occurs from the landslide initiation zone down the debris flow track. Our field observations indicated a minimum landslide depth of 1.5 ft (.5m) for the initiation zone and a maximum depth along the torrent track of 9.0 ft; our average depth of 5.7 ft (1.7m) assumes a uniform transition between the two. If these values represent actual end-members of the possible distribution of average depths, mass sediment input from debris flows could range from about 2,200 to 12,570 t/yr (2,000 to 12,000 metric tons/yr). Variations in landslide depths of these magnitudes would result in a range of total landslide inputs of about 190 t/mi2/yr (306 metric tons /km2/yr) to 780 t/mi2/yr (1255 metric tons/km2/yr).
2.1.2 Sediment Transport Capacity (EASI) The sediment transport capacity of a river is an important component of the watershed mass balance. Comparing relative magnitudes of sediment input and sediment flux through the river should help to discern if different reaches of the river are aggrading, degrading, or in balance over time, and provide a basis for interpreting independent measures of riverine condition.
2.1.2.1 Methods 2.1.2.1.1 EASI modeling 2.1.2.1.2
The Enhanced Acronym Series with Interface (EASI) is a bedload transport model for gravel bedded rivers adapted from the Acronym Series of Gary Parker (1990a), which incorporates the surface-based bedload equation of Parker (1990b). The model uses grain-size distribution, channel slope, channel width, and historical discharge records to generate a bedload transport rating curve and a long-term average bedload transport capacity. It can also estimate the long-term average bedload transport rate that can be used to guide subsequent gravel augmentation projects. A more detailed description of the model and its assumptions is provided in Appendix A.
The model assumes an unlimited supply of sediment, which is why it provides quantitative estimates of capacity rather than the actual sediment transported. If supplies are abundant, these two values are the same, but if sediment is limited then the actual amount transported will be limited by what is available. The consequences of such an imbalance will be explored in the next section.

Jackson Hydroelectric Project
Page 14 Study 22: Sultan River Physical Process Studies Technical Report June 2008
The model was run for three scenarios, based on reach-average discharge and stream gradient. Each run consisted of a comparison of sediment transport capacity between pre-Stage 2 and Stage 2 daily discharge data at each of the three sites. The first scenario was for PR 1 (RM 0 to RM 3). The daily discharge data for the pre-Stage 2 run was supplied from the Sultan River gage near Sultan (12138000; 1911–1931); the daily discharge data for the Stage 2 run was supplied from the Sultan River gage below the Powerhouse (12138160; 1983–2007). The second scenario was for PR 2 (RM 3 to RM 11. The daily discharge data for the pre-Stage 2 run was supplied from the Sultan River gage near Chaplain Creek (12138150; 1974–1984); the daily discharge data for the Stage 2 run was supplied from the Sultan River gage below the Diversion Dam (12137800; 1983–2007). Finally a scenario was done for PR 3 (RM 11 to RM 16.5). The daily discharge data for the pre-Stage 2 run was supplied from the Sultan River gage near Startup (12137500; 1934–1971); the daily discharge data for the Stage 2 run was supplied by R2 Resource Consultants (written communication 12/2007) and was modeled based on the Sultan River gage below the Diversion Dam (12137800; 1983–2007). The locations and supporting information of the USGS gages is presented in Table 2-3.
Table 2-3 Current and historic USGS gaging stations within the Sultan River Basin (table from Study 23).
The gradient of channel segments bounded by 20-foot contour intervals were derived from the LiDAR and then averaged for each of the process reaches. It was assumed that reach average gradient did not change between pre-Stage 2 and Stage 2; therefore, gradient was the one input parameter that was not varied between model runs.
Variation in sediment transport capacity within the two model runs (i.e., pre-Stage 2 and Stage 2) of each scenario was bracketed by using a range of bed-surface particle sizes based on 2007 pebble counts. Bracketing in this way gives a range of sediment transport capacity that spans the variation in bedload particle size for the entire reach that was modeled. Comparison of the 2007 particle size ranges with previous studies

Jackson Hydroelectric Project
Study Plan 22: Sultan River Physical Process Studies Technical Report Page 15 June 2008
(GeoEngineers 1984, R2 2006) indicates that reach-average sediment size ranges are similar between pre-Stage 2 and Stage 2.
Variation between each of the two runs for given scenario was derived by variations in the daily discharge data and channel dimensions. Differences in the record of daily discharge between pre-Stage 2 and Stage 2 reflect how operation of the Project has changed the pattern and magnitude of discharge available to transport sediment. The effects of the variation in discharge are therefore central to the investigations of this study.
Channel dimensions, however, also determine sediment transport capacity. For this study, channel width was measured from air photos in a GIS. Based on these measurements, variation in channel width was applied to the PR 1 site, the only one with significant variations across the years of data. In this reach, encroachment of vegetation into areas of previously active channel has effectively narrowed the channel (see the results in the channel planform study, section 2.2.2.2.1). Therefore, Stage 2 operations were modeled using a narrower channel width in PR 1.
2.1.2.1.3 Tracer rocks Tracer rock studies in the Sultan River will be used as an empirical check on predicted estimates of incipient motion of the bedload of the river. Incipient motion is defined as initiation of movement of the particles that make up the bedload and is typically associated with characteristic discharge. Below this characteristic discharge, most of the bed is static and above this discharge the bed begins to mobilize and translate downstream.
Transects of tracer rocks were deployed at four sites in the Sultan River throughout the study area. One transect each at each detailed study site, and one transect at the upstream end of the Diversion Dam pool. An additional “patch” of tracer rocks was installed immediately downstream of the Diversion Dam. The tracer transect for the upper site was located approximately 500 feet (150m) upstream of the detailed survey site to a location more suitable for tracer rocks studies. Transects of tracers were located along the surveyed cross sections at the detailed study sites. A tape was stretched between pins and tracer rocks were installed in the void left by removing a similarly sized rock from the bed. The tape-position and the distance upstream or downstream from the tape were recorded at the time the tracers were installed. The additional patch of tracer consisted of rocks from the pool of tracers that remained after installation of the tracer transects. The of tracer patch serves as an additional qualitative measure of particle movement, since no precise measurement of the tracer rock locations in the patch were made.
Tracer rocks consisted of painted rocks that were previously selected from the bed of the Sultan River whose size distribution was in the range of the D50 to D85 of the particles at the location of each tracer transect. Essentially, rocks in each tracer transect were matched to the range of size between the characteristic grain size (the D50 or median) and the largest typically mobile grain size (the D85).

Jackson Hydroelectric Project
Page 16 Study 22: Sultan River Physical Process Studies Technical Report June 2008
The tracer studies were timed to other flow-related studies in the river to maximize efficiencies. Within PR 3, three flow releases of 305, 680, and 880 cfs were conducted in association with Study Plan 14 (the flow recreation study). Rainfall was considerable (up to 2.5” in 24 hours) during these releases adding substantial flow to downstream reaches (PR 2 and PR1). After each flow release, direct observations of the whether or not any tracers were displaced were made.
Results During the 2007 field season, no tracers were observed to have moved. Observation of the tracer transects will be made during the summer of 2008 if winter flood flows have occurred.
2.1.2.1.4 Pebble counts During the 2007 field season pebble counts completed as part of the physical processes study were targeted at collecting data as inputs into the EASI sediment transport model and for the tracer study. The method used for the pebble counts is a form of the Wolman (1954) approach as described in the1984 GeoEngineers report. A total of seven pebble counts distributed among the detailed study sites and the Diversion Dam were collected. These pebble count data are presented in Appendix C.
Pebble counts were also completed as part of the habitat study. Generally speaking the pebble counts from the habitat study represent the size distribution of patches of obviously mobile deposits of gravel, which overlie a coarser bed. These patches of mobile sediment are likely to have different particle size distribution that the bed as a whole.
During the 2008 field season, pebble counts at each of the 1984 GeoEngineers sites will be completed for direct comparison of the particle size distributions. As a cautionary note, all of the detailed study sites have changed in fundamental ways, which make comparison of the size distributions from 1984 to the present a qualitative exercise at best. For example, at the Kien’s Bar and Chaplain Creek sites the formerly exposed bars where the pebble counts took place are now covered in riparian vegetation, and do not appear to have been mobilized and rebuilt since Stage 2 operations began. Basically, these bars are no longer sampling the bedload in the way they were in 1983 when the GeoEngineers pebble counts were made. The upper study site may be more comparable, but there remains uncertainty in the distribution and size of gravel patches between 1983 and 2008. Vegetation encroachment is also an issue at the upper study site.
2.1.2.2 Results EASI model results (Table 2-4) can be summed up in four main points:
1) With constant channel geometry, the sediment transport capacity in the alluvial reach (PR 1) is similar between pre-Stage 2 and Stage 2; within model precision, this capacity has not changed.

Jackson Hydroelectric Project
Study Plan 22: Sultan River Physical Process Studies Technical Report Page 17 June 2008
2) Changes in the transport capacity of the alluvial reach (PR 1) are largely a consequence of changes in channel geometry, not flow modification.
3) Flow modifications have dramatically reduced the sediment transport capacity in PR 2 and PR 3 during Stage 2 relative to pre-Stage 2 operations, but it remains one to two orders of magnitude higher than the transport capacity of PR 1.
4) Changes in sediment transport capacity have been most affected by the magnitude and frequency of large floods (see EASI model output in Appendix B).
Table 2-4 Summary output of the sediment transport modeling for the Sultan River.
Site name
Contemporary range of average annual
sediment transport capacity (1000
tons/year)
Historical range of average annual
sediment transport capacity (1000
tons/year)
Contemporary range of average annual
sediment transport capacity using 1983 channel width (1000
tons/year)
Kien’s Bar (PR 1) 0.7–12 0.2–9 0.01–3.5
Chaplain Creek (PR 2) 30–150 3500–12100 NA
Upper Site (PR 3) 200–300 2200–4030 NA
2.1.3 Cross-section Re-surveying 2.1.3.1 Introduction and objectives
In-channel sediment storage provides a buffer between hillslope erosion processes that deliver sediment to stream channels (input) and sediment-transport processes that export sediment from the river (output). Measuring rates of sediment aggradation or degradation can allow us to evaluate the critical physical processes that form and maintain channel and floodplain habitats, bracket the plausible values of sediment yields, and examine the potential net effects of modifications to flow and sediment dynamics, including hypdroelectric projects. One rapid method of evaluating long-term changes in sediment storage is to re-occupy cross-sections and compare historic to present conditions. Surveying the bathymetry of a reservoir deposit over the course of one or several high flow seasons can evaluate sediment yield and transport as a function of hydrologic conditions, which can be a useful tool in assessing the effects of flow regulation on sediment-transport dynamics.
The objectives of this phase of the study were to:

Jackson Hydroelectric Project
Page 18 Study 22: Sultan River Physical Process Studies Technical Report June 2008
1) Obtain empirical data on changes in channel cross-section elevation and geometry over the past two decades since the start of Stage 2.
2) Determine current sediment yield at one location in the watershed for a high-flow season, through measurement of reservoir bathymetry.
2.1.3.2 Methods 2.1.3.2.1 Cross-section re-surveying
Cross-sections were surveyed in June 2007 at existing monitoring sites surveyed as part of the GeoEngineers study from the early 1980’s. In total, five cross-sections were surveyed at three sites: three cross-sections were surveyed at the Kien’s Bar site (located at RM 1.1), one cross-section was surveyed at the Upper site (located at RM 10.0), and one cross-section was surveyed at the Chaplain site (located at RM 5.2). The exact location of the original GeoEngineers cross-sections could not be reoccupied as they were not monumented, so approximate cross-section locations were located from schematic drawings and surveying benchmarks (e.g., large boulders and tree stumps) included in the 1984 GeoEngineers report. We estimate that we resurveyed within approximately 6 ft of each of the 1984 cross-section locations. As it was not possible to obtain the numeric cross-section data from the GeoEngineers study, the elevation data had to be extracted from scaled cross-section plots in the 1984 GeoEngineers report.
The cross-sections were surveyed with a total station and prism following standard geomorphic surveying protocols (Harrelson 1994). For each cross-section surveyed, rebar endpins were driven to a secure depth on each bank, capped, and marked for future identification. The rebar endpins were placed in the approximate location of the presumed start/end of the GeoEngineers surveys and were the first and last point surveyed for each cross-section. To match the GeoEngineer’s data, all dimensions were recorded in feet. Elevation measurements were taken approximately every 3–5 ft or at significant breaks in slope to ensure that small-scale elevation changed and microtopographic bedforms were accurately captured. All benchmarks included in the GeoEngineers surveys were re-surveyed as part of this surveying to ensure that both surveys has a common datum and so any changes in channel elevation and dimension could be properly captured.
During surveying efforts, strict quality assurance standards were followed to ensure accuracy of 0.2 in (5 mm) at all points, including control points and backsights. The accuracy was to be verified by closing out each site survey with a “close-out loop” to ensure the initial and final control point elevation measurements were within 0.2 in. The instrument level was also checked at least every 10 minutes. In the rare event that the instrument was moved or other technical problems occurred, all data collected up to that moment were discarded and all shots, including the control points, were re-surveyed.

Jackson Hydroelectric Project
Study Plan 22: Sultan River Physical Process Studies Technical Report Page 19 June 2008
2.1.3.3 Results 2.1.3.3.1 Re-occupied cross-sections Kien’s Bar
The channel at the Kien’s Bar study site shows clear indications of geomorphic change since the early 1980’s. At the downstream-most cross-section (XS 1), the channel bed elevation has remained relatively static since the GeoEngineers survey, with a maximum thalweg elevation difference of approximately 1.4 ft (.4m), but the thalweg position has moved toward the left bank, which has retreated by approximately 21.5 ft (6.6m). The right bank has remained static (Figure 2-2). At the two cross-sections farther upstream at this site (XS 2 and XS 3), the thalweg has also migrated towards the left bank with associated left-bank erosion, but the lowering of the thalweg is more pronounced than at XS 1: the thalweg elevation has decreased approximately 2.5 ft (.76m) at XS 2 (Figure 2-3) and approximately 2.7 ft (.8m) at XS 3 (Figure 2-4).
190
195
200
205
210
215
0 20 40 60 80 100 120 140 160 180 200 220 240
distance from left bank (ft)
rela
tive
elev
atio
n (ft
)
1984 survey
2007 survey
Rock BM
Figure 2-2 Cross-section comparison at the Kien’s Bar Site, XS 1. Elevation is
relative to the Rock BM elevation (200 ft) given in the 1984 GeoEngineers survey.

Jackson Hydroelectric Project
Page 20 Study 22: Sultan River Physical Process Studies Technical Report June 2008
194
196
198
200
202
204
206
208
-10 40 90 140 190 240
distance from left bank (ft)
rela
tive
elev
atio
n (ft
)
1984 survey
2007 survey
21.49 ft
Figure 2-3 Cross-section comparison at the Kien’s Bar Site, XS 2. Elevation is
relative to the Rock BM elevation (200 ft) in XS 1. Due to the lack of surveying benchmarks at this location from the 1984 GeoEngineers survey, the two cross-sections were aligned in the horizontal based on the measured bank retreat of 21.49 ft at XS 1. Note change in Y-axis scale relative to Figure 2-2.
194
196
198
200
202
204
206
208
-10 40 90 140 190 240
distance from left bank (ft)
rela
tive
elev
atio
n (ft
)
1984 survey
2007 survey
21.49 ft
Figure 2-4 Cross-section comparison at the Kien’s Bar Site, XS 3. Elevation is
relative to the Rock BM elevation (200 ft) in XS 1. Due to the lack of surveying benchmarks at this location from the 1984 GeoEngineers survey, the two cross-sections were aligned in the horizontal based on the measured bank retreat of 21.49 ft at XS 1.

Jackson Hydroelectric Project
Study Plan 22: Sultan River Physical Process Studies Technical Report Page 21 June 2008
Chaplain Site Comparison of the elevations from the early 1980’s and current conditions at the Chaplain site show essentially no change in overall channel elevation (Figure 2-5). The channel thalweg position has shifted towards the center of the channel since the GeoEngineers survey, but the average channel depth has changed by less than 1 ft in the past 23 years.
190
195
200
205
210
-20 0 20 40 60 80 100 120 140 160 180 200 220 240 260
distance from left bank (ft)
rela
tive
elev
atio
n (ft
)
1984 survey
2007 survey
Figure 2-5 Cross-section comparison at the Chaplain Site. Elevation is relative to the Rock BM elevation (200 ft) given in the 1984 GeoEngineers survey.
Upper Site Comparison of channel elevations from the early 1980’s and current conditions at the Upper site shows that there has been little change in channel bed elevation (Figure 2-6). Some erosion of the right bank is possible between the two years, either a result of stream-bank landsliding or a slight mismatch in the location of the reoccupied survey.
The channel thalweg position has remained relatively static and the thalweg elevation difference between the two surveys is less than 1 ft (.3m). Although there has been little elevation change within the channel bed, there has been noticeable erosion of the right bank debris flow deposit that was emplaced shortly before the 1984 GeoEngineers survey. Between 1984 and 2007, the right bank (above the low-water elevation) has retreated by an average of 12 ft (3.7m), with a maximum at-a-station retreat of 18 ft

Jackson Hydroelectric Project
Page 22 Study 22: Sultan River Physical Process Studies Technical Report June 2008
(5.5m). The elevation of the deposit within the area surveyed (approximate bankfull channel) has decreased by an average of approximately 3.1 ft (.9m), with a maximum point elevation change of over 4 ft (1.2m).
390
395
400
405
410
415
0 20 40 60 80 100 120 140 160 180 200 220
distance from left bank (ft)
rela
tive
elev
atio
n (ft
)
1984 survey
2007 survey
BM 1BM 2
Figure 2-6 Cross-section comparison at the Upper Site. Elevation is relative to
the BM 1 and BM 2 elevations derived from the 1984 GeoEngineers survey plot.
2.1.4 Diversion Dam Pool Sediment Study 2.1.4.1 Methods
A bathymetric survey of the reservoir sediment deposit behind the Diversion Dam was conducted in conjunction with the cross-section re-surveying effort. The bathymetric survey included nine cross-sections, located approximately 30 (9m) to 280 ft (85m) upstream of the dam (at head of the reservoir deposit). Cross-sections were monumented with rebar endpins driven into the bank several feet above the reservoir water surface. Elevations above the water surface were measured using the total station and prism, following the same protocols used in the cross-section re-surveying effort. Below the reservoir water surface, elevations were determined along each cross-section from depth measurements. At each cross-section, depth from the water surface to the reservoir sediment deposit was measured with a weighted line approximately every 5 ft (1.5m). The depth measurements at each cross-section were then converted to elevation by subtracting the depth measurements from the water surface edge elevation measured with total station and prism. The converted depth measurements were then combined with the surveyed cross-section elevation measurements to result in a topographic surface of the reservoir deposit and bars/banks outside the low-flow channel and within the bankfull channel. These data will be compared with data collected during the summer 2008 as an empirical indication of sediment yield in the Sultan River watershed over the course of

Jackson Hydroelectric Project
Study Plan 22: Sultan River Physical Process Studies Technical Report Page 23 June 2008
the water year (WY) 2008 high flow season. If during th e2008 water year no flows large enough to mobilize sediments occur, the diversion dam survey will give no insight into annual rates of sediment transport.
2.1.4.2 Results The current bathymetry for the deposit behind the Diversion Dam, including the survey point locations, is shown in Figure 2-7. These data show a maximum of 8 ft (2.4m) elevation relief over the 280-ft (85m) distance between the cross-section closest to the dam (XS 1) and the most upstream cross-section (XS 9). The current front of the depositional reservoir deposit appears to be at XS 2; between XS 1 and XS 2, the thalweg elevation rises steeply by approximately 5 ft (1.5m), whereas the thalweg elevation increases by only 3 ft (.9m) over the much longer distance from XS 2 to XS 9. Comparison of these data with WY 2008 bathymetric data will help constrain the estimates of annual rates of sediment transport and delivery from the watershed upstream of the study site.
DAM

Jackson Hydroelectric Project
Page 24 Study 22: Sultan River Physical Process Studies Technical Report June 2008
Figure 2-7 Reservoir bathymetry for the sediment deposit behind the Diversion Dam (July 2007). The solid blue lines indicate the water surface elevation at the time of measurement.
2.1.5 Mass Balance 2.1.5.1 Introduction
The Mass Balance Study integrates the results of the work on sediment delivery and transport that have been developed by the two studies presented above. This integration can provide a quantitative estimate of average annual net aggradation and/or incision in the Sultan River in PR 1, PR 2, and PR 3. The results of the Mass Balance Study can be used to assess how any observed changes in planform (section 2.2.2.2.1) may be related to changes in channel sediment storage, and its estimates can be compared directly with the results of the channel cross section data at the sites presented below.
2.1.5.2 Results The results of the mass balance study are summarized in Table 2-5. Both PR 2 and PR 3 have excess capacity relative to their inputs, and they should be readily transporting all sediment delivered to them. In PR 1, sediment accumulation depends on the grain size being evaluated. The EASI model run on coarse-grained bedload in PR 1 yields the low value of transport capacity shown and suggests that such sediment should accumulate; the model run on fine-grained bedload (high value) suggests full transport of the supplied sediment.
Table 2-5 Summary of mass balance of sediment transport capacity and sediment input for the Sultan River.
Site Name
Contemporary range of
average annual sediment transport
capacity (1000 tons/year)
Historical range of average annual
sediment transport
capacity (1000 tons/year)
Average annual
sediment input (1000 tons/year)
Estimated modern range
of mass balance (1000
tons/year) (values > 0 = deposition)
Kien’s Bar (PR 1) 0.7–12 0.2–9 ~11 -1 to 10 Chaplain Creek (PR 2) 31–151 3497–12142 ~11 -140 to -20 Upper Site (PR 3) 198–301 2202–4026 ~6 -295 to -195 The relative magnitude of predicted sediment input and sediment transport should be reflected in the morphology of the channel, because sediment balance is a critical determinant of channel form. Where transport capacity greatly exceeds sediment supply, channels are generally scoured down to bedrock. An alluvial cover is present only where roughness elements have locally reduced transport capacity, leading to local deposits of

Jackson Hydroelectric Project
Study Plan 22: Sultan River Physical Process Studies Technical Report Page 25 June 2008
sediment. Where transport capacity is less than or roughly in balance with supply, a well-developed alluvial form would be expected; any long-term changes in the channel grade would depend on the potential for floodplain sediment storage. The resurveyed cross sections at Chaplain Creek and Upper Site are entirely consistent with our observations of a sediment-limited, bedrock-floored channel with a rapid flux of sediment and minimal opportunity for long-term storage.
The cross-sectional change at Kien’s Bar, however, suggests a modest but systematic condition of long-term excess transport capacity as well. With additional 1984 survey locations the possibility that this change is an artifact of local hydraulics could be evaluated; with available data, we can infer only that the supply imbalance in PR 1 is on the order of 1 kiloton/yr (i.e., based on 100 ft erosion depth x 102 ft channel width x 104 ft reach length) over the 23 years between surveys. This correspondence with the integration of the sediment-supply and sediment-transport studies, namely that the total imbalance between them in the alluvial reach is a scant fraction of their independently predicted values, is consistent with the observed geomorphic conditions of the river and suggests that the overall characterization of sediment-transport conditions is correct.
2.2 Channel Dynamics
2.2.1 Island and Side Channel Formation 2.2.1.1 Introduction
Side channels have been identified as an important element of aquatic habitat in alluvial rivers, and the Sultan River in no exception. An understanding of the processes that form and maintain side channels is essential for long-term management of aquatic habitat in the Sultan River. The characteristics and geomorphic processes that form islands and side channel features are closely allied, and reflect complex interactions between discharge, sediment load, large woody debris, and riparian vegetation (Abbe and Montgomery 1996, Gurnell et al. 2001, Collins and Montgomery 2002a, Gurnell et al. 2002, Montgomery and Abbe 2005, Naiman et al. 2005, Beechie et al. 2006). Characteristics and rates of channel meander migration play an integral role in the formation of islands and side channels. In turn, the dominant channel pattern of a river is the expression of these complex interactions (Beechie et al. 2006).
2.2.1.2 Progressive meander migration The progressive downstream migration of a meander bend occurs over time via the gradual erosion of the outside bend (i.e., concave in planform) or bank and subsequent deposition along the inside bank on the point bar. Erosion on an outside bank is generally balanced by point bar deposition on the corresponding inside bank such that channel width remains roughly constant as the river shifts both laterally and in the downstream direction on its floodplain (Lawler 1993). As a general rule, rates and patterns of progressive migration reflect the balance between (1) shear forces of flow at the bank and (2) the resistance of bank and floodplain materials to erosion (Ikeda et al 1981, Howard and Knutson 1984). Compared to inside bends, outside bends typically have greater depths and velocities, and higher shear forces acting along the toe of the

Jackson Hydroelectric Project
Page 26 Study 22: Sultan River Physical Process Studies Technical Report June 2008
bank. These sites typically exhibit relatively rapid progressive migration rates (Thorne 1992). Channel curvature (i.e. radius of curvature) is another important regulator of shear forces acting on channel banks (Johanesson and Parker 1989), with higher curvature corresponding to locally higher rates of bank erosion (Nanson and Hickin 1986, Furbish 1988).
2.2.1.3 Dynamics of cutoff and side-channel habitat formation Another characteristic of unconfined alluvial river valleys is the formation meander cutoffs that create islands and side channels. Rates and patterns of progressive migration control the generation of bends and regulate their geometry, which in turn influences their susceptibility to cutoff. As discussed in the preceding section, rates of progressive migration are thought to generally increase with curvature. But this may be true only up to a point. At high curvatures, above a certain threshold, bends can become so tight that they generate backwater effects which reduce the energy available for bank erosion (Hickin and Nanson 1984, Furbish 1988). In bends such as these, increases in flow may increase water depths enough to initiate overbank flow, thus leading to erosion on the floodplain and potentially initiating chute cutoff (side channel)—a rapid shift in channel alignment due to sediment scour on the floodplain.
2.2.1.3.1 Cutoff formation processes Channel cutoffs generally occur via the following sequence of processes:
1. Over-bank flows carve a "probe" channel—a precursor to the chute—to be scoured across the floodplain.
2. The probe develops to the point where it connects an upstream point of a sinuous bend with a point further downstream, which provides a shortcut for the mainstem flow.
3. If overbank flow is deep enough and persists for long enough, the probe may expand into a complete cutoff (capturing all of the river's flow). The expansion is generally thought to progress by upstream migration of a knickpoint (point of differential elevations), which is typically initiated by oversteepening and mass failure at a plunge-pool were the probe initially rejoins the mainstem (Gay et al. 1998).
Probes that span the entire bend from one (upstream) inflection point to the next (downstream) become complete chute cutoffs (or side channels). Probes that cross only a portion of the bend will become partial cutoffs (or backwaters). Over time, chute cutoffs may capture most of the flow carried by the river and so become the main channel. In other instances the chute cutoffs remain subsidiary to the main channel and are may be flushed only every few years during floods with enough discharge to fill them. In either case the subsidiary channel is considered to be side channel habitat.
2.2.1.4 Island Formation Broadly speaking, vegetated islands are formed in rivers by either excision of a portion of the floodplain by channel cutoffs (Knigton 1998) or by accretion of sediment to form a mid-channel bar where riparian vegetation colonizes and over time becomes well

Jackson Hydroelectric Project
Study Plan 22: Sultan River Physical Process Studies Technical Report Page 27 June 2008
established (Gurnell et al., 2001). More detailed sub-divisions have been made which include up to eight nuanced variations of the basic cases above (Osterkamp 1998). Historically, island formation was treated as a pure fluvial process: islands were considered to be expressions of mutual adjustment of sediment load, discharge, and channel slope (Leopold and Wolman 1957, Schumm 1984). From this standpoint, braided channels and anastomosing channels are examples where spontaneous deposition of mid-channel bars and islands, or rampant channel avulsion is the result of dynamic fluvial processes. More recently, there has been recognition of the importance of large woody debris and riparian vegetation recruitment in channel-forming processes in general and vegetated island formation in particular (Collins and Montgomery 2002a, Gurnell et al. 2002, Montgomery and Piegay 2003, Hook 2006). Large woody debris can locally direct river flow into floodplain and erode new channels (Abbe and Montgomery 1996). Alterntively, stable mid-channel deposits of wood can provide the foundation for new island development and establishment of riparian vegetation (Gurnell 2001).
2.2.1.5 Channel Pattern Fundamentally, rivers are dynamic systems that transport, store, and route the sediment (i.e. gravel and LWD) and water supplied to them over time (“the fluvial system” of Schumm 1977). These supplies of wood, water and sediment vary as a matter of localized processes and large natural disturbances that play out over thousands of years. The channel pattern of any river is therefore a top-level manifestation of the interplay of physical and riparian process taking place in the fluvial system. Waxing and waning of side channels and islands in a river over time are expected in the dynamic environment of a river floodplain. Sediment supply, discharge, riparian forest dynamics, all play a role in the channel pattern expressed by the river (Leopold 1994, Beechie et al. 2006).
River regulation adds another dimension to channel pattern adjustment in a given fluvial system. In the Sultan River, flow regulation, and to a lesser degree, sediment input rates have been altered following construction of the original Culmback Dam. General predictions about the channel adjustments that result from changes in sediment or water supply can be made. In practice, however, actual adjustments may either be at odds with predictions, or the changes that have taken place are so localized or subtle that statements about what has happened are sometimes equivocal (Ligon et al. 1995, Grant et al. 2000, Petts and Gurnell 2005).
2.2.2 Channel Planform and Terrace Mapping 2.2.2.1 Introduction
Channel morphology and changes over time reflect fundamental physical processes involving sediment, water, wood input, transport, and deposition. Rates of channel migration, channel avulsion, and island formation control the rate of floodplain turnover, riparian forest succession, and large wood recruitment to the river corridor (Beechie et al. 2006). Channel migration, channel avulsion, and island formation is in turn controlled by the interplay between hydrology and sediment dynamics.

Jackson Hydroelectric Project
Page 28 Study 22: Sultan River Physical Process Studies Technical Report June 2008
To aid in identification of channel changes over time, a time series of historical aerial photographs were be evaluated, digitized, and geo-referenced using GIS to provide base maps to analyze channel pattern change. Boundaries of the active channel for each year were digitized for comparing number of channels, channel width, island and side channel locations and other characteristics between years. These analytical methods are now well accepted for analyzing historical vs. current channel conditions, as described by Collins et al (2003).
2.2.2.2 Methods 2.2.2.2.1 Channel planforms
Digitized channel planforms were generated in a GIS by tracing the channel boundary of the Sultan River depicted in digital, georeferenced aerial photography.
Aerial photographs were selected to correspond with milestones in Sultan River management history, subject to availability. Pre-project conditions are represented by the 1957 aerial photographs. Initiation of Stage 1 (ca. 1964) through initiation of Stage 2 (ca. 1984) is represented by 1965 and 1983 aerial photographs. From Stage 2 to the present, changes in channel conditions are expressed by changes displayed between the 1983 and 2003 aerial photographs. How the aerial photographs were processed varied by year, source, and location of the air photos. Aerial photographs for 1957, 1965, and 1983 were optically scanned and saved as high-resolution tiff files and subsequently rectified in a GIS. The scanned aerial photography was not orthorectified, because rectification alone is satisfactory for linking the aerial photography to a coordinate system in relatively flat terrain as in the lower three miles of the Sultan River. Orthorectification is a systematic correction of the scale and relief displacement in an aerial photograph which accounts for differences in the position of the aircraft and the topography. Rectification is a simpler technique that accounts for only positional difference without correcting for topography. The 2003 aerial photography was already in a digital orthorectified format (GeoTiff) and needed no further processing. A historical USGS topographic map from 1919 was also scanned and georeferenced to provided information on the channel position prior to the 1957 aerial photographs. Once all images were in a GIS, digitizing the channel planform was feasible. The sequence of channel planforms was digitized by tracing the active channel boundary for each year in turn. We defined the active channel as the area of the channel that is generally free of riparian vegetation and is presumably composed of frequently transported alluvium.
2.2.2.2.2 Fill terraces Shaded relief and contours based on LiDAR digital topography guided delineation of fill terraces in the lower three miles of the Sultan River. Terraces within the broad valley bottom were considered to be most important in bounding the river, so high elevation terraces up the valley walls were ignored for this analysis. Boundaries of the top and bottom edges of terrace treads were digitized by tracing the edge of the terrace treads in the GIS, using obvious breaks in slope as boundaries (Figure 2-8).

Jackson Hydroelectric Project
Study Plan 22: Sultan River Physical Process Studies Technical Report Page 29 June 2008
2.2.2.3 Results Between RM 0 to 4 (PR 1 and the lower one mile of PR 2):
1) The present-day channel planform and position has been essentially unchanged since at least 1919 (Figure 2-9).
2) However, between 1957 and 2003, the total area of active channel has diminished by 64 acres (25.8 ha) (from 125 acres (50.0 ha) to 61 acres (24.6 ha), an average of 1.4 acres/yr (5,700 m2/yr). The rate between 1984 and 2003 is the same as that of the entire period (Table 2-6).
3) The lack of observed changes in the channel planform would not be anticipated if high rates of sediment deposition were occurring in this reach.
4) Reduction in active channel area is almost exclusively the result of pervasive vegetation encroachment of the river, and is especially evident in the alluvial reach (PR 1) (Figure 2-10 to Figure 2-13).
5) Habitat presently defined as side channels are actually relict features that were historically part of the active channel, and which have since been encroached by riparian vegetation. Most of the encroachment to form these side channels took place prior to the onset of Stage 2 operations (Figure 2-10 to Figure 2-12).

Jackson Hydroelectric Project
Page 30 Study 22: Sultan River Physical Process Studies Technical Report June 2008
Figure 2-8 Valley bottom terrace mapping in process reach 1. The low terraces represent former channel boundaries, now abandoned by the river.

Jackson Hydroelectric Project
Study Plan 22: Sultan River Physical Process Studies Technical Report Page 31 June 2008
Figure 2-9 The 1965, 1983, and 2003 Sultan River channel planform overlain onto the 1919 USGS topographic map. This figure illustrates how the channel planform of the Sultan River has been relatively stable since before Stage 1 of the Project.
Table 2-6 Active channel area in acres by year in the lower 4 miles of the
Sultan River (i.e., all of PR 1 and the lowermost end of PR 2). Year Area (acres) Year over year change
(%) 1957 125 NA 1965 119 4.4 1983 90 24.4 2003 61 32.0

Jackson Hydroelectric Project
Page 32 Study 22: Sultan River Physical Process Studies Technical Report June 2008
Figure 2-10 Vegetation encroachment of side channel 1 (~RM 0.9) between 1965
and 2003.
Figure 2-11 Vegetation encroachment of side channel 2 (~RM 1.1) and Kien’s Bar
site (RM 1.2) between 1965 and 2003.

Jackson Hydroelectric Project
Study Plan 22: Sultan River Physical Process Studies Technical Report Page 33 June 2008
Figure 2-12 Vegetation encroachment of side channel 3 (~RM 1.8) between 1965
and 2003.
Figure 2-13 Vegetation encroachment at the Chaplain Creek site between 1965
and 2003.

Jackson Hydroelectric Project
Page 34 Study 22: Sultan River Physical Process Studies Technical Report June 2008
2.3 Large Woody Debris Study
2.3.1 Introduction This study was designed to characterize the quantity and pattern of wood loading in the Sultan River below Culmback Dam. We also evaluated the factors that could influence, and perhaps explain, the observed patterns of wood loading. For comparison purposes, our data from the Sultan River are compared to data previously collected from rivers throughout Washington state from the thesis of Martin Fox (2001).
2.3.2 Methods 2.3.2.1 Wood volume estimates
The volume of woody debris was calculated based on wood surveys conducted as part of Study Plan 18. As part of the study, individual piece length and diameter breast height size class were estimated for every piece of wood surveyed in the field for each habitat unit in the entire channel below Culmback Dam. Volume estimates per habitat unit were made by summing the product of length and width of each piece, including pieces in log jams.
To compare wood loading between channels of different size, the length of individual habitat units was normalized by casting it in units of channel width. For this analysis the length and average width of each habitat was derived from the GIS data that were produced for Study Plan 18. The width data for the habitat units derived from the GIS were assumed to be a close approximation of the bankfull width. By dividing the length of each habitat by its average bankfull width, the length of the habitat was converted to units of channel width. For example, if a habitat was 100 feet (30m) long and the bankfull width was 20 feet (6m), then the length of the habitat would be 5 channel widths (CW). The volume of wood per channel width (LWD Volume/CW) was derived by dividing the volume of wood in each habitat by the habitat length in channel widths.
For each mile of river, the volume of LWD per channel width (LWD Volume/CW) was averaged to smooth the data and allow between-reach comparisons of wood loading by river mile throughout the Sultan River below Culmback Dam.
2.3.2.2 Stream power index The original method for this study plan presumed that aerial photographs would have sufficient resolution to observe any changes in LWD loading over time. In practice this was not possible, given the deep shading in the ravine and the relatively small scale of available aerial photographs. The study plan anticipated this possibility, and suggested that stream power (a measure of the river’s ability to do work) might show a useful correlation with LWD loading in western Washington rivers that could be compared to any relationships observed between these two variables in the Sultan River.

Jackson Hydroelectric Project
Study Plan 22: Sultan River Physical Process Studies Technical Report Page 35 June 2008
Stream power “…is an expression for the rate of potential energy expenditure per unit length of channel” (Knighton 1998, Knighton 1999) and is defined by the expression
Ω = γQs,
where γ (=ρg) is the specific weight of water, Q is discharge, and s is slope. The calculation of stream power at a site is relatively straightforward if discharge and slope data are available. In practice, discharge data are usually only available at gaging stations. Therefore, for this analysis we substituted drainage basin area as a surrogate for bankfull discharge (Dunne and Leopold 1978):
Q = eAd,
where A is drainage basin area and e and d are empirically derived constants. The coefficient d commonly ranges in value from 0.7 for dry climates and 1.0 for wet climates (such as the study area) (Dunne and Leopold 1978, Leopold 1994, Rice 1998, Whiting et al. 1999, Brummer and Montgomery 2003).
An index of stream power was used to compare the relative variation in stream power among reaches by setting the coefficient e equal to 1. Drainage basin area was assigned to each stream reach bounded by 20-foot (6m) contour intervals and was derived from a USGS 10 m DEM. Slope derived from 2006 LiDAR DEM was assigned to each 20-foot contour interval reach. From these data, the stream power index for each reach bounded by the 20-foot contour interval was calculated.
2.3.3 Results The pattern of wood loading in PR 2 and PR 3 displays a few prominent characteristics:
1) Average wood volume per river mile is negatively related to an index of stream power in all western Washington Rivers (Figure 2-14). Not surprisingly, larger and more energetic rivers are better able to transport logs.
Overall, wood loading in the Sultan is modestly lower than the median of western Washington rivers, particularly in PR 1 (Figure 2-15 and
2) Table 2-7).
3) Log jams tend to accumulate in low stream-power reaches just downstream of high-stream power reaches (Figure 2-16 and Figure 2-17).
4) Average wood volume is highest when there are log jams present (Figure 2-17).

Jackson Hydroelectric Project
Page 36 Study 22: Sultan River Physical Process Studies Technical Report June 2008
0.10
1.00
10.00
10 100 1000
Stream Power Index
LWD
Vol
/CW
PR3
PR2
PR1
Figure 2-14 Large woody debris volume verses an index of stream power in the
Sultan River in each process reach.
0.001
0.010
0.100
1.000
10.000
100.000
1000.000
1.00 10.00 100.00 1000.00
Bankfull Width (m)
LWD
Vol
ume
per C
hann
el W
idth
LWD Volume/CW in WA Rivers
PR1
PR2
PR3
Figure 2-15 Normalized volume of large woody debris verses bankfull width for
Washington rivers (from Fox 2001) and in the Sultan River by process reach.

Jackson Hydroelectric Project
Study Plan 22: Sultan River Physical Process Studies Technical Report Page 37 June 2008
Table 2-7 Comparison of wood loading in Process Reach 1 and wood loading
in undisturbed rivers with the same range of bankfull widths surveyed by Fox (2001).
PR 1 bankfull width (m) PR 1 mean wood loading
(LWD Volume/CW) Fox 2001 mean wood loading (LWD Volume/CW)
26.0 – 41.0 1.7 (range 0.2 – 4.5) 25.7 (range 4.5 – 150.0)
0.00
1.00
2.00
3.00
4.00
5.00
6.00
16151413121110987654321
River Mile
LWD
Vol
ume/
CW
0
100
200
300
400
500
600
Stre
am P
ower
Inde
x
LWD Volume/CW
Stream Pow er Index
Figure 2-16 Average large woody debris volume and index of stream power by
river mile in the Sultan River.

Jackson Hydroelectric Project
Page 38 Study 22: Sultan River Physical Process Studies Technical Report June 2008
0.00
1.00
2.00
3.00
4.00
5.00
6.00
16151413121110987654321
River Mile
LWD
Vol
ume/
CW
0.00
20.00
40.00
60.00
80.00
100.00
120.00
140.00
160.00
Log
Jam
Vol
ume/
CW
LWD Volume/CW
Log Jam Vol/CW
Figure 2-17 Average large woody debris volume and average log jam volume by
river mile in the Sultan River.
2.3.4 Discussion Wood in river channels is a form of sediment and is subject to transport dynamics in a sense similar to bedload. In reaches with excess capacity, wood transport will be higher than in reaches with less capacity. Interactions among wood pieces, wood loading, and the size of the wood pieces with respect to the channel width also play a role in transport and deposition of large woody debris (Fox 2001, Braudrick and Grant 2001). Unlike bedload, woody debris is buoyant, so it can be rafted and deposited singly or in aggregations to form wood jams that are perched at a height above the low-flow channel about equal to the depth of the flow that deposited them. Large woody debris frequently interacts with the bedload by forming dams that trap reservoirs of sediment on their upstream sides (Montgomery et al. 1995), or by creating areas of flow separation and convergence which deposit or scour sediment respectively (Bilby 1998, Abbe and Montgomery 2003). The volume of sediment available to interact with large woody debris is a factor in the nature of the interaction. If there is an excess of sediment, wood will be more likely to play a role in bedload deposition and scour. In contrast, if there is a limited sediment supply then there will likely be less interaction with large woody debris. Therefore, the loading and function of large woody debris in a given channel reach will be subject to reach average transport capacity, wood supply, wood dimensions, and sediment supply.
The distribution of large woody debris in the Sultan River is variable by river mile and can be explained by variations in the stream power as a surrogate for transport capacity. Wood loading by river mile is shown in Figure 2-16 and closely tracks variation in an index of stream power by river mile. Because drainage area increases only gradually along most of the Sultan River, the variation in stream power is mainly driven by local

Jackson Hydroelectric Project
Study Plan 22: Sultan River Physical Process Studies Technical Report Page 39 June 2008
changes in the slope of the channel. Wood loading is low in reaches with a relatively higher index of stream power, and conversely, high in reaches with a relatively lower index of stream power. Aggregations of wood tend to occur in reaches immediately downstream of reaches with high stream power. It appears that the reaches with high stream power (and therefore high transport capacity) pass and route wood into reaches with lower stream power where it is deposited in jams.
Deposits of wood in PR 2 and PR 3 are predominantly deposited out of the bankfull channel margin (Figure 2-18), where there would be less opportunity for them to interact with any available bedload. This is not surprising, as some reaches through the gorge are very confined and have very high transport capacity. In addition, the trees that supply the wood load in the Sultan River consist of second- and third-growth timber, which are naturally shorter and thinner than would be old-growth timber. The channel reach throughout the gorge is a supply-limited system, and so the total volume of sediment available to interact with any wood in the active channel is minimized. Direct observation in the field and from the air reveals that there is very little wood in the gorge interacting with the bedload to create habitat heterogeneity. Given the energy available to transport wood during flood events, channel position of wood deposits, wood caliber, and the sediment supply-limited character of PR 2 and PR 3, this is not an unexpected outcome.

Jackson Hydroelectric Project
Page 40 Study 22: Sultan River Physical Process Studies Technical Report June 2008
0%
20%
40%
60%
80%
100%
PR3 PR2 PR1
Process Reach
Perc
ent c
ompo
sitio
n of
LW
D p
ositi
on w
ithin
g th
eb
ound
s of
teh
bank
full
chan
nel
Zone 2 Bankfull ChannelZone 1b Wetted Mid-channelZone 1a Wetted Channel
Figure 2-18 Percent composition of large woody debris (LWD) and location within the channel of the Sultan River by Process Reach. Pieces within Zone 1 interact with the wetted area. Zone 2 include those pieces within the bankfull channel but that are too high to fall within the wetted area of the channel.
The total wood load in PR 2 and PR 3 is somewhat lower than for unregulated rivers in Washington State (Figure 2-15). While much of the wood supplied from upstream of Culmback Dam would have likely been deposited in the low-gradient reach between RM 17 and RM 24, some unknown fraction would have been transported into the gorge reach. Landsliding presumably has always brought a fair amount of wood directly into the gorge; the 2007 late-winter slide at RM 14 is prime example. Wood loading in PR 1, however, is especially low by comparison to either the gorge upstream or other Washington rivers (Figure 2-15). This is most likely explained by long-term salvage of large wood from the lower system, as a building or fuel resource or for flood control, since the time of colonization in the 1800’s (Collins and Montgomery 2002b, Collins et al. 2003). Despite relatively low transport capacity and abundant sediment, there is very little functional wood in PR 1.

Jackson Hydroelectric Project
Study Plan 22: Sultan River Physical Process Studies Technical Report Page 41 June 2008
3.0 GEOMORPHIC SYNTHESIS
This geomorphic synthesis consists of three elements:
1. A description of the contemporary state of physical process and function in the Sultan River basin in the project area, given Project operations and the geomorphic template of the basin.
2. A geomorphic process model, intended to provide a physical context in which to view project operations and future management decisions.
3. Implications of the physical process context on interpretation of ecological functions, emphasizing outcomes on the expression of aquatic habitat.
The studies were undertaken to test the general hypothesis articulated in the original Study Plan:
Stage 2 Project operations have reduced the frequency and magnitude of sediment delivery and transport from the upper gorge reach to the lower alluvial reach, resulting in channel aggradation in the gorge reach and bar stabilization in the lower alluvial reach.
The driving hypothesis was approached in three parts: a sediment mass balance study, and examination of the channel planform, and a study of large woody debris dynamics A mass-balance comparison of sediment input into the river with its capacity transport and the channel response over 23 years was the first component. The planform of the river channel and its relationship to its floodplain, riparian vegetation, and bounding valley walls was the next component. The final component was an analysis of large woody debris loading, transport, and deposition compared to field-collected data from this and other western Washington rivers. This synthesis section presents the integration of these three components.
The magnitude and pattern of sediment-transporting large floods in the Sultan River is different during Stage 2 management than it was during Stage 1. The differences are best summarized by operational reaches, because Project operations are the basis of the differences. In OR 1 the flood magnitude is now higher but the interval between large floods is longer; in OR 2 the pattern is the same as in OR 1; in OR 3 the flood magnitude is now lower and the interval between floods is larger. The final technical report for Study Plan 23 (Indicators of Hydrologic Alteration/Range of Variability Analysis in the Sultan River Downstream of Culmback Dam) presents a more detailed discussion of changes to the hydrologic system in the Sultan River.
The physiographic character of the Sultan River basin is a mitigating factor in the interruption of coarse sediment by Culmback Dam. This idea was first presented in the sediment transport study completed as part of the original studies on the impacts and

Jackson Hydroelectric Project
Page 42 Study 22: Sultan River Physical Process Studies Technical Report June 2008
influences of Stage 2 Project operations (GeoEngineers 1984). Based on aerial photography analysis and the 1919 USGS 1:50,000 topography map, the Sultan River at present-day Spada Lake was a pool-riffle channel. This type of channel is typically transport-limited (Montgomery and Buffington, 1997). The valley in which this reach of the Sultan River flowed is broad and unconfined, a form inherited from previous glacial erosion. The river probably only infrequently impinged upon its valley walls, thereby limiting sediment input by landsliding (Dadson and Church 2006, Amerson et al. 2007). This type of setting is typically a sediment sink, because only a relatively small volume of the coarse sediment transported from the steep headwaters can be transported through the low-gradient reach to the lower river during floods.
In stark contrast, the Sultan River below Culmback Dam flows in a confined gorge, which is subject to frequent landslides that immediately enter the channel. While it is certain that sediment was transported from upstream of RM 16.5, the influx of sediment below RM 16.5 probably would have swamped this upstream supply. Based on basin physiography, we expect that the vast majority of the sediment that comprises the channel boundary in the alluvial reach (PR 1) in the lower three miles of the Sultan River is derived from PR 2 immediately upstream, and this was likely the case before Stage 1 operations began. This also was the judgment expressed in GeoEngineers (1984).
The sediment supply entering the channel in the period between Stage 1 and Stage 2 operations have remained essentially unchanged. In 1964, Stage 1 operations included a sufficiently high dam at the present location of Culmback Dam to interrupt all coarse sediment supply from upstream. Otherwise, land use and climate have remained generally similar. Between Stage 1 and Stage 2 operations, the most influential alteration in the fluvial system has been the alteration in the hydrograph.
Sediment transport modeling and the mass balance show that while the sediment transport capacity has been reduced in PR 2 and PR 3, there remains excess capacity to transport all of the sediment supplied to them (Table 2-4). Even though large flood pulses have been more punctuated during Stage 2 operations, sediment transport was likely to have been more-or-less similar during the two stages because even medium-sized floods had excess capacity to transport the sediment supplied to these reaches. Given the relatively steep gradient and confinement of these reaches, this is an expected outcome: channel reaches of this type are considered to be supply-limited, and this description is still appropriate for these reaches during Stage 2 operations. As a consequence, Stage 2 sediment routing through PR 2 and PR 3 is similar to Stage 1, and most sediment supplied to the reach is exported to PR 1 with minimal storage in the channel.
Changes in sediment transport capacity in PR 1 have become more complex. An expected outcome is that channel adjustments associated with excess sediment supply should be observed if the sediment supply from the gorge reaches during Stage 2 has remained the same, while the frequency of large floods has been reduced. However, no expression of the channel changes expected from such circumstances was found in the planform study: neither avulsions, braiding, nor channel widening. The active channel area has shrunk by about 30% since the onset of Stage 2, and this phenomenon appears to

Jackson Hydroelectric Project
Study Plan 22: Sultan River Physical Process Studies Technical Report Page 43 June 2008
continue a trend that initiated at the onset of Stage 1 operations (1964). Furthermore, the basic planform and channel position has been static since at least 1919, long before Stage 1 operations began.
Vegetation encroachment onto formerly active bars has occurred throughout both the gorge and the alluvial reach and is especially evident in PR 1 and PR 2 (Figure 2-10 to Figure 2-13). Changes in the frequency of flows large enough to scour the surface of active bars and suppress establishment of riparian vegetation is the likely cause of this condition. It appears to have begun at the onset of Stage 1 operations and has continued through Stage 2. Vegetation encroachment is a mitigating factor in the changing sediment transport dynamics, however, because the presence of the vegetated bars forces flows into a narrower channel during flooding, effectively increasing sediment transport capacity.
Our modeling of sediment transport capacity under two different channel geometries demonstrates the compensatory effect of vegetation encroachment on this geomorphic process. Under contemporary conditions, modeled sediment transport capacity goes down if the channel dimensions are held the same as in 1984, even though flood peaks are higher, because the frequency of large floods is smaller. Basically, flood flows smaller than the largest events have less energy because they are wide and shallow. Modeling sediment transport capacity using contemporary channel dimensions shows that even with fewer large floods, the effectively narrower channel during Stage 2 operations has a modeled sediment transport capacity that is similar to Stage 1 conditions (see Table 2-4). This modeling exercise demonstrates that the sediment transport capacity in PR 1 during Stage 2 is similar to the sediment transport capacity during Stage 1. Vegetation encroachment also mitigates for excess sediment loading because it sequesters sediment in fixed bars that would otherwise be available for transport.
Since 1983 about 30% of the total active channel area in PR 1 has been lost due to vegetation encroachment. This represents approximately 30 acres of sediment of unknown depth that is no longer available for transport by fluvial processes. As an expression of this, the mid channel island at RM 2 has persisted in the same location and has had the same approximate area since at least 1965. The sediment bound in place by the mature riparian forest on the island has been unavailable to the fluvial system for at least 43 years. In the same way, the maturing forests that have grown up on formerly active bars in the Sultan River channel since Stage 2 operations began have kept a large volume of sediment out of the fluvial system. As the forests on the bars mature, the likelihood of the sediment being released to active transport is reduced because the magnitude of floods required to remove the forest becomes less common. The encroaching vegetation has also created a series of side channels in PR 1 (Figure 2-10 to Figure 2-13). In all cases, present-day side channels are relicts of formerly active main channel segments that have been encroached by riparian vegetation. This process of side channel formation is in contrast to the processes in unregulated rivers (see section 2.2.10).
The implications of these findings on aquatic habitat are beyond the scope of this study document and are left for future discussions.

Jackson Hydroelectric Project
Page 44 Study 22: Sultan River Physical Process Studies Technical Report June 2008
3.1 Sultan River Physical Process Model In this report, the study area is presented as a “physical process model”—inputs and outputs of sediment are mediated by physical processes and structured by the geological and physiographic setting. This approach is modeled after the scheme presented by Bisson, Buffington, and Montgomery (2006). Implications of the findings of the detailed studies will be presented in the context of the Sultan River Physical Process Model.
3.1.1 Geologic Setting The geology and geologic setting of the study area were mapped by Booth (1986, 1990). The Puget lobe of the Cordilleran ice sheet overrode the study area, arriving generally from the northwest during the last period of global glacier advances, in this region called the Vashon stade of the Fraser glaciation (Booth et al. 2004) (about 17,000 years ago). Ample evidence for this event is available throughout the study area. Erosional and depositional features left by the ice sheet are evident on the 2006 LiDAR DEM (Figure 1-1). The ice sheet left behind a veneer of glacial till and related deposits of variable thickness that overlies the bedrock of the study area, recognized as Mesozoic rocks (between 70 and 240 Ma) of the Western Mélange Belt (Tabor et al. 1993). This geologic unit consists of locally hard rocks intermixed in a matrix of weakly metamorphosed, pervasively sheared sedimentary rocks that have been tectonically translated and uplifted to their present position. The composition and tectonic history of the matrix-forming sedimentary rock has made it relatively weak and friable. The juxtaposition of regionally extensive, weak bedrock overlain by glacial till is a key feature of the physical template in the study area.
An equally important component of the physical template of the Sultan River is the more recent geological history of the Sultan River itself. The Puget lobe blocked the Skykomish River and the historical basin of the upper paleo-Pilchuck River (which now forms the upper Sultan River basin) as it advanced from the west and northwest (Booth, 1986). The dammed Skykomish River formed a lake, which subsequently deposited a thick mantle of sediments. The ice sheet similarly dammed the upper Pilchuck River, emplacing a subaqueous moraine locally known as the Pilchuck Plug, which is visible as the low divide between western Spada Lake and the modern Pilchuck River basin in the 2006 LiDAR DEM (Figure 1-1).
The lake that formed behind the Pilchuck Plug (at the location of modern Spada Lake) eventually spilled over the divide of a small tributary to the paleo-Pilchuck River to the south (approximately RM 16 to RM 11 in the modern Sultan River). The spill flushed to the south and probably rapidly incised to form the general course of the present-day Sultan River. The timing of the formation of the Sultan River and damming and drainage the lake in the Skykomish basin is uncertain, but waves of incision and deposition by the Sultan and Skykomish Rivers formed prominent flights of terraces composed of fluvially deposited and incised lacustrine sediments (approximately RM 11 to RM 0 in the modern Sultan River). The modern channel is confined to an inset bedrock gorge between RM 4 and RM 16 whose floor is covered by a discontinuous veneer of fluvially-transported landslide debris derived from glacial till and lake deposits, and punctuated by rock

Jackson Hydroelectric Project
Study Plan 22: Sultan River Physical Process Studies Technical Report Page 45 June 2008
avalanche deposits from the regional bedrock. The lower three miles of the Sultan River is unconfined and flows across planar deposits of alluvial fill and is broadly bounded by valley walls formed by fill terraces. The Sultan River below Culmback Dam is thus only about 15,000 years old, which makes it a relatively young feature by geologic standards.
3.1.2 Process Domains in the Study Area Knowledge of the recent geologic history and physiographic setting of the study area is fundamental to understanding how physical processes at the landscape scale mediate physical processes at the reach and the habitat scale in the Sultan River. At the landscape scale, the Sultan River in the study area can be divided into three valley types by physiographic distinctions alone (other valley types can be distinguished above RM 16.5 but will not be further defined here). Thus, three process domains (Montgomery 1999) can be defined in the study area based on the geologic template and the dominant physical processes that are active at the landscape and reach scale.
From Culmback Dam (RM 16.5) to RM 11, the Sultan River flows through a gorge with a V-shaped cross-section, a form that was likely inherited when the lake in the upper paleo-Pilchuck River spilled to establish the modern Sultan River channel. Immediately downstream of the V-shaped valley is a terrace-bounded valley reach, spanning RM 11 to RM 4, that also exposes bedrock in the channel bed but is closely bounded by incised alluvial and lake deposits. The lowermost reach, below RM 4, is in an alluvial valley broadly bounded by fill terraces whose channel form is a classically defined self-formed alluvial river with a formerly seasonally inundated floodplain. Each of these “lithotopo units” (Montgomery 1999) has unique physiography, geology, and landscape processes that set them apart from one another. From the perspective of this study, dominant landsliding style is the chief landscape process distinction among them, because landsliding in the study area is the main sediment input mechanism to the Sultan River.
The dominant landsliding style in each of the three valley types is a direct outcome of the geology and topography of each reach. The V-shaped valley is dominated by debris flows, and the terrace bounded valley is dominated by deep-seated landslides (Figure 2-1). In both cases, landslide sediments are deposited directly into the channel because they are closely confined by their valley walls. The channel flowing through the alluvial valley reach, in contrast, receives sediment input from slumps and deep-seated landslides only infrequently where the river impinges on its valley walls.
In the V-shaped valley, debris flows are shallow and fail catastrophically in the relatively thin Vashon till. Vashon till is enriched in readily transportable, fluvially sorted clasts which are mostly composed of durable rocks of volcanic and plutonic origin. In the terrace-bounded valley, deep-seated landsides incrementally fail in deep deposits of lake and alluvial sedimentary fill, which are also enriched in sorted clasts. There is relatively more fine sands and silts in the terrace sediments, however, than in the till.
Between RM 16 and RM 4, the relatively steep, confined, supply-limited conditions give rise to channel reaches whose morphology are variously cascade, step-pool, and plane bed. In the uppermost valley segment (RM 16 to RM 11, there are also some reaches that consist of bedrock notches with little or no alluvium in them. In the Sultan River gorge,

Jackson Hydroelectric Project
Page 46 Study 22: Sultan River Physical Process Studies Technical Report June 2008
rock avalanche deposits are most important in setting pool spacing. Sequentially emplaced rock avalanche deposits are the predominant sediment storage and pool-forming mechanism in the gorge reaches. Tailouts of long glide-like pools are formed out of the clasts derived from glacial sediments that landslide into the river, with pool spacing set by the spacing of rock avalanche deposits (Figure 3-1). Despite relatively high wood loading, large woody debris plays very little role in forcing sediment deposition in PR 2 and PR 3 because the wood is generally deposited above of the active channel. Thus the observation that pool spacing in many mountain rivers of the Pacific Northwest is set by alluviation that is forced by large woody debris (Montgomery et al. 1995, Montgomery et al. 1996) does not apply in this part of the Sultan River.
frequently a bedrock glide or pool just below landslide
step
discrete alluvial deposit upstream of landslide depositrelict landslide
deposit
cascade or high gradient riffle
BEDRO
FLOW
relict landslide deposit
discrete alluvial dupstream of landslid
LAND
SLIDE
LAND
SLID
E
Figure 3-1 Schematic diagram showing how rock avalanche debris backs up large reservoirs of fine grained sediment in the gorge reaches of the Sultan River.
The alluvial valley reach includes both plane bed and pool-riffle channel types. Pool spacing in the alluvial reach is set by the natural scour and deposition of sediment and is characteristic of self-formed alluvial rivers. Low wood loading in the alluvial reach is consistent with the relatively high pool spacing and shallow pools (i.e., glides) mapped in Study Plan 18.
An overview of the characteristics and distinctions among the process reaches is presented in Figure 3-2.

Jackson Hydroelectric Project
Study Plan 22: Sultan River Physical Process Studies Technical Report Page 47 June 2008
Figu
re 3
-2
Proc
ess
Rea
ch fe
atur
es a
nd d
istin
ctio
ns in
the
Sulta
n R
iver
.

Jackson Hydroelectric Project
Page 48 Study 22: Sultan River Physical Process Studies Technical Report June 2008
4.0 CONCLUSIONS
Any assessment of the geomorphic conditions and processes in the Sultan River owes a debt to the well-executed study of GeoEngineers (1984). A summary of the conclusions from that report that are relevant to the present study are as follows:
• The Sultan River is a supply-limited system, with most sediment delivered via mass failures in the gorge reaches (PR 2 and PR 3) above the Diversion Dam and below Culmback Dam. Prior to the inception of Stage 1 (1964), the Sultan River below RM 16.5 appeared to have received minimal delivery of coarse sediment from the upper watershed. Numerous active slides and debris flows were observed in the gorge; tributary streams did not appear to have contributed significant amounts of coarse sediment to the channel, and there were few sources identified that delivered sediment to the channel downstream of the Powerhouse.
• Below Culmback Dam, sediment transport was estimated to be approximately equal to sediment delivery at the time of the study, although no quantitative estimates of sediment input were made. However, initiation of Stage 2 Project operations, which would generally reduce peak flows and sediment transport capacity in the lower reach while not significantly changing sediment input to the lower reach, was expected to result in channel aggradation, bar growth, and increased channel migration.
Our results affirm the conclusion from the GeoEngineers (1984) report, with one important exception: “excess” sediment is not accumulating in the alluvial reach, as predicted in 1984. This is a consequence of the multiple effects of flow alterations: sediment-transporting flows have been reduced and large flood frequency has been reduced to the degree that encroaching vegetation has created a narrower channel. This change in channel geometry, in turn, has created a more efficient channel for transporting sediment for any given increment of flow. Thus, the hydraulic efficiency of the channel has increased even as the discharge has decreased. Because the input of sediment into the alluvial reach has not changed, the result has been a continued near-balance of sediment flux down the entire channel network, accompanied by a reduction in the width of the active channel.
A summary of conditions in the river • The Sultan River in the Project area can be divided into three distinct process
reaches, each with characteristic landscape and channel morphology.
• Vegetation encroachment in the lower alluvial reach has been an unforeseen consequence of flow alteration. Riparian vegetation has reduced the active channel area by 32% since Stage 2 operation began.
• Sediment sequestered in vegetated bars has also been an unforeseen consequence of Stage 2 operations.

Jackson Hydroelectric Project
Study Plan 22: Sultan River Physical Process Studies Technical Report Page 49 June 2008
• Side channels in the Sultan River are relict features, a consequence of vegetation encroachment into formerly active channels of the river.
• The volume of LWD in PR 2 and PR 3 is similar to that of other Washington Rivers. Volumes in PR 1, however, are low compared to other Washington rivers.
• Pool formation and spacing in PR 2 and PR 3 is set by the frequency of rock avalanche deposits.
Implications • Observed and expected channel types, and associated habitat features and
distribution, directly reflect the character of individual physical process reaches in the Sultan River. For example, pool-riffle channels would not be expected in either PR 2 or PR 3. This is a natural consequence of the inherent characteristics of these reaches.
• Mobilization of sediment stored in bars of the lower river would require floods of a magnitude sufficient to scour well-established riparian vegetation, which is locally up to 50 years old. Activation of sediment stored in bars would have unknown consequences to channel planform and channel stability.
• The present analysis is insufficient to predict whether the Stage 2 flow regime might maintain, enlarge, or diminish side channels. However, incipient encroachment of riparian vegetation suggests that side channels may be diminishing during Stage 2.
• Wood supply to the channel derives from the same hillslope processes that account for inputs of sediment.
• The function of large woody debris in PR 2 and PR 3 is unlikely to change in the foreseeable future, because the surrounding forests consist solely of second- and third-growth timber. The size of the supply of large wood to the system is limited to the size of available trees, and even under regulated flows the stream power is apparently more-than-adequate to displace logs high onto the banks. An increase in the quantity of wood in PR 1, however, would likely increase overall physical heterogeneity in that reach.
• Wood within the two canyon process reaches appears to provide little in the way of sediment storage relative to the influence of lag deposits from landslides. This seems to be a function of the relatively small size and quantity of trees entering the channel from adjacent hillslopes. Additional input of wood of undetermined volumes from above the present location of Culmback Dam may historically have contributed obstructions to flow and to sediment storage.

Jackson Hydroelectric Project
Page A-50 Study 22: Sultan River Physical Process Studies Technical Report June 2008
5.0 REFERENCES
Abbe, T.B., Montgomery, D.R., 1996. Large woody debris jams, channel hydraulics and habitat formation in large rivers. Regulated Rivers: Research and Management 12: 201–221.
Abbe, T.B., Montgomery, D.R., 2002. Patterns and processes of wood debris accumulation in the Queets River basin, Washington. Geomorphology 51: 81–107.
Abbe, T.B., D.R. Montgomery. 2003. Patterns and processes of wood debris accumulation in the Queets river basin, Washington. Geomorphology 51: 81-107.
Amerson, B., Montgomery, D. R., and Meyer, G., 2008. Relative size of glacial and fluvial valleys in central Idaho Geomorphology. 93: 537-547.
Beechie T.J., M. Lierman, M.M. Pollock, S. Baker, J. Davies. 2006. Channel pattern and river-floodplain dynamics in forested mountain river systems. Geomorphology 78: 124-141.
Benda, L., M.A. Hassan, M. Church, and C.L. May. 2005. Geomorphology of steepland headwaters: The transition from hillslopes to channels. Journal of the American Water Resources Association 41(4):835-851.
Bilby, R. E., and J. W. Ward. 1991. Characteristics and function of large woody debris in streams draining old growth, clear-cut, and second-growth forests in southwestern Washington. Canadian Journal of Fisheries and Aquatic Sciences 48:2499–2508.
Bisson, P.A., J.M. Buffington, D.R. Montgomery. 2007. Valley segments, stream reaches, and channel units, in R. Hauer and G.A. Lamberti, eds. Methods in Stream Ecology 2nd edition. Academic Press. p 23-49.
Booth, D. B. 1986. The formation of ice-marginal embankments into ice-dammed lakes in the eastern Puget Lowland, Washington, U.S.A., during the late Pleistocene: Boreas, v. 15, p. 247–263.
Booth, D. B. 1990. Surficial geology of the Skykomish and Snoqualmie Rivers area, Snohomish and King Counties, Washington: U.S. Geological Survey Miscellaneous Investigations Map I-1745, scale 1:50,000, 2 sheets with pamphlet.
Booth, D. B., Troost, K. G., Clague, J. J., and Waitt, R. B., 2004, The Cordilleran ice sheet: Chapter 2 in Gillespie, A., Porter, S. C., and Atwater, B., eds., The Quaternary Period in the United States: International Union for Quaternary Research, Elsevier Press, p. 17-43.

Jackson Hydroelectric Project
Study 22: Sultan River Physical Process Studies Technical Report Page 51 June 2008
Braudrick, C.A., G.E. Grant. 2001. Transport and deposition of large woody debris in streams: a flume experiment. Geomorphology 41: 263-283.
Brummer, C.J. 2006. Influence of mass wasting on bed-surface armoring, lag formation, and sediment storage in mountain drainage basins of western Washington State. Doctoral dissertation. University of Washington.
Brummer, C.J., D.R. Montgomery. 2003. Downstream coarsening in headwater channels. Water Resources Research 39: doi:10.1029/2003WR001981.
Collins, B.D., D.R. Montgomery and A.J. Sheikh. 2003. Reconstructing the historical riverine landscape of the Puget Lowland. Pages 79-128 in D. R. Montgomery, S. Bolton, D. B. Booth and L. Wall, editors. Restoration of Puget Sound rivers. University of Washington Press, Seattle.
Collins, B.D., D.R. Montgomery, A.D. Haas. 2002a. Historical changes in the distribution and functions of large wood in Puget Lowland rivers. Canadian Journal of Fisheries and Aquatic Sciences 59: 66-76.
Collins, B.D., D.R. Montgomery. 2002b. Forest development, wood jams, and restoration of floodplain rivers in the Puget Lowland, Washington. Restoration Ecology 10(2): 237-247.
Cruden, D. M., and D. J. Varnes. 1996. Landslide types and processes. Pages 36-75 in Landslides investigation and mitigation. Special Report 247. Transportation Research Board, Washington, D.C.
Dadson, J.S., M. Church. 2005. Postglacial topographic evolution of glaciated valleys: a stochastic landscape evolution model. Earth Surface Processes and Landforms 30: 1387–1403.
Dietrich, W.E., and T. Dunne. 1978. Sediment budget for a small catchment in mountainous terrain. Zeitschrift fuer Geomorphologie N. F. 29: 191-206.
Dietrich, W.E., R. Reiss, M.L. Hsu, and D.R. Montgomery. 1995. A process-based model for colluvial soil depth and shallow landsliding using digital elevation data, Hydrological Processes, 9, 383-400.
Dunne, T., L.B. Leopold. 1978. Water in Environmental Planning. W.H. Freeman and Company, New York.
Fox, M. J. 2001. A new look at the quantities and volumes of wood in forested basins of Washington State. Master’s thesis. University of Washington, Seattle.
Frissell, C.A., W.J. Liss, C.E. Warren, M.D. Hurley. A hierarchical framework for stream habitat classification: Viewing streams in a watershed context. Environmental Management 10(2): 199-214.

Jackson Hydroelectric Project
Page A-52 Study 22: Sultan River Physical Process Studies Technical Report June 2008
Furbish, D. 1988. River-bend curvature and migration: how are they related? Geology 16: 725–755.
Gay, G., H. Gay, W. Gay, and H. Martinson. 1998. Evolution of cutoffs across meander necks in Powder River, Montana, USA. Earth Surface Processes and Landforms 23: 651–662.
GeoEngineers. 1984. Phase 1 Report, River Gravel Quantity Study. Prepared for Public Utility District No. 1 of Snohomish County, Everett, Washington.
Grant, G.E., J.C. Schmidt, S. L. Lewis. 2003. A Geological Framework for Interpreting Downstream Effects of Dams on Rivers, in J.E. O'Connor and G.E. Grant, eds. A Peculiar River, Geology, Geomorphology, and Hydrology of the Deschutes River, Oregon.American Geophysical Union, Washington D.C. p. 209-225.
Gurnell, A.M., Petts, G.E. 2002. Island-dominated landscapes of large floodplain rivers, a European perspective. Freshwater Biology 47: 581–600.
Gurnell, A.M., Petts, G.E., Hannah, D.M., Smith, B.P.G., Edwards, P. J., Kollman, J., Ward, J.V., Tockner, K., 2001. Riparian vegetation and island formation along the gravel-bed Fiume Tagliamento, Italy. Earth Surface Processes and Landforms 26: 31–62.
Guthrie, R.H., and S.G. Evans. 2004. Analysis of landslide frequencies and characteristics in a natural system, coastal British Columbia. Earth Surface Processes and Landforms 29:1321-1339.
Harrelson, C. C., C. L. Rawlins and J. P. Potyondy. 1994. Stream channel reference sites: an illustrated guide to field technique. General Technical Report RM-245. USDA Forest Service, Rocky Mountain Forest and Range Experiment Station, Fort Collins, Colorado.
Hicks, B. A. 1982. Geology, geomorphology, and dynamics of mass movement in parts of the middle Santiam River drainage, western Cascades, Oregon. Master's thesis. Oregon State University, Corvallis.
Hook, A.K. 2006. The recent history of floodplain dynamics in the North Fork Skykomish River, Washington. Master’s thesis. University of Washington, Seattle.
Howard, A., and T. Knutson. 1984. Sufficient conditions for river meandering: a simulation approach. Water Resources Research 20: 1659–1667.
Ikeda, S., G. Parker, and K. Sawai. 1981. Bend theory of river meanders, Part 1: Linear development. Journal of Fluid Mechanics 112: 363–377.
Kelsey, H.M., 1978, Earthflows in Franciscan melange, Van Duzen River basin, California; Geology, 6, 361-364.
Jackson Hydroelectric Project
Study 22: Sultan River Physical Process Studies Technical Report Page 53 June 2008
Knighton, A. D. 1998. Fluvial form and processes. Arnold, Oxford, England.
Knighton, A. D. 1999. Downstream variation in stream power. Geomorphology 29: 293-306.
Lawler, D. M. 1993. The measurement of river bank erosion and lateral change: a review. Earth Surface Processes and Landforms 18: 777–821.
Lehre, A.K. 1982. Sediment mobilization and production from a small mountain catchment: Lone Tree Creek, Marin County, California. Doctoral dissertation. University of California, Berkeley.
Leopold, L. B., 1994. A View of the River, Harvard Univ. Press, Cambridge, Mass.
Leopold, L.B., Wolman, M.G., 1957. River channel patterns: braided, meandering and straight. In: Physiographic and hydraulic studies of rivers. USGS Professional Paper, vol. 282-B. U.S. Government Printing Office, Washington, D.C, pp. 39–85.
Ligon, F. K., W. E. Dietrich, and W. J. Trush. 1995. Downstream ecological effects of dams: a geomorphic perspective. BioScience 45: 183-192.
Montgomery, D. R. 1999. Process Domains and the River Continuum, Journal of the American Water Resources Association 35: 397-410.
Montgomery, D. R., T. B. Abbe, J. M. Buffington, N. P. Peterson, K. M. Schmidt, and J. D. Stock. 1996. Distribution of bedrock and alluvial channels in forested mountain drainages. Nature 381:587–589.
Montgomery, D.R., J.M. Buffington, R.D. Smith, K.M. Schmidt, G. Pess. 1995. Pool spacing in forest channels. Water Resources Research 31(4): 1097-1105.
Montgomery, D.R., J.M. Buffington. 1997. Channel-reach morphology in mountain drainage basins. Geological Society of America 109(5) 596-611.
Montgomery, D.R., Pie´gay, H. 2003. Wood in rivers: interactions with channel morphology and processes. Geomorphology 51: 1 –5
Naiman, R.J., J.S. Bechtold, D., Drake, J.J. Latterell, T.C. O’Keefe, E.V. Balian. 2005. Origins, patterns, and importance of heterogeneity in riparian systems. Pages 279-309, in G. Lovett, C.G. Jones, M.G. turner, and K.C. Weathers, editors. Ecosystem Function in Heterogeneous landscapes. Springer-Verlag, New York.
Nanson, G., and E. Hickin. 1986. A statistical analysis of bank erosion and channel migration in western Canada. Bulletin Geological Society of America 97: 497–504.
Osterkamp, W.R., 1998. Processes of fluvial island formation, with examples from Plum Creek, Colorado and Snake River, Idaho. Wetlands 18: 530–545.

Jackson Hydroelectric Project
Page A-54 Study 22: Sultan River Physical Process Studies Technical Report June 2008
Parker, G. 1990a. Surface-based bedload transport relation for gravel rivers. Journal of Hydraulic Research 28: 417-436.
Parker, G. 1990b. The Acronym Series of PASCAL program for computing bedload transport in gravel rivers. External Memorandum M-220. St. Anthony Falls Laboratory, University of Minnesota.
Petts, G.E., A.M. Gurnell. 2005. Dams and Geomorphology: Research and future directions. Geomorphology 71: 27-47.
Pyles, M.R., K. Mils, and G. Saunders. 1987. Mechanics and stability of the Lookout Creek earth flow. Bulletin of the Association of Engineering Geologists 24: 267-280.
R2 Resource Consultants. 2006. Spatial and temporal comparison of spawning gravel quality in the Sultan River, Washington, Henry M. Jackson Hydroelectric Project, FERC Project No. 2157. Prepared by R2 Resource Consultants, Inc., Redmond, WA.
Reid, L.M. 1981. Sediment production from gravel-surfaced forest roads, Clearwater basin, Washington. FRI-UW-8108. Fisheries Research Institute, University of Washington, Seattle. 247 p.
Reid, L.M., T. Dunne. 1996. Rapid Evaluation of Sediment Budgets. Catena Verlag GMBH 35447, Reiskirchen, Germany.
Reneau, S.L., and W.E. Dietrich. 1991. Erosion rates in the southern Oregon Coast Range: Evidence for an equilibrium between hillslope erosion and sediment yield. Earth Surface Processes and Landforms 16: 307-322.
Rice, S., 1998. Which tributaries disrupt downstream fining along gravel-bed rivers?, Geomorphology, 22: 39– 56.
Roering, J.J., J.W. Kirchner, and W.E. Dietrich. 2005. Characterizing structural and lithologic controls on deep-seated landsliding: implications for topographic relief and landscape evolution in the Oregon Coast Range, USA. GSA Bulletin 117: 654-668.
Sarikhan, I.Y., and P.T. Pringle. 2005. Landslide Hazard Zonation Project, Sultan River Watershed, Snohomish County, Washington. Washington Department of Natural Resources, 22 p., 1 plates, scale 1:24,000.
Schumm, S.A. 1977. The Fluvial System. Wiley-Interscience, New York.
Selby, M.J. 1993. Hillslope materials and processes. Oxford University Press, New York.

Jackson Hydroelectric Project
Study 22: Sultan River Physical Process Studies Technical Report Page 55 June 2008
Swanson, F.J., and C.T. Dyrness. 1975. Impact of clear-cutting and road construction on soil erosion by landslides in the western Cascade Range, Oregon. Geology 1: 393-396.
Swanson, F.J., and D.N. Swanston. 1977. Complex mass-movement terrains in the western Cascade Range, Oregon. Geological Society of America, Reviews in Engineering Geology 3: 113-124.
Swanson, F.J., L.E. Benda, S.H. Duncan, G.E. Grant, W.F. Megahan, L.M. Reid, and R.R. Ziemer. 1987. Mass failures and other processes of sediment production in Pacific Northwest forest landscapes. Pages 9-38 in E. O. Salo and T. W. Cundy, editors. Streamside management: forestry and fishery interactions. College of Forest Resources, University of Washington.
Swanson, F.J., R.L. Fredriksen, and F.M. McCorison. 1982. Material transfer in a western Oregon forested watershed. Pages 233-266 in R. L. Edmonds, editor. Analysis of coniferous forest ecosystems in the western United States. Hutchinson Ross Publishing, Stroudsburg, Pennsylvania.
Swanson, F.J., T.K. Krantz, N. Caine, R.G. Woodmanse. 1998. Landform effects of ecosystem patterns and processes. BioScience 38(2): 92-98.
Swanston, D.N., and F.J. Swanson. 1976. Timber harvesting, mass erosion, and steepland forest geomorphology in the Pacific Northwest. In Coates, D.R., ed., Geomorphology and Engineering. Dowden, Hutchinson, and Ross, Inc. Stroudsburg, Pa. 231 p.
Swanston, D.N., R.R. Ziemer, and R.J. Janda. 1995. Rate and mechanics of progressive hillslope failures in the Redwood Creek basin, northwestern California. Pages E1-E16, In: Nolan, K.M.; H.M. Kelsey; D.C. Marron, eds., Geomorphic processes and aquatic habitat in the Redwood Creek basin, northwestern California. U.S. Geological Survey Professional Paper 1454, Washington, DC.
Tabor, R.W., V.A. Frizzell, Jr., D.B. Booth, R.B. Waitt, Jr., J.T. Whetten, and R.E. Zartman. 1993. Geologic map of the Skykomish River 30- by 60-minute quadrangle, Washington: U.S. Geological Survey Miscellaneous Investigations Map I-1963, scale 1:100,000.
Thorne, C. R. 1992. Bend scour and bank erosion on the meandering Red River, Louisiana. Pages 95–115 in P. Carling and G. Petts, editors. Lowland floodplain rivers: geomorphological perspectives. Wiley and Sons, Chichester.
Whiting, P. J., J. F. Stamm, D. B. Moog, and R. L. Orndorff, 1999. Sediment transporting flows in headwater channels, Geological Society of America Bulletin 111: 450– 466.
Wolman, G.M. 1954. A method of sampling coarse river-bed material. Transactions of the American Geophysical Union 35: 951-956.


Jackson Hydroelectric Project
Study 22: Sultan River Physical Process Studies Technical Report Page A-1 June 2008
APPENDIX A Description of EASI model formulation

Jackson Hydroelectric Project
Page A-2 Study 22: Sultan River Physical Process Studies Technical Report June 2008
The surface based bedload equation of Parker (1990a and 1990b) is expressed for wide rectangular channel for which channel geometry can be expressed as a channel width. The equation is modified for the Enhanced Acronym Series with Interface (EASI) program so that it can also handle a given cross section. Details of the surface based bedload equation of Parker can be found in the original references (Parker 1990a and 1990b). Here only the most essential part of the Parker equation is presented so that we can discuss how the equation is modified and implemented in the EASI program.
The surface based bedload equation of Parker (1990a and 1990b) for a wide rectangular channel is as follows,
⎥⎥
⎦
⎤
⎢⎢
⎣
⎡
⎟⎟⎠
⎞⎜⎜⎝
⎛=
−β
ωφαsg
isgoi
iG
DD
GFBu
pRgQ3
*
(Equation A-1)
Where R denotes the submerged specific gravity of sediment; g denotes the acceleration of gravity; QG denotes volumetric bedload transport rate; B denotes channel width; u* denotes shear velocity; iD denotes the mean grain size of the i-th subrange; pi denotes the volumetric fraction of the i-th subrange in bedload; Fi denotes the volumetric fraction of the i-th subrange in the surface layer; Dsg denotes geometric mean grain size of the surface layer; φsgo is normalized Shields stress; ω is a function of the normalized Shields stress φsgo and the arithmetic standard deviation of the surface layer. Coefficients α and β are given as:
0951.0;00218.0 == βα (Equation A-2a–b)
Grain size is described both in diameter and in ψ-scale, which is the negative of the more commonly used φ-scale in geophysics community (1990a and 1990b).
( )iii Dog 2l=−= φψ (Equation A-3)
The grain size is divided into N subgroups bounded by N+1 grain sizes ψ1 (D1) to ψN+1 (DN+1). The mean grain size of the i-th subrange is then given as:
11 ,
2 ++ =
+= iii
iii DDD
ψψψ (Equation A-4a–b)
The surface layer mean grain size sψ and standard deviation ψσ s are as follows,
( )∑∑ −===
isis
N
iiis FF
22
1, ψψσψψ ψ (Equation A-5a–b)
and the geometric mean grain size is given as:
ssgD ψ2= (Equation A-5c)

Jackson Hydroelectric Project
Study 22: Sultan River Physical Process Studies Technical Report Page A-3 June 2008
Note that the surface based bedload equation of Parker applies only to particles too coarse to be transported in suspension, and Parker further suggested that the finest grain size (D1) be set as 2 mm as a common rule in field cases (Parker 1990a and 1990b).
-0.4
-0.3
-0.2
-0.1
0
0.1
0.2
0.1 1 10 100 1000
φsgo
log10(σ 0) and log10(ω0)
log10(ω0)
log10(σ0)
Figure A-1. Parameters σ0 and ω0 as functions of φsgo in Parker equation.
Parameter ω is a function of the normalized Shield stress φsgo,
( )11 00 −+= ω
σσ
ωψs
(Equation A-6)
where σ0 and ω0 are functions of φsgo given in Figure 1 (Parker 1990a and 1990b). The relations can also be found in tabulated form in Parker (1990a and 1990b).
The normalized Shield stress φsgo is acquired by dividing the surface based Shield stress *sgτ by a reference stress *
rτ ,
*
*
r
sgsgo
τ
τφ = (Equation A-7)

Jackson Hydroelectric Project
Page A-4 Study 22: Sultan River Physical Process Studies Technical Report June 2008
where the reference Shield stress *rτ was originally proposed by Parker (1990a and
1990b) as 0.0386. However, for this study the reference Shield stress *rτ was determined
from the relation proposed by Mueller et al. (2005) described in detail below (Section 2), which was calibrated with data from the tracer rock study where possible. The surface based Shield stress *
sgτ is defined as:
sgsg RgD
u 2** =τ (Equation A-8)
Shear velocity u* is assumed to obey the Keulegan resistance relation,
⎟⎟⎠
⎞⎜⎜⎝
⎛=
skhn
uu 115.2
*
l (Equation A-9)
in which u denotes flow velocity; h denotes water depth and ks denotes roughness height. Roughness height is defined slightly differently from the original work of Parker (1990a and 1990b) for simplicity,
28.12 sgsgs Dk σ= (Equation A-10)
where σsg denotes surface layer geometric standard deviation,
ψσσ ssg 2= (Equation A-11)
Note that the roughness height given in Equation (A-10) is an approximation of the original value given by Parker (1990a and 1990b), in which the roughness height was defined as twice of surface layer D90.
In case of a normal flow, shear velocity *u can be expressed as:
ghSu =* (Equation A-12)
in which S is channel bed slope.
Function G is given by Parker (1990a and 1990b) as:
( ) ( )[ ]1
59.11128.912.14exp
59.1853.015474
)(2.14
2
5.4
<≤≤−−−
>⎟⎟⎠
⎞⎜⎜⎝
⎛−
⎪⎩
⎪⎨
⎧=
φφφφφ
φφ
φG (Equation A-13)

Jackson Hydroelectric Project
Study 22: Sultan River Physical Process Studies Technical Report Page A-5 June 2008
In case of an arbitrary cross section, the cross section is divided into the main channel and a floodplain. In this case sediment transport over floodplain is assumed to be insignificant.
The surface based bedload equation of Parker (Equation A-1) and the Keulegan resistance relation (Equation A-9) are modified as follows,
( )( )βωφα
−= sgisgoi
c
iG DDGFSuA
pRQ /*
(Equation A-14)
⎟⎟⎠
⎞⎜⎜⎝
⎛=
s
hcc
kRn
uu 115.2
*
l (Equation A-15)
where Ac denotes flow area in the main channel; Rhc denotes hydraulic radius of the flow in the main channel;
c
chc P
AR = (Equation A-16)
and Pc denotes the wet perimeter of the main channel. Shear velocity, roughness height and grain size parameters in Equations A-14 and A-15 all refer to those in the main channel.

Jackson Hydroelectric Project
Page A-6 Study 22: Sultan River Physical Process Studies Technical Report June 2008
Floodplain hydraulics and flow continuity are brought in to close the equations,
2/13/21 SRAn
Q hffwf = (Equation A-17)
wwcwf QQQ =+ (Equation A-18)
f
fhf P
AR = (Equation A-19)
c
wcc A
Qu = (Equation A-20)
where n denotes Manning’s n for floodplain; fA denotes flow area in floodplain; fP denotes the wet perimeter of the floodplain; hfR denotes hydraulic radius of the floodplain; wfQ and wcQ denotes the discharge on floodplain and main channel respectively.
The following assumptions and limitations pertain to applying Parker’s surface-based bedload equation (Parker 1990a and 1990b) in the EASI model:
• Flow is assumed to be normal (steady and uniform) flow.
• Friction slope (energy slope) is approximated by the reach-averaged water surface slope surveyed at relatively low discharges.
• Sediment densities are assumed to be 2,650 kg m-3.
• The channel is assumed prismatic (continuous channel shape throughout the reach being modeled) based on the shape of the cross-section input; as a result, cross-sections used in the model should be located in uniform and representative sites of the entire reach.
• If floodplains exist at the cross-section, sediment transport occurs only in the main channel while the floodplains convey part of the flow at discharges that overtop the bank and connect with the floodplain.
• Parker’s (1990a and 1990b) bedload transport equation and the EASI model are intended to simulate sediment transport in alluvial reaches. The model is not designed to predict sediment transport capacities in bedrock channels or streams paved with large immobile boulders because large roughness elements can create reach-scale deviations in shear stress that limit the effectiveness of bedload transport equations based on total boundary shear (Yager et al. 2004). However, if an estimated bedload grain size distribution is given under supply-limited conditions, the model can be used to calculate the transport capacity of the bedload supply with a given hydrologic condition. Physical models of steep stream channels

Jackson Hydroelectric Project
Study 22: Sultan River Physical Process Studies Technical Report Page A-7 June 2008
with large roughness elements have shown that boulders can reduce sediment transport of mobile grain sizes by absorbing a significant amount of the fluid force, trap sediment that would otherwise be highly mobile, or induce scour and increase sediment transport due to creating turbulent flow structures. Thus, the effect of roughness elements on sediment transport and bed morphology can vary and is difficult to determine, for a given roughness configuration (Yager et al. 2004). Numerical theories and equations developed specifically for predicting bedload transport in boulder dominated systems are currently unavailable, and Parker’s (1990a and 1990b) bedload transport equation is deemed the best available option.
• Simulated sediment transport capacities should be viewed as long-term averages.
• As with any sediment transport equation, sediment transport capacities calculated with EASI model can have an error factor of 2 to 3.
REFERENCES
Mueller, E. R., J.Pitlick, and J. M. Nelson. 2005. Variation in the reference Shields stress for bed load transport in gravel-bed streams and rivers. Water Resources Research 41: W04006, doi: 10.1029/2004WR003692
Parker, G. 1990a. Surface-based bedload transport relation for gravel rivers. Journal of Hydraulic Research 28: 417-436.
Parker, G. 1990b. The Acronym Series of PASCAL program for computing bedload transport in gravel rivers. External Memorandum M-220. St. Anthony Falls Laboratory, University of Minnesota.
Yager, E., M. Schmeeckle, W. E. Dietrich, and J. W. Kirchner. 2004. The effect of large roughness elements on local flow and bedload transport. American Geophysical Union, AGU Fall Meeting: Abstract #H41G-05.


Jackson Hydroelectric Project
Study 22: Sultan River Physical Process Studies Technical Report Page B-1 June 2008
APPENDIX B EASI Model Output


Jackson Hydroelectric Project
Study 22: Sultan River Physical Process Studies Technical Report Page B-3 June 2008
Site Name: Kien’s Bar Time Period: Modern conditions Grain Size: Coarse INPUT Grain size distribution
Channel Width = 175.0 ft Channel Slope = 0.004 Daily Discharge data (1984 - 2007) from USGS gage 12138160
OUTPUT
EASI output Non-exceedance Probability (%)
Discharge (cfs)
Φago Qs (kt/a)
Depth (ft)
99.95 13128.8 1.55 657.785700532 7.992 99.7 4436.8 0.847 3.446038589 4.367 99.25 2458 0.615 0.024081407 3.169 98.5 2055 0.558 0.005340073 2.879 97.5 1855 0.529 0.002267713 2.726 96.5 1760 0.514 0.001462985 2.651 95.5 1700 0.505 0.001096134 2.603 94.5 1660 0.498 0.000899295 2.57 93.5 1630 0.494 0.000772893 2.545 92.5 1610 0.49 0.000697618 2.529 91.5 1590 0.487 0.000628902 2.512 90.5 1570 0.484 0.000566244 2.495 87.5 1515 0.475 0.000421439 2.449 82.5 1395 0.455 0.000213148 2.345 77.5 1215 0.423 0.000068470 2.181 72.5 1003.5 0.383 0.000014391 1.975 67.5 840 0.35 0.000003420 1.802 62.5 727.5 0.325 0.000001081 1.675 57.5 628 0.301 0.000000336 1.555 52.5 545.5 0.281 0.000000111 1.448
Average Annual Transport Rate is 0.672 kt/a
Grain Size (mm)
% Finer Surface
512 100 256 93 128 44 64 26 32 10 16 7 8 4 4 2 2 1

Jackson Hydroelectric Project
Page B-4 Study 22: Sultan River Physical Process Studies Technical Report June 2008
Site Name: Kien’s Bar Time Period: Modern conditions Grain Size: Fine INPUTS Grain size distribution
Channel Width = 175.0 ft Channel Slope = 0.004 Daily Discharge data (1984 - 2007) from USGS gage 12138160
OUTPUTS
EASI output Non-exceedance Probability (%)
Discharge (cfs)
Φago Qs (kt/a)
Depth (ft)
99.95 13128.8 2.9 10054.328 6.7 99.70 4436.8 1.6 408.476 3.6 99.25 2458.0 1.1 15.455 2.5 98.50 2055.0 1.0 4.338 2.3 97.50 1855.0 1.0 1.926 2.2 96.50 1760.0 0.9 1.247 2.1 95.50 1700.0 0.9 0.934 2.1 94.50 1660.0 0.9 0.761 2.0 93.50 1630.0 0.9 0.651 2.0 92.50 1610.0 0.9 0.586 2.0 91.50 1590.0 0.9 0.526 2.0 90.50 1570.0 0.9 0.472 2.0 87.50 1515.0 0.8 0.346 1.9 82.50 1395.0 0.8 0.168 1.8 77.50 1215.0 0.8 0.050 1.7 72.50 1003.5 0.7 0.009 1.5 67.50 840.0 0.6 0.002 1.4 62.50 727.5 0.6 0.001 1.3 57.50 628.0 0.5 0.000 1.2 52.50 545.5 0.5 0.000 1.1
Average Annual Transport Rate is 11.9 kt/a
Grain Size (mm)
% Finer Surface
256 100 128 99 64 78 32 25 16 4 8 0 4 0 2 0

Jackson Hydroelectric Project
Study 22: Sultan River Physical Process Studies Technical Report Page B-5 June 2008
Site Name: Kien’s Bar Time Period: Historical conditions Grain Size: Coarse INPUT Grain size distribution
Channel Width = 350.0 ft Channel Slope = 0.004 Daily Discharge data (1911-1931) from USGS gage 1213800
OUTPUT
EASI output Non-exceedance Probability (%)
Discharge (cfs)
Φago Qs (kt/a)
Depth (ft)
99.95 13659.2 1.075 117.5402238 5.541 99.7 9184.2 0.863 9.072133161 4.45 99.25 5782.3 0.671 0.190304498 3.458 98.5 4152.3 0.561 0.011638105 2.894 97.5 3071.9 0.478 0.000944339 2.467 96.5 2586.9 0.437 0.000228823 2.254 95.5 2290 0.41 8.42719E-05 2.115 94.5 2065 0.389 3.62777E-05 2.004 93.5 1895 0.372 1.80718E-05 1.917 92.5 1760 0.358 9.94778E-06 1.846 91.5 1660 0.347 6.21163E-06 1.791 90.5 1590 0.34 4.39538E-06 1.752 87.5 1425 0.321 1.83073E-06 1.657 82.5 1195 0.294 4.53468E-07 1.516 77.5 1027.5 0.273 1.38635E-07 1.406 72.5 899.5 0.255 4.93129E-08 1.316 67.5 797 0.241 1.94613E-08 1.24 62.5 708 0.227 7.93358E-09 1.171 57.5 633 0.215 3.457E-09 1.109 52.5 566 0.204 1.55356E-09 1.051
Average Annual Transport Rate is 0.155 kt/a
Grain Size (mm)
% Finer Surface
512 100 256 93 128 44 64 26 32 10 16 7 8 4 4 2 2 1

Jackson Hydroelectric Project
Page B-6 Study 22: Sultan River Physical Process Studies Technical Report June 2008
Site Name: Kien’s Bar Time Period: Historical conditions Grain Size: Fine INPUT Grain size distribution
Channel Width = 350.0 ft Channel Slope = 0.004 Daily Discharge data (1911-1931) from USGS gage 12138000
OUTPUT
EASI output Non-exceedance Probability (%)
Discharge (cfs)
Φago Qs (kt/a)
Depth (ft)
99.95 13659.2 2.009 3846.41 4.556 99.7 9184.2 1.597 949.9828 3.622 99.25 5782.3 1.225 86.17603 2.778 98.5 4152.3 1.014 9.362055 2.301 97.5 3071.9 0.856 0.781355 1.94 96.5 2586.9 0.777 0.173611 1.762 95.5 2290 0.726 0.059584 1.646 94.5 2065 0.685 0.024076 1.553 93.5 1895 0.653 0.011363 1.481 92.5 1760 0.627 0.005965 1.421 91.5 1660 0.607 0.003585 1.376 90.5 1590 0.592 0.002465 1.343 87.5 1425 0.558 0.000953 1.265 82.5 1195 0.506 0.000208 1.148 77.5 1027.5 0.466 5.7E-05 1.057 72.5 899.5 0.433 1.83E-05 0.983 67.5 797 0.406 6.52E-06 0.921 62.5 708 0.381 2.39E-06 0.864 57.5 633 0.359 9.28E-07 0.813 52.5 566 0.338 3.63E-07 0.766
Average Annual Transport Rate is 8.18 kt/a
Grain Size (mm)
% Finer Surface
256 100 128 99 64 78 32 25 16 4 8 0 4 0 2 0

Jackson Hydroelectric Project
Study 22: Sultan River Physical Process Studies Technical Report Page B-7 June 2008
Site Name: Kien’s Bar Time Period: Modern conditions Grain Size: Coarse Broad INPUT Grain size distribution
Channel Width = 350.0 ft Channel Slope = 0.004 Daily Discharge data (1984 - 2007) from USGS gage 12138160
OUTPUT
EASI output Non-exceedance Probability (%)
Discharge (cfs)
Φago Qs (kt/a)
Depth (ft)
99.95 13128.8 1.051 96.6592 5.421 99.7 4436.8 0.582 0.020302 2.999 99.25 2458 0.426 0.00015 2.194 98.5 2055 0.388 3.49E-05 1.999 97.5 1855 0.368 1.52E-05 1.896 96.5 1760 0.358 9.95E-06 1.846 95.5 1700 0.352 7.52E-06 1.813 94.5 1660 0.347 6.21E-06 1.791 93.5 1630 0.344 5.37E-06 1.774 92.5 1610 0.342 4.86E-06 1.763 91.5 1590 0.34 4.4E-06 1.752 90.5 1570 0.338 3.97E-06 1.741 87.5 1515 0.332 2.99E-06 1.709 82.5 1395 0.318 1.55E-06 1.639 77.5 1215 0.296 5.17E-07 1.529 72.5 1003.5 0.269 1.15E-07 1.389 67.5 840 0.247 2.91E-08 1.273 62.5 727.5 0.23 9.73E-09 1.186 57.5 628 0.214 3.26E-09 1.105 52.5 545.5 0.2 1.21E-09 1.033
Average Annual Transport Rate is 0.097 kt/a
Grain Size (mm)
% Finer Surface
512 100 256 93 128 44 64 26 32 10 16 7 8 4 4 2 2 1

Jackson Hydroelectric Project
Page B-8 Study 22: Sultan River Physical Process Studies Technical Report June 2008
Site Name: Kien’s Bar Time Period: Modern conditions Grain Size: Fine Broad INPUT Grain size distribution
Channel Width = 350.0 ft Channel Slope = 0.004 Daily Discharge data (1984 - 2007) from USGS gage 12138160
OUTPUT
EASI output Non-exceedance Probability (%)
Discharge (cfs)
Φago Qs (kt/a)
Depth (ft)
99.95 13128.8 1.963 3423.531623 4.453 99.7 4436.8 1.053 15.27003 2.389 99.25 2458 0.755 0.110956931 1.712 98.5 2055 0.683 0.023075106 1.549 97.5 1855 0.645 0.009433099 1.463 96.5 1760 0.627 0.005965099 1.421 95.5 1700 0.615 0.004410184 1.394 94.5 1660 0.607 0.003585033 1.376 93.5 1630 0.601 0.00305934 1.362 92.5 1610 0.597 0.002748084 1.353 91.5 1590 0.592 0.002465283 1.343 90.5 1570 0.588 0.002208635 1.334 87.5 1515 0.577 0.00162077 1.308 82.5 1395 0.551 0.000792943 1.25 77.5 1215 0.511 0.000240532 1.158 72.5 1003.5 0.46 4.65268E-05 1.043 67.5 840 0.418 1.01922E-05 0.947 62.5 727.5 0.386 3.00681E-06 0.876 57.5 628 0.357 8.68369E-07 0.81 52.5 545.5 0.331 2.66139E-07 0.751
Average Annual Transport Rate is 03.49 kt/a
Grain Size (mm)
% Finer Surface
256 100 128 99 64 78 32 25 16 4 8 0 4 0 2 0

Jackson Hydroelectric Project
Study 22: Sultan River Physical Process Studies Technical Report Page B-9 June 2008
Site Name: Chaplain’s Bar Time Period: Modern conditions Grain Size: Coarse INPUT Grain size distribution
Channel Width = 150.0 ft Channel Slope = 0.013 Daily Discharge data (1984 - 2007) from USGS gage 12137800
OUTPUT
EASI output Non-exceedance Probability (%)
Discharge (cfs)
Φago Qs (kt/a)
Depth (ft)
99.95 10590 3.518 25999.57 5.64 99.7 3015 1.78 1100.16 2.854 99.25 1207 1.107 77.43614 1.775 98.5 754.5 0.876 6.386297 1.404 97.5 476.5 0.701 0.227497 1.125 96.5 376.5 0.628 0.040031 1.007 95.5 329.5 0.59 0.015216 0.947 94.5 302.5 0.568 0.008237 0.91 93.5 281 0.549 0.004872 0.88 92.5 263.5 0.533 0.003092 0.855 91.5 250 0.521 0.002137 0.835 90.5 240.5 0.512 0.00163 0.821 87.5 225 0.497 0.001026 0.797 82.5 209 0.481 0.000617 0.772 77.5 201.5 0.474 0.00048 0.76 72.5 194 0.466 0.000371 0.747 67.5 187 0.459 0.000289 0.735 62.5 182 0.453 0.000241 0.727 57.5 177.5 0.449 0.000203 0.719 52.5 172.5 0.443 0.000168 0.71
Average Annual Transport Rate is 30.9 kt/a
Grain Size (mm)
% Finer Surface
512 100 256 93 128 44 64 26 32 10 16 7 8 4 4 2 2 0

Jackson Hydroelectric Project
Page B-10 Study 22: Sultan River Physical Process Studies Technical Report June 2008
Site Name: Chaplain’s Bar Time Period: Modern conditions Grain Size: Fine INPUT Grain size distribution
Channel Width = 150.0 ft Channel Slope = 0.013 Daily Discharge data (1984 - 2007) from USGS gage 12137800
OUTPUT
EASI output Non-exceedance Probability (%)
Discharge (cfs)
Φago Qs (kt/a)
Depth (ft)
99.95 10590 6.543 96829.21 4.565 99.7 3015 3.183 11604.61 2.221 99.25 1207 1.907 1258.017 1.33 98.5 754.5 1.473 213.5293 1.028 97.5 476.5 1.149 18.37623 0.802 96.5 376.5 1.013 3.95464 0.707 95.5 329.5 0.944 1.470272 0.659 94.5 302.5 0.903 0.756391 0.63 93.5 281 0.868 0.420015 0.606 92.5 263.5 0.84 0.249471 0.586 91.5 250 0.817 0.162634 0.57 90.5 240.5 0.801 0.118744 0.559 87.5 225 0.773 0.069222 0.54 82.5 209 0.744 0.038049 0.519 77.5 201.5 0.73 0.028291 0.51 72.5 194 0.716 0.020813 0.5 67.5 187 0.703 0.015467 0.49 62.5 182 0.693 0.012431 0.484 57.5 177.5 0.684 0.010161 0.477 52.5 172.5 0.674 0.008075 0.471
Average Annual Transport Rate is 151 kt/a
Grain Size (mm)
% Finer Surface
256 100 128 99 64 78 32 25 16 4 8 0 4 0 2 0

Jackson Hydroelectric Project
Study 22: Sultan River Physical Process Studies Technical Report Page B-11 June 2008
Site Name: Chaplain’s Bar Time Period: Historical conditions Grain Size: Coarse INPUT Grain size distribution
Channel Width = 150.0 ft Channel Slope = 0.031 Daily Discharge data (1974 – 1983) from USGS gage 12138150
OUTPUT
EASI output Non-exceedance Probability (%)
Discharge (cfs)
Φago Qs (kt/a)
Depth (ft)
99.95 17950 8.834 483729.6 5.938 99.7 9455 6.21 186354 4.175 99.25 5506.3 4.641 73596.49 3.12 98.5 3976.6 3.906 39380.88 2.626 97.5 3035.3 3.391 22375.79 2.28 96.5 2570 3.112 15486.02 2.092 95.5 2300 2.939 11962.99 1.976 94.5 2100 2.806 9662.882 1.886 93.5 1960 2.709 8167.134 1.821 92.5 1841.2 2.624 7051.339 1.764 91.5 1731.2 2.544 6057.758 1.71 90.5 1640 2.476 5312.262 1.664 87.5 1460 2.336 4074.505 1.57 82.5 1220 2.137 2686.394 1.436 77.5 1050 1.985 1878.906 1.334 72.5 925 1.867 1390.397 1.255 67.5 820 1.761 1044.088 1.184 62.5 729 1.665 787.9159 1.12 57.5 649.9 1.577 601.5637 1.06 52.5 573.4 1.488 447.0969 1
Average Annual Transport Rate is 3497 kt/a
Grain Size (mm)
% Finer Surface
512 100 256 93 128 44 64 26 32 10 16 7 8 4 4 2 2 0

Jackson Hydroelectric Project
Page B-12 Study 22: Sultan River Physical Process Studies Technical Report June 2008
Site Name: Chaplain’s Bar Time Period: Historical conditions Grain Size: Fine INPUT Grain size distribution
Channel Width = 150.0 ft Channel Slope = 0.031 Daily Discharge data (1974 - 1983) from USGS gage 12138150
OUTPUT
EASI output Non-exceedance Probability (%)
Discharge (cfs)
Φago Qs (kt/a)
Depth (ft)
99.95 17950 16.469 663532.2 4.819 99.7 9455 11.37 325821.4 3.327 99.25 5506.3 8.348 170128 2.443 98.5 3976.6 6.943 111665.3 2.032 97.5 3035.3 5.965 76989.62 1.745 96.5 2570 5.435 60535.34 1.59 95.5 2300 5.109 51247.07 1.495 94.5 2100 4.857 44562.46 1.421 93.5 1960 4.675 39991.24 1.368 92.5 1841.2 4.516 36181.26 1.321 91.5 1731.2 4.365 32734.68 1.277 90.5 1640 4.237 29934.28 1.24 87.5 1460 3.974 24582.92 1.163 82.5 1220 3.602 17873.28 1.054 77.5 1050 3.32 13493.77 0.971 72.5 925 3.099 10514.46 0.907 67.5 820 2.904 8205.378 0.85 62.5 729 2.726 6373.804 0.798 57.5 649.9 2.564 4954.664 0.75 52.5 573.4 2.399 3736.184 0.702
Average Annual Transport Rate is 12142 kt/a
Grain Size (mm)
% Finer Surface
256 100 128 99 64 78 32 25 16 4 8 0 4 0 2 0

Jackson Hydroelectric Project
Study 22: Sultan River Physical Process Studies Technical Report Page B-13 June 2008
Site Name: Bypass’ Bar Time Period: Historical conditions Grain Size: Fine INPUT Grain size distribution
Channel Width = 130.0 ft Channel Slope = 0.017 Daily Discharge data (1934 - 1971) from USGS gage 12137500
OUTPUT
EASI output Non-exceedance Probability (%)
Discharge (cfs)
Φago Qs (kt/a)
Depth (ft)
99.95 17950 14.747 308401.8 6.347 99.7 9455 10.165 141736.6 4.375 99.25 5506.3 7.452 68473.03 3.208 98.5 3976.6 6.192 42277.56 2.665 97.5 3035.3 5.315 27490.37 2.288 96.5 2570 4.84 20717.06 2.083 95.5 2300 4.548 17028.73 1.958 94.5 2100 4.323 14434.58 1.861 93.5 1960 4.159 12691.82 1.79 92.5 1841.2 4.017 11271.78 1.729 91.5 1731.2 3.882 10013.79 1.671 90.5 1640 3.767 9001.621 1.621 87.5 1460 3.532 7096.488 1.52 82.5 1220 3.199 4843.759 1.377 77.5 1050 2.946 3442.563 1.268 72.5 925 2.749 2551.433 1.183 67.5 820 2.575 1918.719 1.108 62.5 729 2.416 1449.691 1.04 57.5 649.9 2.27 1094.01 0.977 52.5 573.4 2.123 798.0341 0.914
Average Annual Transport Rate is 4026 kt/a
Grain Size (mm)
% Finer Surface
256 100 128 96 64 81 32 39 16 14 8 4 4 3 2 0

Jackson Hydroelectric Project
Page B-14 Study 22: Sultan River Physical Process Studies Technical Report June 2008
Site Name: Bypass’ Bar Time Period: Historical conditions Grain Size: Coarse INPUT Grain size distribution
Channel Width = 130.0 ft Channel Slope = 0.017 Daily Discharge data (1934 - 1971) from USGS gage 12137500
OUTPUT
EASI output Non-exceedance Probability (%)
Discharge (cfs)
Φago Qs (kt/a)
Depth (ft)
99.95 17950 12.66 259516.4 6.873 99.7 9455 8.782 106478.2 4.768 99.25 5506.3 6.477 45135.7 3.516 98.5 3976.6 5.403 25319.46 2.934 97.5 3035.3 4.654 14984.08 2.527 96.5 2570 4.248 10639.69 2.307 95.5 2300 3.998 8397.28 2.171 94.5 2100 3.805 6894.423 2.066 93.5 1960 3.665 5899.721 1.99 92.5 1841.2 3.543 5096.998 1.924 91.5 1731.2 3.427 4411.184 1.861 90.5 1640 3.329 3887.255 1.807 87.5 1460 3.127 2916.242 1.698 82.5 1220 2.841 1819.435 1.542 77.5 1050 2.623 1225.138 1.424 72.5 925 2.454 889.5105 1.332 67.5 820 2.303 672.3995 1.25 62.5 729 2.166 515.7822 1.176 57.5 649.9 2.04 394.0408 1.108 52.5 573.4 1.913 296.3453 1.038
Average Annual Transport Rate is 2202 kt/a
Grain Size (mm)
% Finer Surface
1024 100 512 99 256 98 128 80 64 58 32 36 16 20 8 10 4 1

Jackson Hydroelectric Project
Study 22: Sultan River Physical Process Studies Technical Report Page B-15 June 2008
Site Name: Bypass’ Bar Time Period: Modern conditions Grain Size: Coarse INPUT Grain size distribution
Channel Width = 130.0 ft Channel Slope = 0.017 Daily Discharge data (1984 - 2006) from R2 Resources Consulting.
OUTPUT
EASI output Non-exceedance Probability (%)
Discharge (cfs)
Φago Qs (kt/a)
Depth (ft)
99.95 10722.5 9.43 127979.67 5.12 99.7 3054.5 4.67 15175.34 2.54 99.25 941.7 2.48 924.99 1.35 98.5 558.5 1.89 279.06 1.02 97.5 348.8 1.49 90.86 0.81 96.5 265.8 1.30 44.34 0.71 95.5 227.5 1.20 27.68 0.65 94.5 200.2 1.13 17.68 0.61 93.5 179.5 1.07 11.53 0.58 92.5 167.5 1.04 8.50 0.56 91.5 158.1 1.01 6.44 0.55 90.5 147.7 0.98 4.48 0.53 87.5 129.1 0.92 2.01 0.50 82.5 107.6 0.85 0.60 0.46 77.5 93.7 0.80 0.23 0.43 72.5 83.3 0.75 0.10 0.41 67.5 75.1 0.72 0.05 0.39 62.5 69.1 0.70 0.03 0.38 57.5 64.3 0.67 0.02 0.37 52.5 59.9 0.65 0.01 0.36
Average Annual Transport Rate is 198 kt/a
Grain Size (mm)
% Finer Surface
1024 100 512 99 256 98 128 80 64 58 32 36 16 20 8 10 4 1

Jackson Hydroelectric Project
Page B-16 Study 22: Sultan River Physical Process Studies Technical Report June 2008
Site Name: Bypass’ Bar Time Period: Modern conditions Grain Size: Fine INPUT Grain size distribution
Channel Width = 130.0 ft Channel Slope = 0.017 Daily Discharge data (1984 - 2006) from R2 Resources Consulting.
OUTPUT
EASI output Non-exceedance Probability (%)
Discharge (cfs)
Φago Qs (kt/a)
Depth (ft)
99.95 10722.5 10.932 166230.9426 4.705 99.7 3054.5 5.334 27779.45551 2.296 99.25 941.7 2.776 2664.807804 1.195 98.5 558.5 2.093 743.5197161 0.901 97.5 348.8 1.631 178.628442 0.702 96.5 265.8 1.415 69.7480705 0.609 95.5 227.5 1.306 38.96498951 0.562 94.5 200.2 1.223 23.21656661 0.526 93.5 179.5 1.157 14.39413265 0.498 92.5 167.5 1.117 10.47580466 0.481 91.5 158.1 1.085 7.876841543 0.467 90.5 147.7 1.049 5.54191217 0.451 87.5 129.1 0.981 2.53582359 0.422 82.5 107.6 0.896 0.74681384 0.386 77.5 93.7 0.838 0.273390797 0.361 72.5 83.3 0.791 0.113563116 0.341 67.5 75.1 0.752 0.051928127 0.324 62.5 69.1 0.723 0.027981538 0.311 57.5 64.3 0.699 0.016285348 0.301 52.5 59.9 0.676 0.00963913 0.291
Average Annual Transport Rate is 301 kt/a
Grain Size (mm)
% Finer Surface
256 100 128 96 64 81 32 39 16 14 8 4 4 3 2 0

Jackson Hydroelectric Project
Study 22: Sultan River Physical Process Studies Technical Report Page C-1 June 2008
APPENDIX C 2007 Pebble Count Data


Jackson Hydroelectric Project
Study 22: Sultan River Physical Process Studies Technical Report Page C-3 June 2008
Table C-1 2007 Pebble count data.
% Finer
Kien's Bar particle size
(mm)
Chaplain Creek particle
size (mm)
Diversion Dam particle
size (mm)
Near Broken Horseshoe (~RM 11.3)
particle size (mm)
~RM 10.5 particle size
(mm) 1 2 10 5 4 4 2 4 13 6 4 6 3 6 14 9 4 10 4 8 15 9 8 10 5 9 18 12 9 11 6 10 18 14 11 12 7 15 20 14 12 13 8 20 20 15 12 14 9 28 20 15 12 14 10 30 20 22 14 14 11 37 20 22 15 16 12 40 20 22 15 18 13 42 23 22 15 18 14 42 24 22 16 19 15 48 25 23 17 20 16 50 25 24 19 22 17 52 26 25 20 22 18 53 28 25 21 28 19 55 28 28 22 28 20 57 28 29 22 29 21 57 28 29 23 30 22 58 29 30 23 33 23 58 29 31 23 34 24 60 30 32 23 35 25 60 32 34 23 35 26 64 35 35 24 38 27 68 35 35 24 40 28 72 35 35 25 42 29 75 35 36 25 45 30 78 35 38 26 45 31 80 35 39 26 50 32 80 36 39 27 50 33 83 36 40 28 50 34 90 37 44 30 55 35 91 37 45 31 55 36 98 38 45 31 56 37 100 38 47 31 56 38 100 40 50 32 65 39 105 40 52 32 65 40 108 40 52 33 65

Jackson Hydroelectric Project
Page C-4 Study 22: Sultan River Physical Process Studies Technical Report June 2008
% Finer
Kien's Bar particle size
(mm)
Chaplain Creek particle
size (mm)
Diversion Dam particle
size (mm)
Near Broken Horseshoe (~RM 11.3)
particle size (mm)
~RM 10.5 particle size
(mm) 41 110 40 53 33 67 42 122 40 53 34 70 43 125 40 54 34 75 44 128 40 54 35 78 45 135 40 54 35 80 46 137 43 55 35 80 47 140 45 57 35 80 48 140 46 58 35 80 49 141 46 60 36 85 50 150 47 60 36 90 51 150 50 60 37 90 52 150 50 63 38 95 53 150 50 65 38 100 54 150 50 66 38 105 55 150 50 67 38 110 56 150 50 70 39 112 57 155 50 70 40 120 58 160 51 72 40 125 59 160 52 72 40 125 60 160 53 72 41 130 61 160 53 78 45 135 62 160 55 80 45 135 63 160 55 82 46 140 64 160 55 82 47 145 65 162 55 85 47 145 66 165 55 85 51 145 67 170 55 85 53 155 68 170 55 86 54 160 69 170 55 90 55 165 70 170 55 90 55 175 71 170 56 90 55 185 72 175 58 92 57 190 73 178 60 95 57 210 74 180 60 96 60 210 75 180 60 97 60 210 76 180 62 98 62 220 77 190 62 100 63 222 78 190 64 104 63 230 79 190 65 104 63 240

Jackson Hydroelectric Project
Study 22: Sultan River Physical Process Studies Technical Report Page C-5 June 2008
% Finer
Kien's Bar particle size
(mm)
Chaplain Creek particle
size (mm)
Diversion Dam particle
size (mm)
Near Broken Horseshoe (~RM 11.3)
particle size (mm)
~RM 10.5 particle size
(mm) 80 190 65 110 64 240 81 200 65 114 64 270 82 200 66 119 65 270 83 202 68 120 65 280 84 205 68 122 67 290 85 210 72 127 67 310 86 220 72 140 68 350 87 220 75 147 70 350 88 220 75 149 73 360 89 225 75 150 79 365 90 225 75 157 80 370 91 235 75 160 83 400 92 240 76 164 85 400 93 245 80 180 87 400 94 260 90 185 100 420 95 275 90 185 100 430 96 280 106 190 120 440 97 280 114 200 132 440 98 300 116 230 137 500 99 300 120 235 145 540
100 350 206 260 160 620


Jackson Hydroelectric Project
Study 22: Sultan River Physical Process Studies Technical Report Page D-1 June 2008
APPENDIX D
Responses to Stakeholder Comments on Draft Report

Jackson Hydroelectric Project
Page D-2 Study 22: Sultan River Physical Process Studies Technical Report June 2008
STAKEHOLDER COMMENT LICENSEE RESPONSE Tulalip Tribes – Letter dated April 30, 2008 General Comment: The study was well-conceived and executed. The level of detail that went into the field work and modeling conducted as part of the RSP 22 project is appreciated. The summarized results and implications from this study will be especially useful as the relicensing stakeholders begin to discuss future Jackson Hydroelectric operations. The draft report appeared to achieve its stated objectives and provides a wealth of useful information on fluvial processes and channel morphology of the Sultan River, and how they have been affected by the construction and operation of the Henry M. Jackson Hydroelectric Project. The geomorphic synthesis section, in particular, added detail the Tribes felt was missing in the RSP 18 habitat study. We appreciate the thought and effort that went into this study, and commend the authors on a report well-written.
We appreciate your feedback.
General Comment: We note that the objectives of the study included an evaluation of how current and proposed operations of the Project affect physical processes and conditions of the river. We saw little discussion of the direct cause and effect relation between the observed changes and the Project. Moreover, we did not find a discussion of the likely effects of proposed operations, as promised. However, we also realize that this discussion should be deferred until practical proposals for future operation have been advanced by the licensee and vetted with the Tulalip Tribes, natural resource agencies, and stakeholders. We urge the licensee to include the principle investigators of RSP22 in future discussions of impacts anticipated under probable future operational and environmental (e.g., climate change) conditions.
We agree that the best time to discuss possible outcomes of future operations on geomorphic processes is when discussion of proposed operations is actually under discussion. We intend to have the investigators of RSP 22 involved in future discussions regarding the impacts associated with any proposed operational changes.

Jackson Hydroelectric Project
Study 22: Sultan River Physical Process Studies Technical Report Page D-3 June 2008
STAKEHOLDER COMMENT LICENSEE RESPONSE General Comment: The authors also specifically declined to discuss the likely impacts of their findings on aquatic species and their habitat. We suggest that these linkages be established in concert with observations made in the other relicensing studies. It is critical that we understand how effects have been propagated through the system, and how the biota has responded, and are likely to in the future. At a minimum, biological species and habitat components affected by past alterations of the physical system, or that would be vulnerable to future changes, should be identified. When this information is “left for future discussions” without explicitly noting how it will be integrated into the overall planning and analytical effort, we have to question whether the greater goal of comprehending and, where appropriate, mitigating for project impacts will be met. Mitigation must be informed by the type and degree of change that has occurred to date, and by changes expected in the future.
The intent of the geomorphic analysis was to present a state of the system report that focuses on physical processes in the Sultan River in the Project area. Discussion of the state of physical processes on aquatic species, or specific discussion of aquatic habitat as it pertains to critical species, was beyond the scope of the physical processes study. RSP 3 and RSP 18 will provide information on physical aquatic habitat conditions and the relationship between habitat and flow, as regulated by the Project.
General Comment: The finding that present rates and processes of sediment input into the Sultan River area are similar to pre-Project conditions seems counterintuitive given the presence of Spada Reservoir, which effectively intercepts all sediment conveyed from reaches upstream.
To be clear, “pre-Project” for purposes of this report refers to pre-Stage 2. Before 1984 (onset of Stage 2) the Sultan River still was dammed and presumably all bedload (and most of the suspended load) from the upper basin would have been sequestered behind the Dam. Prior to Stage 1 (i.e., predating any reservoir), it is likely that sediment passage through this reach was somewhat higher than during either Stage 1 or Stage 2, in most water years. During this time, however, the Sultan River upstream of RM 16.5 was almost certainly a depositional river. This conclusion was previously expressed in the Dunne report (1984). The 1919 USGS topographic maps shows that this was a low-gradient (approximate slope 0.0003), meandering river. Furthermore, in the broad valley of this reach, the only local input of landslide-derived sediment would have been in those presumably limited locations where the river impinged on its valleys walls. In contrast, the river downstream of Culmback Dam is steep with relatively high transport capacity and abundant sediment from the closely confining valley walls directly enters the channel via landsliding. The relative differences in sediment contributions between these two reaches would have been significant even

Jackson Hydroelectric Project
Page D-4 Study 22: Sultan River Physical Process Studies Technical Report June 2008
STAKEHOLDER COMMENT LICENSEE RESPONSE before any dam was constructed; following the first constructed dam (1964), the pattern of relative sediment contributions would have been determined for both “pre-Project” and “Project” conditions.
General Comment: The conclusion that peak flood magnitudes are “only modestly diminished” seems contrary to the results obtained in SP23 (IHA Study). That study found that both flood magnitudes and frequency has decreased, which although not attributed, was presumably due to the impacts of Project operation on downstream flows. It also demonstrated that the timing and duration of flows associated with floods and baseflows have changed over time.
We see no fundamental disagreement between these perspectives. Peak floods are lower than in the past but are still relatively high; this is in accord with the IHA study. In fact, the largest floods in OR1 are higher during Stage 2 than in Stage 1. We affirm the perspective that flood frequency is a particularly significant flow attribute, because many geomorphic processes (such as channel migration) can be quite effective even with moderate floods, if they occur frequently enough. This issue is most important in PR1 because the low gradient in this reach makes it especially responsive to even “modestly diminished” flood magnitudes or frequencies.
General Comment: Is sediment transport through the alluvial reach of the river expected to increase as vegetative encroachment continues? Will the frequency and length of side channels in this reach continue to decline due to vegetation encroachment? We note that the number and areal extent of side channels has also been reduced by the reduction in large wood in the lower river. Large wood accumulations play a critical role in side channel formation and maintenance.
We do not have enough information to say whether sediment transport will increase or decrease over time, but we do expect sediment transport capacity to remain high enough to accommodate the sediment supply. The side channels in PR1 appear to have formed through abandonment of formerly active channels. Given the static nature of the modern channel, we judge it unlikely that new side channels will form. Maintenance of the present side channels is most dependent on discharges with a magnitude and frequency great enough to scour them regularly. This study did not generate the type of information needed to quantify the frequency and magnitude of such discharges, however. Your comment regarding wood loading and side channel formation is noted, but high flows remain the dominant driver of formation and maintenance.
General Comment: Although sediment transport remains high through this reach, implying a dynamic system, can we expect fewer changes over time due to a reduction in high flow events?
As noted above, we judge that sediment transport capacity will remain high enough to accommodate the sediment supply. However, a reduced rate of change in the channel form would be a likely consequence of a reduction in the

Jackson Hydroelectric Project
Study 22: Sultan River Physical Process Studies Technical Report Page D-5 June 2008
STAKEHOLDER COMMENT LICENSEE RESPONSE frequency (and, to a lesser extent, the magnitude) with which such scouring events occur.
General Comment: In the lower 3 miles of the Sultan River, large woody debris is scarcer than in unmanaged western Washington rivers. Although large wood may still be relatively abundant in the upper river, the rate at which it is exported from this reach to the lower river is probably lower than normal. Any large pieces conveyed to the lower river are probably transported rapidly through the system, due the lack of anchor logs and large rooted trees. What is the significance of reduced loading rates and accumulations of large woody debris in this reach?
We are assuming that by upper river you mean RM 3 to 16.5. We have no analyses that illuminate the rate export of LWD from the upper river to the lower river. In pre-European times, it is likely that the loading of LWD in the gorge reach of the Sultan was much higher than what we see today, and that most wood introduced to the river would have been racked on very large logjams, as reported from other PNW unmanaged watersheds. In that case, export of LWD out of the upper river might actually have been lower in the past than today. Regardless of the change in historic export rates, however, we expect that forest management practices of many other entities, both past and present, are responsible for the state of the riparian forests and thus the dominant processes and rates of wood delivery into the Sultan River, not the instream flow regime as managed by the PUD.
General Comment: The authors note that large woody debris plays little functional role in habitat formation. Isn’t it safe to conclude that the relatively minor role played by large wood is due to its relative scarcity in the system, especially in the lower river? Large wood undoubtedly played a much more important role before loading rates diminished, and existing pieces were removed from the river. Reestablishment of normal loading rates would result in significant improvement of habitat quality and availability.
See the response above regarding causality. As for the likelihood that additional LWD would increase habitat quantity, regardless of the current shortage, we certainly agree—in this system, as in virtually all managed PNW watersheds. The “quality” of such LWD-formed habitat, however, would be a function of many other factors besides simply “loading rates.” The increase in such rates would be a necessary, but probably not sufficient, condition for “improvement in habitat quality and availability.”
General Comment: We note that the relatively low observed abundance of logs in this reach can probably be attributed more to the decrease in wood transported from upstream reaches, and from mature trees falling in the channel, than it is from logging and active removal.
This is certainly possible; we know of no definitive evidence either way. Our position on this issue may be speculative, but it is in line with the history of stream clearing in rivers through out the Pacific Northwest. One important process that we did not address in the report is recruitment of locally derived large woody debris via erosion and undercutting of mature riparian stands. Given the relatively static nature of the Sultan River under current operating procedures, there is little channel migration and therefore little wood introduced from the riparian forest immediately adjacent to the river in

Jackson Hydroelectric Project
Page D-6 Study 22: Sultan River Physical Process Studies Technical Report June 2008
STAKEHOLDER COMMENT LICENSEE RESPONSE PR1.
General Comment: According to the report, the channel in the alluvial reach of the Sultan River has remained “more-or-less the same” over the life of the project. However, the authors also cite extensive changes in the active channel, including its wetted area, planform and geometry that have occurred during this same period. The observed reduction of the area of the active channel by about one-third due to encroachment of riparian vegetation onto formerly active gravel bars appears to be a major change effected by the Project. These changes have profound biological consequences; primary and secondary production, and the availability and quality of juvenile salmonid rearing and overwintering habitat, in particular, has probably declined significantly. We therefore strongly encourage the evaluation of these and other impacts in the context of the findings on fluvial processes and channel morphology obtained in this study.
To clarify the initial sentence of this comment, we stated that general position of the river has stayed more or less the same. Examination of the 1919 mapping clearly shows that the Sultan River has not moved from its present position since at least 1919. There have likely been some avulsions and channel migration, but no wholesale migration of the channel across the valley bottom has occurred. Since Stage 2 operations commenced, the channel position has not changed but, as documented in the report and summarized in this response, the total active channel area has significantly declined. Any speculation about the biological consequences associated with channel changes must consider, in the context, the benefits associated with flow regulation including: increased survival to emergence because of flood control, improved rearing conditions because of flow augmentation during summer months, and the year-round presence of suitable temperature conditions for all salmonid life stages.
Executive Summary, Page v. This section states: “Reduced flood frequency, a consequence of Project operations, has played a role by allowing the establishment of riparian forests on gravel bars that would otherwise remain mobile and free of vegetation.” How much fish habitat has been lost by the geometry changes in PR1? Is it possible to say if the geometry has changed the suitability of the habitat for the species that currently use the river? About 1/3 of active bars have been lost to vegetation encroachment, but what does this mean for total habitat area?
Historically, pre-project, the Sultan River experienced extremes in hydrology. These hydrologic extremes coupled with existing geology (gradient, confinement) made the Sultan River poor and unreliable, in terms of salmon production. The existing instream flows have provided conditions that sustain a productive and in some instances a prolific resource. With that said, the “baseline” as defined in the ILP is the current condition. RSP 3, coupled with RSP 18, provides the best scientific means of quantifying fish habitat under the Project operation and factors in channel geometry and discharge.
Section 2.1, Page 5. This section’s title, “Sediment Input, Routing and Fate,” could be changed to “Sediment Input, Routing and Deposition.”
Thank you, we made the suggested edit.
Section 2.1.3.3.1, Page 20. Figure 2-3 captions should be changed to read “Note change in Y-axis scale relative to Figure 2-2.”
Thank you, we made the suggested edit.

Jackson Hydroelectric Project
Study 22: Sultan River Physical Process Studies Technical Report Page D-7 June 2008
STAKEHOLDER COMMENT LICENSEE RESPONSE Section 2.1.4.2, Page 23. The bathymetric data upstream of the diversion dam gives a sense of upstream transport between the emptying of the sediment plug. However, there is no mention of downstream effects of the sediment pulse when the diversion dam is lifted to provide sediment storage relief. Was this considered and if so, what were the downstream effects?
We did not consider this issue because the Diversion Dam spillway is normally left open during high flows so that sediment passes along with the flood pulse.
Section 2.2.2.3, Page 29. This section states: “Most of the encroachment to form these side channels took place prior to the onset of Stage 2 operations.” Does that mean that there has been no change in side channel location or character since the onset of Stage 2 operations? Hasn’t most of the vegetation encroachment happened since 1957? Is there evidence of active transport in these channels or are they expected to become overgrown and non-functional if the current trend continues?
Stage 2 began in 1984 when the Project began operating in its current incarnation. Stage 1 began in 1964. The locations of the side channel have not changed since Stage 2 commenced; however, they are more overgrown. Under existing flow management this trend appears likely to continue. We have no data to judge if, or when, these channels might entirely lose function. Based on visual inspection in the field and aerial photography, active sediment transport is present along each of the major side channels, albeit at different levels of activity. The upstream-most side channel (side channel 3) is more or less a subsidiary channel of the mainstem and transport frequency likely matches that of the mainstem. The side channel opposite Kien’s Bar (side channel 2) is wetted throughout the year and likely experiences active transport at a reduced frequency with respect to the mainstem. The side channel bounding Kien’s bar (side channel 1) is dry during summer low flow and has some riparian vegetation in some sections of its bed, and it probably has the lowest frequency of active transport.
Section 2.2.3, Page 35. The list at the bottom of the page has formatting errors.
We made your editorial suggestion.
Section 2.2.3, Page 37-38. Figures 2-16 and 2-17 would be better represented as bar graphs. The line graph implies a trend between reaches.
We realize that bar graphs are often used to depict reach-average data such as this. However, our specific intent was to depict the pattern of wood loading with the stream power index and log jam frequency, respectively. We settled on this graphical representation because we feel that it best conveys the pattern in otherwise noisy data. While there is not strictly a trend in the data as

Jackson Hydroelectric Project
Page D-8 Study 22: Sultan River Physical Process Studies Technical Report June 2008
STAKEHOLDER COMMENT LICENSEE RESPONSE calculated, there is certainly a pattern of wood loading between each river mile. The pattern of wood loading is lost if the data are plotted continuously rather than reach-averaged, and bar graphs did not seem convey the message as clearly as what we settled on. Thanks for your feedback.
Section 2.2.3, Page 37-38. Could the lack of wood in the lower reach be due to an increased transport capacity? Were there relic jams found in the areas with vegetation encroachment? Could the wood transported from the upper reaches be transported directly though PR1 because the channel has incised, stream power has increased and there are no bare bars to settle on in larger floods? It is clear from the analysis that stream power in PR1 is significantly lower than the upper confined reaches but it has presumably increased over the photo record?
By definition, total stream power has gone down over time in PR1 (total stream power varies by slope and discharge), and so we do not see how a reduction in wood in the lower river could be due to changes in stream power. In contrast, stream clearing almost certainly accounts for some of the loss. It is possible that some wood now passes though PR1 without being deposited. It is also possible that unit stream power (which is inversely related to channel width) in PR1 has increased since the inception of Stage 2, given the relatively narrower channel. We are not aware of a useful methodology to quantify each of these possible relationships. Thus, our analysis focused on an index of total stream power to make a relative comparison of the energy available to do work in the different process reaches.
Section 2.2.3, Page 37-38. Does the current active bar/streambed show signs of embeddedness in PR1? How does the current sediment compare with what has been lost to vegetation encroachment? Has the distribution of clasts changed?
We did no specific studies to characterize embeddedness because it was not determined to be a key issue for further study. In 2007, we made pebble counts along transects across the channel, rather than in patches as in the 1984 GeoEngineers study. We used this revised methodology because our intent was to collect particle size distribution of the bed surface for use in the sediment transport modeling. The bed at Kien’s Bar, for example, is relatively coarse (D50 = 150 mm), but whether this is a departure from past conditions cannot be judged from the data presently at hand. Repeat pebble counts at the 1984 GeoEngineers sites, however, are scheduled for summer 2008. These pebble counts will likely show a decrease is clast size in the lower river because many of the sites of the pebble counts are no longer part of the active channel but instead are areas of riparian forest. Several prior studies conducted since the inception of Stage 2 have shown no
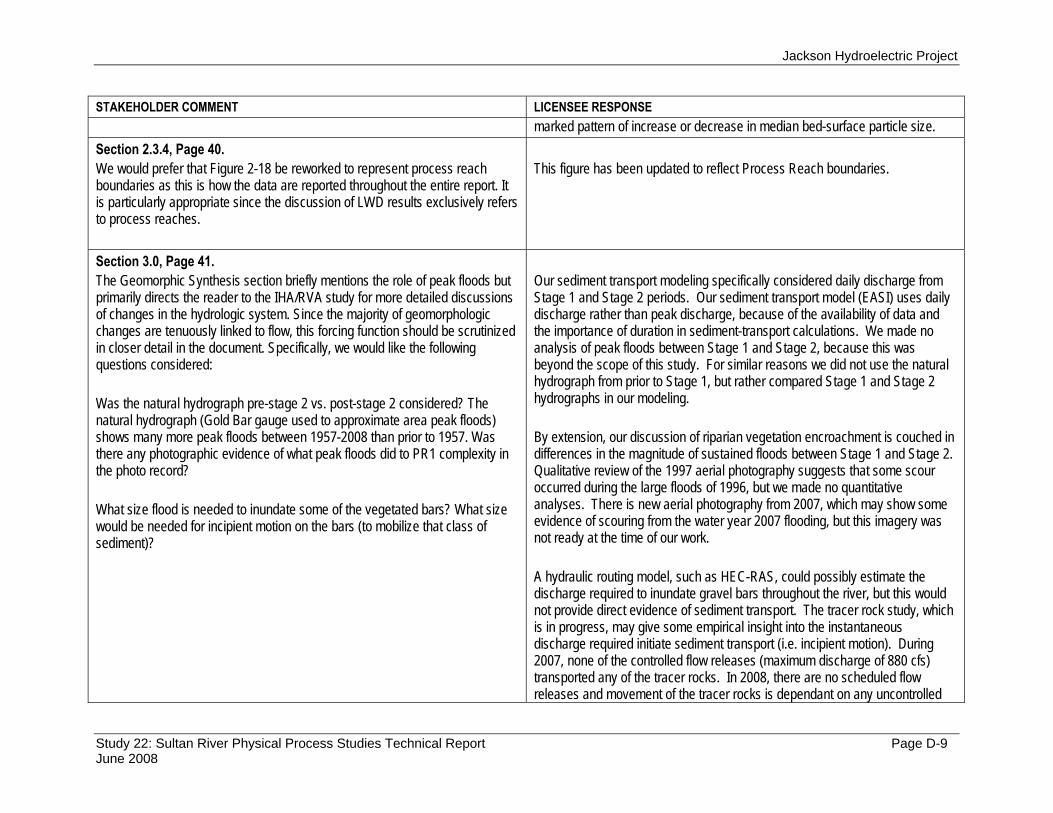
Jackson Hydroelectric Project
Study 22: Sultan River Physical Process Studies Technical Report Page D-9 June 2008
STAKEHOLDER COMMENT LICENSEE RESPONSE marked pattern of increase or decrease in median bed-surface particle size.
Section 2.3.4, Page 40. We would prefer that Figure 2-18 be reworked to represent process reach boundaries as this is how the data are reported throughout the entire report. It is particularly appropriate since the discussion of LWD results exclusively refers to process reaches.
This figure has been updated to reflect Process Reach boundaries.
Section 3.0, Page 41. The Geomorphic Synthesis section briefly mentions the role of peak floods but primarily directs the reader to the IHA/RVA study for more detailed discussions of changes in the hydrologic system. Since the majority of geomorphologic changes are tenuously linked to flow, this forcing function should be scrutinized in closer detail in the document. Specifically, we would like the following questions considered: Was the natural hydrograph pre-stage 2 vs. post-stage 2 considered? The natural hydrograph (Gold Bar gauge used to approximate area peak floods) shows many more peak floods between 1957-2008 than prior to 1957. Was there any photographic evidence of what peak floods did to PR1 complexity in the photo record? What size flood is needed to inundate some of the vegetated bars? What size would be needed for incipient motion on the bars (to mobilize that class of sediment)?
Our sediment transport modeling specifically considered daily discharge from Stage 1 and Stage 2 periods. Our sediment transport model (EASI) uses daily discharge rather than peak discharge, because of the availability of data and the importance of duration in sediment-transport calculations. We made no analysis of peak floods between Stage 1 and Stage 2, because this was beyond the scope of this study. For similar reasons we did not use the natural hydrograph from prior to Stage 1, but rather compared Stage 1 and Stage 2 hydrographs in our modeling. By extension, our discussion of riparian vegetation encroachment is couched in differences in the magnitude of sustained floods between Stage 1 and Stage 2. Qualitative review of the 1997 aerial photography suggests that some scour occurred during the large floods of 1996, but we made no quantitative analyses. There is new aerial photography from 2007, which may show some evidence of scouring from the water year 2007 flooding, but this imagery was not ready at the time of our work. A hydraulic routing model, such as HEC-RAS, could possibly estimate the discharge required to inundate gravel bars throughout the river, but this would not provide direct evidence of sediment transport. The tracer rock study, which is in progress, may give some empirical insight into the instantaneous discharge required initiate sediment transport (i.e. incipient motion). During 2007, none of the controlled flow releases (maximum discharge of 880 cfs) transported any of the tracer rocks. In 2008, there are no scheduled flow releases and movement of the tracer rocks is dependant on any uncontrolled
Jackson Hydroelectric Project
Page D-10 Study 22: Sultan River Physical Process Studies Technical Report June 2008
STAKEHOLDER COMMENT LICENSEE RESPONSE spill at Culmback Dam.
Barry Gall – US Forest Service – Letter dated May 2, 2008 General Comments: It is obvious that a great deal of thought and effort went into the design and execution of the plan, which is greatly appreciated. Revised Study Plan (RSP) 22 is well written, and generally easy to follow assumptions and design rationale. Our main concern continues to be how this report will be integrated with others to estimate impacts of current and proposed future operations on both instream and riparian habitats and the instream aquatic community. The Geomorphic Synthesis section of RSP 22 simply summarizes the results of the three components of the study. It is still unclear which Study Plans or other reports will discuss those links and provide the summary overview. In addition, which Study Plans or other reports will actually propose possible mitigations to partially offset the effects of current operations?
The Project operation and its interrelationship with aquatic habitat is informed by several studies including RSP 3, RSP 5, RSP 18, RSP 22, and RSP 23. As these reports are completed, they are distributed to stakeholders and members of the Aquatic Resources Working Group (ARWG) for review and comment. Once all reports are complete, the District will convene a series of meetings to discuss the integration of the results of these studies. The first of these meetings will likely occur in August / September. Discussion of possible PM&E measures will occur during the fall.
General Comment: The RSP repeatedly states that historically the watershed upstream of the current Culmback dam provided relatively little sediment compared to that delivered to the river in Process Reaches (PR) 2 and 3. The only basis for this claim that we found in the RSP appeared to be based on a qualitative review of the basin physiography above Culmback. Apparently until now there has been little or no bathymetric measurements made of the reservoir to estimate annual sediment transport into the reservoir. Is this true? It also appears that compared to the work conducted in the three reaches below Culmback Dam that relatively little effort was spent trying to estimate annual sediment budgets into the reservoir using other methods. How then can the claim that the portion of the watershed above Culmback historically delivered relatively little of the overall sediment in the drainage be justified?
Prior to any reservoir, it is likely that sediment passage through this reach was somewhat higher than during either Stage 1 or Stage 2, in most water years. During this time, however, the Sultan River upstream of RM 16.5 was almost certainly a depositional river. This conclusion was previously expressed in the Dunne report (1984). The 1919 USGS topographic maps shows that this was a low-gradient (approximate slope 0.0003), meandering river. Furthermore, in the broad valley of this reach, the only local input of landslide-derived sediment would have been in those presumably limited locations where the river impinged on its valleys walls. In contrast, the river downstream of Culmback Dam is steep with relatively high transport capacity and abundant sediment from the closely confining valley walls directly enters the channel via landsliding. The relative differences in sediment contributions between these two reaches would have been significant even before any dam was constructed; following the first constructed dam (1964), the pattern of relative sediment contributions would have been determined for both “pre-Project” and “Project” conditions.

Jackson Hydroelectric Project
Study 22: Sultan River Physical Process Studies Technical Report Page D-11 June 2008
STAKEHOLDER COMMENT LICENSEE RESPONSE General Comment: It does seem plausible that the current smaller magnitude, less frequent flows in PR 2 and PR3 still have the power to mobilize and transport the vast majority of sediments delivered to them. It would, however, be very helpful if the section on sediment transport included some discussion from published literature on channel maintenance flows, including specifics on the magnitude (relative to geomorphic bankfull) and frequency of such flows thought to be needed to provide effective or dominant discharge (e.g. Emmett, Andrews, etc.). The case for why there are still sufficiently large and sufficiently frequent channel maintenance flows should be strengthened. In addition, there appears to be no discussion of whether the reduction of channel width in the mainstem (reported as 32% comparing Stage 2 to Stage 1) or the reduction in number and size of side-channels (both related to changes in the hydrologic and sediment regimes and consequent vegetation encroachment) will continue under current or proposed future operational conditions. Nor is there any discussion in RSP 22 of the implications this reduction had on the quantity and quality of available instream habitat in PR1. Is there a discussion in SP18 or elsewhere of these topics? If not, where will such a discussion be?
Thanks for your suggestion and comments. “Channel maintenance flows” were not a specific element of this study, though clearly the altered hydrograph of Stage 2 has changed sediment scour, deposition, and channel planform processes in the alluvial reaches of the river. Riparian vegetation encroachment and side channel maintenance are also issues that are related the points you make. Given that the Sultan in the Project area is a regulated river, the concept of a “channel maintenance flow” has changed, and the present form of the channel reflects this. Under current operating procedures, discharge in the neighborhood of what was once a bankfull flow is now more dependant of how water is routed through the powerhouse than on seasonal runoff patterns. Thus, any appeal to the classic geomorphic literature would, in our judgment, provide little insight into the present condition of the Sultan River. From a purely process standpoint, the channel is simply adjusting to a new regime and some channel form will be maintained under this new regime (i.e. there is now a “new” channel maintenance flow). An important question at this point is what channel form is relevant and desired over the longer term?
General Comment: Parker (1990) is certainly one of the most appropriate sediment transport models to use for the Sultan River; however, it is known that there are no sections of PR1 elsewhere or where there are armored stream beds? If this is known, how is it known? If there are such sections, which would seem likely, it would seem that the Parker and Klingeman model for transport in reaches with pave and sub-pave substrates would be more appropriate. Was this latter model, or other models appropriate for armored reaches considered?
During the course of our 2007 fieldwork, we did not encounter any reaches where the bed surface was decidedly imbricate or appeared to have a pavement. In most places, particles were loose and easily dislodged from their position on the bed.
General Comment: The RSP states that the LWD loading in PR1 is well below regional averages for similar rivers. Hence, although the RSP does not overtly state so, LWD plays a proportionally smaller role in forming complex, high quality habitat (and
We agree with your judgments about the reduced role of reduced LWD in forming instream habitat. We did not see, however, how a discussion of presumed (but ultimately speculative) historic LWD conditions would enhance

Jackson Hydroelectric Project
Page D-12 Study 22: Sultan River Physical Process Studies Technical Report June 2008
STAKEHOLDER COMMENT LICENSEE RESPONSE retaining sediment) in PR1. What actions, if any, are to be proposed for adding or increasing the rate of recruitment of LWD into PR1? Where will such a discussion occur? In addition, the RSP states that although the overall loading of LWD within PR2 and PR3 appears to be average to similar rivers in Washington, that proportionally little of it occurs in the wetted width of the channel during non-storm flows. It is stated that this is largely due to the riparian and uplands being dominated by immature and smaller mature second and third generation trees that evidently do not have the mass to remain in the channel during high storm flows. A discussion of what role LWD likely historically played in these reaches would be helpful, along with an estimate of when and where recruitment of large trees in some sections of PR2 and PR3 would have a significant impact on quality and quantity of instream habitat there. For instance, at that point in the future, under current or proposed operating conditions, might portions of PR2 and PR3 provide significantly more spawning or rearing habitat than it does now?
the questions that you are posing about future management actions. Historically, in pre-European times, it is likely that the loading of LWD in the gorge reach of the Sultan was much higher than what we see today, and that most wood introduced to the river would have been racked on very large logjams, as reported from other PNW unmanaged watersheds. The role (past, present, and future) of LWD in habitat creation within a boulder and bedrock dominated, high gradient, confined channel such as the Sultan is difficult to quantify, both spatially and temporally.
Section 2.1.1, page 3, 2nd paragraph, last sentence – The Clearwater River on the Olympic Peninsula was chosen as a reference channel for the Sultan River. What other channels in the Snohomish Basin were considered? High quality, detailed stream surveys exist for most of the major tributaries (and many of the small tributaries) within the Mt. Baker-Snoqualmie National Forest, including many in the Skykomish and Snoqualmie sub-basins.
We selected the Clearwater River specifically for the detailed sediment-input research that has been done there, work that can provide a quantitative basis for our analyses and that goes far beyond the stream surveys done throughout the PNW. In our judgment, these qualities far outweighed the benefits of mere geographic proximity.
Section 2.1.1.2, page 4, bullet 4 – What photo flight years were reviewed to map past landslides between 1958 and 2005? What scales were the photography, and what equipment was used to review the photos and digitize the landslides to put them into the Sarikhan and Pringle (2005) database? The scale and dates of the photography used will affect the accuracy of the landslide area estimates.
Please see the original reference, cited in the bibliography.
Section 2.1.2.1.1, page 13, first paragraph, first sentence – the EASI model is defined as the “Enhanced Acronym Series with Interface” in
EASI means “Enhanced Acronym Series with Interface”. We edited the

Jackson Hydroelectric Project
Study 22: Sultan River Physical Process Studies Technical Report Page D-13 June 2008
STAKEHOLDER COMMENT LICENSEE RESPONSE this section, but is defined as the “Estimate of Adversary Sequence Interruption” in Appendix A. Which is correct?
document accordingly.
Table 2-4, page 17 – The estimates of current versus historic transport capacity for Process Reaches 2 and 3 show a full order of magnitude decrease due to operational conditions. Please refer to the comments above (under General Comments) requesting a fuller discussion of channel maintenance flow literature to support why and how such a dramatic decrease in capacity could still result in the transport of delivered sediment, if indeed it still does. The Mass Balance component of the RSP discusses this, but do its results agree with what would be expected relative to channel maintenance flows occurring in these reaches?
Please see our response above.
Section 2.1.4.1, page 22 and 23 – Is the ongoing mapping of the reservoir the only effort conducted to date to try to estimate annual sediment loading into the reservoir? If not, please refer to other studies. Additionally, will the bathymetric maps now being created be accurate enough to show changes due to incoming sediments over a single water year, even if that input would be significant to the channel downstream of the dam if it were allowed to pass (i.e. is the mapping really sensitive enough to note any but a very large, unusual input of sediment over a single water year)?
We are conducting this survey only to estimate annual sediment loading into the reservoir, and thereby to provide an independent check of our other approaches to calculating sediment transport and sediment mass balance. If there is substantial sustained spill at Culmback Dam, we will re-survey the Diversion Dam pool. We believe that if appreciable sediment transport takes place (i.e., if our tracer rocks are translated tens of meters), our measurement method also should be able to detect a change in bed elevation.
Section 3.0, page 42, 2nd paragraph – The paragraph states that “While it is certain that sediment was transported from upstream of RM 16.5, the influx of sediment below RM 16.5 would have swamped this upstream supply. Based on basin physiography, we expect the vast majority of the sediment that comprises the channel boundary in the alluvial reach (PR1) in the lower three miles of the Sultan River is derived from PR2 immediately upstream, and this was likely the case before Stage 1 operations.” Please add information to this discussion that would support the claim that relatively little sediment historically came from the portion of the watershed upstream of Culmback Dam.
Please see our response above.
Section 3.0, page 43, 2nd and 3rd paragraphs –

Jackson Hydroelectric Project
Page D-14 Study 22: Sultan River Physical Process Studies Technical Report June 2008
STAKEHOLDER COMMENT LICENSEE RESPONSE Formatting problem, needs a little editing. Thank you, we made the suggested edit. Section 3.1.2, page 46, 1st paragraph – It might be good to remind the reader why LWD plays a relatively minor role in habitat formation in PR2 and PR3, even though they both have “relatively high wood loading”.
Thank you, we made the suggested edit.
Section 4.0, page 48, 1st bullet – RSP states “Prior to the inception of Stage 1 (1964), the Sultan River below RM 16.5 appeared to have received minimal delivery of coarse sediment from the upper watershed”. As mentioned earlier, what is the supporting data for that claim?
See our response above.
Richard E. Johnson – WA Department of Fish and Wildlife – Email dated May 12, 2008
Thank you for extending the comment period so that Al Wald and I could review conditions in the lower Sultan River, from the powerlines to the mouth, by floating and walking the river with Keith Binkley. We find the Draft Technical Report to be a detailed and useful analysis of geomorphic flow effects, particularly sediment and large woody debris transport, downstream of Culmback Dam. It provides essential information necessary for a comprehensive review that includes RSP 3 (Instream Flow Study), RSP 18 (Riverine, Riparian, and Wetland Habitat Assessment), and other studies.
We appreciate your feedback.
The report finds that reduction of the active channel area began with the completion of phase one in 1965, and since the completion of phase two in 1984 the channel has been reduced by about one-third due to encroachment of riparian vegetation onto formerly active gravel bars. We noted a prevalence of mature vegetation on the islands in the lower river during our field review as well. The report would benefit from some discussion of the results of the IHA analysis and changes, particularly reductions, in high flows that might account for some of this vegetation encroachment on the gravel bars and islands. How much of the vegetative encroachment and "disconnection" of the floodplain could be due to a lack of scouring events?
The reduction in frequency of scouring floods (i.e., “a lack of scouring events”) is likely the most important reason that bounding riparian forest has encroached on the channel.

Jackson Hydroelectric Project
Study 22: Sultan River Physical Process Studies Technical Report Page D-15 June 2008
STAKEHOLDER COMMENT LICENSEE RESPONSE The channel cross-sections (Figures 2.2 to 2.5) in the lower river show a progressive deepening of the channel from 1984-2007. We also noted during our field review numerous reaches of high, steep banks along this lower river area. The report would benefit from some discussion of whether the channel deepening is a result of vegetative encroachment and stabilization of the riparian gravels (due to a change in the high flow regime) or whether channel deepening may have occurred as a result of levee construction and removal of wood. It appears as though the "base level" of these alluvial reaches of the river are significantly lower than some prior condition.
The limited number of cross sections makes generalizing about incision or deposition throughout PR1 problematic. We agree that cross sections are suggestive of incision, especially coupled with other evidence that you observed; however, we are less certain that the entire extent of PR1 has incised. The most likely reasons for the observed narrowing and possible incision are the altered Stage 2 hydrograph, and the consequent encroachment of the channel, and the removal of LWD.
The cross-section at the upper site (Figure 2.6) shows the diversity of channel conditions and off-channel areas normally associated with highly productive fish habitat. Additional cross-sections in this area would be valuable in helping define the geomorphic characteristics and resource values of this reach. We understand RSP 3 (Instream Flow Study) will provide additional assessment of fish habitat conditions above the diversion dam and we look forward to reviewing those results.
Comment noted.
As per our comments on Study Plan 18, we are still not comfortable with the definition of "side channels" used for these reports. The requirement for discernable flow connected by an upstream inlet and downstream outlet does not represent the range of side channel characteristics we need for fish habitat assessments. The islands and meander bars on the Sultan River contain numerous overflow channels, of variable depths and lengths, that carry (or used to carry) high flows and have important instream functions. We still do not have an adequate characterization of the flow paths for high flows in this river environment. At some point, we need to compare a range of specific high flows and where those flows go to understand the "shifting habitat mosaic" so important to fish productivity in the Sultan River.
Quantitative assessments of fish habitat are currently being performed in RSP 3 at 18 transect locations in three side channels of Reach 1 of the Sultan River. Depths, velocities, substrate characteristics, and cover habitat were measured at 20 plus vertical locations across each transect under flow conditions ranging from low to high. The physical data collected in this study will be used to assess fish habitat for various species/life stages in side channels located in Reach 1. Time series analyses of fish habitat will be conducted, and compared with periodicities of the various species/life stages to assess fish habitat on a seasonal basis during wet, dry, and average years under pre- and post-project conditions.
Based on the reports we have reviewed so far, it appears that there is a clear need for a greater diversity in type and number of holding pools and cover for fish habitat throughout the lower eleven miles of the river. Because of vegetative encroachment on the meanders and gravel bars, for whatever reason, we see a need for reopening the side channel rearing habitat in at least
Your comments are noted.

Jackson Hydroelectric Project
Page D-16 Study 22: Sultan River Physical Process Studies Technical Report June 2008
STAKEHOLDER COMMENT LICENSEE RESPONSE the lower six miles of river. Reopening the side channels requires sufficient flow to keep them open as well. The addition of large wood could provide multiple benefits, such as retaining gravel, providing cover, increasing pools, and providing flow control for side channels. Pending additional information from the instream flow study, and based on the studies so far, we see a very real possibility of significant fish habitat benefits from providing fish passage at the diversion dam.
Your comments are noted. The results of several studies, including RSP 3 and RSP 20, will provide important information regarding the costs and benefits of providing fish passage at the Diversion Dam.
Thank you for the opportunity to provide these comments. We look forward to working with you to further discuss and develop specific actions to improve fish use and the ecological productivity of the Sultan River.
The District plans on convening meetings with the ARWG to discuss these issues. These meetings will likely commence during late August or early September. We look forward to your participation.