Embed Size (px)
Citation preview
1
1.0. Project Description
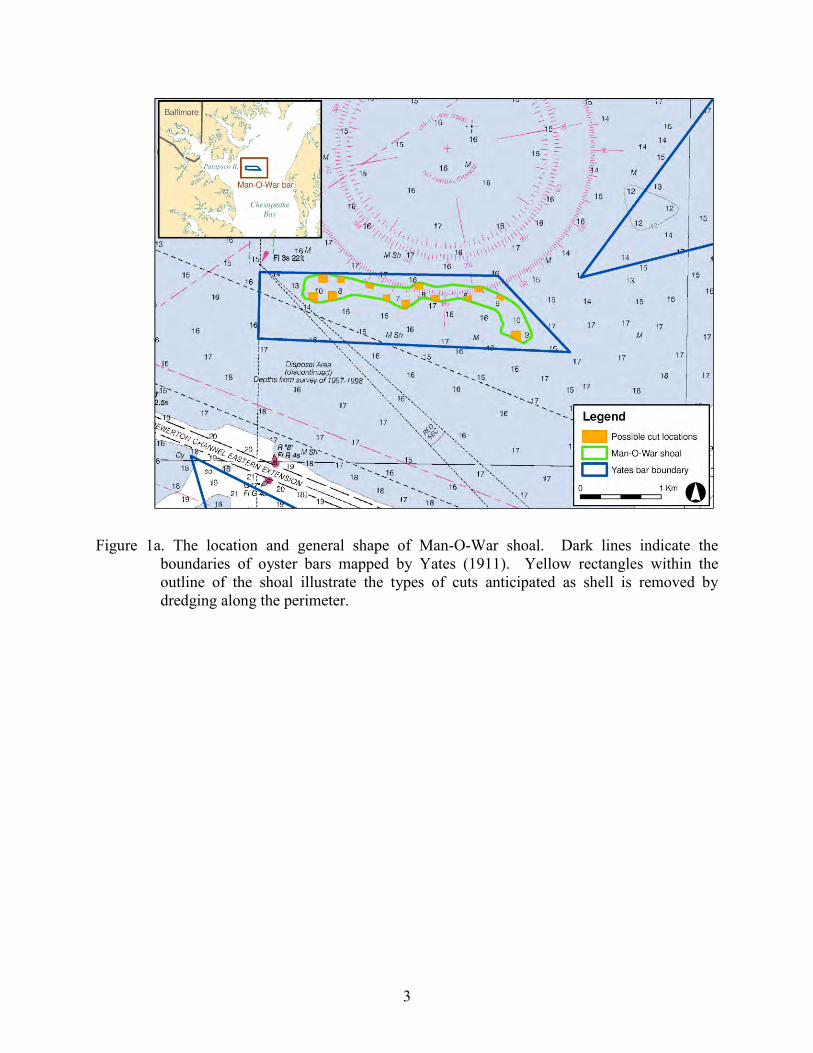
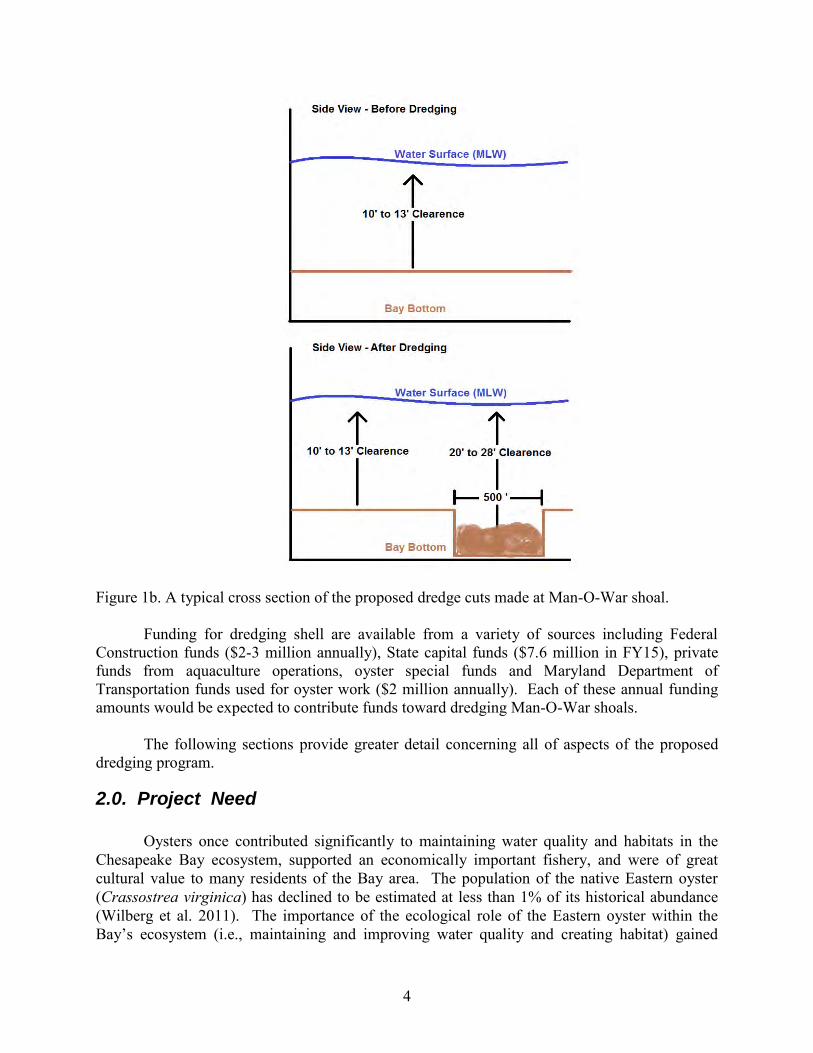
The Maryland Department of Natural Resources (MDNR) is proposing conducting a project to acquire old oyster shell at Man-O-War shoals in the upper Chesapeake Bay and assess the impacts of this proposed project. The purpose of this project is to acquire oyster shell that can be used in several ways to restore oyster populations and oyster fisheries in the Bay. Shell may be used to improve existing oyster bars to enhance natural recruitment, to provide a foundation for hatchery-spawned seed oysters deployed to encourage reestablishment of an abundant and self-sustaining oyster population, to provide substrate for leased bottom in support of aquaculture, and to provide substrate needed to sustain oyster fisheries in Maryland. All of these efforts are components of recommendations of the Chesapeake Bay Program’s 2000 Agreement, the Maryland Oyster Advisory Commission, the 2005 Oyster Management Plan, President Obama’s 2009 executive order to restore and protect Chesapeake Bay, Maryland’s 2010 oyster restoration and aquaculture development plan, and the 2014 Chesapeake Bay Watershed Agreement and are necessary to implement the preferred alternative specified in the Final Programmatic Environmental Impact Statement for Oyster Restoration in Chesapeake Bay Including the Use of a Native and/or Nonnative Oyster (USACE et al. 2009). Furthermore, Executive Order 13508 Strategy for Protecting and Restoring the Chesapeake Bay Watershed established a goal of restoring oyster populations in 20 tributaries of Chesapeake Bay by 2025. The new draft 2014 Chesapeake Bay Agreement is considering a goal of 10 tributaries (5 in Maryland and 5 in Virginia). The State of Maryland, National Oceanic and Atmospheric Administration (NOAA), U.S. Army Corps of Engineers (USACE) and academic scientists from University of Maryland Center for Environmental Sciences and Virginia Institute of Marine Sciences are all committed to achieving these goals. A 1988 Maryland Geological Survey (MGS) study of the Man-O-War shoal (Figure 1) indicated that the shoal comprises between 86 million and 103 million bushels of oyster shell in a 456 acre area (J. Halka, MGS, pers. comm.; Cuthbertson 1988). MDNR intends ultimately to remove approximately 30% of the available shell (about 30 million bushels) to use primarily to restore oyster habitat and oyster populations. In response to stakeholders’ concerns about the potential ecological effects of a shell-dredging project of this magnitude, MDNR is requesting an initial five-year permit to dredge five million bushels of shell as part of a comprehensive monitoring project to assess the ecological consequences of removing shell from the shoal. The comprehensive monitoring program, which is described in greater detail in Section 7.0, will be designed as a before-after-control-impact (BACI) study. Data on water quality, oyster populations, and fish and benthic communities will be collected seasonally at one to three proposed dredging sites and two reference locations at the shoal in Year 1 of the permit period. In Year 2, approximately two million bushels of shell will be removed using a hydraulic dredge making cuts at one to three locations along the periphery of the shoal. Each cut will be no wider than 500 feet and extend no more than one-third of the distance through the shoal (Figure 1a and 1b). The initial depth of the dredge cut will be approximately 30 feet deep but usually the cut will be backfilled by sediment and fines resulting in a final depth of the cut being 10 to 15 feet deep. The square feet of each cut will be 5,000 to 7,500 and the volume of each cut will range from 92,000 to 138,000 cubic yards. No dredge cut will occur on an area of the shoal that has
2
been planted with wild oyster seed or hatchery oyster seed within the past 10 years. The number of dredge cuts made will be dependent on how much shell each dredge cut contains. DNR will continue to make dredge cuts until the target bushels of shells is met. A minimum thickness of two feet of shell will be left in place at the bottom of each cut. The arrangement of dredge cuts is intended to provide irregular habitat features that would increase the surface area of hard substrate at Man-O-War shoal that is available for colonization by epibenthic biota and would attract fish that use hard-bottom habitat. Water quality will be monitored during the dredging process. In Year 2 and Year 3 of the permit period, water quality, oyster populations, and fish and benthic communities will be monitored seasonally in the dredged cut(s) and in two undisturbed reference locations at the shoal. Results of the monitoring program will be analyzed, and a report will be prepared at the end of Year 4. If findings of the studies indicate that the test dredging has produced no significant adverse effects, an additional three million bushels of shell will be dredged in Year 5 using peripheral cuts, as in Year 2. If dredging continues in Year 5, MDNR will submit an application to continue dredging at the shoal in future years until the maximum 30 million bushels of shell have been removed.
The permit requested at this time would allow dredging at any time of year. The optimal period to dredge shell for use in capturing natural spat set would be in early spring. Shell to be used for planting hatchery-produced seed oysters or for aquaculture could be dredged at any time of year. Dredging would be scheduled to minimize user conflicts (e.g., with commercial and recreational fishing) and impacts to natural resources. The oyster shell to be dredged from Man-O-War shoal will be planted on sanctuary bars for ecological restoration, be deployed at aquaculture sites and harvest reserves, and be planted on open harvest areas. Specific restoration sites will be identified in conjunction with the Maryland Interagency Workgroup, whose members include representatives from MDNR, NOAA, USACE, and the Oyster Recovery Partnership. This group coordinates large-scale oyster restoration projects in Chesapeake Bay. Some shell may be stockpiled for short periods if specific locations for planting have not been established before dredging begins. The shell that will be planted on open harvest areas will be directed by MDNR in consultation with County Commission advisory boards. Half of the shell will be evenly allocated to each County and the other half will be allocated proportionally based on the number of waterman paying oyster surcharges in each county.
3
Figure 1a. The location and general shape of Man-O-War shoal. Dark lines indicate the
boundaries of oyster bars mapped by Yates (1911). Yellow rectangles within the outline of the shoal illustrate the types of cuts anticipated as shell is removed by dredging along the perimeter.
4
Figure 1b. A typical cross section of the proposed dredge cuts made at Man-O-War shoal. Funding for dredging shell are available from a variety of sources including Federal
Construction funds ($2-3 million annually), State capital funds ($7.6 million in FY15), private funds from aquaculture operations, oyster special funds and Maryland Department of Transportation funds used for oyster work ($2 million annually). Each of these annual funding amounts would be expected to contribute funds toward dredging Man-O-War shoals. The following sections provide greater detail concerning all of aspects of the proposed dredging program.
2.0. Project Need
Oysters once contributed significantly to maintaining water quality and habitats in the
Chesapeake Bay ecosystem, supported an economically important fishery, and were of great cultural value to many residents of the Bay area. The population of the native Eastern oyster (Crassostrea virginica) has declined to be estimated at less than 1% of its historical abundance (Wilberg et al. 2011). The importance of the ecological role of the Eastern oyster within the Bay’s ecosystem (i.e., maintaining and improving water quality and creating habitat) gained
5
increased attention as a result of the precipitous decline of the oyster population during the 1980s. As a result, State and Federal agencies increasingly began working together to restore oysters. The Chesapeake Bay Program identified oyster restoration as a key component for improving the health of the Bay and established specific management goals for restoring the abundance of oysters in the Bay in its 1987, 1994, 2000 agreements and the 2014 draft agreement. The lead agencies responsible for preparing the Final Programmatic Environmental Impact Statement for Oyster Restoration in Chesapeake Bay Including the Use of a Native and/or Nonnative Oyster (PEIS) concluded that enhanced restoration activities for, and increased commercial cultivation (i.e. aquaculture) of, the native oyster will be the best approach to achieving ecological and economic objectives. Furthermore, restoration of the native oyster is a key component of President Obama’s 2009 executive order to restore and protect Chesapeake Bay and Maryland’s 2010 oyster restoration and aquaculture development plan.
The availability of hard substrate is critical for increasing the numbers of oysters in the
Bay; however, sedimentation and deterioration of oyster shell together are reducing hard-bottom habitat in Chesapeake Bay available for recruitment. Oyster larvae must adhere (set) to a clean hard substrate, preferably oyster shell, after two to three weeks in the water column, or they will die. In Chesapeake Bay, however, sediment that is washed into the Bay rapidly covers hard substrates, thereby reducing the amount of available habitat upon which oyster larvae can settle (Smith et al. 2005). Deterioration of old shell is another significant factor contributing to loss of oyster habitat. Old shell deteriorates as a result of disarticulation, bioerosion, breakage, and dissolution (Powell et al. 2006) at rates ranging from 20% to 50% per year (Mann 2007). The result of these combined forces is a severe and continuing decline in the area of suitable habitat for settlement of oyster larvae.
Oyster grounds in Maryland’s portion of Chesapeake Bay encompassed 329,977 acres
(1983 survey) including 214,772 acres on the Yates Bars surveyed between 1906 to 1911 (Smith et al 1997). New acoustic techniques for surveying the bottom of the Bay suggest that less than 1% of Maryland’s historic oyster grounds can be classified as clean or lightly sedimented shell. Most of the substrate that is suitable for settlement of oyster larvae is within areas where the State has planted shell recently. Between the Maryland Bay Bottom Survey (1978 to 1983) and recent surveys (1999 to 2000; Smith et al. 2005), the amount of habitat on sampled bars declined by nearly 70%, or about 3.5% per year (USACE et al. 2009). The current (2004) area of oyster habitat in Maryland’s portion of the Bay is estimated to be 43,892 acres (USACE et al. 2009 . Assuming that the rate of loss on the 16 bars sampled between 1999 and 2001 is representative of the rate of loss of habitat throughout the Bay, more than 2,500 acres of oyster habitat are lost each year without a sustained and growing oyster population (Smith et al 2005).
The “Repletion” program has been a significant element of Maryland’s oyster
management efforts in the past. The term repletion describes two approaches for encouraging settlement, growth, and survival of oysters by planting shell: (1) “permanent” plantings, in which shell is planted in areas where large spat sets occur naturally, and the resulting spat are left in place until they are large enough to be harvested; and (2) seed-area plantings, in which shell is planted in areas of high salinity where large spat sets are most likely, and the resulting spat are moved to areas of lower salinity to attempt to protect them from disease. Shell for the repletion
6
program was obtained by dredging buried shell from historical deposits located primarily in the upper Bay. This oyster shell dredging and planting program began in 1960, and about five million bushels were dredged and planted per year until 1990. Beginning in 1991, the program was reduced to about 1.5 to 2.8 million bushels per year. Some stakeholders opposed shell dredging because it alters the bottom substrate, may adversely affect other fisheries, and creates a sediment plume. The shell-dredging program ceased in 2006 when the dredging permit issued by USACE and the Maryland Department of Environment expired (DNR 2006). At that time, MDNR decided not to reapply for the permit required to continue the program.
In its 2009 report to the Governor and General Assembly, the Maryland Oyster Advisory
Commission (OAC) stated that a shortage of high-quality habitat for settlement and growth of oyster larvae represents a significant limitation of the oyster population’s potential for expansion and that recent limitations on the availability of dredged shell have curtailed shell-planting programs. The OAC recommended that MDNR apply for a permit to dredge shell from Man-O-War shoal.
As described in the PEIS, survey data collected from 1994 through 2006 showed no
statistically significant change in oyster abundance in Maryland, suggesting that the repletion program and other management actions over that time period did not result in an enhancement of the Bay’s oyster stock. Given the apparent failure of past management and enhancement approaches, both the PEIS and the OAC concluded that enhanced and new restoration measures need to be implemented. As such, Maryland developed and implemented its 2010 Comprehensive Oyster Management Plan.
Newer restoration methods that have shown promising signs of success involve creating
three-dimensional mounds of shell that mimic historical reef structures and grouping the mounds together to cover large areas. For example, the USACE created the largest network of sanctuary reefs in the Bay in the Great Wicomico River in 2004 (C. Seltzer, Norfolk District, USACE, pers. comm.; Schulte et al 2009). Low-relief reef (LRR) totals 54.8 acres; high-relief reef (HRR), on which the shell surface is elevated above the bottom, totals 29.8 acres. Sampling of the constructed reefs has shown positive results, including an increase in the local oyster population by a factor of 62, multiple age classes of oysters, strong recruitment over multiple years, and both vertical and cohesive growth of the reefs. The HRR appears to be accreting shell faster than it is being lost. The total population on these constructed reefs is estimated to be 184.5 million oysters, and this new population is a considered to represent direct augmentation of the wild oyster population in the Great Wicomico River. In 2011, the HRR and LRR reefs were sampled again and found that 80% of the HRR samples contained densities exceeding 50 oysters per meter square whereas only 13% LRR samples had densities exceeding 50 oysters per meter square in areas where the habitat suitability index was less then 0.3 (USACE 2013). Although significant mortality due to disease is expected in the future, recent research has suggested that this subpopulation exhibits a level of resistance to disease akin to that of a hatchery-produced strain of disease-resistant Eastern oysters (Carnegie & Burreson 2011). Overall, the outcome of the project in the Great Wicomico River differs from prior restoration efforts in several ways: (1) recruitment has been strong and steady for several years; (2) a significant proportion of the
7
constructed reefs is achieving positive shell balance; and (3) oysters are growing at greater densities than on any other sub tidal reefs in Chesapeake Bay.
In Maryland, oyster reef restoration projects are underway in Harris Creek and the Little
Choptank River. Instead of building mounds as in the Great Wicomico River, Maryland reefs are constructed by placing material at a thickness of 6-12” over areas ranging from 0.5 to 25.5 acres. The reefs have been constructed from fresh oyster shell, shell reclaimed from previous oyster restoration projects, clam shell, granite, and dredged oyster shell. Continued restoration efforts will require much greater amounts of shell than have been used historically in Maryland. Maryland’s repletion program involved spreading shell to a thickness of three to six inches over the footprints of historical bars. In the later years of that program, when only 1.5 to 2.8 million bushels of shell were being dredged per year, about 350 acres were planted with shell annually. That acreage represents only 14% of the amount of hard-bottom habitat estimated to be lost Bay-wide each year. Approaches such as those used in the Great Wicomico River, Harris Creek, and the Little Choptank River require significantly larger quantities of substrate. For example, an estimated 1.9 million bushels of shell were used to construct about 90 acres of three-dimensional reef in the Great Wicomico River; 5.1 million bushels of material are required to complete 212 acres of 6-12” reefs in Harris Creek. The total shell proposed to be dredged from Man-O-War shoal from this permit and future permits, about 30 million bushels, would be sufficient to create 6”-12” relief oyster bars covering about 1,000 acres, if all the shell were to be used to construct such bars. If the shell were to be used for low-relief restoration projects, even more acreage could be rehabilitated; however, medium-relief and high-relief reefs may be more resilient to siltation than low-relief structures and thus remain more viable for larval settlement for a longer period of time.
The objective of the proposed shell-dredging program is to use some of the dredged shell
for ecological restoration (i.e. placed in areas off-limits to commercial harvesting). As noted earlier, the continuing loss of oyster habitat in the Bay is, to a substantial degree, a result of the lack of a growing oyster population. Oysters create their own habitat through growth of shell, and a healthy population can grow at a rate that exceeds the rate at which shell is lost due to degradation and siltation. The use of dredged shell as substrate for placing hatchery seed in low salinity waters, where oyster mortality due to disease is low, will result in live oysters growing and increasing shell stock and reef structure over time. However, spat set would be infrequent in low salinity waters, so repeated seed planting may be required to sustain such reefs. The promising results observed in the Great Wicomico River and other locations in Virginia suggest that medium-relief and high-relief reefs may contribute to enhanced oyster reproduction, settlement, and survival in areas of higher salinity. These factors would result in shell accretion and growth of the reef only so long as harvest is prohibited. Although oysters in high-salinity areas are expected to suffer significant disease mortality, die offs due to disease are a necessary step in the selection and propagation of disease resistance in the population, and the gradual evolution of disease resistance is expected in the local oyster stocks. Furthermore, shell from oysters dying of disease will build up the shell base. MDNR recognizes that deposits of buried shell are a limited and non-renewable resource, and the proposed uses of the shell to be removed from Man-O-War shoal emphasize efforts that will result in the growth and development of
8
oyster reefs that can sustain themselves into the future, without the need for continual addition of new substrate.
3.0 Alternate Analysis
The OAC’s 2009 report recommended that MDNR consider all alternatives to using dredged shell to create oyster habitat, including rehabilitating oyster bars through surface dredging, reclaiming previously planted shell at other locations, purchasing shell from out-of-state suppliers, and using alternative materials. That recommendation recognized the critical need for large amounts of substrate for oysters and the limited availability of buried shell. The OAC reviewed all potential locations for dredging shell before recommending Man-O-War shoal as the most appropriate location. Also, another alternative analysis to the proposed project would be to reduce the scope of this project to (a) 500,000 bushels, (b) one million bushels or (c) two million bushels was a feasible option, however, doing this would directly impact the ability to achieve the Executive Order and Bay Agreement goals.
3.1 Surface Dredging
Surface dredging, also known as bar rehab, is defined as a restoration technique to rehabilitate a natural oyster bar that has degraded over time by turning over buried or lightly sedimented oyster shell by dredging for the purpose of providing a clean, unsedimented settlement substrate for oyster recruits (spat). This can occur by two methods: bagless dredging and bagged dredging. Bagless dredging turns over the shells without bringing them to the surface, whereas bagged dredging brings the shell and oysters to the surface and then relocates them to a consolidated, centralized location on the bar which is thought to increase recruitment rates by increasing the oyster density in that location.
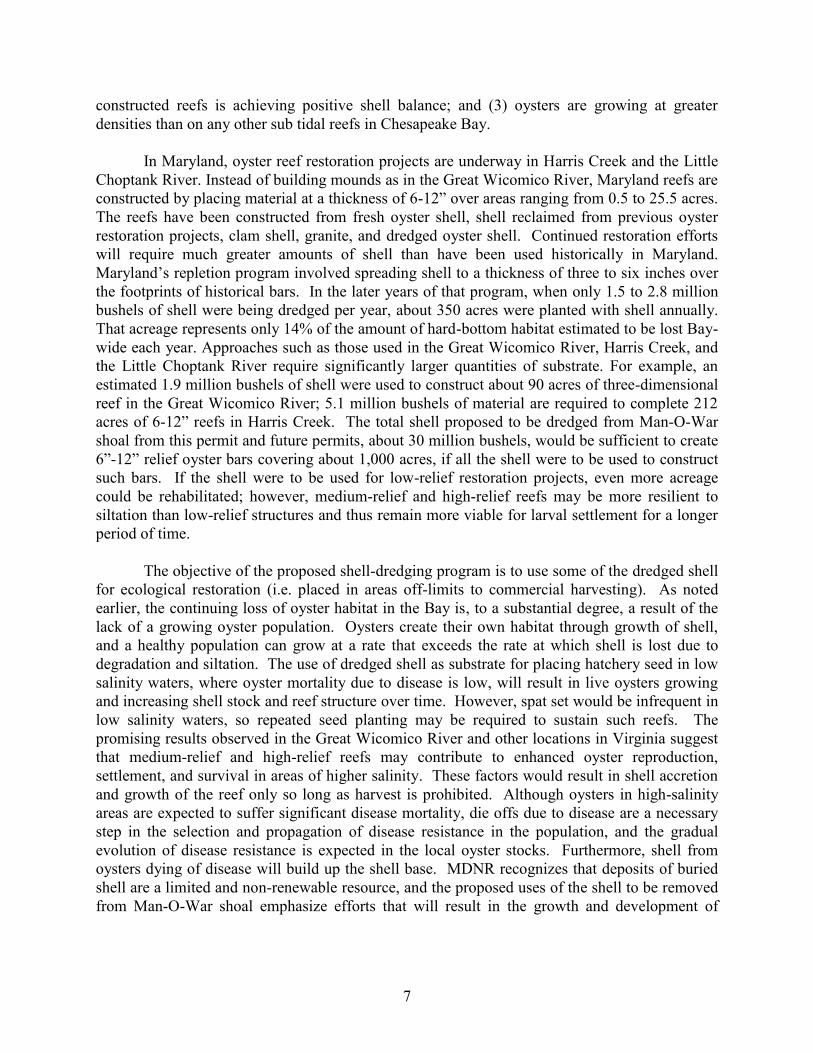
In 1998, MDNR conducted an evaluation of bagless dredging and results suggested that there was not a significant increase the number of spat in 3 of the 4 bars examined (Homer 1998). The results suggested that this technique is not effective in the enhancement of oyster recruitment under light to moderate set rates (i.e., low salinity areas). In addition, on a site where a thin layer of shell existed on a rather muddy substrate (Mill Bar), bagless dredging may be detrimental to recruitment success (Table 1).
9
Table 1. Count of spat per liter of surface shell on live oysters and boxes between experimental (bagless dredged) and control plots at four sites in upper Chesapeake Bay. Statistically significant (Mann-Whitney U-test; a>0.05) differences are indicated by values in bold. (Homer 1998).
Bar Treatment
Spat Per Liter of Surface Shell (Mean ± Standard Error)
Live Oysters Boxes
Royston Bagless Dredged 5.8±1.1 0.07±0.06
Control 4.9±0.7 0.13±0.11
Mill Bar Bagless Dredged 1.49±0.27 0.01±0.02
Control 2.13±0.44 0.01±0.01
Ragged Point Bagless Dredged 1.63±0.34 0.53±0.13
Control 1.71±0.23 0.37±0.11
Middleground
Bagless Dredged 0.51±0.18 0.01±0.02 Control 0.43±0.12 0.01±0.01
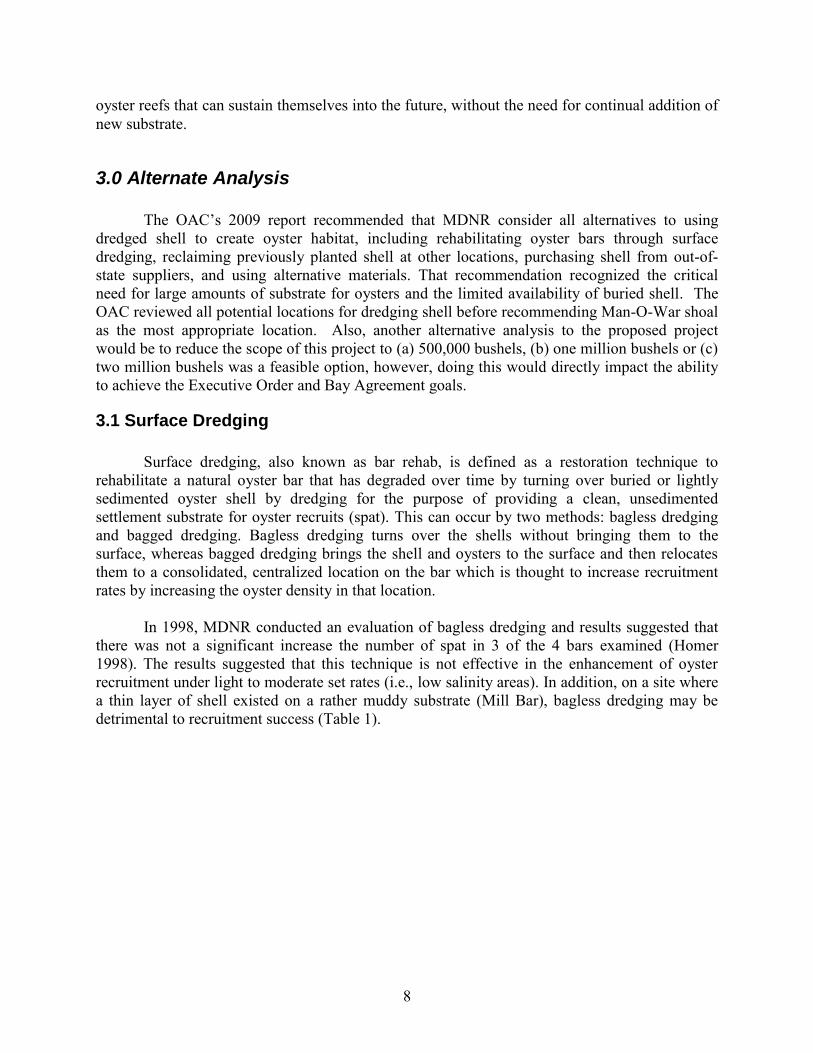
Bar rehab using bagged dredges occurred in 2010 and 2011 in various locations of Maryland’s portion of the Bay (Table 2). More then 250,000 bushels of shell was collected over the time period. The dredge used in this project functions by scraping the surface of the oyster reef, not by digging, and it is unlikely that a significant or predictable amount of buried shell is brought to the surface using this technique. De-silting of surface shells is thought to increase recruitment of oysters providing increased amount of clean shell for settlement. However, ANOVA results showed no significant difference (p-value = 0.0819 (bars with rehab occurring in 2010) and 0.2913 (bars with rehab occurring in 2011)) in average number of spat per half bushel on the oyster bars where bagged dredging occurred and nearby bars in the same region where no bagged dredging occurred.
10
Table 2. Amount of shell and live oysters collected during the bar rehab project in 2010 and 2011 using bagged dredging conducted by watermen and coordinated by Oyster Recovery Partnership and Versar, Inc.
Area Bar Date Range Number of Days
Total Shell
(bushels)
Total Number of
Oysters (bushels)
Min # Boats
Working
Max # Boats
Working Choptank River Lecompte 2010 (04/05 - 04/16) 10 Unknown 17,049 18 31 Choptank River Chlora Point 2011 (03/21 - 03/31) 9 44,400 2,898 20 25 Eastern Bay Bugby 2010 (04/05 - 04/16) 10 24,585 1,201 13 31 Eastern Bay Sawmill Creek 2011 (03/14 - 04/01) 6 5,736 87 8 18 Eastern Bay Cox Creek 2011 (03/21 - 03/28) 5 4,220 153 7 18
Eastern Bay Northern Cox Creek 2011 (03/29 - 03/30) 2 Unknown 16 7 8
Eastern Bay / Miles River Tilghman Point 2011 (03/31 - 04/07) 4 3,488 74 8 25 Harris Creek Change Point 2011 (03/28 - 04/04) 6 15,793 302 15 Harris Creek Mill Bar 2011 (04/05 - 04/07) 3 7,437 624 15 Hooper's Straits Black Beacon 2010 (04/05 - 04/09) 5 5,687 109 37 Hooper's Straits Applegrath 2010 (04/12 - 04/16) 5 4,555 227 28 Little Choptank Nine Acres 2010 (04/05 - 04/09) 5 5,730 Unknown 27 Little Choptank Ragged Point 2010 (04/12 - 04/16) 5 1,593 213 6 Little Choptank McKeils Point 2011 (03/28 - 04/01) 5 28,491 6,572 37 38
Little Choptank Cason / Tabacco Stick 2011 (04/04 - 04/06) 2 10,078 4,656 38
Little Choptank Town Point 2011 (04/07) 1 5,379 1,738 38
Manokin River Piney Island Swash 2011 (03/14 - 04/06) 12 21,189 3,159 28 47
Manokin River Drum Point 2011 (03/29 - 04/08) 5 8,448 1,111 28 29 Nanticoke River White Shoal 2011 (03/14 - 03/23) 8 17,820 492 15 Nanticoke River Wilson Shoals 2011 (03/14 - 03/24) 9 23,359 7,232 13 15 Patuxent River Island Creek 2010 (04/05 - 04/09) 5 7,940 794 18 Patuxent River Jack's Bay 2010 (04/05 - 04/09) 5 6,320 632 21 Middle Anne Arundel Shore Tolly Point 2010 (04/05 - 04/09) 5 4,010 Unknown 16 Upper Bay East Swan Point 2010 (04/05 - 04/09) 5 Unknown 590 14
Total 256,258 49,926
3.2 Reclaiming Previously Planted Shell
The OAC 2009 report considered multiple locations for dredging shell in Maryland’s
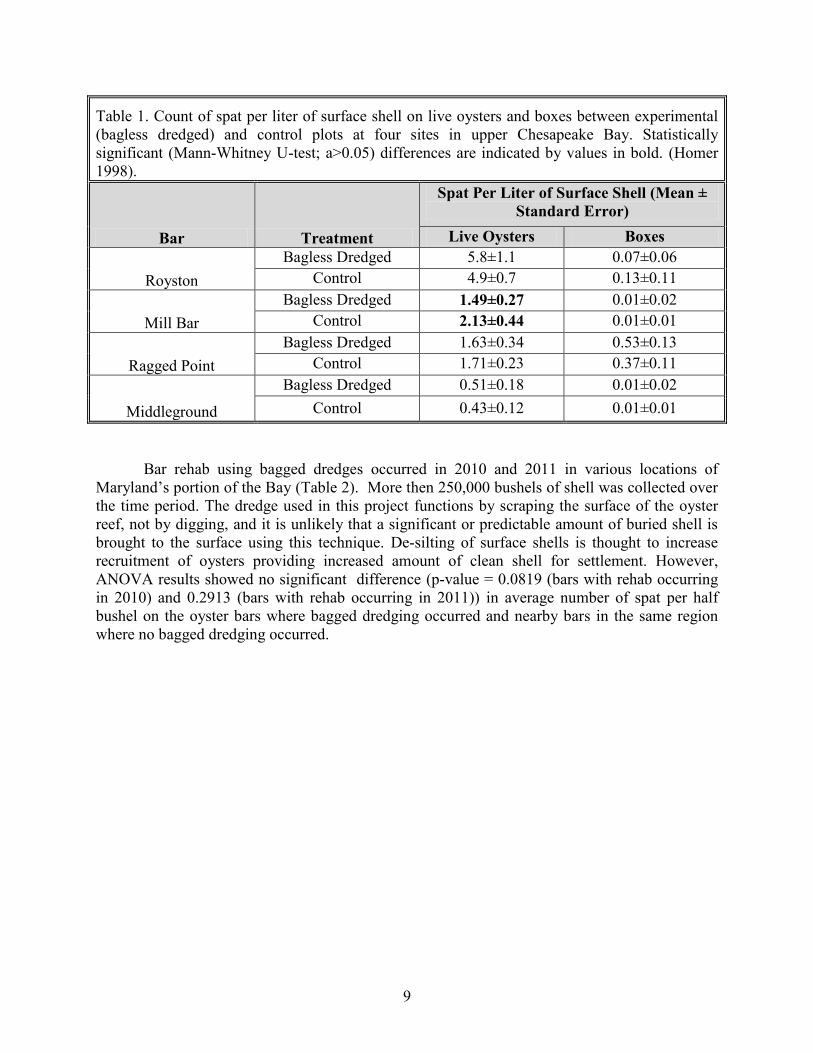
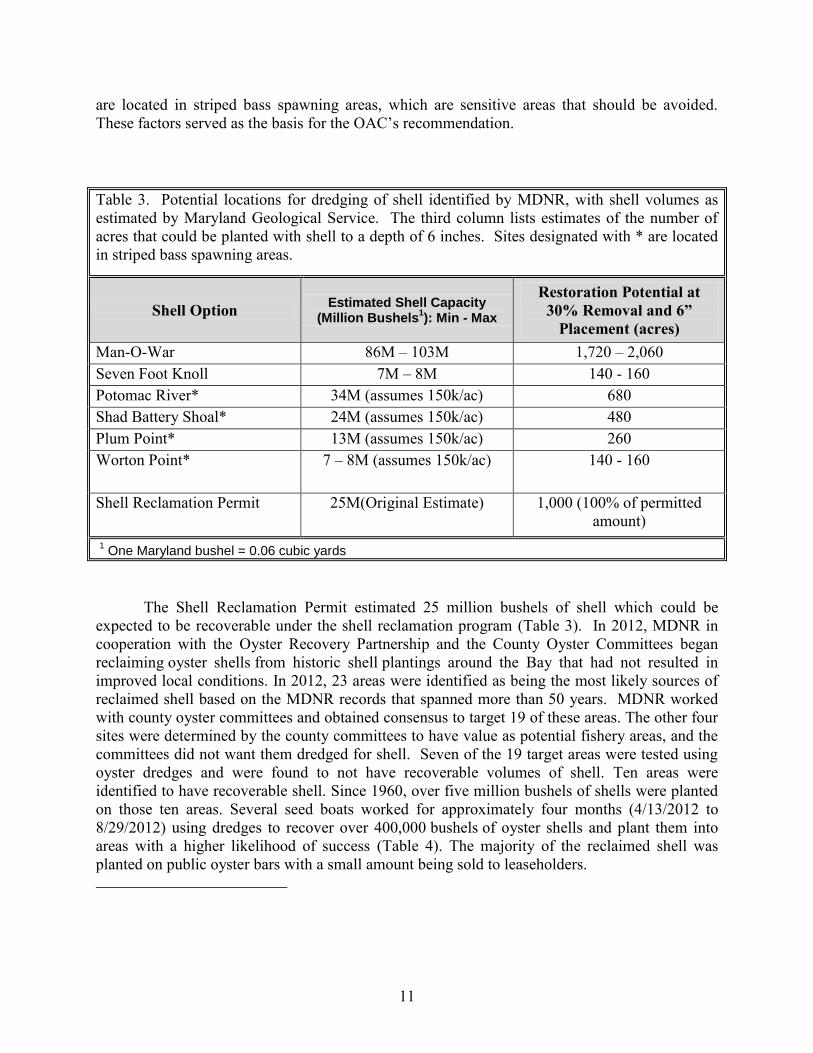
portion of the Bay (Table 3). The volume of shell at Man-O-War shoal is an order of magnitude greater than the volumes at all the other locations. Completely removing a shoal is likely to result in significant modification of existing habitat for fish and other Bay organisms. Consequently, one constraint on the proposed dredging program is to remove no more than 30% of a shell deposit. Removing 30% of the total volume of shell at Man-O-War shoal would produce the greatest amount of shell at the six locations evaluated while maintaining the basic integrity of the shoal and minimizing habitat alterations. In addition, four of the six sites with shell remaining
11
are located in striped bass spawning areas, which are sensitive areas that should be avoided. These factors served as the basis for the OAC’s recommendation. Table 3. Potential locations for dredging of shell identified by MDNR, with shell volumes as estimated by Maryland Geological Service. The third column lists estimates of the number of acres that could be planted with shell to a depth of 6 inches. Sites designated with * are located in striped bass spawning areas.
Shell Option Estimated Shell Capacity (Million Bushels
1): Min - Max
Restoration Potential at 30% Removal and 6”
Placement (acres) Man-O-War 86M – 103M 1,720 – 2,060 Seven Foot Knoll 7M – 8M 140 - 160 Potomac River* 34M (assumes 150k/ac) 680 Shad Battery Shoal* 24M (assumes 150k/ac) 480 Plum Point* 13M (assumes 150k/ac) 260 Worton Point* 7 – 8M (assumes 150k/ac) 140 - 160
Shell Reclamation Permit 25M(Original Estimate) 1,000 (100% of permitted amount)
1 One Maryland bushel = 0.06 cubic yards
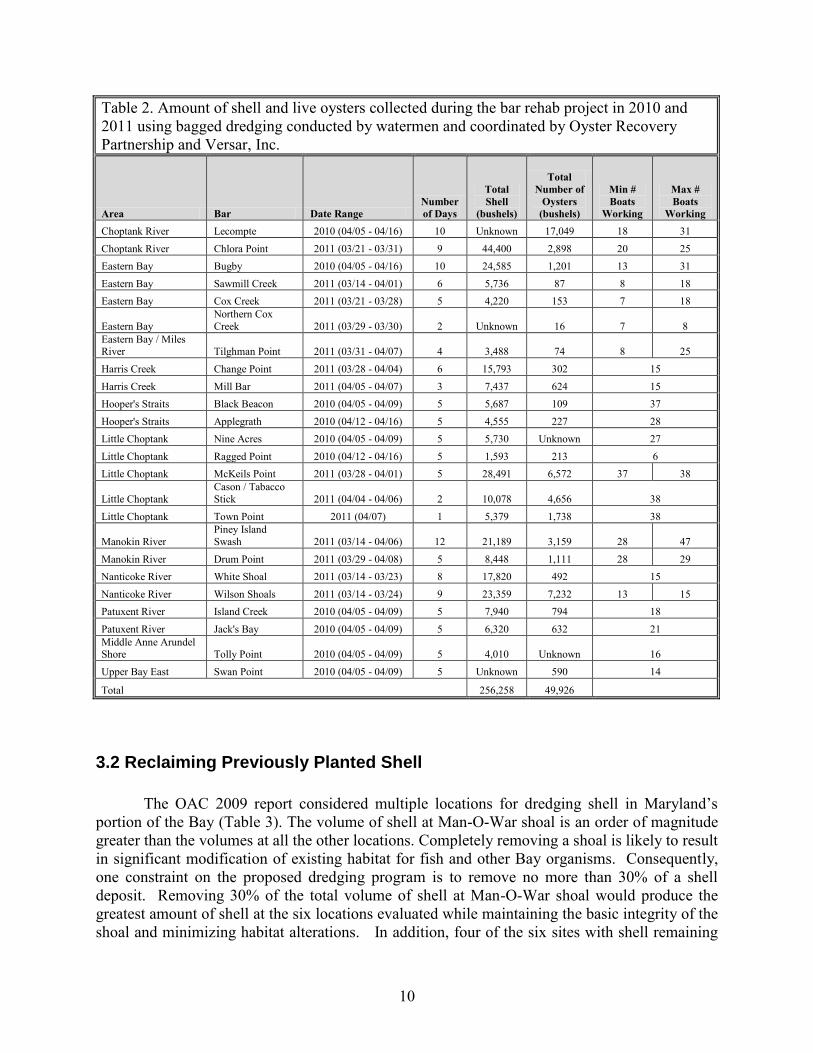
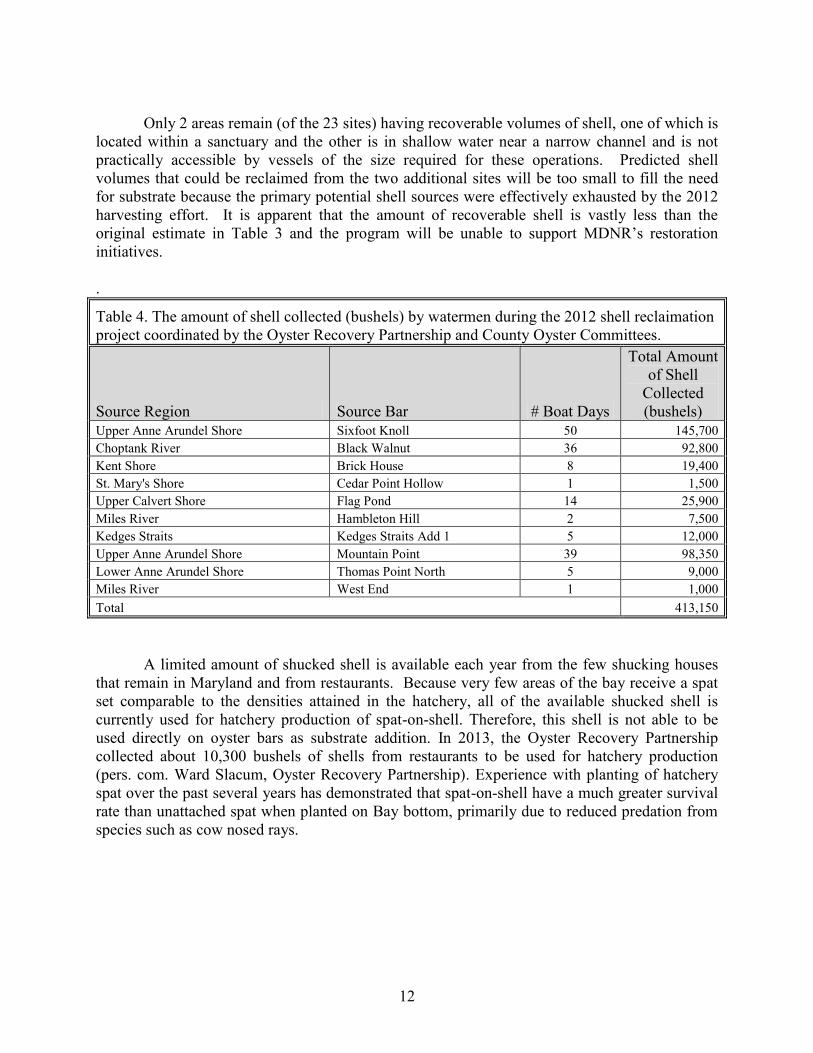
The Shell Reclamation Permit estimated 25 million bushels of shell which could be expected to be recoverable under the shell reclamation program (Table 3). In 2012, MDNR in cooperation with the Oyster Recovery Partnership and the County Oyster Committees began reclaiming oyster shells from historic shell plantings around the Bay that had not resulted in improved local conditions. In 2012, 23 areas were identified as being the most likely sources of reclaimed shell based on the MDNR records that spanned more than 50 years. MDNR worked with county oyster committees and obtained consensus to target 19 of these areas. The other four sites were determined by the county committees to have value as potential fishery areas, and the committees did not want them dredged for shell. Seven of the 19 target areas were tested using oyster dredges and were found to not have recoverable volumes of shell. Ten areas were identified to have recoverable shell. Since 1960, over five million bushels of shells were planted on those ten areas. Several seed boats worked for approximately four months (4/13/2012 to 8/29/2012) using dredges to recover over 400,000 bushels of oyster shells and plant them into areas with a higher likelihood of success (Table 4). The majority of the reclaimed shell was planted on public oyster bars with a small amount being sold to leaseholders.
12
Only 2 areas remain (of the 23 sites) having recoverable volumes of shell, one of which is
located within a sanctuary and the other is in shallow water near a narrow channel and is not practically accessible by vessels of the size required for these operations. Predicted shell volumes that could be reclaimed from the two additional sites will be too small to fill the need for substrate because the primary potential shell sources were effectively exhausted by the 2012 harvesting effort. It is apparent that the amount of recoverable shell is vastly less than the original estimate in Table 3 and the program will be unable to support MDNR’s restoration initiatives. .
Table 4. The amount of shell collected (bushels) by watermen during the 2012 shell reclaimation project coordinated by the Oyster Recovery Partnership and County Oyster Committees.
Source Region Source Bar # Boat Days
Total Amount of Shell
Collected (bushels)
Upper Anne Arundel Shore Sixfoot Knoll 50 145,700 Choptank River Black Walnut 36 92,800 Kent Shore Brick House 8 19,400 St. Mary's Shore Cedar Point Hollow 1 1,500 Upper Calvert Shore Flag Pond 14 25,900 Miles River Hambleton Hill 2 7,500 Kedges Straits Kedges Straits Add 1 5 12,000 Upper Anne Arundel Shore Mountain Point 39 98,350 Lower Anne Arundel Shore Thomas Point North 5 9,000 Miles River West End 1 1,000 Total 413,150
A limited amount of shucked shell is available each year from the few shucking houses that remain in Maryland and from restaurants. Because very few areas of the bay receive a spat set comparable to the densities attained in the hatchery, all of the available shucked shell is currently used for hatchery production of spat-on-shell. Therefore, this shell is not able to be used directly on oyster bars as substrate addition. In 2013, the Oyster Recovery Partnership collected about 10,300 bushels of shells from restaurants to be used for hatchery production (pers. com. Ward Slacum, Oyster Recovery Partnership). Experience with planting of hatchery spat over the past several years has demonstrated that spat-on-shell have a much greater survival rate than unattached spat when planted on Bay bottom, primarily due to reduced predation from species such as cow nosed rays.
13
3.3 Purchasing Out of State Oyster Shell
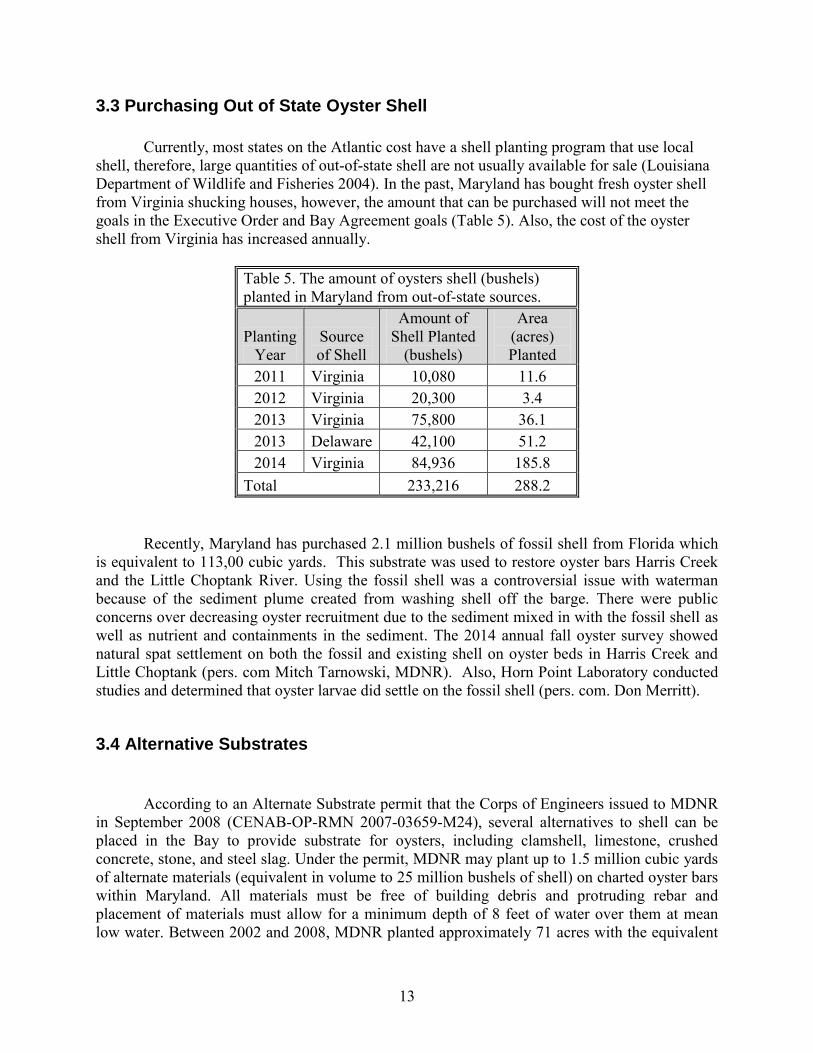
Currently, most states on the Atlantic cost have a shell planting program that use local shell, therefore, large quantities of out-of-state shell are not usually available for sale (Louisiana Department of Wildlife and Fisheries 2004). In the past, Maryland has bought fresh oyster shell from Virginia shucking houses, however, the amount that can be purchased will not meet the goals in the Executive Order and Bay Agreement goals (Table 5). Also, the cost of the oyster shell from Virginia has increased annually.
Table 5. The amount of oysters shell (bushels) planted in Maryland from out-of-state sources.
Planting Year
Source of Shell
Amount of Shell Planted
(bushels)
Area (acres) Planted
2011 Virginia 10,080 11.6 2012 Virginia 20,300 3.4 2013 Virginia 75,800 36.1 2013 Delaware 42,100 51.2 2014 Virginia 84,936 185.8
Total 233,216 288.2
Recently, Maryland has purchased 2.1 million bushels of fossil shell from Florida which is equivalent to 113,00 cubic yards. This substrate was used to restore oyster bars Harris Creek and the Little Choptank River. Using the fossil shell was a controversial issue with waterman because of the sediment plume created from washing shell off the barge. There were public concerns over decreasing oyster recruitment due to the sediment mixed in with the fossil shell as well as nutrient and containments in the sediment. The 2014 annual fall oyster survey showed natural spat settlement on both the fossil and existing shell on oyster beds in Harris Creek and Little Choptank (pers. com Mitch Tarnowski, MDNR). Also, Horn Point Laboratory conducted studies and determined that oyster larvae did settle on the fossil shell (pers. com. Don Merritt).
3.4 Alternative Substrates
According to an Alternate Substrate permit that the Corps of Engineers issued to MDNR in September 2008 (CENAB-OP-RMN 2007-03659-M24), several alternatives to shell can be placed in the Bay to provide substrate for oysters, including clamshell, limestone, crushed concrete, stone, and steel slag. Under the permit, MDNR may plant up to 1.5 million cubic yards of alternate materials (equivalent in volume to 25 million bushels of shell) on charted oyster bars within Maryland. All materials must be free of building debris and protruding rebar and placement of materials must allow for a minimum depth of 8 feet of water over them at mean low water. Between 2002 and 2008, MDNR planted approximately 71 acres with the equivalent
14
of 985,000 bushels of alternative habitat materials at a cost of $1.7 million, or $24,000 per acre. MDNR-Fisheries Service has been investigating various sources of alternate materials and has tested some of these materials in tanks and in the field. We have demonstrated in tanks and in the field that oyster spat will set on a variety of brick and stone materials. These materials can replace natural oyster shell as cultch (providing a clean substrate for oysters to set on). However, there are various logistical issues involved with procuring, transporting, storing, staging, and placing the materials. These logistical issues lead to substantial increases in cost. In some instances, it may be possible to negotiate lower prices when ordering larger quantities of material, but costs still exceed the cost of dredging and deploying natural shell.
Of all the non-organic alternate materials, recycled concrete rubble tends to be the
cheapest material because construction companies or industrial sources are trying to dispose of the material at minimal cost. Much of the cost of concrete is related to the processing, crushing, cleaning and screening to make it suitable for use as oyster material. In the lower Rappahannock River, low relief oyster reefs and concrete oysters reefs were constructed in 2001 and sampled in 2005 for oyster density (Lipcius and Burke 2006). Oyster density on the low relief reefs were calculated to be 9 oysters per square meter as compared to 73 oysters per square meter on the concrete reefs. This increased oyster density was thought to be attributed to the increased modular surface area of the concrete reef.
Quarry rock (limestone and granite) is a more natural material but is higher-priced
because it is considered a commodity. Crushed granite or “gabion stone” can be directly loaded on to barges in Havre De Grace and can be transported downstream to sites throughout the Bay. Limestone must be trucked from the Frederick, MD area or Hannover, PA which increases the transport costs. A survey in Lynhaven River determined that oyster densities on granite rip-rap along the shoreline was 978 oysters per square meter as compared to oysters densities ranging from 97 to 240 oysters per square meter on restored oysters reefs with shells (Burke 2007). Oyster densities on rip-rap consiting of limestone marl were less than granite at 275 oysters per square meter. These oyster densities are on rip-rap shorelines and may not be comparable to intertidal and subtidal oyster reefs. Laboratory settlement rates for Crassostrea virginica larvae have been estimated to be 35.5 % on biofouled granite versus 45.4 % on biofouled oyster shell (Tamburri et. al. 2008).
Clam shell has been used successfully as cultch for oysters in Delaware Bay (NJ/DE) for many years. It is also being used for the Harris Creek restoration project. MDNR has been investigating state sources of clam shell from Delaware and New England (Massachusetts and Rhode Island). Some clam shell is stockpiled at farm fields in rural Delaware and MDNR could consider purchasing shell directly from seafood processors in Delaware. There are at least two contacts for clam shell from New England. Most of the shell comes from processing facilities in New Bedford, Massachusetts, a major commercial fishing port in southwestern Massachusetts. There is a cost issue involved with trucking the material down the I-95 corridor to Maryland. Obtaining clam shell from New England would make the shell more expensive than from Delaware. In addition to Delaware and New England, a clam shell deposit of mixed fossil sea shell (clam, scallop, and coral) has been uncovered in a clay mine near Richmond, Virginia. Clam shell from all locations needs to be rinsed and sun-dried before placement. It may be transported by barge or by truck depending on location. Price is moderate, estimated at $2.25 -
15
$3.00 per bushel, or about $35.00 – $38.00 per cubic yard. A study conducted in Virginia’s portion of Chesapeake Bay and York River determined no difference in recruitment between oyster and surf clam (Spisula solidissima) shell, however, there was higher post-settlement morality associated with the clam shell (Nestlerode et. al. 2007). The clam shell tended to be more fragmented then oyster shell and settled oysters tended to be found at the base of the clam shell reef where larger clam shells were located. In an oyster restoration report by the United States Army Corp of Engineers (USACE, 2012), surf clam shells were found to be fragile and break more easily than hard clam shells providing very little interstitial space.
Using alternate materials can cause some public controversy. Slag material (a steel
industry by product) has been used historically in the bay, but it generated major concerns from the Severn River Association when it was used as reef material in the lower Severn River. Many alternate materials, including concrete rubble, granite and reef balls, are strongly disliked by watermen because the heavy, jagged structures are viewed as an obstruction to traditional fishing gear, such as oyster dredges, trotlines, and gillnets. This can also be an issue for recreational fishermen and for boaters where anchors may be deployed. MDNR is currently in the process of constructing 62 acres of reef of granite and fossil oyster shell in Harris Creek (permit CENAB-OP-RMN 2012-61332-M24) and 155 acres in the Little Choptank River (currently operating under permit CENAB-OP-RMN 2007-03659-M24, with application for planting in water < 8 feet deep under review) at an average cost of $73,000 per acre. The use of alternate materials at the Harris Creek and Little Choptank River restoration sites and at other artificial reef project sites going back to the 1980’s and 1990’s, has also been a controversial issue.
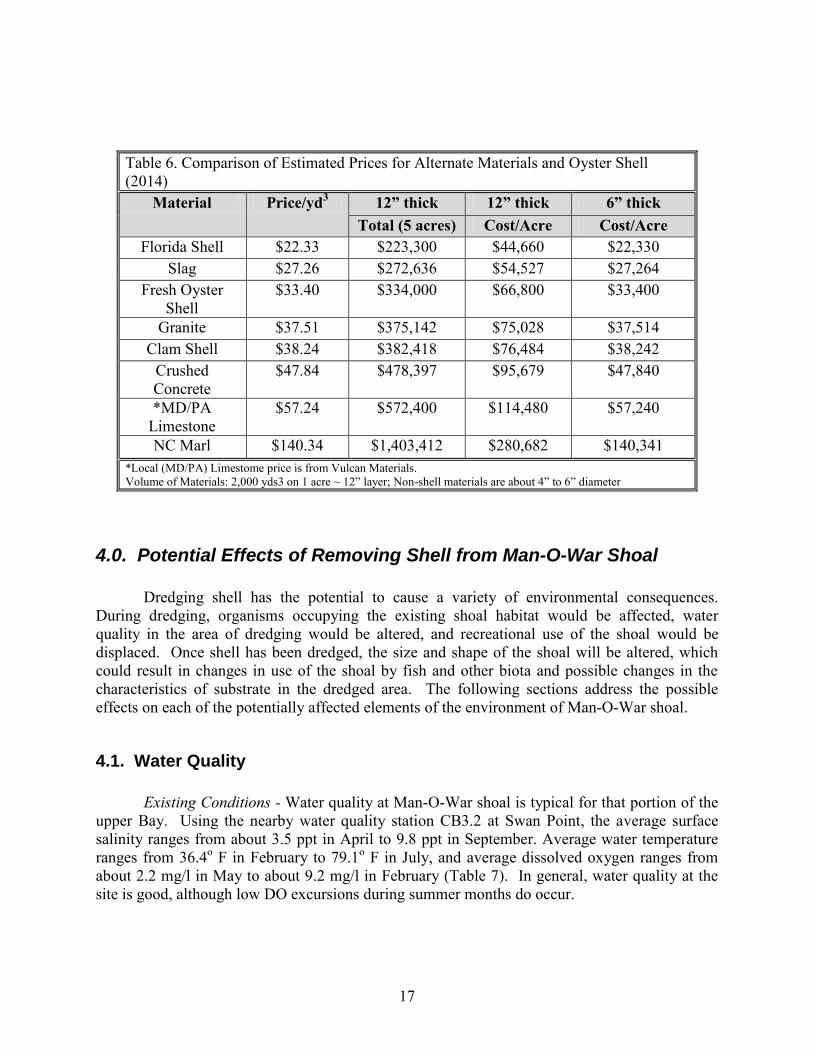
A cost comparison of all substrate materials can be found on Tables 5 and 6. Typically, the amount of material required to cover 1 acre at 12 inches thickness is in the range of 1600-2000 cubic yards. Extra material will allow for some settling, sinking, and compression. The cost of alternate materials ranges from $27.26 per cubic yard (cu yd) for slag to $140 per cu yd for North Carolina marl (a form of limestone). This equates to $54,527 per acre-foot for slag to $280,682 per acre-foot for marl (an acre-foot is 1 acre of material spread at a thickness of 12 inches). Local granite is the cheapest stone material at $55 per cu yd and $75,000 per acre-foot. The cheaper alternate materials are still more expensive than fresh shell but fresh shell has limited availability. There are other shell sources such as reclaimed shell and clam shell. Fresh shell is currently $2.00 per bushel = $33.40 per cu yd which equates to $66,800 per acre foot. New information (May 2013) from the USACE restoration division for the Harris Creek project shows a contract price of $47.41 per cu yd for granite, and $43.63 per cu yd for “mixed shell”. This equates to $76, 472 per acre-foot for granite, and $70,375 per acre-foot for mixed shell (based on 1613 cu yards per acre used by ACOE).
If current shell prices continue to rise, and alternate material price remain the same, or decrease, then it may be feasible to more aggressively pursue alternate materials as a replacement for natural oyster shell. This will require additional scoping with local watermen and other user groups to avoid conflict in traditional fishing areas. Nonetheless, the nearly 25 million bushel-equivalents of non-shell substrate that can be deployed under the 2008 permit is nearly equal to the amount that could be removed from Man-O-War shoal.
16
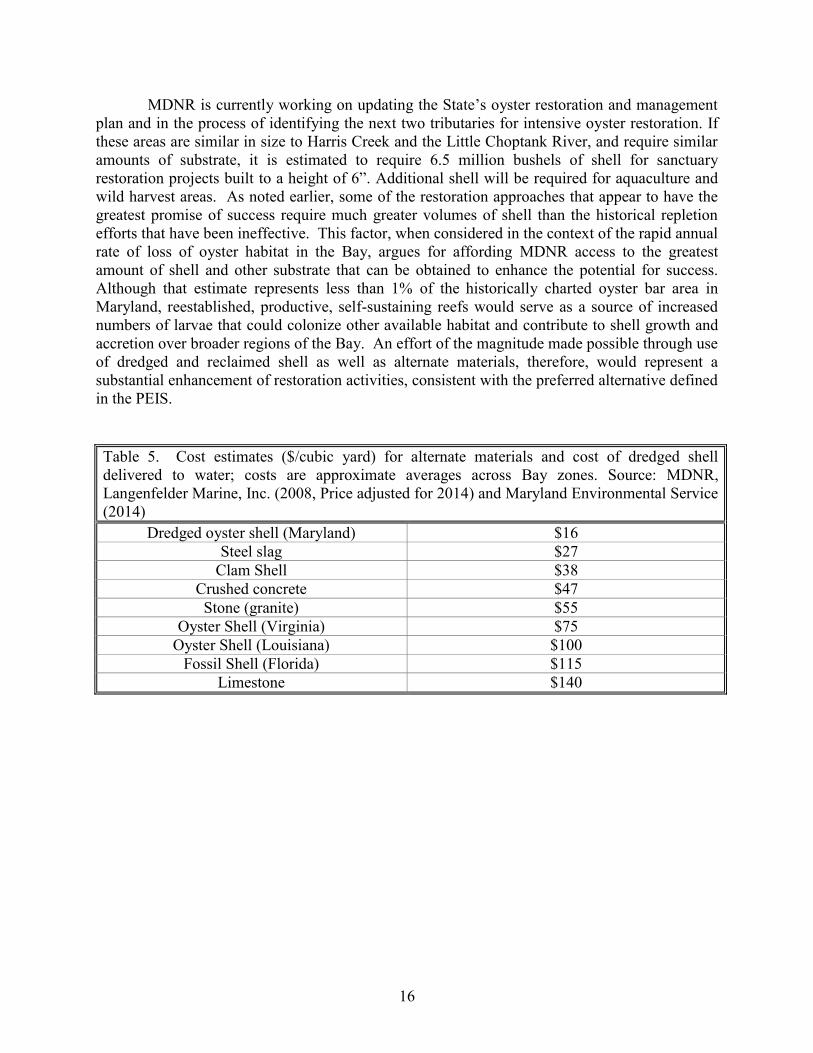
MDNR is currently working on updating the State’s oyster restoration and management plan and in the process of identifying the next two tributaries for intensive oyster restoration. If these areas are similar in size to Harris Creek and the Little Choptank River, and require similar amounts of substrate, it is estimated to require 6.5 million bushels of shell for sanctuary restoration projects built to a height of 6”. Additional shell will be required for aquaculture and wild harvest areas. As noted earlier, some of the restoration approaches that appear to have the greatest promise of success require much greater volumes of shell than the historical repletion efforts that have been ineffective. This factor, when considered in the context of the rapid annual rate of loss of oyster habitat in the Bay, argues for affording MDNR access to the greatest amount of shell and other substrate that can be obtained to enhance the potential for success. Although that estimate represents less than 1% of the historically charted oyster bar area in Maryland, reestablished, productive, self-sustaining reefs would serve as a source of increased numbers of larvae that could colonize other available habitat and contribute to shell growth and accretion over broader regions of the Bay. An effort of the magnitude made possible through use of dredged and reclaimed shell as well as alternate materials, therefore, would represent a substantial enhancement of restoration activities, consistent with the preferred alternative defined in the PEIS.
Table 5. Cost estimates ($/cubic yard) for alternate materials and cost of dredged shell delivered to water; costs are approximate averages across Bay zones. Source: MDNR, Langenfelder Marine, Inc. (2008, Price adjusted for 2014) and Maryland Environmental Service (2014)
Dredged oyster shell (Maryland) $16 Steel slag $27
Clam Shell $38 Crushed concrete $47 Stone (granite) $55
Oyster Shell (Virginia) $75 Oyster Shell (Louisiana) $100
Fossil Shell (Florida) $115 Limestone $140
17
Table 6. Comparison of Estimated Prices for Alternate Materials and Oyster Shell (2014)
Material Price/yd3 12” thick 12” thick 6” thick Total (5 acres) Cost/Acre Cost/Acre
Florida Shell $22.33 $223,300 $44,660 $22,330 Slag $27.26 $272,636 $54,527 $27,264
Fresh Oyster Shell
$33.40 $334,000 $66,800 $33,400
Granite $37.51 $375,142 $75,028 $37,514 Clam Shell $38.24 $382,418 $76,484 $38,242
Crushed Concrete
$47.84 $478,397 $95,679 $47,840
*MD/PA Limestone
$57.24 $572,400 $114,480 $57,240
NC Marl $140.34 $1,403,412 $280,682 $140,341 *Local (MD/PA) Limestome price is from Vulcan Materials. Volume of Materials: 2,000 yds3 on 1 acre ~ 12” layer; Non-shell materials are about 4” to 6” diameter
4.0. Potential Effects of Removing Shell from Man-O-War Shoal
Dredging shell has the potential to cause a variety of environmental consequences. During dredging, organisms occupying the existing shoal habitat would be affected, water quality in the area of dredging would be altered, and recreational use of the shoal would be displaced. Once shell has been dredged, the size and shape of the shoal will be altered, which could result in changes in use of the shoal by fish and other biota and possible changes in the characteristics of substrate in the dredged area. The following sections address the possible effects on each of the potentially affected elements of the environment of Man-O-War shoal.
4.1. Water Quality
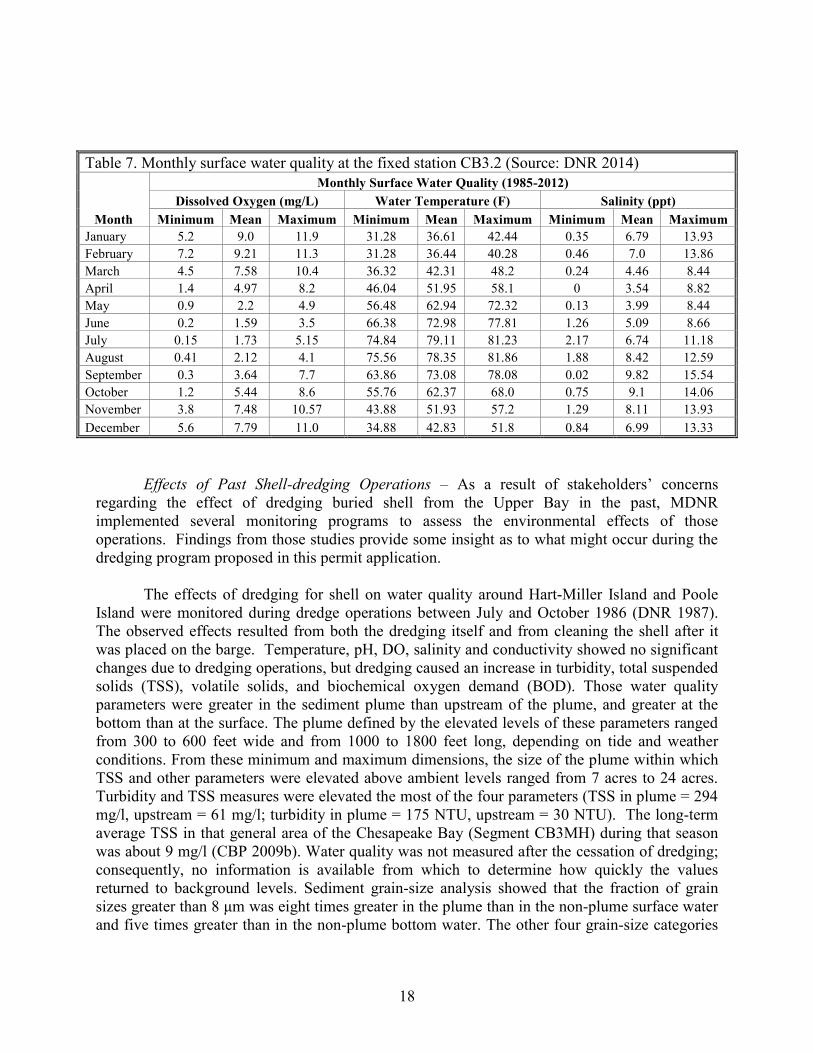
Existing Conditions - Water quality at Man-O-War shoal is typical for that portion of the upper Bay. Using the nearby water quality station CB3.2 at Swan Point, the average surface salinity ranges from about 3.5 ppt in April to 9.8 ppt in September. Average water temperature ranges from 36.4o F in February to 79.1o F in July, and average dissolved oxygen ranges from about 2.2 mg/l in May to about 9.2 mg/l in February (Table 7). In general, water quality at the site is good, although low DO excursions during summer months do occur.
18
Table 7. Monthly surface water quality at the fixed station CB3.2 (Source: DNR 2014)
Month
Monthly Surface Water Quality (1985-2012) Dissolved Oxygen (mg/L) Water Temperature (F) Salinity (ppt)
Minimum Mean Maximum Minimum Mean Maximum Minimum Mean Maximum January 5.2 9.0 11.9 31.28 36.61 42.44 0.35 6.79 13.93 February 7.2 9.21 11.3 31.28 36.44 40.28 0.46 7.0 13.86 March 4.5 7.58 10.4 36.32 42.31 48.2 0.24 4.46 8.44 April 1.4 4.97 8.2 46.04 51.95 58.1 0 3.54 8.82 May 0.9 2.2 4.9 56.48 62.94 72.32 0.13 3.99 8.44 June 0.2 1.59 3.5 66.38 72.98 77.81 1.26 5.09 8.66 July 0.15 1.73 5.15 74.84 79.11 81.23 2.17 6.74 11.18 August 0.41 2.12 4.1 75.56 78.35 81.86 1.88 8.42 12.59 September 0.3 3.64 7.7 63.86 73.08 78.08 0.02 9.82 15.54 October 1.2 5.44 8.6 55.76 62.37 68.0 0.75 9.1 14.06 November 3.8 7.48 10.57 43.88 51.93 57.2 1.29 8.11 13.93 December 5.6 7.79 11.0 34.88 42.83 51.8 0.84 6.99 13.33
Effects of Past Shell-dredging Operations – As a result of stakeholders’ concerns regarding the effect of dredging buried shell from the Upper Bay in the past, MDNR implemented several monitoring programs to assess the environmental effects of those operations. Findings from those studies provide some insight as to what might occur during the dredging program proposed in this permit application. The effects of dredging for shell on water quality around Hart-Miller Island and Poole Island were monitored during dredge operations between July and October 1986 (DNR 1987). The observed effects resulted from both the dredging itself and from cleaning the shell after it was placed on the barge. Temperature, pH, DO, salinity and conductivity showed no significant changes due to dredging operations, but dredging caused an increase in turbidity, total suspended solids (TSS), volatile solids, and biochemical oxygen demand (BOD). Those water quality parameters were greater in the sediment plume than upstream of the plume, and greater at the bottom than at the surface. The plume defined by the elevated levels of these parameters ranged from 300 to 600 feet wide and from 1000 to 1800 feet long, depending on tide and weather conditions. From these minimum and maximum dimensions, the size of the plume within which TSS and other parameters were elevated above ambient levels ranged from 7 acres to 24 acres. Turbidity and TSS measures were elevated the most of the four parameters (TSS in plume = 294 mg/l, upstream = 61 mg/l; turbidity in plume = 175 NTU, upstream = 30 NTU). The long-term average TSS in that general area of the Chesapeake Bay (Segment CB3MH) during that season was about 9 mg/l (CBP 2009b). Water quality was not measured after the cessation of dredging; consequently, no information is available from which to determine how quickly the values returned to background levels. Sediment grain-size analysis showed that the fraction of grain sizes greater than 8 μm was eight times greater in the plume than in the non-plume surface water and five times greater than in the non-plume bottom water. The other four grain-size categories
19
also were three times greater in the plume area than outside the plume on average (DNR 1987). Large particles would be expected to settle out of the water column more rapidly than smaller particles. In August 1998, TSS and turbidity were monitored in a plume created by a dredging operation east of Poole Island during different tidal stages (Wikel et al. 1999). During maximum flood and ebb tides, TSS and turbidity concentrations in the plumes decreased exponentially with longitudinal distance from the dredge in the direction of the current flow. The highest TSS concentrations (ranging from 80 mg/l to > 280 mg/l) and turbidity (> 200 NTU) were within 500 m of the dredge. Ambient concentrations of TSS and turbidity were reached at distances ranging 2,500 m to 4,500 m from the dredge. During slack tides, high TSS and turbidity concentrations were found in areas within 500 m of the dredge. Ambient concentrations were attained at distances of 1,000 to 1,500 m from the dredging site. Monitoring was not continued after cessation of dredging; consequently, no information is available from which to determine the total time required for the suspended material to dissipate. Additional plume monitoring was conducted from July to September 1999. TSS and turbidity were monitored in plumes in the same study area (Wikel et al. 1999, 2000). Residual turbidity, characterized by low, near-ambient NTU levels, occupied the study area up to two hours after dredging activity ceased (Wikel et al 2000). This report also suggested that continuous dredging created greater levels of TSS and turbidity than intermittent dredging. One additional concern regarding the consequence of shell dredging on water quality is that removing shell could reduce the circulation of water through the excavated depressions, resulting in localized oxygen depletion. To address this issue, dissolved oxygen concentrations in past dredge cuts were monitored in four areas (Hart-Miller Island, Poole Island, Tolchester, and outside Fairlee Creek) in the upper Chesapeake Bay from June to September in 1999 to determine if dredge cuts become hypoxic (0-2 mg/l) areas (Tarnowski et al 2000). Results showed no evidence of hypoxia within dredge cuts and no statistical correlation between DO and depth in the study area. The explanations provided for the lack of effect included locally strong water currents, irregular bottom topography, and turbulence in the area that prevented tidally induced salinity stratification. Some stakeholders expressed the concern that dredging shell may result in resuspending sequestered nutrients (nitrogen, phosphorous) that could exacerbate phytoplankton production and ultimately contribute to oxygen depletion. Maryland Geology Services (MGS) did not measure nutrients in core samples collected to estimate the volume of shell in the shoals. The material dredged from shell deposits is primarily shell rather than the depositional material that is typically dredged from shipping channels in the Bay; consequently, the volume of material that becomes suspended in the water column during shell-dredging is minimal compared with the volume that typically becomes suspended during channel dredging, and the material suspended during shell dredging is unlikely to result in detectable changes in nutrient concentrations in the water column. Potential Ecological Effects of Changes in Water Quality Related to Dredging Shell – The most obvious effect of shell dredging is the turbidity plume created during active dredging. Monitoring studies showed that a critical parameter for biota, dissolved oxygen was not
20
depressed within the relatively small plume. In addition, the studies showed that the maximum levels of TSS measured in the plume were well below levels that may adversely affect biota. For example, lethal turbidity levels for exposure to uncontaminated sediment begin at 4,000 mg/l (Peddicord and McFarland 1978), which is more than 10 times greater than the average sediment load typically found in the shell-dredging plume. Also, sediment-induced mortality of adult striped bass occurred only after continued exposure over a 10-day period in a closed environment. Tarnowski et al. (2000) also demonstrated that dissolved oxygen levels were not depressed in affected areas immediately following shell dredging. No contaminants and no significant nutrients are likely to occur in buried shell deposits such as those that make up Man-O-War shoal; therefore, no adverse effects related to nutrients or contaminants are expected. Based on monitoring of prior shell-dredging operations, the primary effect of dredging at Man-O-War shoal will be the presence of a visible turbidity plume that may range in size up to tens of acres when dredging occurs during running tides; however, the presence of the plume is unlikely to result in any significant biological or ecological effects, and the plume is likely to dissipate nearly completely within several hours of cessation of dredging.
4.2. Oysters
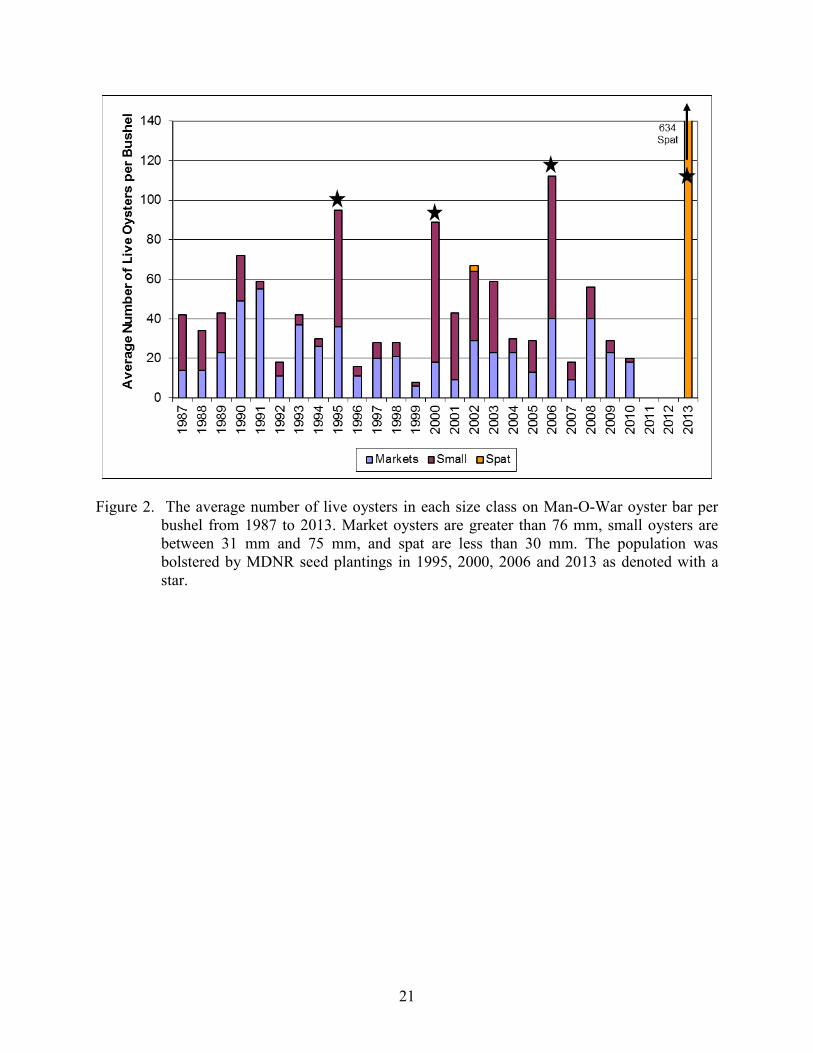
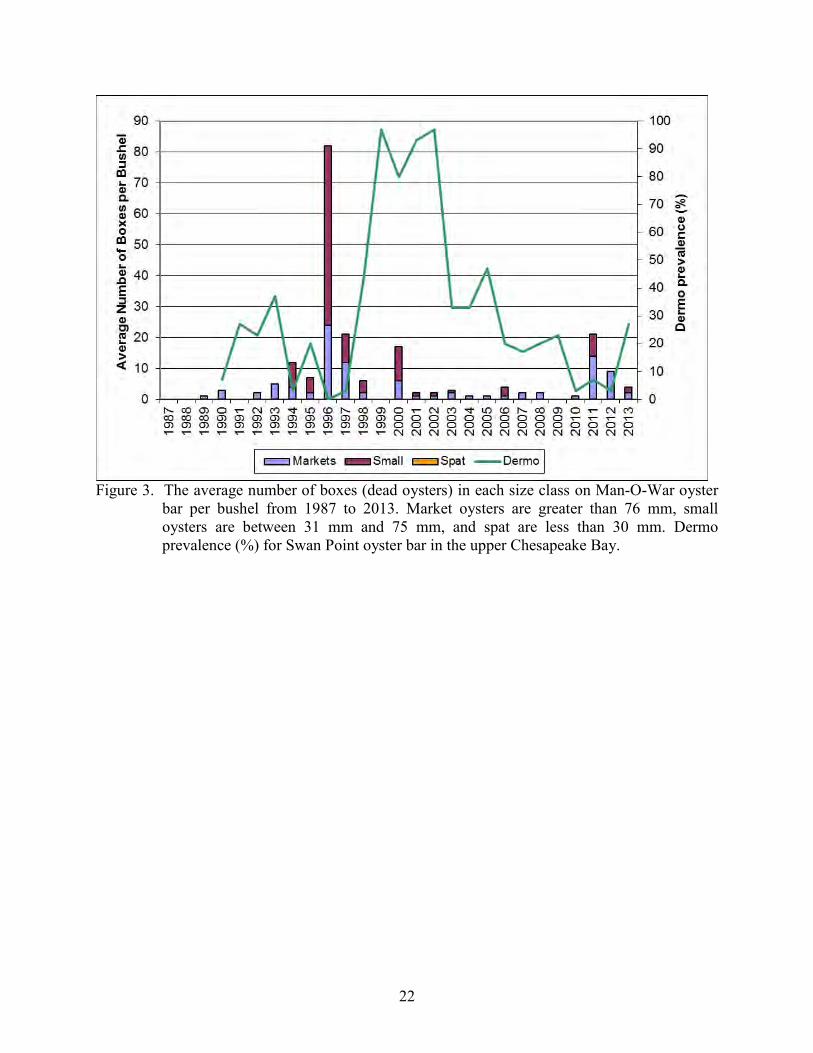
Existing Conditions - Man-O-War shoal was created as a result of continuous growth of oyster populations over thousands of years; however, oyster production on the shoal currently is very limited. The MDNR annual fall oyster survey has monitored Man-O-War oyster bar continuously since 1987 at two locations on the bar: South which is located on the eastern side of the bar and D which is located towards the western side of the bar (Tarnowski 2014). The D site has been planted with seed during 1995, 2000, 2006, and 2013. The greatest number of live market and small oysters was observed in 2006 (112 oysters per ½ bushel) which occurred after a wild seed planting (Figure 2). 1990 and 1991 produced the greatest number of live oysters without being supplemented with a oyster restoration activity (49 and 55 per ½ bushel, respectively). The greatest number of boxes (dead oysters) was documented in 1996 (Figure 3). 1996 was documented to be a dry rainfall year with 1995 documented to be a very wet rainfall year. Increased mortality could be explained by freshets in 1995 by the increased freshwater flow into the upper bay (USGS 2013). Dermo prevalence at a nearby oyster bar (Swan Point) in the upper bay ranges from 0% in 2006 to 97% in 2002 with the average being 32% (Tarnowski 2014). However, Dermo intensity is relatively low, 0.8, at Swan Point, thereby suggesting low mortality caused by Dermo pressures. MSX prevalence has always been zero percent. Significant spat set on oyster bars in low-salinity waters is infrequent, as observed at Man-O-War (Figure 4). With the exception of 2013, the only year in which spat were found in samples collected for the annual fall oyster survey was 2002, and numbers then were very low (3 spat per bushel). However in 2013, hatchery spat on shell was planted in a portion of the bar. Over the 25 year time series, natural spat set on Man-O-War has always been below the Baywide Spat Index. During this period the Man-O-War population has been supported primarily through seed plantings.
21
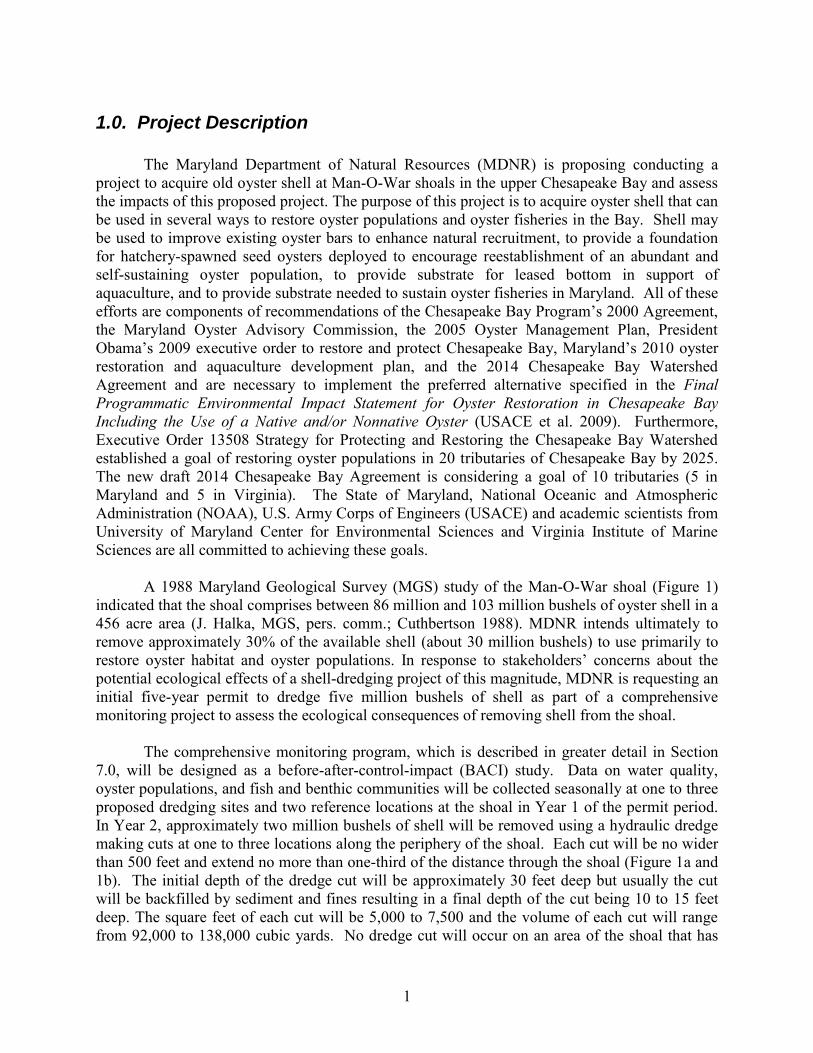
Figure 2. The average number of live oysters in each size class on Man-O-War oyster bar per
bushel from 1987 to 2013. Market oysters are greater than 76 mm, small oysters are between 31 mm and 75 mm, and spat are less than 30 mm. The population was bolstered by MDNR seed plantings in 1995, 2000, 2006 and 2013 as denoted with a star.
22
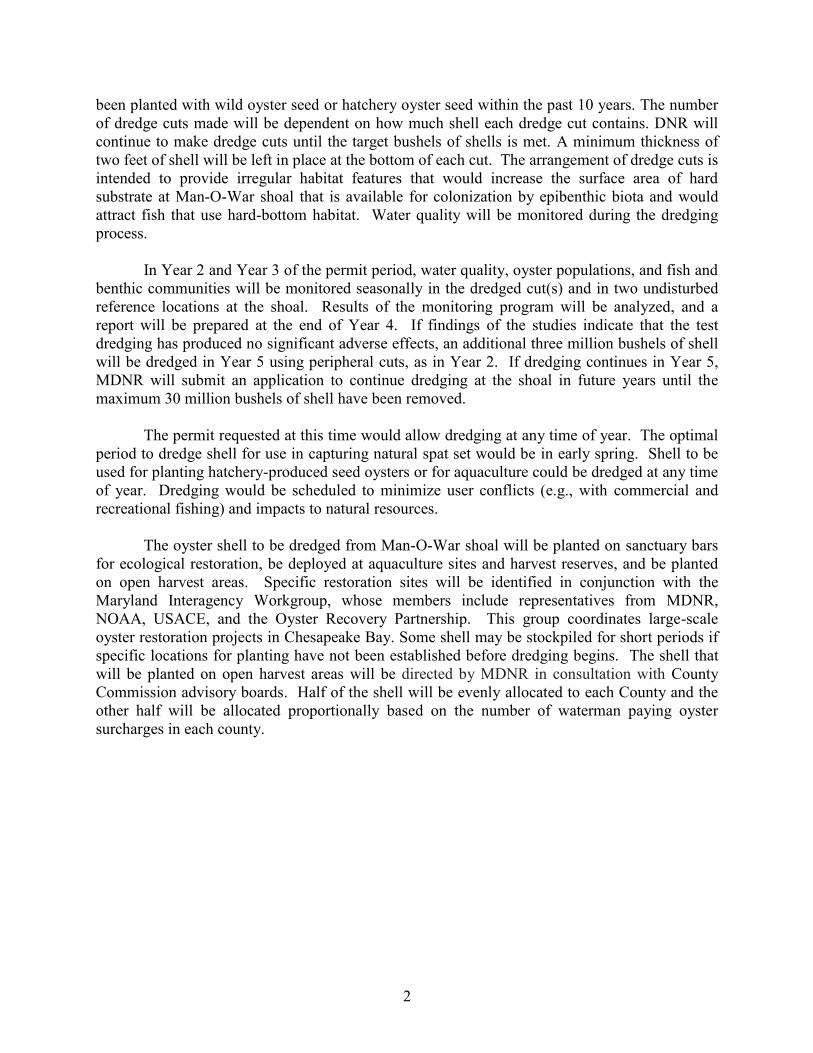
Figure 3. The average number of boxes (dead oysters) in each size class on Man-O-War oyster
bar per bushel from 1987 to 2013. Market oysters are greater than 76 mm, small oysters are between 31 mm and 75 mm, and spat are less than 30 mm. Dermo prevalence (%) for Swan Point oyster bar in the upper Chesapeake Bay.
23
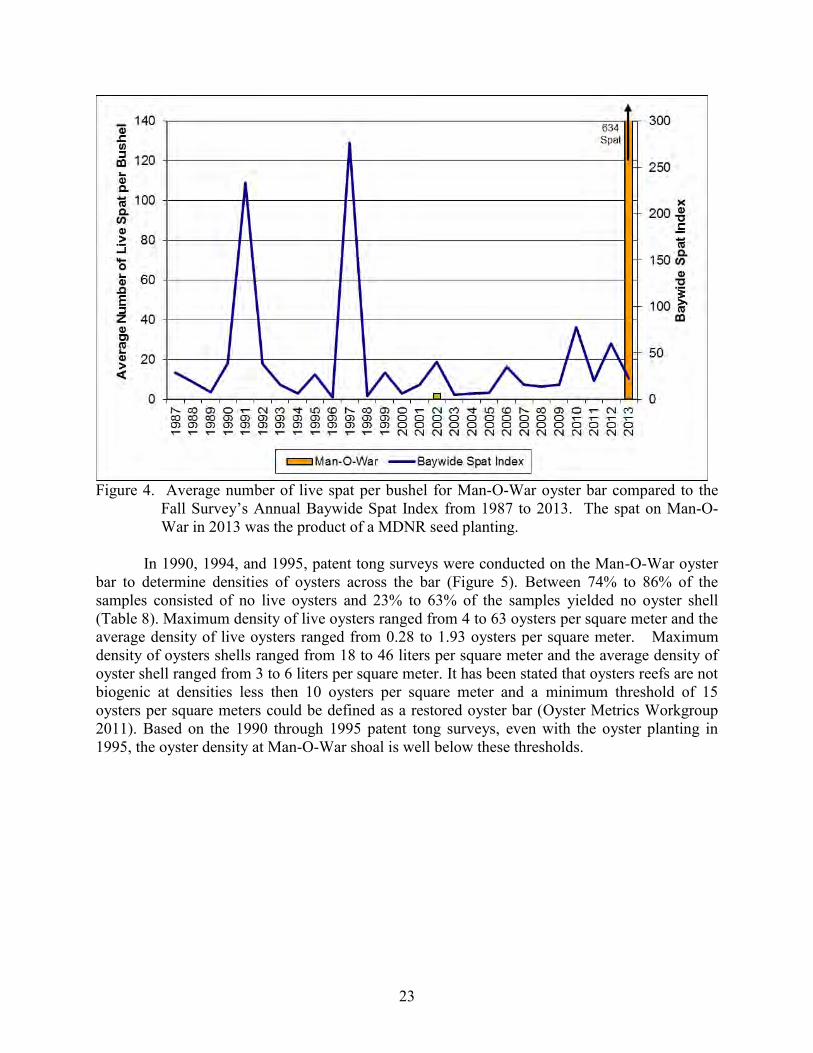
Figure 4. Average number of live spat per bushel for Man-O-War oyster bar compared to the
Fall Survey’s Annual Baywide Spat Index from 1987 to 2013. The spat on Man-O-War in 2013 was the product of a MDNR seed planting.
In 1990, 1994, and 1995, patent tong surveys were conducted on the Man-O-War oyster bar to determine densities of oysters across the bar (Figure 5). Between 74% to 86% of the samples consisted of no live oysters and 23% to 63% of the samples yielded no oyster shell (Table 8). Maximum density of live oysters ranged from 4 to 63 oysters per square meter and the average density of live oysters ranged from 0.28 to 1.93 oysters per square meter. Maximum density of oysters shells ranged from 18 to 46 liters per square meter and the average density of oyster shell ranged from 3 to 6 liters per square meter. It has been stated that oysters reefs are not biogenic at densities less then 10 oysters per square meter and a minimum threshold of 15 oysters per square meters could be defined as a restored oyster bar (Oyster Metrics Workgroup 2011). Based on the 1990 through 1995 patent tong surveys, even with the oyster planting in 1995, the oyster density at Man-O-War shoal is well below these thresholds.
24
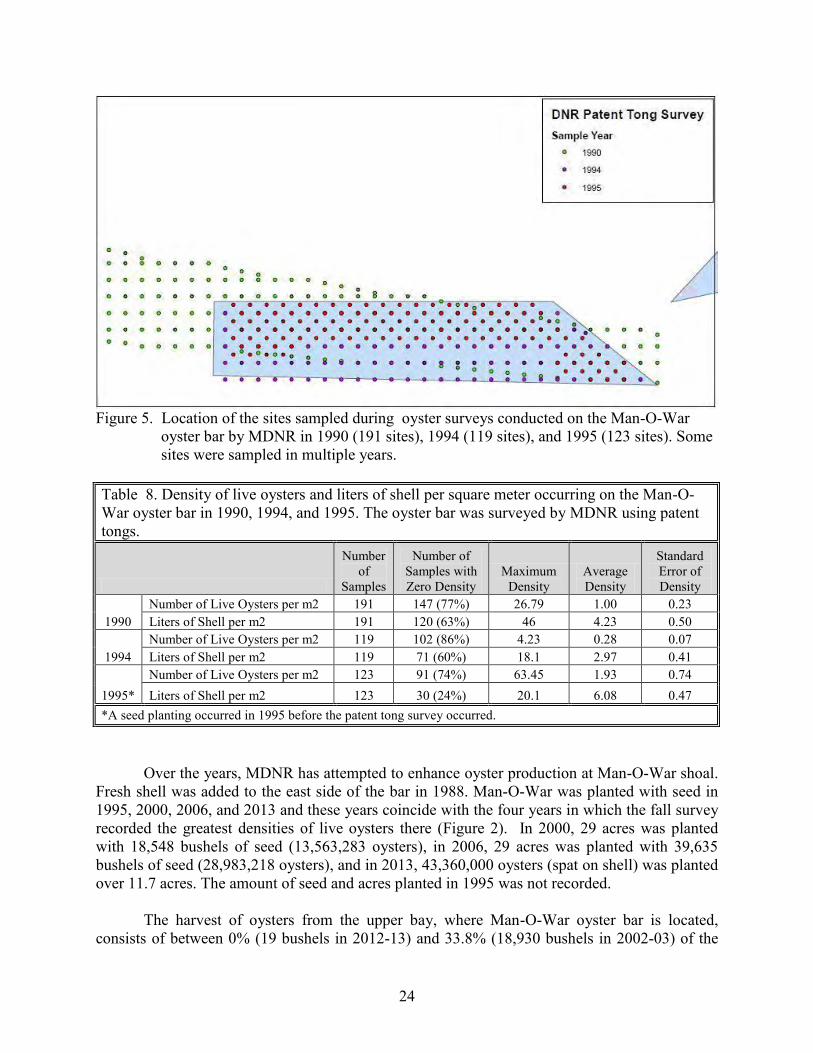
Figure 5. Location of the sites sampled during oyster surveys conducted on the Man-O-War
oyster bar by MDNR in 1990 (191 sites), 1994 (119 sites), and 1995 (123 sites). Some sites were sampled in multiple years.
Table 8. Density of live oysters and liters of shell per square meter occurring on the Man-O-War oyster bar in 1990, 1994, and 1995. The oyster bar was surveyed by MDNR using patent tongs.
Number of
Samples
Number of Samples with Zero Density
Maximum Density
Average Density
Standard Error of Density
1990 Number of Live Oysters per m2 191 147 (77%) 26.79 1.00 0.23 Liters of Shell per m2 191 120 (63%) 46 4.23 0.50
1994 Number of Live Oysters per m2 119 102 (86%) 4.23 0.28 0.07 Liters of Shell per m2 119 71 (60%) 18.1 2.97 0.41
1995* Number of Live Oysters per m2 123 91 (74%) 63.45 1.93 0.74 Liters of Shell per m2 123 30 (24%) 20.1 6.08 0.47
*A seed planting occurred in 1995 before the patent tong survey occurred.
Over the years, MDNR has attempted to enhance oyster production at Man-O-War shoal. Fresh shell was added to the east side of the bar in 1988. Man-O-War was planted with seed in 1995, 2000, 2006, and 2013 and these years coincide with the four years in which the fall survey recorded the greatest densities of live oysters there (Figure 2). In 2000, 29 acres was planted with 18,548 bushels of seed (13,563,283 oysters), in 2006, 29 acres was planted with 39,635 bushels of seed (28,983,218 oysters), and in 2013, 43,360,000 oysters (spat on shell) was planted over 11.7 acres. The amount of seed and acres planted in 1995 was not recorded. The harvest of oysters from the upper bay, where Man-O-War oyster bar is located, consists of between 0% (19 bushels in 2012-13) and 33.8% (18,930 bushels in 2002-03) of the
25
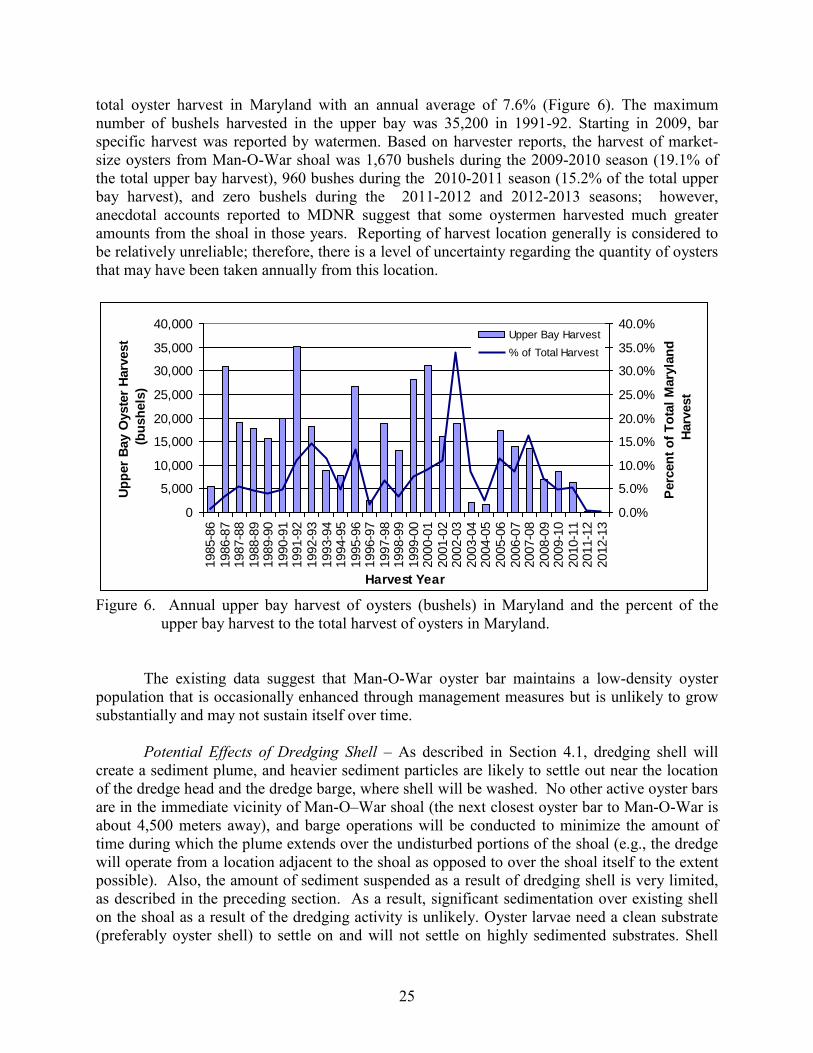
total oyster harvest in Maryland with an annual average of 7.6% (Figure 6). The maximum number of bushels harvested in the upper bay was 35,200 in 1991-92. Starting in 2009, bar specific harvest was reported by watermen. Based on harvester reports, the harvest of market-size oysters from Man-O-War shoal was 1,670 bushels during the 2009-2010 season (19.1% of the total upper bay harvest), 960 bushes during the 2010-2011 season (15.2% of the total upper bay harvest), and zero bushels during the 2011-2012 and 2012-2013 seasons; however, anecdotal accounts reported to MDNR suggest that some oystermen harvested much greater amounts from the shoal in those years. Reporting of harvest location generally is considered to be relatively unreliable; therefore, there is a level of uncertainty regarding the quantity of oysters that may have been taken annually from this location.
0
5,000
10,000
15,000
20,000
25,000
30,000
35,000
40,000
1985-8
61986-8
71987-8
81988-8
91989-9
01990-9
11991-9
21992-9
31993-9
41994-9
51995-9
61996-9
71997-9
81998-9
91999-0
02000-0
12001-0
22002-0
32003-0
42004-0
52005-0
62006-0
72007-0
82008-0
92009-1
02010-1
12011-1
22012-1
3
Harvest Year
Up
per
Bay O
yste
r H
arv
est
(bu
sh
els
)
0.0%
5.0%
10.0%
15.0%
20.0%
25.0%
30.0%
35.0%
40.0%
Perc
en
t o
f T
ota
l M
ary
lan
d
Harv
est
Upper Bay Harvest
% of Total Harvest
Figure 6. Annual upper bay harvest of oysters (bushels) in Maryland and the percent of the
upper bay harvest to the total harvest of oysters in Maryland. The existing data suggest that Man-O-War oyster bar maintains a low-density oyster population that is occasionally enhanced through management measures but is unlikely to grow substantially and may not sustain itself over time. Potential Effects of Dredging Shell – As described in Section 4.1, dredging shell will create a sediment plume, and heavier sediment particles are likely to settle out near the location of the dredge head and the dredge barge, where shell will be washed. No other active oyster bars are in the immediate vicinity of Man-O–War shoal (the next closest oyster bar to Man-O-War is about 4,500 meters away), and barge operations will be conducted to minimize the amount of time during which the plume extends over the undisturbed portions of the shoal (e.g., the dredge will operate from a location adjacent to the shoal as opposed to over the shoal itself to the extent possible). Also, the amount of sediment suspended as a result of dredging shell is very limited, as described in the preceding section. As a result, significant sedimentation over existing shell on the shoal as a result of the dredging activity is unlikely. Oyster larvae need a clean substrate (preferably oyster shell) to settle on and will not settle on highly sedimented substrates. Shell
26
reclamation dredging occurring outside the spawning season may further minimize the impact to oyster settlement rate.
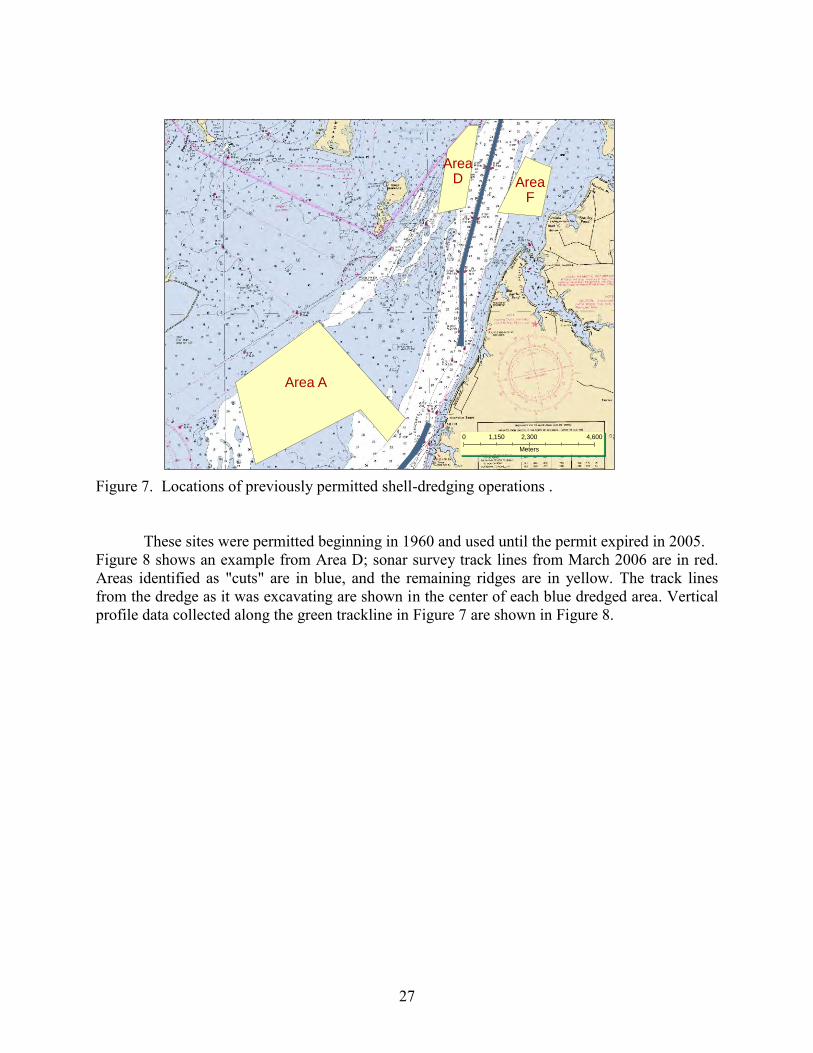
Increased turbidity, as occurs from sediment plumes, was not found to have significant impacts on oyster recruitment based on a study in Texas (Lunt and Smee 2014), therefore, it is not thought that there will be significant impacts to recruitment during the dredging activity. Man-O-War oyster bar has little natural spawning, however, impacts could be further minimized if shell reclamation dredging does not happen when spawning is not occurring (May to September). This permit application requests approval to remove approximately 5 million bushels of the shell from Man-O-War shoal. The preliminary plan for shell removal is to make multiple cuts into the shoal along its periphery in years two and five of the permit term. The approach is intended to preserve the basic integrity of the shoal structure. Most of the surface area of the shoal will remain undisturbed and serve as a base for future shell or seed planting. As currently planned, shell will remain at the bottom and along the sides of the dredged cuts and, thus, potentially will increase the total shell surface area on which spat may set if conditions are conducive to a spat set in any future year. In addition, the increased surface area will provide opportunities for colonization by epibenthic organisms that support the food chain of the biological communities that occupy hard substrate in the Bay. These potentially positive outcomes of dredging shell might not be realized if the dredged shoal loses its structural integrity. To assess whether dredged cuts become filled with sediment or collapse from the sides, MGS conducted detailed bathymetric surveys of previously permitted Areas A, D, and F (J. Halka, MGS, pers. comm.). Area A is located west of Tolchester Beach; Areas D and F are east of Pooles Island, Area D is on the west side of the C&D Approach Channel, and Area F is on the east side of the channel (Figure 7).
27
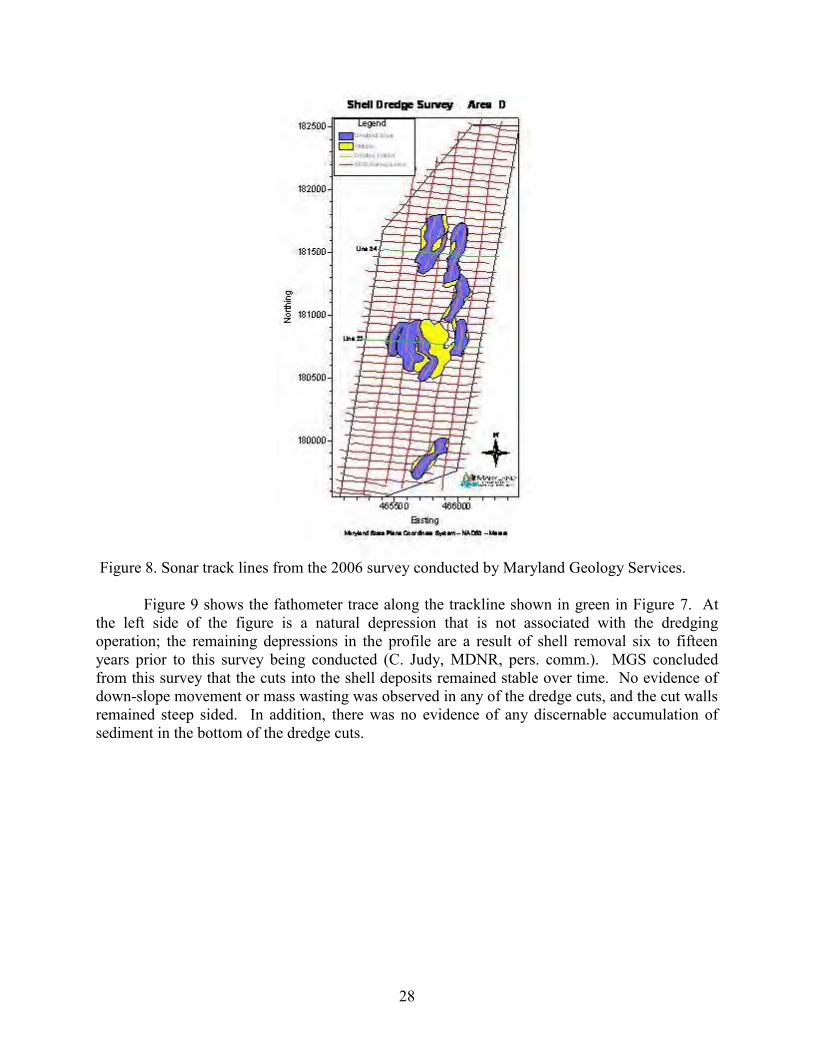
Figure 7. Locations of previously permitted shell-dredging operations . These sites were permitted beginning in 1960 and used until the permit expired in 2005. Figure 8 shows an example from Area D; sonar survey track lines from March 2006 are in red. Areas identified as "cuts" are in blue, and the remaining ridges are in yellow. The track lines from the dredge as it was excavating are shown in the center of each blue dredged area. Vertical profile data collected along the green trackline in Figure 7 are shown in Figure 8.
Area A
AreaF
AreaD
0 2,300 4,6001,150
Meters
28
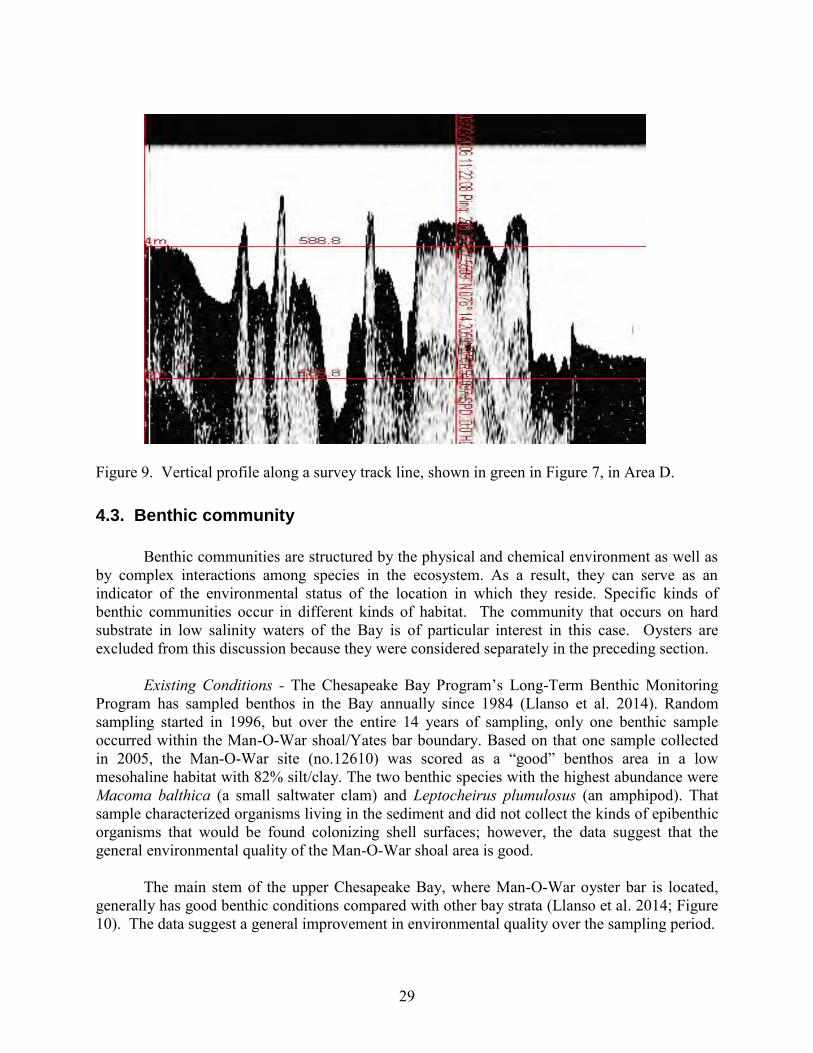
Figure 8. Sonar track lines from the 2006 survey conducted by Maryland Geology Services. Figure 9 shows the fathometer trace along the trackline shown in green in Figure 7. At the left side of the figure is a natural depression that is not associated with the dredging operation; the remaining depressions in the profile are a result of shell removal six to fifteen years prior to this survey being conducted (C. Judy, MDNR, pers. comm.). MGS concluded from this survey that the cuts into the shell deposits remained stable over time. No evidence of down-slope movement or mass wasting was observed in any of the dredge cuts, and the cut walls remained steep sided. In addition, there was no evidence of any discernable accumulation of sediment in the bottom of the dredge cuts.
29
Figure 9. Vertical profile along a survey track line, shown in green in Figure 7, in Area D.
4.3. Benthic community
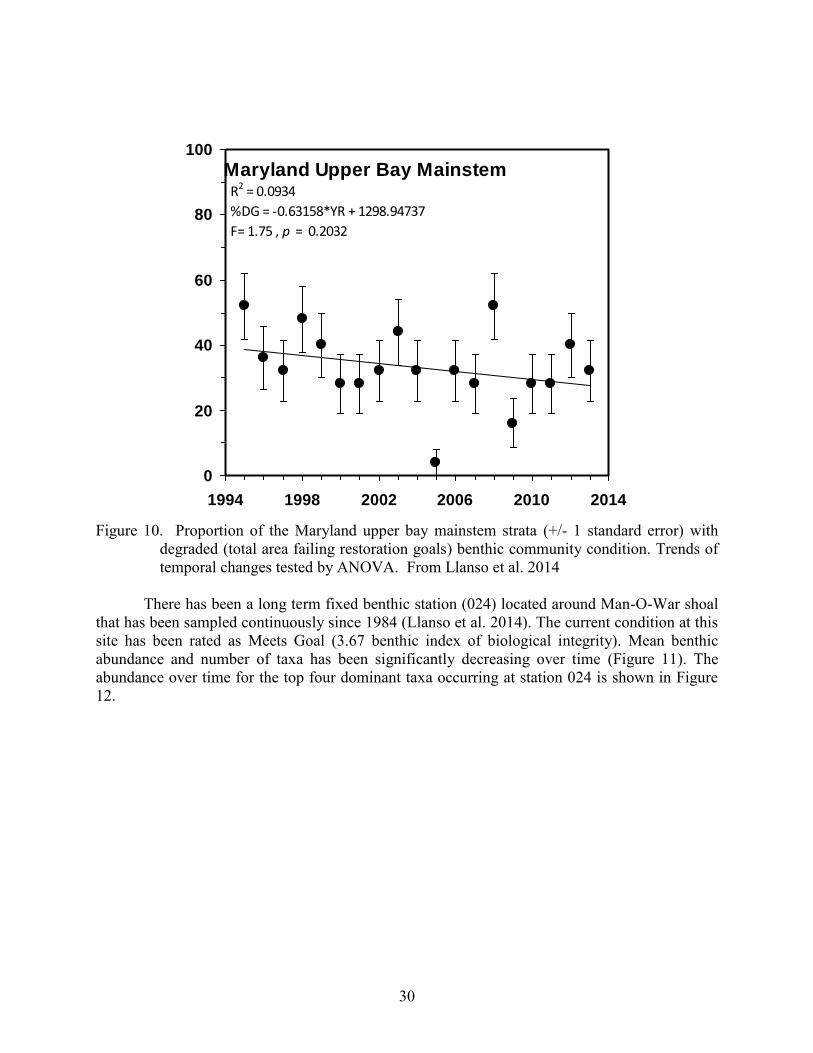
Benthic communities are structured by the physical and chemical environment as well as by complex interactions among species in the ecosystem. As a result, they can serve as an indicator of the environmental status of the location in which they reside. Specific kinds of benthic communities occur in different kinds of habitat. The community that occurs on hard substrate in low salinity waters of the Bay is of particular interest in this case. Oysters are excluded from this discussion because they were considered separately in the preceding section. Existing Conditions - The Chesapeake Bay Program’s Long-Term Benthic Monitoring Program has sampled benthos in the Bay annually since 1984 (Llanso et al. 2014). Random sampling started in 1996, but over the entire 14 years of sampling, only one benthic sample occurred within the Man-O-War shoal/Yates bar boundary. Based on that one sample collected in 2005, the Man-O-War site (no.12610) was scored as a “good” benthos area in a low mesohaline habitat with 82% silt/clay. The two benthic species with the highest abundance were Macoma balthica (a small saltwater clam) and Leptocheirus plumulosus (an amphipod). That sample characterized organisms living in the sediment and did not collect the kinds of epibenthic organisms that would be found colonizing shell surfaces; however, the data suggest that the general environmental quality of the Man-O-War shoal area is good. The main stem of the upper Chesapeake Bay, where Man-O-War oyster bar is located, generally has good benthic conditions compared with other bay strata (Llanso et al. 2014; Figure 10). The data suggest a general improvement in environmental quality over the sampling period.
30
Maryland Upper Bay Mainstem
0
20
40
60
80
100
1994 1998 2002 2006 2010 2014
R2 = 0.0934
%DG = -0.63158*YR + 1298.94737
F= 1.75 , p = 0.2032
Figure 10. Proportion of the Maryland upper bay mainstem strata (+/- 1 standard error) with
degraded (total area failing restoration goals) benthic community condition. Trends of temporal changes tested by ANOVA. From Llanso et al. 2014
There has been a long term fixed benthic station (024) located around Man-O-War shoal
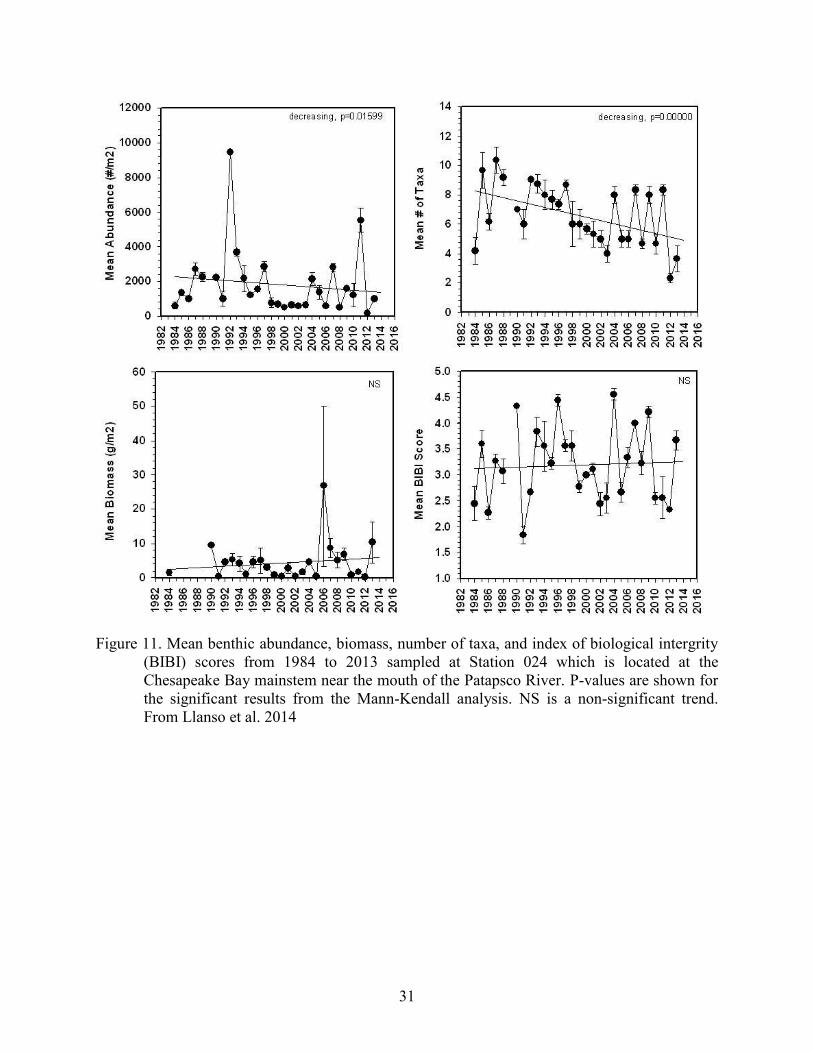
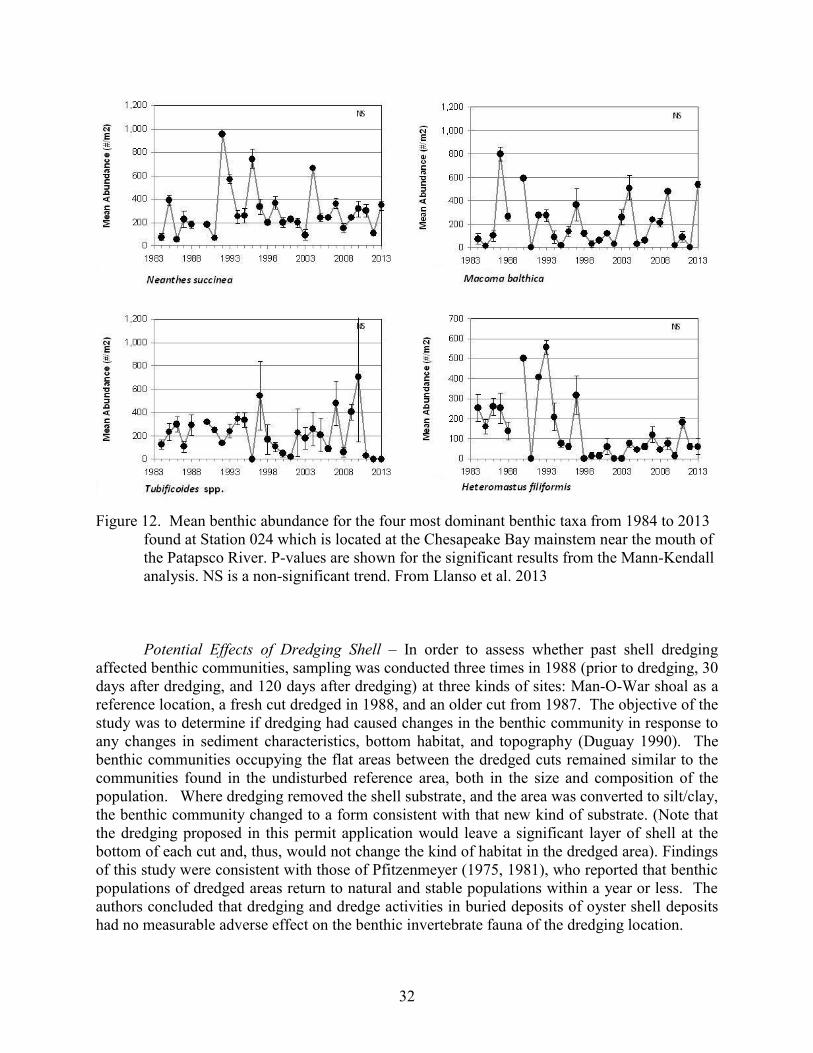
that has been sampled continuously since 1984 (Llanso et al. 2014). The current condition at this site has been rated as Meets Goal (3.67 benthic index of biological integrity). Mean benthic abundance and number of taxa has been significantly decreasing over time (Figure 11). The abundance over time for the top four dominant taxa occurring at station 024 is shown in Figure 12.
31
Figure 11. Mean benthic abundance, biomass, number of taxa, and index of biological intergrity
(BIBI) scores from 1984 to 2013 sampled at Station 024 which is located at the Chesapeake Bay mainstem near the mouth of the Patapsco River. P-values are shown for the significant results from the Mann-Kendall analysis. NS is a non-significant trend. From Llanso et al. 2014
32
Figure 12. Mean benthic abundance for the four most dominant benthic taxa from 1984 to 2013
found at Station 024 which is located at the Chesapeake Bay mainstem near the mouth of the Patapsco River. P-values are shown for the significant results from the Mann-Kendall analysis. NS is a non-significant trend. From Llanso et al. 2013
Potential Effects of Dredging Shell – In order to assess whether past shell dredging affected benthic communities, sampling was conducted three times in 1988 (prior to dredging, 30 days after dredging, and 120 days after dredging) at three kinds of sites: Man-O-War shoal as a reference location, a fresh cut dredged in 1988, and an older cut from 1987. The objective of the study was to determine if dredging had caused changes in the benthic community in response to any changes in sediment characteristics, bottom habitat, and topography (Duguay 1990). The benthic communities occupying the flat areas between the dredged cuts remained similar to the communities found in the undisturbed reference area, both in the size and composition of the population. Where dredging removed the shell substrate, and the area was converted to silt/clay, the benthic community changed to a form consistent with that new kind of substrate. (Note that the dredging proposed in this permit application would leave a significant layer of shell at the bottom of each cut and, thus, would not change the kind of habitat in the dredged area). Findings of this study were consistent with those of Pfitzenmeyer (1975, 1981), who reported that benthic populations of dredged areas return to natural and stable populations within a year or less. The authors concluded that dredging and dredge activities in buried deposits of oyster shell deposits had no measurable adverse effect on the benthic invertebrate fauna of the dredging location.
33
In 2011, a benthic survey was conducted to determine impacts on benthic communities before and after shell reclamation occurred in Lecompte Bay in the Choptank River, Maryland (Llanso et al 2011). The study did not find significant impact for the shell reclamation. One location of the study did suggest impacts from dredging had occurred but the results were not significant. Shell dredging takes place in many locations along the Atlantic and Gulf coasts of the U.S. where oysters have occurred historically, and some information is available about the effects of such dredging in other areas. A study in 1975 examined the effects of dredging shell on soft-bottom benthic communities in Tampa Bay, Florida (Conner and Simon 1979). Changes in sediment parameters, including increased particle size, reduced organic content, and reduced silt/clay were observed up to 6 months after dredging, but after 12 months no significant differences in sediment characteristics remained between pre- and post-dredging samples. Dredging caused an immediate loss of benthos: 40% fewer species, 66% decrease in abundance, and 87% decrease in biomass. Amphiod taxa were the least affected, and bivalves were the most affected groups of species. Significant differences in benthic abundance, biomass, and number of taxa between the dredged site and the control site persisted for up to six months after dredging; values at the dredged site always were less than those at the reference site. No significant difference in benthic abundance and number of taxa remained at 12 months after dredging, except at one dredged site at which biomass remained significantly lower than at the control. Based on the findings of previous studies, dredging shell from Man-O-War shoal is likely to result in a loss of benthos, both biomass and numbers of species, in the dredged cuts immediately following dredging, and bivalve species probably will be most affected; however, benthic communities probably will recover to pre-dredging levels of abundance, biomass, and number of species within 6 to12 months after dredging is completed.
4.4. Fish Communities
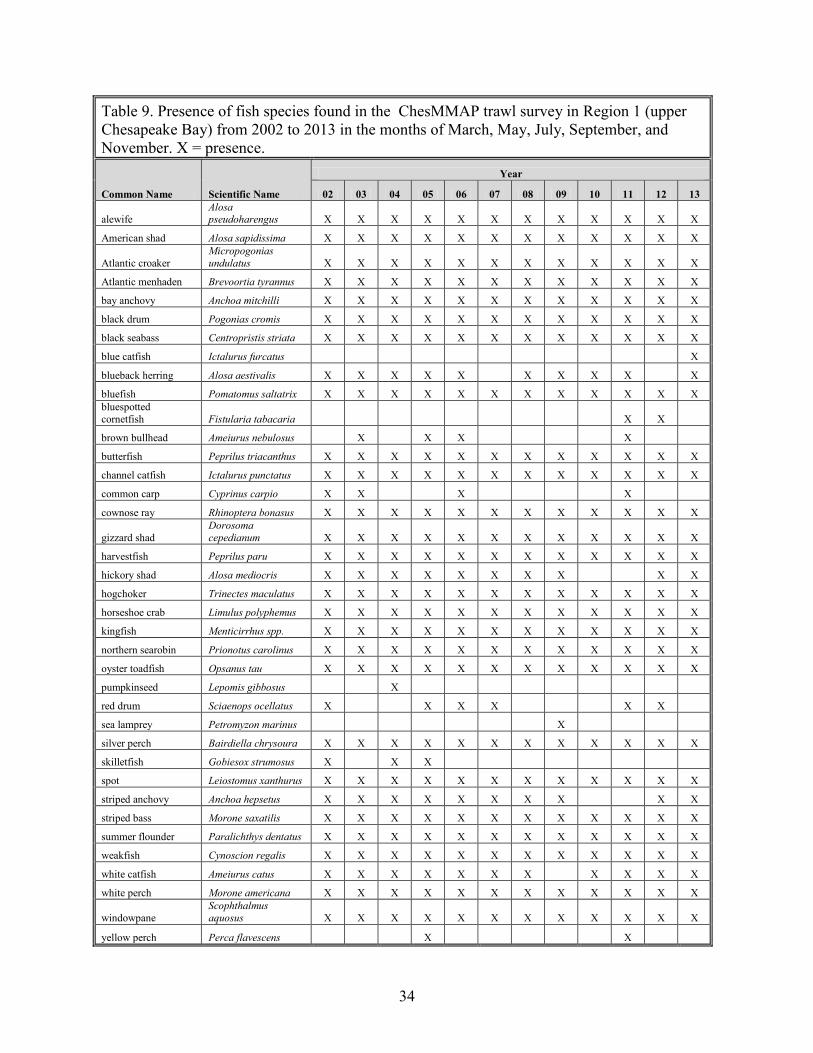
One major concern regarding dredging shell from Man-O-War shoal is the potential effect on fish communities and, consequently, on the value of the location for recreational and commercial fishing. Several fish surveys are useful for characterizing the species that can be found in the vicinity of the Man-O-War shoal at various times and on the possible effects of the proposed shell-dredging project on those species. Existing Conditions – Approximately 350 fish species reside in the Chesapeake Bay. Non-migratory fish species located in the upper Chesapeake Bay include species such as anchovy, blenny, flounder, goby, hogchoker, oyster toadfish, pipefish, perch, skilletfish, silverside, and stickleback. Migratory species that reside seasonally in the upper bay include species such as American eel, American shad, bluefish, croaker, herrings, striped bass, spot, and weakfish. Annual fish trawl surveys have been conducted in March, May, July, September, and November every year since 2002 as part of ChesMMAP (VIMS Multispecies Research Group 2014). Fish species found in the upper Chesapeake Bay (where Man-O-War shoal is located) are listed in Table 9.
34
Table 9. Presence of fish species found in the ChesMMAP trawl survey in Region 1 (upper Chesapeake Bay) from 2002 to 2013 in the months of March, May, July, September, and November. X = presence.
Common Name Scientific Name
Year
02 03 04 05 06 07 08 09 10 11 12 13
alewife Alosa pseudoharengus X X X X X X X X X X X X
American shad Alosa sapidissima X X X X X X X X X X X X
Atlantic croaker Micropogonias undulatus X X X X X X X X X X X X
Atlantic menhaden Brevoortia tyrannus X X X X X X X X X X X X
bay anchovy Anchoa mitchilli X X X X X X X X X X X X
black drum Pogonias cromis X X X X X X X X X X X X
black seabass Centropristis striata X X X X X X X X X X X X
blue catfish Ictalurus furcatus X
blueback herring Alosa aestivalis X X X X X X X X X X
bluefish Pomatomus saltatrix X X X X X X X X X X X X bluespotted cornetfish Fistularia tabacaria X X
brown bullhead Ameiurus nebulosus X X X X
butterfish Peprilus triacanthus X X X X X X X X X X X X
channel catfish Ictalurus punctatus X X X X X X X X X X X X
common carp Cyprinus carpio X X X X
cownose ray Rhinoptera bonasus X X X X X X X X X X X X
gizzard shad Dorosoma cepedianum X X X X X X X X X X X X
harvestfish Peprilus paru X X X X X X X X X X X X
hickory shad Alosa mediocris X X X X X X X X X X
hogchoker Trinectes maculatus X X X X X X X X X X X X
horseshoe crab Limulus polyphemus X X X X X X X X X X X X
kingfish Menticirrhus spp. X X X X X X X X X X X X
northern searobin Prionotus carolinus X X X X X X X X X X X X
oyster toadfish Opsanus tau X X X X X X X X X X X X
pumpkinseed Lepomis gibbosus X
red drum Sciaenops ocellatus X X X X X X
sea lamprey Petromyzon marinus X
silver perch Bairdiella chrysoura X X X X X X X X X X X X
skilletfish Gobiesox strumosus X X X
spot Leiostomus xanthurus X X X X X X X X X X X X
striped anchovy Anchoa hepsetus X X X X X X X X X X
striped bass Morone saxatilis X X X X X X X X X X X X
summer flounder Paralichthys dentatus X X X X X X X X X X X X
weakfish Cynoscion regalis X X X X X X X X X X X X
white catfish Ameiurus catus X X X X X X X X X X X
white perch Morone americana X X X X X X X X X X X X
windowpane Scophthalmus aquosus X X X X X X X X X X X X
yellow perch Perca flavescens X X
35
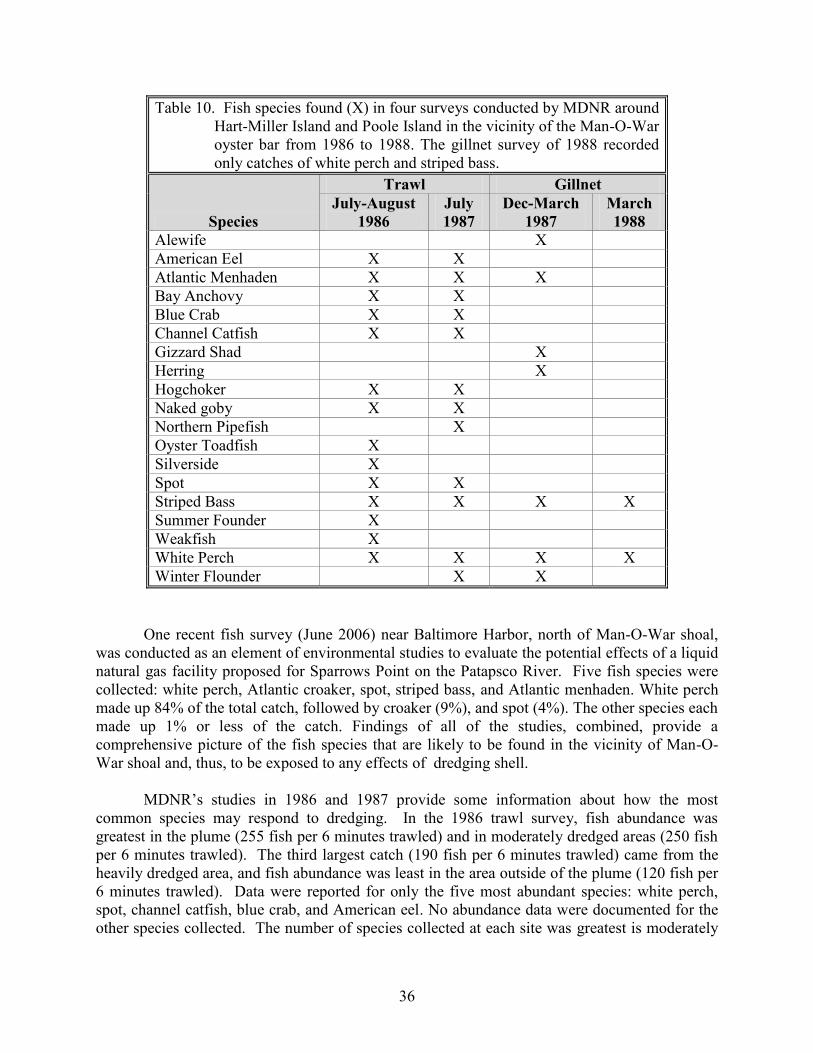
There have been past fish surveys conducted to determine impacts of dredging in the upper Bay. MDNR conducted trawl surveys from July to October, 1986, in sediment plumes created by dredging operations in the upper bay, in locations upstream of the dredging activity, at an old dredge cut, and in an area closed to dredging (DNR 1987). All four sites were in the vicinity of Hart-Miller Island and Poole Island. A follow up trawl study conducted in July 1987 evaluated later effects. MDNR also conducted a gillnet survey in December and March, 1987, around Hart-Miller Island and Poole Island to estimate fish abundance in undisturbed areas and dredge cuts (DNR 1988). A follow-up gillnet survey in March, 1988, examined abundance of striped bass and white perch in dredged and undisturbed areas. Results of those four studies characterize the fish species in the vicinity of Man-O-War oyster bar in areas that were dredged and those that were not dredged (Table 10). Nineteen species were found in the four studies; striped bass and white perch were the only species reported in all four. A mortality study conducted during the process of dredging showed that no adult fish died as a direct result of the suction of the dredge or exposure to the plume of sediment caused by dredging (DNR 1987). That study could not assess the mortality of eggs, larvae, and juveniles because the net mesh was too large to catch small fish.
36
Table 10. Fish species found (X) in four surveys conducted by MDNR around Hart-Miller Island and Poole Island in the vicinity of the Man-O-War oyster bar from 1986 to 1988. The gillnet survey of 1988 recorded only catches of white perch and striped bass.
Species
Trawl Gillnet July-August
1986 July 1987
Dec-March 1987
March 1988
Alewife X American Eel X X Atlantic Menhaden X X X Bay Anchovy X X Blue Crab X X Channel Catfish X X Gizzard Shad X Herring X Hogchoker X X Naked goby X X Northern Pipefish X Oyster Toadfish X Silverside X Spot X X Striped Bass X X X X Summer Founder X Weakfish X White Perch X X X X Winter Flounder X X
One recent fish survey (June 2006) near Baltimore Harbor, north of Man-O-War shoal, was conducted as an element of environmental studies to evaluate the potential effects of a liquid natural gas facility proposed for Sparrows Point on the Patapsco River. Five fish species were collected: white perch, Atlantic croaker, spot, striped bass, and Atlantic menhaden. White perch made up 84% of the total catch, followed by croaker (9%), and spot (4%). The other species each made up 1% or less of the catch. Findings of all of the studies, combined, provide a comprehensive picture of the fish species that are likely to be found in the vicinity of Man-O-War shoal and, thus, to be exposed to any effects of dredging shell. MDNR’s studies in 1986 and 1987 provide some information about how the most common species may respond to dredging. In the 1986 trawl survey, fish abundance was greatest in the plume (255 fish per 6 minutes trawled) and in moderately dredged areas (250 fish per 6 minutes trawled). The third largest catch (190 fish per 6 minutes trawled) came from the heavily dredged area, and fish abundance was least in the area outside of the plume (120 fish per 6 minutes trawled). Data were reported for only the five most abundant species: white perch, spot, channel catfish, blue crab, and American eel. No abundance data were documented for the other species collected. The number of species collected at each site was greatest is moderately
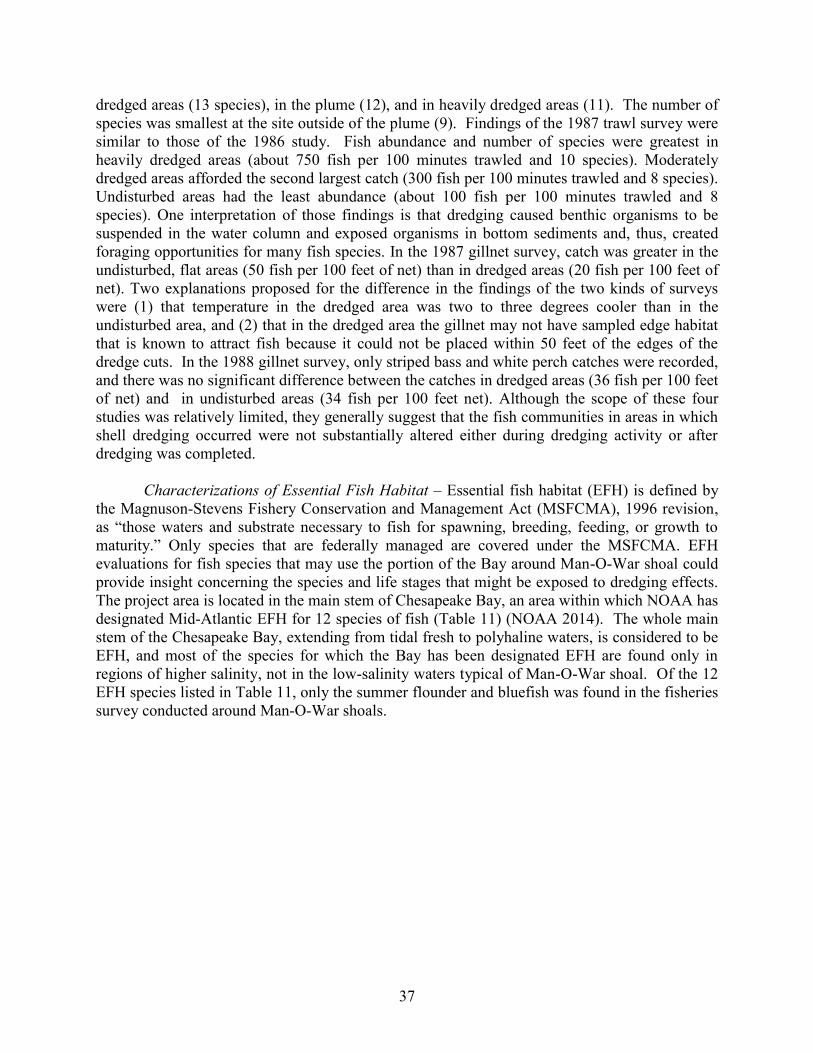
37
dredged areas (13 species), in the plume (12), and in heavily dredged areas (11). The number of species was smallest at the site outside of the plume (9). Findings of the 1987 trawl survey were similar to those of the 1986 study. Fish abundance and number of species were greatest in heavily dredged areas (about 750 fish per 100 minutes trawled and 10 species). Moderately dredged areas afforded the second largest catch (300 fish per 100 minutes trawled and 8 species). Undisturbed areas had the least abundance (about 100 fish per 100 minutes trawled and 8 species). One interpretation of those findings is that dredging caused benthic organisms to be suspended in the water column and exposed organisms in bottom sediments and, thus, created foraging opportunities for many fish species. In the 1987 gillnet survey, catch was greater in the undisturbed, flat areas (50 fish per 100 feet of net) than in dredged areas (20 fish per 100 feet of net). Two explanations proposed for the difference in the findings of the two kinds of surveys were (1) that temperature in the dredged area was two to three degrees cooler than in the undisturbed area, and (2) that in the dredged area the gillnet may not have sampled edge habitat that is known to attract fish because it could not be placed within 50 feet of the edges of the dredge cuts. In the 1988 gillnet survey, only striped bass and white perch catches were recorded, and there was no significant difference between the catches in dredged areas (36 fish per 100 feet of net) and in undisturbed areas (34 fish per 100 feet net). Although the scope of these four studies was relatively limited, they generally suggest that the fish communities in areas in which shell dredging occurred were not substantially altered either during dredging activity or after dredging was completed. Characterizations of Essential Fish Habitat – Essential fish habitat (EFH) is defined by the Magnuson-Stevens Fishery Conservation and Management Act (MSFCMA), 1996 revision, as “those waters and substrate necessary to fish for spawning, breeding, feeding, or growth to maturity.” Only species that are federally managed are covered under the MSFCMA. EFH evaluations for fish species that may use the portion of the Bay around Man-O-War shoal could provide insight concerning the species and life stages that might be exposed to dredging effects. The project area is located in the main stem of Chesapeake Bay, an area within which NOAA has designated Mid-Atlantic EFH for 12 species of fish (Table 11) (NOAA 2014). The whole main stem of the Chesapeake Bay, extending from tidal fresh to polyhaline waters, is considered to be EFH, and most of the species for which the Bay has been designated EFH are found only in regions of higher salinity, not in the low-salinity waters typical of Man-O-War shoal. Of the 12 EFH species listed in Table 11, only the summer flounder and bluefish was found in the fisheries survey conducted around Man-O-War shoals.
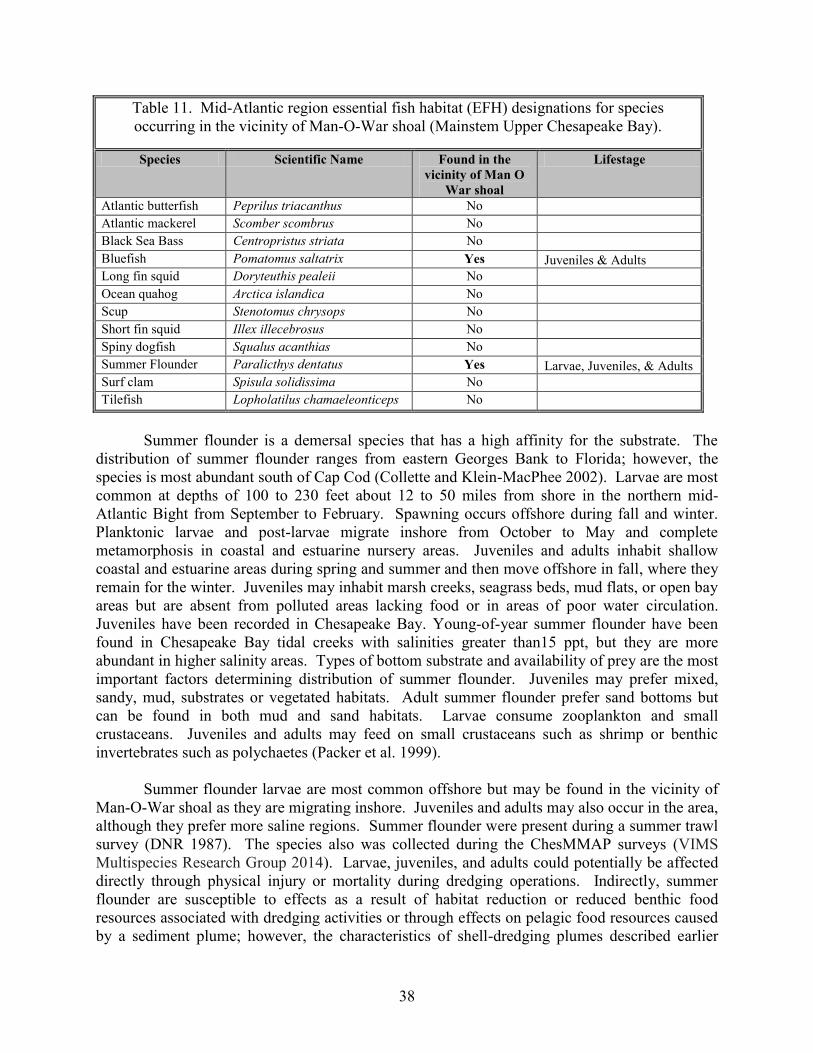
38
Table 11. Mid-Atlantic region essential fish habitat (EFH) designations for species occurring in the vicinity of Man-O-War shoal (Mainstem Upper Chesapeake Bay).
Species Scientific Name Found in the vicinity of Man O
War shoal
Lifestage
Atlantic butterfish Peprilus triacanthus No Atlantic mackerel Scomber scombrus No Black Sea Bass Centropristus striata No Bluefish Pomatomus saltatrix Yes Juveniles & Adults Long fin squid Doryteuthis pealeii No Ocean quahog Arctica islandica No Scup Stenotomus chrysops No Short fin squid Illex illecebrosus No Spiny dogfish Squalus acanthias No Summer Flounder Paralicthys dentatus Yes Larvae, Juveniles, & Adults Surf clam Spisula solidissima No Tilefish Lopholatilus chamaeleonticeps No
Summer flounder is a demersal species that has a high affinity for the substrate. The distribution of summer flounder ranges from eastern Georges Bank to Florida; however, the species is most abundant south of Cap Cod (Collette and Klein-MacPhee 2002). Larvae are most common at depths of 100 to 230 feet about 12 to 50 miles from shore in the northern mid-Atlantic Bight from September to February. Spawning occurs offshore during fall and winter. Planktonic larvae and post-larvae migrate inshore from October to May and complete metamorphosis in coastal and estuarine nursery areas. Juveniles and adults inhabit shallow coastal and estuarine areas during spring and summer and then move offshore in fall, where they remain for the winter. Juveniles may inhabit marsh creeks, seagrass beds, mud flats, or open bay areas but are absent from polluted areas lacking food or in areas of poor water circulation. Juveniles have been recorded in Chesapeake Bay. Young-of-year summer flounder have been found in Chesapeake Bay tidal creeks with salinities greater than15 ppt, but they are more abundant in higher salinity areas. Types of bottom substrate and availability of prey are the most important factors determining distribution of summer flounder. Juveniles may prefer mixed, sandy, mud, substrates or vegetated habitats. Adult summer flounder prefer sand bottoms but can be found in both mud and sand habitats. Larvae consume zooplankton and small crustaceans. Juveniles and adults may feed on small crustaceans such as shrimp or benthic invertebrates such as polychaetes (Packer et al. 1999). Summer flounder larvae are most common offshore but may be found in the vicinity of Man-O-War shoal as they are migrating inshore. Juveniles and adults may also occur in the area, although they prefer more saline regions. Summer flounder were present during a summer trawl survey (DNR 1987). The species also was collected during the ChesMMAP surveys (VIMS Multispecies Research Group 2014). Larvae, juveniles, and adults could potentially be affected directly through physical injury or mortality during dredging operations. Indirectly, summer flounder are susceptible to effects as a result of habitat reduction or reduced benthic food resources associated with dredging activities or through effects on pelagic food resources caused by a sediment plume; however, the characteristics of shell-dredging plumes described earlier
39
suggest that adverse effects are unlikely, and the proposed approach to remove shell from the periphery of the shoal, leave shell substrate in cuts, and leave the main body of the shoal intact would minimize habitat reduction.
Bluefish can be found in the western North Atlantic region from Nova Scotia to Argentina. All of the major estuaries between Florida and Marine are considered EFH for both the juvenile and adult bluefish. The ChesMMAP survey conducted in the upper bay has noted the presence of bluefish during the all months except early spring (VIMS Multispecies Research Group 2014). Bluefish are more common in the mid and lower Chesapeake Bay, but can be found in the upper bay as far north as Baltimore which is in the vicinity of Man-O-War shoals. Bluefish migrate into the bay in the spring and exit the bay in the fall, heading offshore and south. Spawning occurs offshore of the Atlantic coast in deeper waters.
Juvenile bluefish are usually found closer to the shorelines and within creeks of the bay
during the daylight hours and in the open bay or channel waters at night (Fahay et al. 1999). Juveniles use mostly sand substrates, but can be associated with some mud, silt, clay, oyster beds, and seagrass beds. Juveniles can be commonly found in depths ranging for 3 to 98 feet. Juvenile bluefish diets consist of menhaden, bay anchovy, striped bass, clupeids, and Atlantic silversides. Adult bluefish prefer open, deeper waters in the mid to lower bay, commonly traveling in schools. Adult bluefish are sight feeders that prey nearly exclusively on other fish species. Salinity tolerances for bluefish range from 3 to 34 ppt, but generally prefer 23 to 34 ppt.
Impacts to bluefish of the proposed shell reclamation dredging would be minimal due to
the Man-O-War shoals being located at the most northern range of bluefish. Furthermore, bluefish are a pelagic species feeding in the open waters of the bay, thus not as dependent of bottom habitats. There may be some localized, short term impacts to bluefish feeding while dredging is ongoing creating a sediment plume; however, these impacts should cease after the plume disperses.
Reef-Orientated Fish Species Present in the Vicinity of the Project Area - Several species of fish in the Bay use oyster bars as a primary source of habitat, for spawning, foraging, and as refuge from predation year-round (Coen et al 1999). These include naked goby, skilletfish, blennies, and oyster toadfish. These species would be the most directly affected by any modifications of their oyster bar habitat. Naked gobies (Gobiosoma bosci) are found in the Chesapeake Bay year-round in a wide range of salinities, including tidal freshwater. They reside mostly in shallow waters around oyster bars and vegetation. In the winter, gobies migrate to deeper waters or burrow in muddy substrate. The diet of gobies consists of small crustaceans. They spawn from May through the late fall, laying their eggs in empty oyster shells (CBP 2009a). During shell dredging, individual fish could potentially be directly affected by the action of dredging. The proposed plan to remove shell only from the periphery of the shoal and to leave shell at the bottom of all cuts, and the fact that the structure of the cuts is likely to be stable suggests that loss of goby habitat due to dredging shell is unlikely and, in fact, that the increased surface area of exposed shell may actually increase total available habitat for this species.
40
Skilletfish (Gobiesox strumosus) can be found throughout Chesapeake Bay as far north as the Magothy River. During the warmer months, skilletfish reside in shallow waters, usually on oyster bars, but they can reside in eelgrass beds and muddy substrate. In the winter, skilletfish migrate to deeper waters of the Bay. Skilletfish feed on small crustaceans and bristle worms, and lay their eggs from April to August in empty oyster shells (CBP 2009a). Man-O-War shoal is located north of the Magothy River; therefore it this species is unlikely to occur in the area in substantial abundance, and no effects are anticipated. Striped blenny and feather blenny (Chasmodes bosquianus and Hypsoblennius hentz) are abundant, year-round inhabitants of Chesapeake Bay. In warmer months, they reside in shallow waters, preferably on oyster reefs, but they also can reside in SAV or mud flats. In the winter months, blennies migrate to deeper waters in the Bay. The diet of blennies consists of small crustaceans and mollusks, and spawning occurs from early spring to August, when blennies lay their eggs in empty oyster shells, preferably on live oyster bars (CBP 2009a). Blennies are most abundant on live oyster bottom; consequently, enhancing the oyster population on Man-O-War shoal following shell dredging (i.e., through management actions and increased shell surface area for natural spat set) could increase the abundance of these species. Oyster toadfish (Opsanus tau) are found in Chesapeake Bay year-round and are very abundant bottom-dwellers in wrecks, debris, vegetation, oyster reefs, and rocky or muddy bottoms. In the winter months, oyster toadfish migrate to deeper waters. Their diet consists of small crabs and crustaceans, as well as small fish and mollusks. Oyster toadfish spawn in the shallow waters of Chesapeake Bay from April to October (CBP 2009a). Individual fish may be directly affected by the action of dredging but, as suggested for the other reef-dependent species, the proposed approach to removing shell from the shoal may result in an increase in available habitat for this species. Other Common Species Present in the Vicinity of the Project Area - The following species do not have a designated EFH but were taken in the greatest abundance during the MDNR’s surveys (1987, 1988) and ChesMMAP (VIMS Multispecies Research Group 2014). Striped bass (Monroe saxatilis) is a piscivorous species that resides in Chesapeake Bay in a variety of environmental conditions. The species is anadromous, spawning in fresh or nearly fresh water once each year between April and June. Striped bass eggs tolerate temperatures ranging from 14oC to 23oC, and larvae tolerate temperature ranging from 10oC to 24oC. The temperature range for juvenile striped bass ranges from 10oC to 27oC. Fish in these three life stages reside in the fresh or nearly fresh water habitat where spawning occurred. Adult striped bass tolerate a wider range of temperatures from (0oC - 30oC) and feed on fish and invertebrates.
Striped bass eggs and larvae will not be affected by the proposed dredging at Man-O-War shoal because the spawning area for this species is located well to the north of the shoal (north of Bush River). Adult and older juvenile striped bass are likely to be found at the shoal regularly. Individual juveniles and adults are unlikely to be directly affected by the action of dredging because of their mobility. The alterations of the structure of the shoal structure resulting from shell removal as proposed here will create irregular topography within the shoal that may
41
contribute to increases in epibenthic organisms and other organisms that occupy shell habitat and serve as forage for striped bass. In addition, the additional structure created by the dredge cuts as well as any enhancement of the live oyster bottom that may result from subsequent management actions may attract fish and result in increased densities. White perch (Monroe americana) reside everywhere in Chesapeake Bay but prefer substrates with fairly level bottom topography and silt, mud, clay, or sand bottom substrate. Spawning usually occurs in freshwater but can occur in salinities up to 4.2 ppt. Larvae prefer salinities of 3 to 5 ppt. Juvenile white perch can remain in low-salinity nursery areas for up to one year old, then the fish begin to prefer demersal habitat and occasionally migrate offshore during the day. Adults can be found at water temperatures ranging from 2oC to 32.5oC and can tolerate salinities ranging from fresh water to sea water. Shell dredging effects on white perch are expected to be similar to those on striped bass. Early life stages are unlikely to be affected because Man-O-War shoal is not in a major white perch spawning area (north of Back River). Habitat effects would be expected to be the same as described previously, including the likelihood of an increase in the quality and quantity of habitat for this species Spot (Leiostomus xanthurus) migrate seasonally as adults, entering bays and estuaries in the spring. In the late summer or fall, spot move offshore to spawn. Adult spot are primarily found in salinities greater than 5 ppt, but juveniles can be found at lower salinities as well as in tidal freshwater. Primary nursery areas for juvenile spot occur in low salinity areas of the Bay and tidal creeks, and spot also can be found associated with eelgrass communities and oyster beds. As water temperatures decrease during the fall, most juveniles migrate to the ocean, but some may overwinter in deeper waters of the Bay. Juvenile spot would be likely to be found in the project area throughout the summer, but adults would be less likely to occur. Individual fish are unlikely to be affected by the action of dredging because of their mobility. Habitat effects would be expected to be the same as described for striped bass and white perch, including the likelihood of an increase in the quality and quantity of habitat for this species Bay anchovy (Anchoa mitchilli) is a non-migratory, schooling species that resides in Chesapeake Bay year round. It is a major source of food for many predatory fish in the Bay, including striped bass. Spawning occurs between April and September where temperature is warmer than 12oC and salinity is greater than 10 ppt. Bay anchovy tolerate wide ranges of salinity and temperature. Bay anchovies will be present in the project area and, as plankton feeders, could be affected by plume effects on phytoplankton and zooplankton. The plume characteristics described previously, however, are unlikely to have adverse biological effects and are expected to dissipate rapidly after cessation of dredging. Bay anchovies do not use bottom substrates; therefore, they would be unaffected by the proposed alterations of Man-O-War shoal. Blue crabs (Callinectes sapidus) are an important swimming crustacean species located throughout the bay. It is bottom dwelling species feeding on clams, small oysters, mussels, smaller crustaceans, freshly dead fish, and plant and animal detritus. Blue crabs can reside in all types of bottom habitat within the bay. The blue crab normally resides in shallow waters and grass beds during the warmer months and hibernates in the deep trenches of the bay during the colder months. There may be a slight concern with shell reclamation dredging during the winter
42
months while crabs could be hibernating; however, very few crabs will overwinter that far north in the bay so impacts should be minimal.
4.5. Commercial fishing
The main commercial species harvested around Man-O-War shoals are oysters, blue crabs, and striped bass. As discussed in section 4.4, minimal, localized, and short-lived negative impacts may occur for blue crabs from the sediment plume. After the dredging, positive impacts could occur for striped bass by the additional structure created by the dredge cuts.
The commercial oyster season in Maryland’s portion of the bay occurs from October to March. If shell reclamation dredging occurs in the spring to summer months, commercial oystering will not be affected. Oyster harvest at Man-O-War oyster bar has been zero for the past 2 years, as discussed in section 4.2, and was between 0.8% and 0.9% of the total harvest of oysters in Maryland for 2009-10 and 2010-11 harvest years. The proposed shell reclamation project should have minimal impact to commercial oysters on and near the Man-O-War shoal since dredging will not occur on the areas previously planted with seed in the past 10 years. The amount of harvest on the bar has been very low to zero over the last few years. The nearest oyster bars to Man-O-War is Six Foot Knolls which is a part of a harvest reserve, Nine Foot Knolls, and Craighill Lumps. Sediment plumes from the dredging should not reach these bars because they are more than 4,000 meters south. Waterman oystering on the nearby oyster bars should not be impacted by dredging activity. Minimal and short-live impacts of the proposed shell reclamation dredging to watermen may occur dependent on the time of year dredging occurs. There are over 5,000 commercial crab licenses issued in Maryland and the crabbing season occurs from April to December. Crab pots are the most prevalent gear type in the area on and surrounding the Man-O-War shoal. The majority of the crab harvest in the upper bay occurs between July and September. If the dredging occurs during the crabbing season, crabbing using crab pots in the area will need to be closed so that pots are not located in the path of the dredge. This impact to the waterman crabbing in that area should be short-lived, however, it may be recommended that dredging should occur outside of the July-September range when the majority of crab harvest occurs in the upper bay to lessen this impact. Man-O-War shoal is located within the 025 NOAA area code used to report striped bass harvest. The majority of the striped bass harvested in that area near and on Man-O-War shoal occurs using the hook and line and drift gear types. There is pound net fishing for striped bass in the NOAA area code 025 but none of the nets are in the vicinity of Man-O-War shoal. The season for hook and line occurs from March to December and December to February watermen can use drift gill nets to fish for striped bass. The percent of the total harvest occurring in 025 NOAA area code ranges from 7% to 33% (Figure 13). Impacts of the proposed shell reclamation dredging could be minimized if it occurred in March to May when striped bass harvest usually does not occur in the upper bay (NOAA area code 025).
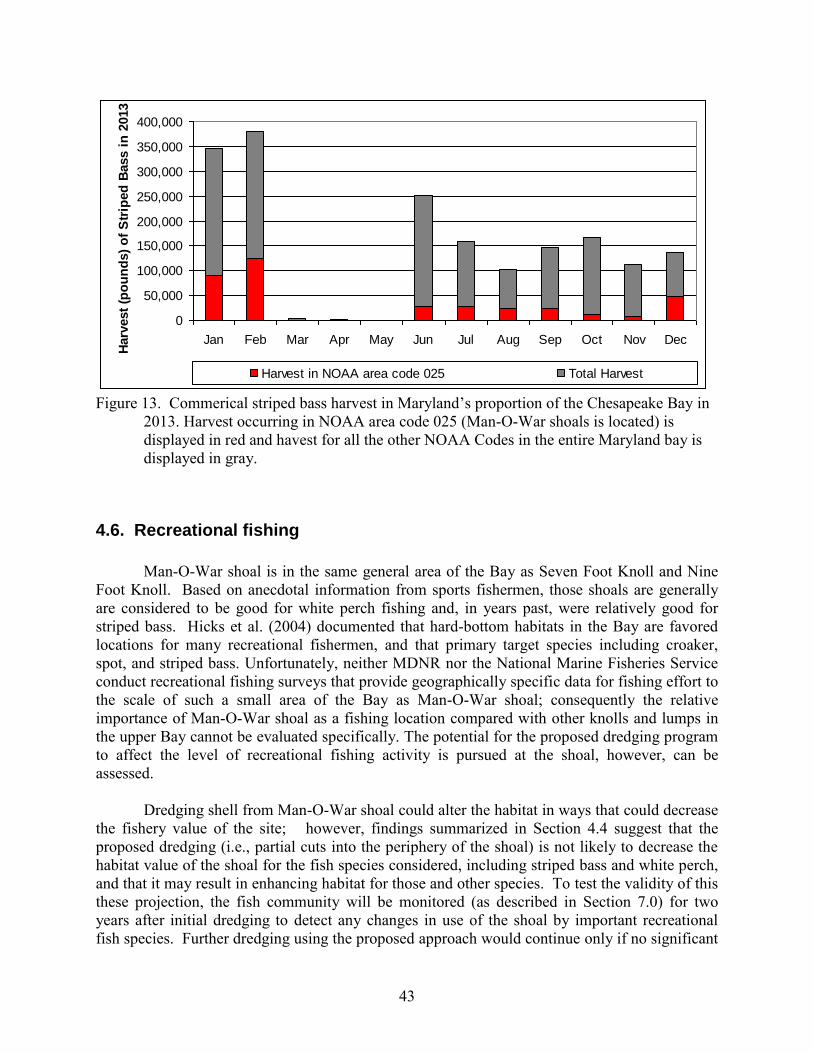
43
0
50,000
100,000
150,000
200,000
250,000
300,000
350,000
400,000
Jan Feb Mar Apr May Jun Jul Aug Sep Oct Nov Dec
Harv
est
(po
un
ds)
of
Str
iped
Bass i
n 2
013
Harvest in NOAA area code 025 Total Harvest
Figure 13. Commerical striped bass harvest in Maryland’s proportion of the Chesapeake Bay in
2013. Harvest occurring in NOAA area code 025 (Man-O-War shoals is located) is displayed in red and havest for all the other NOAA Codes in the entire Maryland bay is displayed in gray.
4.6. Recreational fishing
Man-O-War shoal is in the same general area of the Bay as Seven Foot Knoll and Nine Foot Knoll. Based on anecdotal information from sports fishermen, those shoals are generally are considered to be good for white perch fishing and, in years past, were relatively good for striped bass. Hicks et al. (2004) documented that hard-bottom habitats in the Bay are favored locations for many recreational fishermen, and that primary target species including croaker, spot, and striped bass. Unfortunately, neither MDNR nor the National Marine Fisheries Service conduct recreational fishing surveys that provide geographically specific data for fishing effort to the scale of such a small area of the Bay as Man-O-War shoal; consequently the relative importance of Man-O-War shoal as a fishing location compared with other knolls and lumps in the upper Bay cannot be evaluated specifically. The potential for the proposed dredging program to affect the level of recreational fishing activity is pursued at the shoal, however, can be assessed. Dredging shell from Man-O-War shoal could alter the habitat in ways that could decrease the fishery value of the site; however, findings summarized in Section 4.4 suggest that the proposed dredging (i.e., partial cuts into the periphery of the shoal) is not likely to decrease the habitat value of the shoal for the fish species considered, including striped bass and white perch, and that it may result in enhancing habitat for those and other species. To test the validity of this these projection, the fish community will be monitored (as described in Section 7.0) for two years after initial dredging to detect any changes in use of the shoal by important recreational fish species. Further dredging using the proposed approach would continue only if no significant
44
deleterious effects are observed. If any significant changes in fish usage of the shoal are observed in response to the initial experimental cuts, alternative dredging approaches will be implemented. Dredging activity could interfere with recreational fishing. Fishing boats will be unable to fish the specific location where dredging is being conducted, and boaters may avoid areas of turbidity in the plume generated as a result of dredging, even though past monitoring studies have suggested that, in fact, the density of fish may be greater in the plume than in unaffected waters. MDNR will seek to minimize displacement of fishing activity by scheduling dredging activity so that most work occurs when fishing activity is be expected to be minimal, such as during winter and during weekdays. Some dredging, however, probably will be required in June and July if the dredged shell is to be used to capture natural spat set. Displacement of fishing activity will be unavoidable at those times. Although adverse effects on recreational fishing have been a major point of contention surrounding past shell dredging operations in the upper Bay, this difficulty may be assuaged by the fact that some shell to be recovered in future operations will be used for ecological restoration intended to reestablish live oyster bottom in locations where hard-bottom oyster habitat is declining. Hicks et. al. (2004) confirmed the very high value that recreational fishermen attach to such hard-bottom habitat. They estimated that the creation of 2,000 acres of new hard-bottom habitat in the Bay at 73 locations would increase the net value of recreational fishing activity in the Bay by $640,000 per year. Their study suggests that the benefits of the proposed shell dredging program are likely to significantly outweigh the very limited impediments to on recreational fishing that would be expected to result from the program as it is currently proposed.
4.7. Recreational and Commercial Boating
No boating survey data are available to document the numbers of commercial and recreational vessels that frequent the area of Man-O-War shoal. The Brewerton Shipping Chanel, through which commercial vessels access Baltimore Harbor, is located approximately 3 km southwest of Man-O-War shoal (Figure 1); therefore, dredging activity at the shoal will not interfere with commercial shipping. Man-O-War shoal is in relatively close proximity to western shore tributaries that contain by numerous marinas and waterfront homes and docks, including the Patapsco and Back rivers. Boating traffic through the shoal area probably is substantial during the warm months of the year. As in the case of recreational fishing activity, the presence of the dredge during dredging operations may displace boating activity at and through the dredging site. In addition, dredging may create what some observers might consider to be adverse effects on aesthetics due to the turbidity plume. Such effects are unavoidable but will be temporary and minimal in scope.
45
4.8. Cultural Resources
One issue that must be addressed before any dredging activity is conducted in tidal waters of Maryland is to determine if the proposed dredging will affect any underwater cultural resources. MDNR has consulted the Maryland Historical Trust (MHT) and received confirmation that the proposed program will not affect any cultural resources. The MHT’s confirmation letter is included at the end of the document.
5.0 Potential Ecological Effects of Use of the Dredged Shell
Any permit issued in response to this application will include specifications for how and where shell dredged from Man-O-War shoal is to be used. Shell used in any manner has the potential to result in ecological consequences, both positive and negative. This section describes and evaluates those potential consequences.
5.1 Use of Dredged Shell
MDNR intends to use the shell dredged from Man-O-War shoal on oyster sanctuaries (i.e. areas that are off-limits to commercial harvesting for ecological restoration), on managed public harvest areas, and for aquaculture. This includes all natural and historic oyster bars (Attachment 2 and 3). Planting of shell will be consistent with the guidelines provided in the Chesapeake Bay Program’s 2004 Oyster Management Plan, the Army Corps’ Native Oyster Restoration Master Plan, and Maryland’s Oyster Restoration and Aquaculture Development Plan. The shell planted on managed harvest areas will be directed by MDNR in consultation with Maryland’s County Oyster Committees.
There are three options for the allocation of shell among sanctuary areas, managed public harvest areas, and aquaculture. These three options include:
90% of the dredged shell planted on sanctuary areas and 10% planted on
managed public harvest or aquaculture areas, 50% of the dredged shell planted on sanctuary areas and 50% planted on
managed public harvest or aquaculture areas, or 25% of the dredged shell planted on sanctuary areas and 75% planted on
managed public harvest or aquaculture areas MDNR will utilize public comment received during the permit application review
process, and may conduct additional public outreach with all stakeholder groups to determine the final shell allocation.
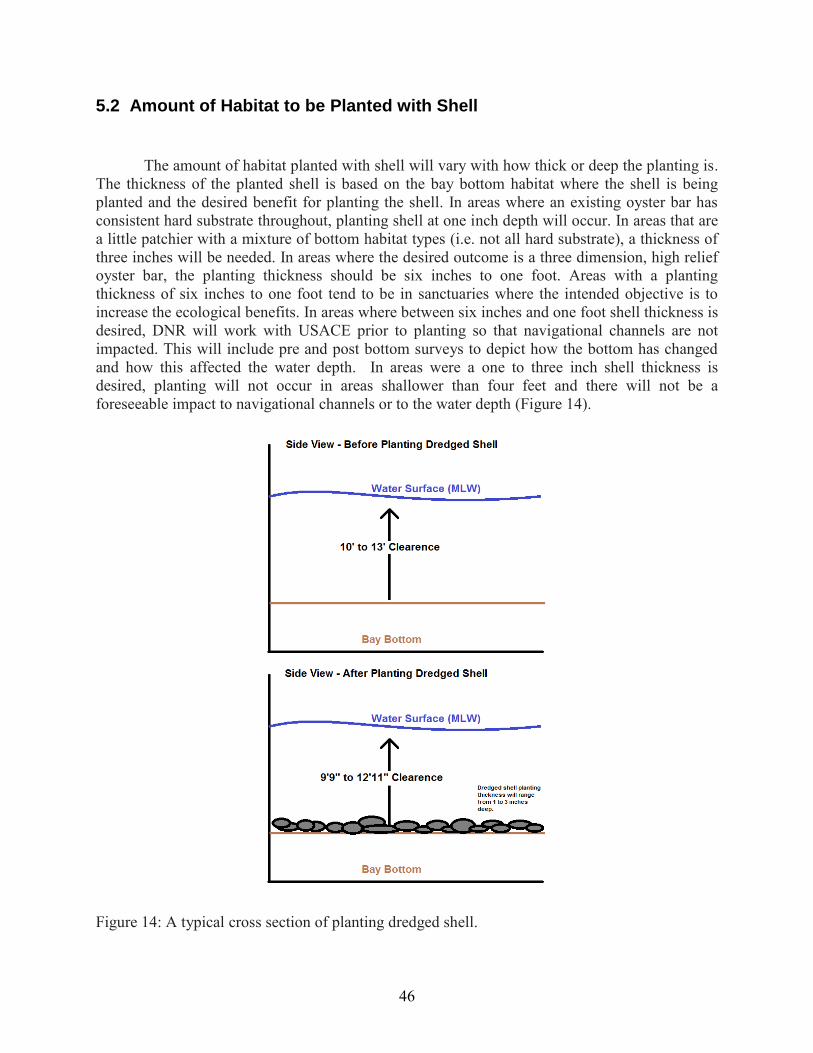
46
5.2 Amount of Habitat to be Planted with Shell
The amount of habitat planted with shell will vary with how thick or deep the planting is. The thickness of the planted shell is based on the bay bottom habitat where the shell is being planted and the desired benefit for planting the shell. In areas where an existing oyster bar has consistent hard substrate throughout, planting shell at one inch depth will occur. In areas that are a little patchier with a mixture of bottom habitat types (i.e. not all hard substrate), a thickness of three inches will be needed. In areas where the desired outcome is a three dimension, high relief oyster bar, the planting thickness should be six inches to one foot. Areas with a planting thickness of six inches to one foot tend to be in sanctuaries where the intended objective is to increase the ecological benefits. In areas where between six inches and one foot shell thickness is desired, DNR will work with USACE prior to planting so that navigational channels are not impacted. This will include pre and post bottom surveys to depict how the bottom has changed and how this affected the water depth. In areas were a one to three inch shell thickness is desired, planting will not occur in areas shallower than four feet and there will not be a foreseeable impact to navigational channels or to the water depth (Figure 14).
Figure 14: A typical cross section of planting dredged shell.
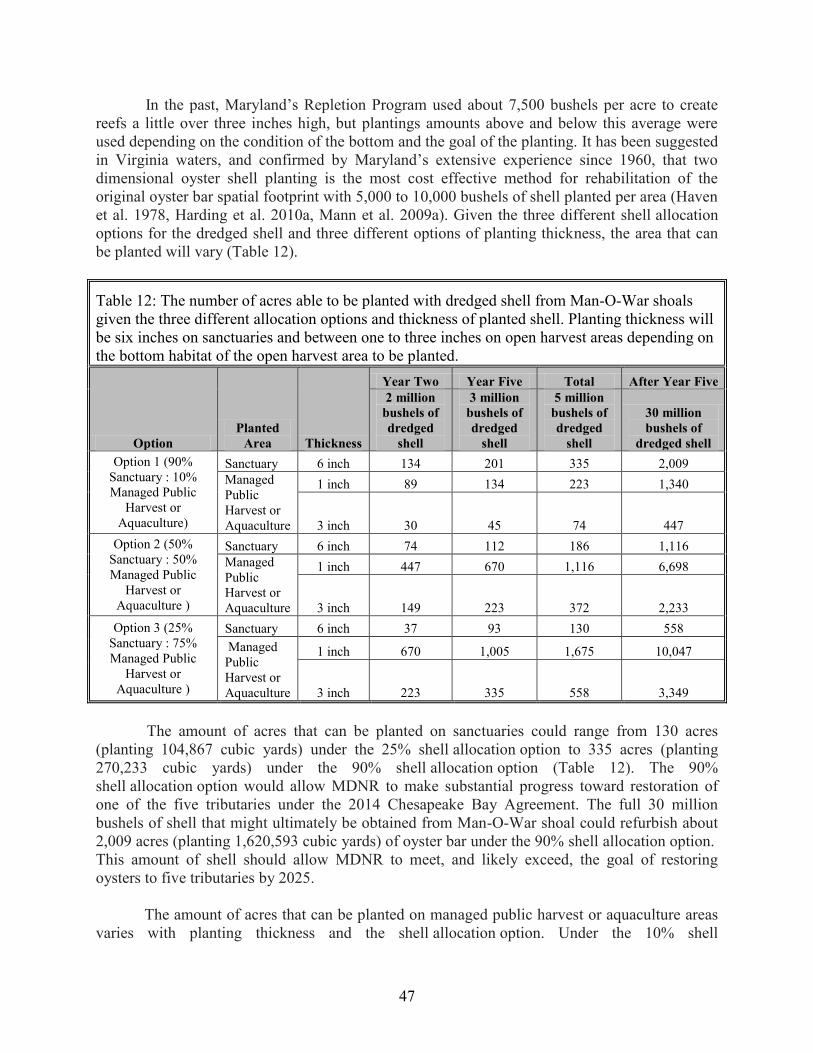
47
In the past, Maryland’s Repletion Program used about 7,500 bushels per acre to create reefs a little over three inches high, but plantings amounts above and below this average were used depending on the condition of the bottom and the goal of the planting. It has been suggested in Virginia waters, and confirmed by Maryland’s extensive experience since 1960, that two dimensional oyster shell planting is the most cost effective method for rehabilitation of the original oyster bar spatial footprint with 5,000 to 10,000 bushels of shell planted per area (Haven et al. 1978, Harding et al. 2010a, Mann et al. 2009a). Given the three different shell allocation options for the dredged shell and three different options of planting thickness, the area that can be planted will vary (Table 12).
Table 12: The number of acres able to be planted with dredged shell from Man-O-War shoals given the three different allocation options and thickness of planted shell. Planting thickness will be six inches on sanctuaries and between one to three inches on open harvest areas depending on the bottom habitat of the open harvest area to be planted.
Option Planted
Area Thickness
Year Two Year Five Total After Year Five 2 million
bushels of dredged
shell
3 million bushels of dredged
shell
5 million bushels of dredged
shell
30 million bushels of
dredged shell Option 1 (90%
Sanctuary : 10% Managed Public
Harvest or Aquaculture)
Sanctuary 6 inch 134 201 335 2,009 Managed Public Harvest or Aquaculture
1 inch 89 134 223 1,340
3 inch 30 45 74 447 Option 2 (50%
Sanctuary : 50% Managed Public
Harvest or Aquaculture )
Sanctuary 6 inch 74 112 186 1,116 Managed Public Harvest or Aquaculture
1 inch 447 670 1,116 6,698
3 inch 149 223 372 2,233 Option 3 (25%
Sanctuary : 75% Managed Public
Harvest or Aquaculture )
Sanctuary 6 inch 37 93 130 558 Managed Public Harvest or Aquaculture
1 inch 670 1,005 1,675 10,047
3 inch 223 335 558 3,349 The amount of acres that can be planted on sanctuaries could range from 130 acres (planting 104,867 cubic yards) under the 25% shell allocation option to 335 acres (planting 270,233 cubic yards) under the 90% shell allocation option (Table 12). The 90% shell allocation option would allow MDNR to make substantial progress toward restoration of one of the five tributaries under the 2014 Chesapeake Bay Agreement. The full 30 million bushels of shell that might ultimately be obtained from Man-O-War shoal could refurbish about 2,009 acres (planting 1,620,593 cubic yards) of oyster bar under the 90% shell allocation option. This amount of shell should allow MDNR to meet, and likely exceed, the goal of restoring oysters to five tributaries by 2025. The amount of acres that can be planted on managed public harvest or aquaculture areas varies with planting thickness and the shell allocation option. Under the 10% shell
48
allocation option, 74 to 223 acres could be planted using between one to three inch planted shell thicknesses (planting 9,948 to 89,943 cubic yards) (Table 12). If the 75% shell allocation option was selected, 558 to 1,675 acres could be planted at one to three inches of shell per acre (planting 75,020 to 675,583 cubic yards). The full 30 million bushels of shell that might ultimately be obtained from Man-O-War shoal could refurbish 10,047 acres (planting 4,052,290 cubic yards) of managed public harvest or aquaculture areas.
5.3 Potential Fate of Placed Shell
Shell planted in Maryland’s past repletion program that received no significant spat set usually became silted over within about five years (Smith et al 2005). Such covered shell is now available for reclamation according to the permit discussed in Section 3.0. Initial efforts to reclaim previously planted shell were not cost-effective; therefore, past planting procedures will be avoided to the extent possible; nevertheless, shell from past repletion programs that has been covered with silt can be reclaimed, which makes it a reusable resource until it degrades and breaks down. The oyster shell half-life typically ranges from 3 to 6 years in mid-Atlantic estuaries (Powell et al. 2006). Dredged shell should be planted with regards to the timing of natural recruitment. Oyster recruitment is highest in the spring; however, spawning can occur from May to October. Shell planting should occur right before spawning occurs to maximize the potential from settlement of oyster larvae on the shells. If oyster shell is planted after recruitment, the shell can potentially be colonized by other benthic taxa. To maximize the benefit of shell planting, planting should occur in high recruitment years, however, it is hard to predict this therefore additional oyster hatchery spat-on-shell planting on top of the shell planting should be considered in some areas to increase the effectiveness restoring oyster bars (O'Beirn et al. 2000, Rodney and Paynter 2006). Oyster reefs in low-salinity waters should be seeded with shell and hatchery-reared spat-on-shell. Mortality due to disease is low in low-salinity waters, and oysters can grow at rates that outpace sedimentation rates. Growth of planted oysters should result in accretion of shell and oyster bar growth that is likely to compensate for substrate loss due to degradation of old shell and siltation. These bars will probably not become self-sustaining because oyster reproduction is generally poor in low-salinity areas. Therefore, regular seed planting will likely be needed to sustain the bars. While the bars may have to be sustained with repeated seeding, these reefs will contribute to local improvements in water quality as a result of increased water filtration by the oysters and in improved habitat for species for which hard bottom and shell habitat is essential. A joint oyster restoration project with USACE in the Severn River has shown that oysters survive and grow well. As expected, reproduction is low, and these areas must be reseeded periodically to maintain populations at the desired level. Reproduction is generally good in higher salinity waters, although disease-induced mortality is greater here. Oyster reefs in higher salinity waters will be constructed where they could serve as sources of larvae for surrounding oyster bars and could contribute to selection for disease resistance in local oyster stocks. Ultimately such reefs could result in sustained growth of
49
the oyster population. Sustained population growth would result in shell accretion that could sustain the bars enhanced or created with shell obtained from Man-O-War Shoal. Larval transport modeling by Dr. Elizabeth North is being used in the Harris Creek oyster restoration project to better understand how restored reef location affects larval supply surrounding areas. Similar exercises in other areas will help ensure the most productive use of the shell. Maryland’s oyster aquaculture industry is expanding as a result of Maryland’s 2010 Oyster Restoration and Aquaculture Development Plan. Expanding oyster aquaculture will remove pressure from the wild oyster fishery, allowing this resource to recover. Because the transition from the wild fishery to aquaculture can be expensive, the state makes low-interest loans available through Maryland Agricultural and Resource-Based Industry Development Corporation (MARBIDCO) to those interested in aquaculture. This strategy appears to be working as 114 Tidal Fisheries License (TFL) holders were listed as applicants on the 200 lease applications that have been received from September, 2010 to December 2013 (DNR 2013). Furthermore, of the 91 projects funded by MARBIDCO, 48 of them involved TFL holders. The shell that may be used to support the expansion of oyster aquaculture in Maryland would be placed to serve as substrate for planting hatchery-produced seed. Shell would be provided for start-up operations. Once an operation is established, aquaculturists will be expected to maintain their own shell base through such measures as deployment of shucked shell or private purchase of shell. However, provision of shell by the state is likely to be required during initial years of aquaculture establishment and enhancement. The dredged shell to be planted in open harvest areas would be used to continue repletion activities that are funded by oyster fees paid by watermen. A groundtruthing survey of the bottom will occur before the shell is planted to determine the bottom type of the area, quantify the amount of hard bottom in the area, and quantify the depth of soft bottom types (mud, clay, sand, etc.). The groundtruthing survey will also assist in determining the amount of shell needed to be planted to stabilize the hard bottom making it suitable for oyster recruitment. The shell to be planted on open harvest areas will be planted in historically high spatfall and harvest areas. Spatial spatfall intensity is documented during the Annual Fall Oyster Survey (Figure 15). If recruitment occurs in these areas where the shell planted, then the shell with the attached spat from natural recruitment could be relocated to open-harvest bars in low-salinity areas where mortality is low. Those bars would be subject to harvest when the seed oysters reach market size, and some dredged shell would be lost when the oysters are harvested. MDNR would sample the original seed locations and potential open-harvest bars for disease prevalence before relocating any seed. Disease testing would be done during MDNR’s regular fall oyster survey and supplemented by sampling at bars identified as candidate sites for seed removal and planting. Seed would be moved from one location to another only if the disease prevalence in the seed source location is lower than the disease prevalence in the open harvest destination. This approach will minimize the expansion of oyster diseases within Maryland waters. Additionally, some of the dredged shell designated for the industry will be sent to the hatchery, set with spat, and then placed on harvest bars.
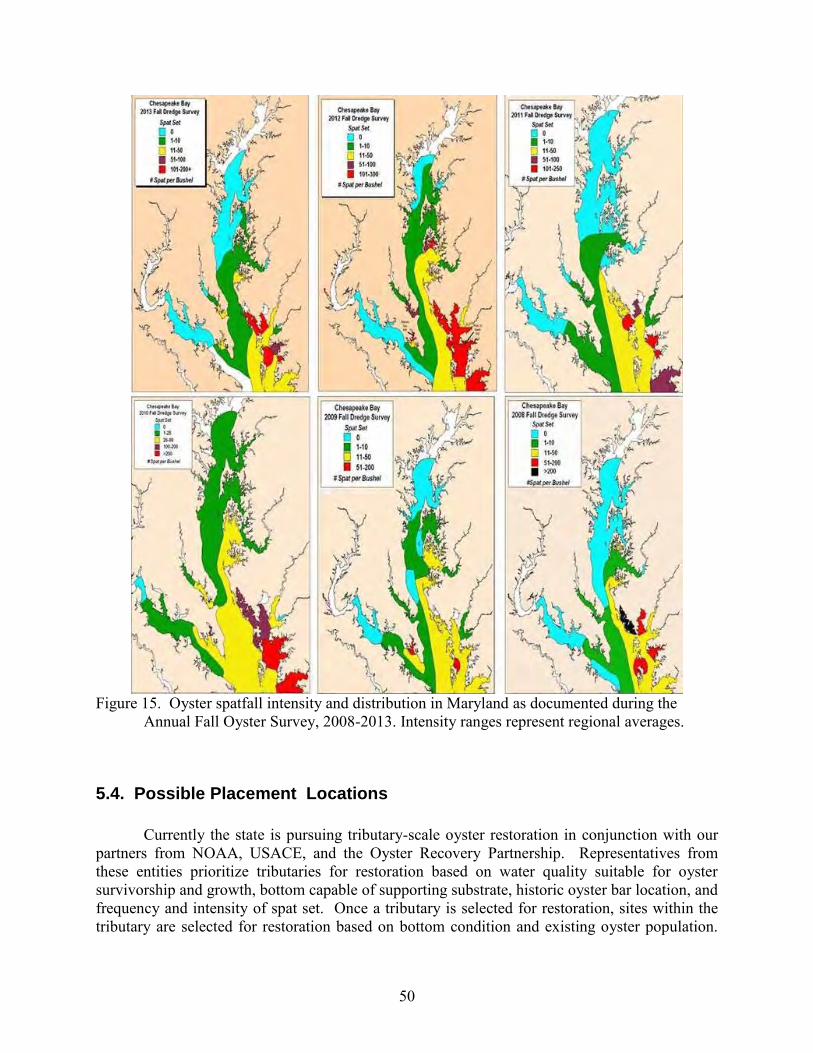
50
Figure 15. Oyster spatfall intensity and distribution in Maryland as documented during the
Annual Fall Oyster Survey, 2008-2013. Intensity ranges represent regional averages.
5.4. Possible Placement Locations
Currently the state is pursuing tributary-scale oyster restoration in conjunction with our partners from NOAA, USACE, and the Oyster Recovery Partnership. Representatives from these entities prioritize tributaries for restoration based on water quality suitable for oyster survivorship and growth, bottom capable of supporting substrate, historic oyster bar location, and frequency and intensity of spat set. Once a tributary is selected for restoration, sites within the tributary are selected for restoration based on bottom condition and existing oyster population.
51
According to the 2014 Chesapeake Bay Agreement, Maryland will restore oysters to five tributaries by 2025. The first tributary selected for large-scale restoration was Harris Creek; reef construction is scheduled for completion in 2015. The second and third tributaries selected for restoration are the Little Choptank and Tred Avon Rivers. The restoration partners are in the process of selecting the fourth and fifth tributaries. Dredged shell will be placed on oyster bars in the fourth and fifth tributaries to be selected for oyster restoration. Dredging of shell would not commence until usage and specific sites are identified, although some shell may be stockpiled for short times for later use. Shell designated for industry will be placed on natural and historic oyster bars open for harvest in consultation with county seed committees. Shell designated for aquaculture will be placed on areas currently leased from the state.
5.5. Ecological Consequences of Shell Placement
Discharge of shell from the shell barge at any placement location will create few water quality problems, because shell will have been washed on deck as it was being dredged. The placement of dredged shell in nearly all cases will be in areas where a similar kind of substrate has been lost or degraded. Thus, shell placements will result only in habitat improvements, without adverse effects. Shell planting could result in habitat changes, but only at aquaculture sites or in locations where existing footprints of bars are expanded. In those instances, planting of shell would convert some existing soft-bottom habitat to hard-bottom habitat, with accompanying changes in the biological communities that would occupy such sites. In such cases, the area of hard-bottom habitat that is currently relatively limited would increase to the benefit of a wide range of species, from diving ducks to fish. The areas affected in this way are anticipated to be virtually insignificant when compared to the total acreage of soft bottom habitat in the Bay. Thus, this ecological change would not be considered a negative effect.
6.0 Economic Considerations
MDNR has estimated the cost of shell dredging at $65/cubic yard, or approximately $4/bushel.1 The total cost for removing 30% of the shell from Man-O-War shoal would be on the order of $120 million. During Year 2 of the period of the requested permit, approximately 2 million bushels would be dredged at a cost of about $8 million, which is roughly MDNR’s annual budget for shell dredging. Thus, funds are likely to be available for dredging the 5 million bushels of shell requested in this permit application over the five-year term of the permit. The cost of reclaiming previously planted shell is about the same as the cost of dredging historical shell; unit costs for alternate substrates were presented in Section 3.0. Grabowski et al. (2012) estimate the economic value of services provided by oyster reefs, excluding harvesting, is
1 One bushel = 0.06 cubic yards; one cubic yard = 16.7 bushels
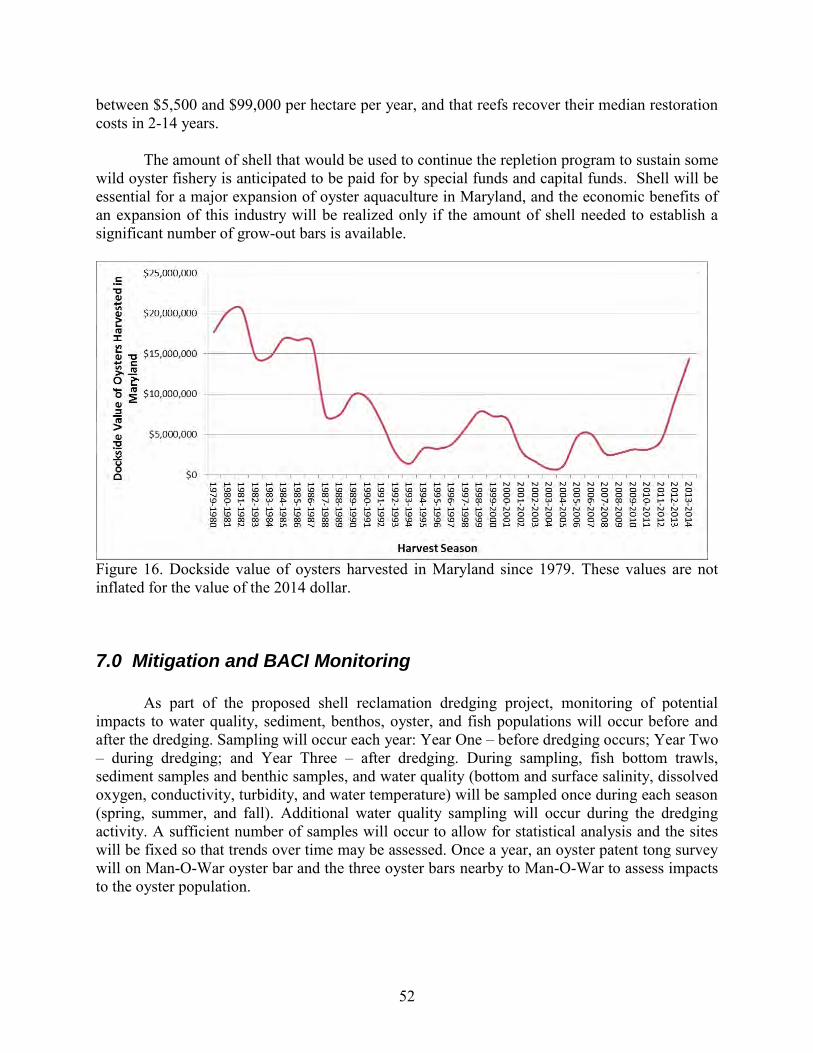
52
between $5,500 and $99,000 per hectare per year, and that reefs recover their median restoration costs in 2-14 years.
The amount of shell that would be used to continue the repletion program to sustain some wild oyster fishery is anticipated to be paid for by special funds and capital funds. Shell will be essential for a major expansion of oyster aquaculture in Maryland, and the economic benefits of an expansion of this industry will be realized only if the amount of shell needed to establish a significant number of grow-out bars is available.
Figure 16. Dockside value of oysters harvested in Maryland since 1979. These values are not inflated for the value of the 2014 dollar.
7.0 Mitigation and BACI Monitoring
As part of the proposed shell reclamation dredging project, monitoring of potential impacts to water quality, sediment, benthos, oyster, and fish populations will occur before and after the dredging. Sampling will occur each year: Year One – before dredging occurs; Year Two – during dredging; and Year Three – after dredging. During sampling, fish bottom trawls, sediment samples and benthic samples, and water quality (bottom and surface salinity, dissolved oxygen, conductivity, turbidity, and water temperature) will be sampled once during each season (spring, summer, and fall). Additional water quality sampling will occur during the dredging activity. A sufficient number of samples will occur to allow for statistical analysis and the sites will be fixed so that trends over time may be assessed. Once a year, an oyster patent tong survey will on Man-O-War oyster bar and the three oyster bars nearby to Man-O-War to assess impacts to the oyster population.
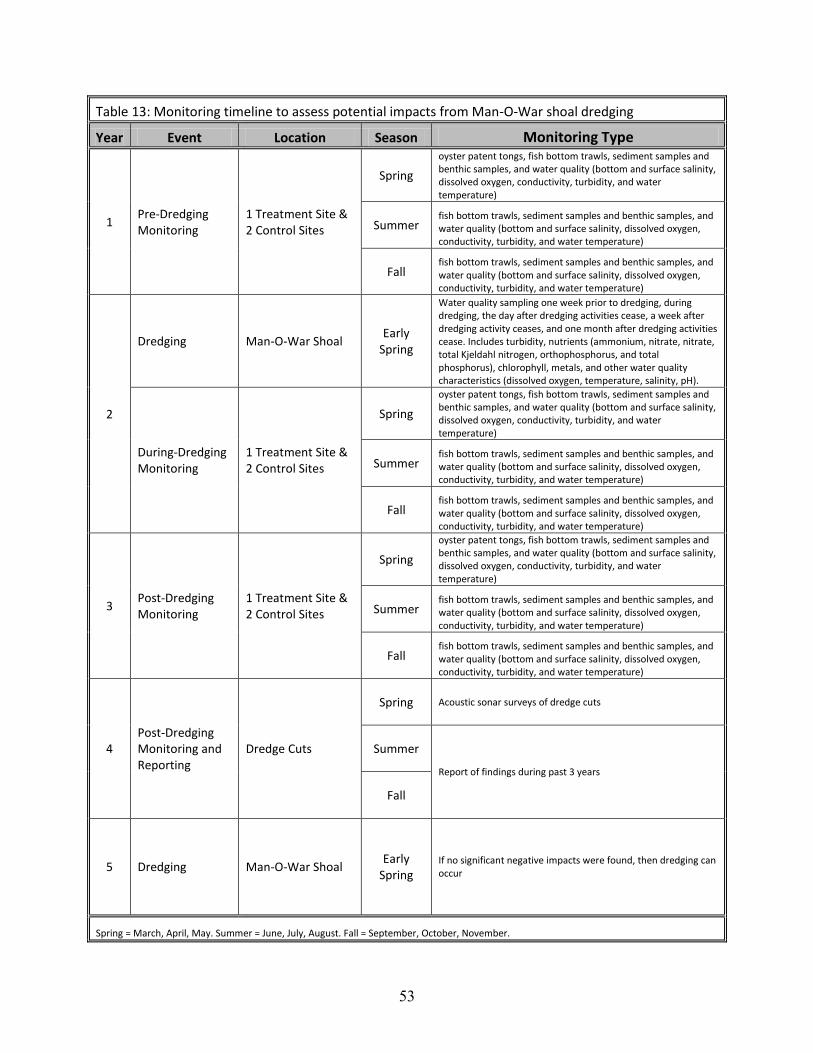
53
Table 13: Monitoring timeline to assess potential impacts from Man-O-War shoal dredging
Year Event Location Season Monitoring Type
1 Pre-Dredging Monitoring
1 Treatment Site & 2 Control Sites
Spring
oyster patent tongs, fish bottom trawls, sediment samples and benthic samples, and water quality (bottom and surface salinity, dissolved oxygen, conductivity, turbidity, and water temperature)
Summer fish bottom trawls, sediment samples and benthic samples, and water quality (bottom and surface salinity, dissolved oxygen, conductivity, turbidity, and water temperature)
Fall fish bottom trawls, sediment samples and benthic samples, and water quality (bottom and surface salinity, dissolved oxygen, conductivity, turbidity, and water temperature)
2
Dredging Man-O-War Shoal Early
Spring
Water quality sampling one week prior to dredging, during dredging, the day after dredging activities cease, a week after dredging activity ceases, and one month after dredging activities cease. Includes turbidity, nutrients (ammonium, nitrate, nitrate, total Kjeldahl nitrogen, orthophosphorus, and total phosphorus), chlorophyll, metals, and other water quality characteristics (dissolved oxygen, temperature, salinity, pH).
During-Dredging Monitoring
1 Treatment Site & 2 Control Sites
Spring
oyster patent tongs, fish bottom trawls, sediment samples and benthic samples, and water quality (bottom and surface salinity, dissolved oxygen, conductivity, turbidity, and water temperature)
Summer fish bottom trawls, sediment samples and benthic samples, and water quality (bottom and surface salinity, dissolved oxygen, conductivity, turbidity, and water temperature)
Fall fish bottom trawls, sediment samples and benthic samples, and water quality (bottom and surface salinity, dissolved oxygen, conductivity, turbidity, and water temperature)
3 Post-Dredging Monitoring
1 Treatment Site & 2 Control Sites
Spring
oyster patent tongs, fish bottom trawls, sediment samples and benthic samples, and water quality (bottom and surface salinity, dissolved oxygen, conductivity, turbidity, and water temperature)
Summer fish bottom trawls, sediment samples and benthic samples, and water quality (bottom and surface salinity, dissolved oxygen, conductivity, turbidity, and water temperature)
Fall fish bottom trawls, sediment samples and benthic samples, and water quality (bottom and surface salinity, dissolved oxygen, conductivity, turbidity, and water temperature)
4 Post-Dredging Monitoring and Reporting
Dredge Cuts
Spring Acoustic sonar surveys of dredge cuts
Summer
Report of findings during past 3 years
Fall
5 Dredging Man-O-War Shoal Early
Spring If no significant negative impacts were found, then dredging can occur
Spring = March, April, May. Summer = June, July, August. Fall = September, October, November.
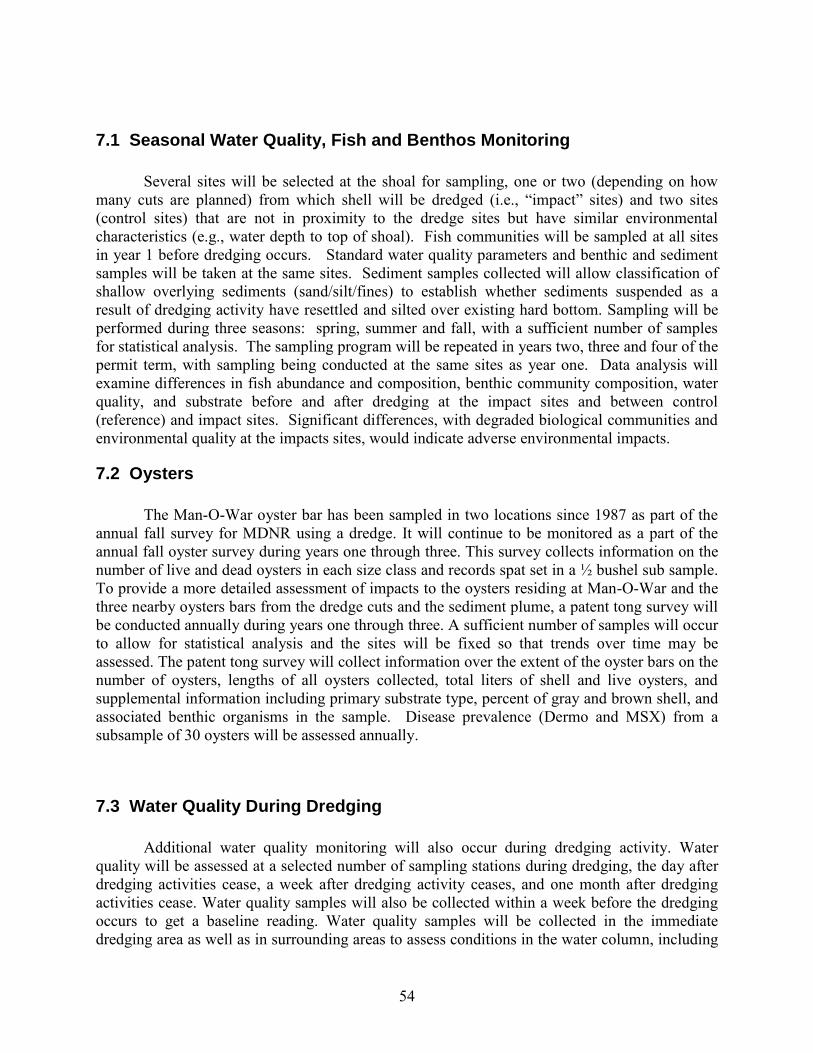
54
7.1 Seasonal Water Quality, Fish and Benthos Monitoring
Several sites will be selected at the shoal for sampling, one or two (depending on how many cuts are planned) from which shell will be dredged (i.e., “impact” sites) and two sites (control sites) that are not in proximity to the dredge sites but have similar environmental characteristics (e.g., water depth to top of shoal). Fish communities will be sampled at all sites in year 1 before dredging occurs. Standard water quality parameters and benthic and sediment samples will be taken at the same sites. Sediment samples collected will allow classification of shallow overlying sediments (sand/silt/fines) to establish whether sediments suspended as a result of dredging activity have resettled and silted over existing hard bottom. Sampling will be performed during three seasons: spring, summer and fall, with a sufficient number of samples for statistical analysis. The sampling program will be repeated in years two, three and four of the permit term, with sampling being conducted at the same sites as year one. Data analysis will examine differences in fish abundance and composition, benthic community composition, water quality, and substrate before and after dredging at the impact sites and between control (reference) and impact sites. Significant differences, with degraded biological communities and environmental quality at the impacts sites, would indicate adverse environmental impacts.
7.2 Oysters
The Man-O-War oyster bar has been sampled in two locations since 1987 as part of the annual fall survey for MDNR using a dredge. It will continue to be monitored as a part of the annual fall oyster survey during years one through three. This survey collects information on the number of live and dead oysters in each size class and records spat set in a ½ bushel sub sample. To provide a more detailed assessment of impacts to the oysters residing at Man-O-War and the three nearby oysters bars from the dredge cuts and the sediment plume, a patent tong survey will be conducted annually during years one through three. A sufficient number of samples will occur to allow for statistical analysis and the sites will be fixed so that trends over time may be assessed. The patent tong survey will collect information over the extent of the oyster bars on the number of oysters, lengths of all oysters collected, total liters of shell and live oysters, and supplemental information including primary substrate type, percent of gray and brown shell, and associated benthic organisms in the sample. Disease prevalence (Dermo and MSX) from a subsample of 30 oysters will be assessed annually.
7.3 Water Quality During Dredging
Additional water quality monitoring will also occur during dredging activity. Water
quality will be assessed at a selected number of sampling stations during dredging, the day after dredging activities cease, a week after dredging activity ceases, and one month after dredging activities cease. Water quality samples will also be collected within a week before the dredging occurs to get a baseline reading. Water quality samples will be collected in the immediate dredging area as well as in surrounding areas to assess conditions in the water column, including

55
turbidity, nutrients (ammonium, nitrate, nitrate, total Kjeldahl nitrogen, orthophosphorus, and total phosphorus), chlorophyll, metals, and other water quality characteristics (dissolved oxygen, temperature, salinity, pH). Water quality samples will be collected at sites up and down the tidal current axis from the point of dredging at intervals of 50 m and 500 m from the dredging operation. Samples will be collected at 0.5 m below the surface, above the bottom, and above the pycnocline (or mid-depth if no pycnocline is present). If water is deeper than 10 meters, additional samples would be collected 1.5 m above the bottom and below the surface. If the dredging method used results in an overboard discharge of wash water, three to five samples of wash water will be collected (with recorded dredging volume) at equal intervals during the dredging process. The data from the fixed water quality sampling will be used for water quality mapping of near surface water quality conditions in and around the dredging site during and after dredging operations. This will provide additional information about some water quality conditions and a measure of spatial variability of turbidity and chlorophyll levels up- and down current of dredging operations.
7.4 Structural Integrity of Dredge Cuts
In Year 4 of the term of the permit, acoustic sonar surveys of the dredged cuts will be performed to assess whether the structure of the cuts has been retained and whether any sedimentation of the cut floors has occurred over that relatively short term.
7.5 Monitoring Report
A report summarizing the results of all monitoring conducted as part of the project will be prepared after sampling in Year Three of the permit term, as well as annual reports providing a short summary of findings each year sampling occurs. The findings of the study will serve as the basis for proceeding or not proceeding with the final dredging in year five of the permit term as currently planned. The findings will also provide the basis for a decision to apply for subsequent permits for proceeding with the additional shell removal planned for Man-O-War shoal.
8.0 Stakeholder Coordination
Public input on placement of dredged shell will be obtained prior to placement. MDNR and its restoration partners have already engaged in public outreach for restoration work in the Little Choptank and Tred Avon Rivers. Outreach has included open houses, meetings with stakeholders, public hearings, and letters sent to adjacent landowners. Similar coordination will occur for the next tributaries chosen for large-scale oyster restoration.
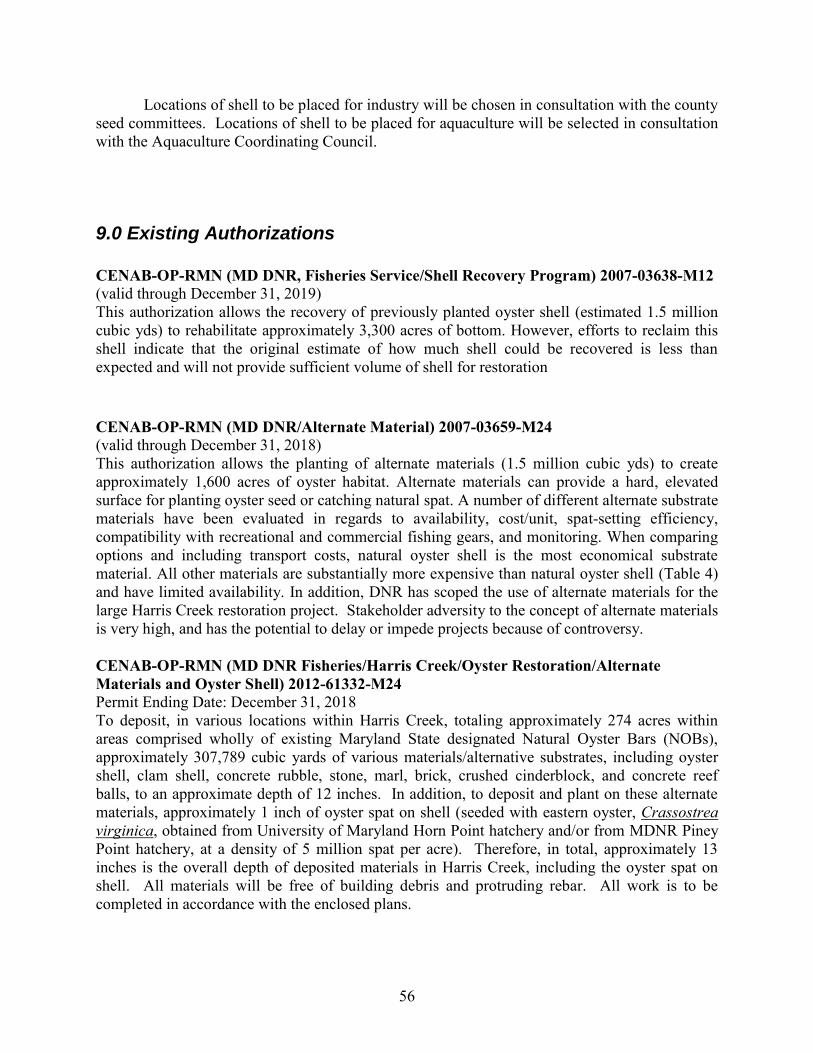
56
Locations of shell to be placed for industry will be chosen in consultation with the county seed committees. Locations of shell to be placed for aquaculture will be selected in consultation with the Aquaculture Coordinating Council.
9.0 Existing Authorizations
CENAB-OP-RMN (MD DNR, Fisheries Service/Shell Recovery Program) 2007-03638-M12 (valid through December 31, 2019) This authorization allows the recovery of previously planted oyster shell (estimated 1.5 million cubic yds) to rehabilitate approximately 3,300 acres of bottom. However, efforts to reclaim this shell indicate that the original estimate of how much shell could be recovered is less than expected and will not provide sufficient volume of shell for restoration
CENAB-OP-RMN (MD DNR/Alternate Material) 2007-03659-M24 (valid through December 31, 2018) This authorization allows the planting of alternate materials (1.5 million cubic yds) to create approximately 1,600 acres of oyster habitat. Alternate materials can provide a hard, elevated surface for planting oyster seed or catching natural spat. A number of different alternate substrate materials have been evaluated in regards to availability, cost/unit, spat-setting efficiency, compatibility with recreational and commercial fishing gears, and monitoring. When comparing options and including transport costs, natural oyster shell is the most economical substrate material. All other materials are substantially more expensive than natural oyster shell (Table 4) and have limited availability. In addition, DNR has scoped the use of alternate materials for the large Harris Creek restoration project. Stakeholder adversity to the concept of alternate materials is very high, and has the potential to delay or impede projects because of controversy. CENAB-OP-RMN (MD DNR Fisheries/Harris Creek/Oyster Restoration/Alternate Materials and Oyster Shell) 2012-61332-M24 Permit Ending Date: December 31, 2018 To deposit, in various locations within Harris Creek, totaling approximately 274 acres within areas comprised wholly of existing Maryland State designated Natural Oyster Bars (NOBs), approximately 307,789 cubic yards of various materials/alternative substrates, including oyster shell, clam shell, concrete rubble, stone, marl, brick, crushed cinderblock, and concrete reef balls, to an approximate depth of 12 inches. In addition, to deposit and plant on these alternate materials, approximately 1 inch of oyster spat on shell (seeded with eastern oyster, Crassostrea virginica, obtained from University of Maryland Horn Point hatchery and/or from MDNR Piney Point hatchery, at a density of 5 million spat per acre). Therefore, in total, approximately 13 inches is the overall depth of deposited materials in Harris Creek, including the oyster spat on shell. All materials will be free of building debris and protruding rebar. All work is to be completed in accordance with the enclosed plans.
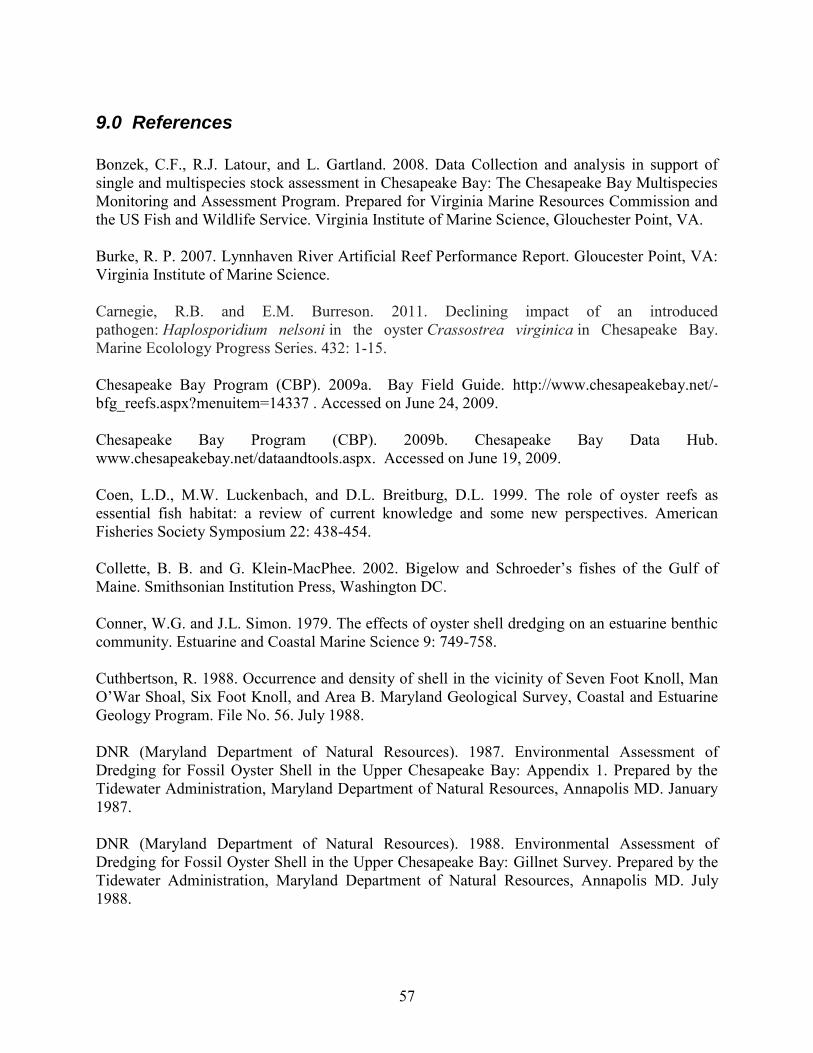
57
9.0 References
Bonzek, C.F., R.J. Latour, and L. Gartland. 2008. Data Collection and analysis in support of single and multispecies stock assessment in Chesapeake Bay: The Chesapeake Bay Multispecies Monitoring and Assessment Program. Prepared for Virginia Marine Resources Commission and the US Fish and Wildlife Service. Virginia Institute of Marine Science, Glouchester Point, VA. Burke, R. P. 2007. Lynnhaven River Artificial Reef Performance Report. Gloucester Point, VA: Virginia Institute of Marine Science. Carnegie, R.B. and E.M. Burreson. 2011. Declining impact of an introduced pathogen: Haplosporidium nelsoni in the oyster Crassostrea virginica in Chesapeake Bay. Marine Ecolology Progress Series. 432: 1-15. Chesapeake Bay Program (CBP). 2009a. Bay Field Guide. http://www.chesapeakebay.net/-bfg_reefs.aspx?menuitem=14337 . Accessed on June 24, 2009. Chesapeake Bay Program (CBP). 2009b. Chesapeake Bay Data Hub. www.chesapeakebay.net/dataandtools.aspx. Accessed on June 19, 2009. Coen, L.D., M.W. Luckenbach, and D.L. Breitburg, D.L. 1999. The role of oyster reefs as essential fish habitat: a review of current knowledge and some new perspectives. American Fisheries Society Symposium 22: 438-454. Collette, B. B. and G. Klein-MacPhee. 2002. Bigelow and Schroeder’s fishes of the Gulf of Maine. Smithsonian Institution Press, Washington DC. Conner, W.G. and J.L. Simon. 1979. The effects of oyster shell dredging on an estuarine benthic community. Estuarine and Coastal Marine Science 9: 749-758. Cuthbertson, R. 1988. Occurrence and density of shell in the vicinity of Seven Foot Knoll, Man O’War Shoal, Six Foot Knoll, and Area B. Maryland Geological Survey, Coastal and Estuarine Geology Program. File No. 56. July 1988. DNR (Maryland Department of Natural Resources). 1987. Environmental Assessment of Dredging for Fossil Oyster Shell in the Upper Chesapeake Bay: Appendix 1. Prepared by the Tidewater Administration, Maryland Department of Natural Resources, Annapolis MD. January 1987. DNR (Maryland Department of Natural Resources). 1988. Environmental Assessment of Dredging for Fossil Oyster Shell in the Upper Chesapeake Bay: Gillnet Survey. Prepared by the Tidewater Administration, Maryland Department of Natural Resources, Annapolis MD. July 1988.
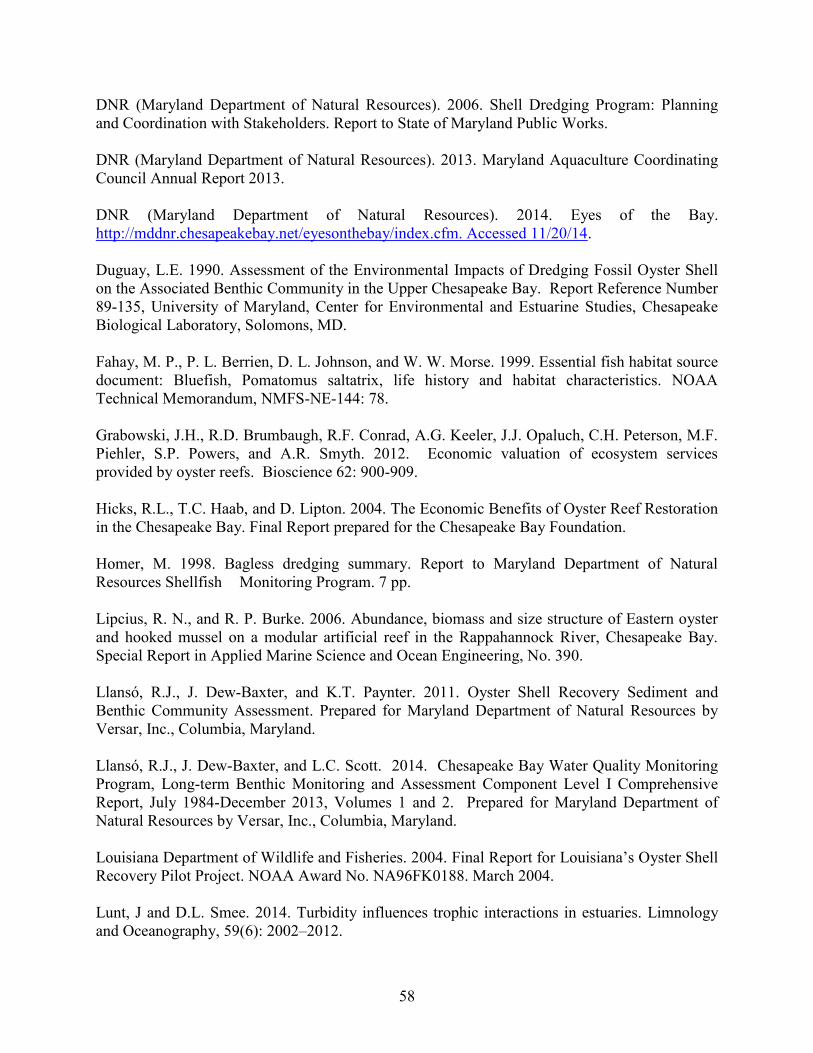
58
DNR (Maryland Department of Natural Resources). 2006. Shell Dredging Program: Planning and Coordination with Stakeholders. Report to State of Maryland Public Works. DNR (Maryland Department of Natural Resources). 2013. Maryland Aquaculture Coordinating Council Annual Report 2013. DNR (Maryland Department of Natural Resources). 2014. Eyes of the Bay. http://mddnr.chesapeakebay.net/eyesonthebay/index.cfm. Accessed 11/20/14. Duguay, L.E. 1990. Assessment of the Environmental Impacts of Dredging Fossil Oyster Shell on the Associated Benthic Community in the Upper Chesapeake Bay. Report Reference Number 89-135, University of Maryland, Center for Environmental and Estuarine Studies, Chesapeake Biological Laboratory, Solomons, MD. Fahay, M. P., P. L. Berrien, D. L. Johnson, and W. W. Morse. 1999. Essential fish habitat source document: Bluefish, Pomatomus saltatrix, life history and habitat characteristics. NOAA Technical Memorandum, NMFS-NE-144: 78. Grabowski, J.H., R.D. Brumbaugh, R.F. Conrad, A.G. Keeler, J.J. Opaluch, C.H. Peterson, M.F. Piehler, S.P. Powers, and A.R. Smyth. 2012. Economic valuation of ecosystem services provided by oyster reefs. Bioscience 62: 900-909. Hicks, R.L., T.C. Haab, and D. Lipton. 2004. The Economic Benefits of Oyster Reef Restoration in the Chesapeake Bay. Final Report prepared for the Chesapeake Bay Foundation. Homer, M. 1998. Bagless dredging summary. Report to Maryland Department of Natural Resources Shellfish Monitoring Program. 7 pp. Lipcius, R. N., and R. P. Burke. 2006. Abundance, biomass and size structure of Eastern oyster and hooked mussel on a modular artificial reef in the Rappahannock River, Chesapeake Bay. Special Report in Applied Marine Science and Ocean Engineering, No. 390. Llansó, R.J., J. Dew-Baxter, and K.T. Paynter. 2011. Oyster Shell Recovery Sediment and Benthic Community Assessment. Prepared for Maryland Department of Natural Resources by Versar, Inc., Columbia, Maryland. Llansó, R.J., J. Dew-Baxter, and L.C. Scott. 2014. Chesapeake Bay Water Quality Monitoring Program, Long-term Benthic Monitoring and Assessment Component Level I Comprehensive Report, July 1984-December 2013, Volumes 1 and 2. Prepared for Maryland Department of Natural Resources by Versar, Inc., Columbia, Maryland. Louisiana Department of Wildlife and Fisheries. 2004. Final Report for Louisiana’s Oyster Shell Recovery Pilot Project. NOAA Award No. NA96FK0188. March 2004. Lunt, J and D.L. Smee. 2014. Turbidity influences trophic interactions in estuaries. Limnology and Oceanography, 59(6): 2002–2012.
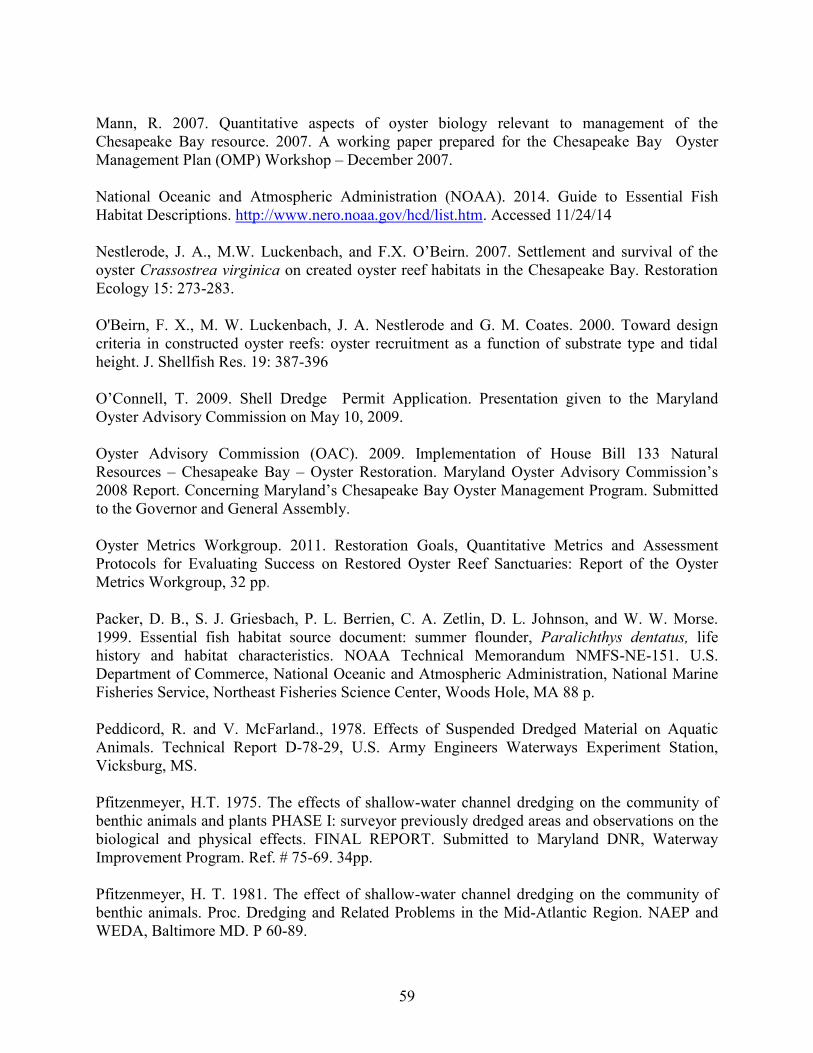
59
Mann, R. 2007. Quantitative aspects of oyster biology relevant to management of the Chesapeake Bay resource. 2007. A working paper prepared for the Chesapeake Bay Oyster Management Plan (OMP) Workshop – December 2007. National Oceanic and Atmospheric Administration (NOAA). 2014. Guide to Essential Fish Habitat Descriptions. http://www.nero.noaa.gov/hcd/list.htm. Accessed 11/24/14 Nestlerode, J. A., M.W. Luckenbach, and F.X. O’Beirn. 2007. Settlement and survival of the oyster Crassostrea virginica on created oyster reef habitats in the Chesapeake Bay. Restoration Ecology 15: 273-283. O'Beirn, F. X., M. W. Luckenbach, J. A. Nestlerode and G. M. Coates. 2000. Toward design criteria in constructed oyster reefs: oyster recruitment as a function of substrate type and tidal height. J. Shellfish Res. 19: 387-396 O’Connell, T. 2009. Shell Dredge Permit Application. Presentation given to the Maryland Oyster Advisory Commission on May 10, 2009. Oyster Advisory Commission (OAC). 2009. Implementation of House Bill 133 Natural Resources – Chesapeake Bay – Oyster Restoration. Maryland Oyster Advisory Commission’s 2008 Report. Concerning Maryland’s Chesapeake Bay Oyster Management Program. Submitted to the Governor and General Assembly. Oyster Metrics Workgroup. 2011. Restoration Goals, Quantitative Metrics and Assessment Protocols for Evaluating Success on Restored Oyster Reef Sanctuaries: Report of the Oyster Metrics Workgroup, 32 pp. Packer, D. B., S. J. Griesbach, P. L. Berrien, C. A. Zetlin, D. L. Johnson, and W. W. Morse. 1999. Essential fish habitat source document: summer flounder, Paralichthys dentatus, life history and habitat characteristics. NOAA Technical Memorandum NMFS-NE-151. U.S. Department of Commerce, National Oceanic and Atmospheric Administration, National Marine Fisheries Service, Northeast Fisheries Science Center, Woods Hole, MA 88 p. Peddicord, R. and V. McFarland., 1978. Effects of Suspended Dredged Material on Aquatic Animals. Technical Report D-78-29, U.S. Army Engineers Waterways Experiment Station, Vicksburg, MS. Pfitzenmeyer, H.T. 1975. The effects of shallow-water channel dredging on the community of benthic animals and plants PHASE I: surveyor previously dredged areas and observations on the biological and physical effects. FINAL REPORT. Submitted to Maryland DNR, Waterway Improvement Program. Ref. # 75-69. 34pp. Pfitzenmeyer, H. T. 1981. The effect of shallow-water channel dredging on the community of benthic animals. Proc. Dredging and Related Problems in the Mid-Atlantic Region. NAEP and WEDA, Baltimore MD. P 60-89.
60
Powell, E.N., J.N. Kraeuter, and K.A. Ashton-Alcox. 2006. How long does oyster shell last on an oyster reef? Estuarine Coastal and Shelf Science 69: 531-542. Rodney, W.S. and Paynter, K. 2006. Comparisons of macrofaunal assemblages on restored and non-restored oyster reefs in mesohaline regions of Chesapeake Bay in Maryland. Journal of Experimental Marine Biology and Ecology 335 (2006) 39–51 Schulte D.M., Burke R.P., and Lipcius R.N. 2009 Unprecedented restoration of a native oyster metapopulation. Department of Fisheries Science, Virginia Institute of Marine Science, The College of William and Mary, Gloucester Point, VA 23062 Smith, G. 1997. Maryland’s Historic Oyster Bottom. A Geographical Representation of the Traditional Named Oyster Bars. Maryland Department of Natural Resources, Sarbanes Cooperative Oxford Laboratory, Oxford, MD. Smith, G.F., D.G. Bruce, E.B. Roach, A. Hansen, R.I.E. Newell, and A.M. McManus. 2005. Assessment of recent habitat conditions on eastern oyster Crassostrea virginica bars in mesohaline Chesapeake Bay. North American Journal of Fisheries Management 25:1569-1590. Tamburri, M. N., M. W. Luckenbach, et al. 2008. Settlement of Crassostrea ariakensis Larvae: Effects of Substrate, Biofilms, Sediment and Adult Chemical Cues. Journal of Shellfish Research 27(3): 601-608. Tarnowski, M., E. Campbell, and R. Bussell. 2000. Dissolved Oxygen Concentrations in Upper Chesapeake Bay Dredge Cuts. Maryland Department of Natural Resources, Annapolis MD. Tarnowski, M. 2014. Maryland Oyster Population Status Report: 2013 Fall Survey. Maryland Department of Natural Resources report. Annapolis, MD: Maryland Department of Natural Resources. US Army Corp of Engineers (USACE), Maryland Department of Natural Resources (MDDNR), and Virginia Marine Resources Commission (VMRC). 2009. Final Programmatic Environmental Impact Statement for Oyster Restoration in Chesapeake Bay Including the Use of a Native and/or Nonnative Oyster. Prepared by Versar Inc.. US Army Corp of Engineers (USACE). 2012. Chesapeake Bay oyster recovery: Native oyster restoration master plan. Maryland and Virginia, U.S. Army Corps of Engineers Baltimore and Norfolk Districts. US Army Corp of Engineers (USACE). 2013. Habitat suitability index and performance of USACE sanctuary reefs in the Great Wicomico River. Found at: http://www.nao.usace.army.mil/Portals/31/docs/GreatWicomico-Summary.pdf U.S. Geological Survey (USGS). 2013. Estimated Streamflow Entering Chesapeake Bay. http://md.water.usgs.gov/waterdata/chesinflow/. Accessed 11/24/14
61
VIMS Multispecies Research Group. 2014, December, 15. Fishery Analyst Online Catch Data Maps.
http://www.vims.edu/fisheries/mrg/gis
Wilberg, M.J., M.E. Livings, J.S. Barkman, B.T. Morris, and J.M. Robinson. 2011. Overfishing, disease, habitat loss, and potential extirpation of oysters in upper Chesapeake Bay. Marine Ecology Progress Series 436: 131-141. Wikel, G., Panageotou, W., and J. Halka. 1999. Turbidity plumes formed during fossil oyster shell dredging in the northern Chesapeake Bay: August 1998. Coastal and Estuarine Geology File Report No. 99-1. Wikel, G., Panageotou, W., and J. Halka. 2000. Turbidity plumes formed during fossil oyster shell dredging in the northern Chesapeake Bay: July – September 1999. Coastal and Estuarine Geology File Report No. 00-1. Yates, C.C. 1911. Survey of the Oyster bars [by country of the State of Maryland]. Dept. of Commerce and Labor-Coast and Geodetic Survey. Washington, DC: U.S. Government Printing Office.

62
Appendix A