Embed Size (px)
Citation preview
energies
Article
100% Renewable Energy Supply for Brazil—The Roleof Sector Coupling and Regional Development
Hans Christian Gils 1,* ID , Sonja Simon 1 ID and Rafael Soria 2,3 ID
1 DLR—German Aerospace Center, Institute of Engineering Thermodynamics, Pfaffenwaldring 38-40,70569 Stuttgart, Germany; [email protected]
2 Energy Planning Program, Graduate School of Engineering, Universidade Federal do Rio de Janeiro,Centro de Tecnologia, Bloco C, Sala 211, Cidade Universitária, Ilha do Fundão,21941-972 Rio de Janeiro, RJ, Brazil; [email protected]
3 Departamento de Ingeniería Mecánica, Escuela Politécnica Nacional, Ladrón de Guevara E11-253,17-01-2759 Quito, Ecuador
* Correspondence: [email protected]; Tel.: +49-711-6862-477
Received: 29 September 2017; Accepted: 8 November 2017; Published: 13 November 2017
Abstract: With its abundance of renewable energy potentials, not only for hydropower and bioenergy,but also for wind and solar, Brazil provides good prospects for a carbon neutral energy system.The role of an enhanced coupling of the power, heat and transport sectors in such systems is not yetfully understood. This paper analyses the least-cost composition and operation of a fully renewablepower supply system as part of a carbon neutral energy supply in Brazil. It relies on the applicationof the high-resolution energy system model REMix. Our analysis reveals that the expansion of windand solar power is more cost-efficient than the construction of additional hydroelectric plants. This isfavoured because the existing hydroelectric plants offer large capacity of dispatchable power tocompensate for fluctuations, and thus no additional storage is necessary. Furthermore, the REMixanalysis indicates that varying shares of solar and wind power technologies as well as the spatialdistribution of power generation have only a small influence on supply costs. This implies thatthe transformation strategy in Brazil can be primarily based on other criteria such as regionaldevelopment, public acceptance, environmental impact or industrial policy without major impactson system costs.
Keywords: energy scenario; renewable energy; Brazil; REMix; demand response; sector coupling;energy system modelling; power system
1. Introduction
Renewable energy (RE) sources are a proven option to reduce greenhouse gas (GHG) emissions.However, it is still a major challenge to integrate large shares of variable renewable energy (VRE) intothe power system. This is specifically the case for strongly developing countries, which additionallyhave to cope with a strong increase in energy and power demand in the future. Brazil is a typicalnewly industrialized country, featuring a large population and considerable economic growth. Today,Brazil already covers 60% of its power demand by hydro and another 10% by biomass and windpower (Figure 1) [1,2]. However, its primary energy supply is dominated by fossil fuels, mainly oil(36%) and gas (14%). Biomass is another main pillar, covering a broad range from traditional biomassuse in the residential sector to modern biofuel applications for power generation and transport fuels.However, the future increase in energy demand is expected to be covered also by an expansion offossil fuel installations and the dependency on hydropower leads to a high vulnerability with regardto droughts [3,4], which have recently heavily disturbed the Brazilian power supply [5].
Energies 2017, 10, 1859; doi:10.3390/en10111859 www.mdpi.com/journal/energies

Energies 2017, 10, 1859 2 of 22Energies 2017, 10, 1859 2 of 23
Figure 1. Shares of renewable and fossil energy in primary energy and power production in Brazil in
2014 based on statistics from [1,2].
Nevertheless, the abundance of RE potentials, not only for hydropower and energy production
from biomass, but also for wind and solar energy provides good prospects for a completely
renewable supply of power, heat, and transport fuels. Biofuels and the large scale use of sugar cane
residues, including second generation technologies have long been one major focus of technology
development [6–9]. Agricultural and agro-industrial residues also have a large energetic potential in
Brazil [10]. Wind power and solar power not only have large potentials in Brazil [11,12], but are also
considered to be cost efficient [13]. Resource assessments in high spatial resolution have been
provided for solar global horizontal irradiation [14,15], direct normal irradiation [16] and wind speed
[17], revealing that particularly good potentials are located in the western and northwestern part of
the country. With reservoir hydro stations as a source of flexibility, the power system is expected to
easily balance substantial shares of VRE generation without increasing demand for fossil backup
power plants [5,18–20]. Nevertheless, Saporta [21] mentioned that the flexibility provided by
hydropower plants with reservoirs in Brazil can be constrained by the multiple uses of water for
environmental, social and economic purposes. Additional benefits are expected for the stability of
the power system through a diversification with wind and solar [5,15,20]. Several studies have
investigated the future role of RE across the whole energy system and identified considerable
potential for their implementation [22–26]. Nevertheless, according to [27], high wind penetration
(65%) in the Northeast power system of Brazil might not happen without curtailment, mainly due to
inflexibility constraints in Brazilian power plants and also to transmission limits. While reference [15]
explore a 100% renewable power sector, the scenarios for the whole energy system eventually require
a backup from fossil resources especially for heat and transport. Their scenario is dominated by solar
photovoltaic (PV), and also evaluates the potential role of a production of synthetic methane for
industrial purpose from renewable electricity. Different alternatives to a hydropower expansion have
been assessed by [28]. Their scenarios particularly focus on wind power and natural gas, and are also
limited to the power sector. An integrated energy system model for Brazil has been applied in
[26,29,30]. Their model provides a very detailed representation of sectoral energy demands, but is
limited in its temporal resolution. The role of enhanced sector coupling has also been studied to some
degree in [25,31].
A transformation beyond 80% RE in the overall energy system is specifically challenging: in the
power sector, seasonal storage becomes almost unavoidable at high VRE shares [32]. Furthermore, a
replacement of all fossil fuels for combustion engines must be provided at reasonable costs for
passenger as well as freight transport vehicles [33]. Additionally, options to replace high temperature
industrial process heat are essential [34]. Previous works have shown that an increased sector
coupling is a prerequisite to efficiently address these challenges and that renewable power can play
Figure 1. Shares of renewable and fossil energy in primary energy and power production in Brazil in2014 based on statistics from [1,2].
Nevertheless, the abundance of RE potentials, not only for hydropower and energy productionfrom biomass, but also for wind and solar energy provides good prospects for a completelyrenewable supply of power, heat, and transport fuels. Biofuels and the large scale use of sugarcane residues, including second generation technologies have long been one major focus of technologydevelopment [6–9]. Agricultural and agro-industrial residues also have a large energetic potentialin Brazil [10]. Wind power and solar power not only have large potentials in Brazil [11,12], but arealso considered to be cost efficient [13]. Resource assessments in high spatial resolution have beenprovided for solar global horizontal irradiation [14,15], direct normal irradiation [16] and windspeed [17], revealing that particularly good potentials are located in the western and northwesternpart of the country. With reservoir hydro stations as a source of flexibility, the power system isexpected to easily balance substantial shares of VRE generation without increasing demand for fossilbackup power plants [5,18–20]. Nevertheless, Saporta [21] mentioned that the flexibility providedby hydropower plants with reservoirs in Brazil can be constrained by the multiple uses of water forenvironmental, social and economic purposes. Additional benefits are expected for the stability of thepower system through a diversification with wind and solar [5,15,20]. Several studies have investigatedthe future role of RE across the whole energy system and identified considerable potential for theirimplementation [22–26]. Nevertheless, according to [27], high wind penetration (65%) in the Northeastpower system of Brazil might not happen without curtailment, mainly due to inflexibility constraints inBrazilian power plants and also to transmission limits. While reference [15] explore a 100% renewablepower sector, the scenarios for the whole energy system eventually require a backup from fossilresources especially for heat and transport. Their scenario is dominated by solar photovoltaic (PV),and also evaluates the potential role of a production of synthetic methane for industrial purpose fromrenewable electricity. Different alternatives to a hydropower expansion have been assessed by [28].Their scenarios particularly focus on wind power and natural gas, and are also limited to the powersector. An integrated energy system model for Brazil has been applied in [26,29,30]. Their modelprovides a very detailed representation of sectoral energy demands, but is limited in its temporalresolution. The role of enhanced sector coupling has also been studied to some degree in [25,31].
A transformation beyond 80% RE in the overall energy system is specifically challenging: in thepower sector, seasonal storage becomes almost unavoidable at high VRE shares [32]. Furthermore,a replacement of all fossil fuels for combustion engines must be provided at reasonable costs forpassenger as well as freight transport vehicles [33]. Additionally, options to replace high temperatureindustrial process heat are essential [34]. Previous works have shown that an increased sector coupling

Energies 2017, 10, 1859 3 of 22
is a prerequisite to efficiently address these challenges and that renewable power can play an increasingrole in both transportation and heating, either directly or via the production of hydrogen or syntheticfuels [35,36]. Despite the high amount of model based scenario studies already available, the role ofregional power exchange, sector coupling, and industrial demand response (DR) in a completely REsystem is not yet fully understood for Brazil. This is particularly important as the consideration ofthe usage of electricity for heating, transportation and fuel production has a high impact on powerdemand and supply.
This paper assesses the effect of sector coupling on the power system in Brazil, both concerning thechallenges arising from an additional power demand for electric mobility and hydrogen production,and the opportunities offered by the flexibility of these loads. Applying the high-resolution energymodel REMix, we identify the least cost composition of different generation, grid, and storagetechnologies and assess the potential contribution of sector coupling and DR to a fully renewablepower supply. We present a case study of four scenarios that provide insight into the impact of REtechnology choice, regional distribution of generation capacities and future drought risks on the supplycosts. The case study relies on a scenario assessment for a 100% renewable supply considering thewhole energy system across the power, heat, and transport sectors.
2. Materials and Methods
2.1. Optimization Model REMix
The case study relies on the application of the REMix energy system model [32]. It combines anassessment of wind and solar power generation potentials in high temporal and spatial resolutionwith an energy system optimization (Figure 2). REMix is focused on a detailed representation of thepower system, but also considers all relevant links to the heat and transport sectors, including electricheating, electric mobility and production of synthetic fuels [37]. The model optimizes the capacityinstallation and hourly operation of all system components in a perfect foresight approach over onetypical year. Its objective function comprises annuities of endogenously added assets and operationalcosts of all assets. In the case study presented here, REMix is applied in a partial greenfield approach.This implies that some power generation and transmission capacities are exogenously defined, forexample considering existing infrastructures, whereas others are endogenously determined by REMix(Section 2.2). A detailed description of REMix appears in [32]. In contrast to previous studies [37,38],we use a simplified model representation of DR, which is described in Appendix A and documentedin Equations (A1)–(A9) and Table A1. For countries with abundance of dispatchable renewablepotentials, such as Brazil, the contribution of DR to load balancing is rather limited. This justifies theapplication of a simplified model, which significantly reduces the model complexity and solutiontime. Furthermore, it requires less input data and is thus more easily transferrable to other countries.The model representation contains the main features of DR, which are load shedding and shifting toan earlier as well as later time. Load shifting is modelled as fictitious energy storage whose storagecosts increase with the period between charging and discharging. In contrast to the more detailedrepresentation, it does not explicitly consider the duration between a load reduction and subsequentincrease. Furthermore, the duration of load interventions is not directly limited. However, both thesedurations can be limited to reasonable values of a few hours by the approach chosen.

Energies 2017, 10, 1859 4 of 22
Energies 2017, 10, 1859 4 of 23
Figure 2. Overview of the REMix model structure.
2.2. Data and Assumptions
The REMix model input includes hourly time series of demand and VRE power generation, RE
technology potentials, existing power generation and transmission capacities, and techno-economic
parameters of all technologies. The model configuration applied in this case study is introduced in
the following paragraph as well as the data used and assumptions made.
In our analysis of least-cost configurations of future power supply systems for Brazil, we
consider a broad range of technologies (Table 1). The optimization focuses on the potential future
role of wind and solar power as well as the need for transmission lines, storage and flexible sector
coupling. It assesses how solar photovoltaic (PV), concentrated solar power (CSP), wind onshore and
wind offshore compete with each other and the expansion of hydropower. Alternating current (AC)
and direct current (DC) transmission are treated separately in the model. Our partial greenfield
approach considers existing hydropower plants and transmission lines, some biomass combined heat
and power (CHP) stations, and small capacities of wave power as well as stationary fuel cells as
exogenous model input (Table 1). Furthermore, we consider flexible electric heating, hydrogen
electrolysis and industrial DR as part of an enhanced sector coupling.
Table 1. Overview of considered technologies.
Use of technology Exogenously Defined Capacities Endogenously Calculated Capacities
Generation
Run-of-river hydro (existent/under
construction)
Reservoir hydro (existent/under
construction)
Biomass CHP
Fuel cell CHP
Wave power
Run-of-river hydro (investment options)
Reservoir hydro (investment options)
Photovoltaic
Wind onshore
Wind offshore
CSP
Hydrogen gas turbine
Hydrogen combined cycle gas turbine
Grid Existing AC and DC lines Additional AC and DC lines
Storage and
demand flexibility
Demand response Battery storage
Flexible electric heating Hydrogen storage
Flexible hydrogen electrolysis Pumps in reservoir hydro stations
To reflect restrictions in power transmission and evaluate the demand for new power lines, we
subdivide Brazil into seven model regions (Figure 3), based on [39,40]. Given their remoteness and
large capacity, the major hydro dams at Belo Monte, Teles Pires and Itaipu are considered as
additional grid nodes without power demand. Furthermore, we include three network junction
Figure 2. Overview of the REMix model structure.
2.2. Data and Assumptions
The REMix model input includes hourly time series of demand and VRE power generation,RE technology potentials, existing power generation and transmission capacities, and techno-economicparameters of all technologies. The model configuration applied in this case study is introduced in thefollowing paragraph as well as the data used and assumptions made.
In our analysis of least-cost configurations of future power supply systems for Brazil, we considera broad range of technologies (Table 1). The optimization focuses on the potential future role ofwind and solar power as well as the need for transmission lines, storage and flexible sector coupling.It assesses how solar photovoltaic (PV), concentrated solar power (CSP), wind onshore and windoffshore compete with each other and the expansion of hydropower. Alternating current (AC) anddirect current (DC) transmission are treated separately in the model. Our partial greenfield approachconsiders existing hydropower plants and transmission lines, some biomass combined heat and power(CHP) stations, and small capacities of wave power as well as stationary fuel cells as exogenous modelinput (Table 1). Furthermore, we consider flexible electric heating, hydrogen electrolysis and industrialDR as part of an enhanced sector coupling.
Table 1. Overview of considered technologies.
Use of Technology Exogenously Defined Capacities Endogenously Calculated Capacities
Generation
Run-of-river hydro(existent/under construction)Reservoir hydro(existent/under construction)Biomass CHPFuel cell CHPWave power
Run-of-river hydro (investment options)Reservoir hydro (investment options)PhotovoltaicWind onshoreWind offshoreCSPHydrogen gas turbineHydrogen combined cycle gas turbine
Grid Existing AC and DC lines Additional AC and DC lines
Storage anddemand flexibility
Demand response Battery storageFlexible electric heating Hydrogen storageFlexible hydrogen electrolysis Pumps in reservoir hydro stations

Energies 2017, 10, 1859 5 of 22
To reflect restrictions in power transmission and evaluate the demand for new power lines,we subdivide Brazil into seven model regions (Figure 3), based on [39,40]. Given their remotenessand large capacity, the major hydro dams at Belo Monte, Teles Pires and Itaipu are considered asadditional grid nodes without power demand. Furthermore, we include three network junction pointswith neither generation nor demand in the model. Existing transmission capacities are consideredaccording to Table A2 and rely on [39].
Energies 2017, 10, 1859 5 of 23
points with neither generation nor demand in the model. Existing transmission capacities are
considered according to Table A2 and rely on [39].
The total electricity demand considered in the case study is based on a comprehensive scenario
of the future development of the Brazilian energy system [41]. This scenario represents a pathway to
a fully RE supply across all sectors by 2050. According to [41], we assume that heat production and
transport will increasingly rely on electricity and synthetic hydrogen, causing almost a doubling in
power demand by 2050. Final energy demand in electricity increases to 325 TWh/year in industry,
and to 412 TWh/year in the residential and service sector. This includes power for direct heating and
heat pumps. For transport 126 TWh/year in electricity are projected in the scenario, with a
comparatively low share of 26% battery electric vehicles (BEV) in passenger cars and 12% in heavy
duty vehicles. Additional power demand arises from the electrolytic production of 8 PJ and 77 PJ of
hydrogen for transport and industry, respectively. Regional power demand values are summarized
in Table A3. They reflect the concentration of population and industry to the Sudeste region [42,43].
In the case study presented here, we consider the energy demand and technology data for 2050, which
is used as target year for a fully renewable supply in [41].
Figure 3. Map showing model regions, net transfer capacities of existing grid connections in GW, and
major hydroelectric plants Belo Monte, Teles Pires and Itaipu. Connections marked with an asterisk
(*) have different transfer capacities depending on the direction of power flows (Table A2).
Hourly load profiles are obtained using metered data of dispatchable power generation. The
national operator of the power system provides hourly values of electricity generation supplied by
centralized power plants [44]. By the time of the modelling phase, the most recent data available were
that of 2013. These data allow capturing the hourly demand behaviour by region. The resulting
hourly load has an annual peak of 100 GW. The new loads—electric vehicle charging, heating and
hydrogen demand—are disaggregated to hourly values according to the methodology presented in
[45]. It considers representative profiles of uncontrolled electric vehicle charging, hydrogen car
fuelling and industrial process heat demand. The inflexible share of the new loads accounts for an
additional hourly demand of at least 15 GW, resulting in a total peak load of about 115 GW, which
occurs in the beginning of December. As most of the new loads are assumed to be flexible in their
operation, the endogenously determined peak load can be up to 55 GW higher.
Today’s existing hydropower plants are expected to be available in the future, just like the
existing facilities already under construction [46,47]. They account for 65 GW and 43 GW of run-of-
river and reservoir hydro capacities, respectively (Tables A4 and A5 in Appendix B). Those hydro
Figure 3. Map showing model regions, net transfer capacities of existing grid connections in GW,and major hydroelectric plants Belo Monte, Teles Pires and Itaipu. Connections marked with an asterisk(*) have different transfer capacities depending on the direction of power flows (Table A2).
The total electricity demand considered in the case study is based on a comprehensive scenarioof the future development of the Brazilian energy system [41]. This scenario represents a pathway toa fully RE supply across all sectors by 2050. According to [41], we assume that heat production andtransport will increasingly rely on electricity and synthetic hydrogen, causing almost a doubling inpower demand by 2050. Final energy demand in electricity increases to 325 TWh/year in industry,and to 412 TWh/year in the residential and service sector. This includes power for direct heatingand heat pumps. For transport 126 TWh/year in electricity are projected in the scenario, with acomparatively low share of 26% battery electric vehicles (BEV) in passenger cars and 12% in heavyduty vehicles. Additional power demand arises from the electrolytic production of 8 PJ and 77 PJ ofhydrogen for transport and industry, respectively. Regional power demand values are summarized inTable A3. They reflect the concentration of population and industry to the Sudeste region [42,43]. In thecase study presented here, we consider the energy demand and technology data for 2050, which isused as target year for a fully renewable supply in [41].
Hourly load profiles are obtained using metered data of dispatchable power generation.The national operator of the power system provides hourly values of electricity generation suppliedby centralized power plants [44]. By the time of the modelling phase, the most recent data availablewere that of 2013. These data allow capturing the hourly demand behaviour by region. The resultinghourly load has an annual peak of 100 GW. The new loads—electric vehicle charging, heating andhydrogen demand—are disaggregated to hourly values according to the methodology presentedin [45]. It considers representative profiles of uncontrolled electric vehicle charging, hydrogen carfuelling and industrial process heat demand. The inflexible share of the new loads accounts for an

Energies 2017, 10, 1859 6 of 22
additional hourly demand of at least 15 GW, resulting in a total peak load of about 115 GW, whichoccurs in the beginning of December. As most of the new loads are assumed to be flexible in theiroperation, the endogenously determined peak load can be up to 55 GW higher.
Today’s existing hydropower plants are expected to be available in the future, just like the existingfacilities already under construction [46,47]. They account for 65 GW and 43 GW of run-of-riverand reservoir hydro capacities, respectively (Tables A4 and A5 in Appendix B). Those hydro stationslisted as mid-term (MT) and long-term (LT) investment options in [39] are considered as upperlimit for the model endogenous installation of additional run-of-river and reservoir hydro capacity(Table A6). They amount to additional 25 GW and 30 GW, respectively. We allow for an endogenousinstallation of pumps in all reservoir hydro stations as an additional source of flexibility and storage.To consider different availabilities and costs, we subdivide existing hydropower stations and futureinstallations into three size classes each for reservoir hydro and run-of-the-river hydro stations. Electriccapacities below 30 MW are classified as small, between 30 MW and 300 MW as medium and above300 MW as large. Maps of all existing major hydro dams are available in [39,48,49]. Based on thecomprehensive scenario development presented in [41], we furthermore assume the existence of wavepower plants, biomass CHP plants, and stationary fuel cells with overall electric capacities of 4.6 GW,19.4 GW, and 0.8 GW, respectively. Both biomass CHP and fuel cell systems contribute to the supplyof renewable heat to residential, commercial and industrial consumers. They dispose of a thermalstorage dimensioned to store up to four hours of peak heat demand. The resulting regional capacitiesare displayed in Figure 4 and detailed in Tables A4 and A5 in Appendix B.
Energies 2017, 10, 1859 6 of 23
stations listed as mid-term (MT) and long-term (LT) investment options in [39] are considered as
upper limit for the model endogenous installation of additional run-of-river and reservoir hydro
capacity (Table A6). They amount to additional 25 GW and 30 GW, respectively. We allow for an
endogenous installation of pumps in all reservoir hydro stations as an additional source of flexibility
and storage. To consider different availabilities and costs, we subdivide existing hydropower stations
and future installations into three size classes each for reservoir hydro and run-of-the-river hydro
stations. Electric capacities below 30 MW are classified as small, between 30 MW and 300 MW as
medium and above 300 MW as large. Maps of all existing major hydro dams are available in
[39,48,49]. Based on the comprehensive scenario development presented in [41], we furthermore
assume the existence of wave power plants, biomass CHP plants, and stationary fuel cells with
overall electric capacities of 4.6 GW, 19.4 GW, and 0.8 GW, respectively. Both biomass CHP and fuel
cell systems contribute to the supply of renewable heat to residential, commercial and industrial
consumers. They dispose of a thermal storage dimensioned to store up to four hours of peak heat
demand. The resulting regional capacities are displayed in Figure 4 and detailed in Tables A4 and A5
in Appendix B.
Figure 4. Exogenously defined power generation capacities for 100% renewable power supply in 2050.
S, M, and L abbreviate the considered size classes of hydropower stations (see main text).
We quantify the maximum installable capacities for PV, Wind and CSP power plants applying
the global resource assessment tool REMix-EnDAT [50]. We find that the considered average
minimum wind speed has significant impact on the regional capacity limits and annual capacity
factors. In order to find a reasonable balance between both, we use regionally different values (see
Tables A7 and A8 in Appendix C). The overall wind power potentials considered in the case study
amount to 138 GW and 470 GW of onshore and offshore capacity, respectively (Table 2). CSP can be
used almost exclusively in the regions Nordeste, Centro-Oeste and Sudeste, with installable capacities
exceeding practical limits. The same applies to the maximum PV capacity across all regions. Based
on historic weather data of 2002, we calculate hourly profiles of wind and PV power generation as
well as CSP heat input using the REMix-EnDAT tool. The daily water inflow to hydropower plants
is considered according to long-term averages over 1931–2013 [51]. As no measured data are available
for wave power, we approximate monthly average output values based on [52], using an annual
capacity factor of 0.3.
Table 2. Potentials for solar and wind power generation based on REMix-EnDAT [50] considered in the
optimization. Note that installable capacities are displayed in GW and annual full load hours in h/year.
Region
Name
Wind Offshore Wind Onshore Photovoltaic CSP
GW (el) h/Year GW (el) h/Year GW (el) h/Year GW (th) h/Year
Figure 4. Exogenously defined power generation capacities for 100% renewable power supply in 2050.S, M, and L abbreviate the considered size classes of hydropower stations (see main text).
We quantify the maximum installable capacities for PV, Wind and CSP power plants applying theglobal resource assessment tool REMix-EnDAT [50]. We find that the considered average minimumwind speed has significant impact on the regional capacity limits and annual capacity factors. In orderto find a reasonable balance between both, we use regionally different values (see Tables A7 and A8 inAppendix C). The overall wind power potentials considered in the case study amount to 138 GW and470 GW of onshore and offshore capacity, respectively (Table 2). CSP can be used almost exclusively inthe regions Nordeste, Centro-Oeste and Sudeste, with installable capacities exceeding practical limits.The same applies to the maximum PV capacity across all regions. Based on historic weather dataof 2002, we calculate hourly profiles of wind and PV power generation as well as CSP heat inputusing the REMix-EnDAT tool. The daily water inflow to hydropower plants is considered accordingto long-term averages over 1931–2013 [51]. As no measured data are available for wave power, weapproximate monthly average output values based on [52], using an annual capacity factor of 0.3.

Energies 2017, 10, 1859 7 of 22
Table 2. Potentials for solar and wind power generation based on REMix-EnDAT [50] considered in theoptimization. Note that installable capacities are displayed in GW and annual full load hours in h/year.
RegionName
Wind Offshore Wind Onshore Photovoltaic CSP
GW (el) h/Year GW (el) h/Year GW (el) h/Year GW (th) h/Year
Nordeste 79 3922 71 3384 >1000 1659 >1000 2007Norte 1 16 2757 253 914 >1000 1580 5 2027Norte 2 13 2155 26 892 >1000 1481 0 0Norte 3 0 0 0 0 313 1411 0 0
Centro-Oeste 0 0 44 2371 >1000 1546 576 1997Sudeste 16 2639 48 1639 >1000 1568 >1000 1959
Sul 14 3468 28 2852 >1000 1286 0 0
In addition to retrofitting reservoir hydro stations by pumps, the model endogenous installationof storage can also include batteries and hydrogen storage. These are represented by Vanadium redoxflow batteries and a combination of proton exchange membrane (PEM) electrolyser, tank storage andsingle or combined cycle gas turbine. The model accounts for DR in energy-intensive productionprocesses and large scale cooling. Load shedding can be realized in the electrolytic production ofaluminium, steel and copper, load shifting in the production of cement, pulp and chlorine as wellas cooling in the food industry, gastronomy and retail. Potentials are based on Brazilian industrystatistics [53–55], Brazilian electricity demand statistics [56], and previous studies for Europe [57].We assume that these potentials are available also in the future, implicitly assuming that increases inproduction capacity and efficiency cancel each other out. Overall potentials are summarized in Table A9in Appendix D. Additional load shifting is assumed to be available from a delayed charging of 60% ofthe BEV fleet by up to eight hours. We also assume a partially flexible operation of electric heatingenabled by thermal energy storage designed to store four hours of peak heat demand. The hydrogenfor the transport sector and industry is produced in electrolysers dimensioned to produce the annualdemand in 3000 full load hours and equipped with tank storage for 12 h of full load production.
The techno-economic parameters of the considered generation and storage technologies arepresented in Table 3. Considerable cost reductions until 2050 are assumed for most technologies,including those that are so far deployed only with small capacities but might become importantat higher VRE supply shares, such as CSP, wave power or hydrogen storage. For hydropower,no significant cost reductions are assumed, as the best potentials are already exploited and increasingsustainability concerns lead to additional costs. Cost assumptions for DR and transmission technologiesare summarized in Tables A9 and A10 in Appendix D. All investments are subject to an interest rate of10%. Biomass is considered with an average fuel cost of 10 €/MWh.
Table 3. Techno-economical parameters of considered RE technologies.
Technology Efficiency Availability SpecificInvestment
Specific Invest.Storage
AmortizationTime
Fixed O & MCosts References
% % of Time k€/MW k€/MWh Years % of Invest/
VRE
Photovoltaic – 95% 520 – 20 1% [58–60]Wind onshore – 92% 900 – 20 4% [59–61]Wind offshore – 92% 1800 – 20 6% [59–61]Wave power – 92% 2000 – 20 6% [60,61]
DispatchableRE
Hydro S < 30 MW – 91% 2450 – 40 2% [39,59]Hydro M 30-300 MW – 92% 2090 – 40 3% [39,59]Hydro L > 300 MW – 89% 1730 – 40 2% [39,59]
Single cycle gas turbine 47% 95% 400 – 25 4% [60,61]Combined cycle gas turbine 67% 96% 700 – 25 4% [60,61]
CSP 37%/95% 1 95% 970/250/25 2 – 25 3% [61]Fuel cell 27%/53% 3 98% 2000 – 20 2% [60,61]
Biomass CHP 34%/53% 3 98% 1950 – 20 2% [60,61]
Storage
Vanadium redox battery 81% 98% 300 100 20 3% [62]Hydrogen storage tanks 96% 100% n.a. 24 30 2% [63]Pumped reservoir hydro 80% 90% 640 n.a. 20 3% [61]
PEM Electrolyser 71% 100% 321 n.a. 20 2% [63]
1 power block/thermal energy storage; 2 power block/solar field/thermal energy storage; 3 electric/thermal.

Energies 2017, 10, 1859 8 of 22
2.3. Scenarios
The case study includes four scenarios focused on regional RE deployment and hydropoweravailability. In the Base scenario, generation capacities of solar and wind power are optimized withoutany minimum target. In contrast, the scenarios PV-Plan and CSP-Plan assess the impact of pre-definedPV and CSP capacities, respectively. They consider the installation of PV currently planned by theBrazilian government [64] on the one hand, and the proposal of deploying CSP in northeast Brazil onthe other [65]. In scenario PV-Plan, we predefine PV capacities of 50 GW in region Sudeste, 25 GW inNordeste, 12 GW in Centro-Oeste, 10 GW in Sul and 3 GW in Norte 1. In scenario CSP-Plan, we consideran electric CSP capacity of 10 GW in Nordeste. Finally, scenario Red-Inflow evaluates how a reducedwater inflow to hydropower plants, for example caused by climate change, influences the systemset-up and supply costs. We assume an inflow reduction of 25% at any hydro station and during everyhour of the year compared to the historic averages applied in all other scenarios.
3. Results
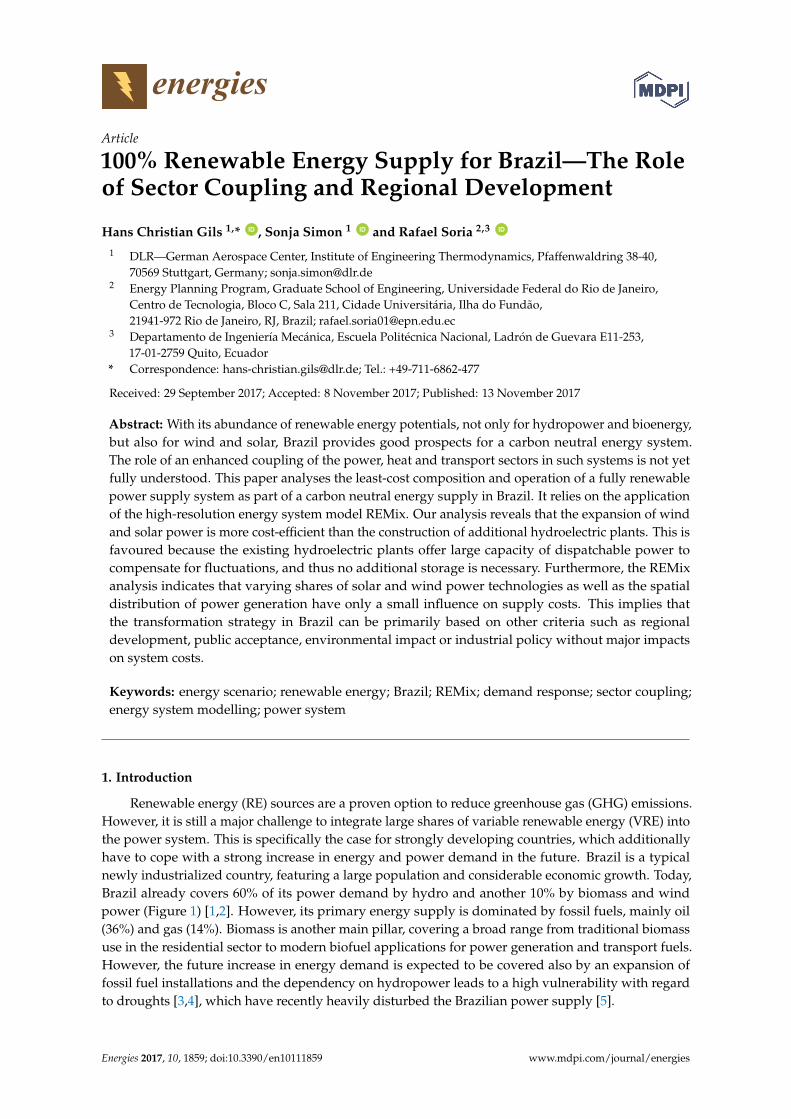
The overall installed power generation capacity identified by REMix reaches about 310 GW inthe scenarios Base and CSP-Plan, and about 335 GW in PV-Plan and Red-Inflow (see Tables S1–S14 inthe Supplementary Material for detailed results). In all scenarios, it includes 109 GW of exogenouslydefined hydropower stations and 25 GW of other RE technologies (see Section 2.2). The modelendogenous installation of additional hydropower plants is very limited, reaching 3.3 GW in allscenarios. It includes 2.3 GW of large and 0.2 GW of medium run-of-the-river power stations inthe region Sul as well as 0.6 GW and 0.3 GW of medium reservoir hydro stations in Itaipu and Sul,respectively. A model endogenous installation of hydrogen reconversion power plants is not realizedin any of the scenarios. Instead, all other capacity expansion concentrates on wind and solar powertechnologies. Reaching almost 32 GW, the overall CSP capacity is found to be highest in scenarioRed-Inflow (Figure 5). This reflects the need for additional dispatchable capacity in the case of areduced water inflow to hydropower stations. Model endogenous installation of CSP is stronglyconcentrated to the region Sudeste, with only small amounts placed in Norte 1. Despite the highquality potentials located there, no endogenous installation in Nordeste is realized. The exogenouslydefined 10 GW of CSP considered in scenario CSP-Plan lead to a substitution of 1.7 GW of windpower by 1.3 of CSP and 1 GW of PV capacity as well as some shift in the regional distribution.The endogenous installation of PV remains significantly below the amount defined in scenario PV-Plan.Its capacity is distributed over five model regions, with regional shares notably influenced by thescenario assumptions. The highest amounts of endogenously added capacities are found for onshorewind power. The available potential of 71 GW in region Nordeste is exploited across all scenarios,and complemented by further 6 to 18 GW in Sul. This regional concentration arises from the bigdifferences in annual capacity factors (Table 2). Offshore wind power is not used in any scenario,which implies that the slightly higher capacity factors compared to onshore wind cannot compensatefor the higher costs of this technology.
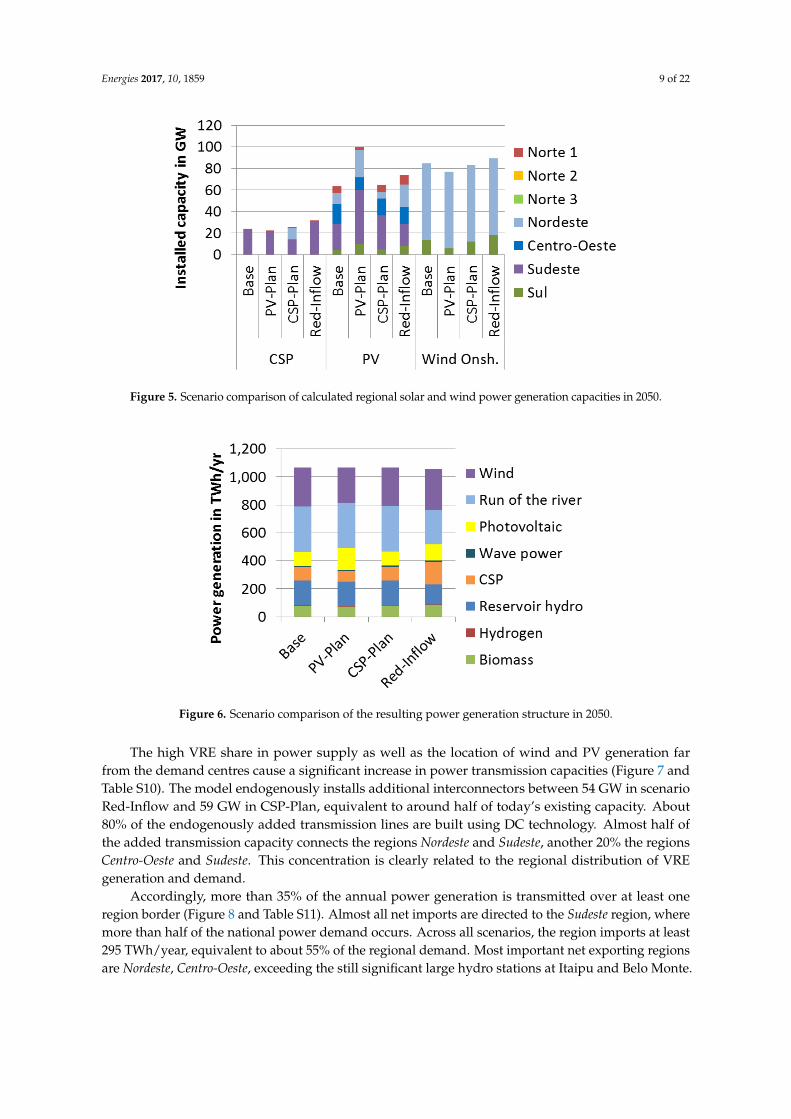
The power generation structure in the different scenarios in 2050 reflects the correspondingcomposition of the power plant park (Figure 6). Generally, a broad mix of different technologies is used.Most important power source is still hydropower: its supply share reaches 37% in Red-Inflow and47% in all other scenarios. Wind power contributes between 24% and 27%, solar power between 18%and 26%, biomass between 7% and 8%, and wave and hydrogen CHP the remaining 1%. The lowerhydropower generation in scenario Red-Inflow is mostly compensated by additional CSP generation(60%), but also by PV (15%), wind (10%) as well as biomass (5%) power, and a reduction of curtailmentsand losses (10%). Despite the high supply share of VRE technologies, curtailments occur only to a verylimited extent. They range between 21 TWh in scenario Red-Inflow and 34 TWh in scenario PV-Plan,equivalent to 2.0% and 3.2% of the overall annual power generation, respectively.
Energies 2017, 10, 1859 9 of 22Energies 2017, 10, 1859 9 of 23
Figure 5. Scenario comparison of calculated regional solar and wind power generation capacities in 2050.
The power generation structure in the different scenarios in 2050 reflects the corresponding
composition of the power plant park (Figure 6). Generally, a broad mix of different technologies is
used. Most important power source is still hydropower: its supply share reaches 37% in Red-Inflow
and 47% in all other scenarios. Wind power contributes between 24% and 27%, solar power between
18% and 26%, biomass between 7% and 8%, and wave and hydrogen CHP the remaining 1%. The
lower hydropower generation in scenario Red-Inflow is mostly compensated by additional CSP
generation (60%), but also by PV (15%), wind (10%) as well as biomass (5%) power, and a reduction
of curtailments and losses (10%). Despite the high supply share of VRE technologies, curtailments
occur only to a very limited extent. They range between 21 TWh in scenario Red-Inflow and 34 TWh
in scenario PV-Plan, equivalent to 2.0% and 3.2% of the overall annual power generation,
respectively.
Figure 6. Scenario comparison of the resulting power generation structure in 2050.
The high VRE share in power supply as well as the location of wind and PV generation far from
the demand centres cause a significant increase in power transmission capacities (Figure 7 and Table
S10). The model endogenously installs additional interconnectors between 54 GW in scenario Red-
Inflow and 59 GW in CSP-Plan, equivalent to around half of today’s existing capacity. About 80% of
the endogenously added transmission lines are built using DC technology. Almost half of the added
transmission capacity connects the regions Nordeste and Sudeste, another 20% the regions Centro-Oeste
Figure 5. Scenario comparison of calculated regional solar and wind power generation capacities in 2050.
Energies 2017, 10, 1859 9 of 23
Figure 5. Scenario comparison of calculated regional solar and wind power generation capacities in 2050.
The power generation structure in the different scenarios in 2050 reflects the corresponding
composition of the power plant park (Figure 6). Generally, a broad mix of different technologies is
used. Most important power source is still hydropower: its supply share reaches 37% in Red-Inflow
and 47% in all other scenarios. Wind power contributes between 24% and 27%, solar power between
18% and 26%, biomass between 7% and 8%, and wave and hydrogen CHP the remaining 1%. The
lower hydropower generation in scenario Red-Inflow is mostly compensated by additional CSP
generation (60%), but also by PV (15%), wind (10%) as well as biomass (5%) power, and a reduction
of curtailments and losses (10%). Despite the high supply share of VRE technologies, curtailments
occur only to a very limited extent. They range between 21 TWh in scenario Red-Inflow and 34 TWh
in scenario PV-Plan, equivalent to 2.0% and 3.2% of the overall annual power generation,
respectively.
Figure 6. Scenario comparison of the resulting power generation structure in 2050.
The high VRE share in power supply as well as the location of wind and PV generation far from
the demand centres cause a significant increase in power transmission capacities (Figure 7 and Table
S10). The model endogenously installs additional interconnectors between 54 GW in scenario Red-
Inflow and 59 GW in CSP-Plan, equivalent to around half of today’s existing capacity. About 80% of
the endogenously added transmission lines are built using DC technology. Almost half of the added
transmission capacity connects the regions Nordeste and Sudeste, another 20% the regions Centro-Oeste
Figure 6. Scenario comparison of the resulting power generation structure in 2050.
The high VRE share in power supply as well as the location of wind and PV generation farfrom the demand centres cause a significant increase in power transmission capacities (Figure 7 andTable S10). The model endogenously installs additional interconnectors between 54 GW in scenarioRed-Inflow and 59 GW in CSP-Plan, equivalent to around half of today’s existing capacity. About80% of the endogenously added transmission lines are built using DC technology. Almost half ofthe added transmission capacity connects the regions Nordeste and Sudeste, another 20% the regionsCentro-Oeste and Sudeste. This concentration is clearly related to the regional distribution of VREgeneration and demand.
Accordingly, more than 35% of the annual power generation is transmitted over at least oneregion border (Figure 8 and Table S11). Almost all net imports are directed to the Sudeste region, wheremore than half of the national power demand occurs. Across all scenarios, the region imports at least295 TWh/year, equivalent to about 55% of the regional demand. Most important net exporting regionsare Nordeste, Centro-Oeste, exceeding the still significant large hydro stations at Itaipu and Belo Monte.

Energies 2017, 10, 1859 10 of 22
Energies 2017, 10, 1859 10 of 23
and Sudeste. This concentration is clearly related to the regional distribution of VRE generation and
demand.
Figure 7. Model endogenous grid capacity expansion in scenario Base in GW. Values for the other
scenarios are similar and summarized in Table S10.
Accordingly, more than 35% of the annual power generation is transmitted over at least one
region border (Figure 8 and Table S11). Almost all net imports are directed to the Sudeste region,
where more than half of the national power demand occurs. Across all scenarios, the region imports
at least 295 TWh/year, equivalent to about 55% of the regional demand. Most important net exporting
regions are Nordeste, Centro-Oeste, exceeding the still significant large hydro stations at Itaipu and
Belo Monte.
Figure 8. Calculated annual power transmission between the regions; positive values indicate net
imports, while negative values net exports in 2050.
The water reservoirs available in the existing hydropower stations theoretically allow for storing
almost 200 TWh/year of electricity, or 20% of the annual demand. This large storage capacity strongly
limits the demand for and potential of alternative balancing options. According to the REMix results,
no model endogenous installation of electricity storage takes place in any of the scenarios. This
Figure 7. Model endogenous grid capacity expansion in scenario Base in GW. Values for the otherscenarios are similar and summarized in Table S10.
Energies 2017, 10, 1859 10 of 23
and Sudeste. This concentration is clearly related to the regional distribution of VRE generation and
demand.
Figure 7. Model endogenous grid capacity expansion in scenario Base in GW. Values for the other
scenarios are similar and summarized in Table S10.
Accordingly, more than 35% of the annual power generation is transmitted over at least one
region border (Figure 8 and Table S11). Almost all net imports are directed to the Sudeste region,
where more than half of the national power demand occurs. Across all scenarios, the region imports
at least 295 TWh/year, equivalent to about 55% of the regional demand. Most important net exporting
regions are Nordeste, Centro-Oeste, exceeding the still significant large hydro stations at Itaipu and
Belo Monte.
Figure 8. Calculated annual power transmission between the regions; positive values indicate net
imports, while negative values net exports in 2050.
The water reservoirs available in the existing hydropower stations theoretically allow for storing
almost 200 TWh/year of electricity, or 20% of the annual demand. This large storage capacity strongly
limits the demand for and potential of alternative balancing options. According to the REMix results,
no model endogenous installation of electricity storage takes place in any of the scenarios. This
Figure 8. Calculated annual power transmission between the regions; positive values indicate netimports, while negative values net exports in 2050.
The water reservoirs available in the existing hydropower stations theoretically allow for storingalmost 200 TWh/year of electricity, or 20% of the annual demand. This large storage capacity stronglylimits the demand for and potential of alternative balancing options. According to the REMix results,no model endogenous installation of electricity storage takes place in any of the scenarios. Thisincludes pump retrofitting of existing reservoir hydropower plants, battery as well as hydrogenstorage. Not even in the Red-Inflow scenario, pump retrofitting proves to be necessary to enhancestorage capacity of water dams.
In contrast, the exogenously defined flexibility is adequate for load balancing. The predefinedhydrogen storage capacity is used to store between 1.6% and 1.9% of the annual hydrogen production(Table S12). This corresponds to around 12 TWh/year of electric energy. Annual full load hours ofhydrogen storage range between 42 and 74 h. They are highest in scenario PV-Plan and lowest inCSP-Plan. Particularly high values are found in the regions Nordeste and Norte 1, lowest values in Norte2 and Sul. A higher utilization is observed for the predefined thermal energy storage capacities in

Energies 2017, 10, 1859 11 of 22
CHP and electric heating systems. Depending on the region and scenario, annual full load hours reachbetween 56 and 161 h. They are highest for fuel cell CHP and lowest for biomass CHP. On a nationallevel, the annual storage energy input varies only by 15% between the scenarios, with lowest value inPV-Plan and highest in Red-Inflow. It reaches between 7% and 9% of the corresponding annual heatdemand (Table S13). The stored energy is equivalent to a power demand of around 6 TWh/year incase of electric heating, and a power generation of 8 TWh/year in case of CHP. Controlled charging ofBEV is also used to balance VRE fluctuations. Between 7% and 9% of the annual charging demandare shifted to a later time, equivalent to between 8 and 10 TWh/year (Table S14). The highest valueoccurs in scenario CSP-Plan, the lowest in Red-Inflow. Generally, longer shifting times of six to eighthours are preferred to shorter ones. The REMix results show that the annual shares of shifted BEVcharging are the highest in the regions Sudeste and Sul. Regional values can be as low as 3% and ashigh as 11% of the annual charging demand. Other, more expensive DR is used to a much lowerextent. The annual amount of the considered industrial and commercial load shifting and sheddingdoes not exceed 0.4 TWh or 0.04% of the total annual power demand. Despite this low amount ofenergy, DR provides peak load reductions by more than 3.3 GW, according to the available potential.The maximum load increase reaches 0.9 GW. The amount of shifted and shedded energy differs byup to 6% between the scenarios, whereas peak reduction and increase are identical. This implies thatthe implementation of DR is only to a very limited extent influenced by the scenario assumptions.In terms of electric energy, the overall load shifting of electric heating, CHP, hydrogen electrolysis, BEV,and other DR reaches around 33 TWh/year, which is about 3% of the annual power demand, and lessthan 20% of the available hydro reservoir capacity. Table S14 sums up regional power transport.
Under the assumptions for investment and operational cost applied, the scenarios Base, PV-Planand CSP-Plan show only slight differences of less than 1% in specific electricity costs (Figure 9).A clearer difference can be found in scenario Red-Inflow, where additional generation capacity isrequired. Here costs of power production are about 6 €/MWh (8%) higher than in the other scenarios.These costs account for fixed as well as variable operation and maintenance costs on the one hand,and the annual depreciation of capital expenditure on the other. Both are here considered for allassets included in the model, thus exogenously defined and endogenously added power stations,power transmission and all considered storage and balancing technologies. This can be considered aconservative approach, as it implies that annuities still have to be paid for hydro and grid capacitiesavailable today. The resulting specific generation costs are dominated by hydro and biomass power,whereas grid, storage and DR do not have a significant share in any of the scenarios. If no annuities areconsidered for existing hydro stations, grid capacities and the predefined biomass CHP plants, specificelectricity costs are lower by 20 €/MWh, 1 €/MWh and 7 €/MWh, respectively. Note that all costs arecalculated in €2015.Energies 2017, 10, 1859 12 of 23
Figure 9. Calculated power supply costs per unit of demand, subdivided by technology in 2050.
4. Discussion and Conclusions
This paper analyses the least-cost composition and operation of a fully renewable power supply
system as part of a 100% RE system in Brazil. It relies on the application of the high-resolution energy
system model REMix, which considers the power sector as well as all linkages to the heat and
transport sectors. The methodology applied is easily transferrable to other countries. The modelling
results show that the Brazilian power system is able to equally address the challenges of providing
sufficient electricity and eliminating direct GHG emissions. With regard to affordability, our results
indicate that a completely renewable power system in Brazil will not lead to significantly increased
costs, despite the additional transmission and generation capacity [41].
Our analysis reveals that the expansion of wind, PV and CSP is cheaper than the construction of
additional hydroelectric power stations. This is favoured because the existing hydroelectric power
plants already offer large capacity of dispatchable power to compensate for fluctuations, and thus no
additional storage is necessary. Furthermore, the existing hydropower capacity limits the
contribution of wind and solar to around half of the generation. This makes a fundamental difference
to other countries and world regions, where a fully renewable power supply relying on domestic
sources can only be realized relying on much higher wind and solar shares. Nonetheless, our analysis
shows that wind, PV and CSP are major pillars of a cost-efficient fully renewable power supply in
Brazil. Previous analyses for Europe have shown that higher VRE shares require the installation of
significant amounts of storage and grid capacity [32,66–72]. In contrast to that, there is no demand
for additional short-term or long-term electricity storage in our scenarios for Brazil, as the available
hydropower reservoirs and biomass stations can balance the intermittent generation. However,
storage is used as thermal energy storage in CSP, CHP as well as electric heating (with hot water
storage), and as decentralized hydrogen storage. According to our scenarios, the Brazilian high-
voltage power grid would have to be expanded by around half of its current capacity. Its main driver
is the installation of wind power and CSP in regions far from the demand centres. Even though the
need for additional power lines is significant, it is comparatively much lower than in systems with
higher solar and especially wind shares. However, the implementation of a wind and solar share of
close to 50% represents a significant transformation of the Brazilian power system.
The REMix analysis also shows that varying shares of new supply technologies (wind, PV, CSP)
as well as the spatial distribution of power plants have only a small influence on the supply costs.
This implies that the transformation strategy in Brazil can be primarily based on other criteria such
as regional development, public acceptance, environmental impact or industrial policy without major
impacts on system costs. Furthermore, the model results indicate an enhanced coupling of power,
heat and transport sectors through flexible electric heating, electric mobility and hydrogen
electrolysis can significantly contribute to the balancing of intermittent power generation. By
Figure 9. Calculated power supply costs per unit of demand, subdivided by technology in 2050.

Energies 2017, 10, 1859 12 of 22
4. Discussion and Conclusions
This paper analyses the least-cost composition and operation of a fully renewable power supplysystem as part of a 100% RE system in Brazil. It relies on the application of the high-resolution energysystem model REMix, which considers the power sector as well as all linkages to the heat and transportsectors. The methodology applied is easily transferrable to other countries. The modelling resultsshow that the Brazilian power system is able to equally address the challenges of providing sufficientelectricity and eliminating direct GHG emissions. With regard to affordability, our results indicate thata completely renewable power system in Brazil will not lead to significantly increased costs, despitethe additional transmission and generation capacity [41].
Our analysis reveals that the expansion of wind, PV and CSP is cheaper than the construction ofadditional hydroelectric power stations. This is favoured because the existing hydroelectric powerplants already offer large capacity of dispatchable power to compensate for fluctuations, and thus noadditional storage is necessary. Furthermore, the existing hydropower capacity limits the contributionof wind and solar to around half of the generation. This makes a fundamental difference to othercountries and world regions, where a fully renewable power supply relying on domestic sources canonly be realized relying on much higher wind and solar shares. Nonetheless, our analysis shows thatwind, PV and CSP are major pillars of a cost-efficient fully renewable power supply in Brazil. Previousanalyses for Europe have shown that higher VRE shares require the installation of significant amountsof storage and grid capacity [32,66–72]. In contrast to that, there is no demand for additional short-termor long-term electricity storage in our scenarios for Brazil, as the available hydropower reservoirsand biomass stations can balance the intermittent generation. However, storage is used as thermalenergy storage in CSP, CHP as well as electric heating (with hot water storage), and as decentralizedhydrogen storage. According to our scenarios, the Brazilian high-voltage power grid would have tobe expanded by around half of its current capacity. Its main driver is the installation of wind powerand CSP in regions far from the demand centres. Even though the need for additional power linesis significant, it is comparatively much lower than in systems with higher solar and especially windshares. However, the implementation of a wind and solar share of close to 50% represents a significanttransformation of the Brazilian power system.
The REMix analysis also shows that varying shares of new supply technologies (wind, PV, CSP)as well as the spatial distribution of power plants have only a small influence on the supply costs.This implies that the transformation strategy in Brazil can be primarily based on other criteria such asregional development, public acceptance, environmental impact or industrial policy without majorimpacts on system costs. Furthermore, the model results indicate an enhanced coupling of power,heat and transport sectors through flexible electric heating, electric mobility and hydrogen electrolysiscan significantly contribute to the balancing of intermittent power generation. By concentrating theseloads to the hours of high solar, wind and hydropower availability, the demand for dispatchablegeneration can be reduced. The same applies to industrial load shifting and shedding, which helps tocut load peaks that occur only in few hours. Even though the flexibility of enhanced sector couplingand DR is used for a temporal shift of only around 3% of the annual power demand, the utilization ofthe considered thermal and hydrogen storage as well as controlled BEV charging is comparable tothat identified for other countries in previous REMix analyses [37,45]. Nonetheless, their balancingpotential might become even more important, if biomass resources are increasingly exploited orexported, thus requiring the use of other energy carriers also in Brazil. The abundance of good qualitysolar and wind energy potentials is a chance for a further electrification of transport and heating,as well as for the production of synthetic fuels without significant increase in specific power generationcosts. Both could potentially substitute the usage of biomass in the heat and transport sectors, whichwas considered in the underlying energy system transformation pathway considered in this work [41].The limits and system impact of this option must analysed by future studies.
Our modelling approach potentially overestimates the flexibility of reservoir hydro stations, as itdoes not account for other uses of water for environmental, social and economic purposes [21]. For this

Energies 2017, 10, 1859 13 of 22
reason, the potential impact of a lower flexibility of hydro stations was studied in a REMix sensitivityrun with the storage capacity of all water reservoirs cut by half. Despite this strong reduction of waterstorage availability, the results only show a slight shift in generation capacity from PV (−4.5 GW,7%) to CSP (2.5 GW, 10%) compared to the Base scenario. This small change can be explained bythe dispatchable operation of CSP, as was also highlighted by [65]. The corresponding change in thepower generation structure reaches only 7 TWh, and is rather insignificant. There is no change in theinvestment in hydro capacity, and the differences in hydropower generation, grid expansion, annualpower transmission and overall system costs are below 1%. The increase in the flexible operation ofsector coupling technologies reaches around 3%, and is most notable for the electrolyser operation.This first assessment must be supplemented by a comprehensive analysis of the real flexibility ofhydropower plants in Brazil considering a detailed modelling of hydro stations operating in cascade.
Scenario Red-Inflow gives some indication on the possible response to a reduction in water inflowto hydropower plants—due to either droughts or other water demands. Due to the abundance of highquality potentials, such a reduction could be relatively easily compensated by additional solar andwind power generation. Particularly the CSP supply share increases notably in this scenario, as it canprovide firm generation capacity through its thermal storage. Future studies must assess the role of areduced water inflow on the Brazilian power supply system in more detail, considering also regionallydifferent values and especially seasonal effects. Concerning the impact of a lower water inflow tohydropower stations, e.g., as a consequence of climate change, our results show that a reduction of25% in hydropower generation can be easily balanced by wind and solar power, increasing the specificpower generation costs by about 8%.
The results of the case study are to a high degree influenced by the REMix modelling approachand the data used. The spatial and temporal resolution of REMix limits the validity of the results to thehourly balancing of demand and generation and the power exchange between the considered modelregions. Possibly, additional grid or generation capacity might be required to supply all demandalso on shorter timescales and within these regions. Furthermore, the model relies on numerousapproximations concerning the technical characteristics and restrictions of all modelled technologies.These aspects have been discussed in detail in [32].
The hourly availability of VRE power generation is mainly driven by weather conditions andis typically different between the years. The results presented here rely on measured data of 2002.The consideration of different weather years might have significant impact on the results [32]. Addingup the minimum availability of the power generation capacities during the afternoon load peak, thefirm capacity in the system can be estimated. Depending on the scenario it reaches around 75% to 80%of the annual peak load. Sensitivity analyses with REMix show that around 33 GW of hydrogen-firedgas turbines are needed to enhance the relative firm capacity to 115%. However, these units wouldhave average annual full load hours of less than 10 h/year. The required investment increases theoverall power system costs by about 3%.
The case study relies on assumptions concerning technology and cost developments, which canhave substantial impact on the results. This is particularly the case for the future costs of wind, solarand hydropower, but also energy storage. Our results show that predefined PV and CSP capacitieshave only a very small impact on the specific generation costs. From this follows that minor changesin investment costs of solar and wind technologies would not lead to significant changes in the supplycosts, even though the least-cost supply structure is likely to be different. The sensitivity of the resultsto a 50% increase in investment costs of CSP and onshore wind technology, respectively, was tested intwo additional REMix runs. The consideration of higher CSP costs leads to a reduction of CSP capacityby around 16.5 GW compared to the Base scenario, equivalent to around one third. It is compensatedby additional 25 GW of PV, 10 GW of onshore wind, 2 GW of hydropower, and 0.8 GW of hydrogengas turbines capacity. CSP generation is reduced even by half, and substituted to 60% by PV and 40%by wind. The additional wind and solar capacity is located in the regions Sul and Centro-Oeste, most orthe additional PV capacity in Nordeste and Centro-Oeste. The different generation structure causes an
Energies 2017, 10, 1859 14 of 22
increase in grid capacity expansion by 30% and in supply costs by 4%. With less dispatchable capacityavailable, other balancing technologies are used to a much higher extent: power transmission increasesby 20%, hydrogen storage charging by 30%, thermal energy storage and shifted BEV charging by about40% each, and other DR by 250%. The consideration of higher onshore wind investment costs reducesthe wind power capacity in Nordeste by 33 GW, which is more than half of the value determined inthe Base scenario. Wind power generation decreases even more, by almost 60%. On the contrary, CSPgeneration doubles, even though the increase in capacity amounts to only 13 GW or 50%. PV capacityand generation are by 25 GW (40%) and 35 TWh (35%) higher than in the Base scenario, respectively.As most of the additional solar power generation capacity is located in Sudeste, the need to expandthe power grid is reduced almost by half. The annual power transmission is by more than 30% lower,whereas the overall usage of other balancing technologies remains unchanged. System costs are byabout 8% higher than in the Base scenario, and close to those in Red-Inflow. Concerning energy storage,a sensitivity run with REMix reveals that battery storage is not used, even if investment costs arereduced by half.
Across all scenarios, CSP is found to be an important element of a 100% renewable power supplyin Brazil. This is in line with previous works particularly dedicated to the future role of CSP in thenortheast of the country [65,73]. For the region here labelled Nordeste, they find that CSP plantshybridized with local biomass would play an important role in the Brazilian power system from 2040on. Such systems would contribute to the power system by regularizing the energy imbalance thatresult from the large-scale wind and PV expansion along with conventional inflexible power plants.Furthermore, they would be able to increase frequency response and operational reserve services andcan provide the required additional flexibility that will be required in the future.
In our case study, we assume a favourable development of VRE technology costs. To some degree,these costs reductions depend on the future global market development. We implicitly assume asignificant increase in globally installed capacity, which enables cost reductions through technologylearning in a global market. This is particularly relevant for the technologies with currently lowinstalled capacities, including wave power, hydrogen fuel cells, battery storage and CSP. In this, werely on the cited data sources for technology costs.
By integrating our detailed power optimization approach with the detailed transformationpathways in [41] we provide an easily adaptable methodology for the assessment of energytransformation. Our scenarios help to identify, which technologies might be essential for a fullydecarbonized energy system as well as critical investment decisions for the future capacity structure.Applying this methodology before, we have identified such decisive investments for an island systemwith regard to costs [37]. With this paper, we provide evidence of an easy transferability of ourapproach. For Brazil, we identified that all considered scenarios with varying generation systems leadto similar costs. We therefore highlight the necessity to further assess other sustainability dimensionsfor an optimal transformation of the power system.
Supplementary Materials: The following are available online at www.mdpi.com/1996-1073/10/11/1859/s1,Table S1: Model-endogenous capacity installation of wind onshore, PV and CSP capacity, Table S2: Annualhydropower generation in scenario Base, Table S3: Annual other power generation in scenario Base, Table S4:Annual hydropower generation in scenario PV-Plan, Table S5: Annual other power generation in scenario PV-Plan,Table S6: Annual hydropower generation in scenario CSP-Plan, Table S7: Annual other power generation inscenario CSP-Plan, Table S8: Annual hydropower generation in scenario Red-Inflow, Table S9: Annual otherpower generation in scenario Red-Inflow, Table S10: Model-endogenous installation of grid connections, Table S11:Annual power export and import by model region, Table S12: Annual energy input to decentralized hydrogenstorage for industry and transport, Table S13: Annual energy input to thermal energy storage in electric heatingand CHP, Table S14: Annual amount of BEV charging power shifted to a later time.
Acknowledgments: The development of the demand response model was part of the INTEEVER projectfinanced by the German Federal Ministry for Economic Affairs and Energy under grant number FKZ 03ET4020A.The preparation of the case study was partially funded by Greenpeace Brazil. The authors acknowledge thecontribution of Tobias Fichter from DLR to the preparation of the model input data and assumptions. We alsothank Mariana Imperio, Cindy Viviescas, Fernanda Guedes, Bruno Scola, Rodrigo Milani, Roberto Schaeffer,and Alexandre Szklo from the Federal University of Rio de Janeiro (UFRJ) to the preparation of the model input

Energies 2017, 10, 1859 15 of 22
data and assumptions. Furthermore, the authors thank Thomas Pregger from DLR for his helpful comments on aprevious draft of this paper. Finally, we thank the Brazilian Federal Agency CAPES for its support to the scientificresearch performed at UFRJ.
Author Contributions: Hans Christian Gils and Sonja Simon conceived and designed the case study;Hans Christian Gils implemented the DR model; Hans Christian Gils performed the model runs; Hans ChristianGils and Sonja Simon analysed the data; Rafael Soria contributed specific data to model the Brazilian powersystem; and Hans Christian Gils and Sonja Simon jointly wrote the paper.
Conflicts of Interest: The authors declare no conflict of interest.
Appendix A. Demand Response Model
This work makes use of a simplified model representation of demand response (DR), compared tothat used in previous publications of REMix results [37,38]. Here, load shifting is modelled as fictitiousenergy storage for preponing and postponing demand. If load is shifted to an earlier time, it operatesequivalent to a physical energy storage, which is charged when the load is increased, and subsequentlydischarged when it is decreased. Load shifting to a later time represents the inverse process, wherethe storage is charged at load reduction and later discharge at load increase. Equations (A1) and (A2)show the storage balance for load shifting to an earlier or later time, respectively. It includes twoefficiency values η1 and η2, representing additional demand caused by DR. In this work, modelequations and inequalities are presented in simplified denotation. For a better readability, sets thatparameters and variables are dependent on are not included here. These are generally model nodesand technologies. Parameters and variables are displayed differently: variables are always written inbold font, and parameters appear in normal font. All model variables used here can have only positivevalues. All variables and parameters used in the equations are defined in Table A1.
∆t ×(
Pred(t)η1
− PbalRed(t))+ (WlevelRed(t) + WlevelRed(t − 1))× 1−η2
2 = WlevelRed(t)− WlevelRed(t − 1) (A1)
∆t ×(
Pinc(t)− PbalInc(t)η1
)+ (WleveInc(t) + WleveInc(t − 1))× 1−η2
2 = WleveInc(t)− WleveInc(t − 1) (A2)
In the case that loads cannot be moved to both an earlier and later time for a certain technology,the corresponding variables are set to zero. For load shedding, Equation (A1) is modified such thatPbalRed is set to zero for all time steps.
The overall load reduction must be smaller or equal than the available flexible capacity givenby the overall capacity of DR loads and the time-dependent availability factor sflex (Equation (A3)).Equivalently, the overall load increase must be smaller or equal than the available unused capacitygiven dependent on the availability factor sfree (Equation (A4)). The overall capacity of DR loadscan be composed of an exogenously defined contribution PexistCap and an endogenously optimizedcontribution PaddedCap. Its sum cannot exceed the overall available potential PmaxCap (Equation (A5)).
Pred(t) + PbalInc(t)!≤ (PaddedCap + PexistCap)× s f lex(t) (A3)
Pinc(t) + PbalRed(t)!≤ (PaddedCap + PexistCap)× s f ree(t) (A4)
PaddedCap + PexistCap!≤ PmaxCap (A5)
The annual depreciation of capital expenditure is calculated as the product of added DR capacityPaddedCap, specific investment costs cspecInv and the annuity factor. The latter is obtained according toEquation (A3) in [32]. The operation and maintenance costs Coperation are composed of three elements:the fixed costs calculated as a constant share cOMFix of the investment costs, and two variable elements

Energies 2017, 10, 1859 16 of 22
scaling with the shifted or shedded load on the one hand, and the levels of the fictitious storage(Equation (A6)) on the other with specific costs values cOMVar1 and cOMVar2.
Coperation = PaddedCap × cspecInv × cOMFix + ∑t(Pred(t) + Pinc(t))× cOMVar1+
∑t(WlevelRed(t) + WlevelInc(t))× cOMVar2
(A6)
Table A1. Variables and parameters used in the model description.
Symbol Unit Variable/Parameter
Coperation k€/year Operation and maintenance costsPaddedCap (t) GW Installed electric capacity of additionally DR consumers
PbalInc (t) GW Balancing of earlier load increasePbalRed (t) GW Balancing of earlier load reduction
Pinc (t) GW Demand response load increasePred (t) GW Demand response load reduction
WlevelInc (t) GWh Amount of increased and not yet balanced energyWlevelRed (t) GWh Amount of reduced and not yet balanced energy
∆t h Calculation time intervalη1 % Efficiency describing additional demand caused by DR, independent of shifting timeη2 %/h Efficiency describing additional demand caused by DR, dependent of shifting time
cOMFix %/year Operation and maintenance fix costscOMVar1 k€/MW Operation and maintenance variable costs, independent of shifting timecOMVar2 k€/MWh Operation and maintenance variable costs, dependent of shifting timecspecInv k€/MW Specific investment costsflex (t) % Share of load reduction potential available in time step tsfree (t) % Share of load increase potential available in time step t
PexistCap GW Already accessed capacity of DR loadsPmaxCap GW Maximum accessible capacity of DR loads
Appendix B. Power Demand, Hydro Power, Biomass Power, and Grid Capacities
Table A2 includes the existing grid connections considered in REMix according to [39].Regionalized power demand values from [41] are summarized in Table A3. Tables A4 and A5provide the considered run-of-river, reservoir hydro, wave power, and biomass CHP capacities aswell as hydropower full load hours considered in all scenarios. The model endogenous installation ofadditional hydropower plants is limited by the potentials summarized in Table A6. The hydropowercapacities are taken from [46,47], while the biomass and wave power capacities were part of thescenario development in [41].
Table A2. Considered existing grid connections and transfer capacities in MW based on [39].
Start (S) End (E) Techn. S → E in MW E → S in MW
XIN IMP AC 4115 4115XIN Norte 1 AC 2700 2700XIN Norte 2 AC 2700 2700XIN Belo Monte AC 11,000 11,000XIN Sudeste DC 8000 8000IMP Nordeste AC 8200 4849IMP Norte 1 AC 8518 8518IMP Centro-Oeste AC 5380 5598IV Sudeste AC 6800 6800IV Itaipu AC 6300 6300IV Sul AC 2426 2317

Energies 2017, 10, 1859 17 of 22
Table A2. Cont.
Start (S) End (E) Techn. S → E in MW E → S in MW
Sudeste Nordeste AC 6500 6936Centro-Oeste Norte 3 DC 7092 7092Centro-Oeste Teles Pires AC 10,500 10,500
Sudeste Itaipu DC 5500 5500Sudeste Sul AC 9420 9108Itaipu Sul AC 2112 192Sudeste Centro-Oeste AC 15,000 15,000
Table A3. Considered regional annual power demand based on [41].
TechnologyRegion
Transport Electric Heating Hydrogen Electrolysis Other
TWh/year TWh/year TWh/year TWh/year
Nordeste 17.6 33.0 4.0 98.9Norte 1 1.9 10.2 1.2 35.3Norte 2 0.8 4.2 0.7 9.0Norte 3 0.5 3.1 0.7 4.5
Centro-Oeste 10.1 12.4 1.3 49.2Sudeste 72.3 89.0 15.5 360.6
Sul 23.4 28.7 4.8 117.8
Table A4. Considered run-of-river hydro and wave power capacities and annual full load hoursbased on [46,47].
TechnologyRegion
Run-of-River Hydro S Run-of-River Hydro M Run-of-River Hydro L Wave Power
MW (el) h/Year MW (el) h/Year MW (el) h/Year MW (el) h/Year
Nordeste 165 3256 0 6139 7895 4270 888 2628Norte 1 235 4799 243 5548 2440 5156 1089 2628Norte 2 0 4799 810 4880 1070 4596 0 0
Belo Monte 0 0 233 5790 11,000 4446 0 0Norte 3 165 4799 74 5264 4308 6061 0 0
Teles Pires 0 0 0 0 1820 4410 0 0Centro-Oeste 1752 4611 1729 5320 8710 4620 0 0
Sudeste 1869 4611 2340 5033 1044 6146 1211 2628Itaipu 0 0 0 0 8800 6148 0 0
Sul 1663 4779 1584 5214 5473 4977 1412 2628
Table A5. Considered reservoir hydro and biomass power capacities and annual full load hoursbased on [41,46,47].
TechnologyRegion
Reservoir Hydro S Reservoir Hydro M Reservoir Hydro L Biomass CHP Fuel Cells
MW (el) h/Year MW (el) h/Year MW (el) h/Year MW (el) MW (el)
Nordeste 0 0 397 4292 2550 4292 2743 113Norte 1 0 0 0 0 1727 5519 809 33Norte 2 30 6745 250 4030 8370 4993 503 21Norte 3 0 0 217 3854 0 6044 503 21
Centro-Oeste 28 2803 1550 4292 18,368 4468 902 37Sudeste 0 0 1526 4292 399 6132 10,627 438
Sul 0 0 795 4468 7437 4993 3260 134

Energies 2017, 10, 1859 18 of 22
Table A6. Considered potential for additional hydropower installation based on [46,47].
TechnologyRegion
Run-of-River S Run-of-River M Run-of-River L Reservoir S Reservoir M Reservoir L
MW (el) MW (el) MW (el) MW (el) MW (el) MW (el)
Nordeste 45 593 0 0 483 0Norte 1 0 0 14,953 0 95 16,418Norte 2 9 0 708 0 0 0Norte 3 84 350 0 0 0 0
Centro-Oeste 481 764 1260 0 280 330Sudeste 862 1499 0 0 3367 8063Itaipu 0 0 0 0 608 0
Sul 997 158 2275 0 292 0
Appendix C. Evaluation of Wind and Solar Power Potentials in Brazil
The global renewable energy assessment tool REMix-EnDAT provides maximum installablecapacities and hourly power generation profiles for wind offshore, wind onshore, and solar PV aswell as the thermal output of solar fields in CSP plants [50]. Installable capacities and annual capacityfactors are highly dependent on the considered lower bound for the average annual wind speed (vmin).To assess this effect on the regional wind power potentials in Brazil, different values between 4 km/hand 7.5 km/h are considered in this work. The resulting capacities and full load hours are summarizedin Tables A7 and A8 for onshore and offshore wind power, respectively. It appears that both extentand quality of wind power potentials differ vastly among different regions. To find a reasonablebalance between installable capacity and annual full load hours, the regional potentials used in theoptimization consider different average annual wind speeds (Table 2). In contrast to wind power,annual full load hours for solar power generation are similar in most regions. However, CSP potentialsare only available in four out of seven regions (Table 2). Using the methodology and site selectioncriteria introduced in [50], installable capacities for both PV and CSP exceed 1000 GW in most regionsand are thus practically unlimited.
Table A7. Available onshore wind potentials at different average annual wind speeds, evaluatedusing REMix-EnDAT. Note that installable capacities are displayed in GW and annual full load hoursin h/year.
Region Nordeste Norte 1 Norte 2 Centro-Oeste Sudeste Sul
Parameter Cap. FLH Cap. FLH Cap. FLH Cap. FLH Cap. FLH Cap. FLH
Min. Wind Speed GW (el) h/Year GW (el) h/Year GW (el) h/Year GW (el) h/Year GW (el) h/Year GW (el) h/Year
vmin = 4 km/h 3246 1892 253 914 26 892 1410 953 1599 1009 396 1437vmin = 5 km/h 2122 2221 0 0 0 0 92 2086 420 1262 174 1888
vmin = 5.5 km/h 1552 2357 0 0 0 0 44 2371 48 1639 79 2256vmin = 6 km/h 823 2568 0 0 0 0 0 0 1 2738 28 2852
vmin = 6.5 km/h 225 2935 0 0 0 0 0 0 1 2776 27 2879vmin = 7 km/h 71 3384 0 0 0 0 0 0 0 0 8 3206
Table A8. Available offshore wind potentials at different average annual wind speeds, evaluatedusing REMix-EnDAT. Note that installable capacities are displayed in GW and annual full load hoursin h/year.
Region Nordeste Norte 1 Norte 2 Sudeste Sul
Parameter Cap. FLH Cap. FLH Cap. FLH Cap. FLH Cap. FLH
Min. Wind Speed GW (el) h/Year GW (el) h/Year GW (el) h/Year GW (el) h/Year GW (el) h/Year
vmin = 4 km/h 417 2636 237 1942 56 1526 183 1446 200 2694vmin = 5 km/h 378 2810 160 2213 33 1929 89 1837 181 2866
vmin = 5.5 km/h 330 2975 137 2282 32 1936 45 2289 172 2938vmin = 6 km/h 293 3107 133 2290 13 2155 16 2639 160 3003
vmin = 6.5 km/h 222 3305 16 2757 0 0 13 2770 143 3083vmin = 7 km/h 128 3626 1 3367 0 0 0 0 82 3305
vmin = 7.5 km/h 79 3922 1 3527 0 0 0 0 14 3468

Energies 2017, 10, 1859 19 of 22
Appendix D. Technology Parameter
The following tables contain techno-economic parameters considered in the REMix applicationfor DR technologies in Table A9, and for grid technologies in Table A10.
Table A9. Techno-economic parameters of demand response technologies.
TechnologyInstalledCapacity
AverageReduction
AverageIncrease Efficiency Variable O
& M Costs Ref.
MW MW MW % €/MWh
Process industry shifting 1601 603 286 99% 50 [53–55,57]Process industry shedding 3849 2210 n.a. 100% 1000 [53–55,57]
Cooling 1666 500 600 95% 10 [56,57]
Table A10. Techno-economic parameters of grid technologies.
TechnologyRated Investment Losses Amort. Fixed O & M
Ref.Power Line Converter Line Converter Time Costs
MW k€/km Unit Cost %/100 km % Years % of Invest/year
HVDC 4000 226 150,000 0.45% 0.70% 40 1.00% [74,75]HVAC 5500 480 n.a. 1% n.a. 40 0.30% [74,76]
References
1. Ministério de Minas e Energia (MME). Balanço Energético Nacional 2015: Ano Base 2014; Ministério de Minas eEnergia, Empresa de Pesquisa Energética (EPE): Brasilia, Brazil, 2015.
2. International Energy Agency (IEA). World Energy Balances (2016 edition). In IEA Energy Statistics(Beyond 20/20); International Energy Agency: Paris, France, 2016.
3. Schaeffer, R.; Szklo, A.; De Lucena, A.F.P.; Soria, R.; Chavez-Rodriguez, M. The vulnerable Amazon:The impact of climate change on the untapped potential of hydropower systems. IEEE Power EnergyMag. 2013, 11, 22–31. [CrossRef]
4. De Lucena, A.F.P.; Szklo, A.S.; Schaeffer, R.; de Souza, R.R.; Borba, B.S.M.C.; da Costa, I.V.L.; Júnior, A.O.P.;da Cunha, S.H.F. The vulnerability of renewable energy to climate change in Brazil. Energy Policy 2009, 37,879–889. [CrossRef]
5. Corrêa da Silva, R.; de Marchi Neto, I.; Silva Seifert, S. Electricity supply security and the future role ofrenewable energy sources in Brazil. Renew. Sustain. Energy Rev. 2016, 59, 328–341. [CrossRef]
6. Nass, L.L.; Pereira, P.A.A.; Ellis, D. Biofuels in Brazil: An Overview. Crop Sci. 2007, 47, 2228–2237. [CrossRef]7. La Rovere, E.L.; Pereira, A.S.; Simões, A.F. Biofuels and Sustainable Energy Development in Brazil. World Dev.
2011, 39, 1026–1036. [CrossRef]8. Raele, R.; Gama-Boaventura, J.M.; Fischmann, A.A.; Sarturi, G. Scenarios for the second generation ethanol
in Brazil. Technol. Forecast. Soc. Chang. 2014, 87, 205–223. [CrossRef]9. De Paula Dias, M.A.; de Souza Vianna, J.N.; Felby, C. Sustainability in the prospective scenarios methods:
A case study of scenarios for biodiesel industry in Brazil, for 2030. Futures 2016, 82, 1–14. [CrossRef]10. Portugal-Pereira, J.; Soria, R.; Rathmann, R.; Schaeffer, R.; Szklo, A. Agricultural and agro-industrial
residues-to-energy: Techno-economic and environmental assessment in Brazil. Biomass Bioenergy 2015,81, 521–533. [CrossRef]
11. Aquila, G.; Rocha, L.C.S.; Junior, P.R.; Pamplona, E.D.O.; Queiroz, A.R.D.; Paiva, A.P.D. Wind powergeneration: An impact analysis of incentive strategies for cleaner energy provision in Brazil. J. Clean. Prod.2016, 137, 1100–1108. [CrossRef]
12. Pinto, J.T.M.; Amaral, K.J.; Janissek, P.R. Deployment of photovoltaics in Brazil: Scenarios, perspectives andpolicies for low-income housing. Sol. Energy 2016, 133, 73–84. [CrossRef]
13. Pereira, A.O.; Cunha da Costa, R.; Costa, C.D.V.; Marreco, J.d.M.; La Rovere, E.L. Perspectives for theexpansion of new renewable energy sources in Brazil. Renew. Sustain. Energy Rev. 2013, 23, 49–59. [CrossRef]

Energies 2017, 10, 1859 20 of 22
14. Pereira, E.B.; Martins, F.R.; Abreu, S.D.; Rüther, R. Atlas Brasileiro de Energia Solar; Instituto Nacional dePesquisas Espaciais (INPE): São José dos Campos, Brazil, 2006; Volume 1.
15. De Souza Noel Simas Barbosa, L.; Orozco, J.F.; Bogdanov, D.; Vainikka, P.; Breyer, C. Hydropower andPower-to-gas Storage Options: The Brazilian Energy System Case. Energy Procedia 2016, 99, 89–107.[CrossRef]
16. Viana, T.S.; Rüther, R.; Martins, F.R.; Pereira, E.B. Assessing the potential of concentrating solar photovoltaicgeneration in Brazil with satellite-derived direct normal irradiation. Sol. Energy 2011, 85, 486–495. [CrossRef]
17. Centro de Pesquisas de Energia Elétrica (CEPEL). Atlas do Potencial Eólico Brasileiro; Centro de Pesquisas deEnergia Elétrica: Rio de Janerio, Brazil, 2001.
18. Chade Ricosti, J.F.; Sauer, I.L. An assessment of wind power prospects in the Brazilian hydrothermal system.Renew. Sustain. Energy Rev. 2013, 19, 742–753. [CrossRef]
19. Schmidt, J.; Cancella, R.; Pereira, A.O. An optimal mix of solar PV, wind and hydro power for a low-carbonelectricity supply in Brazil. Renew. Energy 2016, 85, 137–147. [CrossRef]
20. Silva, A.R.; Pimenta, F.M.; Assireu, A.T.; Spyrides, M.H.C. Complementarity of Brazil’s hydro and offshorewind power. Renew. Sustain. Energy Rev. 2016, 56, 413–427. [CrossRef]
21. Saporta, L.A.D.C. O Papel Dos Reservatórios de Hidroelétricas na Integração da Geração Eólica no Sistema InterligadoNacional; Universidade Federal do Rio de Janeiro: Rio de Janeiro, Brazil, 2017.
22. Lampreia, J.; de Araújo, M.S.M.; de Campos, C.P.; Freitas, M.A.V.; Rosa, L.P.; Solari, R.; Gesteira, C.; Ribas, R.;Silva, N.F. Analyses and perspectives for Brazilian low carbon technological development in the energysector. Renew. Sustain. Energy Rev. 2011, 15, 3432–3444. [CrossRef]
23. Andrade Guerra, J.B.S.O.D.; Dutra, L.; Schwinden, N.B.C.; Andrade, S.F.D. Future scenarios and trends inenergy generation in brazil: supply and demand and mitigation forecasts. J. Clean. Prod. 2015, 103, 197–210.[CrossRef]
24. Herreras Martínez, S.; Koberle, A.; Rochedo, P.; Schaeffer, R.; Lucena, A.; Szklo, A.; Ashina, S.;van Vuuren, D.P. Possible energy futures for Brazil and Latin America in conservative and stringentmitigation pathways up to 2050. Technol. Forecast. Soc. Chang. 2015, 98, 186–210. [CrossRef]
25. Lucena, A.F.P.; Clarke, L.; Schaeffer, R.; Szklo, A.; Rochedo, P.R.R.; Nogueira, L.P.P.; Daenzer, K.; Gurgel, A.;Kitous, A.; Kober, T. Climate policy scenarios in Brazil: A multi-model comparison for energy. Energy Econ.2016, 56, 564–574. [CrossRef]
26. Nogueira de Oliveira, L.P.; Rodriguez Rochedo, P.R.; Portugal-Pereira, J.; Hoffmann, B.S.; Aragão, R.;Milani, R.; de Lucena, A.F.P.; Szklo, A.; Schaeffer, R. Critical technologies for sustainable energy developmentin Brazil: Technological foresight based on scenario modelling. J. Clean. Prod. 2016, 130, 12–24. [CrossRef]
27. Miranda, R.; Soria, R.; Schaeffer, R.; Szklo, A.; Saporta, L. Contributions to the analysis of “Integrating largescale wind power into the electricity grid in the Northeast of Brazil”. Energy 2017, 118, 1198–1209. [CrossRef]
28. De Faria, F.A.M.; Jaramillo, P. The future of power generation in Brazil: An analysis of alternatives toAmazonian hydropower development. Energy Sustain. Dev. 2017, 41, 24–35. [CrossRef]
29. Lucena, A.; Szklo, A.; Schaeffer, R. Toward a Sustainable Energy Future in Brazil and IIASA’s MESSAGE MODEL;Instituto Alberto Luiz Coimbra de Pós-Graduação e Pesquisa em Engenharia/Universidade Federal do Riode Janeiro (COPPE/UFRJ): Vienna, Austria, 2017; p. 20.
30. Schaeffer, R.; Lucena, A.; Herniques, M.; Borba, B.; Freitas, M.; Haddad, E. Integrated Greenhouse Gas EmissionMitigation Scenarios for Brazil to 2050; GEF: Brasília, Brazil, 2017; p. 48.
31. Portugal-Pereira, J.; Köberle, A.C.; Soria, R.; Lucena, A.F.; Szklo, A.; Schaeffer, R. Overlooked impacts ofelectricity expansion optimisation modelling: The life cycle side of the story. Energy 2016, 115, 1424–1435.[CrossRef]
32. Gils, H.C.; Scholz, Y.; Pregger, T.; Luca de Tena, D.; Heide, D. Integrated modelling of variable renewableenergy-based power supply in Europe. Energy 2017, 123, 173–188. [CrossRef]
33. Lindfeldt, E.G.; Saxe, M.; Magnusson, M.; Mohseni, F. Strategies for a road transport system based onrenewable resources—The case of an import-independent Sweden in 2025. Appl. Energy 2010, 87, 1836–1845.[CrossRef]
34. Taibi, E.; Gielen, D.; Bazilian, M. The potential for renewable energy in industrial applications. Renew.Sustain. Energy Rev. 2012, 16, 735–744. [CrossRef]
35. Connolly, D.; Lund, H.; Mathiesen, B.V.; Leahy, M. The first step towards a 100% renewable energy-systemfor Ireland. Appl. Energy 2011, 88, 502–507. [CrossRef]

Energies 2017, 10, 1859 21 of 22
36. Mathiesen, B.V.; Lund, H.; Connolly, D.; Wenzel, H.; Østergaard, P.A.; Möller, B.; Nielsen, S.; Ridjan, I.;Karnøe, P.; Sperling, K.; et al. Smart Energy Systems for coherent 100% renewable energy and transportsolutions. Appl. Energy 2015, 145, 139–154. [CrossRef]
37. Gils, H.C.; Simon, S. Carbon neutral archipelago–100% renewable energy supply for the Canary Islands.Appl. Energy 2017, 188, 342–355. [CrossRef]
38. Gils, H.C. Economic potential for future demand response in Germany—Modeling approach and case study.Appl. Energy 2016, 162, 401–415. [CrossRef]
39. Empresa de Pesquisa Energéticas (EPE). Plano Decenal de Expansão 2024; Empresa de Pesquisa Energéticas:Rio de Janeiro, Brazil, 2015.
40. Operador Nacional do Sistema Elétrico (ONS). Plano de Operação Energética 2014/2018; Operador Nacional doSistema Elétrico: Brasília, Brazil, 2014.
41. Simon, S.; Naegler, T.; Gils, H.C. Transformation towards a renewable energy system in Brazil and Mexico.Renew. Sustain. Energy Rev. 2017. submitted.
42. Instituto Brasileiro de Geografia e Estatística (IBGE). Densidade Demográfica 2010. Instituto Brasileirode Geografia e Estatística, Diretoria De Geociências. Available online: ftp://geoftp.ibge.gov.br/cartas_e_mapas/mapas_do_brasil/sociedade_e_economia/mapas_murais/densidade_populacional_2010.pdf(accessed on 23 October 2017).
43. Instituto Brasileiro de Geografia e Estatística (IBGE). Contas Regionais do Brasil: 2010–2014. InstitutoBrasileiro de Geografia e Estatística, Diretoria De Pesquisas. Available online: https://biblioteca.ibge.gov.br/visualizacao/livros/liv98881.pdf (accessed on 23 October 2017).
44. Operador Nacional do Sistema Elétrico (ONS). Reporte da Modalidade de Operação de Usinas-Arquivo Excel“Modalidade Para o Site—Usinas Individualizadas” Operador Nacional do Sistema Elétrico. Available online:http://www.ons.org.br/integracao_sin/definicao_modalidade_de_operacao_de_usinas.aspx (accessed on1 October 2014).
45. Christian, H. Balancing of Intermittent Renewable Power Generation by Demand Response and Thermal EnergyStorage; Universität Stuttgart: Stuttgart, Germany, 2015.
46. Agência Nacional de Energia Elétrica (ANEEL). Banco de Informações de Geração. AgênciaNacional de Energia Elétrica. Available online: http://www2.aneel.gov.br/aplicacoes/capacidadebrasil/capacidadebrasil.cfm (accessed on 1 July 2016).
47. ONS. Definição da Modalidade de Operação de Usinas. Operador Nacional do Sistema Elétrico.Available online: http://www.ons.org.br/integracao_sin/definicao_modalidade_de_operacao_de_usinas.aspx(accessed on 1 January 2016).
48. Fundación Proteger. International Rivers; ECOA Dams in Amazonia. Available online: http://dams-info.org/en(accessed on 1 November 2017).
49. SIGEL ANEEL. Setor Elétrico Brasileiro 2017. Agência Nacional de Energia Elétrica. Available online:http://sigel.aneel.gov.br/sigel.html (accessed on 23 October 2017).
50. Stetter, D. Enhancement of the REMix Energy System Model: Global Renewable Energy Potentials, OptimizedPower Plant Siting and Scenario Validation. Ph.D. Thesis, University of Stuttgart, Stuttgart, Germany, 2014.
51. ONS. Histórico de Vazões—Série de Vazões Naturais Médias Diárias 1931–2012. Operador Nacional doSistema Elétrico. Available online: http://www.ons.org.br/operacao/vazoes_naturais.aspx (accessed on31 October 2014).
52. Assis, L.E.; Beluco, A.; de Almeida, L.E.B. On the wave energy potential along the southern coast of Brazil.Int. J. Energy Environ. 2014, 5, 59–66. [CrossRef]
53. United States Geological Survey (USGS). 2013 Minerals Yearbook, Brazil [Advance Release]; United StatesGeological Survey: Reston, VA, USA, 2016.
54. Associação Brasileira de Celulose e Papel (BRACELPA). Conjuntura Bracelpa, NO. 64, March 2014.Associação Brasileira de Celulose e Papel. Available online: http://www.paperage.com/2014news/Brazil_pulp_paper_sector_report_March2014.pdf (accessed on 1 November 2017).
55. Abiclor. Relatório Anual 2012. Indústria Brasileira de Álcalis, Cloro e Derivados. Available online:http://clorosur.org/wp-content/uploads/Abiclor-Relatorio-Estatistico-2012.pdf (accessed on 8 September 2017).
56. Empresa de Pesquisa Energéticas (EPE). Anuário Estatístico de Energia Elétrica 2014—Ano base 2013;Empresa de Pesquisa Energéticas: Rio de Janeiro, Brazil, 2014.

Energies 2017, 10, 1859 22 of 22
57. Gils, H.C. Assessment of the theoretical demand response potential in Europe. Energy 2014, 67, 1–18.[CrossRef]
58. ISE. Current and Future Cost of Photovoltaics; Long-Term Scenarios for Market Development, System Prices andLCOE of Utilityscale Pv-Systems; Fraunhofer-Institut für Solare Energiesysteme (Fhg-ISE): Freiburg, Germany;Agora Energiewende: Berlin, Germany, 2015.
59. International Renewable Energy Agency (IRENA). Renewable Power Generation Costs in 2014; InternationalRenewable Energy Agency: Abu Dhabi, UAE, 2015.
60. Danish Energy Agency (DEA). Technology Data for Energy Plants; Danish Energy Agency: Copenhagen,Denmark; Energinet.dk: Erritsø, Denmark, 2012.
61. Nitsch, J.; Pregger, T.; Naegler, T.; Heide, D.; Tena, D.L.D.; Trieb, F.; Scholz, Y.; Nienhaus, K.; Gerhardt, N.;Sterner, M.; et al. Langfristszenarien und Strategien für den Ausbau der erneuerbaren Energien in Deutschland beiBerücksichtigung der Entwicklung in Europa und Global; Deutsches Zentrum für Luft- und Raumfahrt: Stuttgart,Germany; Fraunhofer Institut für Windenergie und Energiesystemtechnik (IWES): Kassel, Germany;Ingenieurbüro für neue Energien (IFNE): Teltow, Germany, 2012.
62. Fuchs, G.; Lunz, B.; Leuthold, M.; Sauer, D.U. Technology Overview on Electricity Storage; Technical Report;ISEA: Aachen, Germany, 2012.
63. Noack, C.; Burggraf, F.; Hosseiny, S.S.; Lettenmeier, P.; Kolb, S.; Belz, S.; Kallo, J.; Friedrich, K.A.; Pregger, T.;Cao, K.-K. Studie Über Die Planung Einer Demonstrationsanlage Zur Wasserstoff-Kraftstoffgewinnung DurchElektrolyse mit Zwischenspeicherung in Salzkavernen unter Druck; German Aerospace Center: Stuttgart, Germany,2015.
64. Ministério das Minas e Energia (MME); Empresa de Pesquisa Energéticas (EPE). Estudos de Demanda deEnergia 2050: Nota Técnica DEA 13/14; Ministério das Minas e Energia, Empresa de Pesquisa EnergéticasBrasil: Rio de Janeiro, Brazil, 2014.
65. Fichter, T.; Soria, R.; Szklo, A.; Schaeffer, R.; Lucena, A.F.P. Assessing the potential role of concentrated solarpower (CSP) for the northeast power system of Brazil using a detailed power system model. Energy 2017,121, 695–715. [CrossRef]
66. Becker, S.; Rodriguez, R.A.; Andresen, G.B.; Schramm, S.; Greiner, M. Transmission grid extensions duringthe build-up of a fully renewable pan-European electricity supply. Energy 2014, 64, 404–418. [CrossRef]
67. Rasmussen, M.G.; Andresen, G.B.; Greiner, M. Storage and balancing synergies in a fully or highly renewablepan-European power system. Energy Policy 2012, 51, 642–651. [CrossRef]
68. Rodríguez, R.A.; Becker, S.; Andresen, G.B.; Heide, D.; Greiner, M. Transmission needs across a fullyrenewable European power system. Renew. Energy 2014, 63, 467–476. [CrossRef]
69. Rodriguez, R.A.; Becker, S.; Greiner, M. Cost-optimal design of a simplified, highly renewable pan-Europeanelectricity system. Energy 2015, 83, 658–668. [CrossRef]
70. Schaber, K.; Steinke, F.; Hamacher, T. Transmission grid extensions for the integration of variable renewableenergies in Europe: Who benefits where? Energy Policy 2012, 43, 123–135. [CrossRef]
71. Schaber, K.; Steinke, F.; Mühlich, P.; Hamacher, T. Parametric study of variable renewable energy integrationin Europe: Advantages and costs of transmission grid extensions. Energy Policy 2012, 42, 498–508. [CrossRef]
72. Scholz, Y.; Gils, H.C.; Pietzcker, R.C. Application of a high-detail energy system model to derive powersector characteristics at high wind and solar shares. Energy Econ. 2017, 64, 568–582. [CrossRef]
73. Soria, R.; Portugal-Pereira, J.; Szklo, A.; Milani, R.; Schaeffer, R. Hybrid concentrated solar power(CSP)–biomass plants in a semiarid region: A strategy for CSP deployment in Brazil. Energy Policy 2015, 86,57–72. [CrossRef]
74. Agência Nacional de Energia Elétrica (ANEEL). Banco de Preços, Módulos de linhas de Transmissão.Agência Nacional de Energia Elétrica. Available online: http://www.aneel.gov.br/cedoc/areh2009758.rar(accessed on 1 April 2015).
75. Trieb, F.; Schillings, C.; Pregger, T.; O’Sullivan, M. Solar electricity imports from the Middle East and NorthAfrica to Europe. Energy Policy 2012, 42, 341–353. [CrossRef]
76. Oswald, B.R. Elektrische Kraftwerke und Netze; Springer: Berlin/Heidelberg, Germany, 2011.
© 2017 by the authors. Licensee MDPI, Basel, Switzerland. This article is an open accessarticle distributed under the terms and conditions of the Creative Commons Attribution(CC BY) license (http://creativecommons.org/licenses/by/4.0/).


![E[R] - elib.dlr.de Revolution – Brazil 2016 .pdf · 1 E[R] Brazilian scenario 2016 Energy [R]evolution For a Brazil with 100% clean and renewable energy This is a translated summary](https://img.pdfslide.net/doc/110x75/5dd0be2dd6be591ccb627a2b/er-elibdlrde-revolution-a-brazil-2016-pdf-1-er-brazilian-scenario-2016.jpg)

![A 100% renewable energy system in the year 2050: The case ...repozitorij.fsb.hr/3543/1/A 100% renewable energy system...[17]; and recently, incentives for 100% renewable energy future](https://img.pdfslide.net/doc/110x75/6128b221d81260112f3313d3/a-100-renewable-energy-system-in-the-year-2050-the-case-100-renewable-energy.jpg)