Embed Size (px)
Citation preview
Renewable Concentrating Solar Power in Brazil andthe U.S.
James Robinson IVUniversity of Pittsburgh
Professor Sacre
July 25, 2008
Typset in LATEX
i
Executive Summary
Brazil has the third largest energy sector of the western hemisphere. Although the countryhas the second largest oil reserve in South America, Brazil has been in a position, in the past,where 34%-38% of their energy was imported. This has encouraged the use of other methods forenergy production including hydroelectric power to satisfy the electricity demand and ethanolproduction from sugar cane to satisfy the transportation energy demand. In California, hydro-electric power is not considered a renewable energy due to the impact on the land and riverlife. With such a high level of insolation in Brazil, the suggestion for solar renewable energy isa logical next step for the country to be energy independent.
Concentrating Solar Power (CSP) technologies have the advantage over solar photovoltaicthat they are not composed of heavy metals and the life cycle is more conducive for reuse and/orrecycling. Mirrored parabolic surfaces reflect sunlight to a receiver that transfers the sun’s pho-ton energy into heat. Two types of CSP are discussed, a solar dish-Stirling engine is a heatengine that has the advantage of producing power autonomously, each dish has the assembly toproduce electricity, therefore, this technology can be used for centralized or decentralized power.A parabolic solar trough (PST) concentrator has the advantage of using a heat transfer fluidthat can store heat and release it slowly enough to be useful during the night.
With the use of high voltage direct current (HVDC) transmission lines areas of less insolationcan still have reliable power that is transmitted from areas of high insolation. The furthest dis-tance of around 4000 km have losses of only 12%. Brazil already has the world’s most impressivespan of HVDC anywhere on Earth.
The domestic energy supply (DES) growth of Brazil is extremely high and their gross do-mestic product is relatively low, this makes it hard for the country to expand their technology tonew possibilities. What works for them now is comforting but this stability may not last long.Drought and severe hydrologic conditions may not sustain a large population of energy users.Although the government recognizes this danger and has proposed a 30 year national energyplan, solar power is not considered. The U.S. has a low DES and is rapidly expanding CSPtechnology into its power mix. This paper presents ideas that encourage the use of solar powerin Brazil for the near future.
ii
Contents
1 Introduction 11.1 Background of Brazil . . . . . . . . . . . . . . . . . . . . . . . . . . . . . . . . . . 2
1.1.1 History of Energy . . . . . . . . . . . . . . . . . . . . . . . . . . . . . . . 21.1.2 History of Electricity . . . . . . . . . . . . . . . . . . . . . . . . . . . . . . 31.1.3 Future of Electricity . . . . . . . . . . . . . . . . . . . . . . . . . . . . . . 4
2 Description of Concentrating Solar Power (CSP) Technologies 52.1 Basic Principles of Stirling Engines . . . . . . . . . . . . . . . . . . . . . . . . . . 5
2.1.1 Benefits . . . . . . . . . . . . . . . . . . . . . . . . . . . . . . . . . . . . . 72.1.2 Disadvantages . . . . . . . . . . . . . . . . . . . . . . . . . . . . . . . . . . 8
2.2 Solar Dish-Stirling Engines . . . . . . . . . . . . . . . . . . . . . . . . . . . . . . 82.3 Parabolic Solar Trough (PST) . . . . . . . . . . . . . . . . . . . . . . . . . . . . . 9
3 Economics, Government and Culture 93.1 Life Cycle Assessment (LCA) . . . . . . . . . . . . . . . . . . . . . . . . . . . . . 11
4 CSP in the United States 16
5 Conclusion 17
6 References 18
7 Appendix A: History of the Stirling Engine 20
8 Appendix B: Additional Data 20
List of Tables
1 Insolation of Brazil (kWhm2
day ) (Apricus, 2007) . . . . . . . . . . . . . . . . . . . . . . 202 Renewable energy summary of Brazil’s proposed National Energy Plan to be in
effect by 2030 (Huacuz and Medrano, 2007) . . . . . . . . . . . . . . . . . . . . . 213 The most impressive HVDC transmission line in the world; extending from Itaipu
Binacional to Sao Paulo (Rudervall et.al., unknown) . . . . . . . . . . . . . . . . 21
List of Figures
1 Electrical energy portfolio of Brazil (MME, 2006). . . . . . . . . . . . . . . . . . 12 Insolation map of Brazil. . . . . . . . . . . . . . . . . . . . . . . . . . . . . . . . . 23 Renewable energy capacity of Brazil (Huacuz and Medrano, 2007) . . . . . . . . 34 Power transmission lines in Brazil (MME, 2006) . . . . . . . . . . . . . . . . . . . 45 Future proposition of renewable electricity mix (MME, 2006) . . . . . . . . . . . 56 Piston-cylinder arrangement of a demonstration Stirling cycle in a test tube: steps
1-2 (Ross, 1977) . . . . . . . . . . . . . . . . . . . . . . . . . . . . . . . . . . . . . 57 Piston-cylinder arrangement of a demonstration Stirling cycle in a test tube: steps
3-4 (Ross, 1977) . . . . . . . . . . . . . . . . . . . . . . . . . . . . . . . . . . . . . 68 Piston-cylinder arrangement of a basic Stirling cycle heat engine (West, 1986) . . 7
iii
9 Piston-cylinder arrangement of a beta Stirling engine (West, 1986) . . . . . . . . 710 Piston-cylinder arrangement of a gamma Stirling engine (West, 1986) . . . . . . 811 CSP technology - Stirling-Dish assembly (Reinalter et. al., 2008) . . . . . . . . . 912 CSP technology- A single solar trough (energy.com.pk, 2007) . . . . . . . . . . . 1013 CSP technology- Solar Trough System (energy.com.pk, 2007) . . . . . . . . . . . 1014 The Gross Domestic Product and Domestic Energy Supply of select countries
(MME, 2006) . . . . . . . . . . . . . . . . . . . . . . . . . . . . . . . . . . . . . . 1115 Cost per distance of AC vs. HVDC transmission lines (Rudervall et.al., unknown) 1216 A distance scale for transmission lines in Brazil (MME, 2006) . . . . . . . . . . . 1217 Energy flow of solar dish-Stirling engines (Reinalter, et. al., 2008) . . . . . . . . . 1318 Production cost of renewable technologies (TREC, 2006) . . . . . . . . . . . . . . 1419 Installation costs of renewable technologies (Huacuz and Medrano, 2007) . . . . . 1420 External costs of future technologies (Krewitt, 2008) . . . . . . . . . . . . . . . . 1521 LCA - Carbon dioxide emissions of renewable technologies (TREC, 2006) . . . . 1522 LCA - Greenhouse gas emissions of renewable technologies (TREC, 2006) . . . . 1623 Southern California Edison 1000 kW model of a potential 850 MW system (SCE,
2005) . . . . . . . . . . . . . . . . . . . . . . . . . . . . . . . . . . . . . . . . . . . 1624 HVDC transmission line distances in the U.S. originating from the southwest
(Price, 2007). . . . . . . . . . . . . . . . . . . . . . . . . . . . . . . . . . . . . . . 17
iv
1 Introduction
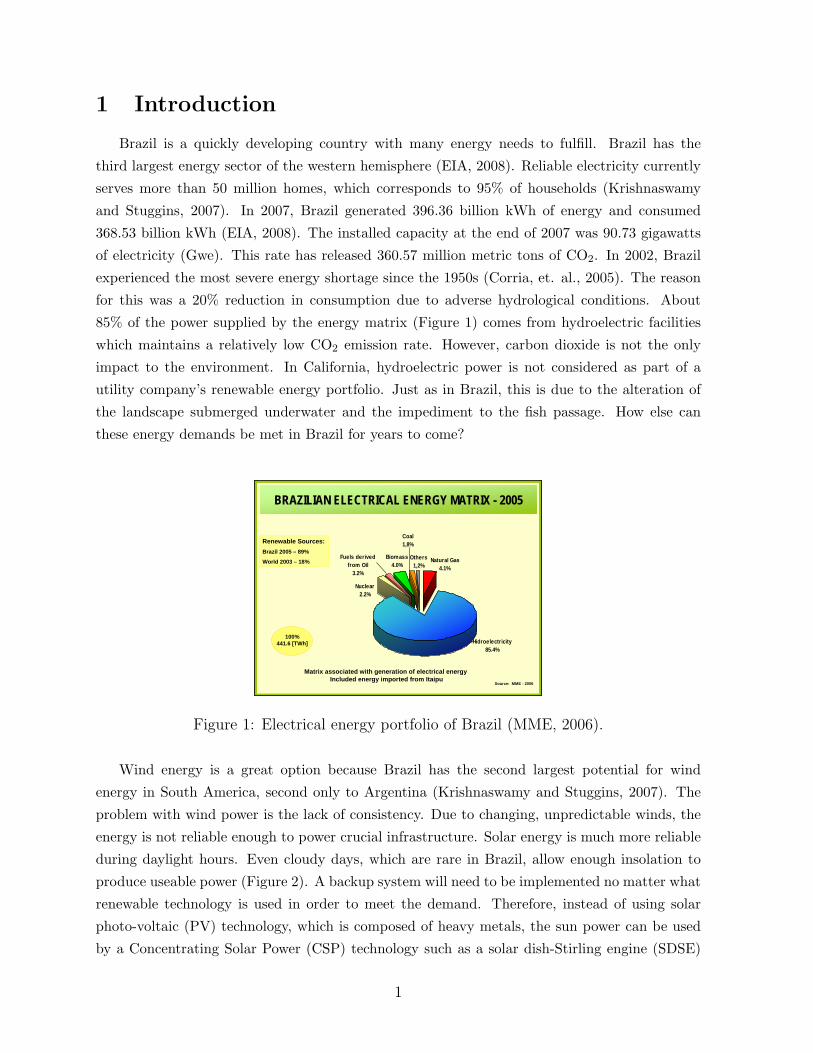
Brazil is a quickly developing country with many energy needs to fulfill. Brazil has the
third largest energy sector of the western hemisphere (EIA, 2008). Reliable electricity currently
serves more than 50 million homes, which corresponds to 95% of households (Krishnaswamy
and Stuggins, 2007). In 2007, Brazil generated 396.36 billion kWh of energy and consumed
368.53 billion kWh (EIA, 2008). The installed capacity at the end of 2007 was 90.73 gigawatts
of electricity (Gwe). This rate has released 360.57 million metric tons of CO2. In 2002, Brazil
experienced the most severe energy shortage since the 1950s (Corria, et. al., 2005). The reason
for this was a 20% reduction in consumption due to adverse hydrological conditions. About
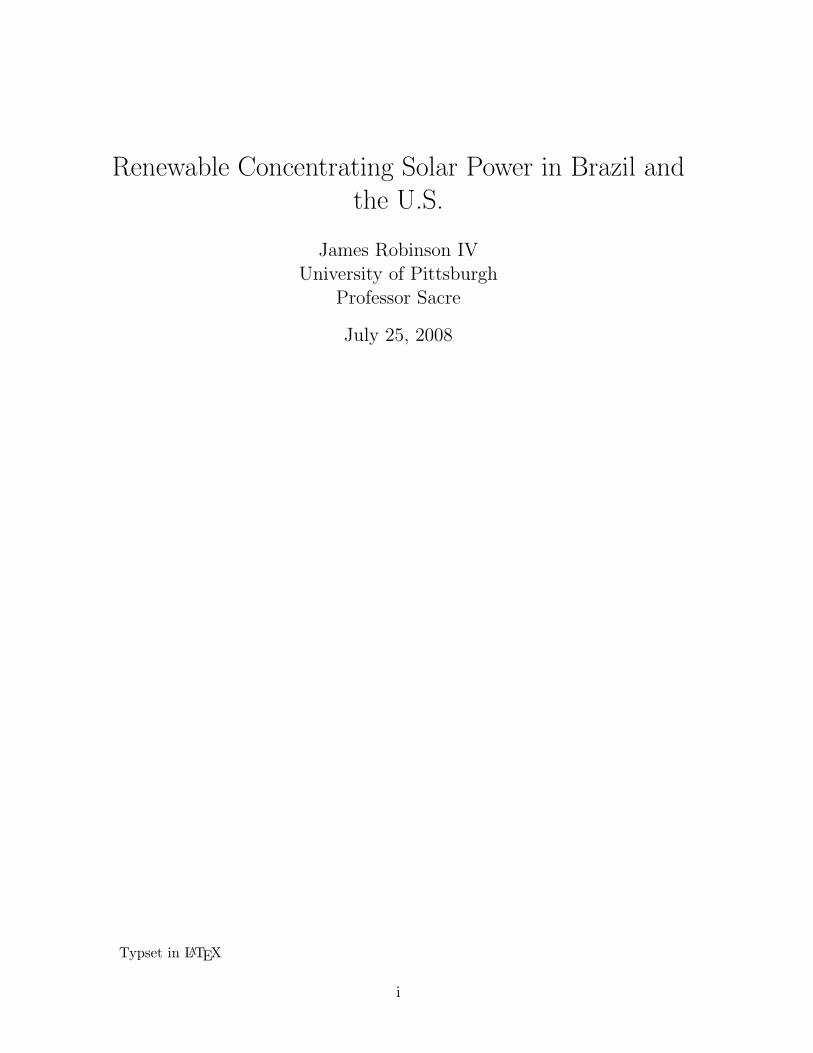
85% of the power supplied by the energy matrix (Figure 1) comes from hydroelectric facilities
which maintains a relatively low CO2 emission rate. However, carbon dioxide is not the only
impact to the environment. In California, hydroelectric power is not considered as part of a
utility company’s renewable energy portfolio. Just as in Brazil, this is due to the alteration of
the landscape submerged underwater and the impediment to the fish passage. How else can
these energy demands be met in Brazil for years to come?
4
Source: MME - 2006
Biomass4.0%
Nuclear2.2%
Fuels derived from Oil
3.2%
Coal1,8%
Others1,2%
Natural Gas4.1%
Hidroelectricity85.4%
Matrix associated with generation of electrical energy Included energy imported from Itaipu
100%441.6 [TWh]
Renewable Sources:Brazil 2005 – 89%
World 2003 – 18%
BRAZILIAN ELECTRICAL ENERGY MATRIX - 2005
100
83
64
61
60
55
45
37
21
18
16
11
6
4
1
25
0 20 40 60 80 100
France
Germany
Japan
Norway
USA
Sweden
Italy
Canada
BRAZIL
India
Colombia
China
Russia
Peru
Indonesia
Congo
Source: World Energy Council (1999);ANEEL (2002)
28 ~ 71,000 MW
EXPLOITED HYDROELECTRIC POWER
%
Figure 1: Electrical energy portfolio of Brazil (MME, 2006).
Wind energy is a great option because Brazil has the second largest potential for wind
energy in South America, second only to Argentina (Krishnaswamy and Stuggins, 2007). The
problem with wind power is the lack of consistency. Due to changing, unpredictable winds, the
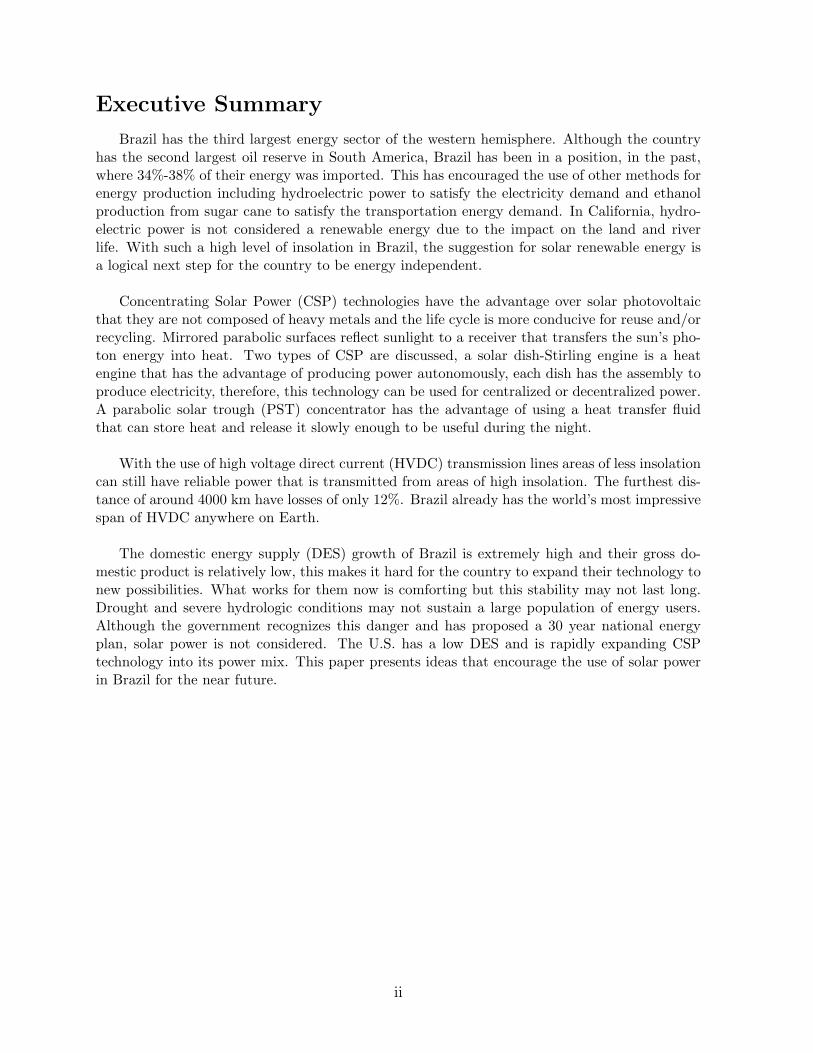
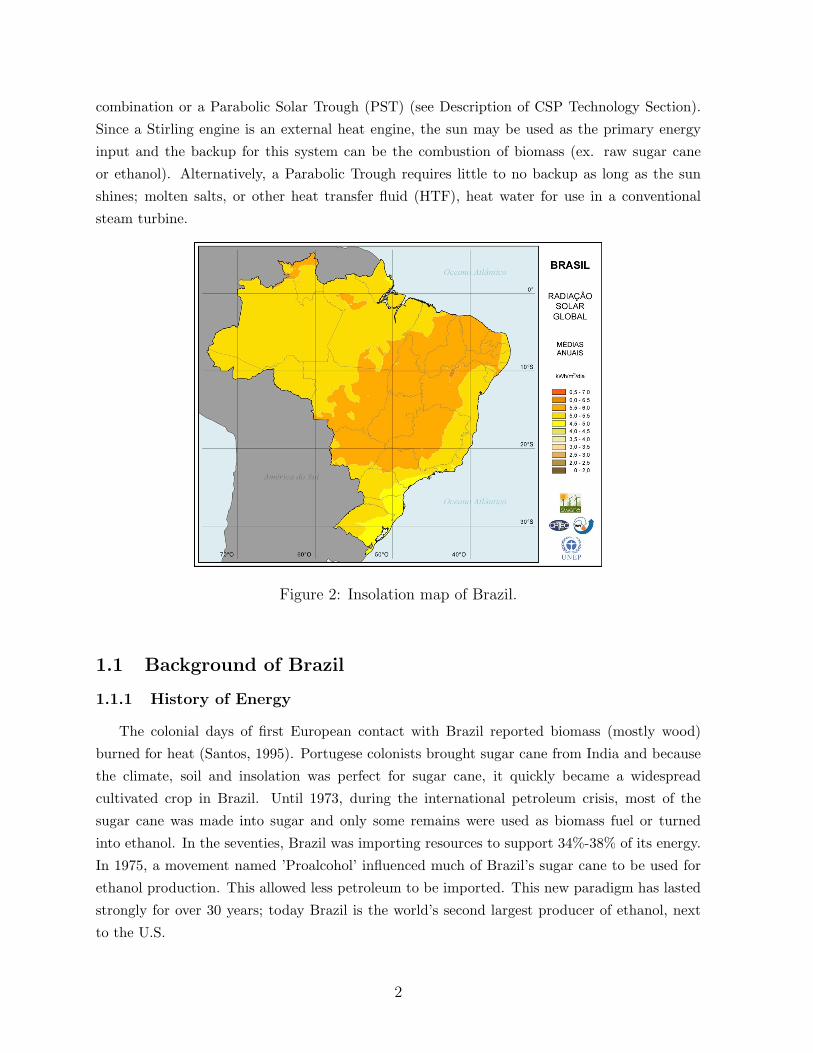
energy is not reliable enough to power crucial infrastructure. Solar energy is much more reliable
during daylight hours. Even cloudy days, which are rare in Brazil, allow enough insolation to
produce useable power (Figure 2). A backup system will need to be implemented no matter what
renewable technology is used in order to meet the demand. Therefore, instead of using solar
photo-voltaic (PV) technology, which is composed of heavy metals, the sun power can be used
by a Concentrating Solar Power (CSP) technology such as a solar dish-Stirling engine (SDSE)
1
combination or a Parabolic Solar Trough (PST) (see Description of CSP Technology Section).
Since a Stirling engine is an external heat engine, the sun may be used as the primary energy
input and the backup for this system can be the combustion of biomass (ex. raw sugar cane
or ethanol). Alternatively, a Parabolic Trough requires little to no backup as long as the sun
shines; molten salts, or other heat transfer fluid (HTF), heat water for use in a conventional
steam turbine.
Figure 2: Insolation map of Brazil.
1.1 Background of Brazil
1.1.1 History of Energy
The colonial days of first European contact with Brazil reported biomass (mostly wood)
burned for heat (Santos, 1995). Portugese colonists brought sugar cane from India and because
the climate, soil and insolation was perfect for sugar cane, it quickly became a widespread
cultivated crop in Brazil. Until 1973, during the international petroleum crisis, most of the
sugar cane was made into sugar and only some remains were used as biomass fuel or turned
into ethanol. In the seventies, Brazil was importing resources to support 34%-38% of its energy.
In 1975, a movement named ’Proalcohol’ influenced much of Brazil’s sugar cane to be used for
ethanol production. This allowed less petroleum to be imported. This new paradigm has lasted
strongly for over 30 years; today Brazil is the world’s second largest producer of ethanol, next
to the U.S.
2
1.1.2 History of Electricity
Ethanol, however, does not support the electricity generation capacity, it is primarily used
for transportation. Brazil’s main source for electrical energy comes from hydroelectric genera-
tion (Corria, et. al., 2005). Although an estimated 170 GW of hydroelectric potential remains,
all of the attractive resources have already been developed (Krishnaswamy and Stuggins, 2007).
Due to the limited future possibilities of hydroelectricity and the future scare of shortage due
to drought, Brazil has instigated the Program of Incentives for Alternative Electricity Sources
(Programa de Incentivo a Fontes Alternativas de Energia Eltrica – PROINFA). Although the
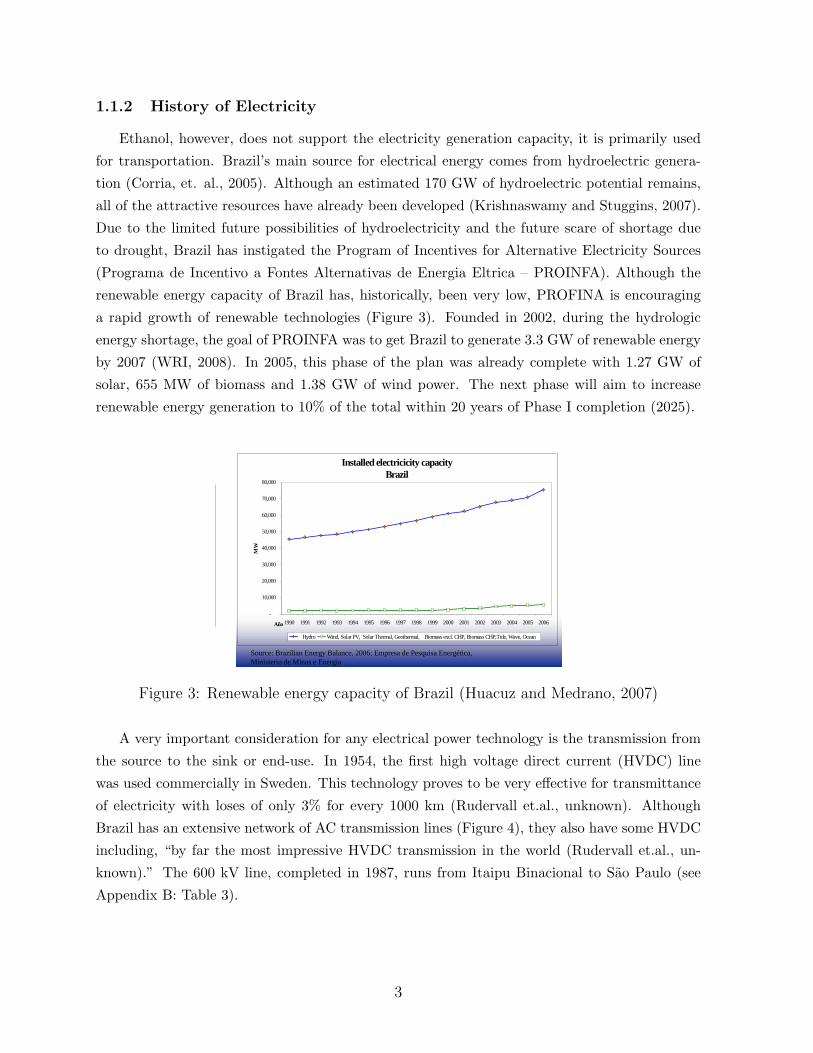
renewable energy capacity of Brazil has, historically, been very low, PROFINA is encouraging
a rapid growth of renewable technologies (Figure 3). Founded in 2002, during the hydrologic
energy shortage, the goal of PROINFA was to get Brazil to generate 3.3 GW of renewable energy
by 2007 (WRI, 2008). In 2005, this phase of the plan was already complete with 1.27 GW of
solar, 655 MW of biomass and 1.38 GW of wind power. The next phase will aim to increase
renewable energy generation to 10% of the total within 20 years of Phase I completion (2025).
Mexico: Installed Generating Capacity
0.0
5,000.0
10,000.0
15,000.0
20,000.0
25,000.0
30,000.0
35,000.0
40,000.0
1990
1991
1992
1993
1994
1995
1996
1997
1998
1999
2000
2001
2002
2003
2004
2005
2006
MW
Conventional Renewable
Brazil: Installed Generating Capacity
0
10,000
20,000
30,000
40,000
50,000
60,000
70,000
80,000
90,000
1990
1991
1992
1993
1994
1995
1996
1997
1998
1999
2000
2001
2002
2003
2004
2005
MW
Conventional Renewable
Renewable Electricicity Generating Capacity Mexico
0
2000
4000
6000
8000
10000
12000
1990 1991 1992 1993 1994 1995 1996 1997 1998 1999 2000 2001 2002 2003 2004 2005 2006Año
MW
Hydro
Wind
Solar PV
Geothermal
Biomass excl. CHP (Biogas)
Biomass CHP
Installed electricicity capacityBrazil
-
10,000
20,000
30,000
40,000
50,000
60,000
70,000
80,000
1990 1991 1992 1993 1994 1995 1996 1997 1998 1999 2000 2001 2002 2003 2004 2005 2006Año
MW
Hydro Wind, Solar PV, Solar Thermal, Geothermal, Biomass excl. CHP, Biomass CHP,Tide, Wave, Ocean
Contribution of Renewables to Power Generating Capacity
Source: Brazilian Energy balance, 2006; Empresa de Pesquisa Energética, Ministerio de Minas e Energia
Source: Brazilian Energy Balance, 2006; Empresa de Pesquisa Energética, Ministerio de Minas e Energia
Source: Balance Nacional de Energía 2005. Secretaría de Energía, 2006
http://www.sener.gob.mxhttp://sie.energia.gob.mx/sie/bdiController?action=login
Figure 3: Renewable energy capacity of Brazil (Huacuz and Medrano, 2007)
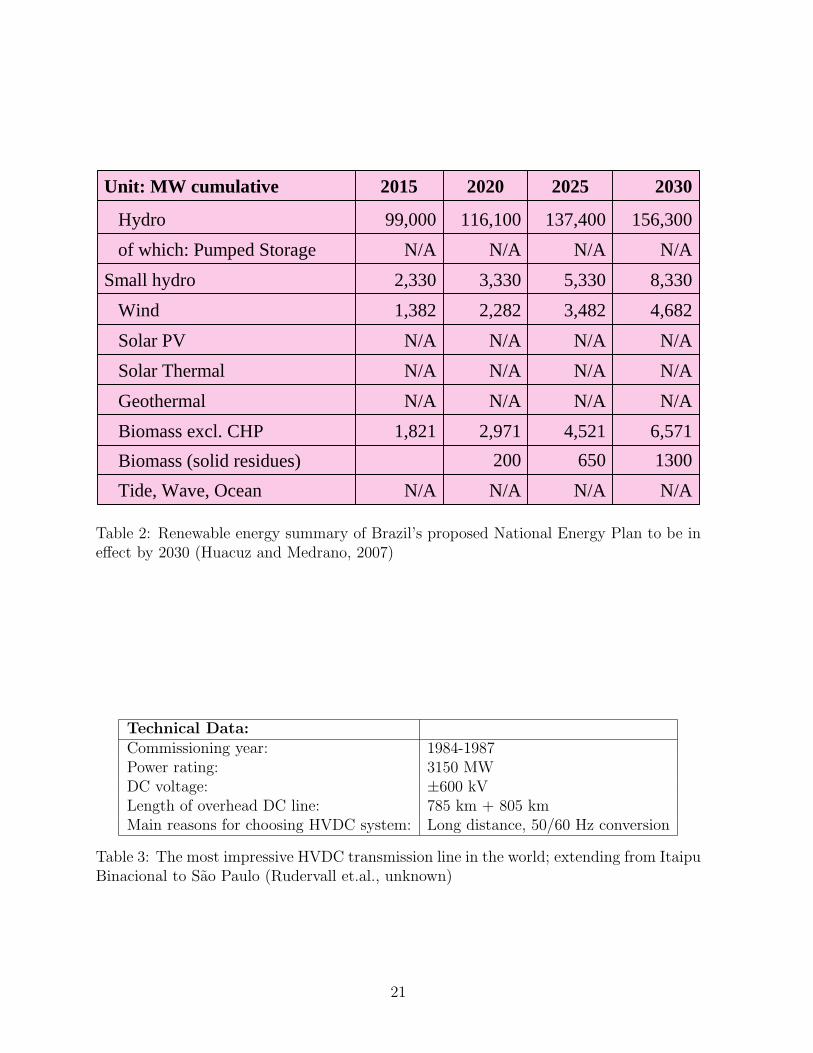
A very important consideration for any electrical power technology is the transmission from
the source to the sink or end-use. In 1954, the first high voltage direct current (HVDC) line
was used commercially in Sweden. This technology proves to be very effective for transmittance
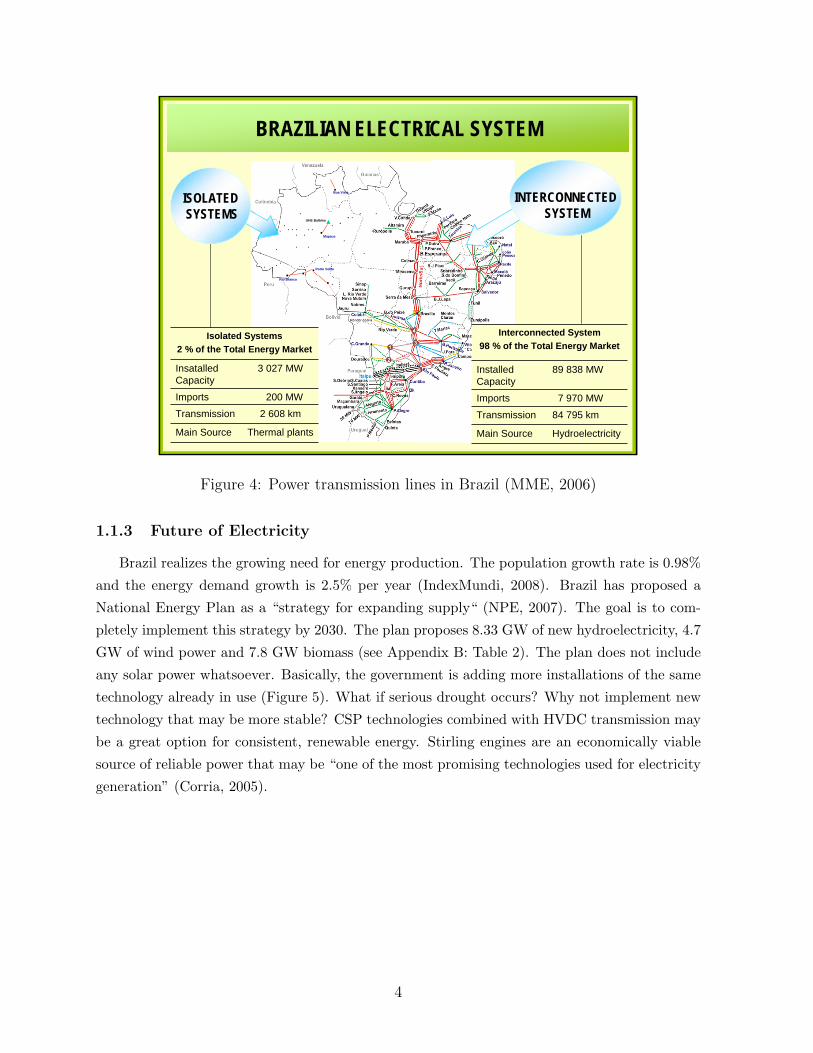
of electricity with loses of only 3% for every 1000 km (Rudervall et.al., unknown). Although
Brazil has an extensive network of AC transmission lines (Figure 4), they also have some HVDC
including, “by far the most impressive HVDC transmission in the world (Rudervall et.al., un-
known).” The 600 kV line, completed in 1987, runs from Itaipu Binacional to Sao Paulo (see
Appendix B: Table 3).
3
3
BRAZILIAN ELECTRICAL SYSTEM
.Porto Velho
.Manaus
UHE Balbina
.. .. ..
..
.. . .. .
. ..
. ..
.
.
.
.
.
.
...Rio Branco
.
.Boa Vista
.
.... . .
. .
Thermal plantsMain Source
Isolated Systems 2 % of the Total Energy Market
2 608 kmTransmission
200 MWImports
3 027 MWInsatalled Capacity
HydroelectricityMain Source
Interconnected System98 % of the Total Energy Market
84 795 kmTransmission
7 970 MWImports
89 838 MWInstalled Capacity
ISOLATEDSYSTEMS
INTERCONNECTEDSYSTEM
BRAZILIAN ELECTRICAL SYSTEM
Continental Dimensions
4 000 km
Systems Stand-alones
4 000 km 4 000 km~2 480 Miles ~2 480 Miles
Figure 4: Power transmission lines in Brazil (MME, 2006)
1.1.3 Future of Electricity
Brazil realizes the growing need for energy production. The population growth rate is 0.98%
and the energy demand growth is 2.5% per year (IndexMundi, 2008). Brazil has proposed a
National Energy Plan as a “strategy for expanding supply“ (NPE, 2007). The goal is to com-
pletely implement this strategy by 2030. The plan proposes 8.33 GW of new hydroelectricity, 4.7
GW of wind power and 7.8 GW biomass (see Appendix B: Table 2). The plan does not include
any solar power whatsoever. Basically, the government is adding more installations of the same
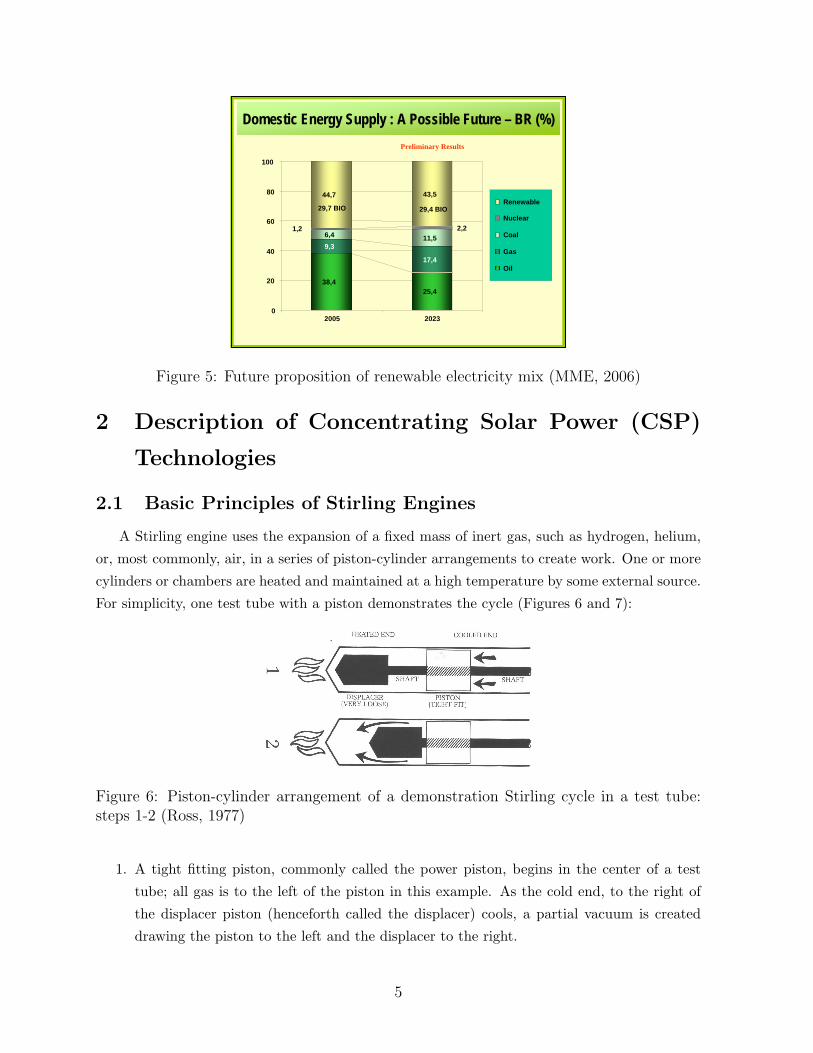
technology already in use (Figure 5). What if serious drought occurs? Why not implement new
technology that may be more stable? CSP technologies combined with HVDC transmission may
be a great option for consistent, renewable energy. Stirling engines are an economically viable
source of reliable power that may be “one of the most promising technologies used for electricity
generation” (Corria, 2005).
4
9
Source: MME/EPE/BEN 2005
Total 1988: 144.438 103 toe Total 2004: 213.370 103 toe
49.6%50.4%
52.4%
47.6%
56.4%
43.6%
59.0%
41.0%
56.4%
43.6%
5%
15%
25%
35%
45%
55%
65%
1988 1992 1996 2000 2004
RenewableNon-Renewable
Renewable Share 1988 - 2004
38,425,4
9,3
17,4
6,4 11,5
44,7 43,5
1,2 2,2
0
20
40
60
80
100
2005 2023
29,7 BIO 29,4 BIORenewable
Nuclear
Coal
Gas
Oil
Preliminary Results
Domestic Energy Supply : A Possible Future – BR (%)
Figure 5: Future proposition of renewable electricity mix (MME, 2006)
2 Description of Concentrating Solar Power (CSP)
Technologies
2.1 Basic Principles of Stirling Engines
A Stirling engine uses the expansion of a fixed mass of inert gas, such as hydrogen, helium,
or, most commonly, air, in a series of piston-cylinder arrangements to create work. One or more
cylinders or chambers are heated and maintained at a high temperature by some external source.
For simplicity, one test tube with a piston demonstrates the cycle (Figures 6 and 7):
HEATED END COOLED END
1 I-
UISPLACEK PISTON (VERY LUOSE) [TIGHT FIT)
Figure 6: Piston-cylinder arrangement of a demonstration Stirling cycle in a test tube:steps 1-2 (Ross, 1977)
1. A tight fitting piston, commonly called the power piston, begins in the center of a test
tube; all gas is to the left of the piston in this example. As the cold end, to the right of
the displacer piston (henceforth called the displacer) cools, a partial vacuum is created
drawing the piston to the left and the displacer to the right.
5
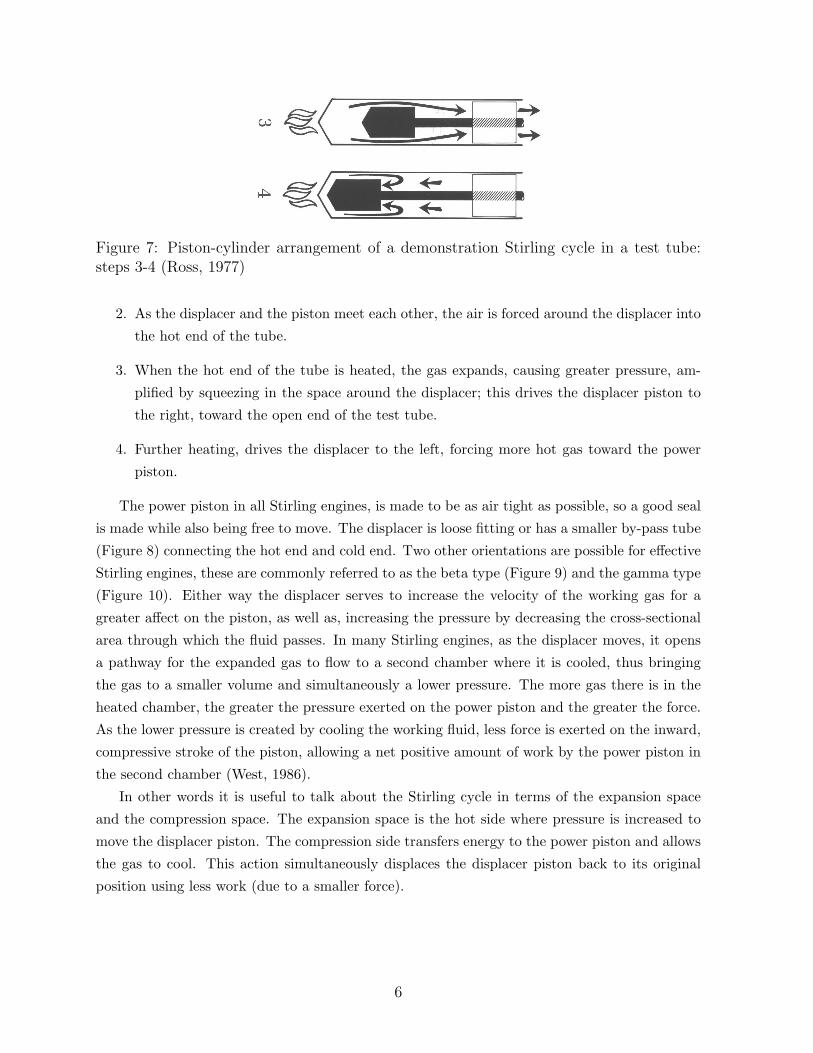
Figure 7: Piston-cylinder arrangement of a demonstration Stirling cycle in a test tube:steps 3-4 (Ross, 1977)
2. As the displacer and the piston meet each other, the air is forced around the displacer into
the hot end of the tube.
3. When the hot end of the tube is heated, the gas expands, causing greater pressure, am-
plified by squeezing in the space around the displacer; this drives the displacer piston to
the right, toward the open end of the test tube.
4. Further heating, drives the displacer to the left, forcing more hot gas toward the power
piston.
The power piston in all Stirling engines, is made to be as air tight as possible, so a good seal
is made while also being free to move. The displacer is loose fitting or has a smaller by-pass tube
(Figure 8) connecting the hot end and cold end. Two other orientations are possible for effective
Stirling engines, these are commonly referred to as the beta type (Figure 9) and the gamma type
(Figure 10). Either way the displacer serves to increase the velocity of the working gas for a
greater affect on the piston, as well as, increasing the pressure by decreasing the cross-sectional
area through which the fluid passes. In many Stirling engines, as the displacer moves, it opens
a pathway for the expanded gas to flow to a second chamber where it is cooled, thus bringing
the gas to a smaller volume and simultaneously a lower pressure. The more gas there is in the
heated chamber, the greater the pressure exerted on the power piston and the greater the force.
As the lower pressure is created by cooling the working fluid, less force is exerted on the inward,
compressive stroke of the piston, allowing a net positive amount of work by the power piston in
the second chamber (West, 1986).
In other words it is useful to talk about the Stirling cycle in terms of the expansion space
and the compression space. The expansion space is the hot side where pressure is increased to
move the displacer piston. The compression side transfers energy to the power piston and allows
the gas to cool. This action simultaneously displaces the displacer piston back to its original
position using less work (due to a smaller force).
6
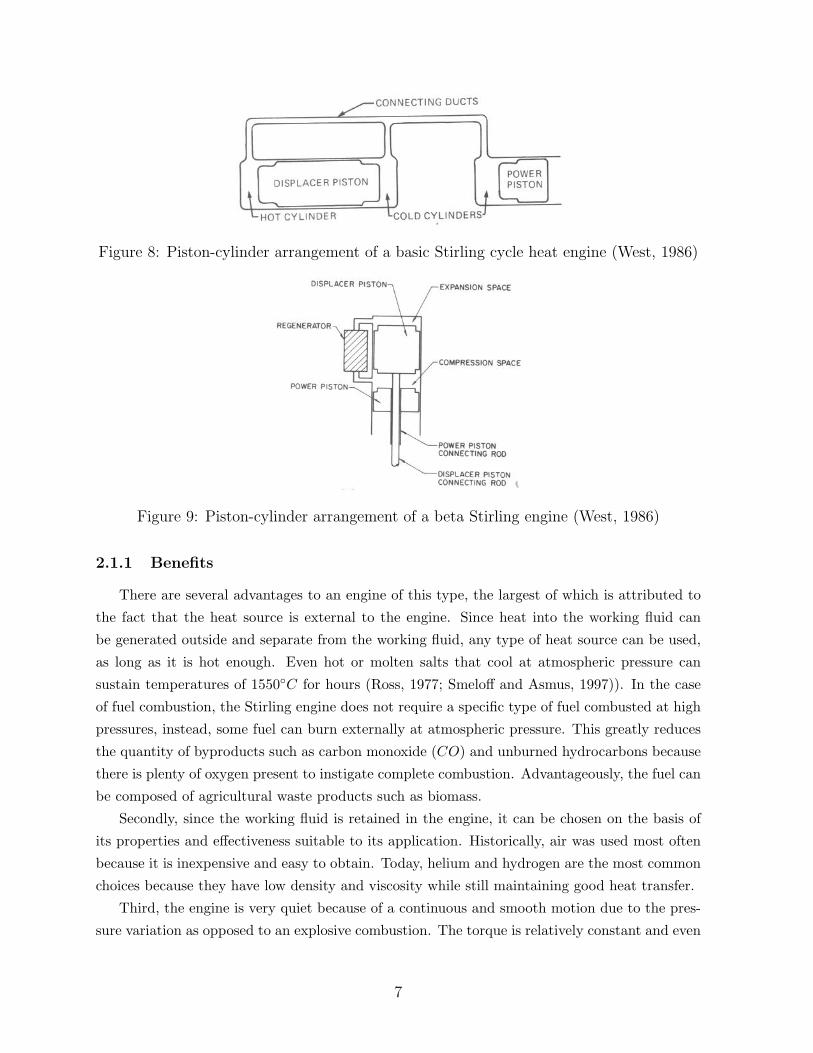
Figure 8: Piston-cylinder arrangement of a basic Stirling cycle heat engine (West, 1986)
Figure 9: Piston-cylinder arrangement of a beta Stirling engine (West, 1986)
2.1.1 Benefits
There are several advantages to an engine of this type, the largest of which is attributed to
the fact that the heat source is external to the engine. Since heat into the working fluid can
be generated outside and separate from the working fluid, any type of heat source can be used,
as long as it is hot enough. Even hot or molten salts that cool at atmospheric pressure can
sustain temperatures of 1550◦C for hours (Ross, 1977; Smeloff and Asmus, 1997)). In the case
of fuel combustion, the Stirling engine does not require a specific type of fuel combusted at high
pressures, instead, some fuel can burn externally at atmospheric pressure. This greatly reduces
the quantity of byproducts such as carbon monoxide (CO) and unburned hydrocarbons because
there is plenty of oxygen present to instigate complete combustion. Advantageously, the fuel can
be composed of agricultural waste products such as biomass.
Secondly, since the working fluid is retained in the engine, it can be chosen on the basis of
its properties and effectiveness suitable to its application. Historically, air was used most often
because it is inexpensive and easy to obtain. Today, helium and hydrogen are the most common
choices because they have low density and viscosity while still maintaining good heat transfer.
Third, the engine is very quiet because of a continuous and smooth motion due to the pres-
sure variation as opposed to an explosive combustion. The torque is relatively constant and even
7
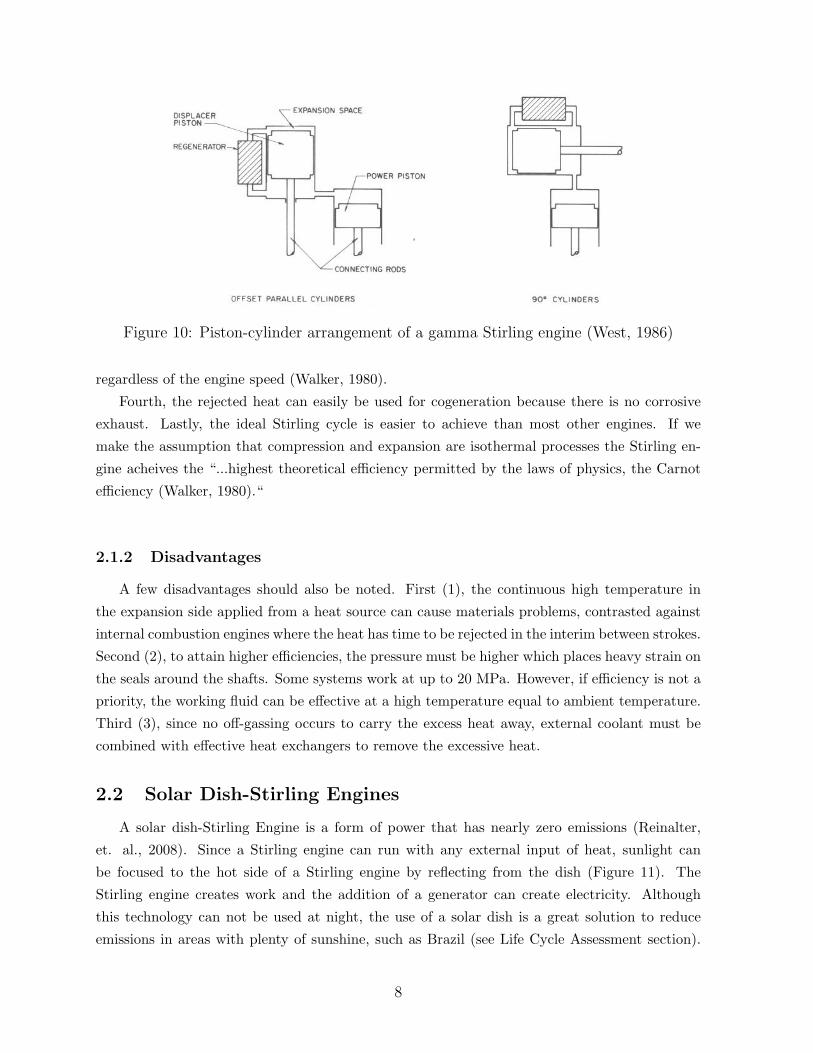
Figure 10: Piston-cylinder arrangement of a gamma Stirling engine (West, 1986)
regardless of the engine speed (Walker, 1980).
Fourth, the rejected heat can easily be used for cogeneration because there is no corrosive
exhaust. Lastly, the ideal Stirling cycle is easier to achieve than most other engines. If we
make the assumption that compression and expansion are isothermal processes the Stirling en-
gine acheives the “...highest theoretical efficiency permitted by the laws of physics, the Carnot
efficiency (Walker, 1980).“
2.1.2 Disadvantages
A few disadvantages should also be noted. First (1), the continuous high temperature in
the expansion side applied from a heat source can cause materials problems, contrasted against
internal combustion engines where the heat has time to be rejected in the interim between strokes.
Second (2), to attain higher efficiencies, the pressure must be higher which places heavy strain on
the seals around the shafts. Some systems work at up to 20 MPa. However, if efficiency is not a
priority, the working fluid can be effective at a high temperature equal to ambient temperature.
Third (3), since no off-gassing occurs to carry the excess heat away, external coolant must be
combined with effective heat exchangers to remove the excessive heat.
2.2 Solar Dish-Stirling Engines
A solar dish-Stirling Engine is a form of power that has nearly zero emissions (Reinalter,
et. al., 2008). Since a Stirling engine can run with any external input of heat, sunlight can
be focused to the hot side of a Stirling engine by reflecting from the dish (Figure 11). The
Stirling engine creates work and the addition of a generator can create electricity. Although
this technology can not be used at night, the use of a solar dish is a great solution to reduce
emissions in areas with plenty of sunshine, such as Brazil (see Life Cycle Assessment section).
8
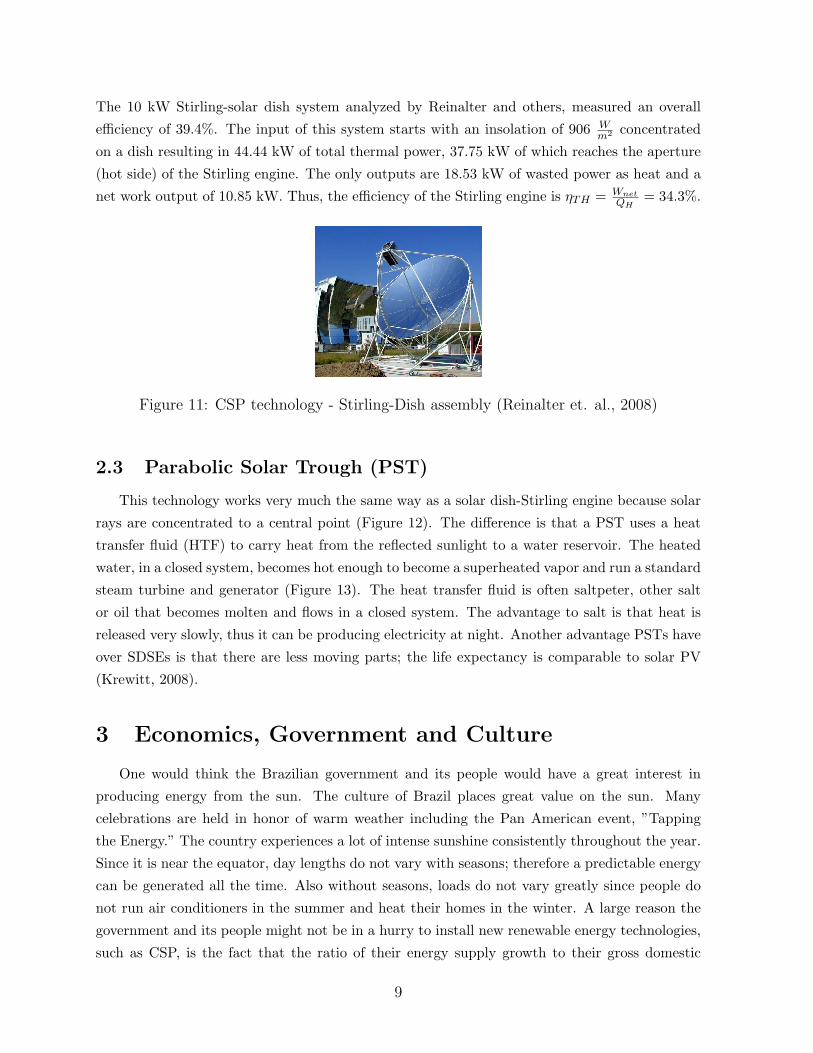
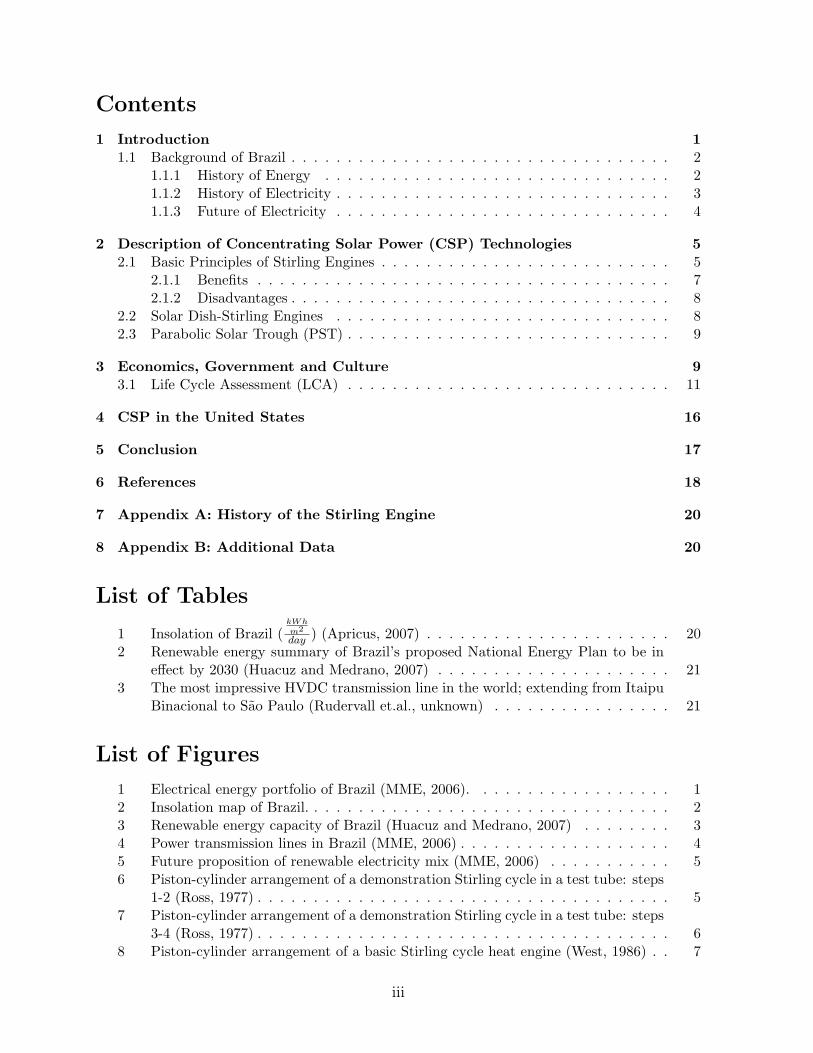
The 10 kW Stirling-solar dish system analyzed by Reinalter and others, measured an overall
efficiency of 39.4%. The input of this system starts with an insolation of 906 Wm2 concentrated
on a dish resulting in 44.44 kW of total thermal power, 37.75 kW of which reaches the aperture
(hot side) of the Stirling engine. The only outputs are 18.53 kW of wasted power as heat and a
net work output of 10.85 kW. Thus, the efficiency of the Stirling engine is ηTH = WnetQH
= 34.3%.
deduced. The thermal output of the engine can be measured com-bining precise temperature and flow measurements of the coolingwater to a calorimetric measurement.
Insolation Data MeasurementThe exact measurement of the direct normal insolation is cru-
cial for the whole measurement series. It is obtained from anactinometric station placed on top of the Odeillo big solar furnacea few hundred meters away from the dish/Stirling system. Thesolar part of the station is equipped with three sensors, a normalincident pyrheliometer �EPPLEY� to measure the direct normalinsolation �I� and two CM6 �Kipp & Zonen� pyranometers in or-der to obtain the global horizontal �G� and diffuse horizontal �D�insolation. The sensors are periodically calibrated at the laborato-ries of Carpantras, which is part of the Météo-France network andin possession of an absolute radiometer on the international radio-metric scale. The measurement uncertainties are about 1.5% forthe pyrheliometer and 3.5% for the pyranometers �1�.
Flux-Mapping SystemA flux measuring system for dish/Stirling systems developed by
DLR was used to map the flux distributions close to the focalplane. It consists basically of a Lambertian target placed in thebeam path, a charge coupled device �CCD� camera, and a com-puter that controls target positioning and image acquisition. Thetarget is made up of a water-cooled aluminum plate with aplasma-sprayed alumina coating, which is close to ideal diffusereflection properties. A Peltier-cooled slow-scan CCD camera ismounted in the central hole of the concentrator taking pictures ofthe illuminated target. The acquired images are automatically pro-cessed and evaluated in the image analysis program OPTIMAS®.Image calibration is achieved by calculating the total reflectedpower coming from the dish and relating it to the integrated grayvalues measured on the target in the focal plane. This calibrationmethod assumes that the target in the focal plane intercepts all thesunlight reflected by the dish. Simulations for the given case
proved that spillage is almost negligible being less than 1% evenfor bad sunshapes. Error analysis resulted in a calibration uncer-tainty of ±2.5% and local measurement uncertainties of −2.5% to+8.5% for this measurement system �2,3�.
Cooling Power Measurement SystemTo precisely measure the power evacuated by the cooling sys-
tem, the change of coolant enthalpy between water inlet and outletwas determined, and the mass flow was measured. A mixingchamber was connected to the outlet and a temperature sensorplaced at the outlet of this chamber to guarantee a homogeneoustemperature in the outlet stream. At the motor inlet, a proper mix-ing was assumed due to the short distance between the circulationpump and the motor inlet. Thus, the sensor was simply placed inthe center of the inlet water tube.
The sensors used were high precision PT100 1/10 DIN B ac-cording IEC751 with an accuracy of ±0.013 K. Their signal wasmeasured with an ICP DAS model I-7033 in four wire configura-tion with an accuracy of 0.1%. An additional calibration was con-ducted by adjusting their temperature difference signal to zerowith the water pump switched on and the engine in stow position.A noise of 0.05°C under static conditions was measured.
An electromagnetic flowmeter was selected to determine themass flow of the coolant. This device is able to measure the flowof conductive liquids regardless of their composition with veryhigh precision. The flowmeter was installed according to themanufacturer’s specifications and its inner diameter is the same asthe main rectilinear return pipe in order to be in unruliness state.The low liquid temperature and the expansion vessel in the cool-ing circuit prevent appearance of bubbles.
The Siemens Sitran MAG 3100 with a maximum flow rate of5000 l /h and the electronic evaluation unit �MAG 6000� has aspecified precision of ±0.5%. The calibration report indicates amaximum error of ±0.17% from 25% to 91% of the full scaleflow.
The measurements were taken in winter with negative outsidetemperatures. The cooling mixture used is a standard automotive-type ELAN FLUID D with full protection down to −26°C. Sincethe exact composition was not known, a sample was taken andanalyzed by the French Laboratoire National d’Essais. The mea-sured heat capacity as function of the temperature had an unex-pected high uncertainty of ±4%. The mean density was deter-mined to be 1060 kg /m3.
Electric Power Measurement SystemMeasurements of the electric power output of the generator and
the consumption of the individual components were performedusing a WEIGEL DUW 2.0 power transducer together with therecommended transformers �30 /1� for the current measurementinputs. With a true three-phase conversion of the current and volt-age inputs, this device guarantees an absolute correct result of themeasurements within the accuracy class of ±0.5%. Since thetransducer was placed at the output of the Stirling engine’s electriccircuit and therefore measures the net output, the constant con-
Fig. 1 The CNRS EuroDish System
Fig. 2 Energy flow in a dish/Stirling system
011013-2 / Vol. 130, FEBRUARY 2008 Transactions of the ASME
Downloaded 16 Apr 2008 to 137.150.173.106. Redistribution subject to ASME license or copyright; see http://www.asme.org/terms/Terms_Use.cfm
Figure 11: CSP technology - Stirling-Dish assembly (Reinalter et. al., 2008)
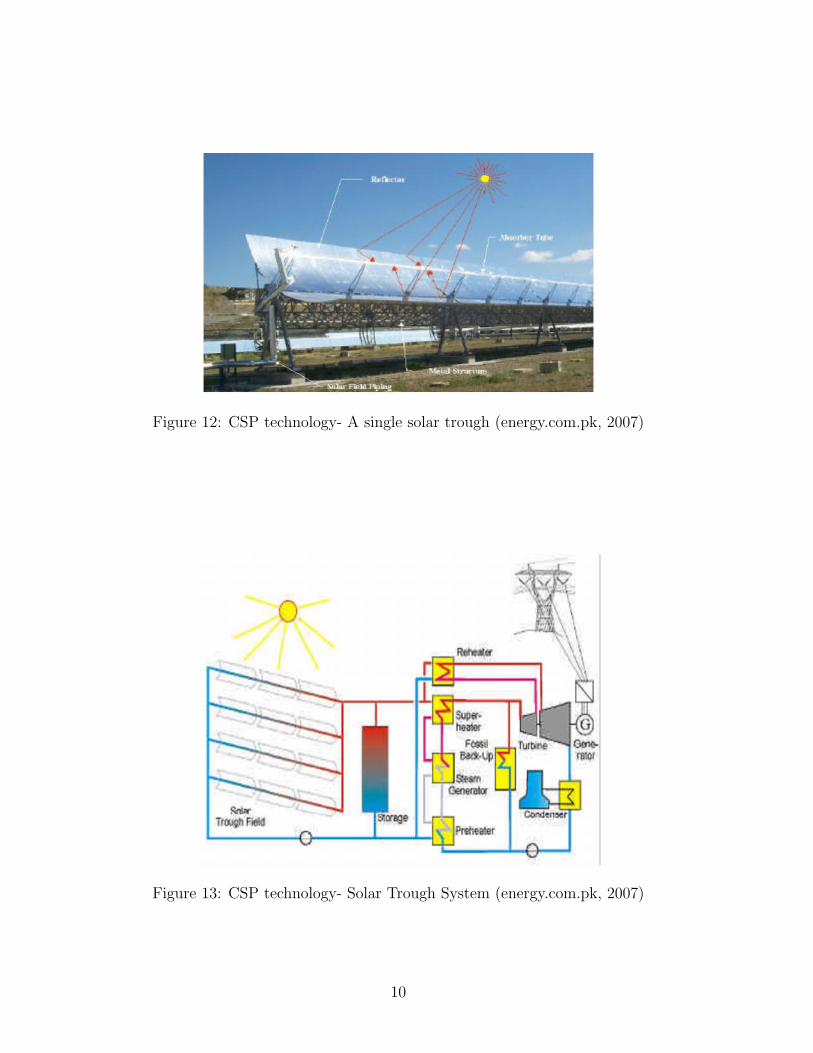
2.3 Parabolic Solar Trough (PST)
This technology works very much the same way as a solar dish-Stirling engine because solar
rays are concentrated to a central point (Figure 12). The difference is that a PST uses a heat
transfer fluid (HTF) to carry heat from the reflected sunlight to a water reservoir. The heated
water, in a closed system, becomes hot enough to become a superheated vapor and run a standard
steam turbine and generator (Figure 13). The heat transfer fluid is often saltpeter, other salt
or oil that becomes molten and flows in a closed system. The advantage to salt is that heat is
released very slowly, thus it can be producing electricity at night. Another advantage PSTs have
over SDSEs is that there are less moving parts; the life expectancy is comparable to solar PV
(Krewitt, 2008).
3 Economics, Government and Culture
One would think the Brazilian government and its people would have a great interest in
producing energy from the sun. The culture of Brazil places great value on the sun. Many
celebrations are held in honor of warm weather including the Pan American event, ”Tapping
the Energy.” The country experiences a lot of intense sunshine consistently throughout the year.
Since it is near the equator, day lengths do not vary with seasons; therefore a predictable energy
can be generated all the time. Also without seasons, loads do not vary greatly since people do
not run air conditioners in the summer and heat their homes in the winter. A large reason the
government and its people might not be in a hurry to install new renewable energy technologies,
such as CSP, is the fact that the ratio of their energy supply growth to their gross domestic
9
Page 5 of 8
Figure : Working Principle of the SPC-24 Collector
This system works on the Conventional Rankine Cycle. The SPC-24 converts the Solar Radiationsinto Electricity through the following major components;
1) Parabolic Trough Solar Concentrator2) Receiver(Evacuated Tubes)3) HTF (Heat Transfer Oil)4) Storage5) Boiler6) Steam Turbine7) Electrical Generator
Parabolic Trough Solar Concentrator
The SPC-24 collectors are made up of identical 12 m long collector modules. Each module comprises32 parabolic mirror panels - 8 along the horizontal axis between pylons and 4 in a vertical cross-section. Each mirror is supported on the structure at four points on its backside. This permits theglass to bend within the range of its flexibility without effect on the focal point. The SPC-24 has 8collector modules and an aperture area of 499.2m².
The torque-box design has been selected for the SPC-24, with less weight and less deformations ofthe collector structure due to dead weight. The design reduces torsion and bending of the structureduring operation and results in increased optical performance and wind resistance.The central element of the box design is a 12-m long steel space-frame structure having a squaredcross section that holds the cantilever arms for the parabolic mirror facets. The torque box consistsof only 4 steel parts which enables easy manufacturing, reduces transportation problems,decreases erection time and thus reduces overall cost.
Figure 12: CSP technology- A single solar trough (energy.com.pk, 2007)
Page 4 of 8
Figure: The Accuracy of the Focal point of SPC-24 being evaluated. The Temperature at thefocus was around 365 degree Celsius.
How the SPC-24 System WorksFigure shows the working principle of the SPC-24 c o l l e c t o r .
Fig. Schematic of the SPC-24 Solar Thermal Power Plant
By tracking the sun from sunrise to sunset, the parabolic SPC-24 collectors concentrate the sun’sradiation with their parabolic mirror facets on the absorber tubes along their focal line. Through theseabsorber tubes circulates a heat transfer fluid (HTF), usually synthetic oil, which is heated to atemperature of nearly 400°C. This heat transfer oil circulates in the boiler tubes, which produces asteam of approx. 350 degree Celsius. The steam runs a conventional steam turbine andconsequently the generator (Fig. Shown).
Figure 13: CSP technology- Solar Trough System (energy.com.pk, 2007)
10
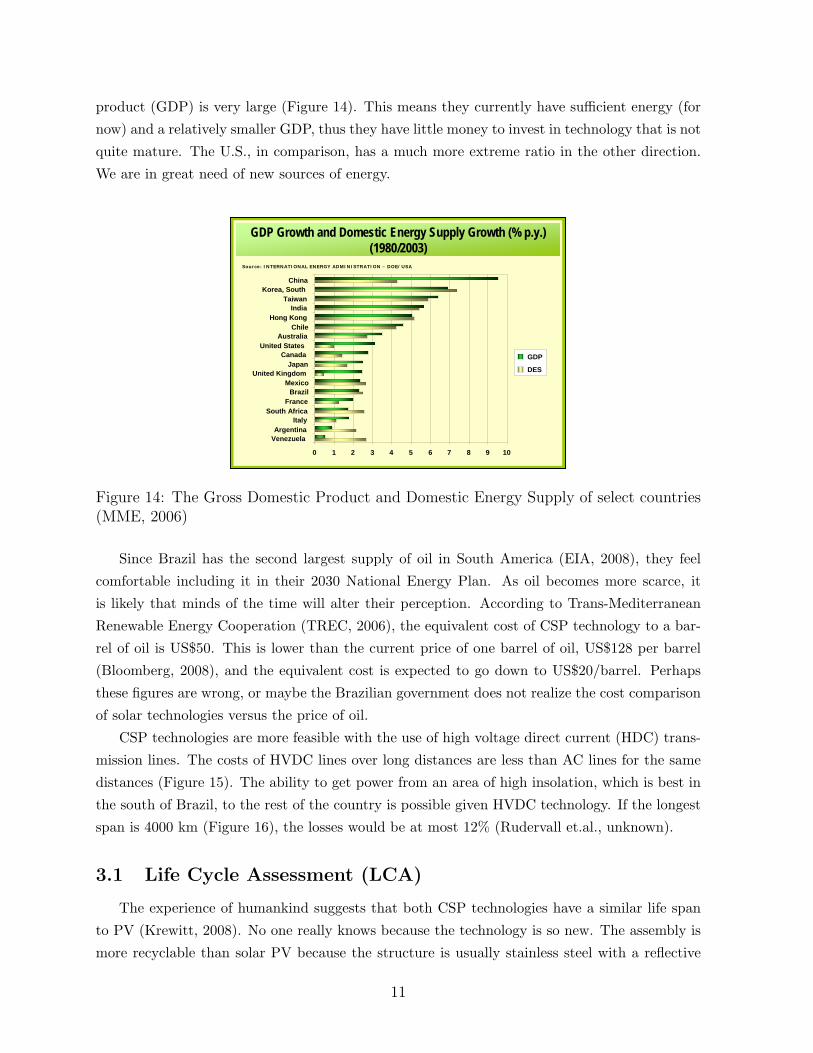
product (GDP) is very large (Figure 14). This means they currently have sufficient energy (for
now) and a relatively smaller GDP, thus they have little money to invest in technology that is not
quite mature. The U.S., in comparison, has a much more extreme ratio in the other direction.
We are in great need of new sources of energy.
6
GDP Growth and Domestic Energy Supply Growth (% p.y.) (1980/2003)
0 1 2 3 4 5 6 7 8 9 10
VenezuelaArgentina
ItalySouth Africa
FranceBrazil
MexicoUnited Kingdom
JapanCanada
United StatesAustralia
ChileHong Kong
IndiaTaiwan
Korea, SouthChina
GDP
DES
Source: INTERNATIONAL ENERGY ADMINISTRATION – DOE/USA
2,1
4,1
2,6
3,6
0
1
2
3
4
5
1980_05 2005_23
GDP DES
The Reference Scenario (Preliminary Results)
Forecasting for GDP Growth and Domestic Energy Supply-Brazil (% p.y.)
Figure 14: The Gross Domestic Product and Domestic Energy Supply of select countries(MME, 2006)
Since Brazil has the second largest supply of oil in South America (EIA, 2008), they feel
comfortable including it in their 2030 National Energy Plan. As oil becomes more scarce, it
is likely that minds of the time will alter their perception. According to Trans-Mediterranean
Renewable Energy Cooperation (TREC, 2006), the equivalent cost of CSP technology to a bar-
rel of oil is US$50. This is lower than the current price of one barrel of oil, US$128 per barrel
(Bloomberg, 2008), and the equivalent cost is expected to go down to US$20/barrel. Perhaps
these figures are wrong, or maybe the Brazilian government does not realize the cost comparison
of solar technologies versus the price of oil.
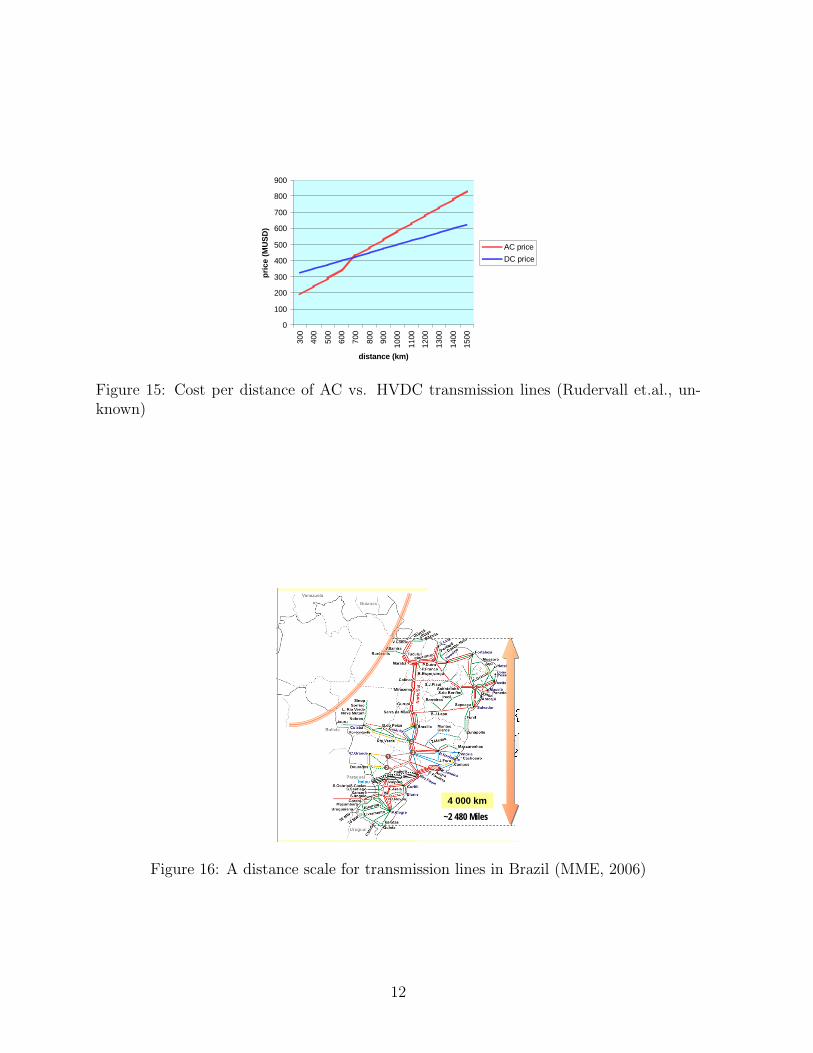
CSP technologies are more feasible with the use of high voltage direct current (HDC) trans-
mission lines. The costs of HVDC lines over long distances are less than AC lines for the same
distances (Figure 15). The ability to get power from an area of high insolation, which is best in
the south of Brazil, to the rest of the country is possible given HVDC technology. If the longest
span is 4000 km (Figure 16), the losses would be at most 12% (Rudervall et.al., unknown).
3.1 Life Cycle Assessment (LCA)
The experience of humankind suggests that both CSP technologies have a similar life span
to PV (Krewitt, 2008). No one really knows because the technology is so new. The assembly is
more recyclable than solar PV because the structure is usually stainless steel with a reflective
11
6
As a guidance, an example showing the price variation for an AC transmission compared with an HVDCtransmission for 2000 MW is presented below.
Assumptions made in the price calculations:For the AC transmission a double circuit is assumed with a price per km of 250 kUSD/km (each), ACsubstations and series compensation (above 600 km) are estimated to 80 MUSD.For the HVDC transmission a bipolar OH line was assumed with a price per km of 250 kUSD/km,converter stations are estimated to 250 MUSD.
It is strongly recommended to take contact with a manufacturer in order to get a first idea of costs andalternatives. The manufacturers should be able to give a budgetary price based on few data, as rated power,transmission distance, type of transmission, voltage level in the AC networks where the converters aregoing to be connected.
Control 7%
AC filters10%
Convertertransformers 16%
Valves 20%
Civil works,buildings 14%
Freight,insurance5%
Engineering 10%
Erection,commissioning 8%
Other equipment 10%
0
100
200
300
400
500
600
700
800
900
300
400
500
600
700
800
900
1000
1100
1200
1300
1400
1500
distance (km)
pric
e (M
US
D)
AC priceDC price
Figure 15: Cost per distance of AC vs. HVDC transmission lines (Rudervall et.al., un-known)
3
BRAZILIAN ELECTRICAL SYSTEM
.Porto Velho
.Manaus
UHE Balbina
.. .. ..
..
.. . .. .
. ..
. ..
.
.
.
.
.
.
...Rio Branco
.
.Boa Vista
.
.... . .
. .
Thermal plantsMain Source
Isolated Systems 2 % of the Total Energy Market
2 608 kmTransmission
200 MWImports
3 027 MWInsatalled Capacity
HydroelectricityMain Source
Interconnected System98 % of the Total Energy Market
84 795 kmTransmission
7 970 MWImports
89 838 MWInstalled Capacity
ISOLATEDSYSTEMS
INTERCONNECTEDSYSTEM
BRAZILIAN ELECTRICAL SYSTEM
Continental Dimensions
4 000 km
Systems Stand-alones
4 000 km 4 000 km~2 480 Miles ~2 480 Miles
Figure 16: A distance scale for transmission lines in Brazil (MME, 2006)
12
surface glued on, such as aluminum or mylar (Bergermann, 2008). These homogeneous, separable
materials bring renewable solar energy closer to a cradle-to-cradle life cycle.
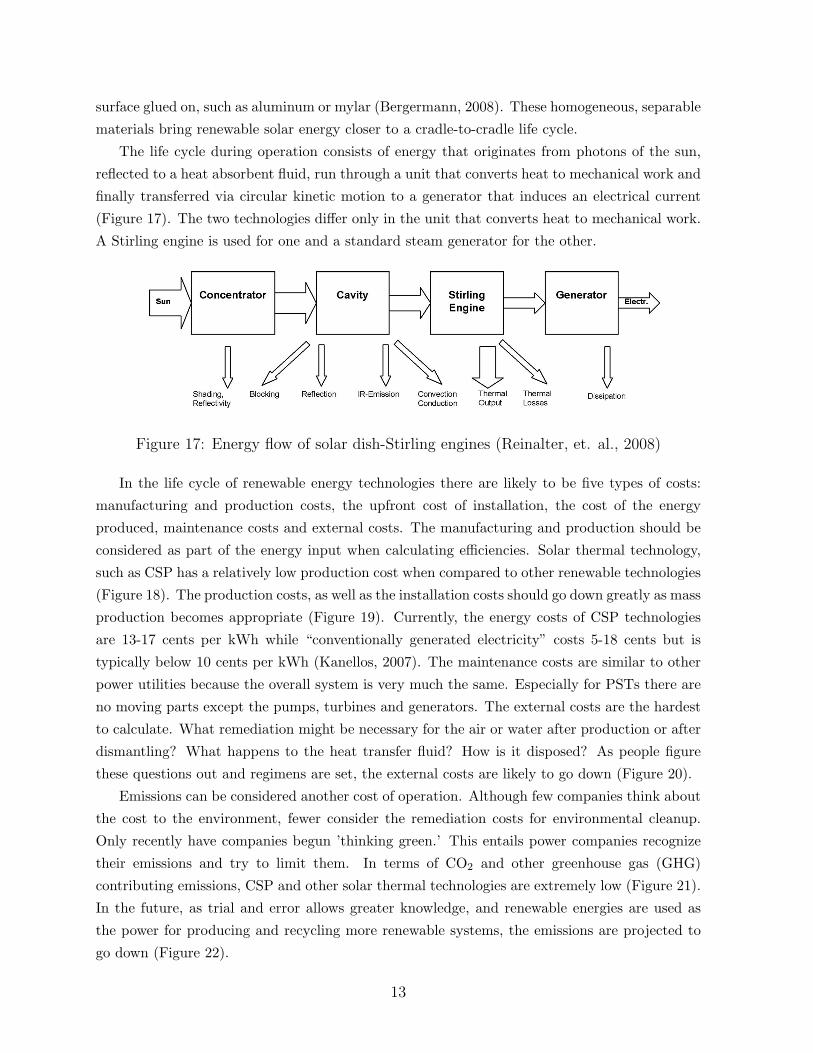
The life cycle during operation consists of energy that originates from photons of the sun,
reflected to a heat absorbent fluid, run through a unit that converts heat to mechanical work and
finally transferred via circular kinetic motion to a generator that induces an electrical current
(Figure 17). The two technologies differ only in the unit that converts heat to mechanical work.
A Stirling engine is used for one and a standard steam generator for the other.
deduced. The thermal output of the engine can be measured com-bining precise temperature and flow measurements of the coolingwater to a calorimetric measurement.
Insolation Data MeasurementThe exact measurement of the direct normal insolation is cru-
cial for the whole measurement series. It is obtained from anactinometric station placed on top of the Odeillo big solar furnacea few hundred meters away from the dish/Stirling system. Thesolar part of the station is equipped with three sensors, a normalincident pyrheliometer �EPPLEY� to measure the direct normalinsolation �I� and two CM6 �Kipp & Zonen� pyranometers in or-der to obtain the global horizontal �G� and diffuse horizontal �D�insolation. The sensors are periodically calibrated at the laborato-ries of Carpantras, which is part of the Météo-France network andin possession of an absolute radiometer on the international radio-metric scale. The measurement uncertainties are about 1.5% forthe pyrheliometer and 3.5% for the pyranometers �1�.
Flux-Mapping SystemA flux measuring system for dish/Stirling systems developed by
DLR was used to map the flux distributions close to the focalplane. It consists basically of a Lambertian target placed in thebeam path, a charge coupled device �CCD� camera, and a com-puter that controls target positioning and image acquisition. Thetarget is made up of a water-cooled aluminum plate with aplasma-sprayed alumina coating, which is close to ideal diffusereflection properties. A Peltier-cooled slow-scan CCD camera ismounted in the central hole of the concentrator taking pictures ofthe illuminated target. The acquired images are automatically pro-cessed and evaluated in the image analysis program OPTIMAS®.Image calibration is achieved by calculating the total reflectedpower coming from the dish and relating it to the integrated grayvalues measured on the target in the focal plane. This calibrationmethod assumes that the target in the focal plane intercepts all thesunlight reflected by the dish. Simulations for the given case
proved that spillage is almost negligible being less than 1% evenfor bad sunshapes. Error analysis resulted in a calibration uncer-tainty of ±2.5% and local measurement uncertainties of −2.5% to+8.5% for this measurement system �2,3�.
Cooling Power Measurement SystemTo precisely measure the power evacuated by the cooling sys-
tem, the change of coolant enthalpy between water inlet and outletwas determined, and the mass flow was measured. A mixingchamber was connected to the outlet and a temperature sensorplaced at the outlet of this chamber to guarantee a homogeneoustemperature in the outlet stream. At the motor inlet, a proper mix-ing was assumed due to the short distance between the circulationpump and the motor inlet. Thus, the sensor was simply placed inthe center of the inlet water tube.
The sensors used were high precision PT100 1/10 DIN B ac-cording IEC751 with an accuracy of ±0.013 K. Their signal wasmeasured with an ICP DAS model I-7033 in four wire configura-tion with an accuracy of 0.1%. An additional calibration was con-ducted by adjusting their temperature difference signal to zerowith the water pump switched on and the engine in stow position.A noise of 0.05°C under static conditions was measured.
An electromagnetic flowmeter was selected to determine themass flow of the coolant. This device is able to measure the flowof conductive liquids regardless of their composition with veryhigh precision. The flowmeter was installed according to themanufacturer’s specifications and its inner diameter is the same asthe main rectilinear return pipe in order to be in unruliness state.The low liquid temperature and the expansion vessel in the cool-ing circuit prevent appearance of bubbles.
The Siemens Sitran MAG 3100 with a maximum flow rate of5000 l /h and the electronic evaluation unit �MAG 6000� has aspecified precision of ±0.5%. The calibration report indicates amaximum error of ±0.17% from 25% to 91% of the full scaleflow.
The measurements were taken in winter with negative outsidetemperatures. The cooling mixture used is a standard automotive-type ELAN FLUID D with full protection down to −26°C. Sincethe exact composition was not known, a sample was taken andanalyzed by the French Laboratoire National d’Essais. The mea-sured heat capacity as function of the temperature had an unex-pected high uncertainty of ±4%. The mean density was deter-mined to be 1060 kg /m3.
Electric Power Measurement SystemMeasurements of the electric power output of the generator and
the consumption of the individual components were performedusing a WEIGEL DUW 2.0 power transducer together with therecommended transformers �30 /1� for the current measurementinputs. With a true three-phase conversion of the current and volt-age inputs, this device guarantees an absolute correct result of themeasurements within the accuracy class of ±0.5%. Since thetransducer was placed at the output of the Stirling engine’s electriccircuit and therefore measures the net output, the constant con-
Fig. 1 The CNRS EuroDish System
Fig. 2 Energy flow in a dish/Stirling system
011013-2 / Vol. 130, FEBRUARY 2008 Transactions of the ASME
Downloaded 16 Apr 2008 to 137.150.173.106. Redistribution subject to ASME license or copyright; see http://www.asme.org/terms/Terms_Use.cfm
Figure 17: Energy flow of solar dish-Stirling engines (Reinalter, et. al., 2008)
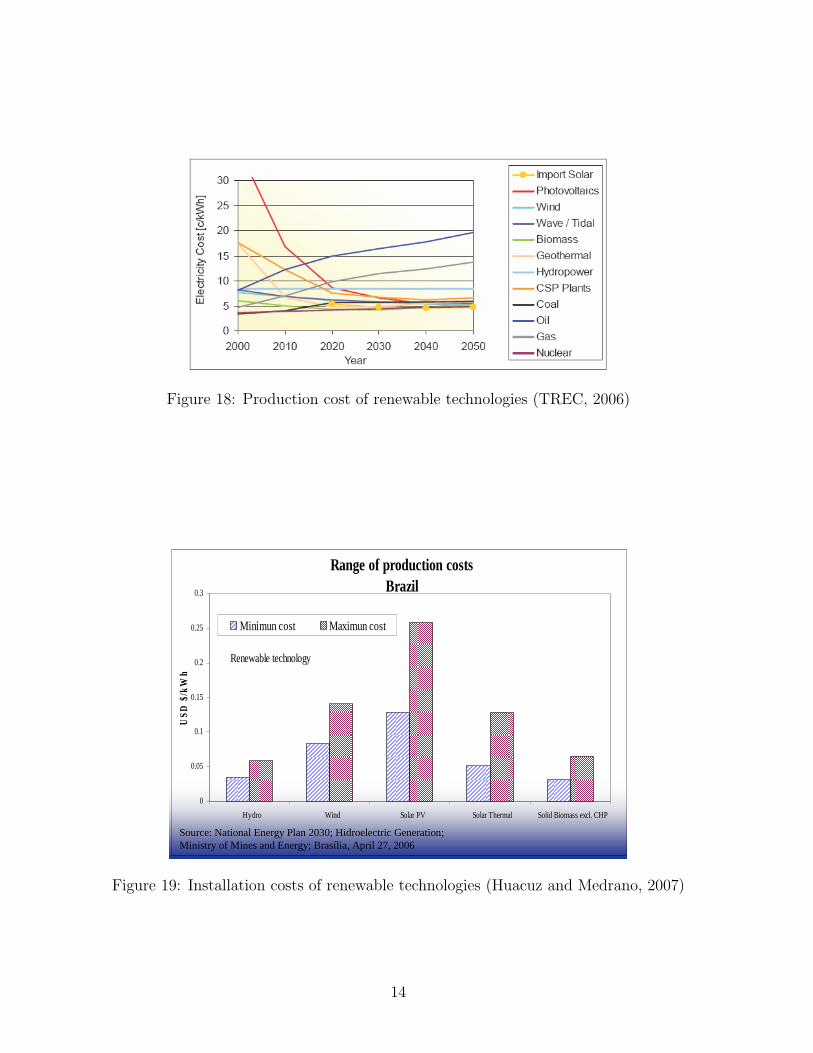
In the life cycle of renewable energy technologies there are likely to be five types of costs:
manufacturing and production costs, the upfront cost of installation, the cost of the energy
produced, maintenance costs and external costs. The manufacturing and production should be
considered as part of the energy input when calculating efficiencies. Solar thermal technology,
such as CSP has a relatively low production cost when compared to other renewable technologies
(Figure 18). The production costs, as well as the installation costs should go down greatly as mass
production becomes appropriate (Figure 19). Currently, the energy costs of CSP technologies
are 13-17 cents per kWh while “conventionally generated electricity” costs 5-18 cents but is
typically below 10 cents per kWh (Kanellos, 2007). The maintenance costs are similar to other
power utilities because the overall system is very much the same. Especially for PSTs there are
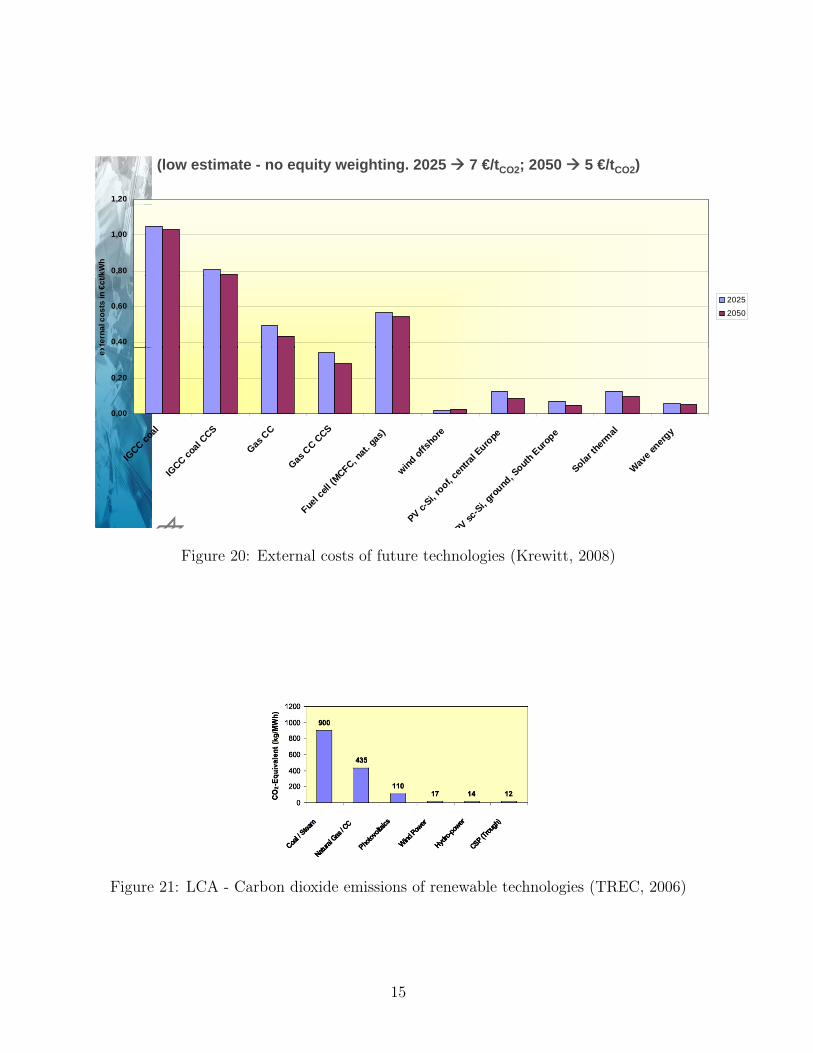
no moving parts except the pumps, turbines and generators. The external costs are the hardest
to calculate. What remediation might be necessary for the air or water after production or after
dismantling? What happens to the heat transfer fluid? How is it disposed? As people figure
these questions out and regimens are set, the external costs are likely to go down (Figure 20).
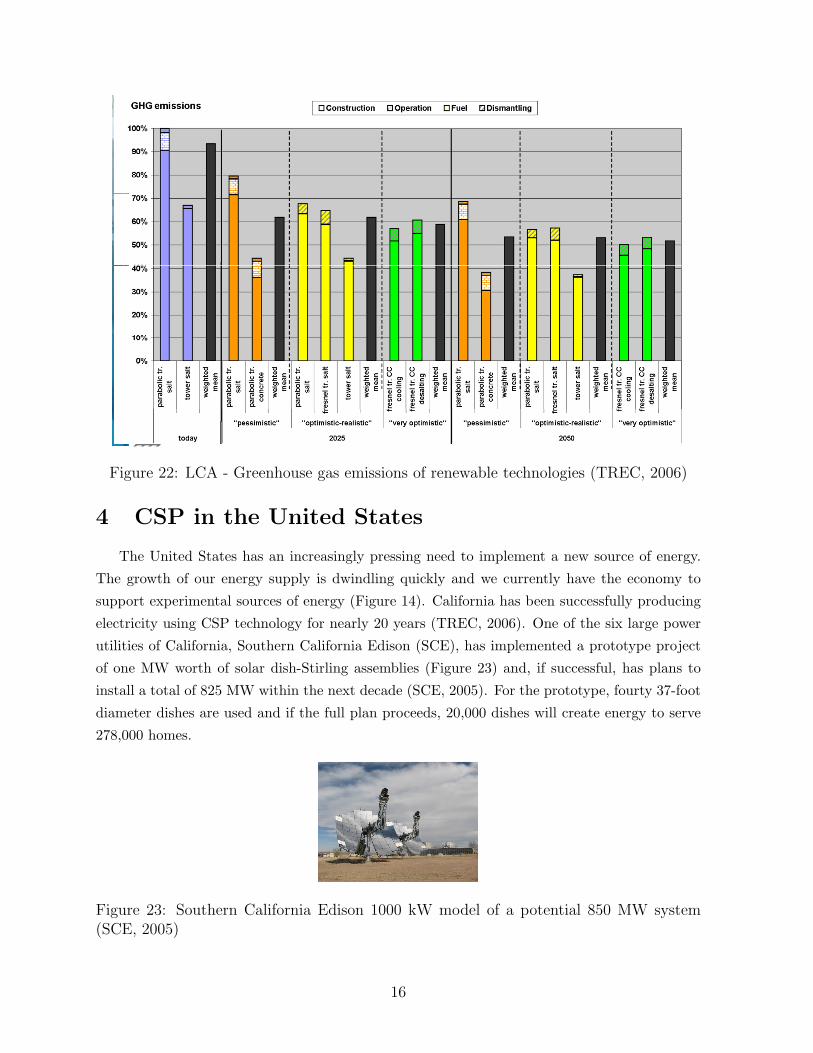
Emissions can be considered another cost of operation. Although few companies think about
the cost to the environment, fewer consider the remediation costs for environmental cleanup.
Only recently have companies begun ’thinking green.’ This entails power companies recognize
their emissions and try to limit them. In terms of CO2 and other greenhouse gas (GHG)
contributing emissions, CSP and other solar thermal technologies are extremely low (Figure 21).
In the future, as trial and error allows greater knowledge, and renewable energies are used as
the power for producing and recycling more renewable systems, the emissions are projected to
go down (Figure 22).
13
Sketch of possible infrastructure for a sustainable supply of power to EUrope, the Middle East and North Africa (short: EU-MENA)
Figure 18: Production cost of renewable technologies (TREC, 2006)
Mexico: Electricity Generation from Renewables
-
5,000
10,000
15,000
20,000
25,000
30,000
35,000
1990 1991 1992 1993 1994 1995 1996 1997 1998 1999 2000 2001 2002 2003 2004 2005 2006
Año
Ele
ctri
city
Gen
erat
ion
(GW
h)
Hydro Wind
Solar PV Geothermal
Biomass excl. CHP Biomass CHP*
Brazil: Electricity Generation from Renewables
0
50,000
100,000
150,000
200,000
250,000
300,000
350,000
400,000
1990 1991 1992 1993 1994 1995 1996 1997 1998 1999 2000 2001 2002 2003 2004 2005 2006Año
Ele
ctri
city
Gen
erat
ion
(GW
h)
Hydro Biomass excl. CHP
Production Costs from Renewable EnergyMexico
0
0.1
0.2
0.3
0.4
0.5
0.6
Hydro Wind Solar PV Geothermal Solid BiomassCHP
Biogas
USD
/kW
h
Minimun cost Maximun cost
Electricity from Renewables and Associated Costs
Source: Brazilian Energy Balance, 2006; Empresa de Pesquisa Energética, Ministerio de Minas e Energia
Range of production costsBrazil
0
0.05
0.1
0.15
0.2
0.25
0.3
Hydro Wind Solar PV Solar Thermal Solid Biomass excl. CHP
Renewable technology
USD
$/k
Wh
Minimun cost Maximun cost
Source: National Energy Plan 2030; Hidroelectric Generation; Ministry of Mines and Energy; Brasília, April 27, 2006
http://sie.energia.gob.mx/sie/bdiController?action=login
Source: Renewable Energies for Sustainable Development in Mexico, 2006, Energy Secretariat (SENER), México, 2006
Figure 19: Installation costs of renewable technologies (Huacuz and Medrano, 2007)
14
external costs of future technologiesexternal costs of future technologies(low estimate - no equity weighting. 2025 7 €/tCO2; 2050 5 €/tCO2)
1,20
0,80
1,00
/kW
h
0,40
0,60
xter
nal c
osts
in €
ct/
2025
2050
0,00
0,20
ex
IGCC co
al
IGCC co
al CCS
Gas C
C
Gas C
C CCS
cell (
MCFC, nat.
gas)
wind of
fshore
roof, c
entra
l Euro
pe
ound
, South
Eur
ope
Solar th
ermal
Wave e
nergy
Dokumentname > 23.11.2004
Folie 18 > Vortrag > Autor
Fuel c
e
PV c-Si, r
o
PV sc-S
i, gro
u
Figure 20: External costs of future technologies (Krewitt, 2008)
Page 1 of 8
POTENTIAL OF SOLAR ENERGY
In many regions of the world, every square kilometre of land can produce as much as 200-300GWh/year of solar electricity. This is equivalent to the annual production of a conventional coal orgas fired 50 MW power plants or - over the total life cycle of a solar power generation system - tothe energy contained in 16 million barrels of oil. The exploitation of less than 1 % of the total solarenergy potential would suffice to meet the recommendations of the Intergovernmental Panel onClimate Change (IPCC) for a long-term stabilization of the climate. At the same time, generation ofelectrical power by solar energy will become economically competitive with fossil fuels.
INTERNATIONAL SOLAR ENERGY ALLIANCES
The large solar power potential in the southern countries will only be used to a small extent, if it isrestricted by the regional demand and by the local technological and financial resources. But if solarelectricity is exported to regions with less solar energy resources, a much greater part of thepotential of the sunbelt countries could be harvested for the protection of the global climate.Some countries like Germany already consider the perspective of solar electricity imports fromNorth Africa and Southern Europe as a contribution to the long-term sustainable development oftheir power sector.
ENVIRONMENTAL SUSTAINABILITY
Life cycle assessment of emissions (bottom) and of land surface impacts of the concentrating solarpower systems shows that they are best suited for the reduction of greenhouse gases and otherpollutants, without creating other environmental risks or contamination. For example, each squaremeter of collector surface can avoid 250-400 kg of CO2-emissions per year.
Figure: Life Cycle CO2-Emissions ofDifferent Power Technologies
This life cycle assessment of CO2-emissions is based on the present
energy mix of Germany. CSP value isvalid for an 80 MW parabolic troughsteam cycle in solar only operationmode. PV and CSP in North Africa.CC:Combined Cycle. Source: DLR.
Figure 21: LCA - Carbon dioxide emissions of renewable technologies (TREC, 2006)
15
CSP life cycle greenhouse gas emissions for variousCSP – life cycle greenhouse gas emissions for various future configurations
Dokumentname > 23.11.2004
Folie 14 > Vortrag > Autor
Figure 22: LCA - Greenhouse gas emissions of renewable technologies (TREC, 2006)
4 CSP in the United States
The United States has an increasingly pressing need to implement a new source of energy.
The growth of our energy supply is dwindling quickly and we currently have the economy to
support experimental sources of energy (Figure 14). California has been successfully producing
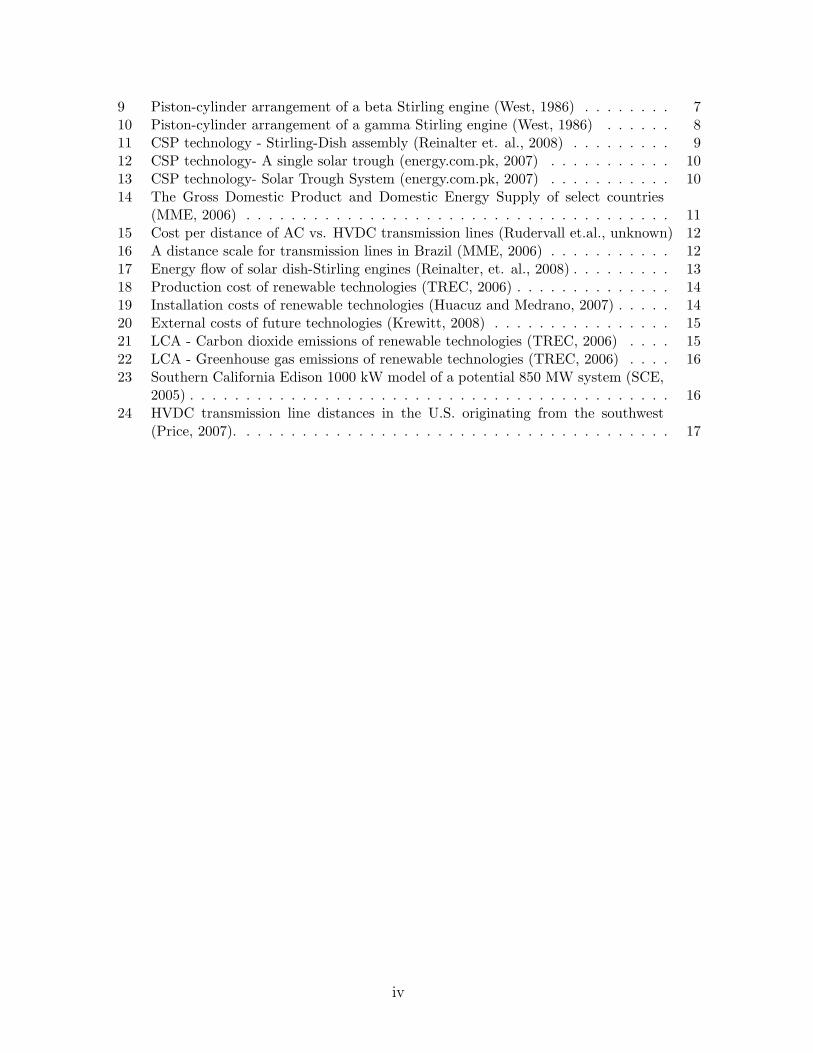
electricity using CSP technology for nearly 20 years (TREC, 2006). One of the six large power
utilities of California, Southern California Edison (SCE), has implemented a prototype project
of one MW worth of solar dish-Stirling assemblies (Figure 23) and, if successful, has plans to
install a total of 825 MW within the next decade (SCE, 2005). For the prototype, fourty 37-foot
diameter dishes are used and if the full plan proceeds, 20,000 dishes will create energy to serve
278,000 homes.Introduction Characteristics System Maximization Inputs/Outputs Reducing emissions
Conclusion
Figure: Southern California Edison 150 kW model of a potential825 MW system
http://www.edison.com/pressroom/pr.asp?id=5885
James Robinson — Analysis of a Biomass-fueled Stirling Heat Engine 24/27
Figure 23: Southern California Edison 1000 kW model of a potential 850 MW system(SCE, 2005)
16
Arizona Public Service (APS) is one example of a large, commercial parabolic solar trough
facility built in the desert between Phoenix and Tucson that produces one MWe.
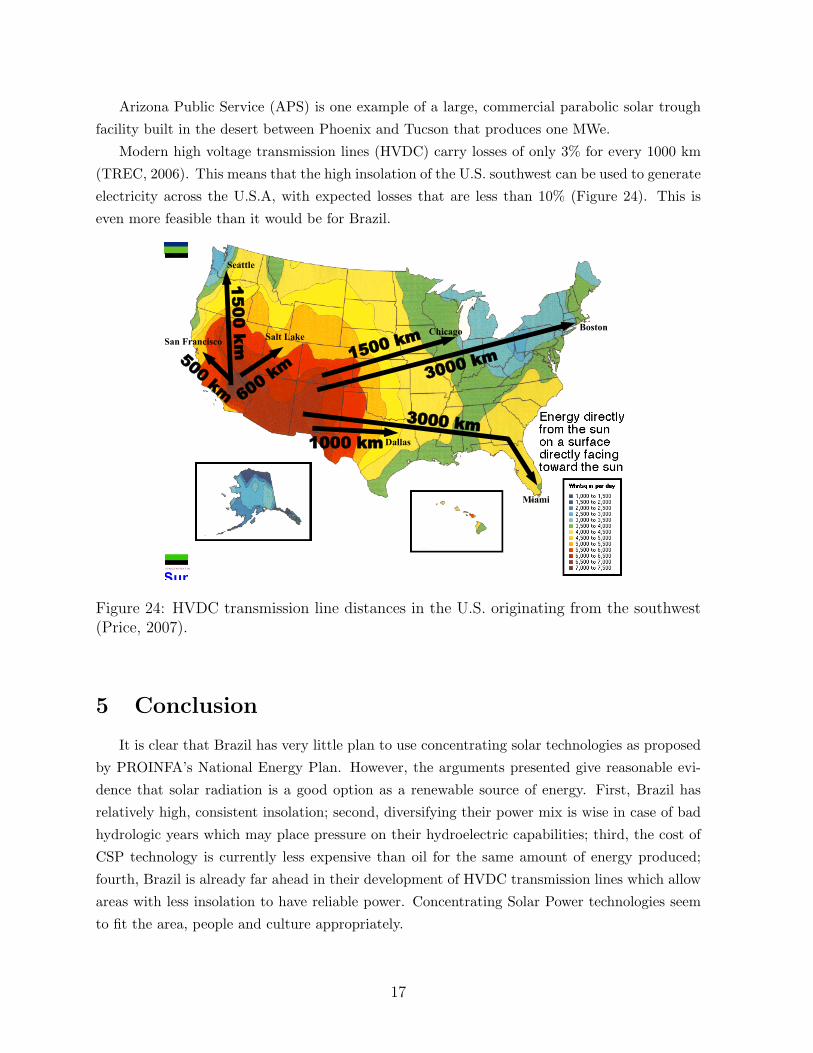
Modern high voltage transmission lines (HVDC) carry losses of only 3% for every 1000 km
(TREC, 2006). This means that the high insolation of the U.S. southwest can be used to generate
electricity across the U.S.A, with expected losses that are less than 10% (Figure 24). This is
even more feasible than it would be for Brazil.
G � S O L A R � P O W E R
Slide 4Sun�Lab
3000 km
3000 km
1500 km Chicago Boston
Miami
Dallas
600 km
1500 km
500 km
1000 km
Salt Lake
Seattle
San Francisco
Southwest Power MarketSouthwest Power Market Transmission FlowsTransmission Flows
C O N C E N T R A T I N
Sandia National Laboratories, Albuquerque, NM National Renewable Energy Laboratory, Golden CO
Operated for the United States Department of Energy
Figure 24: HVDC transmission line distances in the U.S. originating from the southwest(Price, 2007).
5 Conclusion
It is clear that Brazil has very little plan to use concentrating solar technologies as proposed
by PROINFA’s National Energy Plan. However, the arguments presented give reasonable evi-
dence that solar radiation is a good option as a renewable source of energy. First, Brazil has
relatively high, consistent insolation; second, diversifying their power mix is wise in case of bad
hydrologic years which may place pressure on their hydroelectric capabilities; third, the cost of
CSP technology is currently less expensive than oil for the same amount of energy produced;
fourth, Brazil is already far ahead in their development of HVDC transmission lines which allow
areas with less insolation to have reliable power. Concentrating Solar Power technologies seem
to fit the area, people and culture appropriately.
17
6 References
1. Apricus (2007) Insolation of South America. accessed: http://www.apricus.com/html/
insolation levels sth am.htm on 7/12/08, info from: Whitlock, C. E., et al., Release
3 NASA Surface Meteorology and Solar Energy Data Set for Renewable Energy Industry
Use. Rise and Shine 2000, the 26th Annual Conference of the Solar Energy Society of
Canada Inc. and Solar, Oct. 21-24, 2000, Halifax, Nova Scotia, Canada.
2. Bergermann, Schlaich (SBP) (2008)“Concept of a Dish-Stirling-System ” accessed: http:
//www.sbp.de/en/html/solar/dish-stirling.html on 6/21/08
3. Bezerra, Arnaldo M., (1995) “O FOGO SOLAR NA ATIVIDADE HUMANA UTILIZAO
DA ENERGIA RENOVVEL NA COCO DE ALIMENTOS: Uma contribuio ao desenvolvi-
mento sustentvel,” translated from http://mourabezerra.sites.uol.com.br/fogao.htm,
accesed: 7/11/08
4. Canada, S., Brosseau, D., Kolb G., Moore, L., Cable, R. and Price, H. (2006) “Status of
APS 1-MWe Parabolic Trough Project,” Conference paper, NREL
5. Corria, Maria E., Cobas, Vladimir M., and Lora, Electo S. (2005) “Perspectives of Stirling
engines use for distributed generation in Brazil,” Energy Policy, 34, pp. 3402-3408
6. Edison, Int’l, Inc. (2008) “Bettering Energy Efficiency and Power Sources - Solar Energy
Project,”
http://www.sce.com/PowerandEnvironment/BetteringEnergyEfficiencyPowerSources/
SolarProject/about.htm, accessed: 7/01/08
7. energy.com.pk (2007) “Power Generation on Solar Energy,“ publisher, editor, author un-
kown; Pakistan, accessed: www.energy.com.pk, on 7/5/08
8. Huacuz, Jorge M., and Medrano, Consuelo (2007) Mexico and Brazil: Renewable Energy
Markets and Policies, Electrical Research Institute (IIE), Cuernavaca, Mxico
9. Price, Hank (2007) DLR TRANS-CSP Study Applied to North America, USDE: EERE
Presented to NREL
10. EIA (2008) Energy Information Administration: Brazil Energy Profile, updated June 16,
2008, accessed: 7/10/08, http://tonto.eia.doe.gov/country/country energy data.
cfm?fips=BR
11. IndexMundi (2008) “Brazil Population growth rate,“ accessed: http://indexmundi.com/
brazil/population growth rate.html, on 7/3/08
12. Kanellos, Michael (2007) “Shrinking the cost for solar power,“ CNET news, May 11 2007
18
13. Keith, R (2006) “A Sustainable Energy Plan for Brazil,”
14. Krewitt, Wolfram (2008) “External Costs of Future Technologies,” DLR, Presentation by:
Andrea Ricci
15. MME (2006) ETSAP Meeting, Ministry of Mines and Energy, Capetown, Brazil, 06/2006
16. Reinalter, W., Ulmer, S., Heller, P., Rauch, T., Gineste, J.M., Ferriere, A., and Nepveu,
F. (2008) ”Detailed Performance Analysis of a 10 kW Dish/Stirling System.” Journal of
Solar Energy Engineering, 130. pp: 011013-1 - 011013-6 (Purchased ASME)
17. Ross, Andy (1977) Stirling Cycle Engines, Imperial Litho/Graphics
18. Rudervall, Roberto, Charpentier, J.P., and Sharma, Raghuveer (date unknown) High Volt-
age Direct Current (HVDC) Transmission Systems: Technology Review Paper, World
Bank and ABB Power Systems
19. Santos, Marco A. (1995) “A Breif History of Energy Biomass in Brazil,” Ed. Tecnologia,
Cidade Universitria
20. SCE (2005) ”Major New Solar Energy Project Announced By Southern California Edison
and Stirling Energy Systems, Inc.,“ accessed: http://www.edison.com/pressroom/pr.
asp?id=5885 on 6/20/08
21. Smeloff, E and Asmus P. (1997) Reinventing Electric Utilities, Island Press, Clovelo, CA
22. SolarPaces (2004) “START Mission to Brazil,“ International Energy Agency, final report
Cordeiro, Patricia
23. TREC (2006) ”Sun Cheaper than Oil,“ Trans-Mediteranean Renewable Energy Coopera-
tion, Press Release, 7/2006
24. Walker, Graham (1980) Stirling Engines, Oxford University Press, New York.
25. West, C.D., (1986) Principles and Applications of Stirling Engines, Van Norstrand Rein-
hold Co., Inc., New York, NY.
26. Krishnaswamy, Venkataraman and Stuggins, Gary (2007) “Closing the Electricity Supply-
Demand Gap,“ World Bank
27. WRI (2008) World Resources Projects: Programme of Incentives for Alternative Electric-
ity Sources (PROINFA), accessed: 7/11/08,
http://projects.wri.org/sd-pams-database/brazil/programme-incentives\\-alternative-electricity-sources-proinfa
19
7 Appendix A: History of the Stirling Engine
On September 12, 1816 a minister from Scotland walked into the Scottish patent office to
apply for a patent. Robert Stirling built many things during his free time in his shop at home. It
wasn’t until 1850 that the dynamics of the system were explained by Prof. McQuorne Rankine.
Finally, 100 years later, the heat engine was named by Rolf Meijer after its creator, the Stirling
engine. This elegant machine was demonstrated by the great Lord Kelvin in his own classroom
( Edison, 2008).
8 Appendix B: Additional Data
on 7/12/08, info from: Whitlock, C. E., et al., Release 3 NASA Surface Meteorology and Solar Energy Data Set for Renewable Energy Industry Use. Rise & Shine 2000, the 26th Annual Conference of the Solar Energy Society of Canada Inc. and Solar, Oct. 21-24, 2000, Halifax, Nova Scotia, Canada. EIA (2008) Energy Information Administration: Brazil Energy Profile, updated June 16, 2008, accessed: 7/10/08, cached: http://209.85.141.104/search?q=cache:8fpDnXvbZr4J:tonto.eia.doe.gov/country/country_energy_data.cfm%3Ffips%3DBR+history+energy+use+brazil&hl=en&ct=clnk&cd=2&gl=us&client=firefox-a originally: http://tonto.eia.doe.gov/country/country_energy_data.cfm?fips=BR WRI (2008) World Resources Projects: Programme of Incentives for Alternative Electricity Sources (PROINFA), accessed: 7/11/08, http://projects.wri.org/sd-pams-database/brazil/programme-incentives-alternative-electricity-sources-proinfa Appendix A: Additional Data
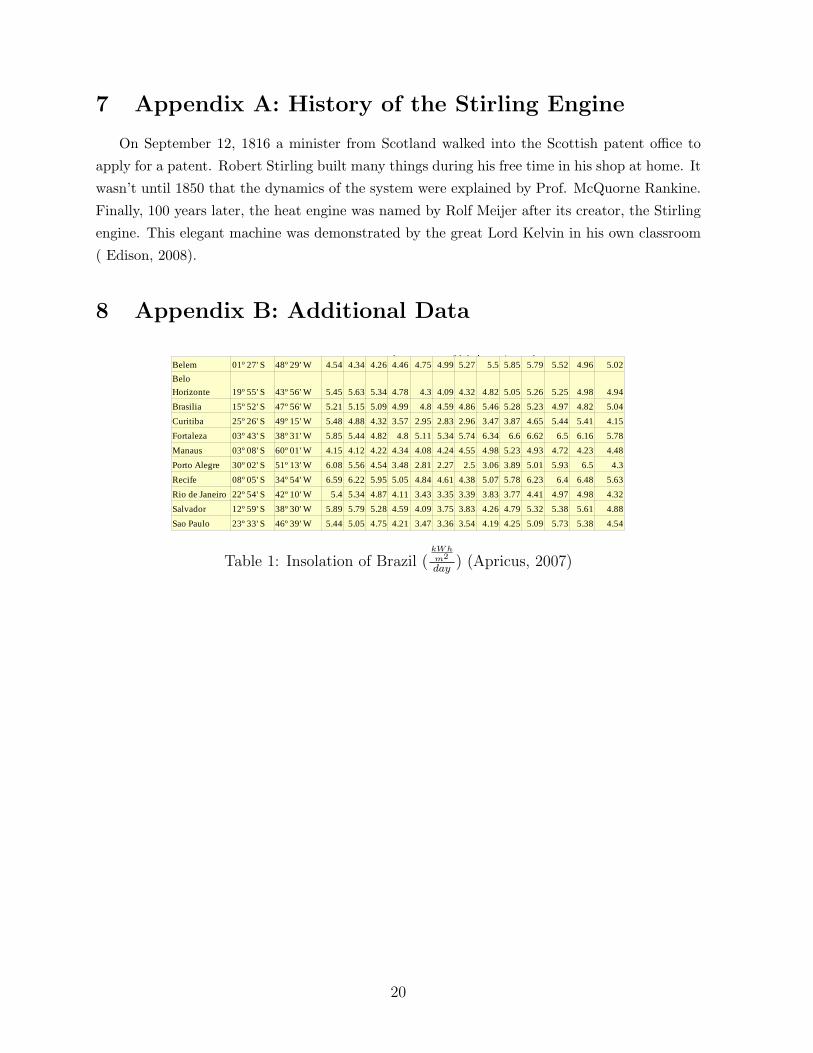
Table 1: Insolation of Brazil (kWh/m^2/day) (Apricus, 2007)
Belem 01º 27' S 48º 29' W 4.54 4.34 4.26 4.46 4.75 4.99 5.27 5.5 5.85 5.79 5.52 4.96 5.02
19º 55' S 43º 56' W 5.45 5.63 5.34 4.78 4.3 4.09 4.32 4.82 5.05 5.26 5.25 4.98 4.94Brasilia 15º 52' S 47º 56' W 5.21 5.15 5.09 4.99 4.8 4.59 4.86 5.46 5.28 5.23 4.97 4.82 5.04Curitiba 25º 26' S 49º 15' W 5.48 4.88 4.32 3.57 2.95 2.83 2.96 3.47 3.87 4.65 5.44 5.41 4.15Fortaleza 03º 43' S 38º 31' W 5.85 5.44 4.82 4.8 5.11 5.34 5.74 6.34 6.6 6.62 6.5 6.16 5.78Manaus 03º 08' S 60º 01' W 4.15 4.12 4.22 4.34 4.08 4.24 4.55 4.98 5.23 4.93 4.72 4.23 4.48Porto Alegre 30º 02' S 51º 13' W 6.08 5.56 4.54 3.48 2.81 2.27 2.5 3.06 3.89 5.01 5.93 6.5 4.3Recife 08º 05' S 34º 54' W 6.59 6.22 5.95 5.05 4.84 4.61 4.38 5.07 5.78 6.23 6.4 6.48 5.63Rio de Janeiro 22º 54' S 42º 10' W 5.4 5.34 4.87 4.11 3.43 3.35 3.39 3.83 3.77 4.41 4.97 4.98 4.32Salvador 12º 59' S 38º 30' W 5.89 5.79 5.28 4.59 4.09 3.75 3.83 4.26 4.79 5.32 5.38 5.61 4.88Sao Paulo 23º 33' S 46º 39' W 5.44 5.05 4.75 4.21 3.47 3.36 3.54 4.19 4.25 5.09 5.73 5.38 4.54
Belo Horizonte
Table 1: Insolation of Brazil (kWhm2
day) (Apricus, 2007)
20
N/A N/A N/A N/A Tide, Wave, Ocean
1300650200Biomass (solid residues)
6,5714,5212,9711,821Biomass excl. CHP
N/A N/A N/A N/A Geothermal
N/A N/A N/A N/A Solar Thermal
N/A N/A N/A N/A Solar PV
4,6823,4822,2821,382Wind
8,3305,3303,3302,330Small hydro
N/A N/A N/A N/A of which: Pumped Storage
156,300137,400116,10099,000Hydro
2030202520202015Unit: MW cumulative
Brazil: Renewable Electricity to the year 2030
Source: National Energy Plan 2030, Strategy to expland the supply; Ministry of Mines and Energy, Brasilia, 2007Table 2: Renewable energy summary of Brazil’s proposed National Energy Plan to be ineffect by 2030 (Huacuz and Medrano, 2007)
Technical Data:Commissioning year: 1984-1987Power rating: 3150 MWDC voltage: ±600 kVLength of overhead DC line: 785 km + 805 kmMain reasons for choosing HVDC system: Long distance, 50/60 Hz conversion
Table 3: The most impressive HVDC transmission line in the world; extending from ItaipuBinacional to Sao Paulo (Rudervall et.al., unknown)
21