Embed Size (px)
Citation preview
Casterton Memorial Hospital
105th
Annual Report
“A Fully Accredited Healthcare Facility”
Casterton Memorial Hospital 105th Annual Report 2012 – 2013
1
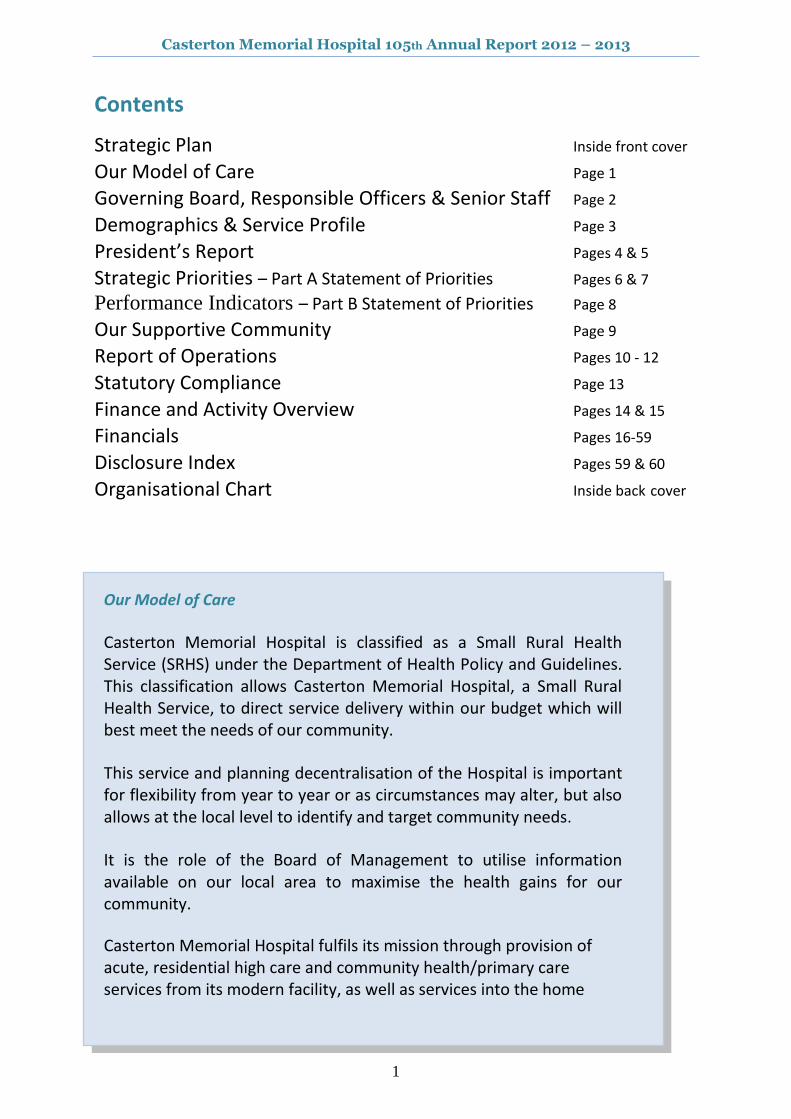
Contents
Strategic Plan Inside front cover
Our Model of Care Page 1
Governing Board, Responsible Officers & Senior Staff Page 2
Demographics & Service Profile Page 3
President’s Report Pages 4 & 5
Strategic Priorities – Part A Statement of Priorities Pages 6 & 7
Performance Indicators – Part B Statement of Priorities Page 8
Our Supportive Community Page 9
Report of Operations Pages 10 - 12
Statutory Compliance Page 13
Finance and Activity Overview Pages 14 & 15
Financials Pages 16-59
Disclosure Index Pages 59 & 60
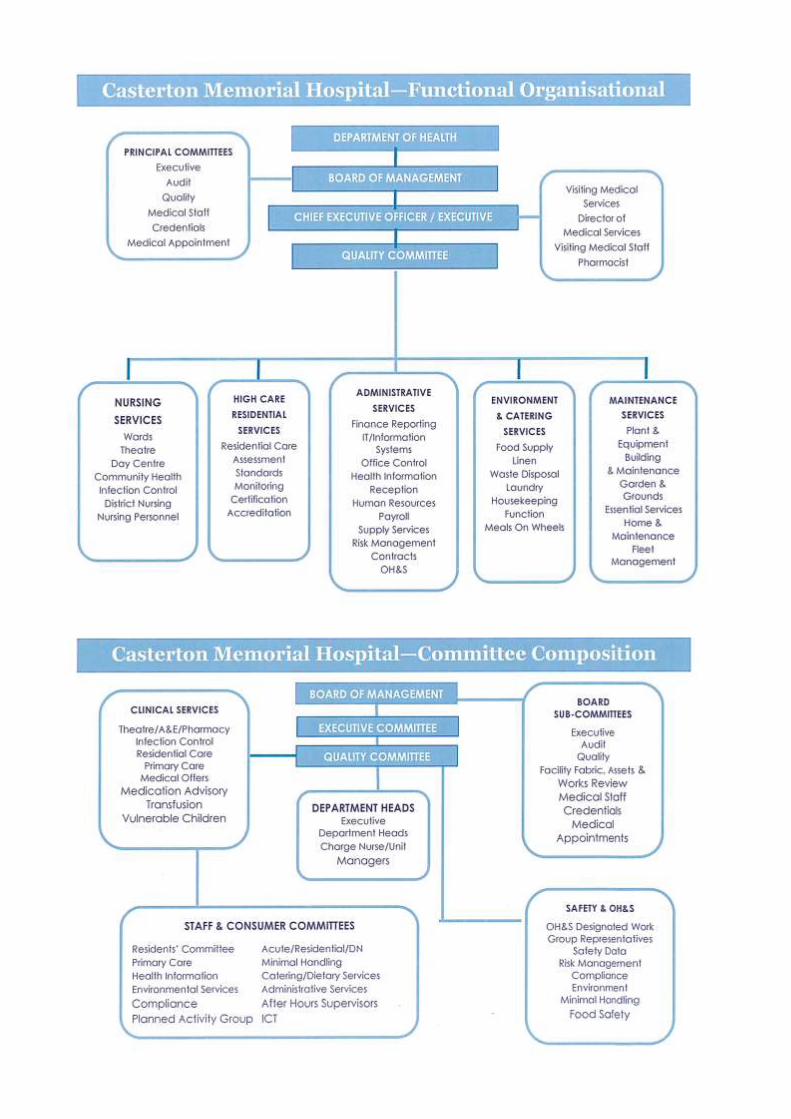
Organisational Chart Inside back cover
Our Model of Care
Casterton Memorial Hospital is classified as a Small Rural Health Service (SRHS) under the Department of Health Policy and Guidelines. This classification allows Casterton Memorial Hospital, a Small Rural Health Service, to direct service delivery within our budget which will best meet the needs of our community.
This service and planning decentralisation of the Hospital is important for flexibility from year to year or as circumstances may alter, but also allows at the local level to identify and target community needs.
It is the role of the Board of Management to utilise information available on our local area to maximise the health gains for our community.
Casterton Memorial Hospital fulfils its mission through provision of acute, residential high care and community health/primary care services from its modern facility, as well as services into the home

Casterton Memorial Hospital 105th Annual Report 2012 – 2013
2
Responsible Ministers: Commonwealth Government Australia: The Hon Tanya Plibersek MP, Minister for Health & Ageing
State Government Victoria The Hon David Davis, MLC, Minister for Health & Ageing
Hospital Board of Management President Mr. G.
Sheppard
Vice President Fr. A. Hayes
Members Mr. T. Baker (OAM) Mrs K. Black Mrs. C. Brown Mr R. Dalby Mr. P. Green Dr. T. Halloran Mr G. Smith
Audit Committee Mr. O. Stephens - CEO
Mr. G. Sheppard – Independent Member
Mrs. B. Toma – Finance Officer
Mrs. C. Brown – Chair (1/7/2012 – 15/11/2012) Mr. R. Dalby – Independent Member
Mrs K. Black – Chair (15/11/2012 – 30/6/2012)
Visiting Medical Staff Dr. B. S. Coulson: M.B.B.S., D.R.O.G., F.A.C.R.R.M.
Dr. M. Prozesky: M.B., ChB, (South Africa)
Dr. R. Taheri: M.B. (Mashad Uni Iran) G.P. Registrar
*Dr. N. Osman: M.D. (uni Gezira-Sudan) G.P. Registrar
Dr. S. Ansari: M.B.B.S. (Army Medical College – Pakistan)
Dr. Yao Zhang: M.B. (Uni of Med Sciences – Guangzhou)
Dr. T. N. Halloran: B.D., B.Sc. (Hons)
Mr. P. H. Tung: M.B., B.S., F.R.A.C.S.
Mr. S. Clifforth: M.B., B.S., F.R.A.C.S.
Dr. G. Coggins: M.B., B.S., F.R.A.C.P. Dr. C. de Kievit: M.B., B.S., D.R.A.N.Z.C.O.G.,
F.A.C.R.R.M.
Dr. K. Fielke: M.B., B.S., D.R.A.N.Z.C.O.G., F.A.C.R.R.M. Dr. P. Goodman: M.B., B.S., D.A., D.Obst., R.C.O.G.,
F.R.A.C.G.P.
Dr. J. D. Muir: M.B., ChB, D.A., F.R.C.A. Dr. T. J. Hodson: M.B., M.B.S., F.R.A.N.Z.C.O.
Dr. S. Perry: G.P. Anaesthesia F.R.A.C.G.P., B.M.B.S. (Flinders), B.S.C.,
D.C.H.
Dr. B. Gavankar: M.D., D.G.O., D.A., M.B.B.S.
Deakin Medical School *Dr. Sophia Ping
Royal Adelaide Interns Dr. Tara Reddy Dr. Michael Rooke Dr. Latifa Mah Dr. William Pham Dr. Michael Waters Dr Zlatan Zulgic Emeritus
Dr.A. F. Floyd: M.B., B.S., D.Obst, R.C.O.G.
Principal Officers Chief Executive Officer Mr. O. P. Stephens: B.Bus., A.C.H.S.E.
Manager Nursing Services Ms. M. Betson: N.P.,R.N., R.M., Cert. Critical Care, Nurse
Immuniser,MNsg.,FACN,
Nurse Unit Manager Acute Ward/AHS/Education Officer
Mrs. J. Coulter: R.N.,R.M., Cert IV Training& Assessment
Nurse Unit Manager Night Nurse in Charge /Quality Improvement
Mrs. H. Dillon: R.N.,R.M.Grad Cert Ad Nsg Practice (Rural Remote)
Nurse Unit Manager Acute Ward/AHS
Mr. S. Gill: R.N. Cert Aged Care
Nurse Unit Manager OR/Emergency/Infection Control Officer
Mrs. H. Gill: R.N.Cert Infection Control & Sterilisation MCNA
Nurse Unit Manager Residential Care
Mrs. K. Sealey: R.N., MCNA.
Nurse Unit Manager Community Health
Ms. S. Bramall: R.N., Grd Dip CH
Nurse Unit Manager Primary & Community Care
Ms Anne Pekin: R.N., Nurse Immuniser, Grad Cert Daibetes Ed.,
BA., Grad DipEd (Psychology)
Nurse Unit Manager District Nursing Service
*Mrs S. Nolte: R.N.
Programmed Activity Group Co-ordinator
*Mrs. J. Annett: EN, Diversional Therapist
Mrs S. Neill: Cert II Financial Svs., Cert III Disability
After Hours Supervisors
Mrs. S. Dehnert: R.N., R.M., IBCLC , Nurse Immuniser, Grad Dip
Child Maternal Health
Mrs Helen Dillon: R.N.,R.M.Grad Cert Ad Nsg Practice (Rural
Remote)
Mrs Alison Jenkins: R.N., Grad Cert Palliative Care, Grad Cert Ad Nsg Practice (Rural Remote)
Mr S. Bryan: R.N. B.N. Grad Cert Ad Nsg (Emergency Nursing)
Mr. S. Makore: R.N.
Administrative & Finance Officer Mrs. B. Toma
Health Information / Quality Improvement Mrs. H. Rees: Clinical Coder
Catering Services Supervisor Mr Mark Nolte
Environmental Services Supervisor *Mrs. L. Carter Mrs. E. Harvey
Maintenance Coordinator / Safety Mr. R. Tomkins
Meals on Wheels Coordinator Ms. V. Ross
Resigned during year
Casterton Memorial Hospital 105th Annual Report 2012 – 2013
3
Casterton Memorial Hospital - Small Rural Health Service (SRHS)
Demographics and Service profile
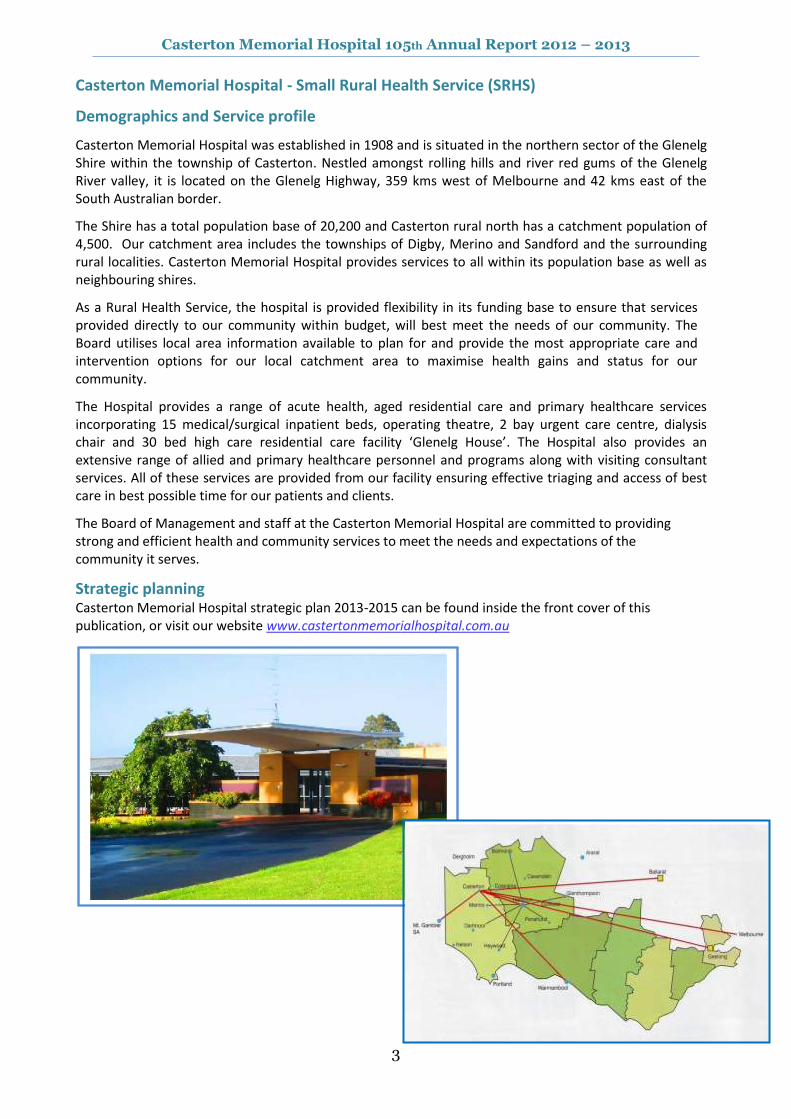
Casterton Memorial Hospital was established in 1908 and is situated in the northern sector of the Glenelg Shire within the township of Casterton. Nestled amongst rolling hills and river red gums of the Glenelg River valley, it is located on the Glenelg Highway, 359 kms west of Melbourne and 42 kms east of the South Australian border.
The Shire has a total population base of 20,200 and Casterton rural north has a catchment population of 4,500. Our catchment area includes the townships of Digby, Merino and Sandford and the surrounding rural localities. Casterton Memorial Hospital provides services to all within its population base as well as neighbouring shires.
As a Rural Health Service, the hospital is provided flexibility in its funding base to ensure that services provided directly to our community within budget, will best meet the needs of our community. The Board utilises local area information available to plan for and provide the most appropriate care and intervention options for our local catchment area to maximise health gains and status for our community.
The Hospital provides a range of acute health, aged residential care and primary healthcare services incorporating 15 medical/surgical inpatient beds, operating theatre, 2 bay urgent care centre, dialysis chair and 30 bed high care residential care facility ‘Glenelg House’. The Hospital also provides an extensive range of allied and primary healthcare personnel and programs along with visiting consultant services. All of these services are provided from our facility ensuring effective triaging and access of best care in best possible time for our patients and clients.
The Board of Management and staff at the Casterton Memorial Hospital are committed to providing strong and efficient health and community services to meet the needs and expectations of the community it serves.
Strategic planning Casterton Memorial Hospital strategic plan 2013-2015 can be found inside the front cover of this publication, or visit our website www.castertonmemorialhospital.com.au
Casterton Memorial Hospital 105th Annual Report 2012 – 2013
4
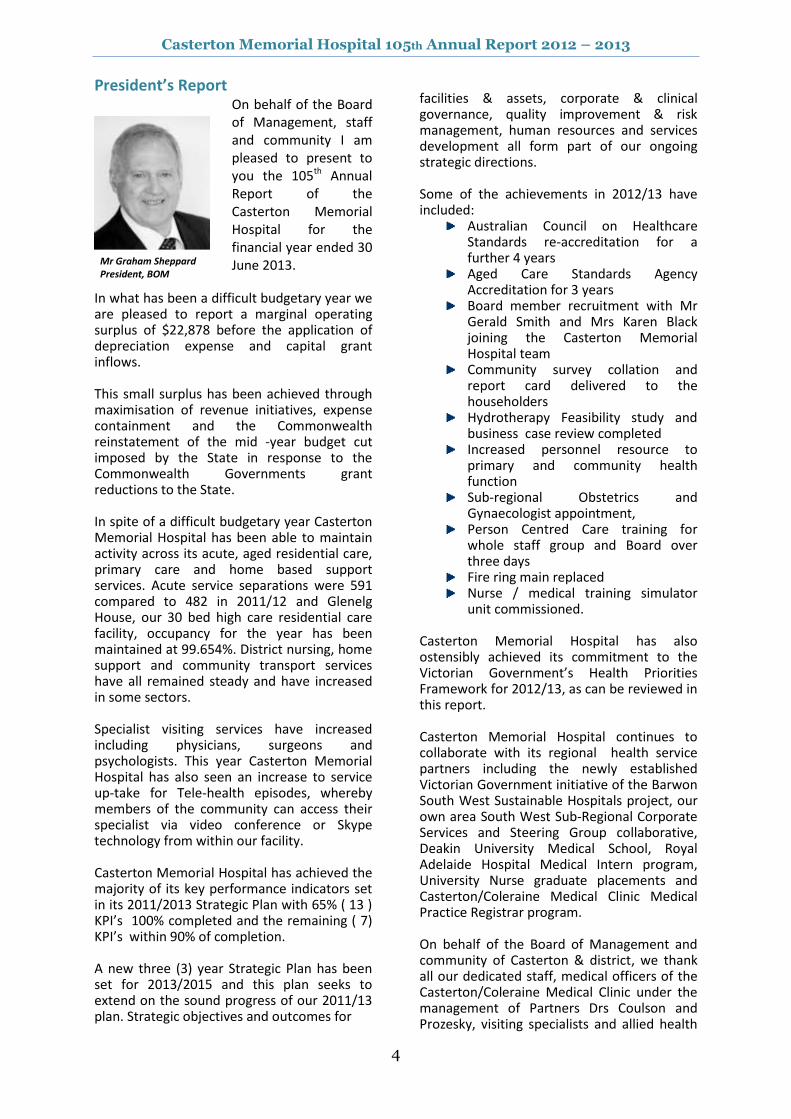
President’s Report On behalf of the Board of Management, staff and community I am pleased to present to you the 105th Annual Report of the Casterton Memorial Hospital for the financial year ended 30 June 2013.
In what has been a difficult budgetary year we are pleased to report a marginal operating surplus of $22,878 before the application of depreciation expense and capital grant inflows. This small surplus has been achieved through maximisation of revenue initiatives, expense containment and the Commonwealth reinstatement of the mid -year budget cut imposed by the State in response to the Commonwealth Governments grant reductions to the State. In spite of a difficult budgetary year Casterton Memorial Hospital has been able to maintain activity across its acute, aged residential care, primary care and home based support services. Acute service separations were 591 compared to 482 in 2011/12 and Glenelg House, our 30 bed high care residential care facility, occupancy for the year has been maintained at 99.654%. District nursing, home support and community transport services have all remained steady and have increased in some sectors. Specialist visiting services have increased including physicians, surgeons and psychologists. This year Casterton Memorial Hospital has also seen an increase to service up-take for Tele-health episodes, whereby members of the community can access their specialist via video conference or Skype technology from within our facility. Casterton Memorial Hospital has achieved the majority of its key performance indicators set in its 2011/2013 Strategic Plan with 65% ( 13 ) KPI’s 100% completed and the remaining ( 7) KPI’s within 90% of completion. A new three (3) year Strategic Plan has been set for 2013/2015 and this plan seeks to extend on the sound progress of our 2011/13 plan. Strategic objectives and outcomes for
facilities & assets, corporate & clinical governance, quality improvement & risk management, human resources and services development all form part of our ongoing strategic directions. Some of the achievements in 2012/13 have included:
Australian Council on Healthcare Standards re-accreditation for a further 4 years
Aged Care Standards Agency Accreditation for 3 years
Board member recruitment with Mr Gerald Smith and Mrs Karen Black joining the Casterton Memorial Hospital team
Community survey collation and report card delivered to the householders
Hydrotherapy Feasibility study and business case review completed
Increased personnel resource to primary and community health function
Sub-regional Obstetrics and Gynaecologist appointment,
Person Centred Care training for whole staff group and Board over three days
Fire ring main replaced Nurse / medical training simulator
unit commissioned.
Casterton Memorial Hospital has also ostensibly achieved its commitment to the Victorian Government’s Health Priorities Framework for 2012/13, as can be reviewed in this report. Casterton Memorial Hospital continues to collaborate with its regional health service partners including the newly established Victorian Government initiative of the Barwon South West Sustainable Hospitals project, our own area South West Sub-Regional Corporate Services and Steering Group collaborative, Deakin University Medical School, Royal Adelaide Hospital Medical Intern program, University Nurse graduate placements and Casterton/Coleraine Medical Clinic Medical Practice Registrar program. On behalf of the Board of Management and community of Casterton & district, we thank all our dedicated staff, medical officers of the Casterton/Coleraine Medical Clinic under the management of Partners Drs Coulson and Prozesky, visiting specialists and allied health
Mr Graham Sheppard President, BOM
Casterton Memorial Hospital 105th Annual Report 2012 – 2013
5
personnel, ambulance service paramedics, partner organisations and of course our dedicated groups of volunteers whom support Casterton Memorial Hospital and the community in so many ways. I would especially like to acknowledge and recognise this year the 21st year of operations and fundraising support by the Casterton Memorial Hospital’s Murray to Moyne Cycle Relay team and committee having raised $157,752.49 in this time. A fantastic achievement in support of Casterton Memorial Hospital’s needs.
Finally I wish to thank and commend the work of my fellow Board of Management colleagues and Executive in Mary-Anne and Owen in managing and keeping the directions of Casterton Memorial Hospital efficient and relevant for the community that we serve.
Mr Graham Sheppard Board Chair 12th August,2013
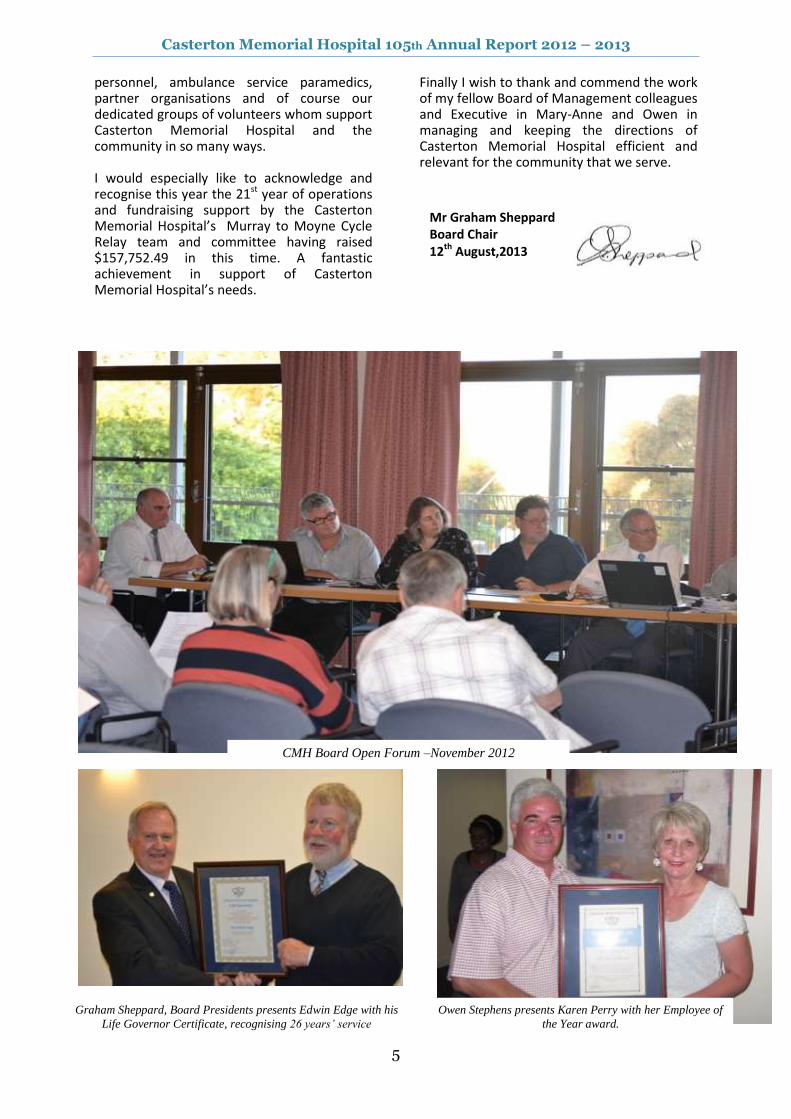
CMH Board Open Forum –November 2012
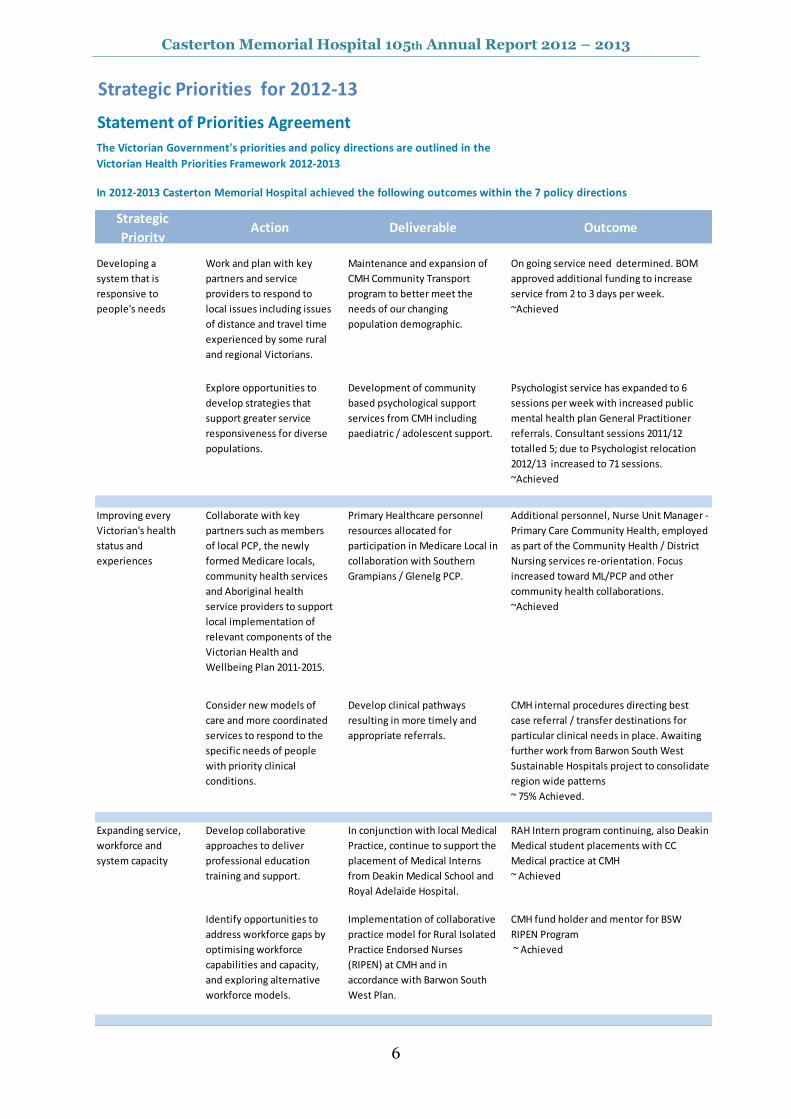
Graham Sheppard, Board Presidents presents Edwin Edge with his
Life Governor Certificate, recognising 26 years’ service
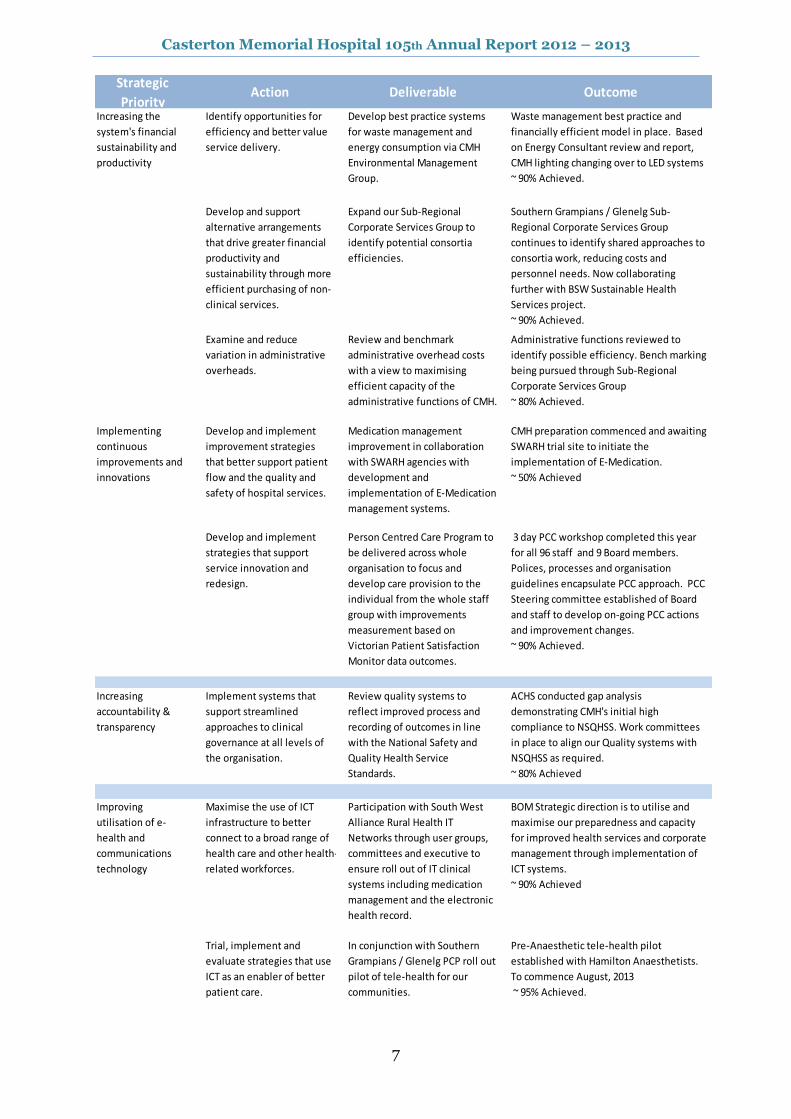
Owen Stephens presents Karen Perry with her Employee of
the Year award.
Casterton Memorial Hospital 105th Annual Report 2012 – 2013
6
Strategic Priorities for 2012-13
Statement of Priorities Agreement
In 2012-2013 Casterton Memorial Hospital achieved the following outcomes within the 7 policy directions
Strategic
PriorityAction Deliverable Outcome
Developing a
system that is
responsive to
people's needs
Work and plan with key
partners and service
providers to respond to
local issues including issues
of distance and travel time
experienced by some rural
and regional Victorians.
Maintenance and expansion of
CMH Community Transport
program to better meet the
needs of our changing
population demographic.
On going service need determined. BOM
approved additional funding to increase
service from 2 to 3 days per week.
~Achieved
Explore opportunities to
develop strategies that
support greater service
responsiveness for diverse
populations.
Development of community
based psychological support
services from CMH including
paediatric / adolescent support.
Psychologist service has expanded to 6
sessions per week with increased public
mental health plan General Practitioner
referrals. Consultant sessions 2011/12
totalled 5; due to Psychologist relocation
2012/13 increased to 71 sessions.
~Achieved
Improving every
Victorian's health
status and
experiences
Collaborate with key
partners such as members
of local PCP, the newly
formed Medicare locals,
community health services
and Aboriginal health
service providers to support
local implementation of
relevant components of the
Victorian Health and
Wellbeing Plan 2011-2015.
Primary Healthcare personnel
resources allocated for
participation in Medicare Local in
collaboration with Southern
Grampians / Glenelg PCP.
Additional personnel, Nurse Unit Manager -
Primary Care Community Health, employed
as part of the Community Health / District
Nursing services re-orientation. Focus
increased toward ML/PCP and other
community health collaborations.
~Achieved
Consider new models of
care and more coordinated
services to respond to the
specific needs of people
with priority clinical
conditions.
Develop clinical pathways
resulting in more timely and
appropriate referrals.
CMH internal procedures directing best
case referral / transfer destinations for
particular clinical needs in place. Awaiting
further work from Barwon South West
Sustainable Hospitals project to consolidate
region wide patterns
~ 75% Achieved.
Expanding service,
workforce and
system capacity
Develop collaborative
approaches to deliver
professional education
training and support.
In conjunction with local Medical
Practice, continue to support the
placement of Medical Interns
from Deakin Medical School and
Royal Adelaide Hospital.
RAH Intern program continuing, also Deakin
Medical student placements with CC
Medical practice at CMH
~ Achieved
Identify opportunities to
address workforce gaps by
optimising workforce
capabilities and capacity,
and exploring alternative
workforce models.
Implementation of collaborative
practice model for Rural Isolated
Practice Endorsed Nurses
(RIPEN) at CMH and in
accordance with Barwon South
West Plan.
CMH fund holder and mentor for BSW
RIPEN Program
~ Achieved
The Victorian Government's priorities and policy directions are outlined in the
Victorian Health Priorities Framework 2012-2013
Casterton Memorial Hospital 105th Annual Report 2012 – 2013
7
Strategic
PriorityAction Deliverable Outcome
Increasing the
system's financial
sustainability and
productivity
Identify opportunities for
efficiency and better value
service delivery.
Develop best practice systems
for waste management and
energy consumption via CMH
Environmental Management
Group.
Waste management best practice and
financially efficient model in place. Based
on Energy Consultant review and report,
CMH lighting changing over to LED systems
~ 90% Achieved.
Develop and support
alternative arrangements
that drive greater financial
productivity and
sustainability through more
efficient purchasing of non-
clinical services.
Expand our Sub-Regional
Corporate Services Group to
identify potential consortia
efficiencies.
Southern Grampians / Glenelg Sub-
Regional Corporate Services Group
continues to identify shared approaches to
consortia work, reducing costs and
personnel needs. Now collaborating
further with BSW Sustainable Health
Services project.
~ 90% Achieved.
Examine and reduce
variation in administrative
overheads.
Review and benchmark
administrative overhead costs
with a view to maximising
efficient capacity of the
administrative functions of CMH.
Administrative functions reviewed to
identify possible efficiency. Bench marking
being pursued through Sub-Regional
Corporate Services Group
~ 80% Achieved.
Implementing
continuous
improvements and
innovations
Develop and implement
improvement strategies
that better support patient
flow and the quality and
safety of hospital services.
Medication management
improvement in collaboration
with SWARH agencies with
development and
implementation of E-Medication
management systems.
CMH preparation commenced and awaiting
SWARH trial site to initiate the
implementation of E-Medication.
~ 50% Achieved
Develop and implement
strategies that support
service innovation and
redesign.
Person Centred Care Program to
be delivered across whole
organisation to focus and
develop care provision to the
individual from the whole staff
group with improvements
measurement based on
Victorian Patient Satisfaction
Monitor data outcomes.
3 day PCC workshop completed this year
for all 96 staff and 9 Board members.
Polices, processes and organisation
guidelines encapsulate PCC approach. PCC
Steering committee established of Board
and staff to develop on-going PCC actions
and improvement changes.
~ 90% Achieved.
Increasing
accountability &
transparency
Implement systems that
support streamlined
approaches to clinical
governance at all levels of
the organisation.
Review quality systems to
reflect improved process and
recording of outcomes in line
with the National Safety and
Quality Health Service
Standards.
ACHS conducted gap analysis
demonstrating CMH's initial high
compliance to NSQHSS. Work committees
in place to align our Quality systems with
NSQHSS as required.
~ 80% Achieved
Improving
utilisation of e-
health and
communications
technology
Maximise the use of ICT
infrastructure to better
connect to a broad range of
health care and other health-
related workforces.
Participation with South West
Alliance Rural Health IT
Networks through user groups,
committees and executive to
ensure roll out of IT clinical
systems including medication
management and the electronic
health record.
BOM Strategic direction is to utilise and
maximise our preparedness and capacity
for improved health services and corporate
management through implementation of
ICT systems.
~ 90% Achieved
Trial, implement and
evaluate strategies that use
ICT as an enabler of better
patient care.
In conjunction with Southern
Grampians / Glenelg PCP roll out
pilot of tele-health for our
communities.
Pre-Anaesthetic tele-health pilot
established with Hamilton Anaesthetists.
To commence August, 2013
~ 95% Achieved.
Casterton Memorial Hospital 105th Annual Report 2012 – 2013
8
Performance Indicators Activity & Funding
Service Performance Target 2012-2013 Actual
Quality and Safety
Health service Accreditation Full compliance Achieved
Residential aged care accreditation Full compliance Achieved
Cleaning standards Full compliance Achieved
Submission of data to VICNISS (1) Full compliance Achieved
Hand Hygiene (rate) 70 64
Victorian Patient Satisfaction Monitor. (OCI) (2) 73 91
Consumer Participation Indicator (3) 75 90.46
People Matter Survey Full compilance Achieved
(1) VICNISS i s the Victorian Hospita l Acquired Infection Survei l lance System.
(2) The target for the Victorian Patient Satis faction Monitor i s the overa l l Care index (OCI) which comprises 6 categories .
(3) The consumer Participation Indicator i s a category of the Victorian Patient Satis faction Monitor.
Environmental Management Casterton Memorial Hospital’s environmental management is through their bi monthly Environmental Management Committee which reports to the Board of Management. Responsibilities include developing and monitoring strategies to reduce the environmental impacts of the Hospital. Staff input is encouraged by way of questionnaires and staff newsletters.
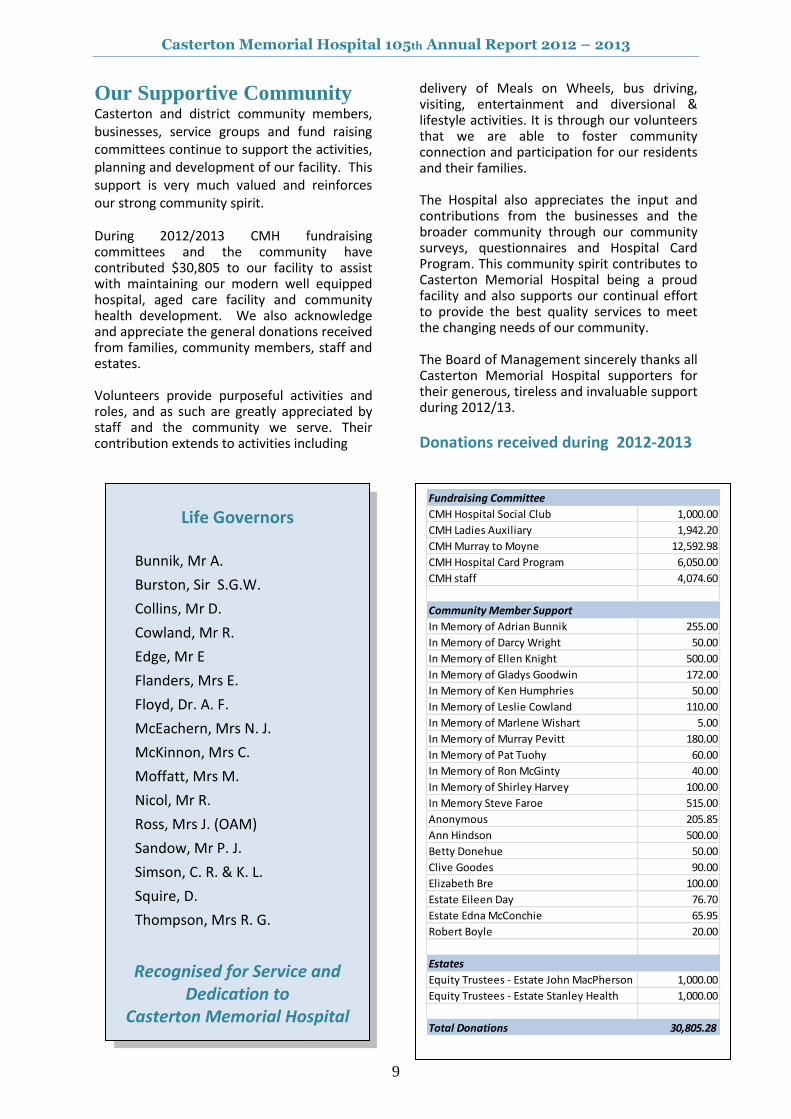
78 80 82 84 86 88 90 92
Overall Care
General Patient Information
Complaints Management
Discharge & Follow-up
Statewide benchmark data comparing Casterton Memorial Hospital with Category D Hospitals
Victorian Patient Satisfaction Monitor
Casterton Memorial Hospital Category D Hospitals
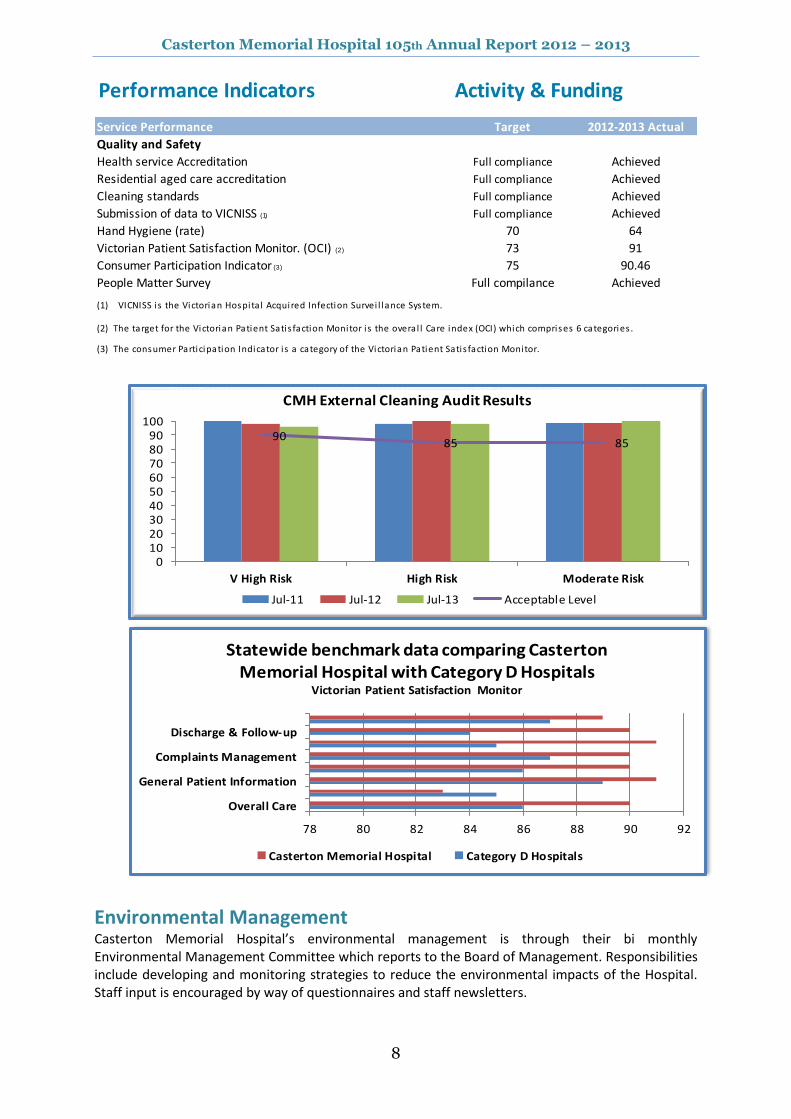
9085 85
0102030405060708090
100
V High Risk High Risk Moderate Risk
CMH External Cleaning Audit Results
Jul-11 Jul-12 Jul-13 Acceptable Level
Casterton Memorial Hospital 105th Annual Report 2012 – 2013
9
Our Supportive Community Casterton and district community members, businesses, service groups and fund raising committees continue to support the activities, planning and development of our facility. This support is very much valued and reinforces our strong community spirit. During 2012/2013 CMH fundraising committees and the community have contributed $30,805 to our facility to assist with maintaining our modern well equipped hospital, aged care facility and community health development. We also acknowledge and appreciate the general donations received from families, community members, staff and estates. Volunteers provide purposeful activities and roles, and as such are greatly appreciated by staff and the community we serve. Their contribution extends to activities including
delivery of Meals on Wheels, bus driving, visiting, entertainment and diversional & lifestyle activities. It is through our volunteers that we are able to foster community connection and participation for our residents and their families. The Hospital also appreciates the input and contributions from the businesses and the broader community through our community surveys, questionnaires and Hospital Card Program. This community spirit contributes to Casterton Memorial Hospital being a proud facility and also supports our continual effort to provide the best quality services to meet the changing needs of our community. The Board of Management sincerely thanks all Casterton Memorial Hospital supporters for their generous, tireless and invaluable support during 2012/13.
Donations received during 2012-2013
Life Governors
Bunnik, Mr A.
Burston, Sir S.G.W.
Collins, Mr D.
Cowland, Mr R.
Edge, Mr E
Flanders, Mrs E.
Floyd, Dr. A. F.
McEachern, Mrs N. J.
McKinnon, Mrs C.
Moffatt, Mrs M.
Nicol, Mr R.
Ross, Mrs J. (OAM)
Sandow, Mr P. J.
Simson, C. R. & K. L.
Squire, D.
Thompson, Mrs R. G.
Recognised for Service and Dedication to
Casterton Memorial Hospital
Fundraising Committee
CMH Hospital Social Club 1,000.00
CMH Ladies Auxiliary 1,942.20
CMH Murray to Moyne 12,592.98
CMH Hospital Card Program 6,050.00
CMH staff 4,074.60
Community Member Support
In Memory of Adrian Bunnik 255.00
In Memory of Darcy Wright 50.00
In Memory of Ellen Knight 500.00
In Memory of Gladys Goodwin 172.00
In Memory of Ken Humphries 50.00
In Memory of Leslie Cowland 110.00
In Memory of Marlene Wishart 5.00
In Memory of Murray Pevitt 180.00
In Memory of Pat Tuohy 60.00
In Memory of Ron McGinty 40.00
In Memory of Shirley Harvey 100.00
In Memory Steve Faroe 515.00
Anonymous 205.85
Ann Hindson 500.00
Betty Donehue 50.00
Clive Goodes 90.00
Elizabeth Bre 100.00
Estate Eileen Day 76.70
Estate Edna McConchie 65.95
Robert Boyle 20.00
Estates
Equity Trustees - Estate John MacPherson 1,000.00
Equity Trustees - Estate Stanley Health 1,000.00
Total Donations 30,805.28
Casterton Memorial Hospital 105th Annual Report 2012 – 2013
10
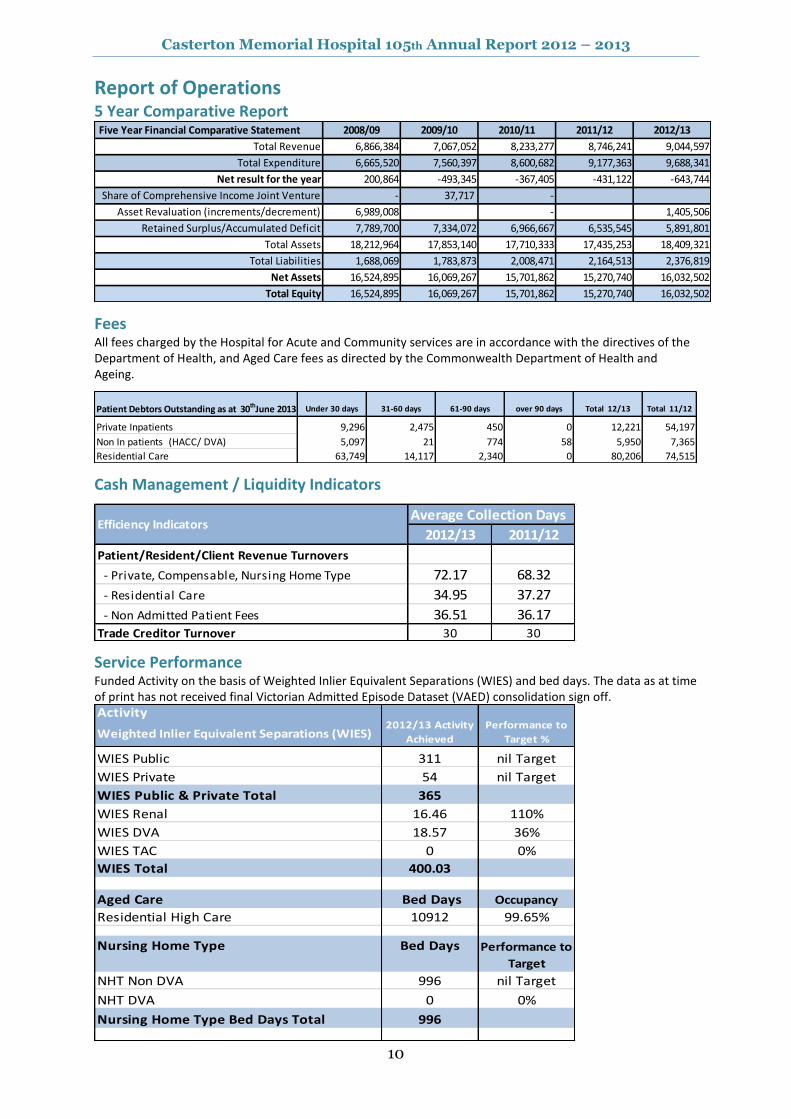
Report of Operations 5 Year Comparative Report Five Year Financial Comparative Statement 2008/09 2009/10 2010/11 2011/12 2012/13
Total Revenue 6,866,384 7,067,052 8,233,277 8,746,241 9,044,597
Total Expenditure 6,665,520 7,560,397 8,600,682 9,177,363 9,688,341
Net result for the year 200,864 -493,345 -367,405 -431,122 -643,744
Share of Comprehensive Income Joint Venture - 37,717 -
Asset Revaluation (increments/decrement) 6,989,008 - 1,405,506
Retained Surplus/Accumulated Deficit 7,789,700 7,334,072 6,966,667 6,535,545 5,891,801
Total Assets 18,212,964 17,853,140 17,710,333 17,435,253 18,409,321
Total Liabilities 1,688,069 1,783,873 2,008,471 2,164,513 2,376,819
Net Assets 16,524,895 16,069,267 15,701,862 15,270,740 16,032,502
Total Equity 16,524,895 16,069,267 15,701,862 15,270,740 16,032,502
Fees All fees charged by the Hospital for Acute and Community services are in accordance with the directives of the Department of Health, and Aged Care fees as directed by the Commonwealth Department of Health and Ageing.
Patient Debtors Outstanding as at 30thJune 2013 Under 30 days 31-60 days 61-90 days over 90 days Total 12/13 Total 11/12
Private Inpatients 9,296 2,475 450 0 12,221 54,197
Non In patients (HACC/ DVA) 5,097 21 774 58 5,950 7,365
Residential Care 63,749 14,117 2,340 0 80,206 74,515
Cash Management / Liquidity Indicators
Average Collection Days
2012/13 2011/12
Patient/Resident/Client Revenue Turnovers
- Private, Compensable, Nursing Home Type 72.17 68.32
- Residential Care 34.95 37.27
- Non Admitted Patient Fees 36.51 36.17Trade Creditor Turnover 30 30
Efficiency Indicators
Service Performance Funded Activity on the basis of Weighted Inlier Equivalent Separations (WIES) and bed days. The data as at time of print has not received final Victorian Admitted Episode Dataset (VAED) consolidation sign off. Activity
Weighted Inlier Equivalent Separations (WIES)
WIES Public 311 nil Target
WIES Private 54 nil Target
WIES Public & Private Total 365
WIES Renal 16.46 110%
WIES DVA 18.57 36%
WIES TAC 0 0%
WIES Total 400.03
Aged Care Bed Days Occupancy
Residential High Care 10912 99.65%
Nursing Home Type
NHT Non DVA 996 nil Target
NHT DVA 0 0%
Nursing Home Type Bed Days Total 996
Bed Days Performance to
Target
2012/13 Activity
Achieved
Performance to
Target %
Casterton Memorial Hospital 105th Annual Report 2012 – 2013
11
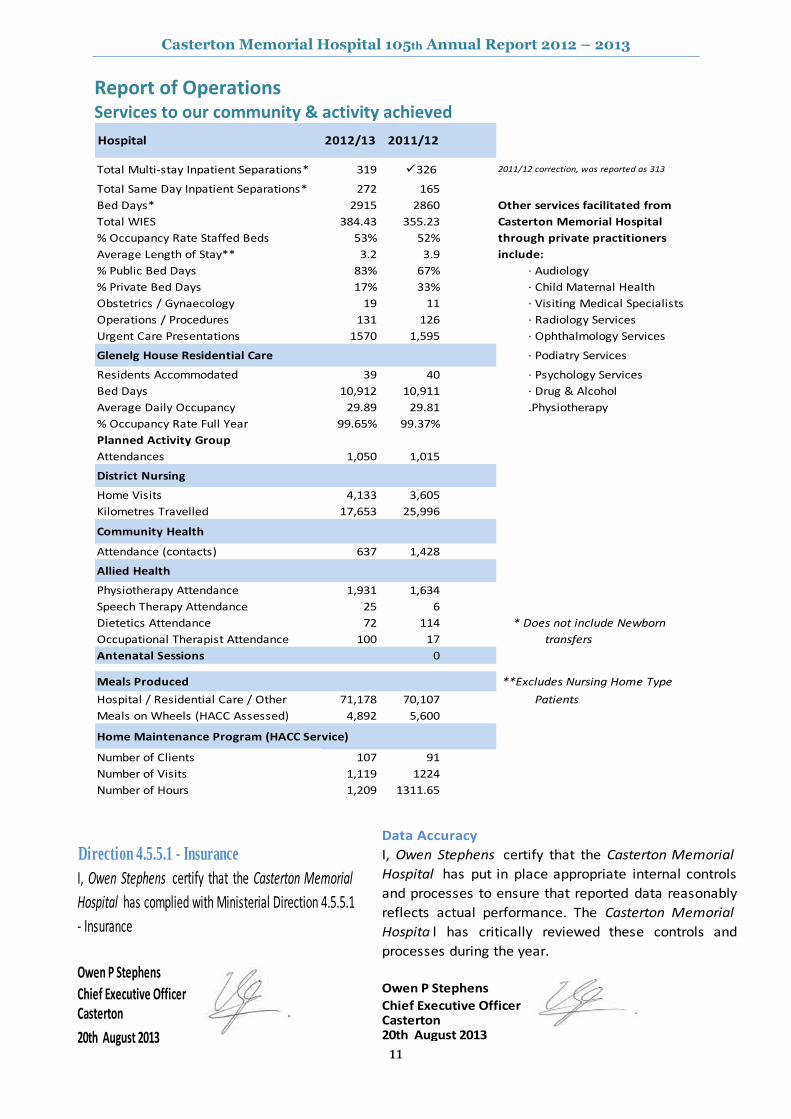
Report of Operations Services to our community & activity achieved
Hospital 2012/13 2011/12
Total Multi-stay Inpatient Separations* 319 326 2011/12 correction, was reported as 313
Total Same Day Inpatient Separations* 272 165
Bed Days* 2915 2860 Other services facilitated from
Total WIES 384.43 355.23 Casterton Memorial Hospital
% Occupancy Rate Staffed Beds 53% 52% through private practitioners
Average Length of Stay** 3.2 3.9 include:
% Public Bed Days 83% 67% · Audiology
% Private Bed Days 17% 33% · Child Maternal Health
Obstetrics / Gynaecology 19 11 · Visiting Medical Specialists
Operations / Procedures 131 126 · Radiology Services
Urgent Care Presentations 1570 1,595 · Ophthalmology Services
Glenelg House Residential Care · Podiatry Services
Residents Accommodated 39 40 · Psychology Services
Bed Days 10,912 10,911 · Drug & Alcohol
Average Daily Occupancy 29.89 29.81 .Physiotherapy
% Occupancy Rate Full Year 99.65% 99.37%
Planned Activity Group
Attendances 1,050 1,015
District Nursing
Home Visits 4,133 3,605
Kilometres Travelled 17,653 25,996
Community Health
Attendance (contacts) 637 1,428
Allied Health
Physiotherapy Attendance 1,931 1,634
Speech Therapy Attendance 25 6
Dietetics Attendance 72 114 * Does not include Newborn
Occupational Therapist Attendance 100 17 transfers
Antenatal Sessions 0
Meals Produced **Excludes Nursing Home Type
Hospital / Residential Care / Other 71,178 70,107 Patients
Meals on Wheels (HACC Assessed) 4,892 5,600
Number of Clients 107 91
Number of Visits 1,119 1224
Number of Hours 1,209 1311.65
Home Maintenance Program (HACC Service)
Data Accuracy
I, Owen Stephens certify that the Casterton Memorial
Hospital has put in place appropriate internal controls
and processes to ensure that reported data reasonably
reflects actual performance. The Casterton Memorial
Hospita l has critically reviewed these controls and
processes during the year.
Owen P Stephens
Chief Executive OfficerCasterton20th August 2013
Direction 4.5.5.1 - Insurance
I, Owen Stephens certify that the Casterton Memorial
Hospital has complied with Ministerial Direction 4.5.5.1
- Insurance
Owen P Stephens
Chief Executive OfficerCasterton
20th August 2013
Casterton Memorial Hospital 105th Annual Report 2012 – 2013
12
Report on Operations Occupational Health & Safety Occupational Health & Safety forms an integral part of the day to day operation of Casterton Memorial Hospital. The Safe Environment / OH&S Committee consist of representatives from each of the designated work group areas as well as management representatives. This committee meets quarterly to discuss and address any concerns or issues that may arise and undertake regular inspections of the workplace. All Designated Work Group Representatives undergo the initial 5 Day Course for OH&S Representatives along with regular refresher courses. Staff are encouraged to act and work in a safe manner and to report any incidents or near misses. Through the operation of the Safe Environment/OH&S Committee, Minimal Handling Committee, staff education and incident reporting, through VHIMS, Casterton Memorial Hospital is continuing to ensure the safety of staff, patients and visitors.
The Casterton Memorial Hospital Work-Safe Industry indicative performance rating is 0.758158. This represents that the comparison of Casterton Memorial Hospital claim costs compared to remuneration is 24.18% better than the average for our industry over the past three years. No workcover claims were registered during 2012-2013 and the facility has currently a nil claims history.
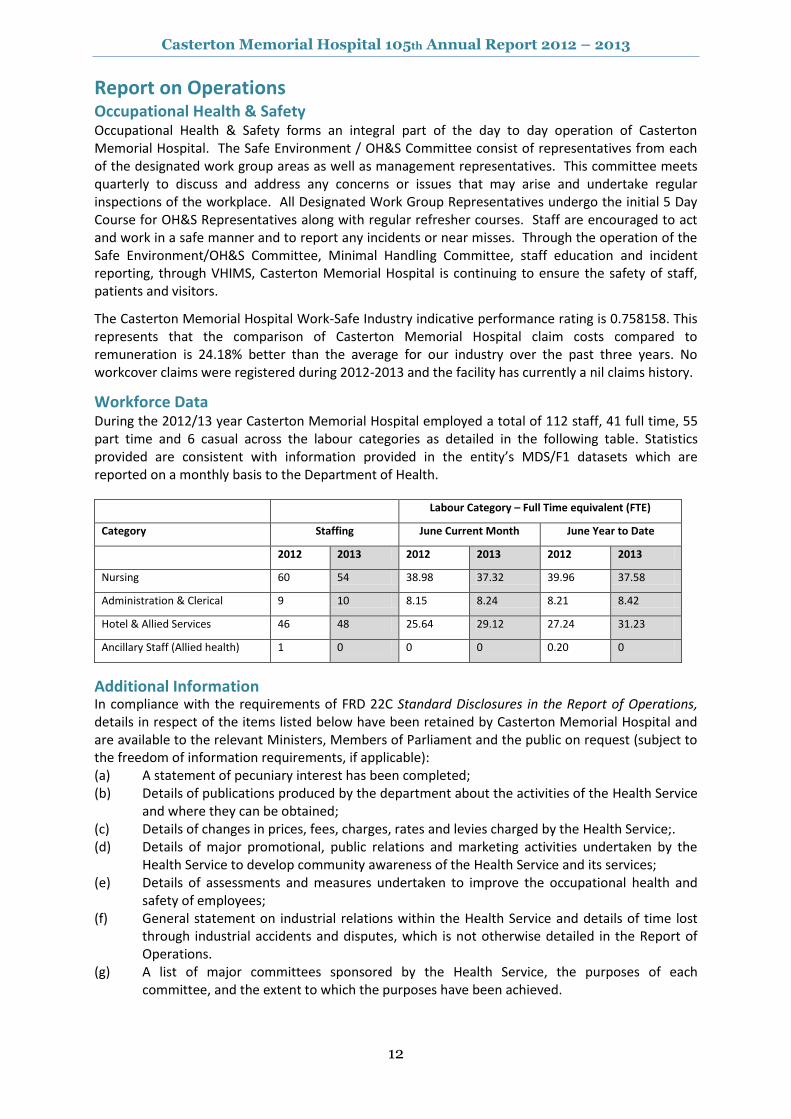
Workforce Data During the 2012/13 year Casterton Memorial Hospital employed a total of 112 staff, 41 full time, 55 part time and 6 casual across the labour categories as detailed in the following table. Statistics provided are consistent with information provided in the entity’s MDS/F1 datasets which are reported on a monthly basis to the Department of Health.
Labour Category – Full Time equivalent (FTE)
Category Staffing June Current Month June Year to Date
2012 2013 2012 2013 2012 2013
Nursing 60 54 38.98 37.32 39.96 37.58
Administration & Clerical 9 10 8.15 8.24 8.21 8.42
Hotel & Allied Services 46 48 25.64 29.12 27.24 31.23
Ancillary Staff (Allied health) 1 0 0 0 0.20 0
Additional Information In compliance with the requirements of FRD 22C Standard Disclosures in the Report of Operations, details in respect of the items listed below have been retained by Casterton Memorial Hospital and are available to the relevant Ministers, Members of Parliament and the public on request (subject to the freedom of information requirements, if applicable): (a) A statement of pecuniary interest has been completed; (b) Details of publications produced by the department about the activities of the Health Service
and where they can be obtained; (c) Details of changes in prices, fees, charges, rates and levies charged by the Health Service;. (d) Details of major promotional, public relations and marketing activities undertaken by the
Health Service to develop community awareness of the Health Service and its services; (e) Details of assessments and measures undertaken to improve the occupational health and
safety of employees; (f) General statement on industrial relations within the Health Service and details of time lost
through industrial accidents and disputes, which is not otherwise detailed in the Report of Operations.
(g) A list of major committees sponsored by the Health Service, the purposes of each committee, and the extent to which the purposes have been achieved.
Casterton Memorial Hospital 105th Annual Report 2012 – 2013
13
Statutory & Regulatory Compliance
The Casterton Memorial Hospital conducts its activities with compliance to many Government Acts, Regulations and Standards. It is a legislative requirement that we provide, where applicable, specific information in support of our compliance.
The Casterton Memorial Hospital is a public health facility established under the Health Services Act 1988. The responsible Ministers during the reporting period are:
Commonwealth Government The Hon Tanya Plibersek MP, Minister for Health & Ageing State Government Victoria The Hon David Davis, MLC, Minister for Health and Ageing
Consultancies During the 2012/2013 financial year Casterton Memorial Hospital reports a nil engagement of any consultants
Building Act 1993 Casterton Memorial Hospital complies with the building and maintenance provisions of the Building Act 1993 in accordance with the Minister for Finance Guidelines Building Act 1993/Standards for Publicly Owned Buildings/November, 1994.
Freedom of Information The Victorian Freedom of Information Act 1982 (FOI Act) provides the right for members of the public to obtain information held by the Casterton Memorial Hospital and consumers are entitled to access their medical record through the Freedom of Information process. Seven (7) Freedom of Information requests were processed this Financial Year. Applications are to be directed to the nominated Officer, Mr Owen Stephens. A fee, plus charges for associated costs may apply in accordance with the Act.
National Competition Policy) Casterton Memorial Hospital has implemented competitive neutral pricing principles to all contracts for services provided, to ensure a level playing field is maintained in accordance with National Competition Policy including the requirements of the Government policy statement, Competitive Neutrality Policy, Victoria; and subsequent reforms. Contract Disclosures There were no contracts commenced or completed during this reporting period to which the Victorian Industry Participation Policy (VIPP) Act 2003 applied.
Equal Employment Opportunity – Merit & Equity The Board of Management at Casterton Memorial Hospital has a firm commitment to ensure equity principles in the workforce are maintained. Human Resource policies and practices give due consideration to public authorities ‘Code of Conduct’ and the Equal Employment Opportunity (EEO) Act, 1995. The facility provides extensive opportunities for staff professional development.
Compliance with Australian/New Zealand Risk Management Standard I, Owen Stephens certify that the Casterton Memorial Hospital has risk management processes in place consistent with the Australian/New Zealand Risk Management Standard and an internal control system is in place that enables the executive to understand, manage and satisfactorily control risk exposures. The Audit Committee verifies this assurance and that the risk profile of the Casterton Memorial Hospital
has been critically reviewed within the last 12 months. Owen P Stephens Chief Executive Officer Casterton 20
th August 2013
In accordance with the Financial Management Act 1994, I am pleased to present the Report of Operations for the Casterton Memorial Hospital for the year ending 30 June, 2013.
Mr Graham Sheppard Board Chair 12th August,2013
Casterton Memorial Hospital 105th Annual Report 2012 – 2013
14
Finance & Activity Overview: Casterton Memorial Hospital’s financial statements of account for the year ended 30th June, 2013 have been completed in accordance with the Australian Audit and Accounting Standards and the Financial Management Act 1994.
Casterton Memorial Hospital’s 2012/13 result has been pleasing given the difficult financial budgetary year.
Net Operating Result - before capital & specific items 2011/12 Result 2012/13 Result 2012/13 Budget Prior Yr Movement
$351,323 $22,878 $7,000 -$328,445
Our small Operating Surplus of $22,878, compared to 2011/12 year is considerably reduced, however came in slightly over budget and achieved despite a Department recall of $248,838; the result of under achieved DVA activity (WIES) targets set within our budget. Also with 2012/13 reductions to our Commonwealth Aged Care subsidies totalling $66,540.
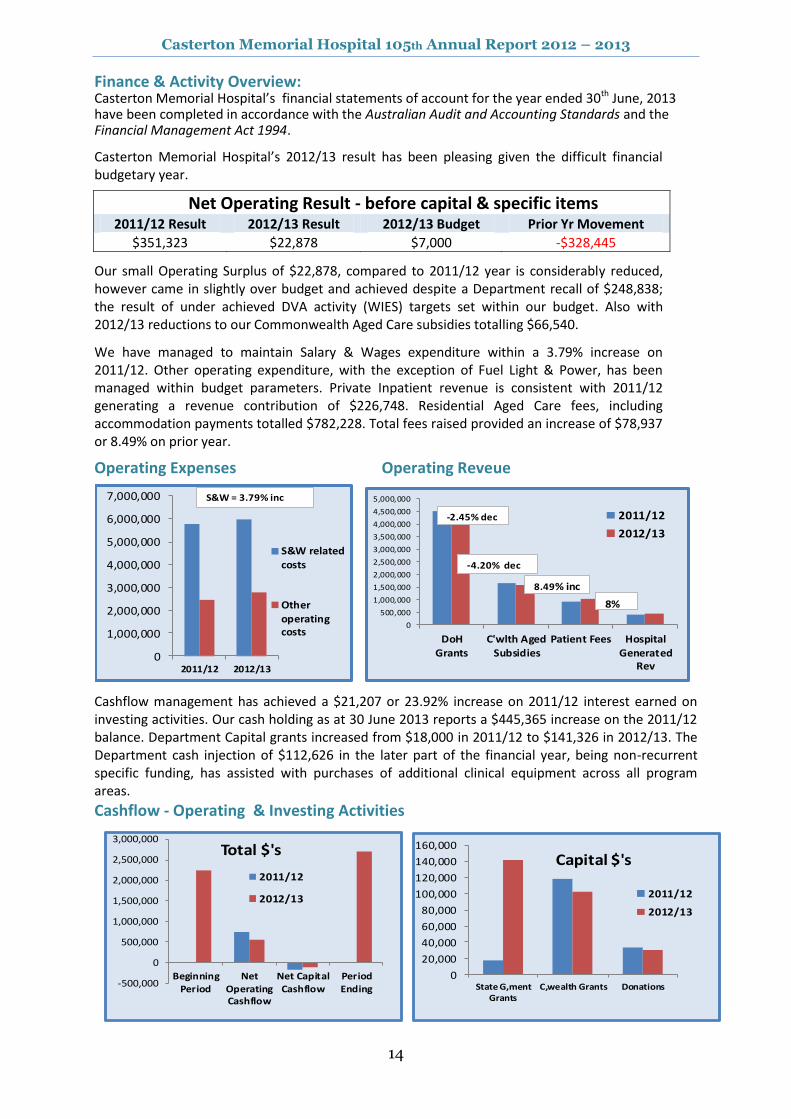
We have managed to maintain Salary & Wages expenditure within a 3.79% increase on 2011/12. Other operating expenditure, with the exception of Fuel Light & Power, has been managed within budget parameters. Private Inpatient revenue is consistent with 2011/12 generating a revenue contribution of $226,748. Residential Aged Care fees, including accommodation payments totalled $782,228. Total fees raised provided an increase of $78,937 or 8.49% on prior year.
Operating Expenses Operating Reveue
Operating Revenue
0
1,000,000
2,000,000
3,000,000
4,000,000
5,000,000
6,000,000
7,000,000
2011/12 2012/13
S&W related
costs
Other
operatingcosts
S&W = 3.79% inc
0
500,000
1,000,000
1,500,000
2,000,000
2,500,000
3,000,000
3,500,000
4,000,000
4,500,000
5,000,000
DoHGrants
C'wlth AgedSubsidies
Patient Fees HospitalGenerated
Rev
2011/12
2012/13
8%
-4.20% dec
-2.45% dec
8.49% inc
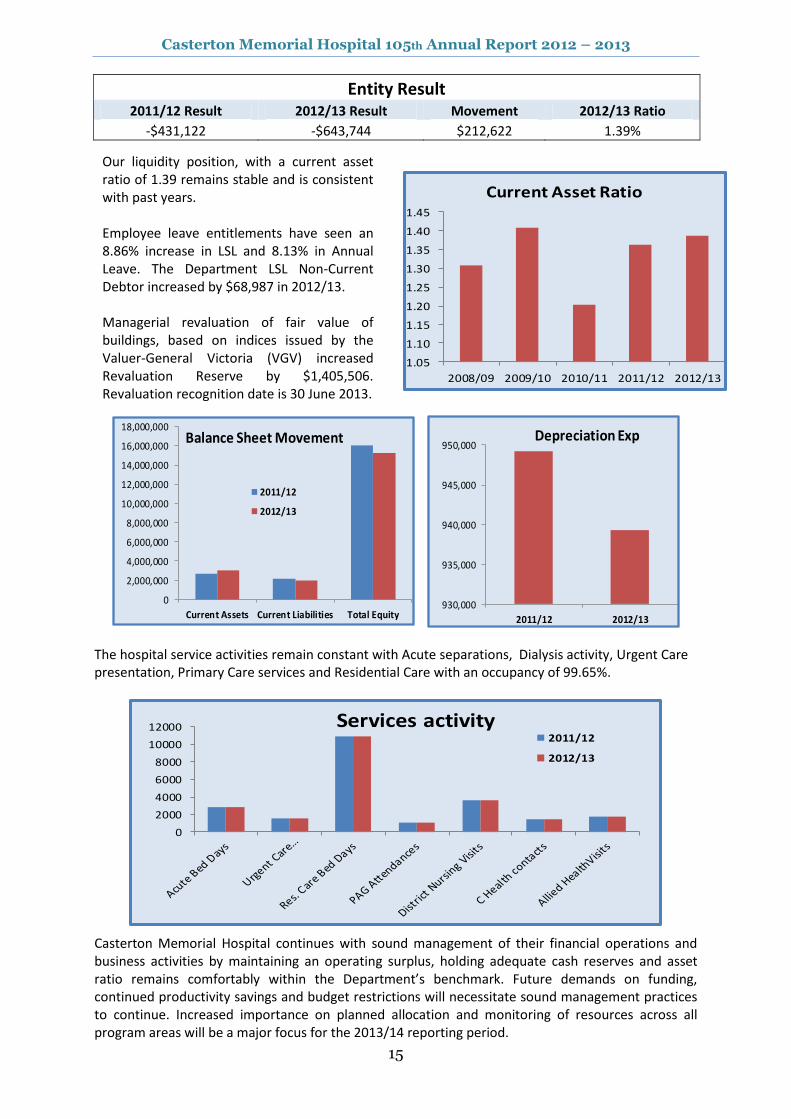
Cashflow management has achieved a $21,207 or 23.92% increase on 2011/12 interest earned on investing activities. Our cash holding as at 30 June 2013 reports a $445,365 increase on the 2011/12 balance. Department Capital grants increased from $18,000 in 2011/12 to $141,326 in 2012/13. The Department cash injection of $112,626 in the later part of the financial year, being non-recurrent specific funding, has assisted with purchases of additional clinical equipment across all program areas.
Cashflow - Operating & Investing Activities
0
20,000
40,000
60,000
80,000
100,000
120,000
140,000
160,000
State G,mentGrants
C,wealth Grants Donations
Capital $'s
2011/12
2012/13
-500,000
0
500,000
1,000,000
1,500,000
2,000,000
2,500,000
3,000,000
BeginningPeriod
NetOperatingCashflow
Net CapitalCashflow
PeriodEnding
Total $'s
2011/12
2012/13
Casterton Memorial Hospital 105th Annual Report 2012 – 2013
15
Entity Result 2011/12 Result 2012/13 Result Movement 2012/13 Ratio
-$431,122 -$643,744 $212,622 1.39%
The hospital service activities remain constant with Acute separations, Dialysis activity, Urgent Care presentation, Primary Care services and Residential Care with an occupancy of 99.65%.
0
2000
4000
6000
8000
10000
12000 Services activity2011/12
2012/13
Casterton Memorial Hospital continues with sound management of their financial operations and business activities by maintaining an operating surplus, holding adequate cash reserves and asset ratio remains comfortably within the Department’s benchmark. Future demands on funding, continued productivity savings and budget restrictions will necessitate sound management practices to continue. Increased importance on planned allocation and monitoring of resources across all program areas will be a major focus for the 2013/14 reporting period.
Our liquidity position, with a current asset ratio of 1.39 remains stable and is consistent with past years. Employee leave entitlements have seen an 8.86% increase in LSL and 8.13% in Annual Leave. The Department LSL Non-Current Debtor increased by $68,987 in 2012/13. Managerial revaluation of fair value of buildings, based on indices issued by the Valuer-General Victoria (VGV) increased Revaluation Reserve by $1,405,506. Revaluation recognition date is 30 June 2013.
2011/12
-$431,122
1.05
1.10
1.15
1.20
1.25
1.30
1.35
1.40
1.45
2008/09 2009/10 2010/11 2011/12 2012/13
Current Asset Ratio
0
2,000,000
4,000,000
6,000,000
8,000,000
10,000,000
12,000,000
14,000,000
16,000,000
18,000,000
Current Assets Current Liabilities Total Equity
Balance Sheet Movement
2011/12
2012/13
930,000
935,000
940,000
945,000
950,000
2011/12 2012/13
Depreciation Exp

Casterton Memorial Hospital 105th Annual Report 2012 – 2013
16
Casterton Memorial Hospital
Financial Report 2012 - 2013
Casterton Memorial Hospital 105th Annual Report 2012 – 2013
17
Casterton Memorial Hospital 105th Annual Report 2012 – 2013
18

Casterton Memorial Hospital 105th Annual Report 2012 – 2013
19
Casterton Memorial Hospital Annual Report 2012/2013
Note Total Total
2013 2012
$ $
Revenue from Operating Activities 2 8,662,019 8,490,818
Revenue from Non-operating Activities 2 109,862 88,655
Employee Expenses 3 (5,985,315) (5,766,642)
Non Salary Labour Costs 3 (339,207) (334,555)
Supplies & Consumables 3 (423,400) (369,820)
Joint Venture Expenses 3 (616,451) (573,874)
Administrative Expenses 3 (415,401) (409,524)
Other Expenses From Continuing Operations 3 (969,229) (773,735)
Net Result Before Capital & Specific
Items
22,878 351,323
Capital Purpose Income 2 272,716 166,768
Depreciation 4 (939,338) (949,213)
NET RESULT FOR THE YEAR (643,744) (431,122)
Other comprehensive income
Net fair value revaluation on Non Financial
Assets 1,405,506 -
COMPREHENSIVE RESULT FOR THE YEAR 761,762 (431,122)
This Statement should be read in conjunction with the accompanying notes.
Casterton Memorial Hospital
Comprehensive Operating StatementFor the Year Ended 30 June 2013
Casterton Memorial Hospital 105th Annual Report 2012 – 2013
20
Casterton Memorial Hospital Annual Report 2012/2013
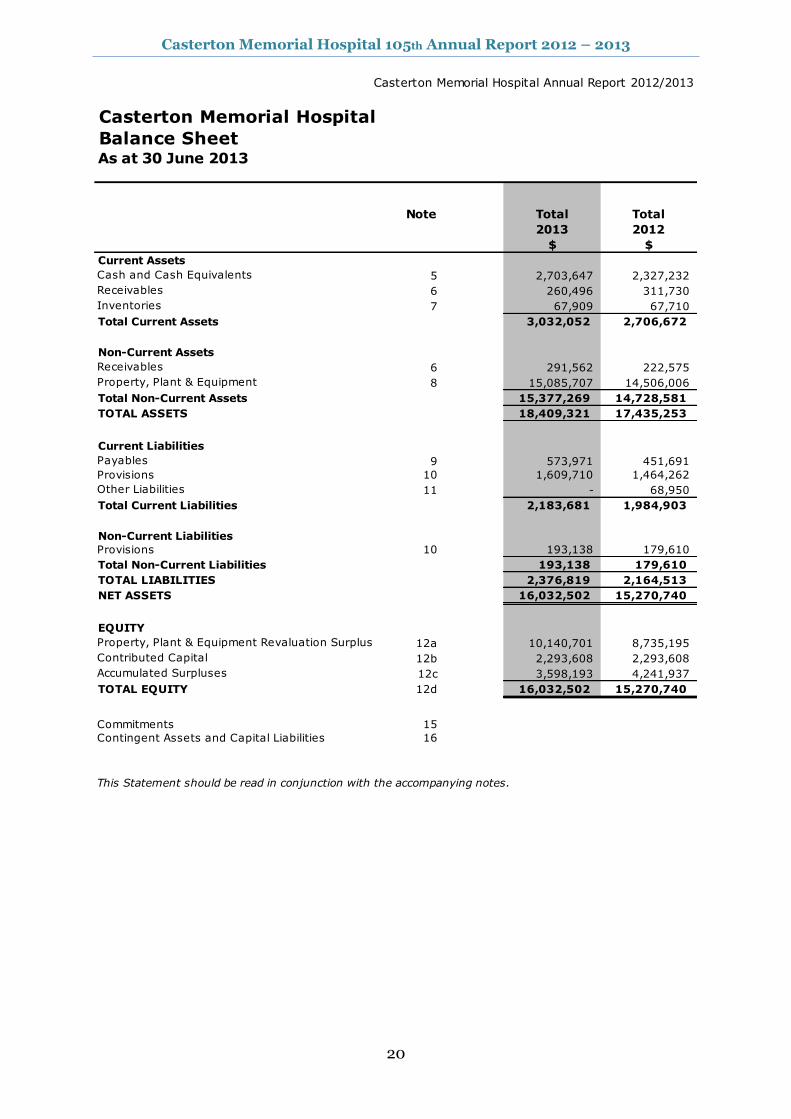
Note Total Total
2013 2012
$ $
Current Assets
Cash and Cash Equivalents 5 2,703,647 2,327,232
Receivables 6 260,496 311,730
Inventories 7 67,909 67,710
Total Current Assets 3,032,052 2,706,672
Non-Current Assets
Receivables 6 291,562 222,575
Property, Plant & Equipment 8 15,085,707 14,506,006
Total Non-Current Assets 15,377,269 14,728,581
TOTAL ASSETS 18,409,321 17,435,253
Current Liabilities
Payables 9 573,971 451,691
Provisions 10 1,609,710 1,464,262
Other Liabilities 11 - 68,950
Total Current Liabilities 2,183,681 1,984,903
Non-Current Liabilities
Provisions 10 193,138 179,610
Total Non-Current Liabilities 193,138 179,610
TOTAL LIABILITIES 2,376,819 2,164,513
NET ASSETS 16,032,502 15,270,740
EQUITY
Property, Plant & Equipment Revaluation Surplus 12a 10,140,701 8,735,195
Contributed Capital 12b 2,293,608 2,293,608
Accumulated Surpluses 12c 3,598,193 4,241,937
TOTAL EQUITY 12d 16,032,502 15,270,740
Commitments 15
Contingent Assets and Capital Liabilities 16
This Statement should be read in conjunction with the accompanying notes.
Balance SheetAs at 30 June 2013
Casterton Memorial Hospital
Casterton Memorial Hospital 105th Annual Report 2012 – 2013
21
Caste
rton M
em
orial H
ospital Annual Report
2012/2
013
Caste
rton
Mem
ori
al
Hospit
al
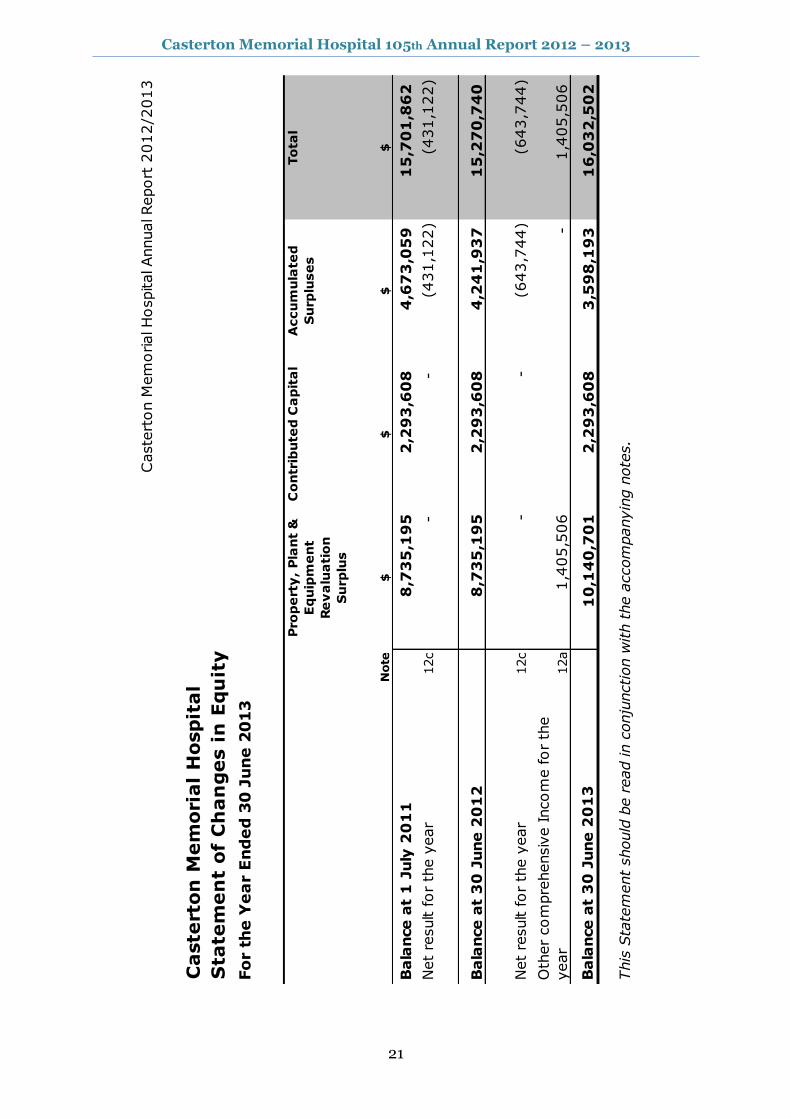
Sta
tem
en
t of
Ch
an
ges i
n E
qu
ity
Fo
r t
he
Ye
ar E
nd
ed
30
Ju
ne
20
13
Pro
pe
rty
, P
lan
t &
Eq
uip
me
nt
Re
va
lua
tio
n
Su
rplu
s
Co
ntr
ibu
ted
Ca
pit
al
Accu
mu
late
d
Su
rplu
se
s
To
tal
Note
$$
$$
Bala
nce a
t 1
July
20
11
8,7
35
,19
5
2,2
93
,60
8
4,6
73
,05
9
15
,70
1,8
62
Net
result for
the y
ear
12c
-
-
(431,1
22)
(431,1
22)
Bala
nce a
t 3
0 J
une 2
01
28
,73
5,1
95
2
,29
3,6
08
4
,24
1,9
37
1
5,2
70
,74
0
Net
result for
the y
ear
12c
-
-
(643,7
44)
(643,7
44)
Oth
er
com
pre
hensiv
e Incom
e for
the
year
12a
1,4
05,5
06
-
1,4
05,5
06
Bala
nce a
t 3
0 J
une 2
01
31
0,1
40
,70
1
2,2
93
,60
8
3,5
98
,19
3
16
,03
2,5
02
This
Sta
tem
ent
should
be r
ead in c
onju
nction w
ith t
he a
ccom
panyin
g n
ote
s.
Casterton Memorial Hospital 105th Annual Report 2012 – 2013
22
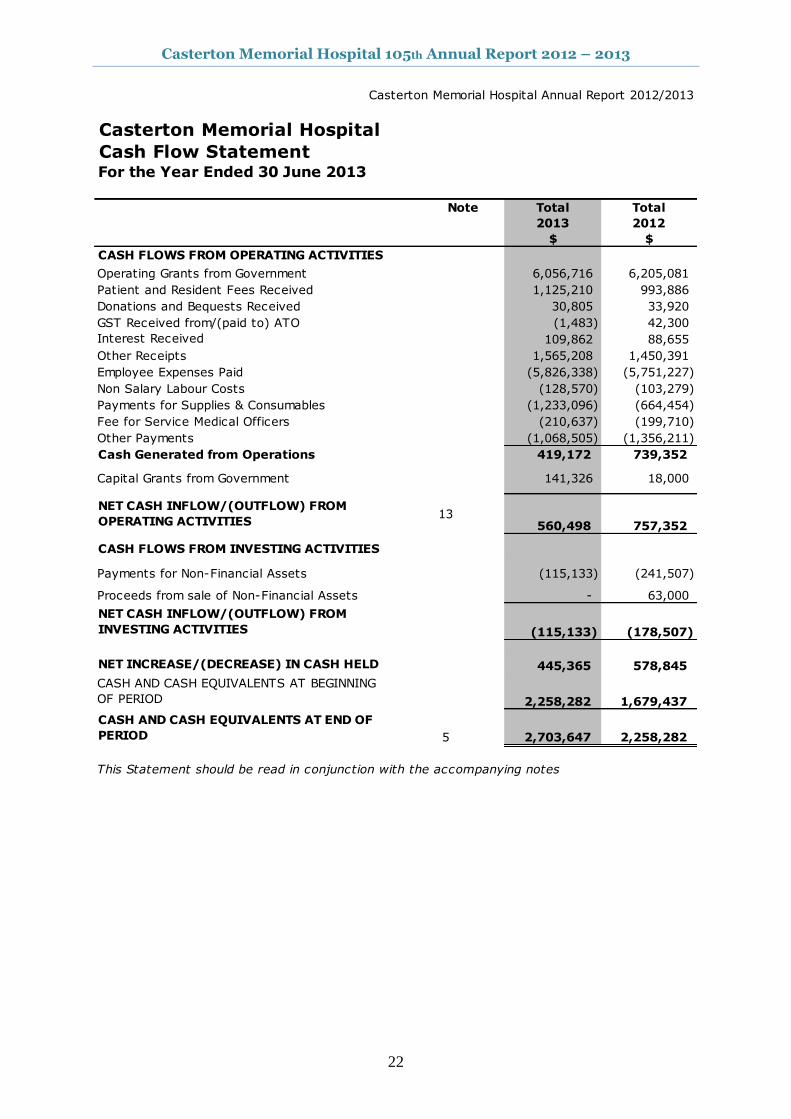
Casterton Memorial Hospital Annual Report 2012/2013
Note Total Total
2013 2012
$ $
CASH FLOWS FROM OPERATING ACTIVITIES
Operating Grants from Government 6,056,716 6,205,081
Patient and Resident Fees Received 1,125,210 993,886
Donations and Bequests Received 30,805 33,920
GST Received from/(paid to) ATO (1,483) 42,300
Interest Received 109,862 88,655
Other Receipts 1,565,208 1,450,391
Employee Expenses Paid (5,826,338) (5,751,227)
Non Salary Labour Costs (128,570) (103,279)
Payments for Supplies & Consumables (1,233,096) (664,454)
Fee for Service Medical Officers (210,637) (199,710)
Other Payments (1,068,505) (1,356,211)
Cash Generated from Operations 419,172 739,352
Capital Grants from Government 141,326 18,000
NET CASH INFLOW/(OUTFLOW) FROM
OPERATING ACTIVITIES13
560,498 757,352
CASH FLOWS FROM INVESTING ACTIVITIES
Payments for Non-Financial Assets (115,133) (241,507)
Proceeds from sale of Non-Financial Assets - 63,000
NET CASH INFLOW/(OUTFLOW) FROM
INVESTING ACTIVITIES (115,133) (178,507)
NET INCREASE/(DECREASE) IN CASH HELD 445,365 578,845
CASH AND CASH EQUIVALENTS AT BEGINNING
OF PERIOD 2,258,282 1,679,437
CASH AND CASH EQUIVALENTS AT END OF
PERIOD 5 2,703,647 2,258,282
This Statement should be read in conjunction with the accompanying notes
Cash Flow Statement For the Year Ended 30 June 2013
Casterton Memorial Hospital
Casterton Memorial Hospital 105th Annual Report 2012 – 2013
23
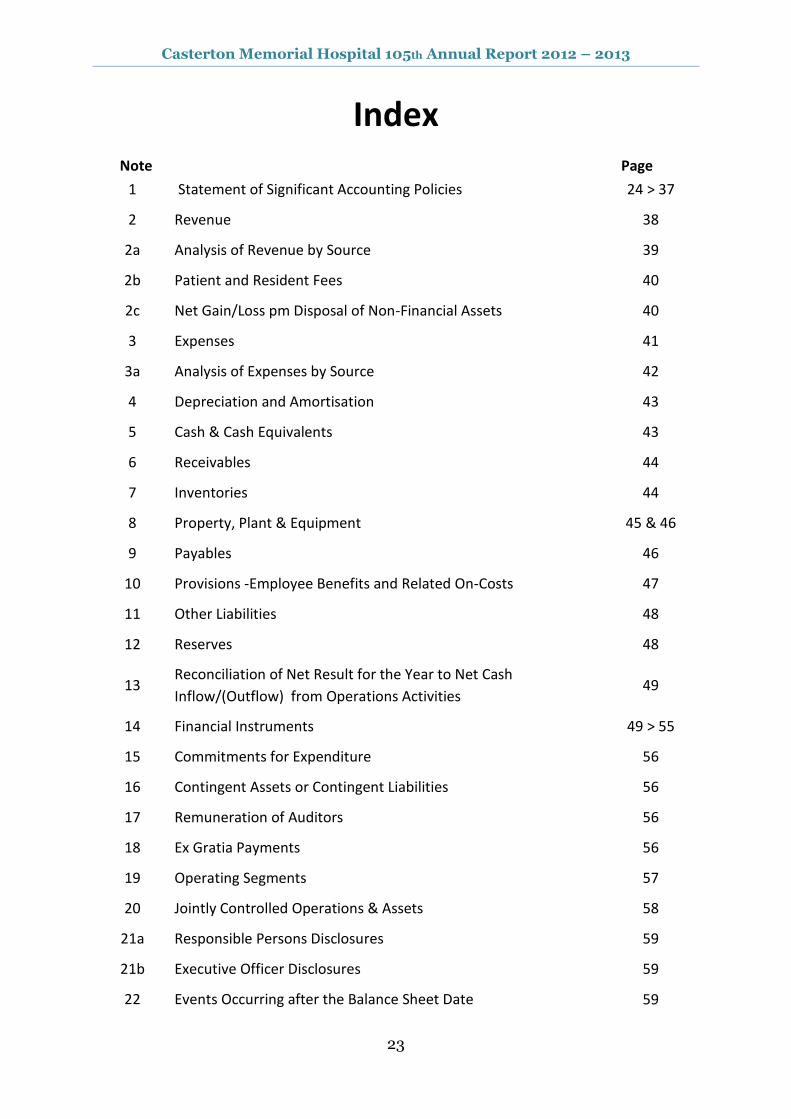
Index
Note Page
1 Statement of Significant Accounting Policies 24 > 37
2 Revenue 38
2a Analysis of Revenue by Source 39
2b Patient and Resident Fees 40
2c Net Gain/Loss pm Disposal of Non-Financial Assets 40
3 Expenses 41
3a Analysis of Expenses by Source 42
4 Depreciation and Amortisation 43
5 Cash & Cash Equivalents 43
6 Receivables 44
7 Inventories 44
8 Property, Plant & Equipment 45 & 46
9 Payables 46
10 Provisions -Employee Benefits and Related On-Costs 47
11 Other Liabilities 48
12 Reserves 48
13 Reconciliation of Net Result for the Year to Net Cash
Inflow/(Outflow) from Operations Activities 49
14 Financial Instruments 49 > 55
15 Commitments for Expenditure 56
16 Contingent Assets or Contingent Liabilities 56
17 Remuneration of Auditors 56
18 Ex Gratia Payments 56
19 Operating Segments 57
20 Jointly Controlled Operations & Assets 58
21a Responsible Persons Disclosures 59
21b Executive Officer Disclosures 59
22 Events Occurring after the Balance Sheet Date 59
Casterton Memorial Hospital 105th Annual Report 2012 – 2013
24
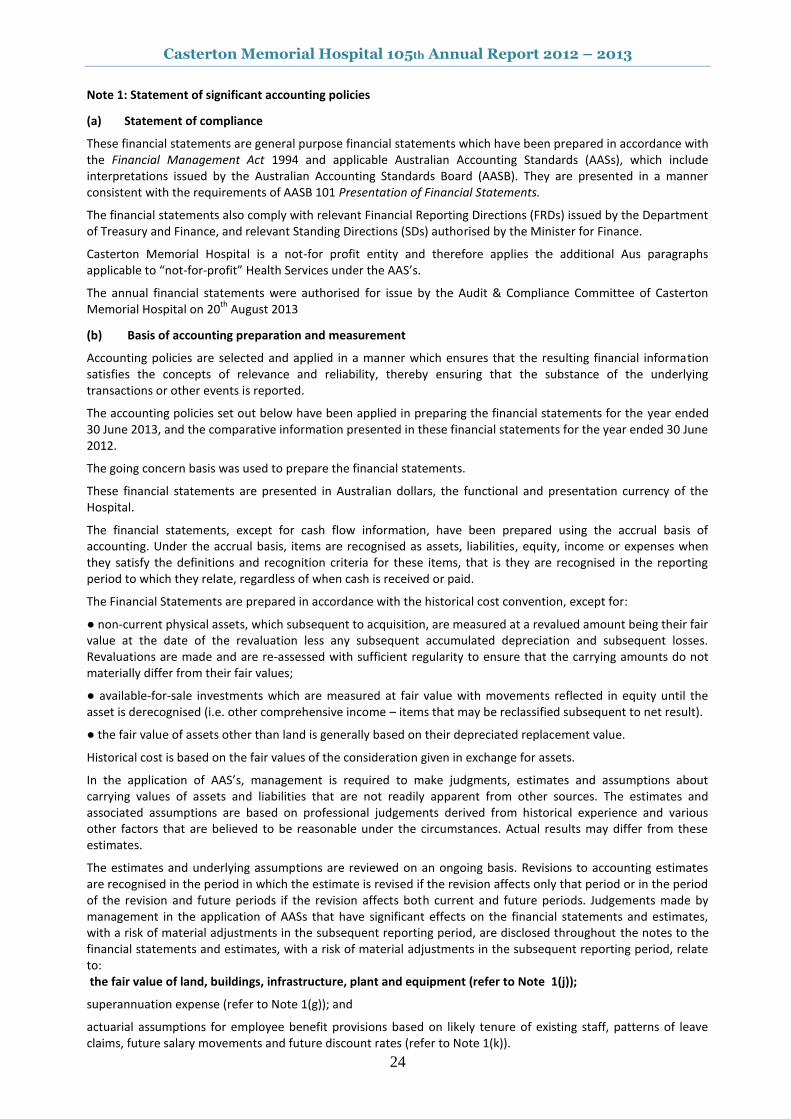
Note 1: Statement of significant accounting policies
(a) Statement of compliance
These financial statements are general purpose financial statements which have been prepared in accordance with the Financial Management Act 1994 and applicable Australian Accounting Standards (AASs), which include interpretations issued by the Australian Accounting Standards Board (AASB). They are presented in a manner consistent with the requirements of AASB 101 Presentation of Financial Statements.
The financial statements also comply with relevant Financial Reporting Directions (FRDs) issued by the Department of Treasury and Finance, and relevant Standing Directions (SDs) authorised by the Minister for Finance.
Casterton Memorial Hospital is a not-for profit entity and therefore applies the additional Aus paragraphs applicable to “not-for-profit” Health Services under the AAS’s.
The annual financial statements were authorised for issue by the Audit & Compliance Committee of Casterton Memorial Hospital on 20
th August 2013
(b) Basis of accounting preparation and measurement
Accounting policies are selected and applied in a manner which ensures that the resulting financial information satisfies the concepts of relevance and reliability, thereby ensuring that the substance of the underlying transactions or other events is reported.
The accounting policies set out below have been applied in preparing the financial statements for the year ended 30 June 2013, and the comparative information presented in these financial statements for the year ended 30 June 2012.
The going concern basis was used to prepare the financial statements.
These financial statements are presented in Australian dollars, the functional and presentation currency of the Hospital.
The financial statements, except for cash flow information, have been prepared using the accrual basis of accounting. Under the accrual basis, items are recognised as assets, liabilities, equity, income or expenses when they satisfy the definitions and recognition criteria for these items, that is they are recognised in the reporting period to which they relate, regardless of when cash is received or paid.
The Financial Statements are prepared in accordance with the historical cost convention, except for:
● non-current physical assets, which subsequent to acquisition, are measured at a revalued amount being their fair value at the date of the revaluation less any subsequent accumulated depreciation and subsequent losses. Revaluations are made and are re-assessed with sufficient regularity to ensure that the carrying amounts do not materially differ from their fair values;
● available-for-sale investments which are measured at fair value with movements reflected in equity until the asset is derecognised (i.e. other comprehensive income – items that may be reclassified subsequent to net result).
● the fair value of assets other than land is generally based on their depreciated replacement value.
Historical cost is based on the fair values of the consideration given in exchange for assets.
In the application of AAS’s, management is required to make judgments, estimates and assumptions about carrying values of assets and liabilities that are not readily apparent from other sources. The estimates and associated assumptions are based on professional judgements derived from historical experience and various other factors that are believed to be reasonable under the circumstances. Actual results may differ from these estimates.
The estimates and underlying assumptions are reviewed on an ongoing basis. Revisions to accounting estimates are recognised in the period in which the estimate is revised if the revision affects only that period or in the period of the revision and future periods if the revision affects both current and future periods. Judgements made by management in the application of AASs that have significant effects on the financial statements and estimates, with a risk of material adjustments in the subsequent reporting period, are disclosed throughout the notes to the financial statements and estimates, with a risk of material adjustments in the subsequent reporting period, relate to:
the fair value of land, buildings, infrastructure, plant and equipment (refer to Note 1(j));
superannuation expense (refer to Note 1(g)); and
actuarial assumptions for employee benefit provisions based on likely tenure of existing staff, patterns of leave claims, future salary movements and future discount rates (refer to Note 1(k)).

Casterton Memorial Hospital 105th Annual Report 2012 – 2013
25
(c) Reporting entity
The financial statements include all the controlled activities of Casterton Memorial Hospital.
Its principle address is: 63 - 69 Russell Street, Casterton 3311
Objectives and funding A description of the nature of Casterton Memorial Hospital’s operations and its principal activities is included in the report of operations, which does not form part of these financial statements.
Casterton Memorial Hospital is predominantly funded by accrual based grant funding for the provision of outputs.
(d) Principles of consolidation
Intersegment Transactions Transactions between segments within the Hospital have been eliminated to reflect the extent of the Hospital's operations as a group.
Jointly Controlled Assets Interest in jointly controlled assets or operations are not consolidated by Casterton Memorial Hospital, but are accounted for in accordance with the policy outlined in Note 1 (j) Financial Assets
(e) Scope & presentation of financial statements
Fund Accounting Casterton Memorial Hospital operates on a fund accounting basis and maintains three funds: Operating, Specific Purpose and Capital Funds. The Hospital's Capital and Specific Purpose Funds include unspent capital donations and receipts from fund-raising activities conducted solely in respect of these funds.
Services Supported By Health Services Agreement and Services Supported By Hospital and Community Initiatives Activities classified as Services Supported by Health Services Agreement (HSA) are substantially funded by the Department of Health and includes Residential Aged Care Services (RACS) and are also funded from other sources such as the Commonwealth, patients and residents, while Services Supported by Hospital and Community Initiatives (H&CI) are funded by the Hospital's own activities or local initiatives and/or the Commonwealth.
Residential Aged Care Service The following Residential Aged Care Services operations are an integral part of the Hospital and share its resources.
– Glenelg House An apportionment of land and buildings has been made based on floor space. The results of the two operations have been segregated based on the actual revenue earned and expenditure incurred by each operation in Note 2b & Note 3a to the financial statements.
Comprehensive operating statement The Comprehensive operating statement includes the subtotal entitled “Net Result before Capital & Specific Items” to enhance the understanding of the financial performance of the Hospital. This subtotal reports the result excluding items such as capital grants; assets received or provided free of charge, depreciation, expenditure using capital purpose income and items of an unusual nature and amount such as specific income and expenses. The exclusion of these items is made to enhance matching of income and expenses so as to facilitate the comparability and consistency of results between years and Victorian Public Health Services. The “Net Result before Capital & Specific Items” is used by the management of the Hospital, the Department of Health and the Victorian Government to measure the ongoing operating performance of Health Services.
Capital and specific items, which are excluded from this sub-total, comprise:
• capital purpose income, which comprises all tied grants, donations and bequests received for the purpose of acquiring non-current assets, such as capital works, plant and equipment or intangible assets. It also includes donations of plant and equipment (refer Note 1 (f)). Consequently the recognition of revenue as capital purpose income is based on the intention of the provider of the revenue at the time the revenue is provided. • specific income/expense, comprises the following items, where material:
– Non-current asset revaluation increments/decrements – Diminution in investments
• impairment of financial and non-financial assets, includes all impairment losses (and reversal of previous impairment losses), which have been recognised in accordance with Note 1 (j) • depreciation and amortisation, as described in Note 1 (g)
Casterton Memorial Hospital 105th Annual Report 2012 – 2013
26
• assets provided or received free of charge, (refer to Notes 1 (f) and (g)); and
• expenditure using capital purpose income, which comprises expenditure which either falls below the asset capitalization threshold or doesn’t meet asset recognition criteria and therefore does not result in the recognition of an asset in the balance sheet, where funding for that expenditure is from capital purpose income.
Balance Sheet Assets and liabilities are categorised either as current or non-current (non-current being those assets or liabilities expected to be recovered/settled more than 12 months after reporting period), are disclosed in the notes where relevant.
Statement of changes in equity The statement of changes in equity presents reconciliations of each non-owner and owner changes in equity from opening balance at the beginning of the reporting period to the closing balance at the end of the reporting period. It also shows separately changes due to amounts recognised in the comprehensive result and amounts recognised in other comprehensive income.
Cash flow statement Cash flows are classified according to whether or not they arise from operating activities, investing activities, or financing activities. This classification is consistent with requirements under AASB 107 Statement of Cash Flows.
For the cash flow statement presentation purposes, cash and cash equivalents includes bank overdrafts, which are included as current borrowings in the balance sheet.
Rounding All amounts shown in the financial statements are expressed to the nearest $1.00 unless otherwise stated. Minor discrepancies in tables between totals and sum of components are due to rounding.
Comparative Information Where necessary the previous year’s figures have been reclassified to facilitate comparisons.
(f) Income from transactions
Income is recognised in accordance with AASB 118 Revenue and is recognised as to the extent that it is probable that the economic benefits will flow to Casterton Memorial Hospital and the income can be reliably measured. Unearned income at reporting date is reported as income received in advance.
Amounts disclosed as revenue is, where applicable, net of returns, allowances and duties and taxes.
Government Grants and other transfers of income (other than contributions by owners) In accordance with AASB 1004 Contributions, government grants and other transfers of income (other than contributions by owners) are recognised as income when the Hospital gains control of the underlying assets irrespective of whether conditions are imposed on the Hospital’s use of the contributions.
Contributions are deferred as income in advance when the Hospital has a present obligation to repay them and the present obligation can be reliably measured.
Indirect Contributions from the Department of Health – Insurance is recognised as revenue following advice from the Department of Health. – Long Service Leave (LSL) – Revenue is recognised upon finalisation of movements in LSL liability in line
with the arrangements set out in the Metropolitan Health and Aged Care Services Division Hospital Circular 05/2013.
Patient and Resident Fees Patient fees are recognised as revenue at the time the invoices are raised.
Private Practice Fees Private Practice fees are recognised as revenue at the time the invoices are raised.
Donations and Other Bequests Donations and bequests are recognised as revenue when received. If donations are for a special purpose, they may be appropriated to a surplus, such as specific restricted purpose surplus.
Dividend Revenue Dividend revenue is recognised when the right to receive payment is established.
Interest Revenue Interest revenue is recognised on a time proportionate basis that takes into account the effective yield of the financial asset.
Casterton Memorial Hospital 105th Annual Report 2012 – 2013
27
Sale of Investments The gain/loss on the sale of investments is recognised when the investment is realised.
Fair value of assets and services received free of charge or for nominal consideration Resources received free of charge or for nominal consideration are recognised at their fair value when the transferee obtains control over them, irrespective of whether restrictions or conditions are imposed over the use of the contributions, unless received from another Health Service or agency as a consequence of a restructuring of administrative arrangements. In the latter case, such transfer will be recognised at carrying value. Contributions in the form of services are only recognised when a fair value can be reliably determined and the services would have been purchased if not donated.
Other income Other income includes non-property rental, dividends, forgiveness of liabilities, and bad debt reversals.
(g) Expense recognition
Expenses are recognised as they are incurred and reported in the financial year to which they relate.
Employee expenses Employee expenses include;
wages and salaries;
annual leave;
sick leave;
long service leave; and
superannuation expenses which are reported differently depending upon whether employees are members of defined benefit or defined contribution plans.
Defined contribution superannuation plans In relation to defined contribution (i.e. accumulation) superannuation plans, the associated expense is simply the employer contributions that are paid or payable in respect of employees who are members of these plans during the reporting period. Contributions to defined contribution superannuation plans are expenses when incurred.
Defined benefit superannuation plans The amount charged to the comprehensive operating statement in respect of defined benefit superannuation plans represents the contributions made by the Hospital to the superannuation plans in respect of the services of current Hospital staff during the reporting period. Superannuation contributions are made to the plans based on the relevant rules of each plan, and are based upon actuarial advice.
Employees of the Hospital are entitled to receive superannuation benefits and the Hospital contributes to both the defined benefit and defined contribution plans. The defined benefits plan(s) provide benefits based on years of service and final average salary.
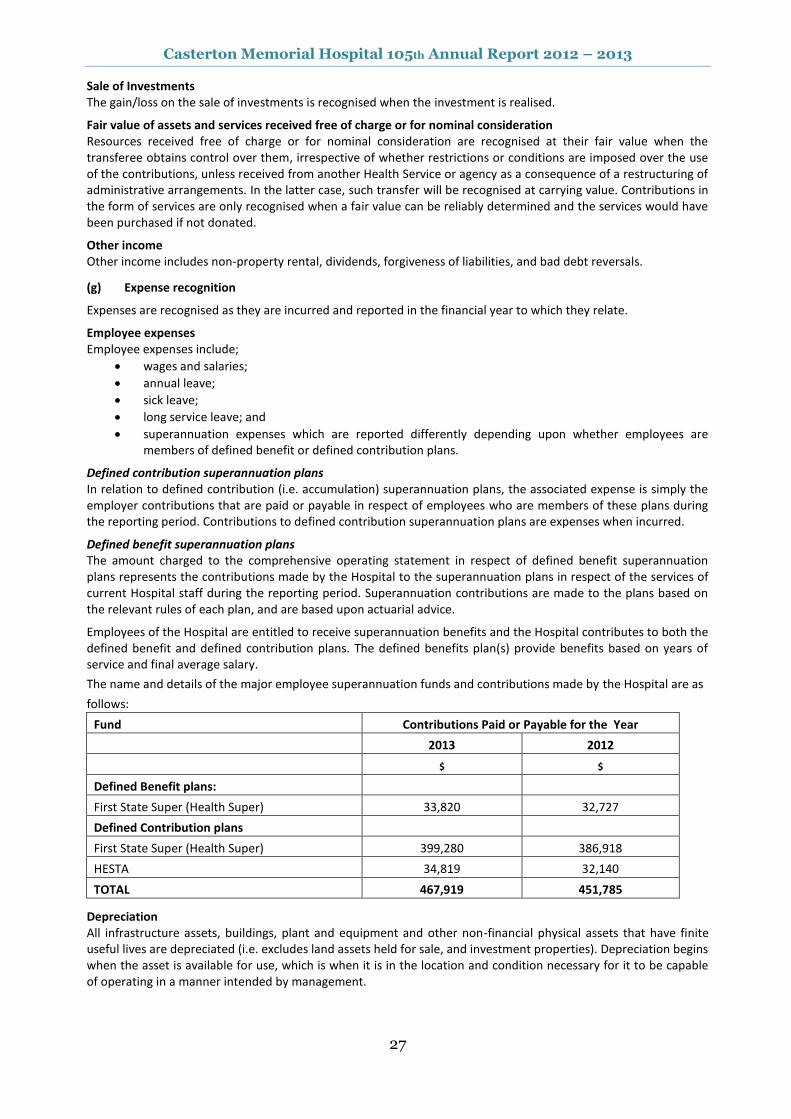
The name and details of the major employee superannuation funds and contributions made by the Hospital are as
follows:
Fund Contributions Paid or Payable for the Year
2013 2012
$ $
Defined Benefit plans:
First State Super (Health Super) 33,820 32,727
Defined Contribution plans
First State Super (Health Super) 399,280 386,918
HESTA 34,819 32,140
TOTAL 467,919 451,785
Depreciation All infrastructure assets, buildings, plant and equipment and other non-financial physical assets that have finite useful lives are depreciated (i.e. excludes land assets held for sale, and investment properties). Depreciation begins when the asset is available for use, which is when it is in the location and condition necessary for it to be capable of operating in a manner intended by management.
Casterton Memorial Hospital 105th Annual Report 2012 – 2013
28
Intangible produced assets with finite lives are depreciated as an expense from transactions on a systematic basis over the asset’s useful life. Depreciation is generally calculated on a straight line basis, at a rate that allocates the asset value, less any estimated residual value over its estimated useful life. Estimates of the remaining useful lives and depreciation method for all assets are reviewed at least annually, and adjustments made where appropriate. This depreciation charge is not funded by the Department of Health. Assets with a cost in excess of $1,000 are capitalised and depreciation has been provided on depreciable assets so as to allocate their cost or valuation over their estimated useful lives.
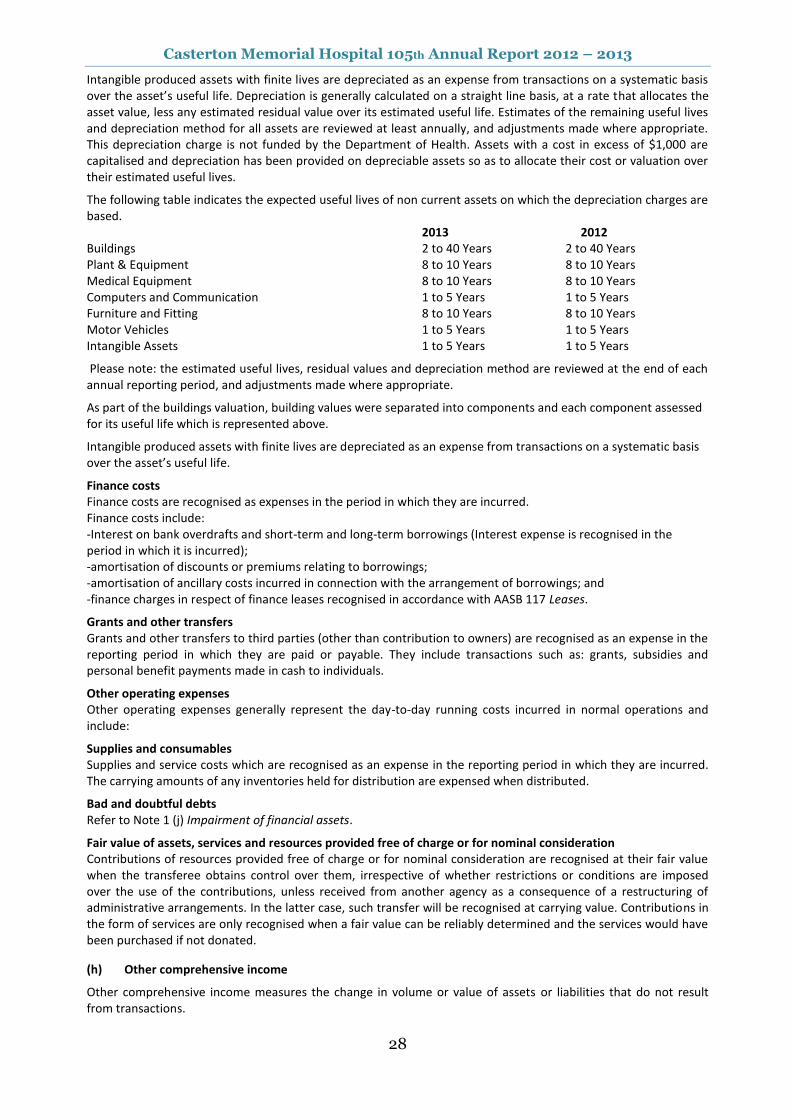
The following table indicates the expected useful lives of non current assets on which the depreciation charges are based. 2013 2012 Buildings 2 to 40 Years 2 to 40 Years Plant & Equipment 8 to 10 Years 8 to 10 Years Medical Equipment 8 to 10 Years 8 to 10 Years Computers and Communication 1 to 5 Years 1 to 5 Years Furniture and Fitting 8 to 10 Years 8 to 10 Years Motor Vehicles 1 to 5 Years 1 to 5 Years Intangible Assets 1 to 5 Years 1 to 5 Years
Please note: the estimated useful lives, residual values and depreciation method are reviewed at the end of each annual reporting period, and adjustments made where appropriate.
As part of the buildings valuation, building values were separated into components and each component assessed for its useful life which is represented above.
Intangible produced assets with finite lives are depreciated as an expense from transactions on a systematic basis over the asset’s useful life.
Finance costs Finance costs are recognised as expenses in the period in which they are incurred. Finance costs include: -Interest on bank overdrafts and short-term and long-term borrowings (Interest expense is recognised in the period in which it is incurred); -amortisation of discounts or premiums relating to borrowings; -amortisation of ancillary costs incurred in connection with the arrangement of borrowings; and -finance charges in respect of finance leases recognised in accordance with AASB 117 Leases.
Grants and other transfers Grants and other transfers to third parties (other than contribution to owners) are recognised as an expense in the reporting period in which they are paid or payable. They include transactions such as: grants, subsidies and personal benefit payments made in cash to individuals.
Other operating expenses Other operating expenses generally represent the day-to-day running costs incurred in normal operations and include:
Supplies and consumables Supplies and service costs which are recognised as an expense in the reporting period in which they are incurred. The carrying amounts of any inventories held for distribution are expensed when distributed.
Bad and doubtful debts Refer to Note 1 (j) Impairment of financial assets.
Fair value of assets, services and resources provided free of charge or for nominal consideration Contributions of resources provided free of charge or for nominal consideration are recognised at their fair value when the transferee obtains control over them, irrespective of whether restrictions or conditions are imposed over the use of the contributions, unless received from another agency as a consequence of a restructuring of administrative arrangements. In the latter case, such transfer will be recognised at carrying value. Contributions in the form of services are only recognised when a fair value can be reliably determined and the services would have been purchased if not donated.
(h) Other comprehensive income
Other comprehensive income measures the change in volume or value of assets or liabilities that do not result from transactions.
Casterton Memorial Hospital 105th Annual Report 2012 – 2013
29
Net gain/(loss) on non-financial assets Net gain/(loss) on non-financial assets and liabilities includes realised and unrealised gains and losses as follows:
Revaluation gains/(losses) of non-financial physical assets Refer to Note 1 (j) Revaluations of non-financial physical assets.
Disposal of non-financial assets Any gain or loss on the disposal of non-financial assets is recognised at the date of disposal and is determined after deducting from the proceeds the carrying value of the asset at that time.
Net gain/(loss) on financial instruments Net gain/(loss) on financial instruments includes:
o realised and unrealised gains and losses from the revaluations of financial instruments at fair value; o impairment and reversal of impairment for financial instruments at amortised cost (refer to Note 1 (j); and o disposals of financial assets and derecognition of financial liabilities
Revaluations of financial instrument at fair value Refer to Note 1 (i) Financial instruments.
Share of net profits/(losses) of associates and joint entities, excluding dividends. Refer to Note 1 (d) Basis of consolidation.
Other gains/(losses) from other comprehensive income include: o the revaluation of the present value of the long service leave liability due to changes in the bond interest
rates; and o transfer of amounts from the reserves to accumulated surplus or net result due to disposal or
derecognition or reclassification.
(i) Financial instruments
Financial instruments arise out of contractual agreements that give rise to a financial asset of one Health Service and a financial liability or equity instrument of another Health Service. Due to the nature of the Casterton Memorial Hospital’s activities, certain financial assets and financial liabilities arise under statute rather than a contract. Such financial assets and financial liabilities do not meet the definition of financial instruments in AASB 132 Financial Instruments: Presentation. For example, statutory receivables arising from taxes, fines and penalties do not meet the definition of financial instruments as they do not arise under contract.
Where relevant, for note disclosure purposes, a distinction is made between those financial assets and financial liabilities that meet the definition of financial instruments in accordance with AASB 132 and those that do not. The following refers to financial instruments unless otherwise stated.
Categories of non-derivative financial instruments
Financial assets and liabilities at fair value through profit or loss Financial assets are categorised as fair value through profit or loss at trade date if they are classified as held for trading or designated as such upon initial recognition. Financial instrument assets are designated at fair value through profit or loss on the basis that the financial assets form part of a group of financial assets that are managed by the Health Service concerned based on their fair values, and have their performance evaluated in accordance with documented risk management and investment strategies.
Financial instruments at fair value through profit or loss are initially measured at fair value and attributable transaction costs are expensed as incurred. Subsequently, any changes in fair value are recognised in the net result as other comprehensive income.
Financial assets held for trading purposes are classified as current assets and are stated at fair value, with any resultant gain or loss recognised in the net result. The net gain or loss recognised in net result incorporates any dividend or interest earned on the financial asset. Fair value is determined in the manner described in Note 14.
Loans and receivables Loans and receivables are financial instrument assets with fixed and determinable payments that are not quoted on an active market. These assets are initially recognised at fair value plus any directly attributable transaction costs. Subsequent to initial measurement, loans and receivables are measured at amortised cost using the effective interest method, less any impairment.
Loans and receivables category includes cash and deposits (refer to Note 1(j)), term deposits with maturity greater than three months, trade receivables, loans and other receivables, but not statutory receivables.
Casterton Memorial Hospital 105th Annual Report 2012 – 2013
30
The effective interest method is a method of calculating the amortised cost of a financial asset and of allocating interest income over the relevant period. The effective interest rate is the rate that exactly discounts estimated future cash receipts through the expected life of the financial asset, or, where appropriate, a shorter period.
Held-to-maturity investments If the Hospital has the positive intent and ability to hold nominated investments to maturity, then such financial assets may be classified as held-to-maturity. Held-to-maturity financial assets are recognised initially at fair value plus any directly attributable transaction costs. Subsequent to initial recognition held-to-maturity financial assets are measured at amortised cost using the effective interest method, less any impairment losses.
The Hospital makes limited use of this classification because any sale or reclassification of more than an insignificant amount of held-to-maturity investments not close to their maturity, would result in the whole category being reclassified as available-for-sale. The Hospital would also be prevented from classifying investment securities as held-to-maturity for the current and the following two financial years.
The held-to-maturity category includes certain term deposits and debt securities for which the entity concerned intends to hold to maturity.
Available-for-sale financial assets Available-for-sale financial instrument assets are those designated as available-for-sale or not classified in any other category of financial instrument asset. Such assets are initially recognised at fair value. Subsequent to initial recognition, gains and losses arising from changes in fair value are recognised in ‘other comprehensive income’ until the investment is disposed of or is determined to be impaired, at which time the cumulative gain or loss previously recognised in equity is included in net result for the period. Fair value is determined in the manner described in Note 14.
Financial liabilities at amortised cost Financial instrument liabilities are initially recognised on the date they are originated. They are initially measured at fair value plus any directly attributable transaction costs. Subsequent to initial recognition, these financial instruments are measured at amortised cost with any difference between the initial recognised amount and the redemption value being recognised in profit and loss over the period of the interest-bearing liability, using the effective interest rate method.
Financial instrument liabilities measured at amortised cost include all of the Hospital’s contractual payables, deposits held and advances received, and interest-bearing arrangements other than those designated at fair value through profit or loss.
Offsetting financial instruments Financial instrument assets and liabilities are offset and the net amount presented in the consolidated balance sheet when, and only when, the Health Service concerned has a legal right to offset the amounts and intend either to settle on a net basis or to realise the asset and settle the liability simultaneously.
(j) Assets
Cash and Cash Equivalents Cash and cash equivalents comprise cash on hand and cash at bank, deposits at call and highly liquid investments with an original maturity of 3 months or less, which are held for the purpose of meeting short term cash commitments rather than for investment purposes which are readily convertible to known amounts of cash and are subject to insignificant risk of changes in value.
For cash flow statement presentation purposes, cash and cash equivalents include bank overdrafts, which are included as current interest bearing liabilities in the balance sheet
Receivables Receivables consist of;
Statutory receivables, which includes predominantly amounts owing from the Victorian Government and GST input tax credits recoverable; and
Contractual receivables, which include mainly debtors in relation to goods and services, loans to third parties, accrued investment income and finance lease receivables.
Trade debtors are carried at nominal amounts due and are due for settlement within 30 days from the date of recognition. Collectability of debts is reviewed on an ongoing basis, and debts which are known to be uncollectible are written off. A provision for doubtful debts is recognised where there is objective evidence that the debts may not be collected and bad debts are written off when identified.
Casterton Memorial Hospital 105th Annual Report 2012 – 2013
31
Receivables that are contractual are classified as financial instruments and categorised as loans and receivables. Statutory receivables are recognised and measured similarly to contractual receivables (except for impairment), but are not classified as financial instruments because they do not arise from a contract.
Receivables are recognised initially at fair value and subsequently measured at amortised cost, using the effective interest rate method, less any accumulated impairment.
Casterton Memorial Hospital classifies its other financial assets between current and non-current assets based on the purpose for which the assets were acquired. Management determines the classification of its other financial assets at initial recognition.
The Hospital assesses at each balance sheet date whether a financial asset or group of financial assets is impaired.
All financial assets, except those measured at fair value through profit and loss are subject to annual review for impairment.
Inventories Inventories include goods and other property held either for sale, consumption or for distribution at no or nominal cost in the ordinary course of business operations. It includes land held for sale and excludes depreciable assets. Inventories held for distribution are measured at cost, adjusted for any loss of service potential. All other inventories, including land held for sale, are measured at the lower of cost and net realisable value.
Inventories acquired for no cost or nominal considerations are measured at current replacement cost at the date of acquisition.
The bases used in assessing loss of service potential for inventories held for distribution include current replacement cost and technical or functional obsolescence. Technical obsolescence occurs when an item still functions for some or all of the tasks it was originally acquired to do, but no longer matches existing technologies. Functional obsolescence occurs when an item no longer functions the way it did when it was first acquired.
Cost is assigned to land for sale (undeveloped, under development and developed) and to other high value, low volume inventory items on a specific identification of cost basis.
Cost for all other inventory is measured on the basis of weighted average cost.
Property, Plant and Equipment All non current physical assets are measured initially at cost and subsequently revalued at fair value less accumulated depreciation and impairment. Where an asset is acquired for no or nominal cost, the cost is its fair value at the date of acquisition. Assets transferred as part of a merger/machinery of government are transferred at their carrying amount.
The initial cost for non-financial physical assets under finance lease is measured at amounts equal to the fair value of the leased asset or, if lower, the present value of the minimum lease payments, each determined at the inception of the lease.
Crown Land is measured at fair value with regard to the property’s highest and best use after due consideration is made for any legal or constructive restrictions imposed on the asset, public announcements or commitments made in relation to the intended use of the asset. Theoretical opportunities that may be available in relation to the asset(s) are not taken into account until it is virtually certain that any restrictions will no longer apply.
Land and Buildings are recognised initially at cost and subsequently measured at fair value less accumulated depreciation and impairment.
Plant, Equipment and Vehicles are recognised initially at cost and subsequently measured at fair value less accumulated depreciation and impairment. Depreciated historical cost is generally a reasonable proxy for fair value because of the short lives of the assets concerned.
Leasehold improvements The cost of a leasehold improvement is capitalised as an asset and depreciated over the shorter of the remaining term of the lease or the estimated useful life of the improvements. Revaluations of non-current physical assets Non-current physical assets measured at fair value are revalued in accordance with FRD 103D Non-current physical assets. This revaluation process normally occurs at least every five years, based upon the asset’s Government Purpose Classification, but may occur more frequently if fair value assessments indicate material changes in values. Independent valuers are used to conduct these scheduled revaluations and any interim revaluations are determined in accordance with the requirements of the FRD’s. Revaluation increments or decrements arise from differences between an asset’s carrying value and fair value.

Casterton Memorial Hospital 105th Annual Report 2012 – 2013
32
Revaluation increments are recognised in ‘other comprehensive income’ and are credited directly to the asset revaluation surplus, except that, to the extent that an increment reverses a revaluation decrement in respect of that same class of asset previously recognised as an expense in net result, the increment is recognised as revenue in the net result.
Revaluation decrements are recognised in ‘other comprehensive income’ to the extent that a credit balance exists in the asset revaluation surplus in respect of the same class of property, plant and equipment.
Revaluation increases and revaluation decreases relating to individual assets within an asset class are offset against one another within that class but are not offset in respect of assets in different classes.
Revaluation surplus is not transferred to accumulated funds on derecognition of the relevant asset.
In accordance with FRD 103D the Hospital’s non-current physical assets were assessed to determine whether revaluation of the non-current physical assets was required.
Other non-financial assets Prepayments Other non-financial assets include prepayments which represent payments in advance of receipt of goods or services or that part of expenditure made in one accounting period covering a term extending beyond that period. Disposal of non-financial assets Any gain or loss on the sale of non-financial assets is recognised in the comprehensive operating statement. Refer to note 1(h) – ‘comprehensive income’. Impairment of non-financial assets Goodwill and intangible assets with indefinite lives (and intangible assets not yet available for use) are tested annually for impairment (as described below) and whenever there is an indication that the asset may be impaired.
All other non-financial assets are assessed annually for indications of impairment, except for:
inventories;
non-current physical assets held for sale; and
assets arising from construction contracts.
If there is an indication of impairment, the assets concerned are tested as to whether their carrying value exceeds their recoverable amount. Where an asset’s carrying value exceeds its recoverable amount, the difference is written-off as an expense except to the extent that the write-down can be debited to an asset revaluation surplus amount applicable to that same class of asset.
If there is an indication that there has been a change in the estimate of an asset’s recoverable amount since the last impairment loss was recognised, the carrying amount shall be increased to its recoverable amount. This reversal of the impairment loss occurs only to the extent that the asset’s carrying amount does not exceed the carrying amount that would have been determined, net of depreciation or amortisation, if no impairment loss had been recognised in prior years.
It is deemed that, in the event of the loss or destruction of an asset, the future economic benefits arising from the use of the asset will be replaced unless a specific decision to the contrary has been made. The recoverable amount for most assets is measured at the higher of depreciated replacement cost and fair value less costs to sell. Recoverable amount for assets held primarily to generate net cash flows is measured at the higher of the present value of the future cash flows expected to be obtained from the asset and fair value less costs to sell.
(k) Liabilities
Payables Payables consist of:
contractual payables which consist predominantly of accounts payable representing liabilities for goods and services provided to the Hospital prior to the end of the financial year that are unpaid, and arise when the Hospital becomes obliged to make future payments in respect of the purchase of those goods and services. The normal credit terms for accounts payable are usually Nett 30 days.
statutory payables, such as goods and services tax and fringe benefits tax payables.
Contractual payables are classified as financial instruments and are initially recognised at fair value, and then subsequently carried at amortised cost. Statutory payables are recognised and measured similarly to contractual payables, but are not classified as financial instruments and not included in the category of financial liabilities at amortised cost, because they do not arise from a contract.
Casterton Memorial Hospital 105th Annual Report 2012 – 2013
33
Provisions Provisions are recognised when the Hospital has a present obligation, the future sacrifice of economic benefits is probable, and the amount of the provision can be measured reliably.
The amount recognised as a liability is the best estimate of the consideration required to settle the present obligation at reporting date, taking into account the risks and uncertainties surrounding the obligation. Where a provision is measured using the cash flows estimated to settle the present obligation, its carrying amount is the present value of those cash flows, using a discount rate that reflects the time value of money and risks specific to the provision.
When some or all of the economic benefits required to settle a provision are expected to be received from a third party, the receivable is recognised as an asset if it is virtually certain that recovery will be received and the amount of the receivable can be measured reliably.
Employee Benefits The provision arises for the benefits accruing to employees in respect of wages and salaries, annual leave and long service leave for services rendered to the reporting date.
Wages and salaries, annual leave, sick leave and accrued days off Liabilities for wages and salaries, including non-monetary benefits, annual leave accumulating sick leave and accrued days off expected to be settled within 12 months of the reporting date are recognised in the provision for employee benefits in respect of employee’s services up to the reporting date, and are classified as current liabilities and measured at their nominal value.
Those liabilities that the Hospital does not expect to settle within 12 months are recognised in the provision for employee benefits as current liabilities, measured at present value of the amounts expected to be paid when the liabilities are settled using the remuneration rate expected to apply at the time of settlement.
Long service leave The liability for long service leave (LSL) is recognised in the provision for employee benefits.
Current liability – unconditional LSL (representing 10 or more years of continuous service) is disclosed in the notes to the financial statements as a current liability even where the Hospital does not expect to settle the liability within 12 months because it will not have the unconditional right to defer the settlement of the entitlement should an employee take leave within 12 months.
The components of this current LSL liability are measured at:
● present value – component that the Hospital does not expect to settle within 12 months; and
● nominal value – component that the Hospital expects to settle within 12 months.
Non -current liability – conditional LSL (represents less than 10 years of continuous service) is disclosed as a non-current liability. There is an unconditional right to defer the settlement of the entitlement until the employee has completed the requisite years of service. Conditional LSL is required to be measured at present value.
Consideration is given to expected future wage and salary levels, experience of employee departures and periods of service. Expected future payments are discounted using interest rates of Commonwealth Government guaranteed securities in Australia.
Termination benefits Termination benefits are payable when employment is terminated before the normal retirement date or when an employee accepts voluntary redundancy in exchange for these benefits.
Liabilities for termination benefits are recognised when a detailed plan for termination has been developed and a valid expectation has been raised with those employees affected that the terminations will be carried out. The liabilities for termination benefits are recognised in other creditors unless the amount or timing of the payments is uncertain, in which case they are recognised as a provision.
On-costs Employee benefit on-costs such as payroll tax, workers compensation and superannuation are recognised together with provisions for employee benefits.
Superannuation liabilities Casterton Memorial Hospital does not recognise any unfunded defined benefit liability in respect of the superannuation plans because the Hospital has no legal or constructive obligation to pay future benefits relating to its employees; its only obligation is to pay superannuation contributions as they fall due.
Casterton Memorial Hospital 105th Annual Report 2012 – 2013
34
(l) Leases
A lease is a right to use an asset for an agreed period of time in exchange for payment. Leases are classified at their inception as either operating or finance leases based on the economic substance of the agreement so as to reflect the risks and rewards incidental to ownership.
Leases of property, plant and equipment are classified as finance leases whenever the terms of the lease transfer substantially all the risks and rewards of ownership to the lessee. All other leases are classified as operating leases.
Operating Leases Entity as lessor Rental income from operating lease is recognised on a straight-line basis over the term of the relevant lease. All incentives for the agreement of a new or renewed operating lease are recognised as an integral part of the net consideration agreed for the use of the leased asset, irrespective of the incentive’s nature or form or the timing of payments.
In the event that lease incentives are given to the lessee, the aggregate cost of incentives are recognised as a reduction of rental income over the lease term, on a straight-line basis unless another systematic basis is more appropriate of the time pattern over which the economic benefit of the leased asset is diminished.
Entity as lessee Operating lease payments, including any contingent rentals, are recognised as an expense in the comprehensive operating statement on a straight line basis over the lease term, except where another systematic basis is more representative of the time pattern of the benefits derived from the use of the leased asset. The leased asset is not recognised in the balance sheet.
(m) Equity
Contributed capital Consistent with Australian Accounting Interpretation 1038 Contributions by Owners Made to Wholly-Owned Public Sector Entities and FRD 119 Contributions by Owners, appropriations for additions to the net asset base have been designated as contributed capital. Other transfers that are in the nature of contributions or distributions have also been designated as contributed capital is also treated as contributed capital.
Property, plant & equipment revaluation surplus The asset revaluation surplus is used to record increments and decrements on the revaluation of non-current physical assets.
(n) Commitments
Commitments for future expenditure include operating and capital commitments arising from contracts. These commitments are disclosed by way of a note (refer to note 15) at their nominal value and are inclusive of the goods and services tax (“GST”) payable. In addition, where it is considered appropriate and provides additional relevant information to users, the net present values of significant individual projects are stated. These future expenditures cease to be disclosed as commitments once the related liabilities are recognised on the balance sheet.
(o) Goods and Services Tax
Income, expenses and assets are recognised net of the amount of associated GST, unless the GST incurred is not recoverable from the taxation authority. In this case it is recognized as part of the cost of acquisition of the asset or part of the expense.
Receivables and payables are stated inclusive of the amount of GST receivable or payable. The net amount of GST recoverable from, or payable to, the taxation authority is included with other receivables or payables in the balance sheet.
Cash flows are presented on a gross basis. The GST components of cash flows arising from investing or financing activities which are recoverable from, or payable to the taxation authority, are presented as operating cash flow.
Commitments for expenditure and contingent assets and liabilities are presented on a gross basis
(p) AASs issued that are not yet effective Certain new Australian accounting standards have been published that are not mandatory for the 30 June 2013 reporting period. DTF assesses the impact of all these new standards and advises the Hospital of their applicability and early adoption where applicable.
Casterton Memorial Hospital 105th Annual Report 2012 – 2013
35
As at 30 June 2013, the following standards and interpretations had been issued by the AASB but were not yet effective. They become effective for the first financial statements for reporting periods commencing after the stated operative dates as detailed in the table below. Casterton Memorial Hospital has not and does not intend to adopt these standards early.
Standard / Interpretation
Summary Applicable for annual reporting periods beginning on
Impact on public sector entity financial statements
AASB 9 Financial instruments
This standard simplifies requirements for the classification and measurement of financial assets resulting from Phase 1 of the IASB’s project to replace IAS 39 Financial Instruments: Recognition and Measurement (AASB 139 Financial Instruments: Recognition and Measurement).
1 Jan 2015
Subject to AASB’s further modifications to AASB 9, together with the anticipated changes resulting from the staged projects on impairments and hedge accounting, details of impacts will be assessed.
AASB 11 Joint Arrangements
This Standard deals with the concept of joint control, and sets out a new principles-based approach for determining the type of joint arrangement that exists and the corresponding accounting treatment. The new categories of joint arrangements under AASB 11 are more aligned to the actual rights and obligations of the parties to the arrangement.
1 Jan 2014 Not-for-profit entities are not permitted to apply this Standard prior to the mandatory application date.
Subject to AASB’s final deliberations and any modifications made to AASB 11 for not-for-profit entities, the entity will need to assess the nature of arrangements with other entities in determining whether a joint arrangement exists in light of AASB 11
AASB 12 Disclosure of Interests in other Entities
This Standard requires disclosure of information that enables users of financial statements to evaluate the nature of, and risks associated with, interests in other entities and the effects of those interests on financial statements. This standard replaces the disclosure requirements in AASB 127 Separate Financial Statements and AASB 131 Interests in Joint Ventures.
The exposure draft ED 238 propses to add some implementation guidance to AASB 12, explaining and illustrating the definition of a ‘structured entity’ from a not-for-profit perspective.
1 Jan 2014 Not-for-profit entities are not permitted to apply this Standard prior to the mandatory application date.
Impacts on the level and nature of the disclosures will be assessed based on the eventual implications arising from AASB 10, AASB 11 and AASB 128 Investments in Associates and Joint Ventures.
AASB 13 Fair Value Measurement
This Standard outlines the requirements for measuring the fair value of assets and liabilities and replaces the existing fair value definition and guidance in other AASs. AASB 13 includes a ‘fair value hierarchy’ which ranks the valuation technique inputs into three levels using unadjusted quoted prices in active markets for identical assets or liabilities; other observable inputs; and unobservable inputs.
1 Jan 2013 Disclosure for fair value measurements using unobservable inputs are relatively detailed compared to disclosure for fair value measurements using observable inputs. Consequently, the Standard may increase the disclosures required assets measured using depreciated replacement cost.
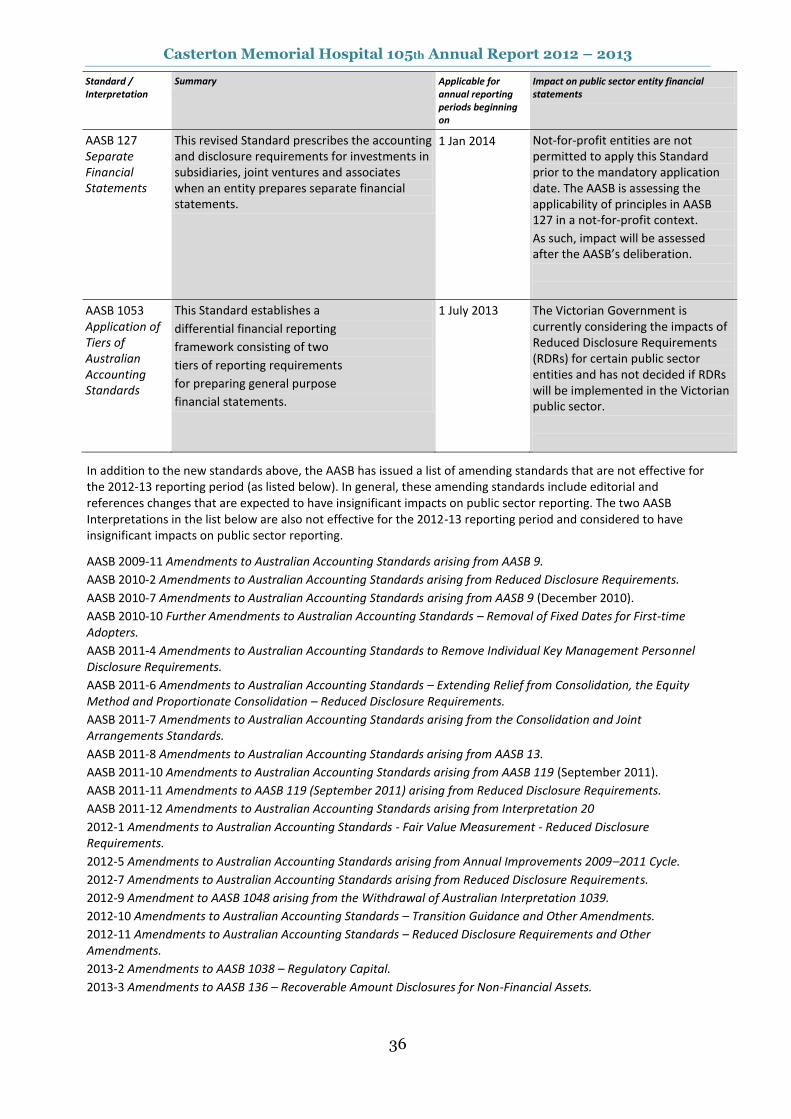
Casterton Memorial Hospital 105th Annual Report 2012 – 2013
36
Standard / Interpretation
Summary Applicable for annual reporting periods beginning on
Impact on public sector entity financial statements
AASB 127 Separate Financial Statements
This revised Standard prescribes the accounting and disclosure requirements for investments in subsidiaries, joint ventures and associates when an entity prepares separate financial statements.
1 Jan 2014 Not-for-profit entities are not permitted to apply this Standard prior to the mandatory application date. The AASB is assessing the applicability of principles in AASB 127 in a not-for-profit context.
As such, impact will be assessed after the AASB’s deliberation.
AASB 1053 Application of Tiers of Australian Accounting Standards
This Standard establishes a
differential financial reporting
framework consisting of two
tiers of reporting requirements
for preparing general purpose
financial statements.
1 July 2013 The Victorian Government is currently considering the impacts of Reduced Disclosure Requirements (RDRs) for certain public sector entities and has not decided if RDRs will be implemented in the Victorian public sector.
In addition to the new standards above, the AASB has issued a list of amending standards that are not effective for the 2012-13 reporting period (as listed below). In general, these amending standards include editorial and references changes that are expected to have insignificant impacts on public sector reporting. The two AASB Interpretations in the list below are also not effective for the 2012-13 reporting period and considered to have insignificant impacts on public sector reporting.
AASB 2009-11 Amendments to Australian Accounting Standards arising from AASB 9.
AASB 2010-2 Amendments to Australian Accounting Standards arising from Reduced Disclosure Requirements.
AASB 2010-7 Amendments to Australian Accounting Standards arising from AASB 9 (December 2010).
AASB 2010-10 Further Amendments to Australian Accounting Standards – Removal of Fixed Dates for First-time Adopters.
AASB 2011-4 Amendments to Australian Accounting Standards to Remove Individual Key Management Personnel Disclosure Requirements.
AASB 2011-6 Amendments to Australian Accounting Standards – Extending Relief from Consolidation, the Equity Method and Proportionate Consolidation – Reduced Disclosure Requirements.
AASB 2011-7 Amendments to Australian Accounting Standards arising from the Consolidation and Joint Arrangements Standards.
AASB 2011-8 Amendments to Australian Accounting Standards arising from AASB 13.
AASB 2011-10 Amendments to Australian Accounting Standards arising from AASB 119 (September 2011).
AASB 2011-11 Amendments to AASB 119 (September 2011) arising from Reduced Disclosure Requirements.
AASB 2011-12 Amendments to Australian Accounting Standards arising from Interpretation 20
2012-1 Amendments to Australian Accounting Standards - Fair Value Measurement - Reduced Disclosure Requirements.
2012-5 Amendments to Australian Accounting Standards arising from Annual Improvements 2009–2011 Cycle.
2012-7 Amendments to Australian Accounting Standards arising from Reduced Disclosure Requirements.
2012-9 Amendment to AASB 1048 arising from the Withdrawal of Australian Interpretation 1039.
2012-10 Amendments to Australian Accounting Standards – Transition Guidance and Other Amendments.
2012-11 Amendments to Australian Accounting Standards – Reduced Disclosure Requirements and Other Amendments.
2013-2 Amendments to AASB 1038 – Regulatory Capital.
2013-3 Amendments to AASB 136 – Recoverable Amount Disclosures for Non-Financial Assets.
Casterton Memorial Hospital 105th Annual Report 2012 – 2013
37
(q) Category Groups
The Hospital has used the following category groups for reporting purposes for the current and previous financial years.
Admitted Patient Services (Admitted Patients) comprises all recurrent health revenue/expenditure on admitted patient services, where services are delivered in public hospitals, or free standing day hospital facilities, or alcohol and drug treatment units or hospitals specialising in dental services, hearing and ophthalmic aids.
Aged Care comprises revenue/expenditure form Home and Community Care (HACC) programs, allied Health, Aged Care Assessment and support services.
Primary Health comprises revenue/expenditure for Community Health Services including health promotion and counselling, physiotherapy, speech therapy, podiatry and occupational therapy.
Residential Aged Care including Mental Health (RAC incl. Mental Health) referred to in the past as psychogeriatric residential services, comprises those Commonwealth-licensed residential aged care services in receipt of supplementary funding from DH under the mental health program. It excludes all other residential services funded under the mental health program, such as mental health-funded community care units (CCUs) and secure extended care units (SECs).
Other Services excluded from Australian Health Care Agreement (AHCA) (Other) comprises revenue/expenditure for services not separately classified above, including: Public health services including Laboratory testing, Blood Borne Viruses / Sexually Transmitted Infections clinical services, Kooris liaison officers, immunisation and screening services, Drugs services including drug withdrawal, counselling and the needle and syringe program, Dental Health services including general and specialist dental care, school dental services and clinical education, Disability services including aids and equipment and flexible support packages to people with a disability, Community Care programs including sexual assault support, early parenting services, parenting assessment and skills development, and various support services. Health and Community Initiatives also falls in this category group.
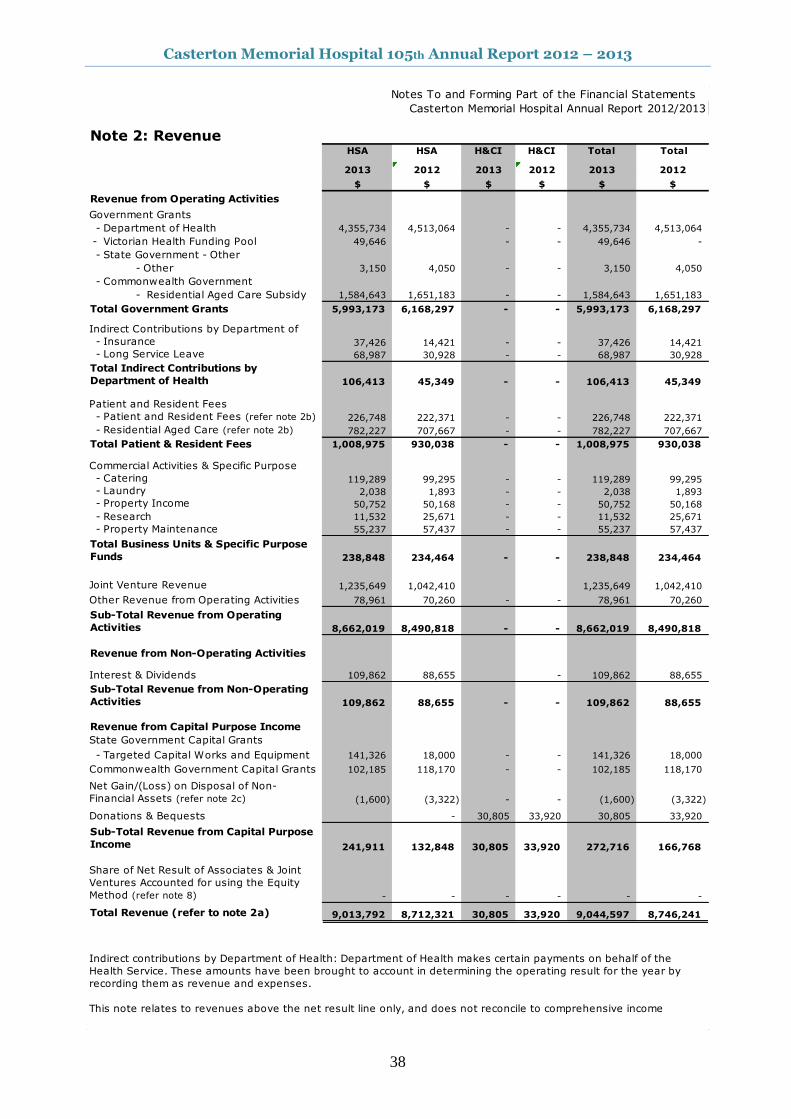
Casterton Memorial Hospital 105th Annual Report 2012 – 2013
38
Notes To and Forming Part of the Financial Statements
Casterton Memorial Hospital Annual Report 2012/2013
Note 2: Revenue HSA HSA H&CI H&CI Total Total
2013 2012 2013 2012 2013 2012
$ $ $ $ $ $
Revenue from Operating Activities
Government Grants
- Department of Health 4,355,734 4,513,064 - - 4,355,734 4,513,064
- Victorian Health Funding Pool 49,646 - - 49,646 -
- State Government - Other
- Other 3,150 4,050 - - 3,150 4,050
- Commonwealth Government
- Residential Aged Care Subsidy 1,584,643 1,651,183 - - 1,584,643 1,651,183
Total Government Grants 5,993,173 6,168,297 - - 5,993,173 6,168,297
Indirect Contributions by Department of
- Insurance 37,426 14,421 - - 37,426 14,421
- Long Service Leave 68,987 30,928 - - 68,987 30,928
Total Indirect Contributions by
Department of Health 106,413 45,349 - - 106,413 45,349
Patient and Resident Fees
- Patient and Resident Fees (refer note 2b) 226,748 222,371 - - 226,748 222,371
- Residential Aged Care (refer note 2b) 782,227 707,667 - - 782,227 707,667
Total Patient & Resident Fees 1,008,975 930,038 - - 1,008,975 930,038
Commercial Activities & Specific Purpose
- Catering 119,289 99,295 - - 119,289 99,295
- Laundry 2,038 1,893 - - 2,038 1,893
- Property Income 50,752 50,168 - - 50,752 50,168
- Research 11,532 25,671 - - 11,532 25,671
- Property Maintenance 55,237 57,437 - - 55,237 57,437
Total Business Units & Specific Purpose
Funds 238,848 234,464 - - 238,848 234,464
Joint Venture Revenue 1,235,649 1,042,410 1,235,649 1,042,410
Other Revenue from Operating Activities 78,961 70,260 - - 78,961 70,260
Sub-Total Revenue from Operating
Activities 8,662,019 8,490,818 - - 8,662,019 8,490,818
Revenue from Non-Operating Activities
Interest & Dividends 109,862 88,655 - 109,862 88,655
Sub-Total Revenue from Non-Operating
Activities 109,862 88,655 - - 109,862 88,655
Revenue from Capital Purpose Income
State Government Capital Grants
- Targeted Capital Works and Equipment 141,326 18,000 - - 141,326 18,000
Commonwealth Government Capital Grants 102,185 118,170 - - 102,185 118,170
Net Gain/(Loss) on Disposal of Non-
Financial Assets (refer note 2c) (1,600) (3,322) - - (1,600) (3,322)
Donations & Bequests - 30,805 33,920 30,805 33,920
Sub-Total Revenue from Capital Purpose
Income 241,911 132,848 30,805 33,920 272,716 166,768
Share of Net Result of Associates & Joint
Ventures Accounted for using the Equity
Method (refer note 8) - - - - - -
Total Revenue (refer to note 2a) 9,013,792 8,712,321 30,805 33,920 9,044,597 8,746,241
Indirect contributions by Department of Health: Department of Health makes certain payments on behalf of the
Health Service. These amounts have been brought to account in determining the operating result for the year by
recording them as revenue and expenses.
This note relates to revenues above the net result line only, and does not reconcile to comprehensive income
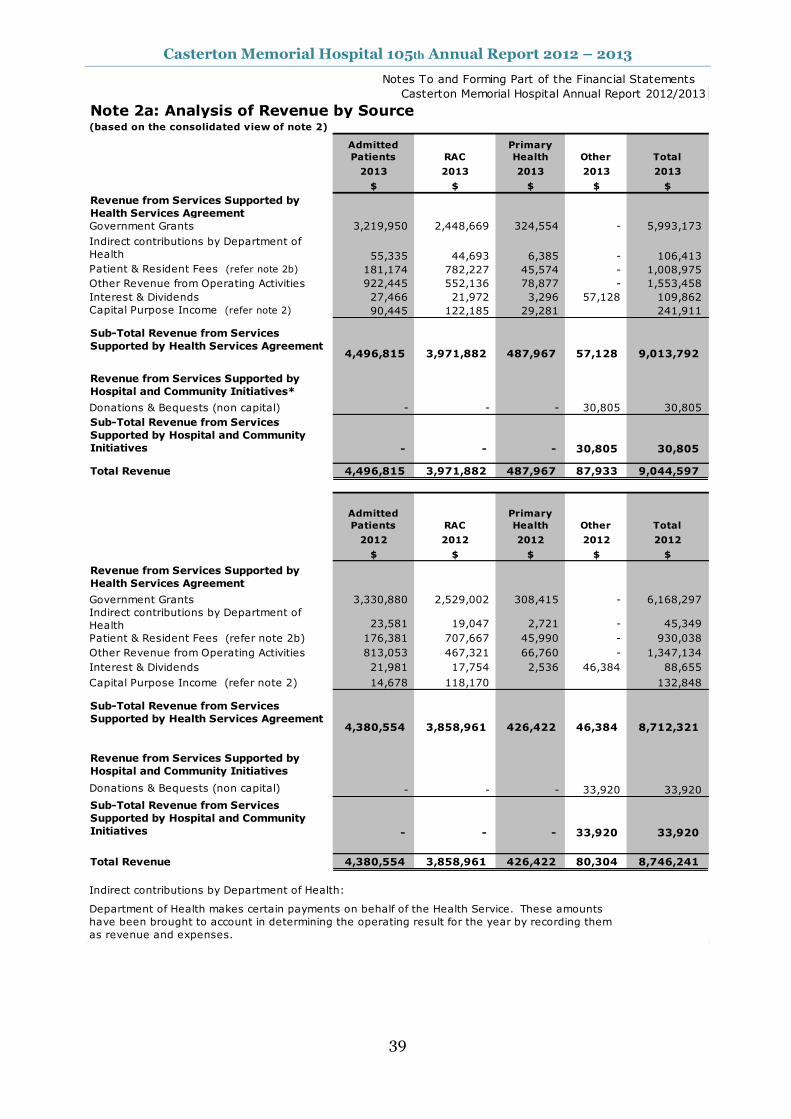
Casterton Memorial Hospital 105th Annual Report 2012 – 2013
39
Notes To and Forming Part of the Financial Statements
Casterton Memorial Hospital Annual Report 2012/2013
Note 2a: Analysis of Revenue by Source(based on the consolidated view of note 2)
2013 2013 2013 2013 2013
$ $ $ $ $
Revenue from Services Supported by
Health Services Agreement
Government Grants 3,219,950 2,448,669 324,554 - 5,993,173
Indirect contributions by Department of
Health 55,335 44,693 6,385 - 106,413
Patient & Resident Fees (refer note 2b) 181,174 782,227 45,574 - 1,008,975
Other Revenue from Operating Activities 922,445 552,136 78,877 - 1,553,458
Interest & Dividends 27,466 21,972 3,296 57,128 109,862
Capital Purpose Income (refer note 2) 90,445 122,185 29,281 241,911
Sub-Total Revenue from Services
Supported by Health Services Agreement4,496,815 3,971,882 487,967 57,128 9,013,792
Revenue from Services Supported by
Hospital and Community Initiatives*
Donations & Bequests (non capital) - - - 30,805 30,805
Sub-Total Revenue from Services
Supported by Hospital and Community
Initiatives - - - 30,805 30,805
Total Revenue 4,496,815 3,971,882 487,967 87,933 9,044,597
2012 2012 2012 2012 2012
$ $ $ $ $
Revenue from Services Supported by
Health Services Agreement
Government Grants 3,330,880 2,529,002 308,415 - 6,168,297
Indirect contributions by Department of
Health 23,581 19,047 2,721 - 45,349
Patient & Resident Fees (refer note 2b) 176,381 707,667 45,990 - 930,038
Other Revenue from Operating Activities 813,053 467,321 66,760 - 1,347,134
Interest & Dividends 21,981 17,754 2,536 46,384 88,655
Capital Purpose Income (refer note 2) 14,678 118,170 132,848
Sub-Total Revenue from Services
Supported by Health Services Agreement4,380,554 3,858,961 426,422 46,384 8,712,321
Revenue from Services Supported by
Hospital and Community Initiatives
Donations & Bequests (non capital) - - - 33,920 33,920
Sub-Total Revenue from Services
Supported by Hospital and Community
Initiatives - - - 33,920 33,920
Total Revenue 4,380,554 3,858,961 426,422 80,304 8,746,241
Indirect contributions by Department of Health:
Total
Other
Primary
Health Total
Admitted
Patients RAC
Department of Health makes certain payments on behalf of the Health Service. These amounts
have been brought to account in determining the operating result for the year by recording them
as revenue and expenses.
Admitted
Patients RAC
Primary
Health Other
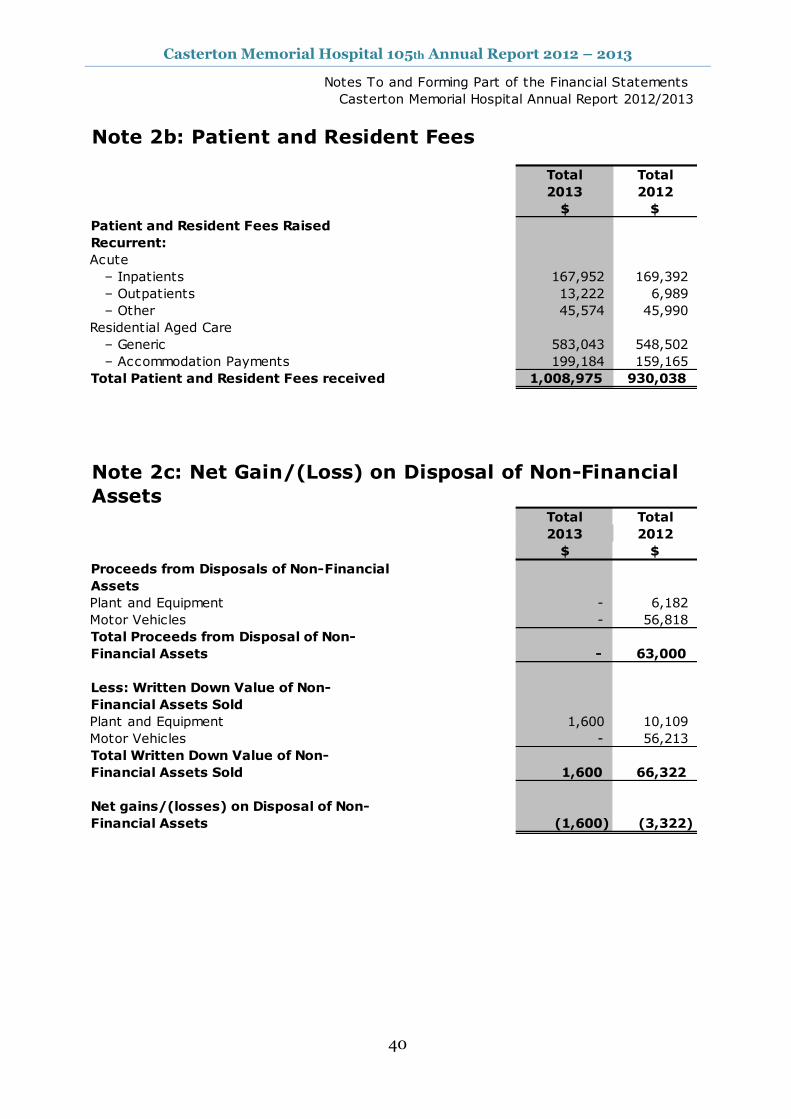
Casterton Memorial Hospital 105th Annual Report 2012 – 2013
40
Notes To and Forming Part of the Financial Statements
Casterton Memorial Hospital Annual Report 2012/2013
Note 2b: Patient and Resident Fees
Total Total
2013 2012
$ $
Patient and Resident Fees Raised
Recurrent:
Acute
– Inpatients 167,952 169,392
– Outpatients 13,222 6,989
– Other 45,574 45,990
Residential Aged Care
– Generic 583,043 548,502
– Accommodation Payments 199,184 159,165
Total Patient and Resident Fees received 1,008,975 930,038
Note 2c: Net Gain/(Loss) on Disposal of Non-Financial
AssetsTotal Total
2013 2012
$ $
Proceeds from Disposals of Non-Financial
Assets
Plant and Equipment - 6,182
Motor Vehicles - 56,818
Total Proceeds from Disposal of Non-
Financial Assets - 63,000
Less: Written Down Value of Non-
Financial Assets Sold
Plant and Equipment 1,600 10,109
Motor Vehicles - 56,213
Total Written Down Value of Non-
Financial Assets Sold 1,600 66,322
Net gains/(losses) on Disposal of Non-
Financial Assets (1,600) (3,322)
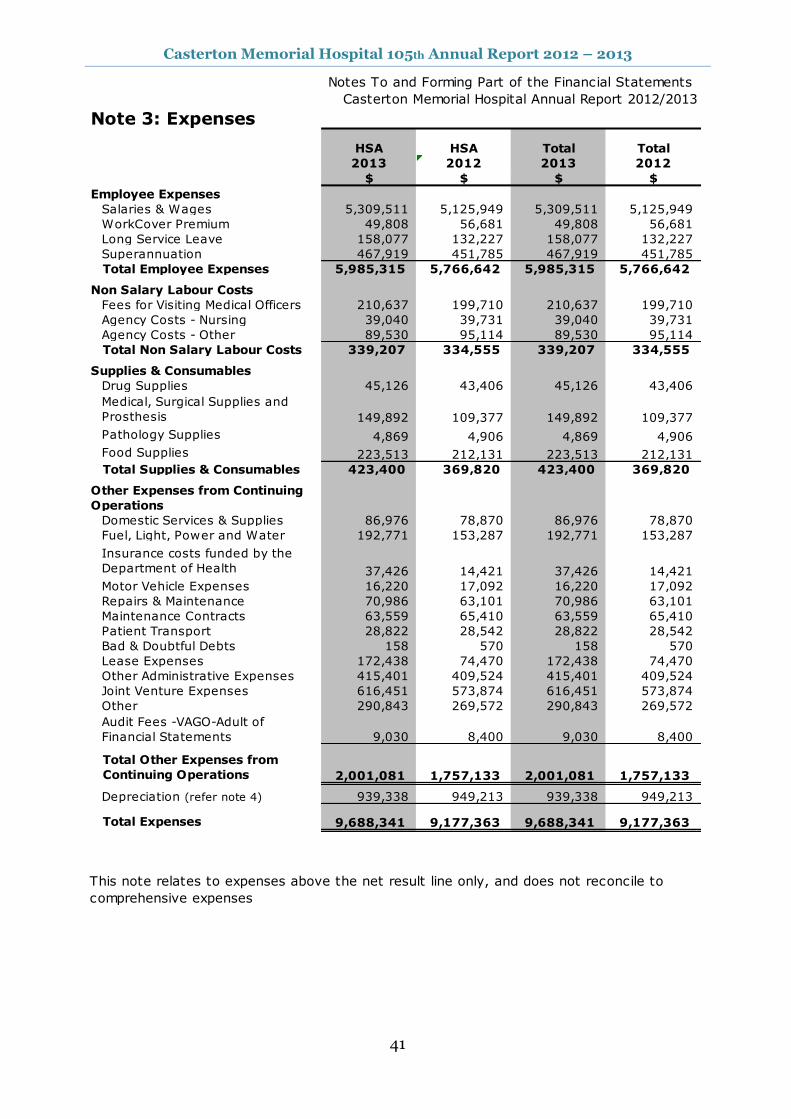
Casterton Memorial Hospital 105th Annual Report 2012 – 2013
41
Notes To and Forming Part of the Financial Statements
Casterton Memorial Hospital Annual Report 2012/2013
Note 3: Expenses
HSA HSA Total Total
2013 2012 2013 2012
$ $ $ $
Employee Expenses
Salaries & Wages 5,309,511 5,125,949 5,309,511 5,125,949
WorkCover Premium 49,808 56,681 49,808 56,681
Long Service Leave 158,077 132,227 158,077 132,227
Superannuation 467,919 451,785 467,919 451,785
Total Employee Expenses 5,985,315 5,766,642 5,985,315 5,766,642
Non Salary Labour Costs
Fees for Visiting Medical Officers 210,637 199,710 210,637 199,710
Agency Costs - Nursing 39,040 39,731 39,040 39,731
Agency Costs - Other 89,530 95,114 89,530 95,114
Total Non Salary Labour Costs 339,207 334,555 339,207 334,555
Supplies & Consumables
Drug Supplies 45,126 43,406 45,126 43,406
Medical, Surgical Supplies and
Prosthesis 149,892 109,377 149,892 109,377
Pathology Supplies 4,869 4,906 4,869 4,906
Food Supplies 223,513 212,131 223,513 212,131
Total Supplies & Consumables 423,400 369,820 423,400 369,820
Other Expenses from Continuing
Operations
Domestic Services & Supplies 86,976 78,870 86,976 78,870
Fuel, Light, Power and Water 192,771 153,287 192,771 153,287
Insurance costs funded by the
Department of Health 37,426 14,421 37,426 14,421
Motor Vehicle Expenses 16,220 17,092 16,220 17,092
Repairs & Maintenance 70,986 63,101 70,986 63,101
Maintenance Contracts 63,559 65,410 63,559 65,410
Patient Transport 28,822 28,542 28,822 28,542
Bad & Doubtful Debts 158 570 158 570
Lease Expenses 172,438 74,470 172,438 74,470
Other Administrative Expenses 415,401 409,524 415,401 409,524
Joint Venture Expenses 616,451 573,874 616,451 573,874
Other 290,843 269,572 290,843 269,572
9,030 8,400 9,030 8,400
Total Other Expenses from
Continuing Operations 2,001,081 1,757,133 2,001,081 1,757,133
Depreciation (refer note 4) 939,338 949,213 939,338 949,213
Total Expenses 9,688,341 9,177,363 9,688,341 9,177,363
This note relates to expenses above the net result line only, and does not reconcile to
comprehensive expenses
Audit Fees -VAGO-Adult of
Financial Statements
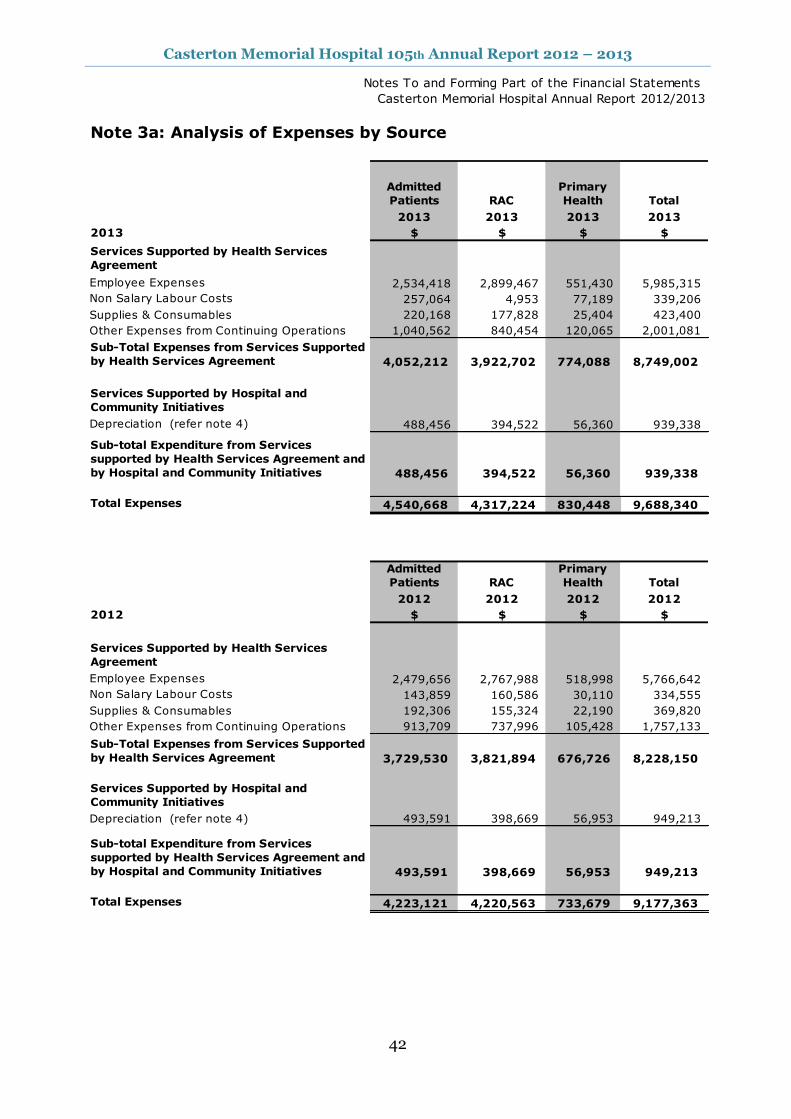
Casterton Memorial Hospital 105th Annual Report 2012 – 2013
42
Notes To and Forming Part of the Financial Statements
Casterton Memorial Hospital Annual Report 2012/2013
Note 3a: Analysis of Expenses by Source
Admitted
Patients RAC
Primary
Health Total
2013 2013 2013 2013
2013 $ $ $ $
Services Supported by Health Services
Agreement
Employee Expenses 2,534,418 2,899,467 551,430 5,985,315
Non Salary Labour Costs 257,064 4,953 77,189 339,206
Supplies & Consumables 220,168 177,828 25,404 423,400
Other Expenses from Continuing Operations 1,040,562 840,454 120,065 2,001,081
Sub-Total Expenses from Services Supported
by Health Services Agreement 4,052,212 3,922,702 774,088 8,749,002
Services Supported by Hospital and
Community Initiatives
Depreciation (refer note 4) 488,456 394,522 56,360 939,338
Sub-total Expenditure from Services
supported by Health Services Agreement and
by Hospital and Community Initiatives 488,456 394,522 56,360 939,338
Total Expenses 4,540,668 4,317,224 830,448 9,688,340
Admitted
Patients RAC
Primary
Health Total
2012 2012 2012 2012
2012 $ $ $ $
Services Supported by Health Services
Agreement
Employee Expenses 2,479,656 2,767,988 518,998 5,766,642
Non Salary Labour Costs 143,859 160,586 30,110 334,555
Supplies & Consumables 192,306 155,324 22,190 369,820
Other Expenses from Continuing Operations 913,709 737,996 105,428 1,757,133
Sub-Total Expenses from Services Supported
by Health Services Agreement 3,729,530 3,821,894 676,726 8,228,150
Services Supported by Hospital and
Community Initiatives
Depreciation (refer note 4) 493,591 398,669 56,953 949,213
Sub-total Expenditure from Services
supported by Health Services Agreement and
by Hospital and Community Initiatives 493,591 398,669 56,953 949,213
Total Expenses 4,223,121 4,220,563 733,679 9,177,363
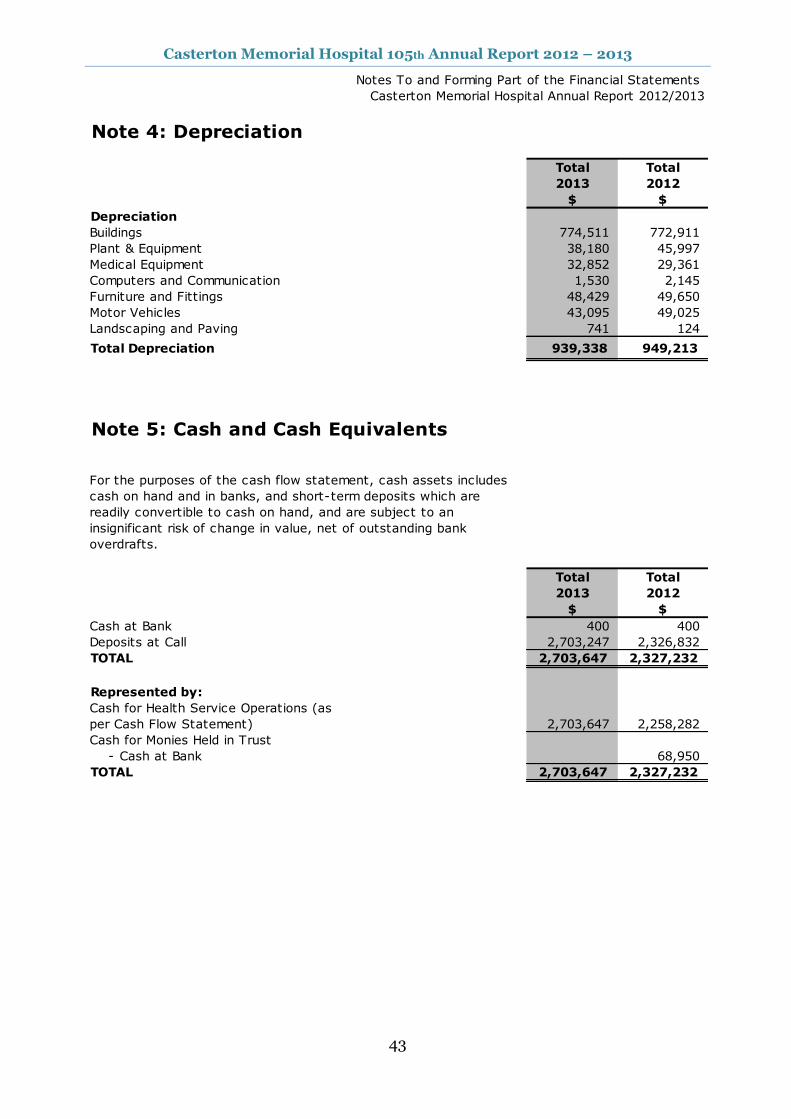
Casterton Memorial Hospital 105th Annual Report 2012 – 2013
43
Notes To and Forming Part of the Financial Statements
Casterton Memorial Hospital Annual Report 2012/2013
Note 4: Depreciation
Total Total
2013 2012
$ $
Depreciation
Buildings 774,511 772,911
Plant & Equipment 38,180 45,997
Medical Equipment 32,852 29,361
Computers and Communication 1,530 2,145
Furniture and Fittings 48,429 49,650
Motor Vehicles 43,095 49,025
Landscaping and Paving 741 124
Total Depreciation 939,338 949,213
Note 5: Cash and Cash Equivalents
Total Total
2013 2012
$ $
Cash at Bank 400 400
Deposits at Call 2,703,247 2,326,832
TOTAL 2,703,647 2,327,232
Represented by:
Cash for Health Service Operations (as
per Cash Flow Statement) 2,703,647 2,258,282
Cash for Monies Held in Trust
- Cash at Bank 68,950
TOTAL 2,703,647 2,327,232
For the purposes of the cash flow statement, cash assets includes
cash on hand and in banks, and short-term deposits which are
readily convertible to cash on hand, and are subject to an
insignificant risk of change in value, net of outstanding bank
overdrafts.
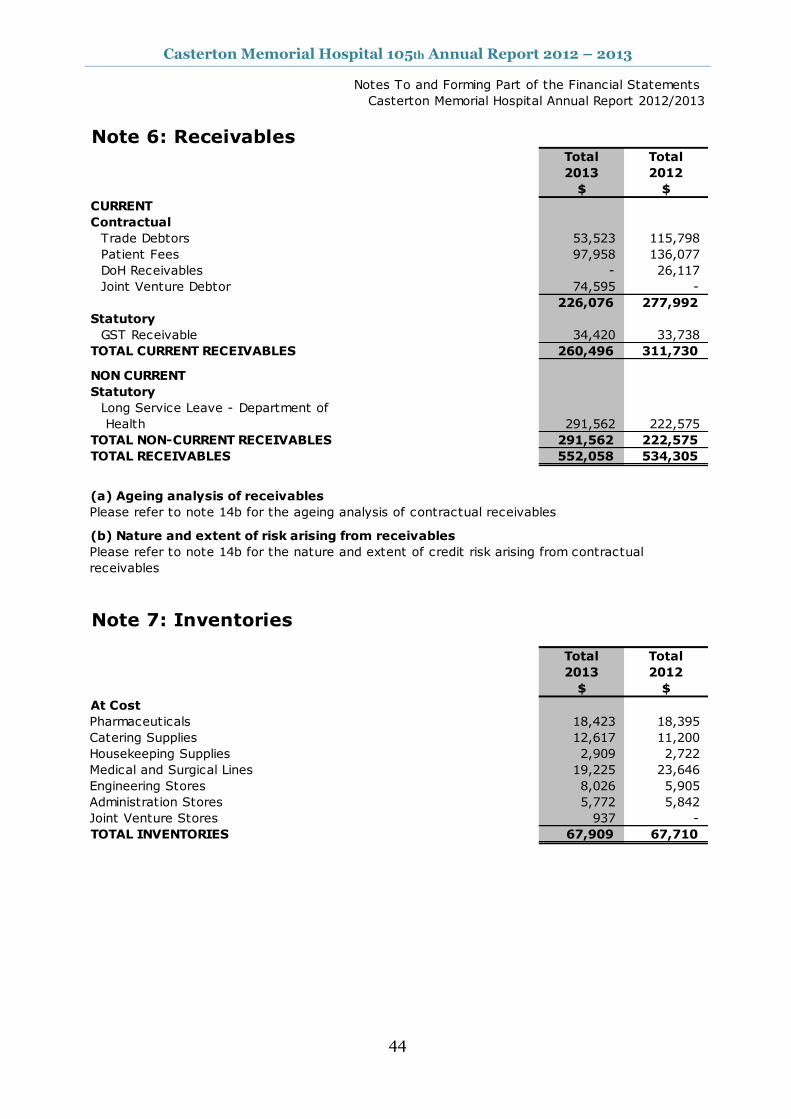
Casterton Memorial Hospital 105th Annual Report 2012 – 2013
44
Notes To and Forming Part of the Financial Statements
Casterton Memorial Hospital Annual Report 2012/2013
Note 6: ReceivablesTotal Total
2013 2012
$ $
CURRENT
Contractual
Trade Debtors 53,523 115,798
Patient Fees 97,958 136,077
DoH Receivables - 26,117
Joint Venture Debtor 74,595 -
226,076 277,992
Statutory
GST Receivable 34,420 33,738
TOTAL CURRENT RECEIVABLES 260,496 311,730
NON CURRENT
Statutory
Long Service Leave - Department of
Health 291,562 222,575
TOTAL NON-CURRENT RECEIVABLES 291,562 222,575
TOTAL RECEIVABLES 552,058 534,305
(a) Ageing analysis of receivables
Please refer to note 14b for the ageing analysis of contractual receivables
(b) Nature and extent of risk arising from receivables
Please refer to note 14b for the nature and extent of credit risk arising from contractual
receivables
Note 7: Inventories
Total Total
2013 2012
$ $
At Cost
Pharmaceuticals 18,423 18,395
Catering Supplies 12,617 11,200
Housekeeping Supplies 2,909 2,722
Medical and Surgical Lines 19,225 23,646
Engineering Stores 8,026 5,905
Administration Stores 5,772 5,842
Joint Venture Stores 937 -
TOTAL INVENTORIES 67,909 67,710

Casterton Memorial Hospital 105th Annual Report 2012 – 2013
45
Notes To and Forming Part of the Financial Statements
Casterton Memorial Hospital Annual Report 2012/2013
Note 8: Property, Plant & Equipment
Total Total
2013 2012
$ $
Land
Land at Fair Value 235,000 235,000
Total Land 235,000 235,000
Buildings
Buildings at Fair Value 14,267,840 15,851,827
Less Acc'd Depreciation - 2,284,940
Total Buildings 14,267,840 13,566,887
Plant and Equipment
Plant and Equipment at Fair Value 640,482 638,952
Less Acc'd Depreciation 455,838 418,913
Total Plant and Equipment 184,644 220,039
Medical Equipment
Medical Equipment at Fair Value 453,331 449,991
Less Acc'd Depreciation 312,630 279,778
Total Medical Equipment 140,701 170,213
Computers and Communication
Computers and Communication at Fair Value 26,811 19,520
Less Acc'd Depreciation 14,555 13,940
Total Computers and Communication 12,256 5,580
Furniture and Fittings
Furniture and Fittings at Fair Value 521,891 497,219
Less Acc'd Depreciation 382,021 337,423
Total Furniture and Fittings 139,870 159,796
Motor Vehicles
Motor Vehicles at Fair Value 292,070 292,070
Less Acc'd Depreciation 186,674 143,579
Total Motor Vehicles 105,396 148,491
TOTAL 15,085,707 14,506,006
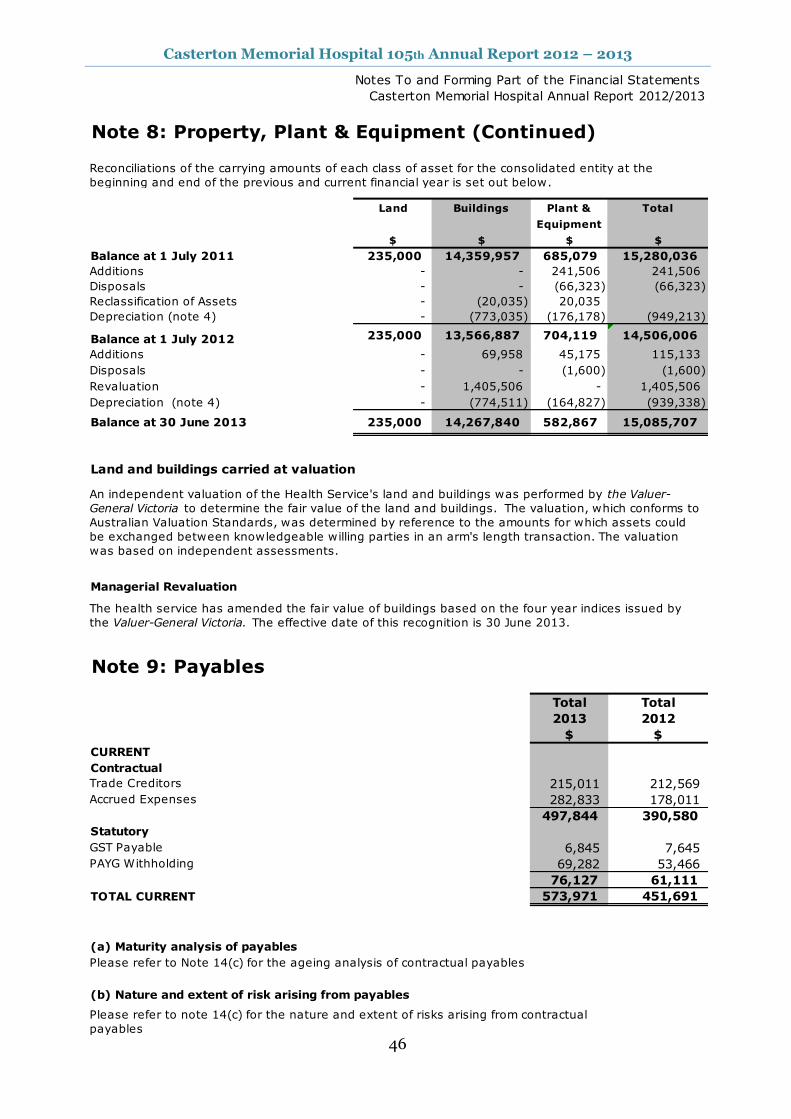
Casterton Memorial Hospital 105th Annual Report 2012 – 2013
46
Notes To and Forming Part of the Financial Statements
Casterton Memorial Hospital Annual Report 2012/2013
Note 8: Property, Plant & Equipment (Continued)
Land Buildings Plant & Total
Equipment
$ $ $ $
Balance at 1 July 2011 235,000 14,359,957 685,079 15,280,036
Additions - - 241,506 241,506
Disposals - - (66,323) (66,323)
Reclassification of Assets - (20,035) 20,035
Depreciation (note 4) - (773,035) (176,178) (949,213)
Balance at 1 July 2012 235,000 13,566,887 704,119 14,506,006
Additions - 69,958 45,175 115,133
Disposals - - (1,600) (1,600)
Revaluation - 1,405,506 - 1,405,506
Depreciation (note 4) - (774,511) (164,827) (939,338)
Balance at 30 June 2013 235,000 14,267,840 582,867 15,085,707
Land and buildings carried at valuation
Managerial Revaluation
Note 9: Payables
Total Total
2013 2012
$ $
CURRENT
Contractual
Trade Creditors 215,011 212,569
Accrued Expenses 282,833 178,011
497,844 390,580
Statutory
GST Payable 6,845 7,645
PAYG Withholding 69,282 53,466
76,127 61,111
TOTAL CURRENT 573,971 451,691
(a) Maturity analysis of payables
Please refer to Note 14(c) for the ageing analysis of contractual payables
(b) Nature and extent of risk arising from payables
Reconciliations of the carrying amounts of each class of asset for the consolidated entity at the
beginning and end of the previous and current financial year is set out below.
An independent valuation of the Health Service's land and buildings was performed by the Valuer-
General Victoria to determine the fair value of the land and buildings. The valuation, which conforms to
Australian Valuation Standards, was determined by reference to the amounts for which assets could
be exchanged between knowledgeable willing parties in an arm's length transaction. The valuation
was based on independent assessments.
Please refer to note 14(c) for the nature and extent of risks arising from contractual
payables
The health service has amended the fair value of buildings based on the four year indices issued by
the Valuer-General Victoria. The effective date of this recognition is 30 June 2013.
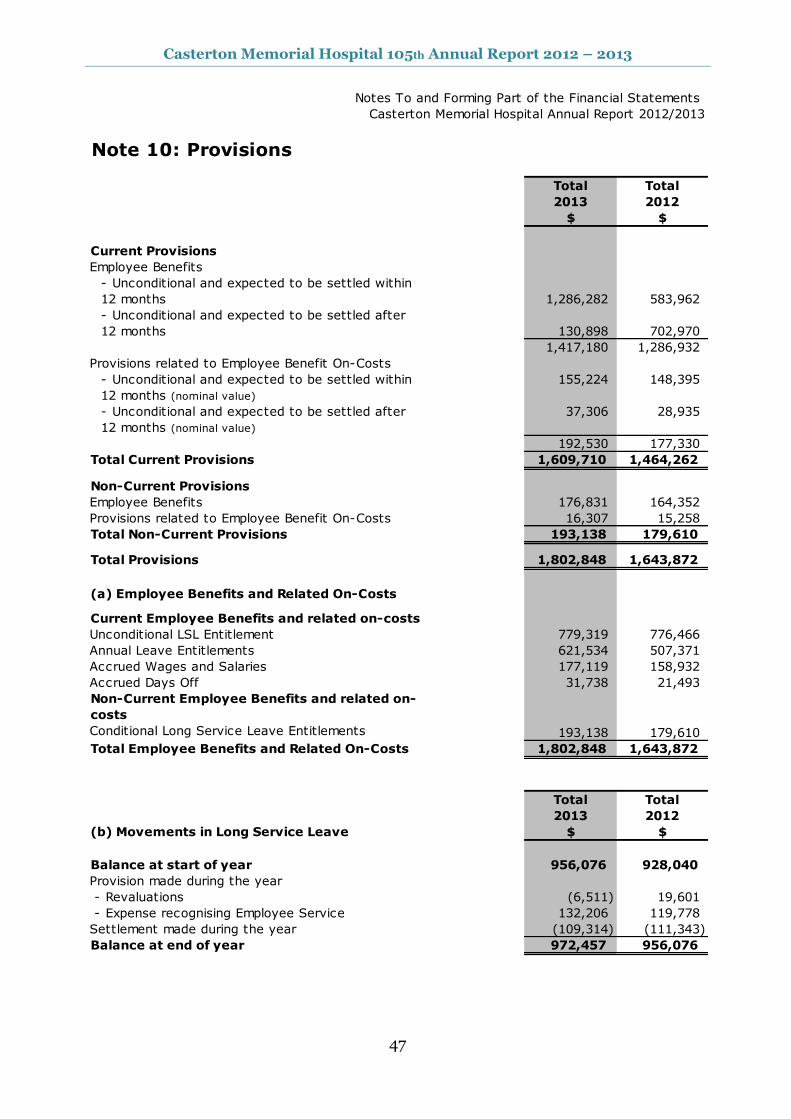
Casterton Memorial Hospital 105th Annual Report 2012 – 2013
47
Notes To and Forming Part of the Financial Statements
Casterton Memorial Hospital Annual Report 2012/2013
Note 10: Provisions
Total Total
2013 2012
$ $
Current Provisions
Employee Benefits
- Unconditional and expected to be settled within
12 months 1,286,282 583,962
- Unconditional and expected to be settled after
12 months 130,898 702,970
1,417,180 1,286,932
Provisions related to Employee Benefit On-Costs
- Unconditional and expected to be settled within
12 months (nominal value)
155,224 148,395
- Unconditional and expected to be settled after
12 months (nominal value)
37,306 28,935
192,530 177,330
Total Current Provisions 1,609,710 1,464,262
Non-Current Provisions
Employee Benefits 176,831 164,352
Provisions related to Employee Benefit On-Costs 16,307 15,258
Total Non-Current Provisions 193,138 179,610
Total Provisions 1,802,848 1,643,872
(a) Employee Benefits and Related On-Costs
Current Employee Benefits and related on-costs
Unconditional LSL Entitlement 779,319 776,466
Annual Leave Entitlements 621,534 507,371
Accrued Wages and Salaries 177,119 158,932
Accrued Days Off 31,738 21,493
Non-Current Employee Benefits and related on-
costs
Conditional Long Service Leave Entitlements 193,138 179,610
Total Employee Benefits and Related On-Costs 1,802,848 1,643,872
Total Total
2013 2012
(b) Movements in Long Service Leave $ $
Balance at start of year 956,076 928,040
Provision made during the year
- Revaluations (6,511) 19,601
- Expense recognising Employee Service 132,206 119,778
Settlement made during the year (109,314) (111,343)
Balance at end of year 972,457 956,076
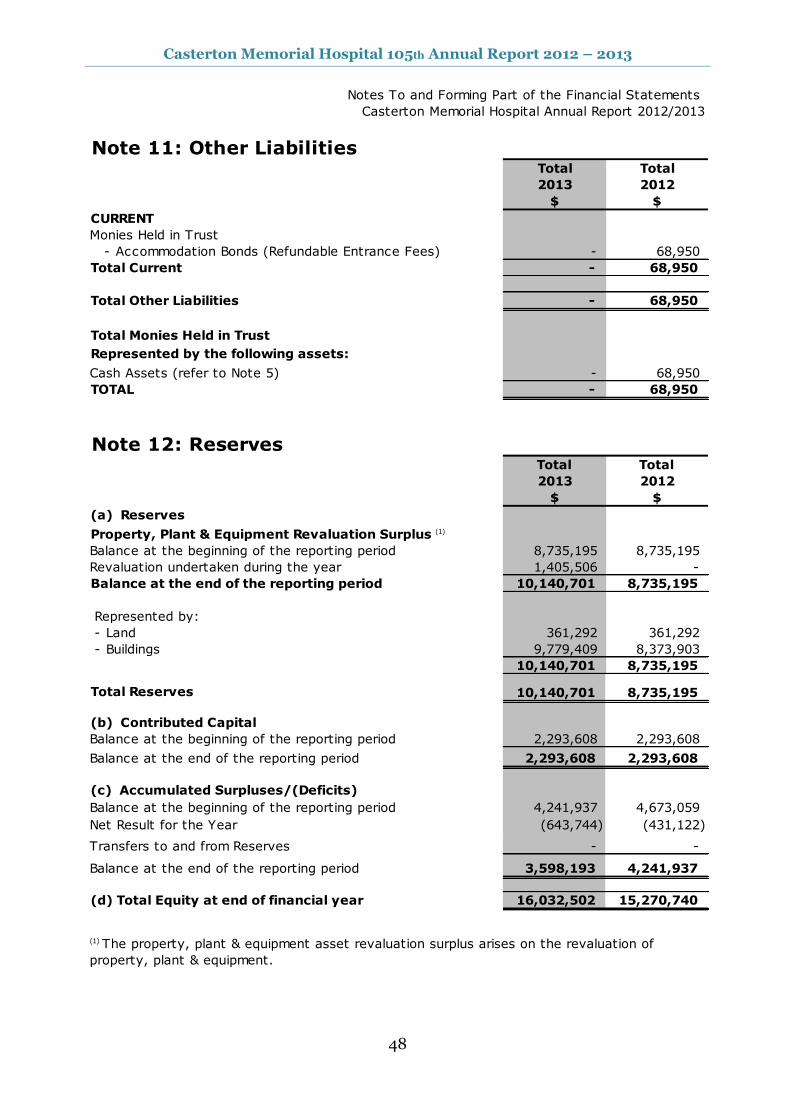
Casterton Memorial Hospital 105th Annual Report 2012 – 2013
48
Notes To and Forming Part of the Financial Statements
Casterton Memorial Hospital Annual Report 2012/2013
Note 11: Other LiabilitiesTotal Total
2013 2012
$ $
CURRENT
Monies Held in Trust
- Accommodation Bonds (Refundable Entrance Fees) - 68,950
Total Current - 68,950
Total Other Liabilities - 68,950
Represented by the following assets:
Cash Assets (refer to Note 5) - 68,950
TOTAL - 68,950
Note 12: ReservesTotal Total
2013 2012
$ $
(a) Reserves
Property, Plant & Equipment Revaluation Surplus (1)
Balance at the beginning of the reporting period 8,735,195 8,735,195
Revaluation undertaken during the year 1,405,506 -
Balance at the end of the reporting period 10,140,701 8,735,195
Represented by:
- Land 361,292 361,292
- Buildings 9,779,409 8,373,903
10,140,701 8,735,195
Total Reserves 10,140,701 8,735,195
(b) Contributed Capital
Balance at the beginning of the reporting period 2,293,608 2,293,608
2,293,608 2,293,608
Balance at the beginning of the reporting period 4,241,937 4,673,059
Net Result for the Year (643,744) (431,122)
- -
3,598,193 4,241,937
(d) Total Equity at end of financial year 16,032,502 15,270,740
Total Monies Held in Trust
(1) The property, plant & equipment asset revaluation surplus arises on the revaluation of
property, plant & equipment.
Balance at the end of the reporting period
Transfers to and from Reserves
Balance at the end of the reporting period
(c) Accumulated Surpluses/(Deficits)
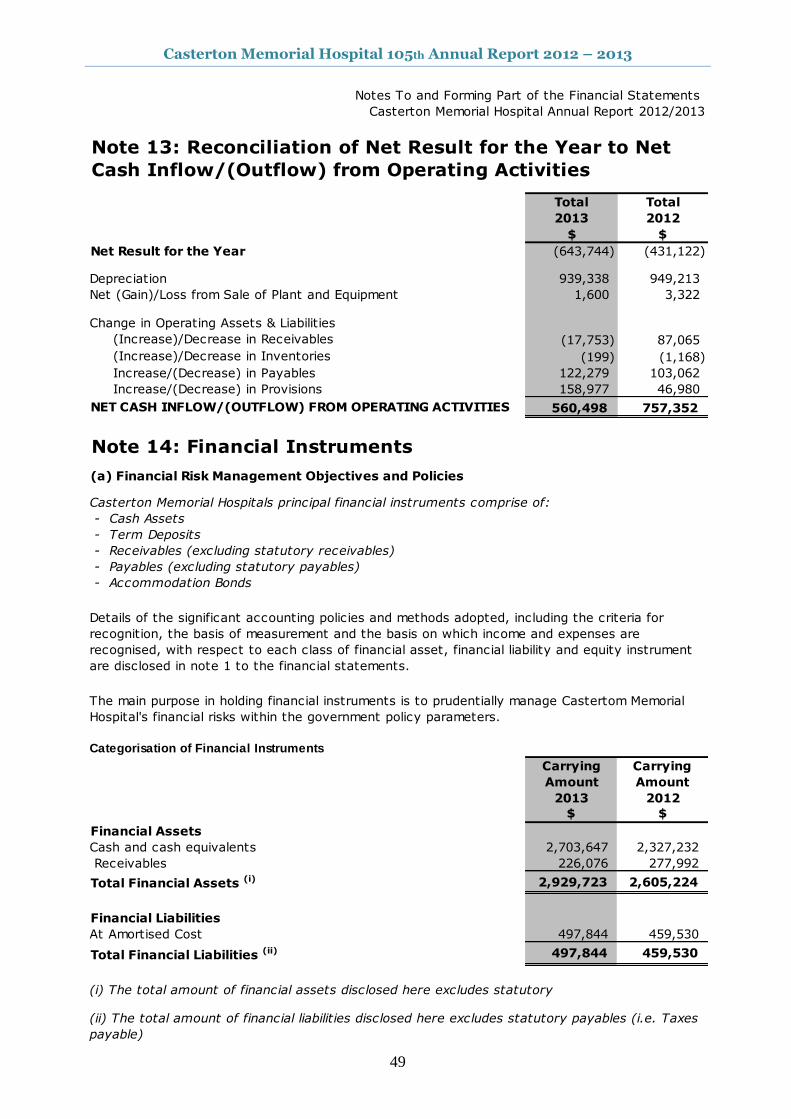
Casterton Memorial Hospital 105th Annual Report 2012 – 2013
49
Notes To and Forming Part of the Financial Statements
Casterton Memorial Hospital Annual Report 2012/2013
Total Total
2013 2012
$ $
Net Result for the Year (643,744) (431,122)
Depreciation 939,338 949,213
Net (Gain)/Loss from Sale of Plant and Equipment 1,600 3,322
Change in Operating Assets & Liabilities
(Increase)/Decrease in Receivables (17,753) 87,065
(Increase)/Decrease in Inventories (199) (1,168)
Increase/(Decrease) in Payables 122,279 103,062
Increase/(Decrease) in Provisions 158,977 46,980
NET CASH INFLOW/(OUTFLOW) FROM OPERATING ACTIVITIES 560,498 757,352
Note 14: Financial Instruments
(a) Financial Risk Management Objectives and Policies
Casterton Memorial Hospitals principal financial instruments comprise of:
- Cash Assets
- Term Deposits
- Receivables (excluding statutory receivables)
- Payables (excluding statutory payables)
- Accommodation Bonds
Categorisation of Financial Instruments
Carrying
Amount
Carrying
Amount
2013 2012
$ $
Financial Assets
Cash and cash equivalents 2,703,647 2,327,232
Receivables 226,076 277,992
Total Financial Assets (i) 2,929,723 2,605,224
Financial Liabilities
At Amortised Cost 497,844 459,530
Total Financial Liabilities (ii) 497,844 459,530
(i) The total amount of financial assets disclosed here excludes statutory
Details of the significant accounting policies and methods adopted, including the criteria for
recognition, the basis of measurement and the basis on which income and expenses are
recognised, with respect to each class of financial asset, financial liability and equity instrument
are disclosed in note 1 to the financial statements.
The main purpose in holding financial instruments is to prudentially manage Castertom Memorial
Hospital's financial risks within the government policy parameters.
(ii) The total amount of financial liabilities disclosed here excludes statutory payables (i.e. Taxes
payable)
Note 13: Reconciliation of Net Result for the Year to Net
Cash Inflow/(Outflow) from Operating Activities
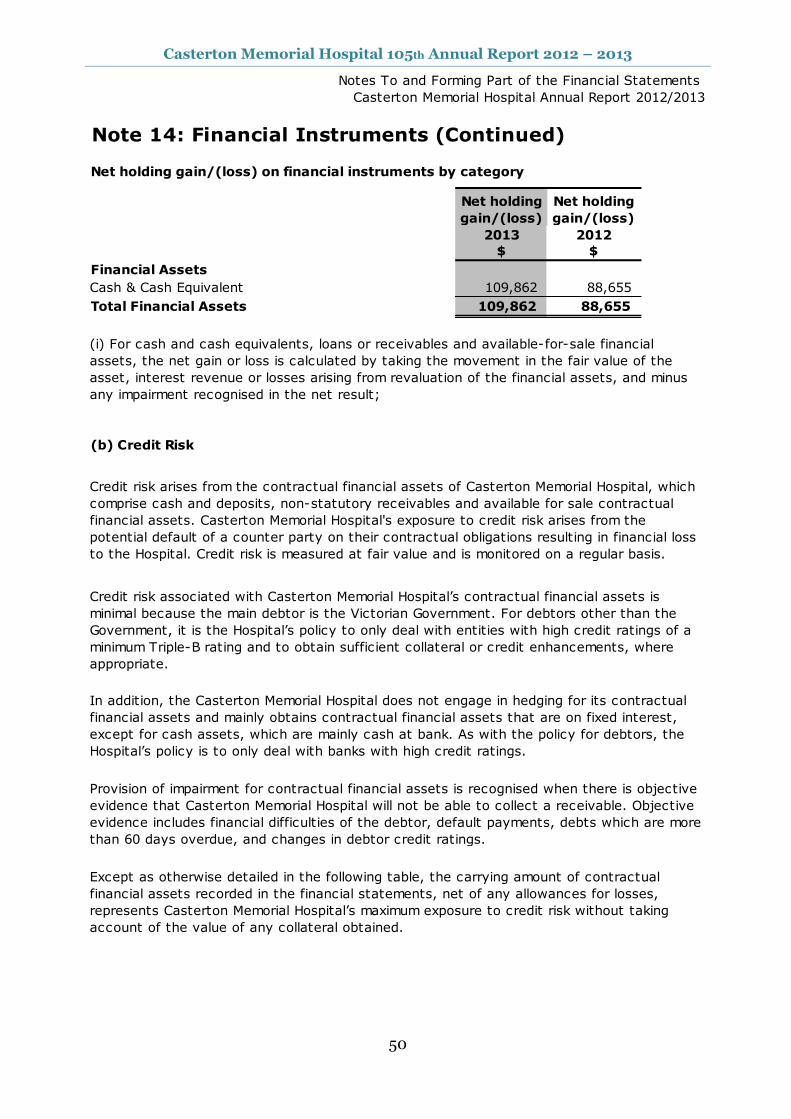
Casterton Memorial Hospital 105th Annual Report 2012 – 2013
50
Notes To and Forming Part of the Financial Statements
Casterton Memorial Hospital Annual Report 2012/2013
Note 14: Financial Instruments (Continued)
Net holding gain/(loss) on financial instruments by category
Net holding
gain/(loss)
Net holding
gain/(loss)
2013 2012
$ $
Financial Assets
Cash & Cash Equivalent 109,862 88,655
Total Financial Assets 109,862 88,655
(b) Credit Risk
Provision of impairment for contractual financial assets is recognised when there is objective
evidence that Casterton Memorial Hospital will not be able to collect a receivable. Objective
evidence includes financial difficulties of the debtor, default payments, debts which are more
than 60 days overdue, and changes in debtor credit ratings.
Except as otherwise detailed in the following table, the carrying amount of contractual
financial assets recorded in the financial statements, net of any allowances for losses,
represents Casterton Memorial Hospital’s maximum exposure to credit risk without taking
account of the value of any collateral obtained.
(i) For cash and cash equivalents, loans or receivables and available-for-sale financial
assets, the net gain or loss is calculated by taking the movement in the fair value of the
asset, interest revenue or losses arising from revaluation of the financial assets, and minus
any impairment recognised in the net result;
In addition, the Casterton Memorial Hospital does not engage in hedging for its contractual
financial assets and mainly obtains contractual financial assets that are on fixed interest,
except for cash assets, which are mainly cash at bank. As with the policy for debtors, the
Hospital’s policy is to only deal with banks with high credit ratings.
Credit risk arises from the contractual financial assets of Casterton Memorial Hospital, which
comprise cash and deposits, non-statutory receivables and available for sale contractual
financial assets. Casterton Memorial Hospital's exposure to credit risk arises from the
potential default of a counter party on their contractual obligations resulting in financial loss
to the Hospital. Credit risk is measured at fair value and is monitored on a regular basis.
Credit risk associated with Casterton Memorial Hospital’s contractual financial assets is
minimal because the main debtor is the Victorian Government. For debtors other than the
Government, it is the Hospital’s policy to only deal with entities with high credit ratings of a
minimum Triple-B rating and to obtain sufficient collateral or credit enhancements, where
appropriate.
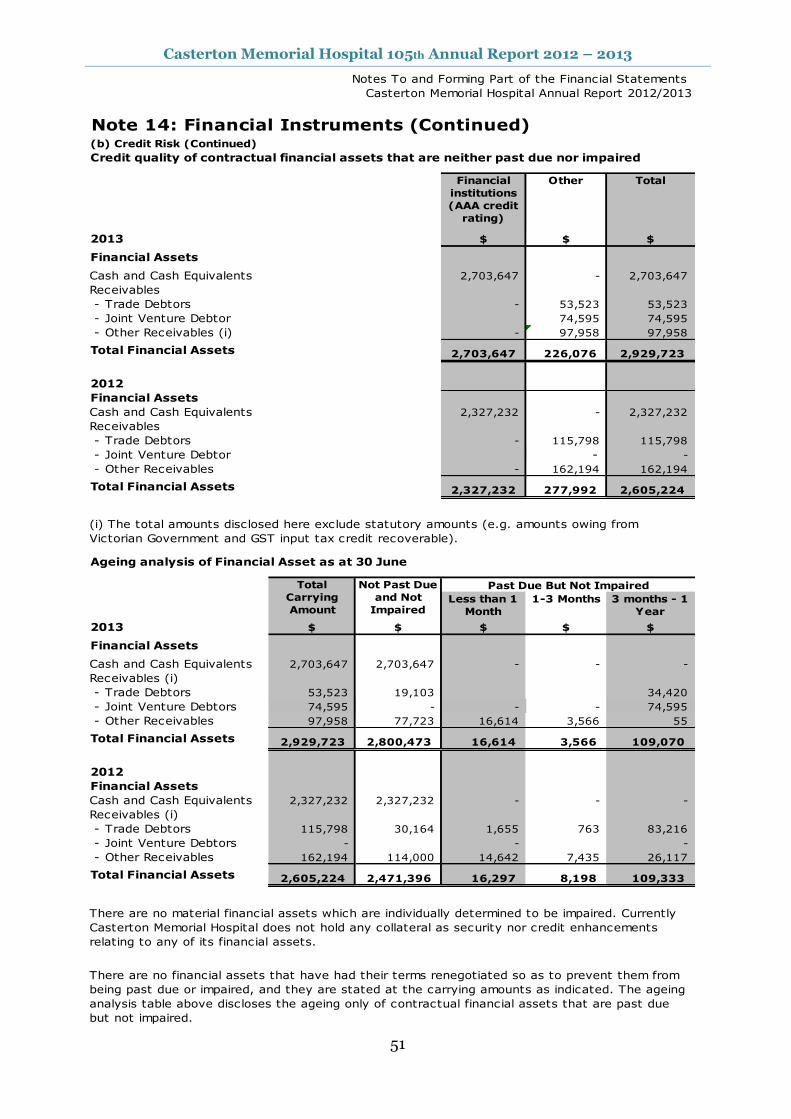
Casterton Memorial Hospital 105th Annual Report 2012 – 2013
51
Notes To and Forming Part of the Financial Statements
Casterton Memorial Hospital Annual Report 2012/2013
Note 14: Financial Instruments (Continued)(b) Credit Risk (Continued)
Credit quality of contractual financial assets that are neither past due nor impaired
2013 $ $ $
Financial Assets
Cash and Cash Equivalents 2,703,647 - 2,703,647
Receivables
- Trade Debtors - 53,523 53,523
- Joint Venture Debtor 74,595 74,595
- Other Receivables (i) - 97,958 97,958
Total Financial Assets 2,703,647 226,076 2,929,723
2012
Financial Assets
Cash and Cash Equivalents 2,327,232 - 2,327,232
Receivables
- Trade Debtors - 115,798 115,798
- Joint Venture Debtor - -
- Other Receivables - 162,194 162,194
Total Financial Assets 2,327,232 277,992 2,605,224
Ageing analysis of Financial Asset as at 30 June
Less than 1
Month
1-3 Months 3 months - 1
Year
2013 $ $ $ $ $
Financial Assets
Cash and Cash Equivalents 2,703,647 2,703,647 - - -
Receivables (i)
- Trade Debtors 53,523 19,103 34,420
- Joint Venture Debtors 74,595 - - - 74,595
- Other Receivables 97,958 77,723 16,614 3,566 55
Total Financial Assets 2,929,723 2,800,473 16,614 3,566 109,070
2012
Financial Assets
Cash and Cash Equivalents 2,327,232 2,327,232 - - -
Receivables (i)
- Trade Debtors 115,798 30,164 1,655 763 83,216
- Joint Venture Debtors - - -
- Other Receivables 162,194 114,000 14,642 7,435 26,117
Total Financial Assets 2,605,224 2,471,396 16,297 8,198 109,333
There are no material financial assets which are individually determined to be impaired. Currently
Casterton Memorial Hospital does not hold any collateral as security nor credit enhancements
relating to any of its financial assets.
There are no financial assets that have had their terms renegotiated so as to prevent them from
being past due or impaired, and they are stated at the carrying amounts as indicated. The ageing
analysis table above discloses the ageing only of contractual financial assets that are past due
but not impaired.
(i) The total amounts disclosed here exclude statutory amounts (e.g. amounts owing from
Victorian Government and GST input tax credit recoverable).
Financial
institutions
(AAA credit
rating)
Other Total
Total
Carrying
Amount
Not Past Due
and Not
Impaired
Past Due But Not Impaired

Casterton Memorial Hospital 105th Annual Report 2012 – 2013
52
Notes To and Forming Part of the Financial Statements
Casterton Memorial Hospital Annual Report 2012/2013
Note 14: Financial Instruments (Continued)
(c) Liquidity Risk
Carrying
Amount
Contractual
Cash Flows
Less than 1
Month
1-3
Months
3 months -
1 Year
1-5 Years
2013 $ $ $ $ $ $
Financial Liabilities
Payables 423,249 423,249 423,249 - - -
Other Financial Liabilities (i)
- Accommodation Bonds - - - - - -
Total Financial Liabilities 423,249 423,249 423,249 - - -
2012
Financial Liabilities
Payables 390,580 390,580 390,580 - - -
Other Financial Liabilities (i)
- Accommodation Bonds 68,950 68,950 - - - 68,950
Total Financial Liabilities 459,530 459,530 390,580 - - 68,950
(d) Market Risk
Currency Risk
The Casterton Memorial Hospital's exposures to market risk are primarily through interest rate risk
with only insignificant exposure to foreign currency and other price risks. Objectives, policies and
processes used to manage each of these risks are disclosed in the paragraph below.
The Casterton Memorial Hospital is exposed to insignificant foreign currency risk through its
payables relating to purchases of supplies and consumables from overseas. This is because of a
limited amount of purchases denominated in foreign currencies and a short timeframe between
commitment and settlement.
Liquidity risk is the risk that the Hospital would be unable to meet its financial obligations as and
when they fall due.
Casterton Memorial Hospital's maximum exposure to liquidity risk is the carrying amounts of
financial liabilities as disclosed in the face of the balance sheet. The Hospital manages its liquidity
risk as follows:
(i) Ageing analysis of financial liabilities excludes the types of statutory financial liabilities (i.e GST
payable)
Maturity Dates
The following table discloses the contractual maturity analysis for Casterton Memorial Hospital's
financial liabilities. For interest rates applicable to each class of liability refer to individual notes to
the financial statements.
Maturity analysis of Financial Liabilities as at 30 June
Trade creditors are paid in accordance with their trading terms. Accommodation bonds are
refunded when the resident departs the aged care facility. Sufficient cash reserves are held to
ensure these commitments are met when due
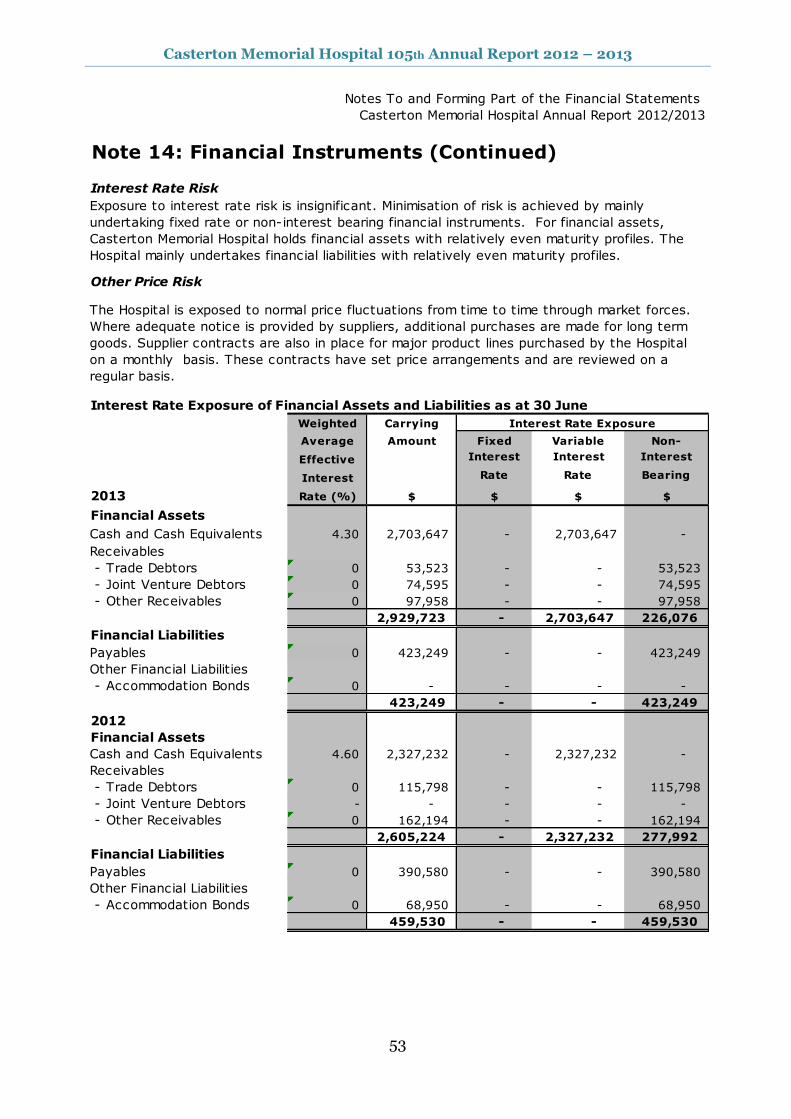
Casterton Memorial Hospital 105th Annual Report 2012 – 2013
53
Notes To and Forming Part of the Financial Statements
Casterton Memorial Hospital Annual Report 2012/2013
Note 14: Financial Instruments (Continued)
Interest Rate Risk
Other Price Risk
Interest Rate Exposure of Financial Assets and Liabilities as at 30 June
Weighted Carrying
Average Amount Fixed Variable Non-
Effective Interest Interest Interest
Interest Rate Rate Bearing
2013 Rate (%) $ $ $ $
Financial Assets
Cash and Cash Equivalents 4.30 2,703,647 - 2,703,647 -
Receivables
- Trade Debtors 0 53,523 - - 53,523
- Joint Venture Debtors 0 74,595 - - 74,595
- Other Receivables 0 97,958 - - 97,958
2,929,723 - 2,703,647 226,076
Financial Liabilities
Payables 0 423,249 - - 423,249
Other Financial Liabilities
- Accommodation Bonds 0 - - - -
423,249 - - 423,249
2012
Financial Assets
Cash and Cash Equivalents 4.60 2,327,232 - 2,327,232 -
Receivables
- Trade Debtors 0 115,798 - - 115,798
- Joint Venture Debtors - - - - -
- Other Receivables 0 162,194 - - 162,194
2,605,224 - 2,327,232 277,992
Financial Liabilities
Payables 0 390,580 - - 390,580
Other Financial Liabilities
- Accommodation Bonds 0 68,950 - - 68,950
459,530 - - 459,530
Interest Rate Exposure
Exposure to interest rate risk is insignificant. Minimisation of risk is achieved by mainly
undertaking fixed rate or non-interest bearing financial instruments. For financial assets,
Casterton Memorial Hospital holds financial assets with relatively even maturity profiles. The
Hospital mainly undertakes financial liabilities with relatively even maturity profiles.
The Hospital is exposed to normal price fluctuations from time to time through market forces.
Where adequate notice is provided by suppliers, additional purchases are made for long term
goods. Supplier contracts are also in place for major product lines purchased by the Hospital
on a monthly basis. These contracts have set price arrangements and are reviewed on a
regular basis.
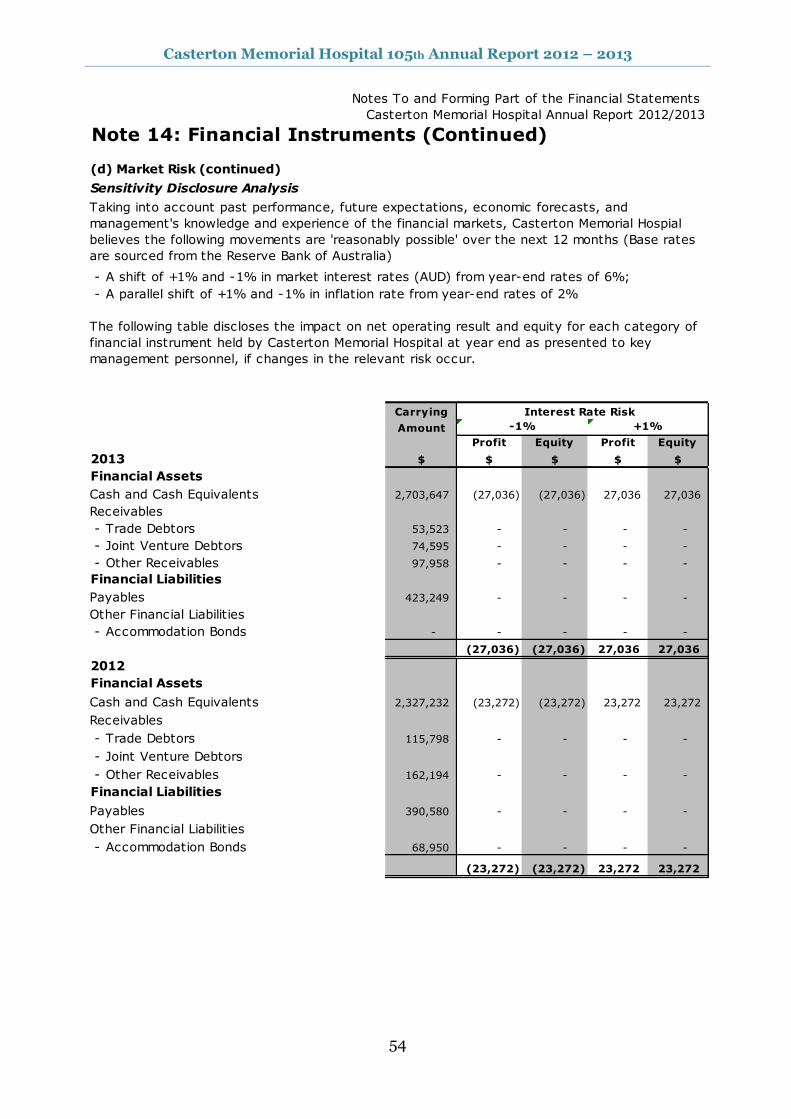
Casterton Memorial Hospital 105th Annual Report 2012 – 2013
54
Notes To and Forming Part of the Financial Statements
Casterton Memorial Hospital Annual Report 2012/2013
Note 14: Financial Instruments (Continued)
(d) Market Risk (continued)
Sensitivity Disclosure Analysis
- A shift of +1% and -1% in market interest rates (AUD) from year-end rates of 6%;
- A parallel shift of +1% and -1% in inflation rate from year-end rates of 2%
Carrying
Amount
Profit Equity Profit Equity
2013 $ $ $ $ $
Financial Assets
Cash and Cash Equivalents 2,703,647 (27,036) (27,036) 27,036 27,036
Receivables
- Trade Debtors 53,523 - - - -
- Joint Venture Debtors 74,595 - - - -
- Other Receivables 97,958 - - - -
Financial Liabilities
Payables 423,249 - - - -
Other Financial Liabilities
- Accommodation Bonds - - - - -
(27,036) (27,036) 27,036 27,036
2012
Financial Assets
Cash and Cash Equivalents 2,327,232 (23,272) (23,272) 23,272 23,272
Receivables
- Trade Debtors 115,798 - - - -
- Joint Venture Debtors
- Other Receivables 162,194 - - - -
Financial Liabilities
Payables 390,580 - - - -
Other Financial Liabilities
- Accommodation Bonds 68,950 - - - -
(23,272) (23,272) 23,272 23,272
Taking into account past performance, future expectations, economic forecasts, and
management's knowledge and experience of the financial markets, Casterton Memorial Hospial
believes the following movements are 'reasonably possible' over the next 12 months (Base rates
are sourced from the Reserve Bank of Australia)
The following table discloses the impact on net operating result and equity for each category of
financial instrument held by Casterton Memorial Hospital at year end as presented to key
management personnel, if changes in the relevant risk occur.
Interest Rate Risk
-1% +1%
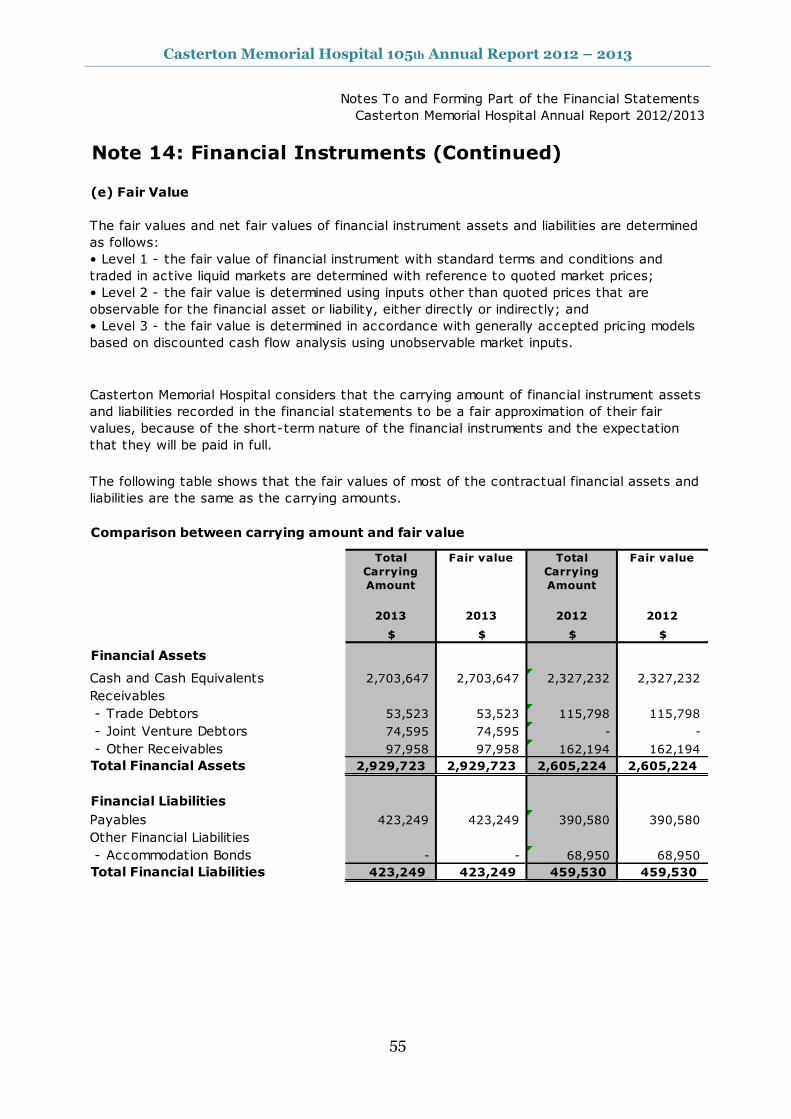
Casterton Memorial Hospital 105th Annual Report 2012 – 2013
55
Notes To and Forming Part of the Financial Statements
Casterton Memorial Hospital Annual Report 2012/2013
Note 14: Financial Instruments (Continued)
(e) Fair Value
Total
Carrying
Amount
Fair value Total
Carrying
Amount
Fair value
2013 2013 2012 2012
$ $ $ $
Financial Assets
Cash and Cash Equivalents 2,703,647 2,703,647 2,327,232 2,327,232
Receivables
- Trade Debtors 53,523 53,523 115,798 115,798
- Joint Venture Debtors 74,595 74,595 - -
- Other Receivables 97,958 97,958 162,194 162,194
Total Financial Assets 2,929,723 2,929,723 2,605,224 2,605,224
Financial Liabilities
Payables 423,249 423,249 390,580 390,580
Other Financial Liabilities
- Accommodation Bonds - - 68,950 68,950
Total Financial Liabilities 423,249 423,249 459,530 459,530
The fair values and net fair values of financial instrument assets and liabilities are determined
as follows:
• Level 1 - the fair value of financial instrument with standard terms and conditions and
traded in active liquid markets are determined with reference to quoted market prices;
• Level 2 - the fair value is determined using inputs other than quoted prices that are
observable for the financial asset or liability, either directly or indirectly; and
• Level 3 - the fair value is determined in accordance with generally accepted pricing models
based on discounted cash flow analysis using unobservable market inputs.
Casterton Memorial Hospital considers that the carrying amount of financial instrument assets
and liabilities recorded in the financial statements to be a fair approximation of their fair
values, because of the short-term nature of the financial instruments and the expectation
that they will be paid in full.
The following table shows that the fair values of most of the contractual financial assets and
liabilities are the same as the carrying amounts.
Comparison between carrying amount and fair value
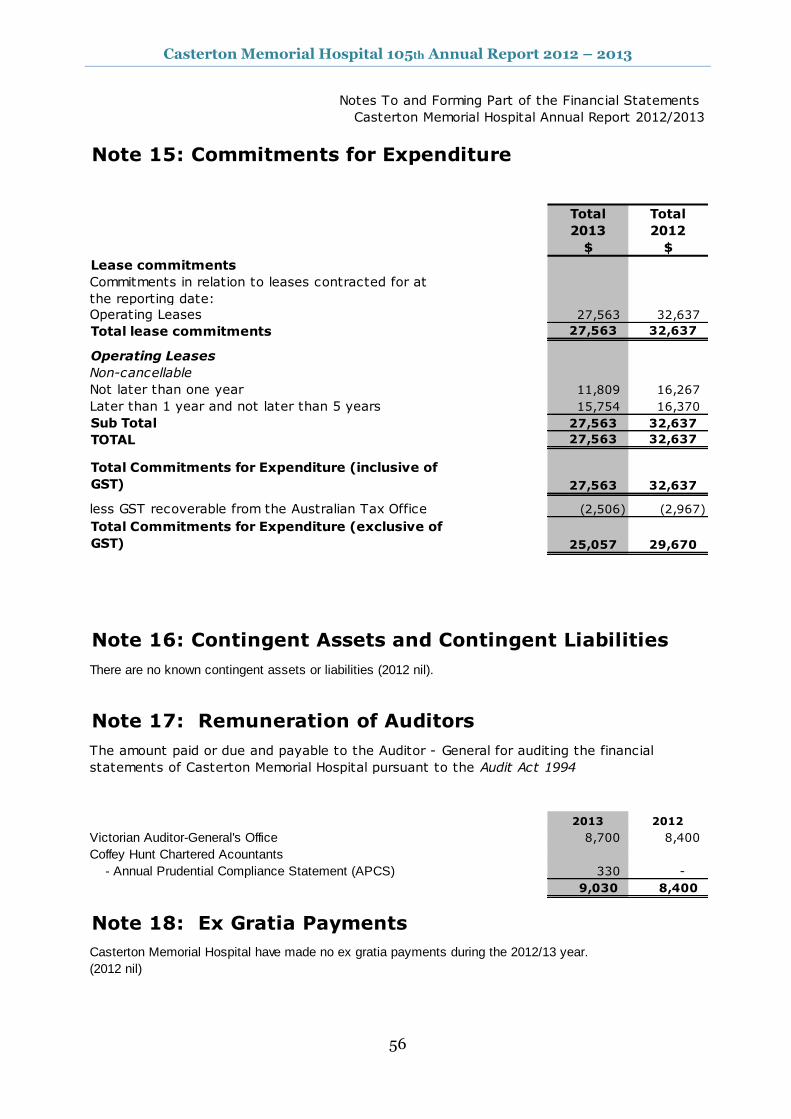
Casterton Memorial Hospital 105th Annual Report 2012 – 2013
56
Notes To and Forming Part of the Financial Statements
Casterton Memorial Hospital Annual Report 2012/2013
Note 15: Commitments for Expenditure
Total Total
2013 2012
$ $
Lease commitments
Commitments in relation to leases contracted for at
the reporting date:
Operating Leases 27,563 32,637
Total lease commitments 27,563 32,637
Operating Leases
Non-cancellable
Not later than one year 11,809 16,267
Later than 1 year and not later than 5 years 15,754 16,370
Sub Total 27,563 32,637
TOTAL 27,563 32,637
Total Commitments for Expenditure (inclusive of
GST) 27,563 32,637
less GST recoverable from the Australian Tax Office (2,506) (2,967)
Total Commitments for Expenditure (exclusive of
GST) 25,057 29,670
Note 16: Contingent Assets and Contingent Liabilities
There are no known contingent assets or liabilities (2012 nil).
Note 17: Remuneration of Auditors
2013 2012
Victorian Auditor-General's Office 8,700 8,400
Coffey Hunt Chartered Acountants
- Annual Prudential Compliance Statement (APCS) 330 -
9,030 8,400
Note 18: Ex Gratia Payments
Casterton Memorial Hospital have made no ex gratia payments during the 2012/13 year.
(2012 nil)
The amount paid or due and payable to the Auditor - General for auditing the financial
statements of Casterton Memorial Hospital pursuant to the Audit Act 1994
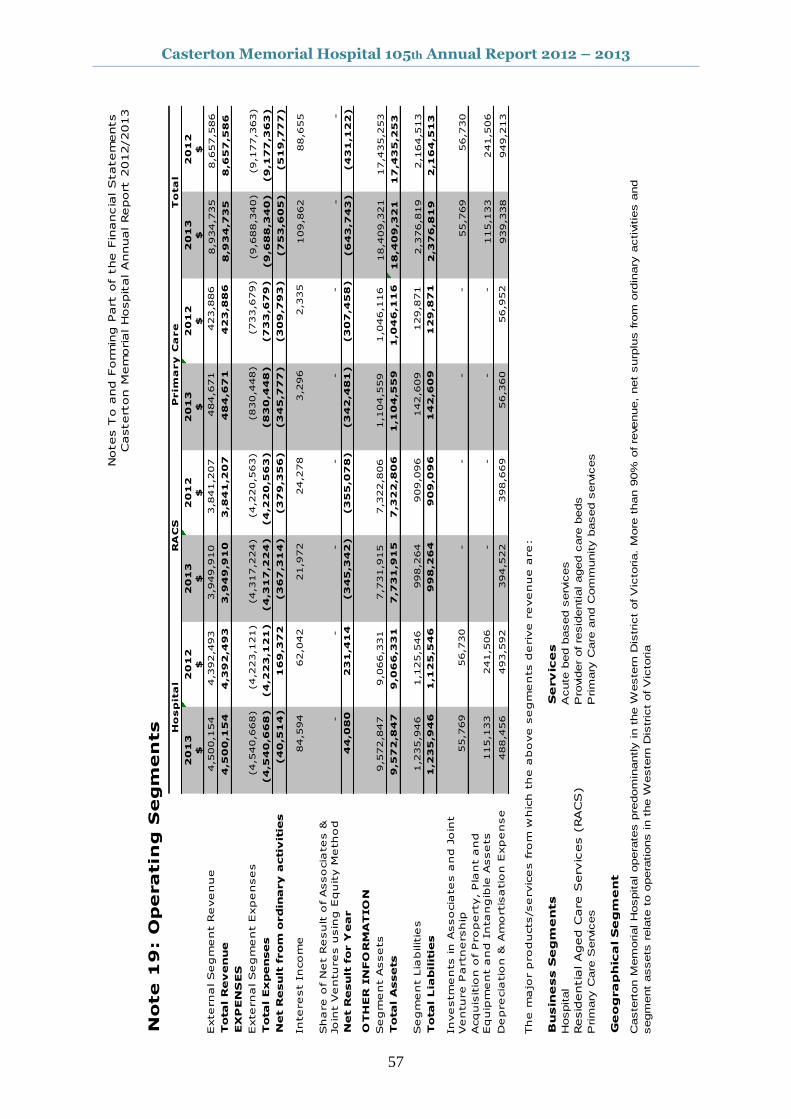
Casterton Memorial Hospital 105th Annual Report 2012 – 2013
57
Notes T
o a
nd F
orm
ing P
art
of
the F
inancia
l Statem
ents
Castert
on M
em
orial Hospital Annual Report
2012/2013
Note 1
9: O
peratin
g S
egm
en
ts
20
13
20
12
20
13
20
12
20
13
20
12
20
13
20
12
$$
$$
$$
$$
External Segm
ent R
evenue
4,5
00,1
54
4,3
92,4
93
3,9
49,9
10
3,8
41,2
07
484,6
71
423,8
86
8,9
34,7
35
8,6
57,5
86
Total R
evenue
4,5
00
,15
4
4,3
92
,49
3
3,9
49
,91
0
3,8
41
,20
7
4
84
,67
1
4
23
,88
6
8,9
34
,73
5
8
,65
7,5
86
EX
PEN
SES
External Segm
ent E
xpenses
(4,5
40,6
68)
(4,2
23,1
21)
(4,3
17,2
24)
(4,2
20,5
63)
(
830,4
48)
(
733,6
79)
(9,6
88,3
40)
(9,1
77,3
63)
Total Expenses
(4
,54
0,6
68
)
(4
,22
3,1
21
)
(4
,31
7,2
24
)
(4
,22
0,5
63
)
(
83
0,4
48
)
(
73
3,6
79
)(9
,68
8,3
40
)
(9
,17
7,3
63
)
Net R
esult
from
ordin
ary a
ctiv
itie
s
(4
0,5
14
)
16
9,3
72
(
36
7,3
14
)
(
37
9,3
56
)
(
34
5,7
77
)
(
30
9,7
93
)(7
53
,60
5)
(5
19
,77
7)
Interest I
ncom
e
84,5
94
62,0
42
21,9
72
24,2
78
3,2
96
2,3
35
109,8
62
88,6
55
Share o
f N
et R
esult o
f Associa
tes &
Join
t V
entures u
sin
g E
quity M
ethod
-
-
-
-
-
-
-
-
Net R
esult
for Y
ear
44
,08
0
2
31
,41
4
(
34
5,3
42
)
(
35
5,0
78
)
(
34
2,4
81
)
(
30
7,4
58
)(6
43
,74
3)
(4
31
,12
2)
OTH
ER
IN
FO
RM
ATIO
N
Segm
ent A
ssets
9,5
72,8
47
9,0
66,3
31
7,7
31,9
15
7,3
22,8
06
1,1
04,5
59
1,0
46,1
16
18,4
09,3
21
17,4
35,2
53
Total A
ssets
9,5
72
,84
7
9,0
66
,33
1
7,7
31
,91
5
7,3
22
,80
6
1,1
04
,55
9
1,0
46
,11
6
18
,40
9,3
21
1
7,4
35
,25
3
Segm
ent L
iabilitie
s
1
,235,9
46
1,1
25,5
46
998,2
64
909,0
96
142,6
09
129,8
71
2,3
76,8
19
2,1
64,5
13
Total Lia
bilit
ies
1,2
35
,94
6
1,1
25
,54
6
9
98
,26
4
9
09
,09
6
1
42
,60
9
1
29
,87
1
2,3
76
,81
9
2
,16
4,5
13
Investm
ents in A
ssocia
tes a
nd J
oin
t
Venture P
artnership
55,7
69
56,7
30
-
-
-
-
55,7
69
56,7
30
Acquis
itio
n o
f Property, Pla
nt a
nd
Equip
ment a
nd I
ntangib
le A
ssets
115,1
33
241,5
06
-
-
-
-
115,1
33
241,5
06
Deprecia
tio
n &
Am
ortis
atio
n E
xpense
488,4
56
493,5
92
394,5
22
398,6
69
56,3
60
56,9
52
939,3
38
949,2
13
The m
ajo
r p
roducts/servic
es from
whic
h t
he a
bove s
egm
ents d
eriv
e r
evenue a
re:
Bu
sin
ess S
eg
me
nts
Se
rv
ice
s
Hospital
Acute
bed b
ased s
erv
ices
Resid
entia
l Aged C
are
Serv
ices (
RACS)
Pro
vid
er
of re
sid
ential aged c
are
beds
Prim
ary
Care
Serv
ices
Prim
ary
Care
and C
om
munity b
ased s
erv
ices
Ge
og
ra
ph
ica
l S
eg
me
nt
Caste
rton M
em
orial H
ospital opera
tes p
redom
inantly in t
he W
este
rn D
istr
ict
of V
icto
ria.
More
than 9
0%
of re
venue,
net
surp
lus fro
m o
rdin
ary
activitie
s a
nd
segm
ent
assets
rela
te t
o o
pera
tions in t
he W
este
rn D
istr
ict
of V
icto
ria
To
ta
lH
osp
ita
lR
AC
SP
rim
ary
Ca
re
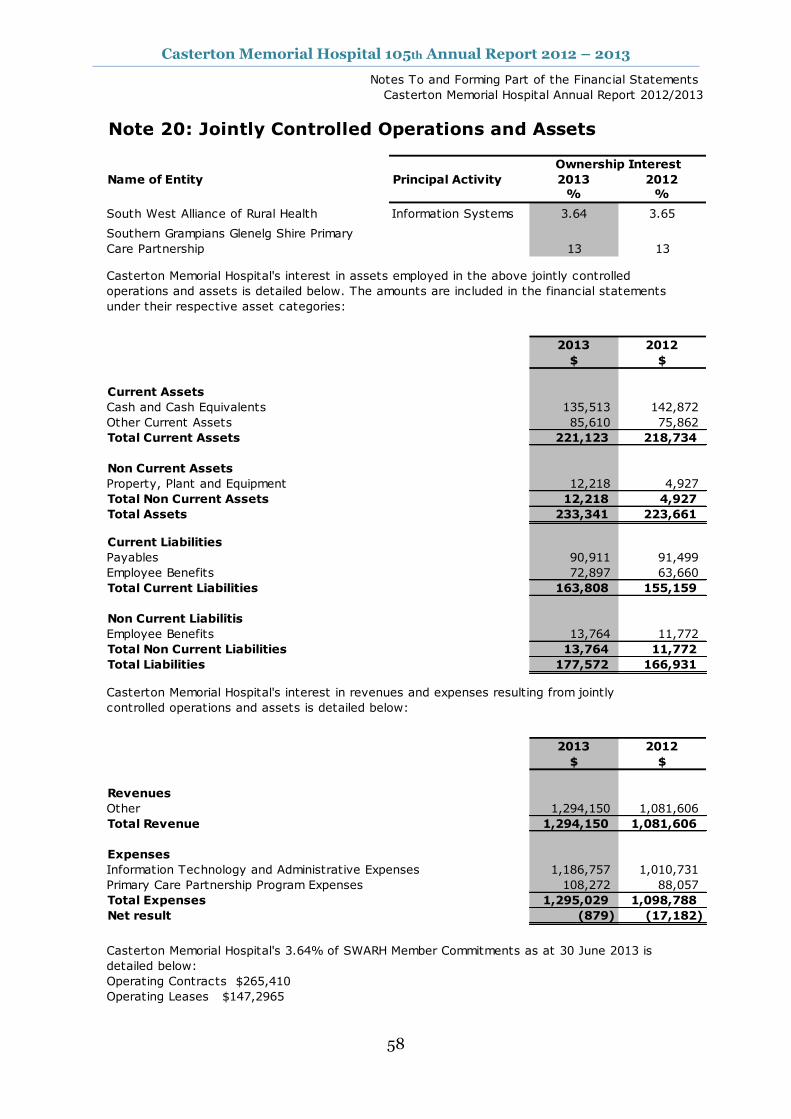
Casterton Memorial Hospital 105th Annual Report 2012 – 2013
58
Notes To and Forming Part of the Financial Statements
Casterton Memorial Hospital Annual Report 2012/2013
Note 20: Jointly Controlled Operations and Assets
Name of Entity Principal Activity 2013 2012
% %
South West Alliance of Rural Health Information Systems 3.64 3.65
Southern Grampians Glenelg Shire Primary
Care Partnership 13 13
Casterton Memorial Hospital's interest in assets employed in the above jointly controlled
operations and assets is detailed below. The amounts are included in the financial statements
under their respective asset categories:
2013 2012
$ $
Current Assets
Cash and Cash Equivalents 135,513 142,872
Other Current Assets 85,610 75,862
Total Current Assets 221,123 218,734
Non Current Assets
Property, Plant and Equipment 12,218 4,927
Total Non Current Assets 12,218 4,927
Total Assets 233,341 223,661
Current Liabilities
Payables 90,911 91,499
Employee Benefits 72,897 63,660
Total Current Liabilities 163,808 155,159
Non Current Liabilitis
Employee Benefits 13,764 11,772
Total Non Current Liabilities 13,764 11,772
Total Liabilities 177,572 166,931
Casterton Memorial Hospital's interest in revenues and expenses resulting from jointly
controlled operations and assets is detailed below:
2013 2012
$ $
Revenues
Other 1,294,150 1,081,606
Total Revenue 1,294,150 1,081,606
Expenses
Information Technology and Administrative Expenses 1,186,757 1,010,731
Primary Care Partnership Program Expenses 108,272 88,057
Total Expenses 1,295,029 1,098,788
Net result (879) (17,182)
Operating Contracts $265,410
Operating Leases $147,2965
Ownership Interest
Casterton Memorial Hospital's 3.64% of SWARH Member Commitments as at 30 June 2013 is
detailed below:

Casterton Memorial Hospital 105th Annual Report 2012 – 2013
59
Notes To and Forming Part of the Financial Statements
Casterton Memorial Hospital Annual Report 2012/2013
Note 21a: Responsible Persons Disclosures
Governing Boards
Mr T Baker
Dr T Halloran
Mr P Green
Mr G Sheppard
Mrs C Brown
Mr R Dalby
Fr A Hayes
Mrs Karen Black
Mr Gerald Smith
Accountable Officers
Mr O Stephens
Remuneration of Responsible Persons
The number of Responsible Persons are shown in their relevant income bands;
2013 2012
Income Band No. No.
$0 - $9,999 9 9
$180,000 - $189,999 1 1
Total Numbers 10 10
$187,106 $178,391
Executive Officers' Remuneration
2013 2012 2013 2012
No. No. No. No.
$120,000 - $129,000 1 1 1 1
Total annualised employee equivalents (AEE) (i) 1 1 1 1
Total Remuneration 127,593 121,923 127,593 121,923
Note 22 Events Occurring after the Balance Sheet Date
In accordance with the Ministerial Directions issued by the Minister for Finance under the Financial
Management Act 1994 , the following disclosures are made regarding responsible persons for the
reporting period.
Note 21b: Executive Officer Disclosures
01/07/2012 - 30/06/2013
01/07/2012 - 30/06/2013
24/07/2012 - 30/06/2013
Total remuneration received or due and receivable by Responsible
Persons from the reporting entity amounted to:
Amounts relating to Responsible Ministers are reported in the financial
statements of the Department of Premier and Cabinet
Remuneration
Responsible Ministers:
Period
01/07/2012 - 30/06/2013
01/07/2012 - 30/06/2013
01/07/2012 - 30/06/2013
01/07/2012 - 30/06/2013
01/07/2012 - 30/06/2013
Casterton Memorial Hospital has made no payments to other personnel or contractors with
significant management responsibilities during the 2012/13 year. (2012 nil).
The Honourable David Davis, MLC, Minister for Health and Ageing
01/07/2012 - 30/06/2013
There have been no events subsequent to the reporting date which require further disclosure.
(2012 nil)
Total Remuneration Base Remuneration
24/07/2012 - 30/06/2013
01/07/2012 - 30/06/2013
(i) Annualised employee equivalent is based on paid working hours of 38 ordinary hours per week
over 52 weeks for a reporting period
The numbers of executive officers, other than Ministers and Accountable Officers, and their total
remuneration during the reporting period are shown in the first two columns in the table below their
relevant income bands. The base remuneration of executive officers is shown in the third and fourth
columns. Base remuneration is exclusive of bonus payments, long service leave payments,
redundancy payments and retirement benefits.
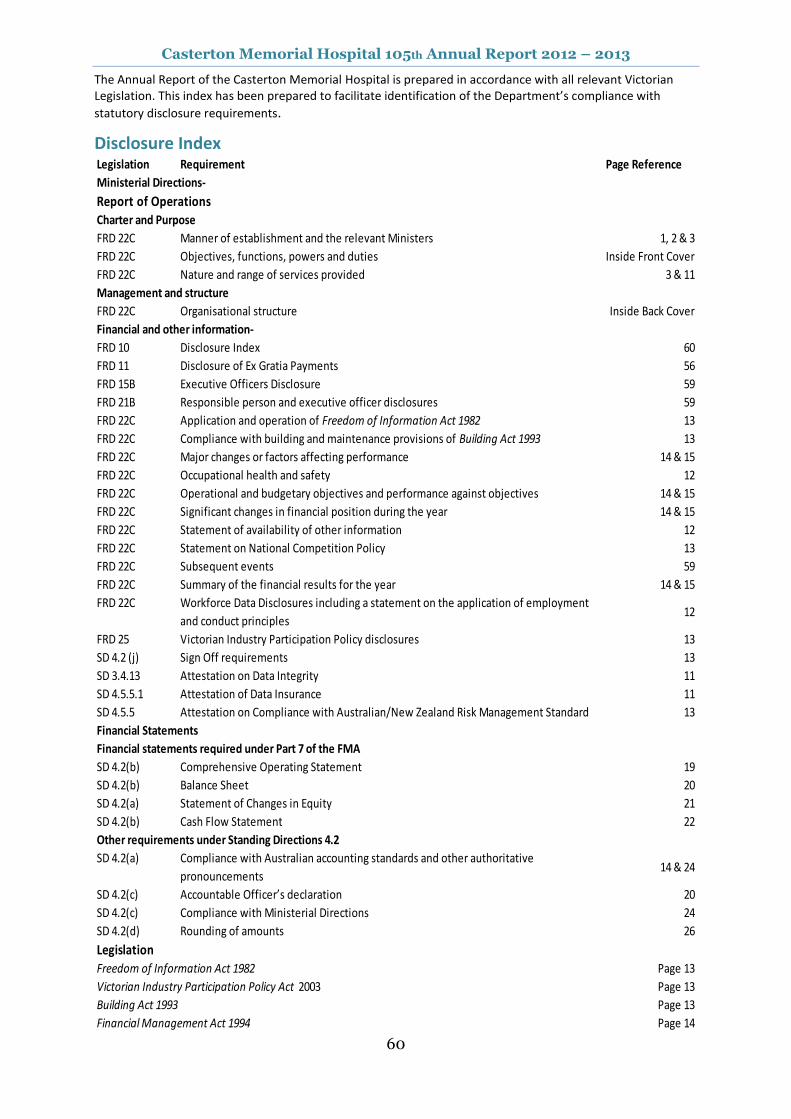
Casterton Memorial Hospital 105th Annual Report 2012 – 2013
60
The Annual Report of the Casterton Memorial Hospital is prepared in accordance with all relevant Victorian Legislation. This index has been prepared to facilitate identification of the Department’s compliance with
statutory disclosure requirements.
Disclosure Index Legislation Requirement Page Reference
Ministerial Directions-
Report of Operations
Charter and Purpose
FRD 22C Manner of establishment and the relevant Ministers 1, 2 & 3
FRD 22C Objectives, functions, powers and duties Inside Front Cover
FRD 22C Nature and range of services provided 3 & 11
Management and structure
FRD 22C Organisational structure Inside Back Cover
Financial and other information-
FRD 10 Disclosure Index 60
FRD 11 Disclosure of Ex Gratia Payments 56
FRD 15B Executive Officers Disclosure 59
FRD 21B Responsible person and executive officer disclosures 59
FRD 22C Application and operation of Freedom of Information Act 1982 13
FRD 22C Compliance with building and maintenance provisions of Building Act 1993 13
FRD 22C Major changes or factors affecting performance 14 & 15
FRD 22C Occupational health and safety 12
FRD 22C Operational and budgetary objectives and performance against objectives 14 & 15
FRD 22C Significant changes in financial position during the year 14 & 15
FRD 22C Statement of availability of other information 12
FRD 22C Statement on National Competition Policy 13
FRD 22C Subsequent events 59
FRD 22C Summary of the financial results for the year 14 & 15
FRD 22C Workforce Data Disclosures including a statement on the application of employment
and conduct principles12
FRD 25 Victorian Industry Participation Policy disclosures 13
SD 4.2 (j) Sign Off requirements 13
SD 3.4.13 Attestation on Data Integrity 11
SD 4.5.5.1 Attestation of Data Insurance 11
SD 4.5.5 Attestation on Compliance with Australian/New Zealand Risk Management Standard 13
Financial Statements
Financial statements required under Part 7 of the FMA
SD 4.2(b) Comprehensive Operating Statement 19
SD 4.2(b) Balance Sheet 20
SD 4.2(a) Statement of Changes in Equity 21
SD 4.2(b) Cash Flow Statement 22
Other requirements under Standing Directions 4.2
SD 4.2(a) Compliance with Australian accounting standards and other authoritative
pronouncements14 & 24
SD 4.2(c) Accountable Officer’s declaration 20
SD 4.2(c) Compliance with Ministerial Directions 24
SD 4.2(d) Rounding of amounts 26
Legislation
Freedom of Information Act 1982 Page 13
Victorian Industry Participation Policy Act 2003 Page 13
Building Act 1993 Page 13
Financial Management Act 1994 Page 14
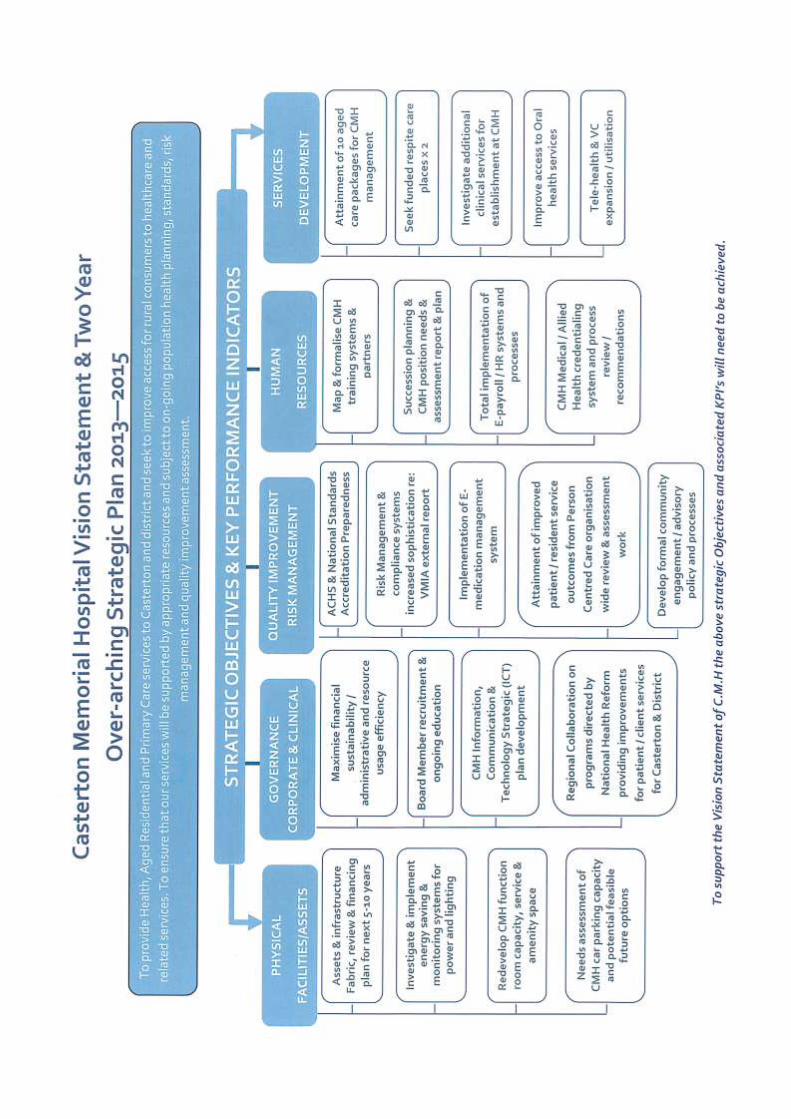

Casterton Memorial Hospital
63 - 69 Russell Street, Casterton, Victoria 3311
Phone: (03) 555 42 555 Fax: (3) 55 811 051 Email: [email protected]
www.castertonmemorialhospital.com.au


![[105th Congress Public Law 206] [[Page 112 STAT. 685 ......[105th Congress Public Law 206] [From the U.S. Government Printing Office] [[Page 112 STAT. 685]] Public Law 105-206 105th](https://img.pdfslide.net/doc/110x75/60ac2973aced9c6eb744dfa2/105th-congress-public-law-206-page-112-stat-685-105th-congress-public.jpg)