Embed Size (px)
Citation preview

Contents
3.10.0: Guide 3.10.1: Activity
© ISET-International, 2012
TRAINING.I-S-E-T.ORG
SERIES 3: Building Resilience
1/213.0 3.1 3.2 3.3 3.4 3.5 3.6 3.7 3.8 3.9 3.10 QUANTITATIVE CBA 3.11 3.12 3.13 3.14 3.15 3.16
Guide 3.10.0
This training set is designed for teams that need to
implement a quantitative cost-benefit analysis to evaluate
the cost-benefit of a proposed or implemented disaster risk
reduction, climate adaptation, or climate resilience project.
These materials discuss how to adapt a standard cost-benefit
analysis to address situations where disaster frequency,
magnitude, or intensity is changing due to climate change;
and provide you the information you will need to develop a
Terms Of Reference to hire the right the right team.
Quantitative Cost-Benefit Analysis
IN THIS SET YOU WILL:
9 Learn the steps associated with implementing a
quantitative cost-benefit analysis in a resilience
and adaptation planning context; and
9 Leave this training with materials that you can use
to develop a Terms Of Reference hiring the right
team for the job.

2/213.0 3.1 3.2 3.3 3.4 3.5 3.6 3.7 3.8 3.9 3.10 QUANTITATIVE CBA 3.11 3.12 3.13 3.14 3.15 3.16
OVERVIEW
A quantitative cost-benefit analysis undertaken for climate
change or disaster risk-related projects differs from a
conventional cost-benefit analysis by integrating future
climate risks and future damages associated with climate
events. In the case of adaptation and resilience planning,
a quantitative cost-benefit analysis may include, but is not
limited to:
• Using downscaled climate model results for a specific
location to assess potential future changes in climate
risk;
• Estimating damage costs that could occur as a result
of potential disasters, such as damage to houses that
could occur in future flood events;
• Assessing direct and indirect costs related to
proposed or implemented adaptation or resilience
solution; and,
• Conducting a sensitivity analysis of the cost-benefit
analysis results
TYPICAL TEAM MAKEUP
The first step in implementing a quantitative CBA is to
assemble a team to conduct the work. To address disaster
risk reduction (DRR) and/or climate adaptation, your team
will need to include an economist, a climate scientist, and
potentially, a hazard specialist. These team members will
provide key expertise and ensure the analysis is rigorous.
Economist: A quantitative CBA requires an economist with
experience in completing the following:
• Has conducted and understands the steps involved in
implementing a quantitative cost-benefit analysis
• Understands how to read and develop depth damage
curves
• Can use valuation techniques to determine market
and potential non-market values
• Familiarity with sourcing and identifying many types
of data
Climate Scientist: ISET has developed a cost-benefit
approach that integrates climate change projections into
the future cost-benefit assessment. However, this approach
requires that both the city planning team and the CBA
economist work with a climate scientist to identify the point
at which climate events become an issue for the proposed or
implemented resilience project.
• For city flooding, this could be a specific rainfall
intensity, such as rains of more than 30 mm/hour for
more than 3 hours;
• For energy production, this could be peak

3/213.0 3.1 3.2 3.3 3.4 3.5 3.6 3.7 3.8 3.9 3.10 QUANTITATIVE CBA 3.11 3.12 3.13 3.14 3.15 3.16
temperatures of over 40C, because generation
efficiency drops at high temperatures;
• For typhoon-related damages and disasters this
could be related to storm surge or wind speed;
• Etc.
However, your climate scientist will need specific information
and input from you in order to contribute effectively. You will
need to communicate what climate events are a problem and
work with the climate scientist to describe those in ways that
can be addressed with the information available from global
climate models (e.g. in terms of temperature, precipitation
intensity, or wind speed thresholds). Once you and your
climate scientist have identified these climate thresholds,
your climate scientist can gather the data needed to assess
how the intensity and frequency of these events may change
at specific times in the future.
Hazard Specialist: A hazard specialist will probably be
required for your CBA analysis, to work with the economist,
climate change scientist, and city planning team. The hazard
specialist can:
• Help identify climate thresholds that are a problem;
• Help translate those into climate parameters the
climate change scientist can work with; and,
• Help the economist determine how to value current
and potential future impacts.
If you can hire a hazard specialist with detailed local
community knowledge, they can help guide the economist in
understanding community values, and based on those values,
assign monetary values to non-monetary costs and benefits
associated with the resilience strategies.
QUANTITATIVE PROCESS REVIEW
Once you have assembled your CBA team, the team will
identify the key steps they plan to include in the quantitative
cost-benefit analysis. You should be aware of key elements of
a CBA related to adaptation/resilience planning and address
any missing areas in the proposed scope of work. Figure 1
illustrates the steps involved in determining the costs and
benefits associated with different disaster risk reduction
strategies. This framework can be applied within the context
of resilience and adaptation planning.

4/213.0 3.1 3.2 3.3 3.4 3.5 3.6 3.7 3.8 3.9 3.10 QUANTITATIVE CBA 3.11 3.12 3.13 3.14 3.15 3.16
FIGURE 3.10.1: QUANTITATIVE PROCESS REVIEW
This process is similar to a typical cost-benefit analysis with the addition of a few key elements, primarily in Steps 2 and 3.
Step 1 Data Collection, the CBA team gathers the data needed to support the CBA analysis. It is helpful to
categorize this data by hazard, exposure, fragility and impacts (explained in more detail below).
Step 2 Hazard and Vulnerability Analyses, the CBA team builds future hazard and vulnerability scenarios and
uses the collected data to assess the damages or impacts that could occur under those scenarios. This
entire step is unique to DRR/climate change resilience CBA, and entails making a number of assumptions
about future systems, institutional constraints, and economic and governance conditions. The planning
team should either be involved in this process, or at least require that these assumptions are clearly
documented.
Step 3 Risk Analysis takes the future scenarios and builds loss-frequency curves for each scenario. Loss-
frequency curves illustrate the recurrence interval of an event (on the x-axis) vs. the damage costs of that
event (on the y-axis). So, for example, a loss-frequency curve will show the expected cost of annual flood
events, 1-in-5 year flood events, 1-in-10 year events, etc. Separate loss-frequency curves are usually
developed for the business-as-usual scenario (i.e. with no interventions or risk reduction strategies) and for
each risk reduction strategy. By comparing damage costs between two curves, the reduction in damages
achieved by the risk reduction strategies are readily apparent. This step differs from a traditional CBA,
where benefits are calculated as the overall financial or social benefits of implementing the project. In
this DRR/climate resilience approach, benefits are the reduction in damages — the losses that would have
occurred, but because of implementation of a resilience strategy, are avoided.
Step 4 Determining the net benefits the costs of implementing each of the strategies are compared against
the avoided losses (benefits) associated with that strategy. The result is the economic efficiency of each
strategy.
Step 4
Step 1
Step 3
Step 2
5/213.0 3.1 3.2 3.3 3.4 3.5 3.6 3.7 3.8 3.9 3.10 QUANTITATIVE CBA 3.11 3.12 3.13 3.14 3.15 3.16
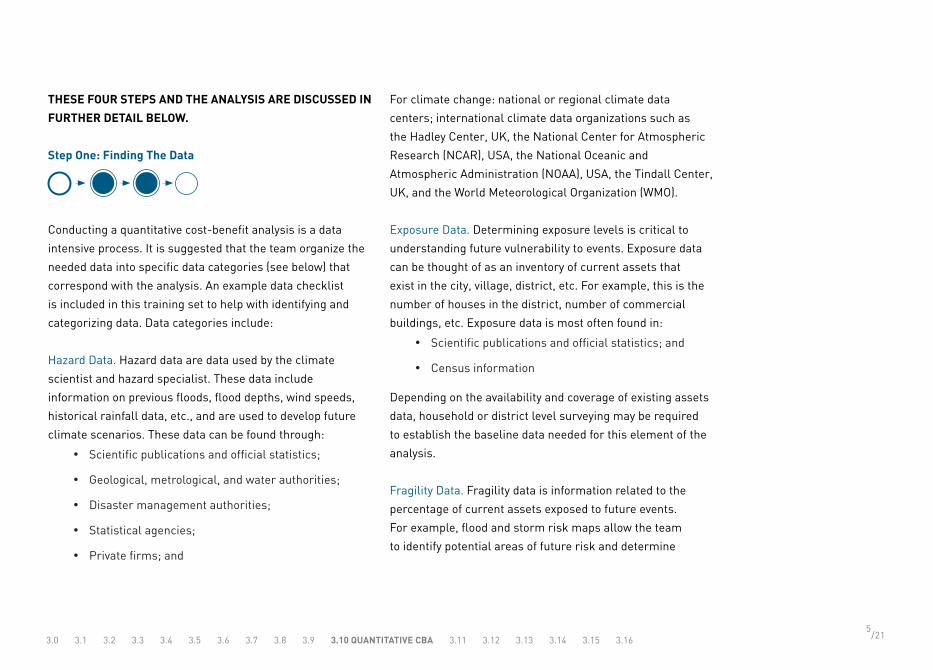
THESE FOUR STEPS AND THE ANALYSIS ARE DISCUSSED IN
FURTHER DETAIL BELOW.
Step One: Finding The Data
Conducting a quantitative cost-benefit analysis is a data
intensive process. It is suggested that the team organize the
needed data into specific data categories (see below) that
correspond with the analysis. An example data checklist
is included in this training set to help with identifying and
categorizing data. Data categories include:
Hazard Data. Hazard data are data used by the climate
scientist and hazard specialist. These data include
information on previous floods, flood depths, wind speeds,
historical rainfall data, etc., and are used to develop future
climate scenarios. These data can be found through:
• Scientific publications and official statistics;
• Geological, metrological, and water authorities;
• Disaster management authorities;
• Statistical agencies;
• Private firms; and
For climate change: national or regional climate data
centers; international climate data organizations such as
the Hadley Center, UK, the National Center for Atmospheric
Research (NCAR), USA, the National Oceanic and
Atmospheric Administration (NOAA), USA, the Tindall Center,
UK, and the World Meteorological Organization (WMO).
Exposure Data. Determining exposure levels is critical to
understanding future vulnerability to events. Exposure data
can be thought of as an inventory of current assets that
exist in the city, village, district, etc. For example, this is the
number of houses in the district, number of commercial
buildings, etc. Exposure data is most often found in:
• Scientific publications and official statistics; and
• Census information
Depending on the availability and coverage of existing assets
data, household or district level surveying may be required
to establish the baseline data needed for this element of the
analysis.
Fragility Data. Fragility data is information related to the
percentage of current assets exposed to future events.
For example, flood and storm risk maps allow the team
to identify potential areas of future risk and determine

6/213.0 3.1 3.2 3.3 3.4 3.5 3.6 3.7 3.8 3.9 3.10 QUANTITATIVE CBA 3.11 3.12 3.13 3.14 3.15 3.16
future exposure potential. This can be used to determine
the fragility of certain geographic areas of types of assets.
Fragility information is generated using:
• Flood and storm risk maps;
• Topographical maps that show locational
vulnerabilities; and,
• GIS analysis.
Damages/Impacts Data. This is data about past damages
that occurred due to past events. For example, the lives lost,
livestock losses, assets lost and infrastructure damages
caused by a past flooding event. Past damage event data is
used in Step 2 to project into the future and determine future
event damages. Past event damage/impact information may
be found in:
• Post-disaster publications;
• Disaster management authorities;
• Statistical agencies; and
• Private firms, such as insurance agencies.
Once all available, relevant data is collected, the team moves
into the next phase, the hazard and vulnerability analyses.
STEP TWO: HAZARD AND VULNERABILITY ANALYSES
Series 2 of these training materials introduced vulnerability
assessments. The vulnerability and hazard analyses used in
a quantitative CBA can build off this previous work, but in
general are more focused and quantitative in nature.
First, the CBA team will use the data gathered in Step 1 to
develop informed assumptions about both future climate
event frequency and future damages due to those events.
They then conduct two separate analyses: first, a hazard
analysis, and second, a vulnerability analysis. For the
vulnerability analysis, the team has the option to choose
either an exposure and fragility approach or an historical
impacts approach. The selected vulnerability approach will
likely depend on the CBA team, their existing capacities and
toolsets, and the available data.
Hazard Analysis: Future climate hazard data is obtained from
climate change models. The models identify the probability
of occurrence of various climate events. If you know at what
point a climate event becomes a hazard, climate scientists
can tell you how the frequency and intensity of that event
may change in the future. However, to do this the climate
scientist will need both a fairly long record of historical
7/213.0 3.1 3.2 3.3 3.4 3.5 3.6 3.7 3.8 3.9 3.10 QUANTITATIVE CBA 3.11 3.12 3.13 3.14 3.15 3.16
weather data (e.g. 20 or more years of daily temperature and
rainfall data) and past hazard events data (ideally hourly data;
could include temperature, precipitation, river flow, wind
speed and/or sea level data depending on the hazard being
analyzed) to develop scenarios for the future. If this data is
not available, you may not be able to do this type of analysis;
a participatory cost-benefit analysis may be far more
successful if the required data is lacking (see Module 3.9).
Vulnerability Analysis: Within the cost-benefit analysis
framework, vulnerability is associated with damages and
losses that occur during future events. Determining future
vulnerability is not an easy task and depends on the data
available. ISET International utilizes two types of approaches
to identify vulnerability of future assets. Your CBA team
should select one of these for your analysis.
1. Exposure & Fragility Analysis Approach. Exposure
and fragility can be used to determine future
damages by identifying current stocks of assets,
determining the fragility of those assets, and making
assumptions that relate to future exposure and future
fragility of those assets.
• Exposure. Exposure is whether or not a system
experiences impacts from a particular climate
event. For a CBA, assessing exposure involves
taking an inventory of current assets, etc. that
would or could be impacted by climate events if
they occurred.
• Fragility. Fragility relates to the damages
incurred in areas that are exposed. For a CBA,
fragility is expressed as a percentage of exposed
assets. For example, the percentage of assets
that would incur damages during a flood where
floodwaters reach a depth of 1 meter.
2. Impacts Based Approach. An impact-based approach
differs from the exposure and fragility approach by
collecting information on past events and identifying
the damages that occurred during those historical
events. This information is used to define a set
of points along a curve related to the intensity of
historical events. The curve is then used to determine
future event damages associated with future event
intensities. It is important to note that this process
needs to take into consideration future changes in
exposure and vulnerability.
The impact-based approach takes a more historical look
at events, while the exposure and fragility approach looks
at current assets and current fragility. Both approaches
use a set of assumptions to project into the future, but the
assumptions are a bit different for each one. And, the data

8/213.0 3.1 3.2 3.3 3.4 3.5 3.6 3.7 3.8 3.9 3.10 QUANTITATIVE CBA 3.11 3.12 3.13 3.14 3.15 3.16
needed for the two approaches can differ substantially.
For example, in an area lacking good data on the damages
incurred during past hazards, the exposure and fragility
approach is likely to be far more successful. When hiring your
team, discuss with them how they might approach the hazard
and vulnerability analyses portion of the quantitative CBA and
make sure there is data to support their analysis and that you
are comfortable with and understand their planned approach.
STEP THREE: RISK ANALYSIS
Identification of potential resilience/adaptation strategies
was reviewed in Sets 3.2 through 3.4. As part of evaluating
and prioritizing those potential strategies, you will want to
assess their benefits. As stated earlier, the benefits in a
climate change or DRR CBA are the avoided losses. Avoided
losses are those losses (direct and indirect) that would be
incurred under a business-as-usual scenario but would
not be incurred if the risk reduction strategy were to be
implemented. To determine those avoided losses (benefits) it
is beneficial to develop loss frequency curves (figure 2 below).
A loss frequency curve is created by plotting the recurrence
frequency of an event (e.g. a 1-in-10 year flood event) with the
damages sustained during that event. By plotting multiple
events at multiple frequencies, you create a curve that can
be used to determine the projected losses for events that
haven’t occurred. The loss frequency curves use the hazard
and vulnerability analyses from Step 2 to determine potential
losses and potential events.
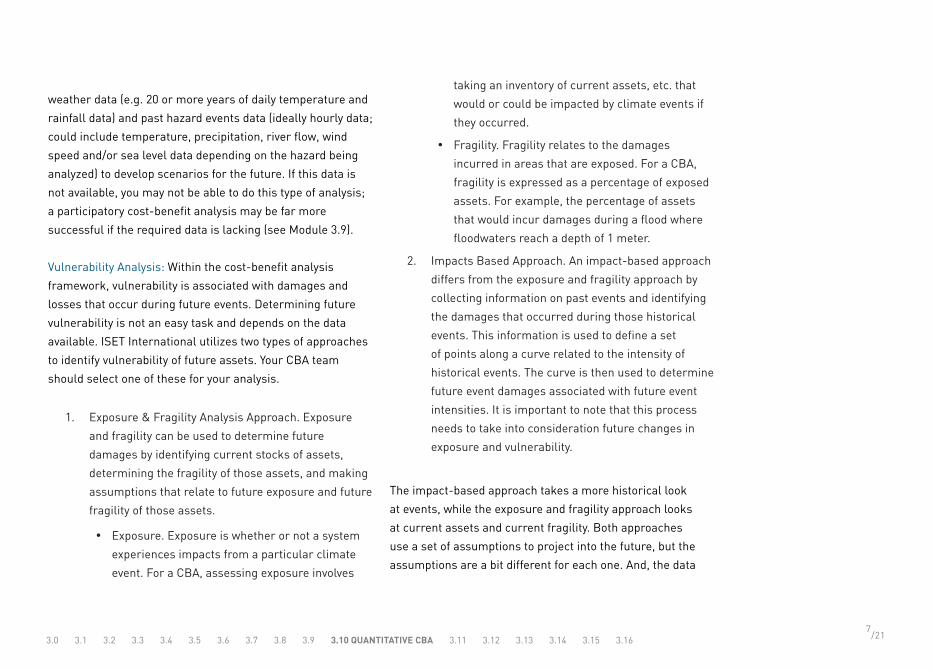
Figure 2 illustrates a set of loss-frequency curves for a flood
project evaluated by JICA. The y-axis shows estimated losses
(in millions of Pakistani Rupees) and the x-axis shows the
cumulative frequency of flooding. Cumulative frequency is the
percentage chance that an event will happen in a given year;
for example, 20% translates to a 1-in-5-year event.
In Figure 2, baseline conditions are shown in dark blue,
and loss-frequency if various resilience strategies are
implemented are shown in green, light blue and red. As
can be seen, losses are lower when resilience strategies
are implemented. When both retention pond and channel
improvements are made (red line), there are no losses at
the higher frequency events. Losses are only incurred at
frequencies of 0.1 and lower (1-in-10-year events or rarer).
Under current conditions, there are losses at frequencies
of 0.2 (1-in-5-year events), and higher cost losses at all
frequencies.
9/213.0 3.1 3.2 3.3 3.4 3.5 3.6 3.7 3.8 3.9 3.10 QUANTITATIVE CBA 3.11 3.12 3.13 3.14 3.15 3.16
FIGURE 2: JICA OPTIONS FOR THE LAI RIVER
Loss frequency curves allow us to evaluate the relative
benefits of alternatives against each other and against the
business-as-usual scenario. We analyze the overall costs and
benefits of the risk reduction strategy in Step 4. This is where
we will look at the lifetime of the project and assess the
benefits and costs that are expected to accrue each year.
STEP FOUR: DETERMINE NET BENEFITS OF EACH RISK
REDUCTION STRATEGY
To determine net benefits, you subtract the total benefits
(avoided losses) identified in Step 3 from the total costs
of implementation. The costs are usually the cost of
implementing the project (capital costs) as well as ongoing
operations and maintenance. Projects (such as the retention
pond in Figure 2) may not be completed within the first
year of implementation, so benefits may not start accruing
immediately.
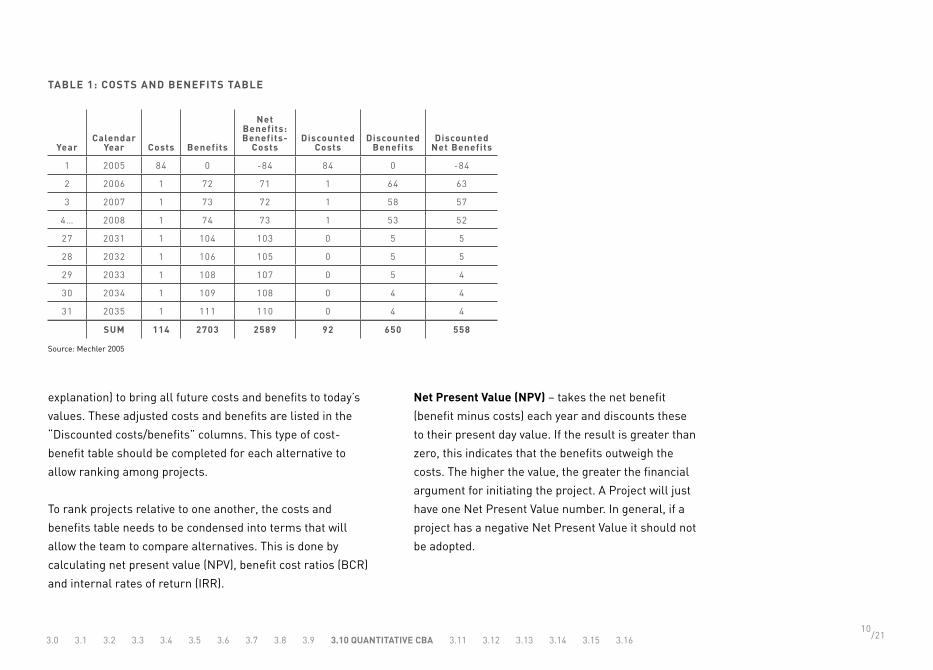
Table 1 shows the expected benefits and costs of the
retention pond strategy included in Figure 2. You can see that
in the first year significant costs are incurred (construction
of the pond) but no benefits are realized. Benefits start to
accrue in year two, and costs from year two on are much
smaller, reflecting on-going maintenance only. The table
also employs the use of discounting (see side box for more
Source: Risk to Resilience Study Team 2009
10/213.0 3.1 3.2 3.3 3.4 3.5 3.6 3.7 3.8 3.9 3.10 QUANTITATIVE CBA 3.11 3.12 3.13 3.14 3.15 3.16
explanation) to bring all future costs and benefits to today’s
values. These adjusted costs and benefits are listed in the
“Discounted costs/benefits” columns. This type of cost-
benefit table should be completed for each alternative to
allow ranking among projects.
To rank projects relative to one another, the costs and
benefits table needs to be condensed into terms that will
allow the team to compare alternatives. This is done by
calculating net present value (NPV), benefit cost ratios (BCR)
and internal rates of return (IRR).
Net Present Value (NPV) – takes the net benefit
(benefit minus costs) each year and discounts these
to their present day value. If the result is greater than
zero, this indicates that the benefits outweigh the
costs. The higher the value, the greater the financial
argument for initiating the project. A Project will just
have one Net Present Value number. In general, if a
project has a negative Net Present Value it should not
be adopted.
TABLE 1: COSTS AND BENEFITS TABLE
YearCalendar
Year Costs Benefits
Net Benefits: Benefits-
CostsDiscounted
CostsDiscounted
Benefits Discounted
Net Benefits
1 2005 84 0 -84 84 0 -84
2 2006 1 72 71 1 64 63
3 2007 1 73 72 1 58 57
4… 2008 1 74 73 1 53 52
27 2031 1 104 103 0 5 5
28 2032 1 106 105 0 5 5
29 2033 1 108 107 0 5 4
30 2034 1 109 108 0 4 4
31 2035 1 111 110 0 4 4
SUM 114 2703 2589 92 650 558
Source: Mechler 2005

11/213.0 3.1 3.2 3.3 3.4 3.5 3.6 3.7 3.8 3.9 3.10 QUANTITATIVE CBA 3.11 3.12 3.13 3.14 3.15 3.16
Benefit-Cost Ratio (BCR) – indicates how much benefit
will accrue for every $1 of cost. A ratio greater than 1
indicates that the project is worth investing in from a
financial perspective, anything less than one indicates a
negative return. Projects can also be ranked by BCR.
Internal Rate of Return (IRR) – the rate of growth
participating parties require to make the investment.
It is often used when determining economic efficiency,
and is expressed as a percentage.
If we take the Lai River Case from Figure 2, we saw that three
strategies were investigated: the use of a retention pond,
the construction of additional channel improvements, and
the combination of both the alternatives. The loss-frequency
curve indicates that both alternatives reduce damages, and
the combination of alternatives reduces damages more
than either alone. However, Figure 2 does not indicate the
implementation costs. To ranks the alternatives, we need
additional information. We need to look at the NPVs and
BCRs to determine which strategy to adopt. Figure 3 provides
the associated net present value and benefit cost ratio each
of the alternatives alone and the two combined, along with
additional options not shown in Figure 2.
DISCOUNT RATE
To interpret CBA results you must pay attention to the discount rates that are used to put all
income (benefit) and cost streams in the project life as a single number in the present. The
discount rate allows us to compare benefits (or costs) in the future with benefits (or costs) in
the present. The discount rate is basically the return one might expect if the same money was
invested in an alternative project or put in a bank. For example, if we put money in a bank with
an interest rate of say 10% per annum, a $100 investment will become $110 in the next year. So
if we have choice of getting a benefit of $100 this year it is better than receiving $100 in the next
year because we have the ability to generate 10% income from it in the meantime. Therefore,
we can say that if were to get a benefit of $110 in the next year it would be worth $100 in the
present, if we applied a discount rate of 10% per annum to it.
However, there are many ways to calculate discount rates and many donors and/or countries
use different discount rates to accept results of Cost-Benefit Analysis. In our previous example,
we use a bank interest rate as the discount rate. However, it may be more appropriate to use a
social discount rate because disaster risk reduction is not necessarily a commercial investment
and it creates public benefits. Social discount rates represents the returns (in percentage per
annum) to other similar interventions in say public health or education, and represent the
current value of income streams vs. foregoing public good related investment.
The discount rate can strongly influence the outcome of a CBA. A large or very small discount
rate can tilt the balance between costs and benefits by putting different values on future costs
and benefits. One way to overcome this is to preform sensitivity analysis on discount rate. In a
sensitivity analysis, your CBA analyst will calculate results using a range of different discount
rates. You can then clearly see how discount rate affects results.

12/213.0 3.1 3.2 3.3 3.4 3.5 3.6 3.7 3.8 3.9 3.10 QUANTITATIVE CBA 3.11 3.12 3.13 3.14 3.15 3.16
Figure 3 indicates that the expressway and relocation
strategies for flood control (not included in Figure 2) have
very high net present values. The rule of thumb for net
present values is to consider any project that has a positive
net present value, and to rank projects from largest to
smallest NPV.
If we were to use NPV alone to select projects, the
expressway/channel would be the top priority project.
However, most communities are resource (money)
constrained and want to ensure that they are getting as much
benefit as possible out of their money. The benefit-cost ratio
indicates the projects that yield the greatest benefit for their
cost. Projects with benefit-cost ratios greater than one are
generally retained for further consideration, and the higher
the benefit-cost ratio, the greater the benefit accrued for the
FIGURE 3: LAI RIVER CASE FINAL RESULTS
Strategy/Intervention Net Present Value of Investment (PKR mill.) Benefit-Cost Ratio
Expressway/channel 24,800 1.88
JICA options (both) 3,593 9.25
Retention Pond 2,234 8.55
River Improvement (additional channel improvements)
1,359 25
Early Warning 412 0.96
Relocation 15,321 1.34
Source: Adapted From Risk to Resilience Study Team 2009
money spent. Figure 3 indicates that both the expressway/
channel and relocation alternatives have benefit-cost ratios
greater than one, but their benefit-cost ratios are relatively
low in comparison to the other strategies. In the case of the
Lai River, the river improvement strategy yields the highest
benefits per dollar spent (BCR=25). However, because in
this case river improvements can be done relatively cheaply
and only in specific areas, the net present value of the river
improvement strategy is actually quite low. I.e., the overall
cost is low, the relative reduction in damages for the cost is
high, but the total reduction in damages is only moderate. In
this type of situation, decision-makers need to weigh overall
goals of strategy implementation along with the NPV or BCR
of individual strategies in prioritizing and ranking strategies
for implementation.

13/213.0 3.1 3.2 3.3 3.4 3.5 3.6 3.7 3.8 3.9 3.10 QUANTITATIVE CBA 3.11 3.12 3.13 3.14 3.15 3.16
TO THINK ABOUT
Cost-benefit analysis is most useful while comparing options. It will be more effective to comparatively assess two or more risk reduction options than to analyze just one preferred option.
Before starting a quantitative CBA assessment, clarify the objectives with the project stakeholders – why are you doing this CBA, what information do you need to get from the analysis, and how will you use that information? At a very early stage of the analysis, it is critical to achieve consensus among the interested and involved parties on the scope of the CBA to be undertaken (Mechler 2005).
Once objectives have been clarified, identify the information and data needed to address those objectives. If the required data isn’t available, consider using a participatory cost-benefit analysis approach instead.
Distributional benefits – who will benefit, how they will benefit, who will not benefit, who will be harmed, and how they will be harmed – are not addressed by cost-benefit analysis. It is important, if you are going to use a cost-benefit analysis in evaluating a project, to also evaluate the social and environmental impacts of the project. This is addressed in Modules 3.11 and 3.12.
When controversial projects (such a hydroelectric dam) appear, CBA cannot be used to effectively resolve value-based arguments.
CBA should be used with other decision-making tools to ensure that a broad range of opinions is represented.
In summary, it is critical to assemble the right team when
conducting a climate change cost-benefit analysis. If well
implemented, the quantitative process can significantly
contribute to understanding the overall benefits of certain
adaptation or risk resilience strategies. In general though,
quantitative cost-benefit analysis, both traditional and for
DRR/climate change, is expensive, time consuming, and data
intensive. A participatory CBA should be conducted prior to a
quantitative CBA, and quantitative CBA should only be used if
there is clear demand for the specific output it will produce.
If it is clear a quantitative CBA is required, the CBA team
should be carefully selected, should have prior expertise with
traditional CBA approaches, and should be excited about the
opportunity to incorporate future risk into their analysis.

14/213.0 3.1 3.2 3.3 3.4 3.5 3.6 3.7 3.8 3.9 3.10 QUANTITATIVE CBA 3.11 3.12 3.13 3.14 3.15 3.16
EXAMPLE DATA FRAMEWORK CHECKLIST
1: HAZARD/METEOROLOGICAL DATA
Type of dataDo we need this data? Yes/No
Who has the data?What type of format is the data in?
Additional Notes (i.e. data must be purchased, doesn’t exist.)
Flood Depths and Duration
River Flow or Stage
Wind Speed
Rainfall
Temperature
Drought Durations
2: FRAGILITY
Flood & Storm Risk Maps
Topographical Maps
3: DAMAGES/IMPACTS
Overview of events and year of occurrence
Total deaths and injuries associated with each event
Total residential damages (assets lost, working days lost, school days lost)
Total Business & industry damages (total business disruption costs, total business assets lost)
Total Public damages (roads, water system, public buildings)
1: This is data that will be collected and used by the climate scientist. Any data relating to past events would be very beneficial.
2: This would be any information that could be provided to the team related to the fragility of the city to future events. Such as areas for future development areas slated to be in flood plains.
3: Data related to past events and those damages associated. This can be deaths, injuries, residential, commercial, public

15/213.0 3.1 3.2 3.3 3.4 3.5 3.6 3.7 3.8 3.9 3.10 QUANTITATIVE CBA 3.11 3.12 3.13 3.14 3.15 3.16
4: EXPOSURE: VALUATION OF POTENTIALLY EXPOSED ASSETS
Type of data Do we need this data? Yes/No Who has the data? What type of format
is the data in?
Additional Notes (i.e. data must be purchased, doesn’t exist.)
Exposure: Valuation of Potentially Exposed Assets
Residential (current value of typical household assets. This might mean livestock, tv, radio, others).
Commercial property (current value of assets related to current businesses and industries –formal and informal.)
Public Assets (current inventory of public assets. This is usually expressed in a monetary term for value of the assets. For example, the cost to build, maintenance, staffing, upgrade, etc.):
Roads
Water and sewage
School Buildings
Health units, outlets, centers etc.
Electrical Utilities and Distribution Network
Livestock and poultry
Vegetation, farmland and crops
Transport (rickshaw, pickup, trucks, donkey carts, etc.)
4: Exposure of assets and indoor moveables in district, city, and state, etc.

16/213.0 3.1 3.2 3.3 3.4 3.5 3.6 3.7 3.8 3.9 3.10 QUANTITATIVE CBA 3.11 3.12 3.13 3.14 3.15 3.16
ABOUT THE AUTHOR
FAWAD KHAN, Senior Economist, ISET-Pakistan.
Mr. Fawad Khan, senior economist based in Islamabad, has
been collaborating with ISET-Internatinoal on a number
of projects since 2006. Mr. Fawad Khan has extensive
experience working on the economics of major policy
and implementation projects from his period as a staff
member with the World Bank. Along with partners at
IIASA he has also played a lead role in the methodology design and implementation
of ISET-International’s prior research on the costs and benefits of climate related
disaster risk reduction interventions for the Risk to Resilience project. Formalities to
establish ISET-Pakistan as an independent, sister organization to ISET, are ongoing.
ISET’s office in Islamabad can be found on the very preliminary website, still under
construction: www.isetpk.org
CONTRIBUTING AUTHOR
KATE HAWLEY, Research Associate.
Ms. Hawley received her Master’s in Sustainable
International Development from Brandeis University.
During her time at Brandeis, she worked with the Asian
Development Bank (ADB) supporting Nepal’s five-year
climate change strategy as well as undergoing research
on the costs and benefits of community climate change adaptation strategies in
Nepal. Her project experience spans a number of national and international agencies
including the National Park Service, US Department of Energy, and Energy Trust
of Oregon. Her background is in business and economics and she received her
bachelor’s degree from Cornell University.
This document is an output from a project funded by the UK Department for International
Development (DFID) and the Netherlands Directorate-General for International
Cooperation (DGIS) for the benefit of developing countries. However, the views expressed
and information contained in it are not necessarily those of or endorsed by DFID, DGIS or
the entities managing the delivery of the Climate and Development Knowledge Network*,
which can accept no responsibility or liability for such views, completeness or accuracy of
the information or for any reliance placed on them.


![Can Quantitative Finance Benefit from IoT?sameekhan.org/pub/Z_K_2017_SEC.pdfQuantStart offers Internet-based educational resources for learning algorithmic trading [22]. Quantopian](https://img.pdfslide.net/doc/110x75/5e35e78fbcd46b05111dbb7f/can-quantitative-finance-benefit-from-iot-quantstart-offers-internet-based-educational.jpg)