Embed Size (px)
Citation preview
A Review of South Africa’s Trade and Investment Relationship with BRIC
10TH BRICS SUMMIT

3
4
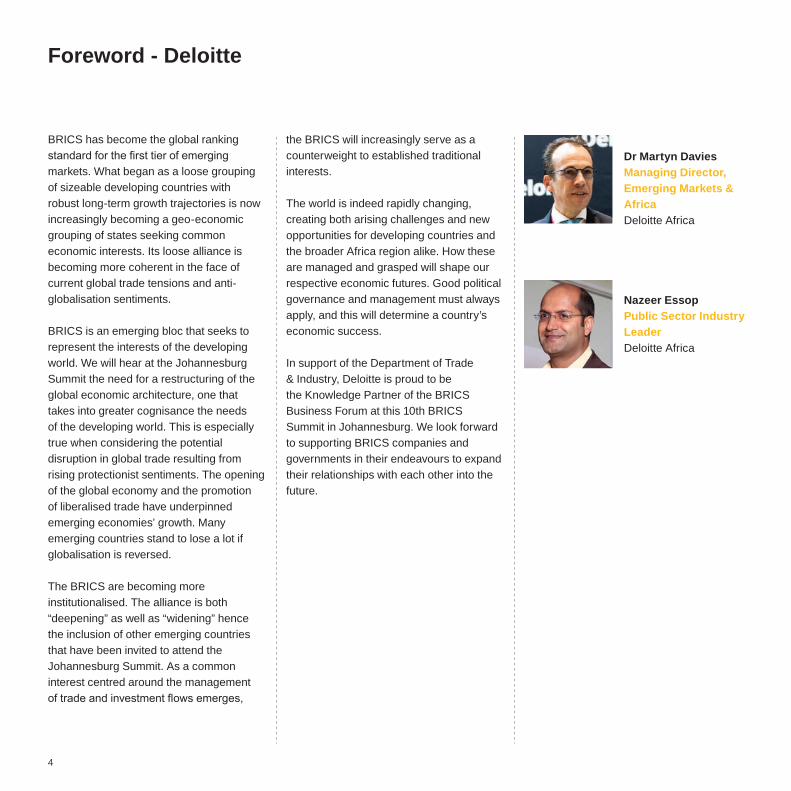
Foreword - Deloitte
BRICS has become the global ranking standard for the first tier of emerging markets. What began as a loose grouping of sizeable developing countries with robust long-term growth trajectories is now increasingly becoming a geo-economic grouping of states seeking common economic interests. Its loose alliance is becoming more coherent in the face of current global trade tensions and anti-globalisation sentiments.
BRICS is an emerging bloc that seeks to represent the interests of the developing world. We will hear at the Johannesburg Summit the need for a restructuring of the global economic architecture, one that takes into greater cognisance the needs of the developing world. This is especially true when considering the potential disruption in global trade resulting from rising protectionist sentiments. The opening of the global economy and the promotion of liberalised trade have underpinned emerging economies’ growth. Many emerging countries stand to lose a lot if globalisation is reversed.
The BRICS are becoming more institutionalised. The alliance is both “deepening” as well as “widening” hence the inclusion of other emerging countries that have been invited to attend the Johannesburg Summit. As a common interest centred around the management of trade and investment flows emerges,
the BRICS will increasingly serve as a counterweight to established traditional interests.
The world is indeed rapidly changing, creating both arising challenges and new opportunities for developing countries and the broader Africa region alike. How these are managed and grasped will shape our respective economic futures. Good political governance and management must always apply, and this will determine a country’s economic success.
In support of the Department of Trade & Industry, Deloitte is proud to be the Knowledge Partner of the BRICS Business Forum at this 10th BRICS Summit in Johannesburg. We look forward to supporting BRICS companies and governments in their endeavours to expand their relationships with each other into the future.
Dr Martyn Davies Managing Director, Emerging Markets & Africa Deloitte Africa
Nazeer EssopPublic Sector Industry LeaderDeloitte Africa
Key Highlights of South Africa’s Trade and Investment Relationship with BRIC Since 2001
Key Agreements Supporting Trade and Investment Between South Africa and BRIC
Trade Developments
Investment Developments
Key Takeouts on South Africa’s Trade and Investment Relations with BRIC Since 2001
Doing Business in BRICS
Table of Contents
07
06
18
32
33
08
6
• Formation of the New Development Bank (NDB): In late March 2013, during the 5th BRICS summit in Durban, South Africa, the BRICS member countries agreed to create a global financial insti-tution which they intended to rival the western-dominated IMF and World Bank. After the summit, the BRICS stated that they planned to finalise the arrangements for this New Development Bank by 2014. Then in 2014 at the BRICS 6th summit in Fortaleza, Brazil, the member states signed the long-anticipated document to create the US$100bn NDB (formerly known as the “BRICS Development Bank”) and a reserve currency pool (the BRICS Contingent Reserve Arrangement) worth over another US$100bn. The member states also signed documents on cooperation between BRICS export credit agencies and an agreement of coopera-tion on innovation. Finally the 7th BRICS summit in July 2015 marked the entry into force of the Agreement on the New Development Bank and in 2016 the bank opened its Headquarters in Shanghai.
• Formation of the BRICS Contingent Reserve Arrangement (CRA): The CRA was established in 2015 by the BRICS countries as a framework for providing protection against global liquidity pressures. The legal basis was formed by the Treaty for the Establishment of a
BRICS Contingent Reserve Arrangement, signed at Fortaleza, Brazil on 15 July 2014. With its inaugural meetings of the BRICS CRA Governing Council and Standing Committee, held on September 4, 2014, in Ankara, Turkey it entered into force upon ratification by all BRICS states, announced at the 7th BRICS summit in July 2015. Once the CRA was established, South Africa contributed US$5bn, China US$40bn and India, Brazil and Russia US$18bn each.
• South Africa receives 1st BRICS Development Bank loan: In the 1st year of operation (2016), the NDB Board of Directors approved seven projects in all member states of the bank involving financial assistance of over US$1.5bn. Out of this South Africa received US$180m as a sovereign guaranteed project loan to ESKOM for a renewable energy transmission project. On completion the project is expected to increase ESKOM’s capacity by 670 MW avoiding 1.3m tonnes in CO2 emissions per year.
• South Africa launches BRICS first regional office: In 2017 the NDB, committed US$1.5bn over 18 months towards South Africa’s development projects as it launched the groups first regional office in Sandton, Johannesburg. The regional office is known as the Africa Regional Centre and it is expected to be the face of the NDB on the continent and aid with identifying key infrastructure projects for the country.
• South Africa receives 2nd BRICS Development Bank loan: In May 2018 Finance Minister Nhlanhla Nene was elected as chairperson of the board of governors of the New Development Bank (NDB). Upon his election the board approved a US$200m loan to the South African government. The loan was approved to finance the Durban container terminal berth reconstruction project. The reconstruction project is aimed at helping the transport parastatal Transnet to enhance capacity of its port in Durban.
Key Highlights of South Africa’s Trade and Investment Rela-tionship with BRIC Since 2001
7
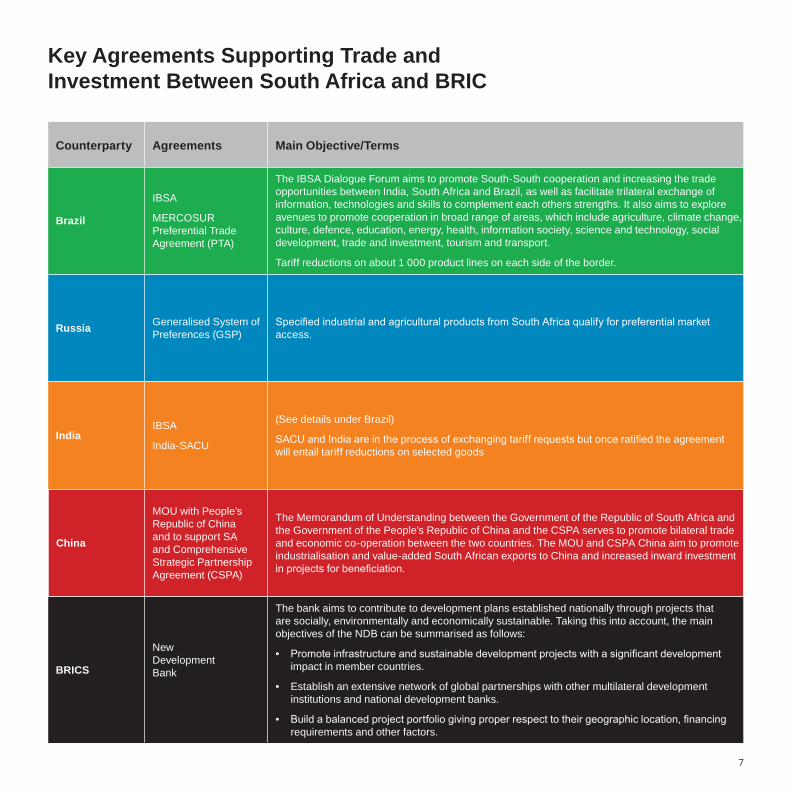
Key Agreements Supporting Trade and Investment Between South Africa and BRIC
Counterparty Agreements Main Objective/Terms
Brazil
IBSA
MERCOSUR Preferential Trade Agreement (PTA)
The IBSA Dialogue Forum aims to promote South-South cooperation and increasing the trade opportunities between India, South Africa and Brazil, as well as facilitate trilateral exchange of information, technologies and skills to complement each others strengths. It also aims to explore avenues to promote cooperation in broad range of areas, which include agriculture, climate change, culture, defence, education, energy, health, information society, science and technology, social development, trade and investment, tourism and transport.
Tariff reductions on about 1 000 product lines on each side of the border.
Russia Generalised System of Preferences (GSP)
Specified industrial and agricultural products from South Africa qualify for preferential market access.
IndiaIBSA
India-SACU
(See details under Brazil)
SACU and India are in the process of exchanging tariff requests but once ratified the agreement will entail tariff reductions on selected goods
China
MOU with People’s Republic of China and to support SA and Comprehensive Strategic Partnership Agreement (CSPA)
The Memorandum of Understanding between the Government of the Republic of South Africa and the Government of the People’s Republic of China and the CSPA serves to promote bilateral trade and economic co-operation between the two countries. The MOU and CSPA China aim to promote industrialisation and value-added South African exports to China and increased inward investment in projects for beneficiation.
BRICS
New Development Bank
The bank aims to contribute to development plans established nationally through projects that are socially, environmentally and economically sustainable. Taking this into account, the main objectives of the NDB can be summarised as follows:
• Promote infrastructure and sustainable development projects with a significant development impact in member countries.
• Establish an extensive network of global partnerships with other multilateral development institutions and national development banks.
• Build a balanced project portfolio giving proper respect to their geographic location, financing requirements and other factors.
Trade Developments
9
Trade Developments
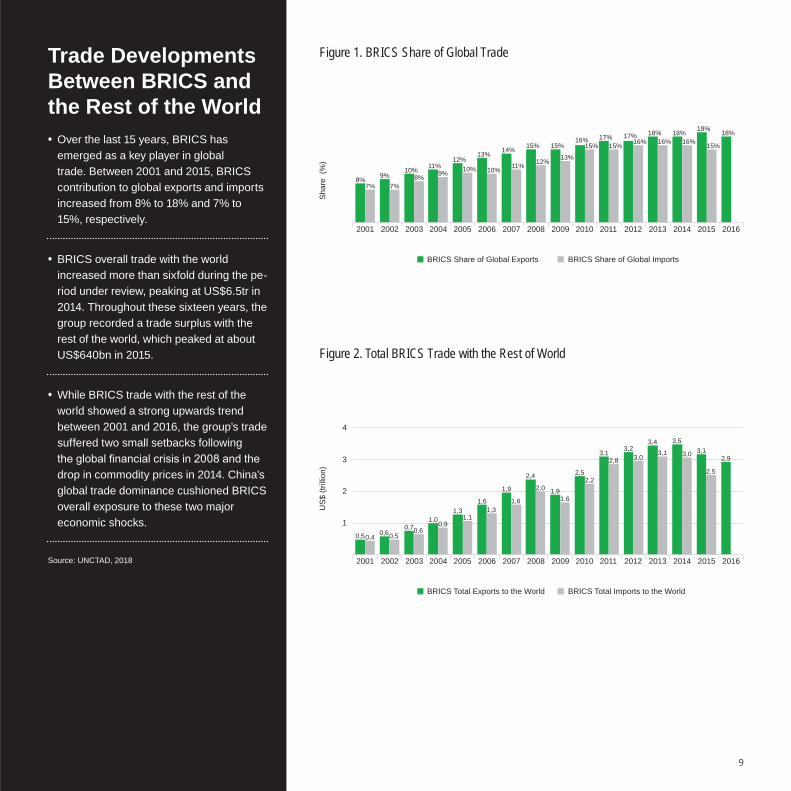
Trade Developments Between BRICS and the Rest of the World • Over the last 15 years, BRICS has emerged as a key player in global trade. Between 2001 and 2015, BRICS contribution to global exports and imports increased from 8% to 18% and 7% to 15%, respectively.
• BRICS overall trade with the world increased more than sixfold during the pe-riod under review, peaking at US$6.5tr in 2014. Throughout these sixteen years, the group recorded a trade surplus with the rest of the world, which peaked at about US$640bn in 2015.
• While BRICS trade with the rest of the world showed a strong upwards trend between 2001 and 2016, the group’s trade suffered two small setbacks following the global financial crisis in 2008 and the drop in commodity prices in 2014. China’s global trade dominance cushioned BRICS overall exposure to these two major economic shocks.
Figure 1. BRICS Share of Global Trade
Figure 2. Total BRICS Trade with the Rest of World
Sha
re (
%)
2001 2002 2003 2004 2005 2006 2007 2008 2009 2010 2011 2012 2013 2014 2015 2016
8%7%
BRICS Share of Global Exports BRICS Share of Global Imports
US
$ (tr
illio
n)
2001 2002 2003 2004 2005 2006 2007 2008 2009 2010 2011 2012 2013 2014 2015 2016
BRICS Total Exports to the World BRICS Total Imports to the World
1
2
3
4
Source: UNCTAD, 2018
7%9% 8%
10% 11%9%
12%10%
13%
10% 11%
14%
12%
15% 15%
13%
16%15% 15%
17% 17%16%
18%16% 16%
18%
15%
18%19%
0,50,4 0,50,6 0,60,7 0,91,0 1,11,3 1,3
1,6 1,6
1,9 2,0
2,4
1,61,9
2,22,5
2,83,1
3,03,2 3,1
3,4
3,0
3,5
2,5
3,12,9
10
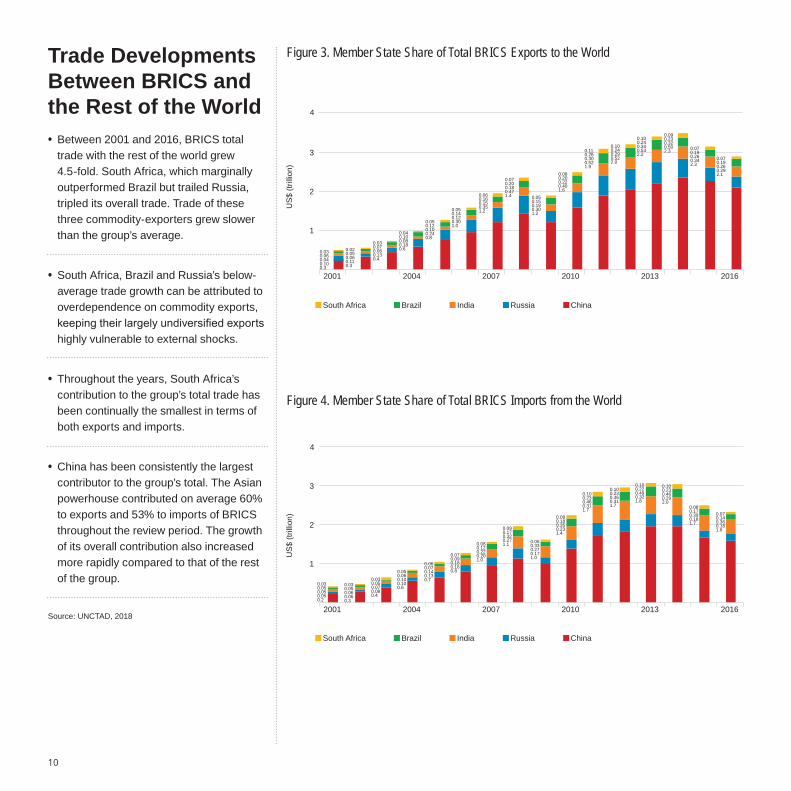
Trade Developments Between BRICS and the Rest of the World • Between 2001 and 2016, BRICS total trade with the rest of the world grew 4.5-fold. South Africa, which marginally outperformed Brazil but trailed Russia, tripled its overall trade. Trade of these three commodity-exporters grew slower than the group’s average.
• South Africa, Brazil and Russia’s below-average trade growth can be attributed to overdependence on commodity exports, keeping their largely undiversified exports highly vulnerable to external shocks.
• Throughout the years, South Africa’s contribution to the group’s total trade has been continually the smallest in terms of both exports and imports.
• China has been consistently the largest contributor to the group’s total. The Asian powerhouse contributed on average 60% to exports and 53% to imports of BRICS throughout the review period. The growth of its overall contribution also increased more rapidly compared to that of the rest of the group.
Figure 3. Member State Share of Total BRICS Exports to the World
Figure 4. Member State Share of Total BRICS Imports from the World
US
$ (tr
illio
n)2001 2004 2007 2010 2013 2016
US
$ (tr
illio
n)
Source: UNCTAD, 2018
1
2
3
4
1
2
3
4
2001 2004 2007 2010 2013 2016
0.30.100.040.06
0.30.110.06
0.020.130.060.070.03
0.03 0.050.4
0.180.080.100.04
0.6
0.240.100.120.05
0.8
0.300.120.140.05
1.0
0.350.150.160.06
1.2
0.470.180.200.07
1.4
0.300.180.150.05
1.2
0.400.220.200.08
1.6
0.520.300.260.11
1.9
0.520.290.240.10
2.0
0.530.340.240.10
2.20.500.320.230.09
2.3
0.340.260.190.07
2.30.290.260.190.07
2.1
0.20.050.050.050.03
0.30.060.06
0.030.05 0.08
0.070.050.03
0.4
0.100.100.060.05
0.6
0.130.140.070.06
0.7
0.160.180.090.07
0.8
0.200.220.120.08
1.0
0.270.320.170.09
1.1
0.170.270.330.06
1.0
0.230.350.180.08
1.4
0.310.460.230.10
1.7
0.310.460.230.10
1.7
0.320.490.220.10
1.8 0.290.460.230.10
2.0
0.180.390.170.08
1.7 0.180.360.140.07
1.6
South Africa Brazil India Russia China
South Africa Brazil India Russia China
11
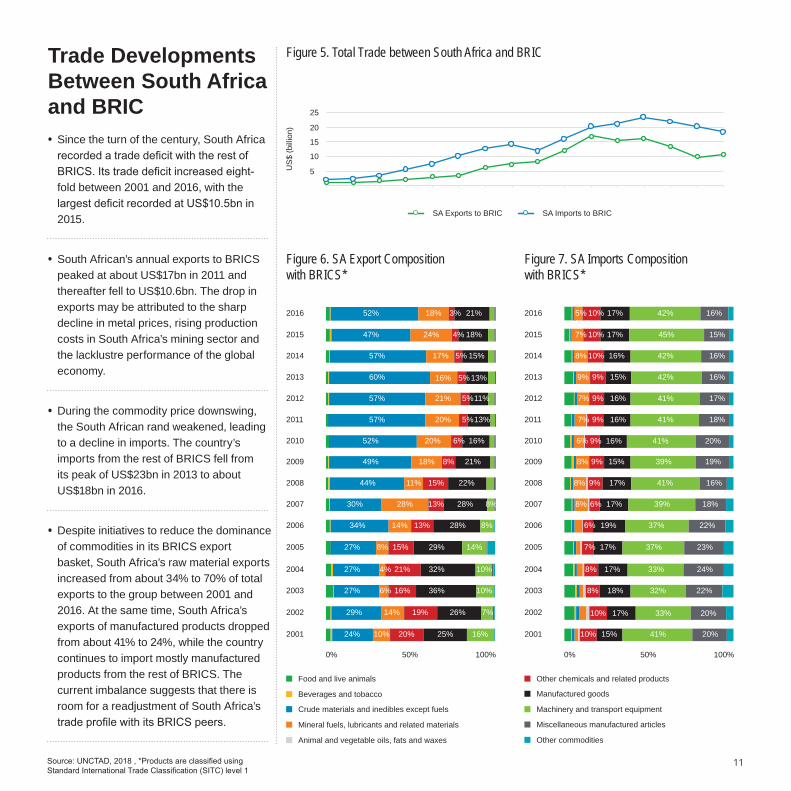
Trade Developments Between South Africa and BRIC • Since the turn of the century, South Africa recorded a trade deficit with the rest of BRICS. Its trade deficit increased eight-fold between 2001 and 2016, with the largest deficit recorded at US$10.5bn in 2015.
• South African’s annual exports to BRICS peaked at about US$17bn in 2011 and thereafter fell to US$10.6bn. The drop in exports may be attributed to the sharp decline in metal prices, rising production costs in South Africa’s mining sector and the lacklustre performance of the global economy.
• During the commodity price downswing, the South African rand weakened, leading to a decline in imports. The country’s imports from the rest of BRICS fell from its peak of US$23bn in 2013 to about US$18bn in 2016.
• Despite initiatives to reduce the dominance of commodities in its BRICS export basket, South Africa’s raw material exports increased from about 34% to 70% of total exports to the group between 2001 and 2016. At the same time, South Africa’s exports of manufactured products dropped from about 41% to 24%, while the country continues to import mostly manufactured products from the rest of BRICS. The current imbalance suggests that there is room for a readjustment of South Africa’s trade profile with its BRICS peers.
Figure 5. Total Trade between South Africa and BRIC
US
$ (b
illio
n)
Source: UNCTAD, 2018 , *Products are classified using Standard International Trade Classification (SITC) level 1
15
20
25
10
5
SA Exports to BRIC SA Imports to BRIC
Figure 6. SA Export Composition with BRICS*
Figure 7. SA Imports Composition with BRICS*
2016
2015
2014
2013
2012
2011
2010
2009
2008
2007
2006
2005
2004
2003
2002
2001
2016
2015
2014
2013
2012
2011
2010
2009
2008
2007
2006
2005
2004
2003
2002
2001
Food and live animals
Beverages and tobacco
Crude materials and inedibles except fuels
Mineral fuels, lubricants and related materials
Animal and vegetable oils, fats and waxes
Other chemicals and related products
Manufactured goods
Machinery and transport equipment
Miscellaneous manufactured articles
Other commodities
0% 100%50% 0% 100%50%
52% 18% 3% 21%
4% 18%24%47%
57%
60%
57%
57%
52%
49%
44%
30%
34%
27%
27%
27%
24%
29%
17% 5% 15%
16% 13%5%
21% 11%5%
20% 13%5%
20% 16%6%
18% 21%8%
11% 22%15%
28% 28%13% 8%
14% 28%13% 8%
8% 29%15% 14%
4% 32%21% 10%
6% 36%16% 10%
14% 26%19% 7%
10% 25%20% 16%
5% 10% 17% 42% 16%
7% 10% 17% 45% 15%
8% 10% 16% 42% 16%
9% 9% 15% 42% 16%
7% 9% 16% 41% 17%
7% 9% 16% 41% 18%
6% 9% 16% 41% 20%
8% 9% 15% 39% 19%
8% 9% 17% 41% 16%
8% 6% 17% 39% 18%
6% 19% 37% 22%
7% 17% 37% 23%
8% 17% 33% 24%
8% 18% 32% 22%
10% 17% 33% 20%
10% 15% 41% 20%
12
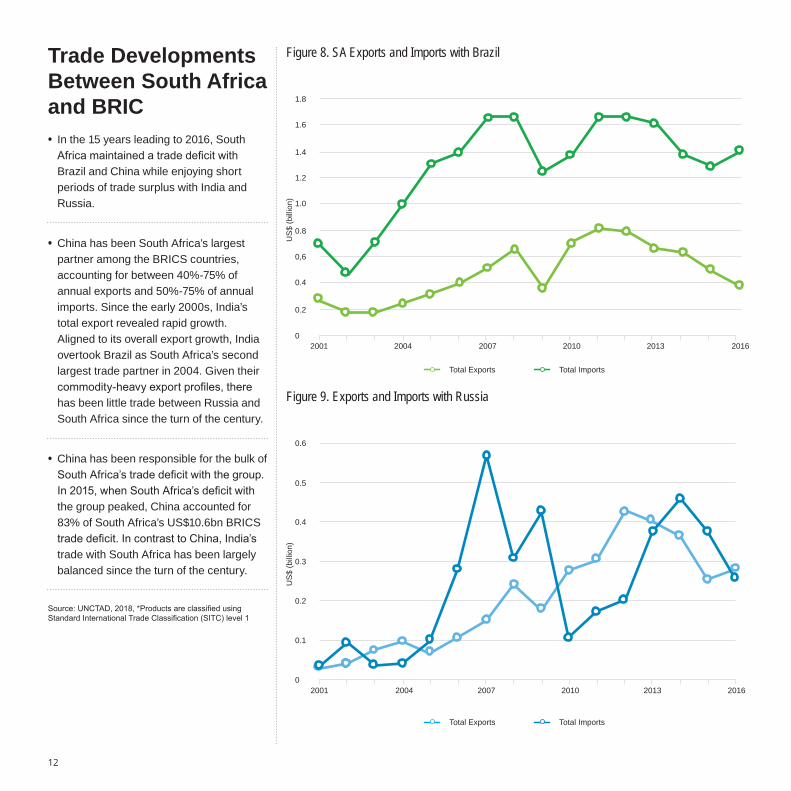
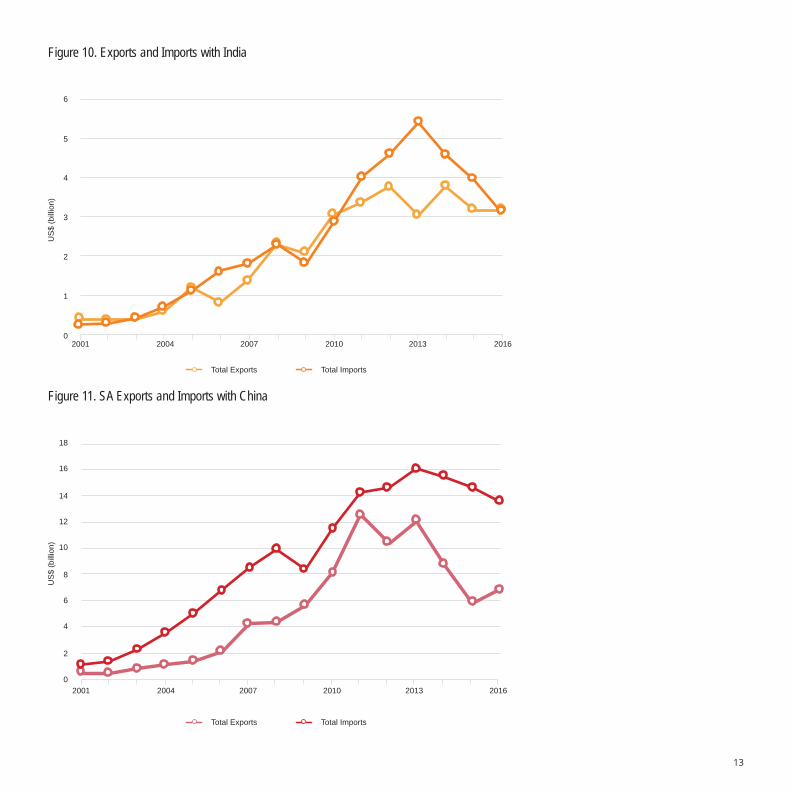
Trade Developments Between South Africa and BRIC • In the 15 years leading to 2016, South Africa maintained a trade deficit with Brazil and China while enjoying short periods of trade surplus with India and Russia.
• China has been South Africa’s largest partner among the BRICS countries, accounting for between 40%-75% of annual exports and 50%-75% of annual imports. Since the early 2000s, India’s total export revealed rapid growth.Aligned to its overall export growth, India overtook Brazil as South Africa’s second largest trade partner in 2004. Given their commodity-heavy export profiles, there has been little trade between Russia and South Africa since the turn of the century.
• China has been responsible for the bulk of South Africa’s trade deficit with the group. In 2015, when South Africa’s deficit with the group peaked, China accounted for 83% of South Africa’s US$10.6bn BRICS trade deficit. In contrast to China, India’s trade with South Africa has been largely balanced since the turn of the century.
Figure 8. SA Exports and Imports with Brazil
Source: UNCTAD, 2018, *Products are classified using Standard International Trade Classification (SITC) level 1
2001 20162004 2007 2010 2013
US
$ (b
illio
n)
0.2
0.4
0,6
0.8
1.0
1.2
1.4
1.6
1.8
0
Figure 9. Exports and Imports with Russia
US
$ (b
illio
n)
0.1
0.2
0.3
0.4
0.5
0.6
02001 2004 2007 2010 2013 2016
Total Exports Total Imports
Total Exports Total Imports
13
Figure 11. SA Exports and Imports with China
US
$ (b
illio
n)
2
4
6
8
10
12
14
16
18
0
Figure 10. Exports and Imports with IndiaU
S$
(bill
ion)
1
2
3
4
5
6
02001 2004 2007 2010 2013 2016
2001 2004 2007 2010 2013 2016
Total Exports Total Imports
Total Exports Total Imports
14
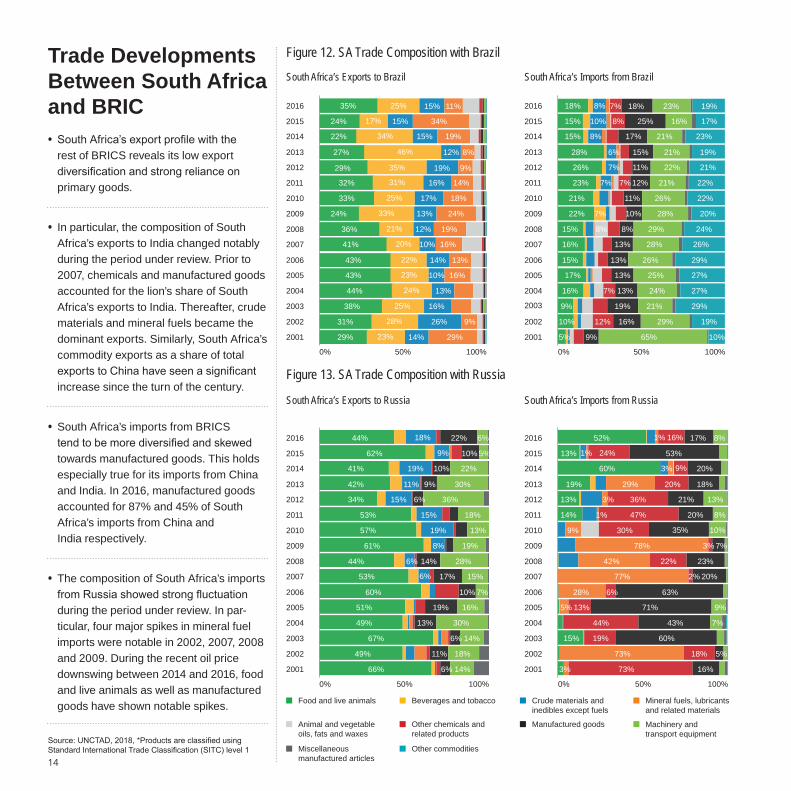
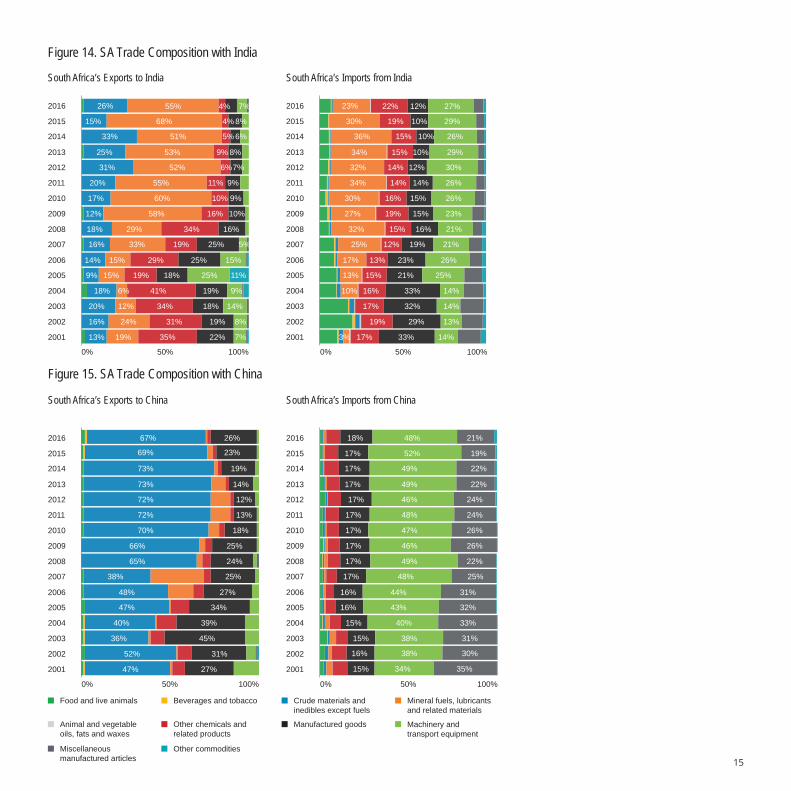
Trade Developments Between South Africa and BRIC • South Africa’s export profile with the rest of BRICS reveals its low export diversification and strong reliance on primary goods.
• In particular, the composition of South Africa’s exports to India changed notably during the period under review. Prior to 2007, chemicals and manufactured goods accounted for the lion’s share of South Africa’s exports to India. Thereafter, crude materials and mineral fuels became the dominant exports. Similarly, South Africa’s commodity exports as a share of total exports to China have seen a significant increase since the turn of the century.
• South Africa’s imports from BRICS tend to be more diversified and skewed towards manufactured goods. This holds especially true for its imports from China and India. In 2016, manufactured goods accounted for 87% and 45% of South Africa’s imports from China and India respectively.
• The composition of South Africa’s imports from Russia showed strong fluctuation during the period under review. In par-ticular, four major spikes in mineral fuel imports were notable in 2002, 2007, 2008 and 2009. During the recent oil price downswing between 2014 and 2016, food and live animals as well as manufactured goods have shown notable spikes.
Figure 12. SA Trade Composition with Brazil
South Africa’s Exports to Brazil South Africa’s Imports from Brazil
Source: UNCTAD, 2018, *Products are classified using Standard International Trade Classification (SITC) level 1
Figure 13. SA Trade Composition with Russia
South Africa’s Exports to Russia South Africa’s Imports from Russia
Food and live animals Crude materials and inedibles except fuels
Mineral fuels, lubricants and related materials
Manufactured goods
Miscellaneous manufactured articles
Beverages and tobacco
Animal and vegetable oils, fats and waxes
Other chemicals and related products
Machinery and transport equipment
Other commodities
2016
2015
2014
2013
2012
2011
2010
2009
2008
2007
2006
2005
2004
2003
2002
2001
2016
2015
2014
2013
2012
2011
2010
2009
2008
2007
2006
2005
2004
2003
2002
2001
2016
2015
2014
2013
2012
2011
2010
2009
2008
2007
2006
2005
2004
2003
2002
2001
2016
2015
2014
2013
2012
2011
2010
2009
2008
2007
2006
2005
2004
2003
2002
2001
35% 25% 15% 11%
24% 17% 15% 34%
22% 34% 15% 19%
27% 46% 12% 8%
29% 35% 19% 9%
32% 31% 16% 14%
33% 25% 17% 18%
24% 33% 13% 24%
36% 21% 12% 19%
41% 20% 10% 16%
43% 22% 14% 13%
43% 23% 10% 16%
44% 24% 13%
38% 25% 16%
31% 28% 26% 9%
29% 23% 14% 29%
18% 8% 7% 18% 23% 19%
15% 10% 8% 25% 16% 17%
15% 8% 17% 21% 23%
28% 6% 15% 19%21%
26% 7% 11% 21%22%
23% 7% 7% 22%12% 21%
21% 11% 22%26%
22% 7% 20%10% 28%
15% 8% 24%8% 29%
16%
15%
17%
16%
9%
10%
5% 9% 65% 10%
12% 16% 29% 19%
19% 21% 29%
13% 24% 27%7%
13% 25% 27%
13% 26% 29%
13% 28% 26%
0% 100%50% 0% 100%50%
0% 100%50% 0% 100%50%
44% 18% 22% 6%
62% 9% 10% 5%
41% 19% 10% 22%
42% 11% 9% 30%
34% 15% 6% 36%
53% 15% 18%
57% 19% 13%
61% 8% 19%
44% 6% 14% 28%
53% 6% 17% 15%
60% 10% 7%
51% 19% 16%
49% 13% 30%
67% 6% 14%
49% 11% 18%
66% 6% 14%
52% 16% 17% 8%1%
13% 24% 53%1%
60% 9% 20%3%
19% 20% 18%29%
13% 36% 21%3% 13%
14% 47% 20%1% 8%
9% 30% 35% 10%
78% 3% 7%
42% 22% 23%
77% 2% 20%
28% 6% 63%
5% 13% 71% 9%
44% 43% 7%
15% 19% 60%
73% 18% 5%
3% 73% 16%
15
Figure 14. SA Trade Composition with India
South Africa’s Exports to India South Africa’s Imports from India
Figure 15. SA Trade Composition with China
South Africa’s Exports to China South Africa’s Imports from China
Food and live animals Crude materials and inedibles except fuels
Mineral fuels, lubricants and related materials
Manufactured goods
Miscellaneous manufactured articles
Beverages and tobacco
Animal and vegetable oils, fats and waxes
Other chemicals and related products
Machinery and transport equipment
Other commodities
2016
2015
2014
2013
2012
2011
2010
2009
2008
2007
2006
2005
2004
2003
2002
2001
2016
2015
2014
2013
2012
2011
2010
2009
2008
2007
2006
2005
2004
2003
2002
2001
0% 100%50% 0% 100%50%
0% 100%50% 0% 100%50%
26% 55% 4% 7%2016
2015
2014
2013
2012
2011
2010
2009
2008
2007
2006
2005
2004
2003
2002
2001
2016
2015
2014
2013
2012
2011
2010
2009
2008
2007
2006
2005
2004
2003
2002
2001
15% 68% 4% 8%
33% 51% 5% 6%
25% 53% 9% 8%
31% 52% 6%7%
20% 55% 11% 9%
17% 60% 10% 9%
12% 58% 16% 10%
18% 29% 34% 16%
16% 33% 19% 25% 5%
14% 15% 29% 25% 15%
15% 19% 18% 25% 11%9%
6% 41% 19% 9%18%
12% 34% 18% 14%20%
24% 31% 19% 8%16%
19% 35% 22% 7%13%
23% 22% 12% 27%
30% 19% 10% 29%
36% 15% 10% 26%
34% 15% 10% 29%
32% 14% 12% 30%
34% 14% 14% 26%
30% 16% 15% 26%
27% 19% 15% 23%
32% 15% 16% 21%
25% 12% 19% 21%
17% 13% 23% 26%
13% 15% 21% 25%
10% 16% 33% 14%
17% 32% 14%
19% 29% 13%
3% 17% 33% 14%
67% 26%
69% 23%
73% 19%
73% 14%
72% 12%
72% 13%
70% 18%
66% 25%
65% 24%
38% 25%
48% 27%
47% 34%
40% 39%
36% 45%
52% 31%
47% 27%
18% 48% 21%
17% 52% 19%
17% 49% 22%
17% 49% 22%
17% 46% 24%
17% 48% 24%
17% 47% 26%
17% 46% 26%
17% 49% 22%
17% 48% 25%
16% 44% 31%
16% 43% 32%
15% 40% 33%
15% 38% 31%
16% 38% 30%
15% 34% 35%
16
Trade Developments Between BRICS and the Rest of the World
Source: UNCTAD, 2018, *Products are classified using Standard International Trade Classification (SITC) level 1
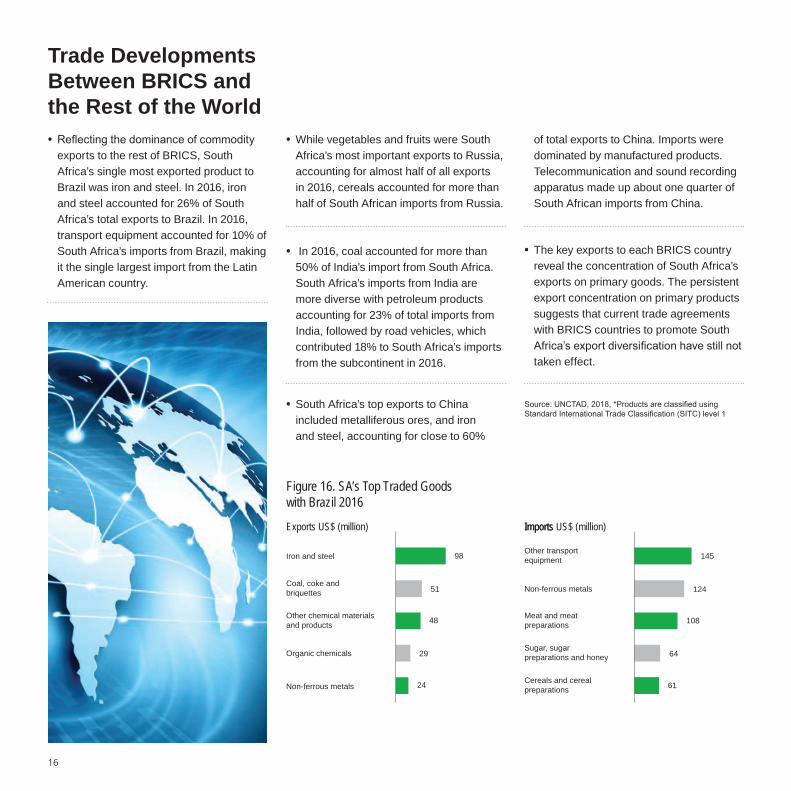
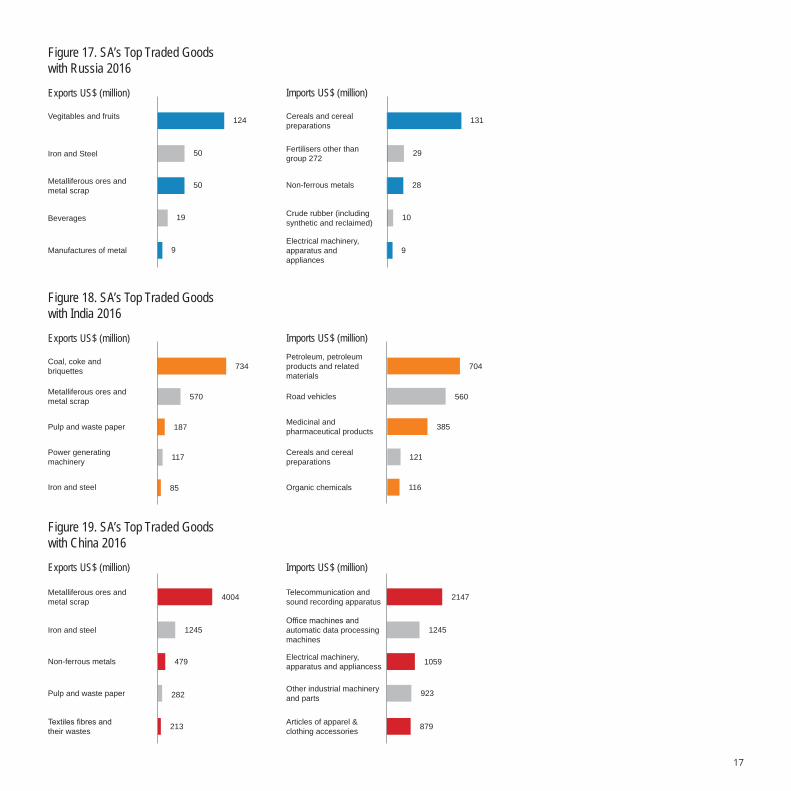
• Reflecting the dominance of commodity exports to the rest of BRICS, South Africa’s single most exported product to Brazil was iron and steel. In 2016, iron and steel accounted for 26% of South Africa’s total exports to Brazil. In 2016, transport equipment accounted for 10% of South Africa’s imports from Brazil, making it the single largest import from the Latin American country.
• While vegetables and fruits were South Africa’s most important exports to Russia, accounting for almost half of all exports in 2016, cereals accounted for more than half of South African imports from Russia.
• In 2016, coal accounted for more than 50% of India’s import from South Africa. South Africa’s imports from India are more diverse with petroleum products accounting for 23% of total imports from India, followed by road vehicles, which contributed 18% to South Africa’s imports from the subcontinent in 2016.
• South Africa’s top exports to China included metalliferous ores, and iron and steel, accounting for close to 60%
of total exports to China. Imports were dominated by manufactured products. Telecommunication and sound recording apparatus made up about one quarter of South African imports from China.
• The key exports to each BRICS country reveal the concentration of South Africa’s exports on primary goods. The persistent export concentration on primary products suggests that current trade agreements with BRICS countries to promote South Africa’s export diversification have still not taken effect.
Figure 16. SA’s Top Traded Goods with Brazil 2016
Imports
Iron and steel
Coal, coke and briquettes
Other chemical materialsand products
Organic chemicals
Non-ferrous metals
Other transport equipment
Non-ferrous metals
Meat and meat preparations
Sugar, sugar preparations and honey
Cereals and cereal preparations
98
48
51
48
29
24
145
124
108
64
61
Exports US$ (million) Imports US$ (million)
17
Figure 19. SA’s Top Traded Goods with China 2016
Figure 18. SA’s Top Traded Goods with India 2016
Coal, coke and briquettes 734
Metalliferous ores and metal scrap
Pulp and waste paper
Power generating machinery
Iron and steel
Petroleum, petroleum products and related materials
Road vehicles
Medicinal and pharmaceutical products
Cereals and cereal preparations
Organic chemicals
570
187
117
85
704
560
385
121
116
Metalliferous ores and metal scrap
Iron and steel
Non-ferrous metals
Pulp and waste paper
Textiles fibres and their wastes
Telecommunication and sound recording apparatus
Office machines and automatic data processing machines
Electrical machinery, apparatus and appliancess
Other industrial machinery and parts
Articles of apparel & clothing accessories
4004
1245
479
213
2147
1245
1059
923
879
282
Figure 17. SA’s Top Traded Goods with Russia 2016
Vegitables and fruits
Iron and Steel
Metalliferous ores and metal scrap
Beverages
Manufactures of metal
124
50
50
19
9
131
29
28
10
9
Cereals and cereal preparations
Fertilisers other than group 272
Non-ferrous metals
Crude rubber (including synthetic and reclaimed)
Electrical machinery, apparatus and appliances
Exports US$ (million) Imports US$ (million)
Exports US$ (million) Imports US$ (million)
Exports US$ (million) Imports US$ (million)
Investment Developments
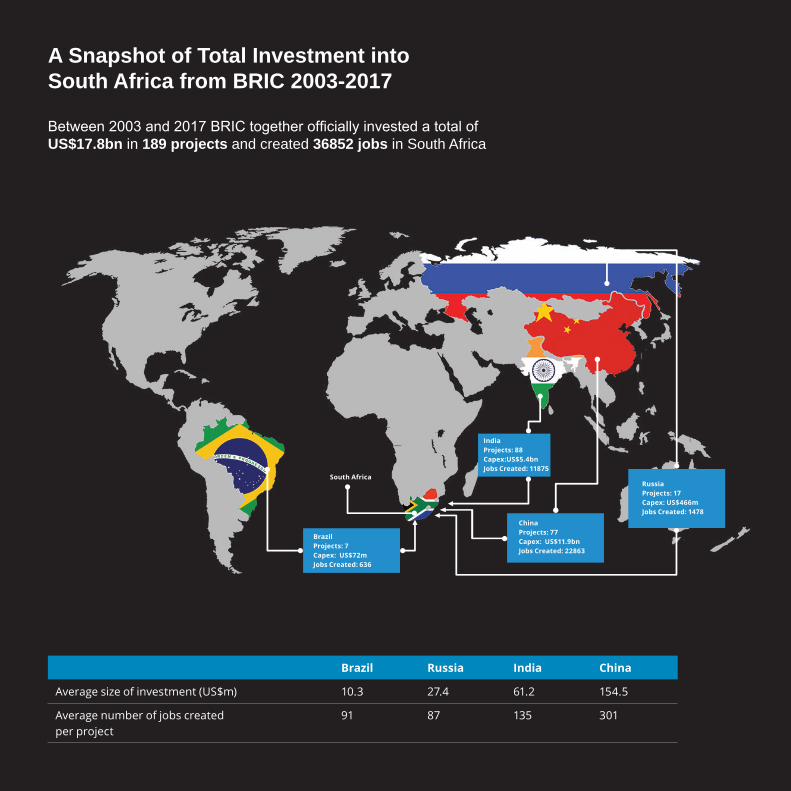
A Snapshot of Total Investment into South Africa from BRIC 2003-2017
Between 2003 and 2017 BRIC together offi cially invested a total of US$17.8bn in 189 projects and created 36852 jobs in South Africa
Brazil Russia India China
Average size of investment (US$m) 10.3 27.4 61.2 154.5
Average number of jobs created per project
91 87 135 301
BrazilProjects: 7Capex: US$72m Jobs Created: 636
ChinaProjects: 77 Capex: US$11.9bnJobs Created: 22863
IndiaProjects: 88 Capex:US$5.4bn Jobs Created: 11875
RussiaProjects: 17Capex: US$466mJobs Created: 1478
South Africa
Investment Developments
20
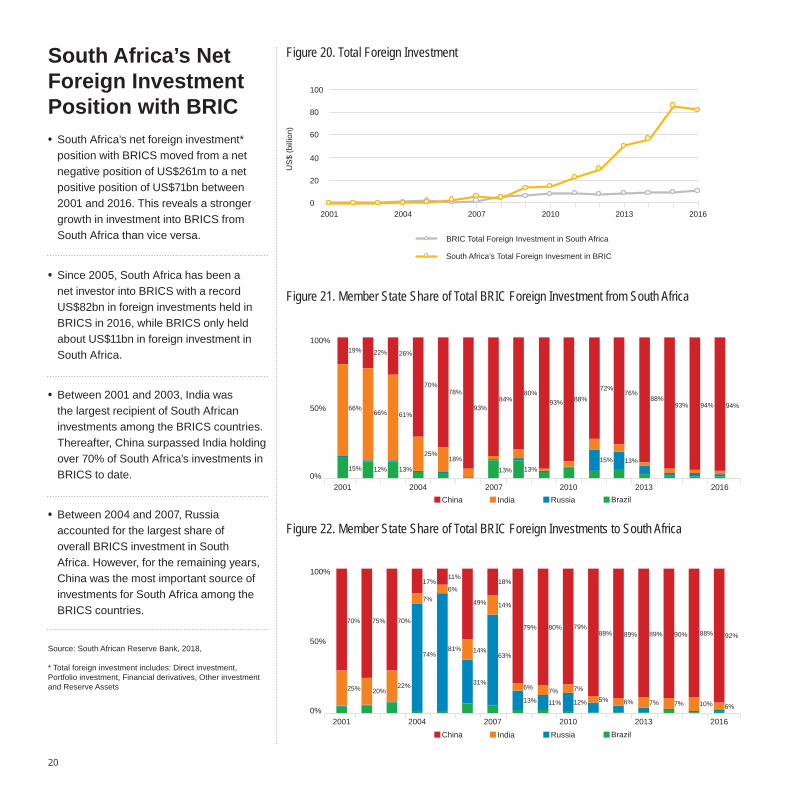
• South Africa’s net foreign investment* position with BRICS moved from a net negative position of US$261m to a net positive position of US$71bn between 2001 and 2016. This reveals a stronger growth in investment into BRICS from South Africa than vice versa.
• Since 2005, South Africa has been a net investor into BRICS with a record US$82bn in foreign investments held in BRICS in 2016, while BRICS only held about US$11bn in foreign investment in South Africa.
• Between 2001 and 2003, India was the largest recipient of South African investments among the BRICS countries. Thereafter, China surpassed India holding over 70% of South Africa’s investments in BRICS to date.
• Between 2004 and 2007, Russia accounted for the largest share of overall BRICS investment in South Africa. However, for the remaining years, China was the most important source of investments for South Africa among the BRICS countries.
South Africa’s Net Foreign Investment Position with BRIC
Source: South African Reserve Bank, 2018,
* Total foreign investment includes: Direct investment, Portfolio investment, Financial derivatives, Other investment and Reserve Assets
Figure 20. Total Foreign Investment
US
$ (b
illio
n) 60
80
100
40
20
BRIC Total Foreign Investment in South Africa
South Africa’s Total Foreign Invesment in BRIC
02001 2004 2007 2010 2013 2016
Figure 21. Member State Share of Total BRIC Foreign Investment from South Africa
Figure 22. Member State Share of Total BRIC Foreign Investments to South Africa
100%
0%
50%
2001 2004 2007 2010 2013 2016China India Russia Brazil
100%
0%
50%
2001 2004 2007 2010 2013 2016China India Russia Brazil
19%
66%
15%
22%
66%
12%
26%
61%
13%
70%
25%
78%
18%
93%84%
13%
80%
13%
93% 88%72%
15%
76%
13%
88%93% 94% 94%
70%
25% 20%22%
75% 70%
17%
7%
74%
11%
6%
81%
49%
14%
31%
18%
14%
63%
79%
6%
13%
80%
7%
11%
79%
7%
12%
88%
5%
89%
6%
89%
7%
90%
7%
88%
10%
92%
6%
21
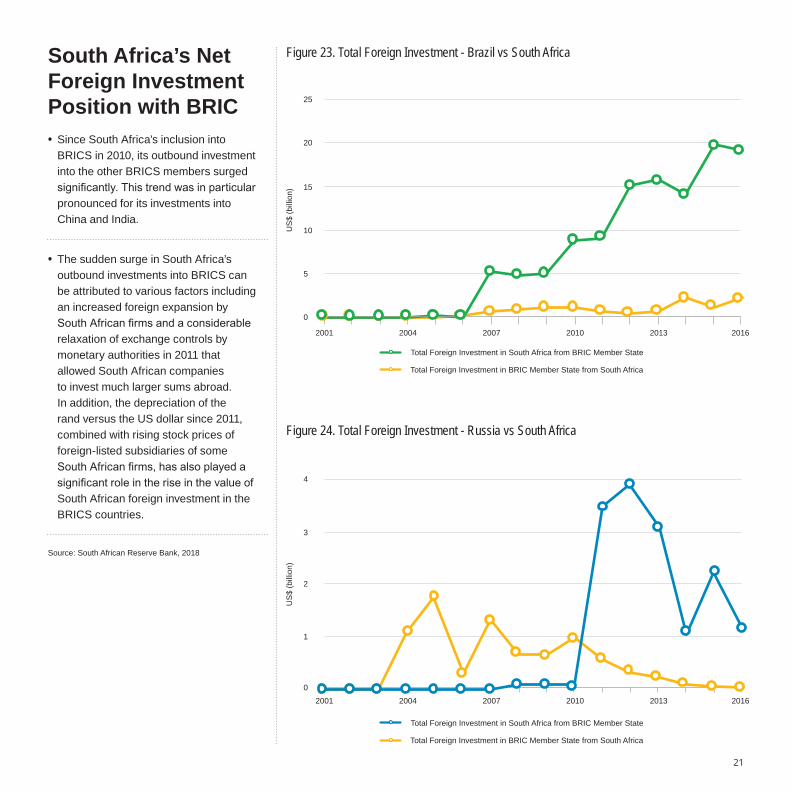
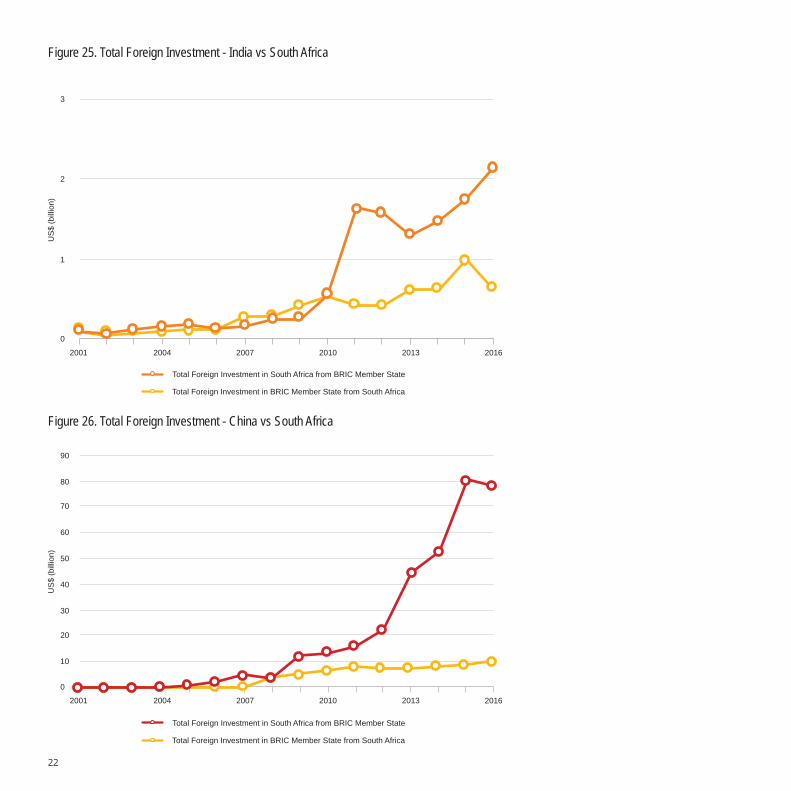
South Africa’s Net Foreign Investment Position with BRIC • Since South Africa’s inclusion into BRICS in 2010, its outbound investment into the other BRICS members surged significantly. This trend was in particular pronounced for its investments into China and India.
• The sudden surge in South Africa’s outbound investments into BRICS can be attributed to various factors including an increased foreign expansion by South African firms and a considerable relaxation of exchange controls by monetary authorities in 2011 that allowed South African companies to invest much larger sums abroad. In addition, the depreciation of the rand versus the US dollar since 2011, combined with rising stock prices of foreign-listed subsidiaries of some South African firms, has also played a significant role in the rise in the value of South African foreign investment in the BRICS countries.
Source: South African Reserve Bank, 2018
Figure 23. Total Foreign Investment - Brazil vs South Africa
Figure 24. Total Foreign Investment - Russia vs South Africa
US
$ (b
illio
n)
25
20
15
10
5
0
4
3
2
1
0
US
$ (b
illio
n)
2001 2004 2007 2010 2013 2016
2001 2004 2007 2010 2013 2016
Total Foreign Investment in South Africa from BRIC Member State
Total Foreign Investment in BRIC Member State from South Africa
Total Foreign Investment in South Africa from BRIC Member State
Total Foreign Investment in BRIC Member State from South Africa
22
Figure 25. Total Foreign Investment - India vs South AfricaU
S$
(bill
ion)
1
2
3
0
2001 2004 2007 2010 2013 2016
Figure 26. Total Foreign Investment - China vs South Africa
2001 2004 2007 2010 2013 2016
90
80
70
60
50
40
30
20
10
0
US
$ (b
illio
n)
Total Foreign Investment in South Africa from BRIC Member State
Total Foreign Investment in BRIC Member State from South Africa
Total Foreign Investment in South Africa from BRIC Member State
Total Foreign Investment in BRIC Member State from South Africa
23
Total FDI into South Africa from BRIC
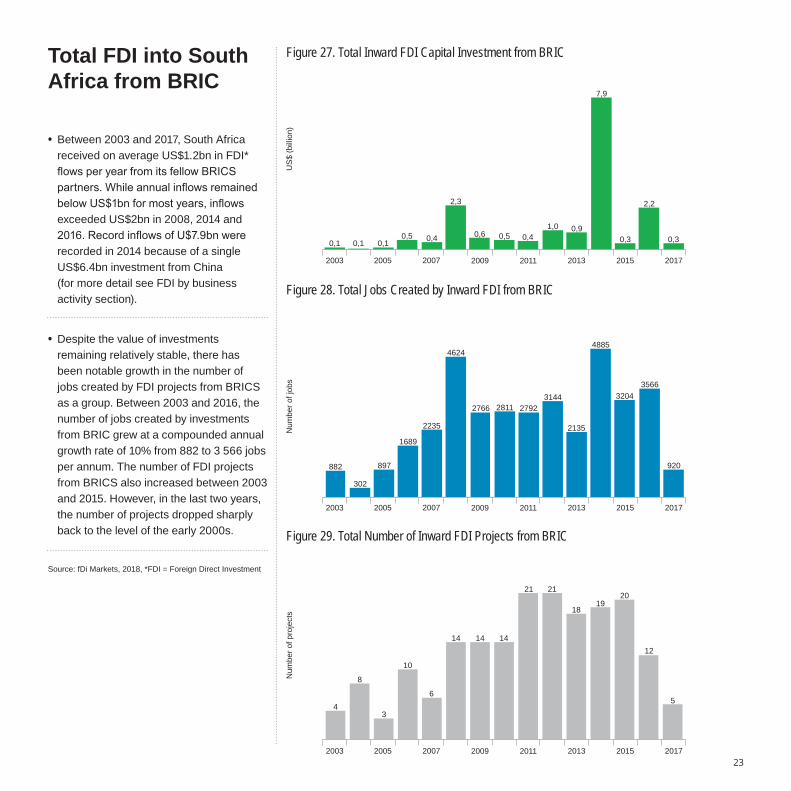
• Between 2003 and 2017, South Africa received on average US$1.2bn in FDI* flows per year from its fellow BRICS partners. While annual inflows remained below US$1bn for most years, inflows exceeded US$2bn in 2008, 2014 and 2016. Record inflows of U$7.9bn were recorded in 2014 because of a single US$6.4bn investment from China (for more detail see FDI by business activity section).
• Despite the value of investments remaining relatively stable, there has been notable growth in the number of jobs created by FDI projects from BRICS as a group. Between 2003 and 2016, the number of jobs created by investments from BRIC grew at a compounded annual growth rate of 10% from 882 to 3 566 jobs per annum. The number of FDI projects from BRICS also increased between 2003 and 2015. However, in the last two years, the number of projects dropped sharply back to the level of the early 2000s.
Source: fDi Markets, 2018, *FDI = Foreign Direct Investment
Figure 27. Total Inward FDI Capital Investment from BRIC
US
$ (b
illio
n)
2003 2005 20132007 2009 2011 2015 2017
Figure 28. Total Jobs Created by Inward FDI from BRIC
2003 2005 20132007 2009 2011 2015 2017
Figure 29. Total Number of Inward FDI Projects from BRIC
2003 2005 20132007 2009 2011 2015 2017
Num
ber o
f job
sN
umbe
r of p
roje
cts
0,1 0,1 0,10,5 0,4
2,3
0,6 0,5 0,41,0 0,9
7,9
0,3
2,2
0,3
882
302
897
1689
2235
4624
2766 2811 27923144
2135
4885
32043566
920
4
8
3
10
6
14 14 14
21 21
1819
20
12
5
24
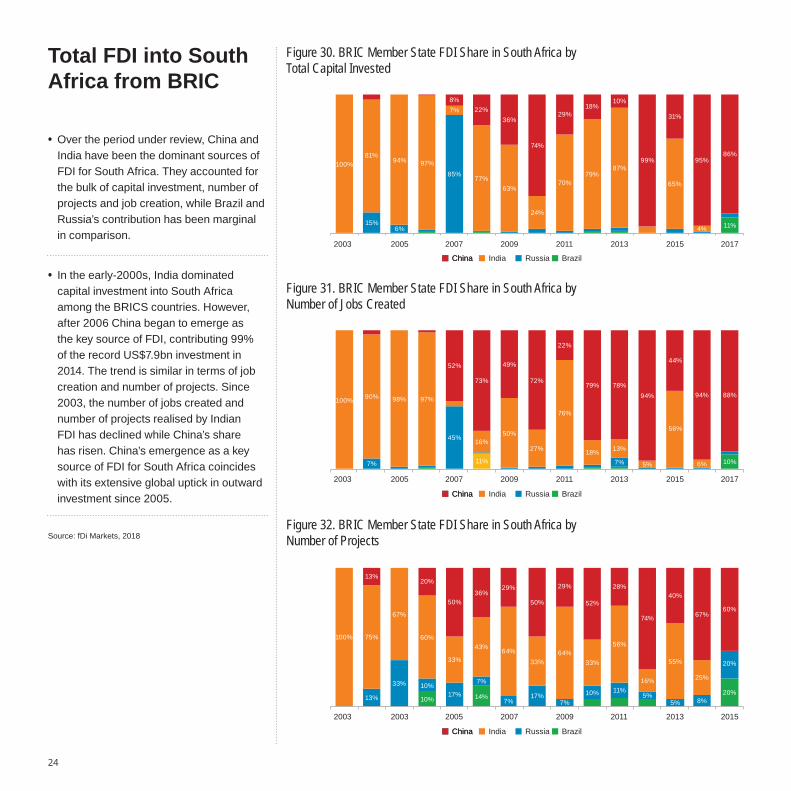
• Over the period under review, China and India have been the dominant sources of FDI for South Africa. They accounted for the bulk of capital investment, number of projects and job creation, while Brazil and Russia’s contribution has been marginal in comparison.
• In the early-2000s, India dominated capital investment into South Africa among the BRICS countries. However, after 2006 China began to emerge as the key source of FDI, contributing 99% of the record US$7.9bn investment in 2014. The trend is similar in terms of job creation and number of projects. Since 2003, the number of jobs created and number of projects realised by Indian FDI has declined while China’s share has risen. China’s emergence as a key source of FDI for South Africa coincides with its extensive global uptick in outward investment since 2005.
Total FDI into South Africa from BRIC
Source: fDi Markets, 2018
Figure 30. BRIC Member State FDI Share in South Africa by Total Capital Invested
Figure 31. BRIC Member State FDI Share in South Africa by Number of Jobs Created
2003 2005 2007 2011 2013 20172009 2015
Figure 32. BRIC Member State FDI Share in South Africa by Number of Projects
2003 2003 2005 2009 2011 20152007 2013
2003 2005 2007 2011 2013 20172009 2015
ChinaChina India Russia Brazil
ChinaChina India Russia Brazil
ChinaChina India Russia Brazil
100%81%
15%
94%
6%
97%85%
7%8%
22%
77%
36%
63%
74%
24%
29%
70%79%
18%10%
87%99%
31%
65%
95%
4%
86%
11%
100% 90%
7%
98% 97%
52%
45%
73%
16%
11%
49%
50%
72%
27%
22%
76%
79%
18%
78%
13%
7%
94%
5%
44%
56%
94%
6%
88%
10%
100% 75%
13%
13%
67%
33%
20%
60%
10%
10%17%
33%
50%36%
43%
7%
14%
29%
64%
7%
50%
33%
17%
29%
64%
7%
52%
33%
10%
28%
56%
11%
74%
16%
5%
40%
55%
5%
67%
25%
8%
60%
20%
20%
25
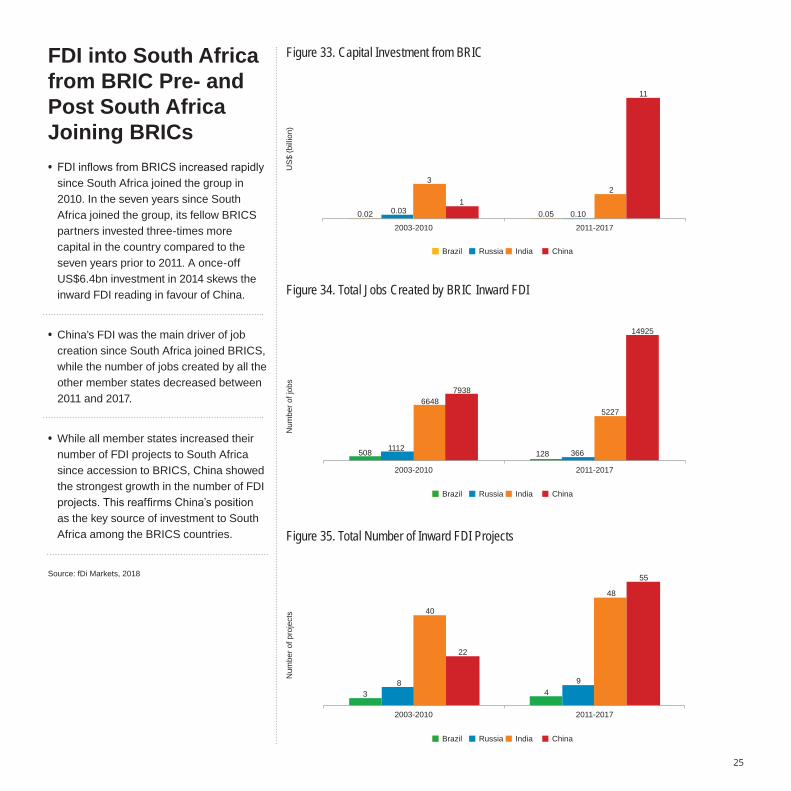
FDI into South Africa from BRIC Pre- and Post South Africa Joining BRICs
Source: fDi Markets, 2018
Figure 33. Capital Investment from BRIC
US
$ (b
illio
n)
2003-2010
Figure 34. Total Jobs Created by BRIC Inward FDI
Figure 35. Total Number of Inward FDI Projects
Num
ber o
f job
sN
umbe
r of p
roje
cts
Brazil Russia India China
2011-2017
2003-2010 2011-2017
2003-2010 2011-2017
• FDI inflows from BRICS increased rapidly since South Africa joined the group in 2010. In the seven years since South Africa joined the group, its fellow BRICS partners invested three-times more capital in the country compared to the seven years prior to 2011. A once-off US$6.4bn investment in 2014 skews the inward FDI reading in favour of China.
• China’s FDI was the main driver of job creation since South Africa joined BRICS, while the number of jobs created by all the other member states decreased between 2011 and 2017.
• While all member states increased their number of FDI projects to South Africa since accession to BRICS, China showed the strongest growth in the number of FDI projects. This reaffirms China’s position as the key source of investment to South Africa among the BRICS countries.
0.031
3
0.02 0.05 0.10
2
11
Brazil Russia India China
Brazil Russia India China
508 1112
66487938
128 366
5227
14925
38
40
22
49
48
55
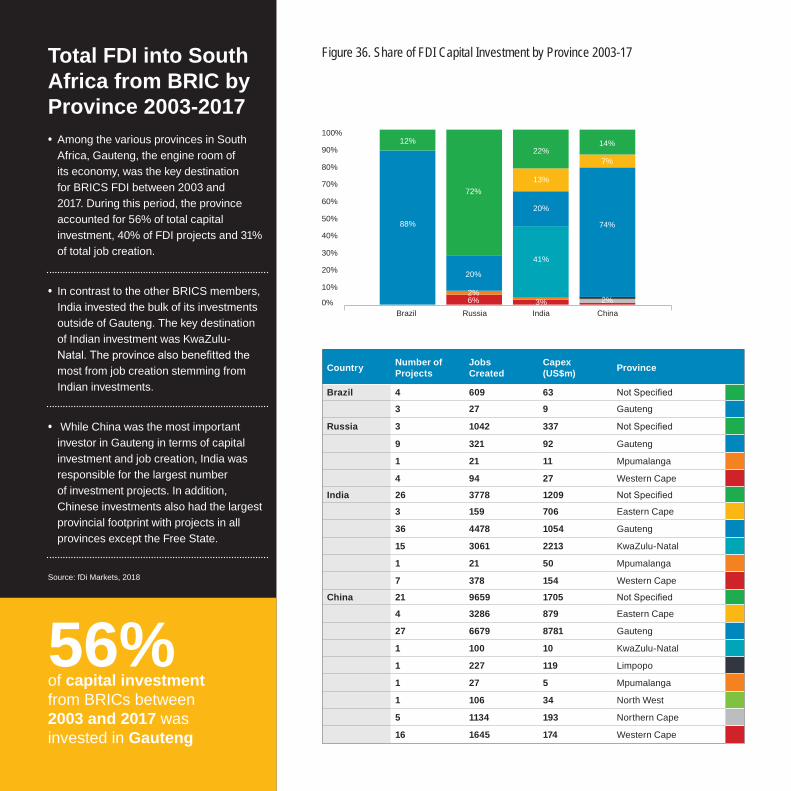
Total FDI into South Africa from BRIC by Province 2003-2017 • Among the various provinces in South Africa, Gauteng, the engine room of its economy, was the key destination for BRICS FDI between 2003 and 2017. During this period, the province accounted for 56% of total capital investment, 40% of FDI projects and 31% of total job creation.
• In contrast to the other BRICS members, India invested the bulk of its investments outside of Gauteng. The key destination of Indian investment was KwaZulu-Natal. The province also benefitted the most from job creation stemming from Indian investments.
• While China was the most important investor in Gauteng in terms of capital investment and job creation, India was responsible for the largest number of investment projects. In addition, Chinese investments also had the largest provincial footprint with projects in all provinces except the Free State.
Source: fDi Markets, 2018
56%of capital investment from BRICs between 2003 and 2017 was invested in Gauteng
Figure 36. Share of FDI Capital Investment by Province 2003-17
Country Number of Projects
Jobs Created
Capex (US$m) Province
Brazil 4 609 63 Not Specified
3 27 9 Gauteng
Russia 3 1042 337 Not Specified
9 321 92 Gauteng
1 21 11 Mpumalanga
4 94 27 Western Cape
India 26 3778 1209 Not Specified
3 159 706 Eastern Cape
36 4478 1054 Gauteng
15 3061 2213 KwaZulu-Natal
1 21 50 Mpumalanga
7 378 154 Western Cape
China 21 9659 1705 Not Specified
4 3286 879 Eastern Cape
27 6679 8781 Gauteng
1 100 10 KwaZulu-Natal
1 227 119 Limpopo
1 27 5 Mpumalanga
1 106 34 North West
5 1134 193 Northern Cape
16 1645 174 Western Cape
12%
88%
72%
20%
2%6%
22%
13%
20%
41%
3%
14%
7%
74%
2%Brazil Russia India China
100%
0%
50%
90%
80%
70%
60%
40%
30%
20%
10%
28
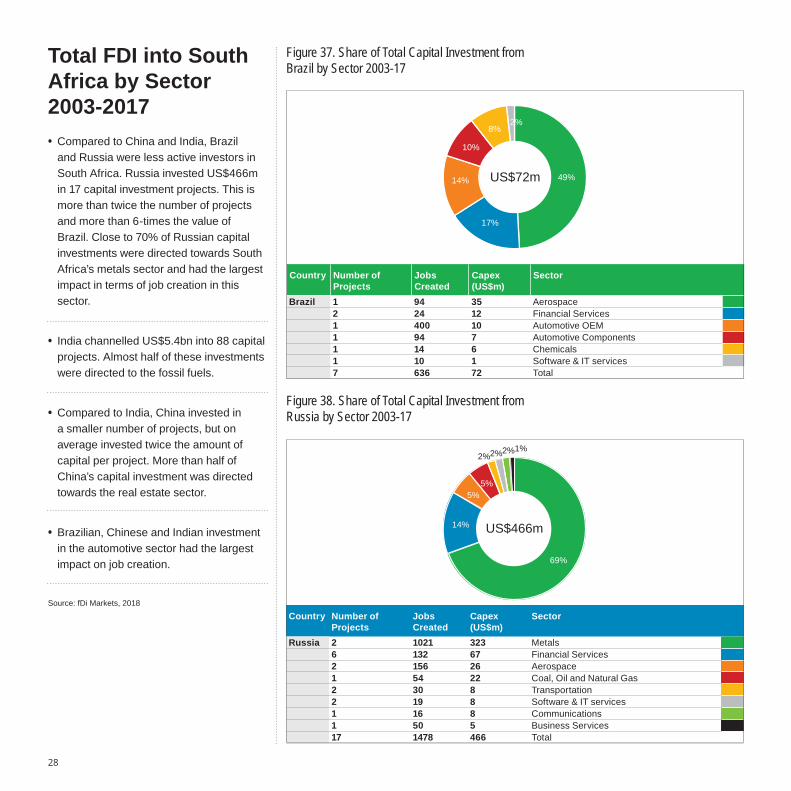
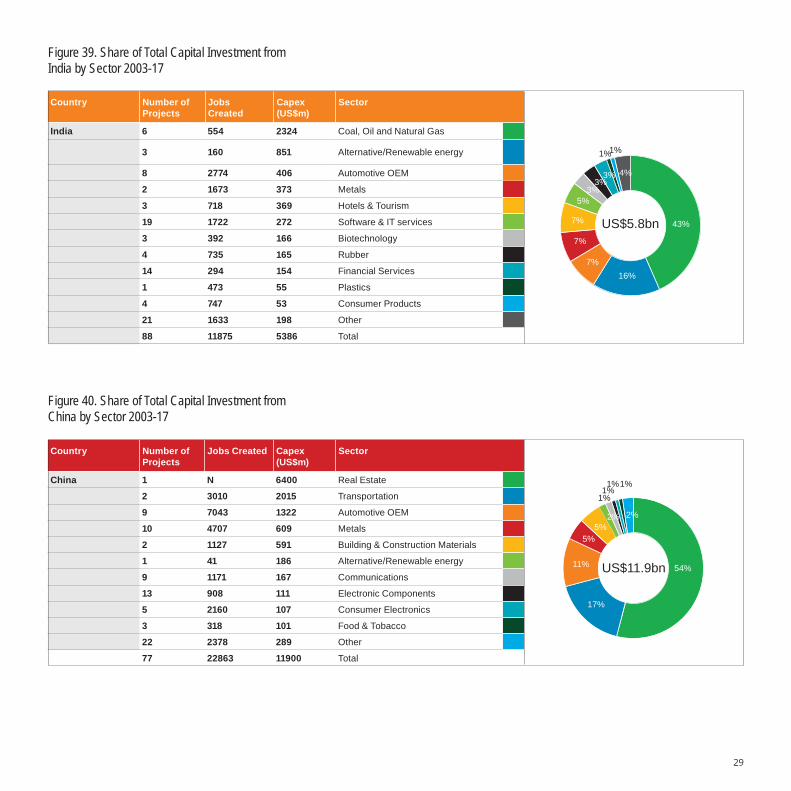
Total FDI into South Africa by Sector 2003-2017 • Compared to China and India, Brazil and Russia were less active investors in South Africa. Russia invested US$466m in 17 capital investment projects. This is more than twice the number of projects and more than 6-times the value of Brazil. Close to 70% of Russian capital investments were directed towards South Africa’s metals sector and had the largest impact in terms of job creation in this sector.
• India channelled US$5.4bn into 88 capital projects. Almost half of these investments were directed to the fossil fuels.
• Compared to India, China invested in a smaller number of projects, but on average invested twice the amount of capital per project. More than half of China’s capital investment was directed towards the real estate sector.
• Brazilian, Chinese and Indian investment in the automotive sector had the largest impact on job creation.
Source: fDi Markets, 2018
Figure 37. Share of Total Capital Investment from Brazil by Sector 2003-17
Country Number of Projects
Jobs Created
Capex (US$m)
Sector
Brazil 1 94 35 Aerospace2 24 12 Financial Services1 400 10 Automotive OEM1 94 7 Automotive Components1 14 6 Chemicals1 10 1 Software & IT services7 636 72 Total
Figure 38. Share of Total Capital Investment from Russia by Sector 2003-17
Country Number of Projects
Jobs Created
Capex (US$m)
Sector
Russia 2 1021 323 Metals6 132 67 Financial Services2 156 26 Aerospace1 54 22 Coal, Oil and Natural Gas2 30 8 Transportation2 19 8 Software & IT services1 16 8 Communications1 50 5 Business Services17 1478 466 Total
49%US$72m14%
10%
8%2%
17%
69%
14%
5%5%
2%2%2%1%
US$466m
29
Figure 39. Share of Total Capital Investment from India by Sector 2003-17
Figure 40. Share of Total Capital Investment from China by Sector 2003-17
Country Number of Projects
Jobs Created
Capex (US$m)
Sector
India 6 554 2324 Coal, Oil and Natural Gas
3 160 851 Alternative/Renewable energy
8 2774 406 Automotive OEM
2 1673 373 Metals
3 718 369 Hotels & Tourism
19 1722 272 Software & IT services
3 392 166 Biotechnology
4 735 165 Rubber
14 294 154 Financial Services
1 473 55 Plastics
4 747 53 Consumer Products
21 1633 198 Other
88 11875 5386 Total
43%US$5.8bn
16%7%
7%
7%
5%3%
3%3% 4%
1%1%
Country Number of Projects
Jobs Created Capex (US$m)
Sector
China 1 N 6400 Real Estate
2 3010 2015 Transportation
9 7043 1322 Automotive OEM
10 4707 609 Metals
2 1127 591 Building & Construction Materials
1 41 186 Alternative/Renewable energy
9 1171 167 Communications
13 908 111 Electronic Components
5 2160 107 Consumer Electronics
3 318 101 Food & Tobacco
22 2378 289 Other
77 22863 11900 Total
54%US$11.9bn
17%
11%
5%5%
1%1%1%1%
2% 2%
30
Figure 41. Share of Total Capital Investment from Brazil by Business Activity
Figure 42. Share of Total Capital Investment from Russia by Business Activity
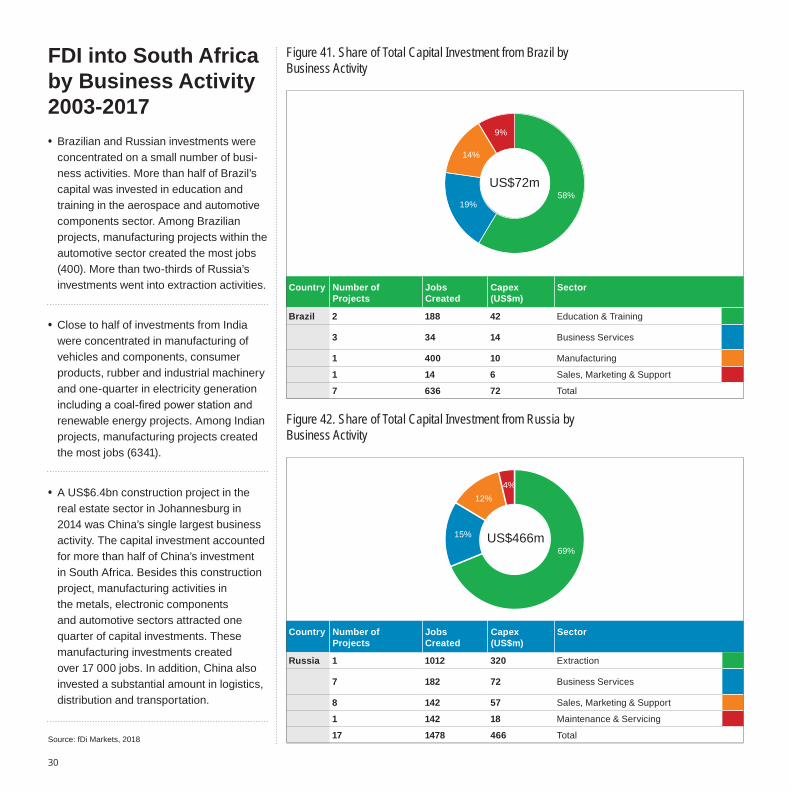
FDI into South Africa by Business Activity 2003-2017 • Brazilian and Russian investments were concentrated on a small number of busi-ness activities. More than half of Brazil’s capital was invested in education and training in the aerospace and automotive components sector. Among Brazilian projects, manufacturing projects within the automotive sector created the most jobs (400). More than two-thirds of Russia’s investments went into extraction activities.
• Close to half of investments from India were concentrated in manufacturing of vehicles and components, consumer products, rubber and industrial machinery and one-quarter in electricity generation including a coal-fired power station and renewable energy projects. Among Indian projects, manufacturing projects created the most jobs (6341).
• A US$6.4bn construction project in the real estate sector in Johannesburg in 2014 was China’s single largest business activity. The capital investment accounted for more than half of China’s investment in South Africa. Besides this construction project, manufacturing activities in the metals, electronic components and automotive sectors attracted one quarter of capital investments. These manufacturing investments created over 17 000 jobs. In addition, China also invested a substantial amount in logistics, distribution and transportation.
Source: fDi Markets, 2018
Country Number of Projects
Jobs Created
Capex(US$m)
Sector
Russia 1 1012 320 Extraction
7 182 72 Business Services
8 142 57 Sales, Marketing & Support
1 142 18 Maintenance & Servicing
17 1478 466 Total
69%US$466m15%
12%4%
Country Number of Projects
Jobs Created
Capex (US$m)
Sector
Brazil 2 188 42 Education & Training
3 34 14 Business Services
1 400 10 Manufacturing
1 14 6 Sales, Marketing & Support
7 636 72 Total
58%US$72m
19%
14%
9%
31
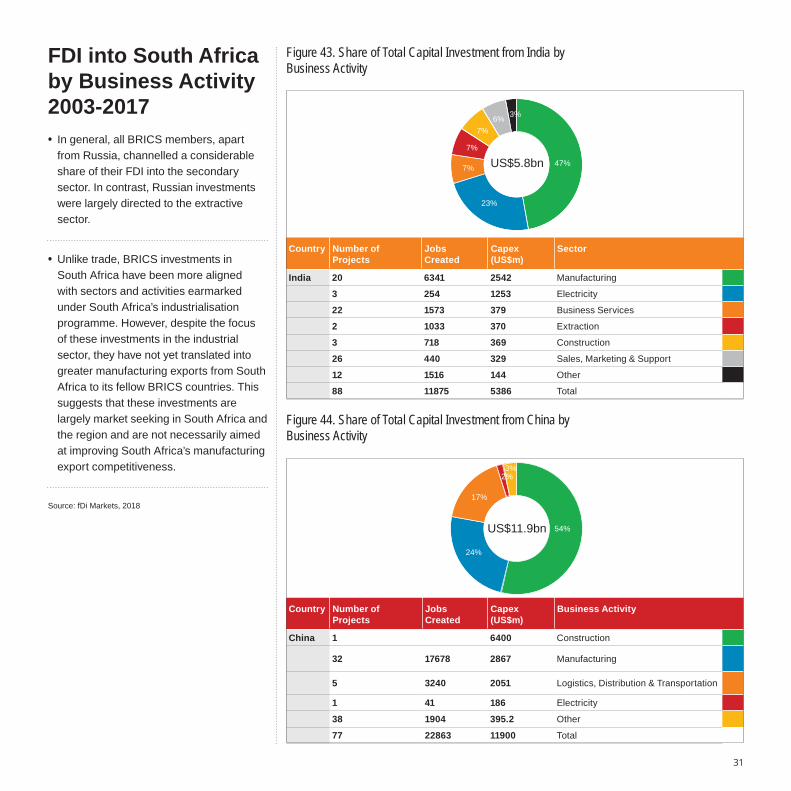
FDI into South Africa by Business Activity 2003-2017 • In general, all BRICS members, apart from Russia, channelled a considerable share of their FDI into the secondary sector. In contrast, Russian investments were largely directed to the extractive sector.
• Unlike trade, BRICS investments in South Africa have been more aligned with sectors and activities earmarked under South Africa’s industrialisation programme. However, despite the focus of these investments in the industrial sector, they have not yet translated into greater manufacturing exports from South Africa to its fellow BRICS countries. This suggests that these investments are largely market seeking in South Africa and the region and are not necessarily aimed at improving South Africa’s manufacturing export competitiveness.
Source: fDi Markets, 2018
Figure 43. Share of Total Capital Investment from India by Business Activity
Country Number of Projects
Jobs Created
Capex (US$m)
Business Activity
China 1 6400 Construction
32 17678 2867 Manufacturing
5 3240 2051 Logistics, Distribution & Transportation
1 41 186 Electricity
38 1904 395.2 Other
77 22863 11900 Total
Figure 44. Share of Total Capital Investment from China by Business Activity
Country Number of Projects
Jobs Created
Capex (US$m)
Sector
India 20 6341 2542 Manufacturing
3 254 1253 Electricity
22 1573 379 Business Services
2 1033 370 Extraction
3 718 369 Construction
26 440 329 Sales, Marketing & Support
12 1516 144 Other
88 11875 5386 Total
54%US$11.9bn
24%
17%
3%2%
47%US$5.8bn
23%
7%
7%
7%6% 3%
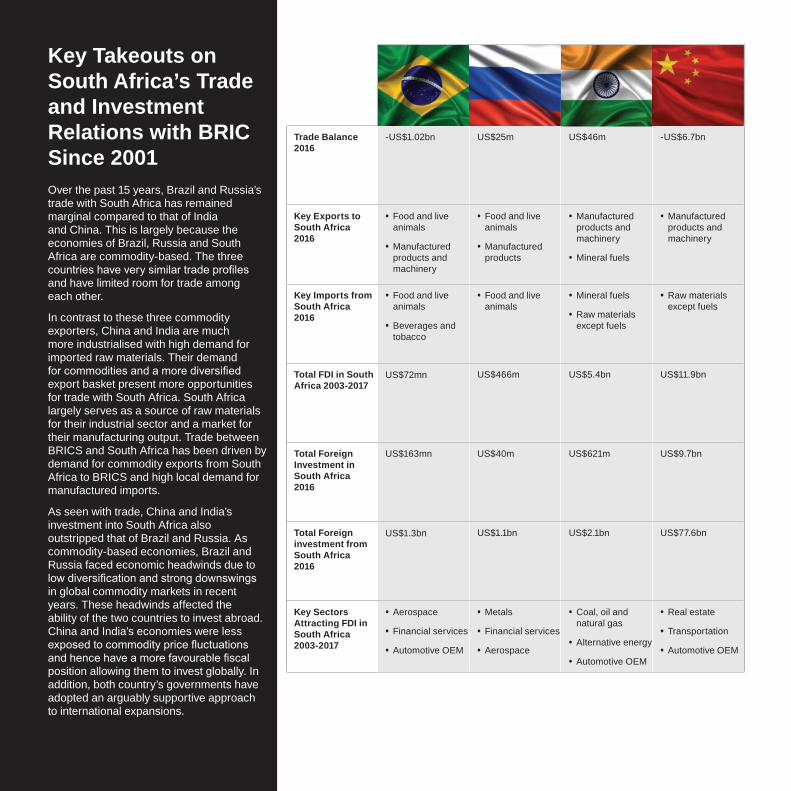
Key Takeouts on South Africa’s Trade and InvestmentRelations with BRIC Since 2001Over the past 15 years, Brazil and Russia’s trade with South Africa has remained marginal compared to that of India and China. This is largely because the economies of Brazil, Russia and South Africa are commodity-based. The three countries have very similar trade profi les and have limited room for trade among each other.
In contrast to these three commodity exporters, China and India are much more industrialised with high demand for imported raw materials. Their demand for commodities and a more diversifi ed export basket present more opportunities for trade with South Africa. South Africa largely serves as a source of raw materials for their industrial sector and a market for their manufacturing output. Trade between BRICS and South Africa has been driven by demand for commodity exports from South Africa to BRICS and high local demand for manufactured imports.
As seen with trade, China and India’s investment into South Africa also outstripped that of Brazil and Russia. As commodity-based economies, Brazil and Russia faced economic headwinds due to low diversifi cation and strong downswings in global commodity markets in recent years. These headwinds affected the ability of the two countries to invest abroad. China and India’s economies were less exposed to commodity price fl uctuations and hence have a more favourable fi scal position allowing them to invest globally. In addition, both country’s governments have adopted an arguably supportive approach to international expansions.
32
Russia India China
Trade Balance 2016
-US$1.02bn US$25m US$46m -US$6.7bn
Key Exports to South Africa 2016
• Food and live animals
• Manufactured products and machinery
• Food and live animals
• Manufactured products
• Manufactured products and machinery
• Mineral fuels
• Manufactured products and machinery
Key Imports from South Africa 2016
• Food and live animals
• Beverages and tobacco
• Food and live animals
• Mineral fuels
• Raw materials except fuels
• Raw materials except fuels
Total FDI in South Africa 2003-2017
US$72mn US$466m US$5.4bn US$11.9bn
Total Foreign Investment in South Africa 2016
US$163mn US$40m US$621m US$9.7bn
Total Foreign investment from South Africa 2016
US$1.3bn US$1.1bn US$2.1bn US$77.6bn
Key Sectors Attracting FDI in South Africa 2003-2017
• Aerospace
• Financial services
• Automotive OEM
• Metals
• Financial services
• Aerospace
• Coal, oil and natural gas
• Alternative energy
• Automotive OEM
• Real estate
• Transportation
• Automotive OEM
Doing Business in BRICS Key Factors to Consider
Key Government Departments for Foreign Investors
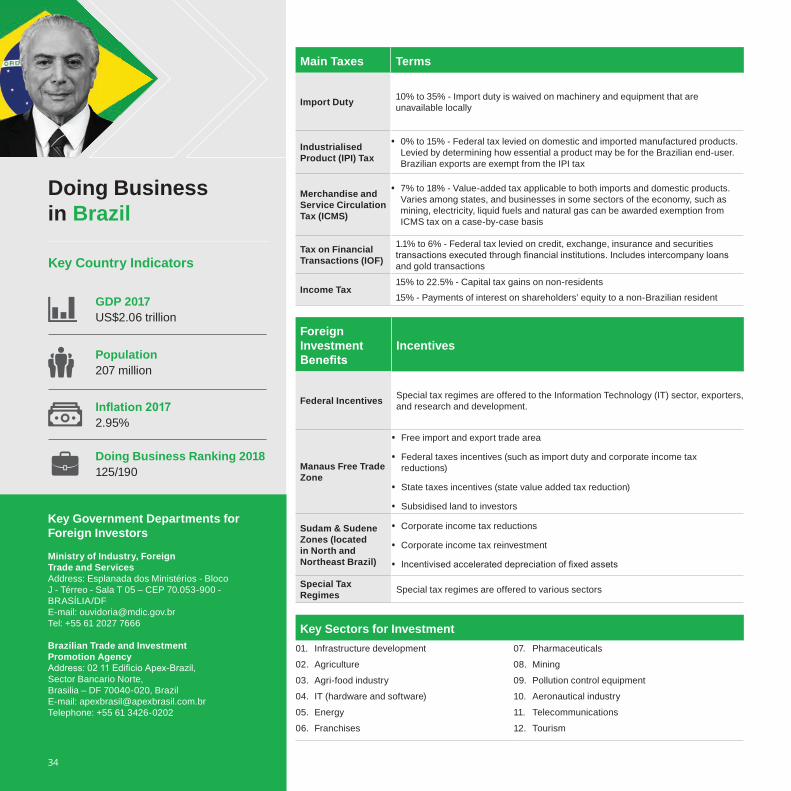
Ministry of Industry, Foreign Trade and ServicesAddress: Esplanada dos Ministérios - Bloco J - Térreo - Sala T 05 – CEP 70.053-900 - BRASÍLIA/DFE-mail: [email protected]: +55 61 2027 7666
Brazilian Trade and Investment Promotion AgencyAddress: 02 11 Edifi cio Apex-Brazil, Sector Bancario Norte, Brasilia – DF 70040-020, BrazilE-mail: [email protected] Telephone: +55 61 3426-0202
Foreign Investment Benefi ts
Incentives
Federal Incentives Special tax regimes are offered to the Information Technology (IT) sector, exporters, and research and development.
Manaus Free Trade Zone
• Free import and export trade area
• Federal taxes incentives (such as import duty and corporate income tax reductions)
• State taxes incentives (state value added tax reduction)
• Subsidised land to investors
Sudam & Sudene Zones (located in North and Northeast Brazil)
• Corporate income tax reductions
• Corporate income tax reinvestment
• Incentivised accelerated depreciation of fi xed assets
Special Tax Regimes Special tax regimes are offered to various sectors
Main Taxes Terms
Import Duty 10% to 35% - Import duty is waived on machinery and equipment that are unavailable locally
Industrialised Product (IPI) Tax
• 0% to 15% - Federal tax levied on domestic and imported manufactured products. Levied by determining how essential a product may be for the Brazilian end-user. Brazilian exports are exempt from the IPI tax
Merchandise and Service Circulation Tax (ICMS)
• 7% to 18% - Value-added tax applicable to both imports and domestic products. Varies among states, and businesses in some sectors of the economy, such as mining, electricity, liquid fuels and natural gas can be awarded exemption from ICMS tax on a case-by-case basis
Tax on Financial Transactions (IOF)
1.1% to 6% - Federal tax levied on credit, exchange, insurance and securities transactions executed through fi nancial institutions. Includes intercompany loans and gold transactions
Income Tax 15% to 22.5% - Capital tax gains on non-residents
15% - Payments of interest on shareholders’ equity to a non-Brazilian resident
Key Sectors for Investment01. Infrastructure development
02. Agriculture
03. Agri-food industry
04. IT (hardware and software)
05. Energy
06. Franchises
07. Pharmaceuticals
08. Mining
09. Pollution control equipment
10. Aeronautical industry
11. Telecommunications
12. Tourism
34
Doing Business in Brazil
GDP 2017 US$2.06 trillion
Infl ation 2017 2.95%
Population 207 million
Doing Business Ranking 2018 125/190
Key Country Indicators
35
Key Government Departments forForeign Investors
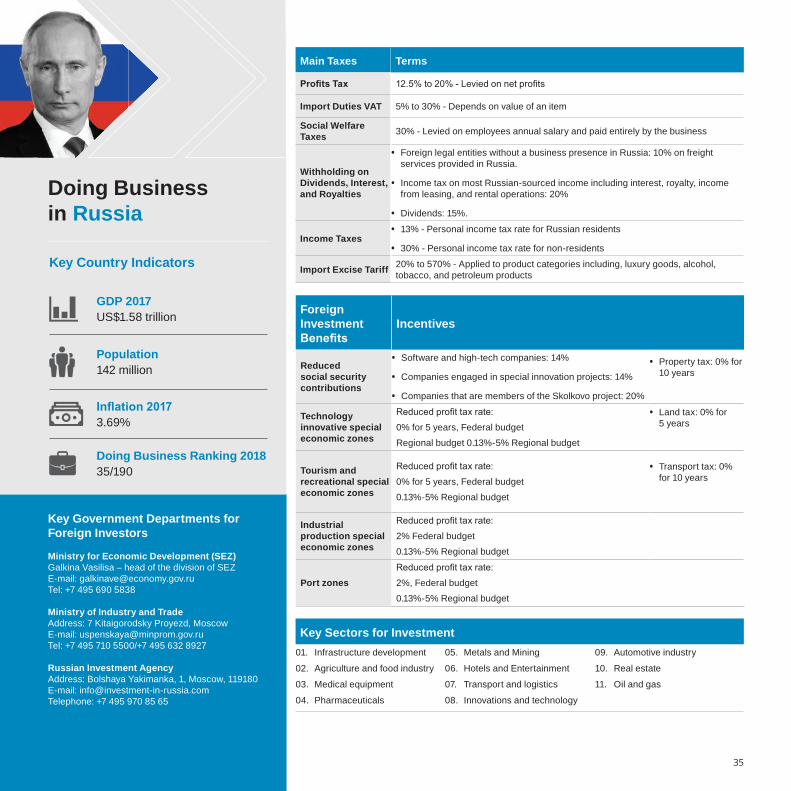
Ministry for Economic Development (SEZ)Galkina Vasilisa – head of the division of SEZE-mail: [email protected]: +7 495 690 5838
Ministry of Industry and TradeAddress: 7 Kitaigorodsky Proyezd, MoscowE-mail: [email protected]: +7 495 710 5500/+7 495 632 8927
Russian Investment AgencyAddress: Bolshaya Yakimanka, 1, Moscow, 119180E-mail: [email protected] Telephone: +7 495 970 85 65
Foreign Investment Benefi ts
Incentives
Reduced social security contributions
• Software and high-tech companies: 14%
• Companies engaged in special innovation projects: 14%
• Companies that are members of the Skolkovo project: 20%
• Property tax: 0% for 10 years
Technology innovative special economic zones
Reduced profi t tax rate:
0% for 5 years, Federal budget
Regional budget 0.13%-5% Regional budget
• Land tax: 0% for 5 years
Tourism and recreational special economic zones
Reduced profi t tax rate:
0% for 5 years, Federal budget
0.13%-5% Regional budget
• Transport tax: 0% for 10 years
Industrial production special economic zones
Reduced profi t tax rate:
2% Federal budget
0.13%-5% Regional budget
Port zonesReduced profi t tax rate:
2%, Federal budget
0.13%-5% Regional budget
Main Taxes Terms
Profi ts Tax 12.5% to 20% - Levied on net profi ts
Import Duties VAT 5% to 30% - Depends on value of an item
Social Welfare Taxes 30% - Levied on employees annual salary and paid entirely by the business
Withholding on Dividends, Interest, and Royalties
• Foreign legal entities without a business presence in Russia: 10% on freight services provided in Russia.
• Income tax on most Russian-sourced income including interest, royalty, income from leasing, and rental operations: 20%
• Dividends: 15%.
Income Taxes • 13% - Personal income tax rate for Russian residents
• 30% - Personal income tax rate for non-residents
Import Excise Tariff 20% to 570% - Applied to product categories including, luxury goods, alcohol, tobacco, and petroleum products
Key Sectors for Investment01. Infrastructure development
02. Agriculture and food industry
03. Medical equipment
04. Pharmaceuticals
05. Metals and Mining
06. Hotels and Entertainment
07. Transport and logistics
08. Innovations and technology
09. Automotive industry
10. Real estate
11. Oil and gas
Doing Business in Russia
Key Country Indicators
GDP 2017 US$1.58 trillion
Infl ation 2017 3.69%
Population 142 million
Doing Business Ranking 2018 35/190
Key Government Departments for Foreign Investors
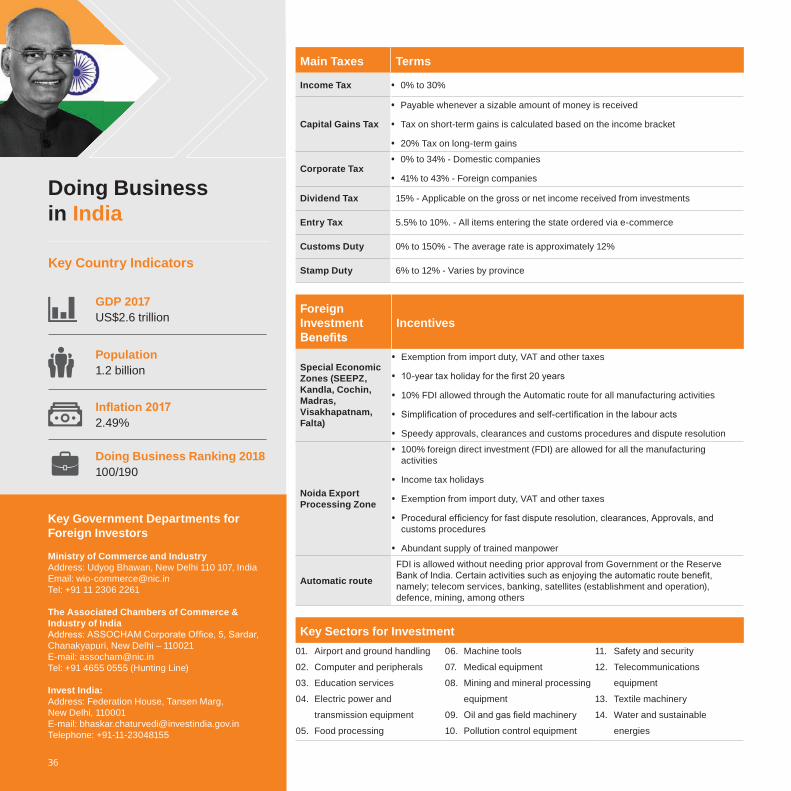
Ministry of Commerce and Industry Address: Udyog Bhawan, New Delhi 110 107, IndiaEmail: [email protected]: +91 11 2306 2261
The Associated Chambers of Commerce & Industry of IndiaAddress: ASSOCHAM Corporate Offi ce, 5, Sardar, Chanakyapuri, New Delhi – 110021E-mail: [email protected]: +91 4655 0555 (Hunting Line)
Invest India: Address: Federation House, Tansen Marg, New Delhi, 110001E-mail: [email protected] Telephone: +91-11-23048155
Foreign Investment Benefi ts
Incentives
Special Economic Zones (SEEPZ, Kandla, Cochin, Madras, Visakhapatnam, Falta)
• Exemption from import duty, VAT and other taxes
• 10-year tax holiday for the fi rst 20 years
• 10% FDI allowed through the Automatic route for all manufacturing activities
• Simplifi cation of procedures and self-certifi cation in the labour acts
• Speedy approvals, clearances and customs procedures and dispute resolution
Noida Export Processing Zone
• 100% foreign direct investment (FDI) are allowed for all the manufacturing activities
• Income tax holidays
• Exemption from import duty, VAT and other taxes
• Procedural effi ciency for fast dispute resolution, clearances, Approvals, and customs procedures
• Abundant supply of trained manpower
Automatic route
FDI is allowed without needing prior approval from Government or the Reserve Bank of India. Certain activities such as enjoying the automatic route benefi t, namely; telecom services, banking, satellites (establishment and operation), defence, mining, among others
Main Taxes Terms
Income Tax • 0% to 30%
Capital Gains Tax
• Payable whenever a sizable amount of money is received
• Tax on short-term gains is calculated based on the income bracket
• 20% Tax on long-term gains
Corporate Tax • 0% to 34% - Domestic companies
• 41% to 43% - Foreign companies
Dividend Tax 15% - Applicable on the gross or net income received from investments
Entry Tax 5.5% to 10%. - All items entering the state ordered via e-commerce
Customs Duty 0% to 150% - The average rate is approximately 12%
Stamp Duty 6% to 12% - Varies by province
Key Sectors for Investment01. Airport and ground handling
02. Computer and peripherals
03. Education services
04. Electric power and
transmission equipment
05. Food processing
06. Machine tools
07. Medical equipment
08. Mining and mineral processing
equipment
09. Oil and gas fi eld machinery
10. Pollution control equipment
11. Safety and security
12. Telecommunications
equipment
13. Textile machinery
14. Water and sustainable
energies
36
Doing Business in India
GDP 2017 US$2.6 trillion
Infl ation 2017 2.49%
Population 1.2 billion
Doing Business Ranking 2018 100/190
Key Country Indicators
37
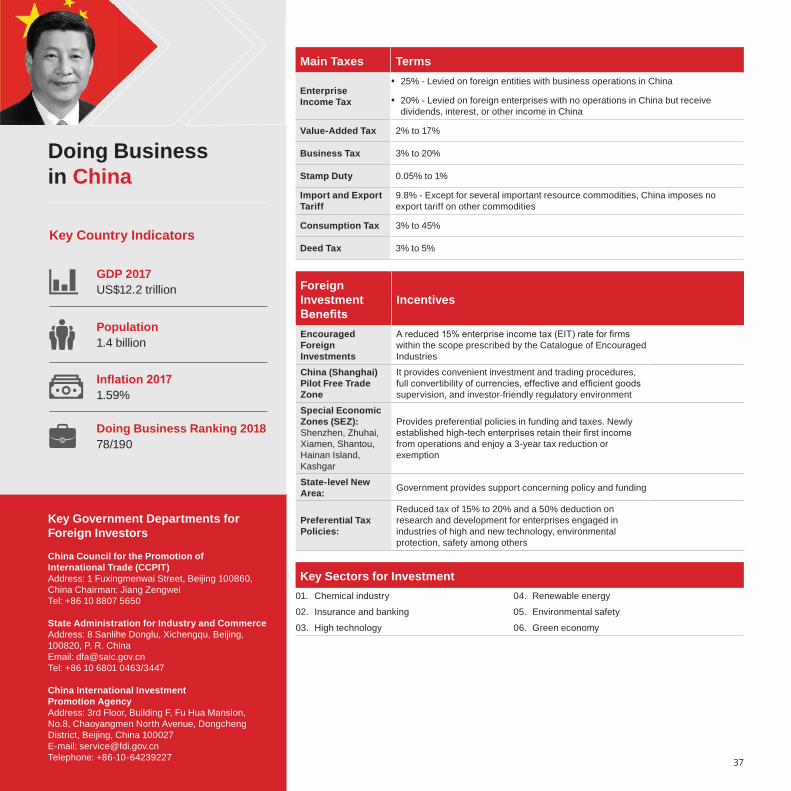
Foreign Investment Benefi ts
Incentives
Encouraged Foreign Investments
A reduced 15% enterprise income tax (EIT) rate for fi rms within the scope prescribed by the Catalogue of Encouraged Industries
China (Shanghai) Pilot Free Trade Zone
It provides convenient investment and trading procedures, full convertibility of currencies, effective and effi cient goods supervision, and investor-friendly regulatory environment
Special Economic Zones (SEZ): Shenzhen, Zhuhai, Xiamen, Shantou, Hainan Island, Kashgar
Provides preferential policies in funding and taxes. Newly established high-tech enterprises retain their fi rst income from operations and enjoy a 3-year tax reduction or exemption
State-level New Area: Government provides support concerning policy and funding
Preferential Tax Policies:
Reduced tax of 15% to 20% and a 50% deduction on research and development for enterprises engaged in industries of high and new technology, environmental protection, safety among others
Main Taxes Terms
Enterprise Income Tax
• 25% - Levied on foreign entities with business operations in China
• 20% - Levied on foreign enterprises with no operations in China but receive dividends, interest, or other income in China
Value-Added Tax 2% to 17%
Business Tax 3% to 20%
Stamp Duty 0.05% to 1%
Import and Export Tariff
9.8% - Except for several important resource commodities, China imposes no export tariff on other commodities
Consumption Tax 3% to 45%
Deed Tax 3% to 5%
Key Government Departments for Foreign Investors
China Council for the Promotion ofInternational Trade (CCPIT)Address: 1 Fuxingmenwai Street, Beijing 100860, China Chairman: Jiang ZengweiTel: +86 10 8807 5650
State Administration for Industry and CommerceAddress: 8 Sanlihe Donglu, Xichengqu, Beijing, 100820, P. R. ChinaEmail: [email protected]: +86 10 6801 0463/3447
China International Investment Promotion AgencyAddress: 3rd Floor, Building F, Fu Hua Mansion, No.8, Chaoyangmen North Avenue, Dongcheng District, Beijing, China 100027E-mail: [email protected]: +86-10-64239227
Key Sectors for Investment01. Chemical industry
02. Insurance and banking
03. High technology
04. Renewable energy
05. Environmental safety
06. Green economy
Doing Business in China
Key Country Indicators
GDP 2017 US$12.2 trillion
Infl ation 2017 1.59%
Population 1.4 billion
Doing Business Ranking 2018 78/190
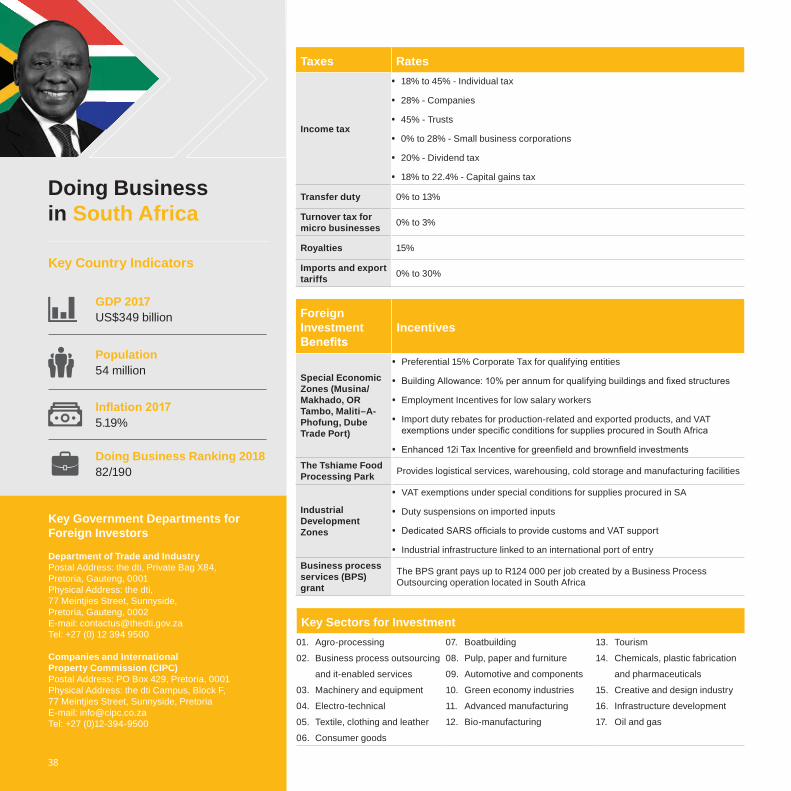
Foreign Investment Benefi ts
Incentives
Special Economic Zones (Musina/Makhado, OR Tambo, Maliti–A-Phofung, Dube Trade Port)
• Preferential 15% Corporate Tax for qualifying entities
• Building Allowance: 10% per annum for qualifying buildings and fi xed structures
• Employment Incentives for low salary workers
• Import duty rebates for production-related and exported products, and VAT exemptions under specifi c conditions for supplies procured in South Africa
• Enhanced 12i Tax Incentive for greenfi eld and brownfi eld investments
The Tshiame Food Processing Park Provides logistical services, warehousing, cold storage and manufacturing facilities
Industrial Development Zones
• VAT exemptions under special conditions for supplies procured in SA
• Duty suspensions on imported inputs
• Dedicated SARS offi cials to provide customs and VAT support
• Industrial infrastructure linked to an international port of entry
Business process services (BPS) grant
The BPS grant pays up to R124 000 per job created by a Business Process Outsourcing operation located in South Africa
Taxes Rates
Income tax
• 18% to 45% - Individual tax
• 28% - Companies
• 45% - Trusts
• 0% to 28% - Small business corporations
• 20% - Dividend tax
• 18% to 22.4% - Capital gains tax
Transfer duty 0% to 13%
Turnover tax for micro businesses 0% to 3%
Royalties 15%
Imports and export tariffs 0% to 30%
Key Government Departments for Foreign Investors Department of Trade and IndustryPostal Address: the dti, Private Bag X84, Pretoria, Gauteng, 0001Physical Address: the dti, 77 Meintjies Street, Sunnyside, Pretoria, Gauteng, 0002E-mail: [email protected]: +27 (0) 12 394 9500
Companies and International Property Commission (CIPC) Postal Address: PO Box 429, Pretoria, 0001Physical Address: the dti Campus, Block F,77 Meintjies Street, Sunnyside, PretoriaE-mail: [email protected]: +27 (0)12-394-9500
Key Sectors for Investment01. Agro-processing
02. Business process outsourcing
and it-enabled services
03. Machinery and equipment
04. Electro-technical
05. Textile, clothing and leather
06. Consumer goods
07. Boatbuilding
08. Pulp, paper and furniture
09. Automotive and components
10. Green economy industries
11. Advanced manufacturing
12. Bio-manufacturing
13. Tourism
14. Chemicals, plastic fabrication
and pharmaceuticals
15. Creative and design industry
16. Infrastructure development
17. Oil and gas
38
Doing Business in South Africa
GDP 2017 US$349 billion
Infl ation 2017 5.19%
Population 54 million
Doing Business Ranking 2018 82/190
Key Country Indicators
39
Contact
Research Team
Dr Martyn Davies Managing Director, Emerging Markets & Africa Deloitte Africa [email protected]
Simon SchaeferManagerDeloitte & [email protected]
Nazeer EssopPublic Sector Industry LeaderDeloitte [email protected]
Jean-Baptist NkumeConsultantDeloitte [email protected]
Deloitte refers to one or more of Deloitte Touche Tohmatsu Limited, a UK private company limited by guarantee (“DTTL”), its network of member firms, and their related entities. DTTL and each of its member firms are legally separate and independent entities. DTTL (also referred to as “Deloitte Global”) does not provide services to clients. Please see www.deloitte.com/about to learn more about our global network of member firms.
Deloitte provides audit, consulting, financial advisory, risk advisory, tax and related services to public and private clients spanning multiple industries. Deloitte serves four out of five Fortune Global 500® companies through a globally connected network of member firms in more than 150 countries and territories bringing world-class capabilities, insights, and high-quality service to address clients’ most complex business challenges. To learn more about how Deloitte’s approximately 245 000 professionals make an impact that matters, please connect with us on Facebook, LinkedIn, or Twitter.
This communication contains general information only, and none of Deloitte Touche Tohmatsu Limited, its member firms, or their related entities (collectively, the “Deloitte network”) is, by means of this communication, rendering professional advice or services. Before making any decision or taking any action that may affect your finances or your business, you should consult a qualified professional adviser. No entity in the Deloitte network shall be responsible for any loss whatsoever sustained by any person who relies on this communication.
© 2018. For information, contact Deloitte Touche Tohmatsu Limited
Designed and produced by Creative Services at Deloitte, Johannesburg. (815046/Jar)