Embed Size (px)
Citation preview

Mikada, H., Moore, G.F., Taira, A., Becker, K., Moore, J.C., and Klaus, A. (Eds.)Proceedings of the Ocean Drilling Program, Scientific Results Volume 190/196
11. AN EMPIRICAL RELATIONSHIP BETWEEN VELOCITY AND POROSITY FOR UNDERTHRUST SEDIMENTS IN THE NANKAI TROUGH ACCRETIONARY PRISM1
Nicole W. Hoffman2 and Harold J. Tobin2
ABSTRACT
An empirical relationship between compressional wave velocity andporosity was developed for underthrust sediments in the Shikoku Basinof the Nankai accretionary prism. Shipboard core and logging measure-ments of velocity and porosity from Ocean Drilling Program Legs 131,190, and 196 were used to define a new velocity-porosity transformbased on an existing formulation. The new transform includes a criticalporosity transition. Corrections were calculated and applied to ship-board core measurements to account for unloading from in situ condi-tions. The results from the velocity-porosity transform indicate theShikoku Basin sediments follow a normal consolidation curve. A criticalporosity transition is crossed at a fractional porosity of ~0.30 betweenthe protothrust and frontal thrust zones of the accretionary prism. Al-though an accurate critical porosity transition was fit to these data, thecritical porosity transition occurs over a range of porosity. The ShikokuBasin formulation represents a significant improvement over previousvelocity-porosity formulations.
INTRODUCTION
The Nankai Trough accretionary prism of southwest Japan (Fig. F1)provides an excellent setting to study the evolution of a clastic prism.
F1. Location of ODP Sites 1173, 1174, and 808, p. 12.
132°E 134° 136°
1173117311741174
1175117511761176
11781178
808808
KinanKinanSeamountsSeamounts
Shikoku Island
CapeMuroto
Nankai
Nankai
Troughough
432
1
4
3
2
1
32°
34°N
1Hoffman, N.W., and Tobin, H.J., 2004. An empirical relationship between velocity and porosity for underthrust sediments in the Nankai Trough accretionary prism. In Mikada, H., Moore, G.F., Taira, A., Becker, K., Moore, J.C., and Klaus, A. (Eds.), Proc. ODP, Sci. Results, 190/196, 1–23 [Online]. Available from World Wide Web: <http://www-odp.tamu.edu/publications/190196SR/VOLUME/CHAPTERS/355.PDF>. [Cited YYYY-MM-DD]2Department of Earth and Environmental Science, New Mexico Institute of Mining and Technology, 801 Leroy Place, Socorro NM 87801, USA. Correspondence author: [email protected]
Initial receipt: 5 December 2003Acceptance: 5 August 2004Web publication: 26 October 2004Ms 196SR-355

N.W. HOFFMAN AND H.J. TOBINVELOCITY AND POROSITY RELATIONSHIP 2
Research during Ocean Drilling Program (ODP) Legs 131, 190, and 196focused on the physical properties of the sediments in the Shikoku Ba-sin (e.g., porosity, pore pressure, and velocity) in order to characterizeboth the initial state of the sediments and the alteration that occursduring initial accretion, underthrusting, and décollement formation(e.g., Moore et al., 2001).
The location of the décollement in an accretionary prism is con-trolled by the existence of high pore pressures in the underthrust sedi-ments (e.g., Davis et al., 1983; Moore, 1989). Because the porosity andpore pressure in the underthrust sediments were only measured at dis-crete drilling locations, little is known about variations in these proper-ties in the underthrust sediments. A conversion between marine seismicreflection velocity data and porosity would provide information on po-rosity variations throughout the underthrust section.
Numerous studies have been conducted to determine velocity-poros-ity transforms for a variety of sediment and rock types (e.g., Wyllie etal., 1958; Raymer et al., 1980). In this paper, we present a velocity-porosity transform for the Shikoku Basin underthrust sediments basedon the global empirical relationship derived by Erickson and Jarrard(1998). Their analysis of high-porosity siliciclastic sediments in the Am-azon Fan is based on a critical porosity formulation and accurately pre-dicts velocity over a large range of porosity. The formulation for theShikoku Basin sediments represents a significant improvement overpreviously determined relationships for the Nankai sediments (e.g.,Hyndman et al., 1993).
GEOLOGIC SETTING AND SITE DESCRIPTIONS
The Nankai Trough is the subduction boundary between the Eur-asian plate and the Shikoku Basin on the Philippine Sea plate. Core-and logging-based measurements obtained during ODP Legs 131, 190,and 196 from Sites 1173, 1174, and 808 define a transect across thezones of initial sediment accretion and underthrust (Figs. F1, F2). Theentire underthrust section beneath the basal décollement fault wassampled at all three sites with cores and a limited number of wirelineand logging-while-drilling (LWD) logs.
Site 1173 (Fig. F2) is the seaward reference site, where there is littleevidence for tectonic deformation in the sediments. This site was sam-pled in order to define the state of the sediments seaward of the defor-mation front. Site 1174 (Fig. F2) is located in the protothrust zone,where there is incipient deformation and the décollement has becomewell developed. However, the sediments below the décollement zoneshow little tectonic deformation. Site 808 (Fig. F2) is located on the sea-ward edge of the imbricate thrust zone, where the décollement is al-ready well developed. This site was sampled in order to obtain datafrom both the frontal thrust and décollement zones.
The sediments at Sites 1173, 1174, and 808 are primarily composedof the upper and lower Shikoku Basin facies (Fig. F3) (Shipboard Scien-tific Party, 2001b). The upper Shikoku Basin sediments vary in composi-tion between silty clay and clayey silt and, with increasing compaction,become silty claystone and clayey siltstone. Interbedded volcanic ashlayers are common, ranging in thickness from 1–2 cm up to 25 cm,with many beds 5–15 cm thick. The lower Shikoku Basin sediments area typical hemipelagic deposit and consist predominantly of silty clay-
F2. Major structural features based on seismic reflection data, p. 13.
10 km0
FrontalOOST
Cover sequence Site1176
Site1175
Site1174
Site808
Site1173
Site1178
BSR
Bottom-simulatingreflector (BSR)Slope
basin
VE = 2.5
ShikokuBasin
NankaiTrough
Trench
Landward-dipping reflector zone
(LDRZ)Large thrust-slice zone
(LTSZ)
Frontal out-of-sequence
thrust zone(OOST)
Imbricate thrust zone(ITZ)
Pro
toth
rust
zon
e (P
TZ
)
Frontalthrust
Seismogenic zone?
Dep
th b
elow
sea
leve
l (km
)
5
6
7
8
4
3
2
1
0
F3. Stratigraphic column, Site 1173, p. 14.
Unit IA: outer trench–wedge faciesSand and silt turbidites, hemipelagic mud,rare volcanic ash
Unit IB: trench to basin transition faciesSilt turbidites, hemipelagic mud,volcanic ash
Unit II: upper Shikoku Basin faciesHemipelagic mudstone,abundant volcanic ash
Unit III: lower Shikoku Basin faciesHemipelagic mudstone,rare siliceous claystone,and calcareous claystone
Unit IV: volcaniclastic faciesVariegated mudstone, siliceous tuff
Unit V: basalt basement
100
200
300
400
500
600
700mid
dle
Mio
cene
late
Mio
cene
Plio
cene
Qua
tern
ary
83.37
102.14
343.77
687.99
724.89
0.46
1.25
2.52
4.00
7.20
9.00
11.80
13.60
Hempelagicmud/mudstone
Sandy mud/mudstone
Chaotic stratification,Slump folds
Silt turbidites
Sand turbidites
Volcanic ash
Gravel, pebblymud/mudstone
Age(Ma) Age
Depth(mbsf)
Graphiclithology Lithofacies description
N.W. HOFFMAN AND H.J. TOBINVELOCITY AND POROSITY RELATIONSHIP 3
stone with scattered carbonate-cemented intervals in the middle andlower sections of the unit.
DATA AND IN SITU CORRECTIONS
A variety of core- and logging-based physical property data were col-lected at Sites 1173, 1174, and 808. As both velocity and porosity dataare available from cores for all three sites, we used the shipboard coremeasurements to develop an empirical velocity-porosity relationshipfor the Shikoku Basin underthrust sediments. The only logging data(wireline and LWD) collected across the underthrust section were at Site1173. The available logging data for this site were used in conjunctionwith the core data to determine corrections to be applied for unloadingfrom in situ conditions.
Velocity Data
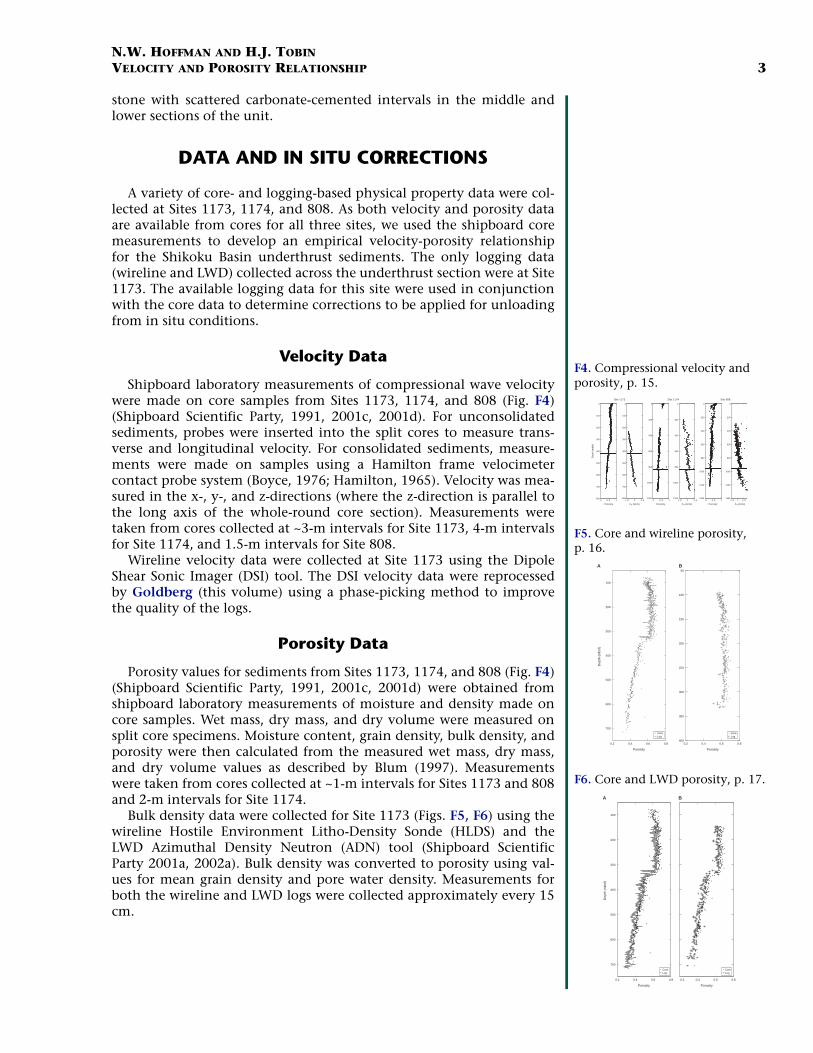
Shipboard laboratory measurements of compressional wave velocitywere made on core samples from Sites 1173, 1174, and 808 (Fig. F4)(Shipboard Scientific Party, 1991, 2001c, 2001d). For unconsolidatedsediments, probes were inserted into the split cores to measure trans-verse and longitudinal velocity. For consolidated sediments, measure-ments were made on samples using a Hamilton frame velocimetercontact probe system (Boyce, 1976; Hamilton, 1965). Velocity was mea-sured in the x-, y-, and z-directions (where the z-direction is parallel tothe long axis of the whole-round core section). Measurements weretaken from cores collected at ~3-m intervals for Site 1173, 4-m intervalsfor Site 1174, and 1.5-m intervals for Site 808.
Wireline velocity data were collected at Site 1173 using the DipoleShear Sonic Imager (DSI) tool. The DSI velocity data were reprocessedby Goldberg (this volume) using a phase-picking method to improvethe quality of the logs.
Porosity Data
Porosity values for sediments from Sites 1173, 1174, and 808 (Fig. F4)(Shipboard Scientific Party, 1991, 2001c, 2001d) were obtained fromshipboard laboratory measurements of moisture and density made oncore samples. Wet mass, dry mass, and dry volume were measured onsplit core specimens. Moisture content, grain density, bulk density, andporosity were then calculated from the measured wet mass, dry mass,and dry volume values as described by Blum (1997). Measurementswere taken from cores collected at ~1-m intervals for Sites 1173 and 808and 2-m intervals for Site 1174.
Bulk density data were collected for Site 1173 (Figs. F5, F6) using thewireline Hostile Environment Litho-Density Sonde (HLDS) and theLWD Azimuthal Density Neutron (ADN) tool (Shipboard ScientificParty 2001a, 2002a). Bulk density was converted to porosity using val-ues for mean grain density and pore water density. Measurements forboth the wireline and LWD logs were collected approximately every 15cm.
F4. Compressional velocity and porosity, p. 15.
0 0. 5 1
0
100
200
300
400
500
600
700
800
Porosity
Dep
th (
mbs
f)
1. 5 2 2. 5
0
100
200
300
400
500
600
700
800
VP (km/s)
0 0. 5 1
0
200
400
600
800
1000
1200
Porosity
1. 5 2 2. 5
0
200
400
600
800
1000
1200
VP (km/s)
0 0. 5 1
0
200
400
600
800
1000
1200
1400
Porosity
1. 5 2 2. 5
0
200
400
600
800
1000
1200
1400
VP (km/s)
Site 1173 Site 1174 Site 808
F6. Core and LWD porosity, p. 17.
0.2 0.4 0.6 0.8
Porosity
Dep
th (
mbs
f)
0.2 0.4 0.6 0.8
Porosity
CoreLog
CoreLog
100
200
300
400
500
600
700
A B
F5. Core and wireline porosity, p. 16.
0.2 0.4 0.6 0.8
Porosity
Dep
th (
mbs
f)
0.2 0.4 0.6 0.8
Porosity
CoreLog
CoreLog
100
200
300
400
500
600
700
50
100
150
200
250
300
350
400
A B

N.W. HOFFMAN AND H.J. TOBINVELOCITY AND POROSITY RELATIONSHIP 4
In Situ Corrections
Corrections were applied to the raw core data to account for unload-ing from in situ conditions. As samples are unloaded from pressure atdepth, the samples undergo a decrease in grain contact stress, whichcauses both an increase in porosity and a decrease in seismic velocity.Corrections to velocity and porosity values were made by comparingthe core data to available wireline and LWD data at correspondingdepths. Because the most complete combination of core and loggingdata are available for Site 1173, this site was used as a standard to calcu-late the in situ corrections applied to core measurements from all threesites.
Porosity Correction
The Site 1173 core porosity values were compared to both wirelineand LWD porosity values. As the core and logging measurements werenot sampled at the same depths, a data set with matching depths wasneeded. Using the depths where core measurements were available, log-ging (wireline and LWD) data were selected for depths located ±10 cmfrom each core sample depth. The difference between the core and log-ging data sets was then calculated by subtracting the values at thematching depths. The difference between the core and logging data ap-pears to be constant with depth when comparing the core data to boththe wireline (Fig. F5) and LWD (Fig. F6) data. For the core-wireline com-parison, the mean fractional porosity offset is 0.0277 ± 0.0200 (core po-rosity is greater than logging porosity). For the core-LWD comparison,the mean difference is 0.0307 ± 0.0249. Taking the average of these twovalues, the in situ correction we have chosen to apply to the core data isa constant value of 0.0289, which has an error of ±0.0224. This correc-tion was applied to the core porosity data for Sites 1173, 1174, and 808.
Velocity Correction
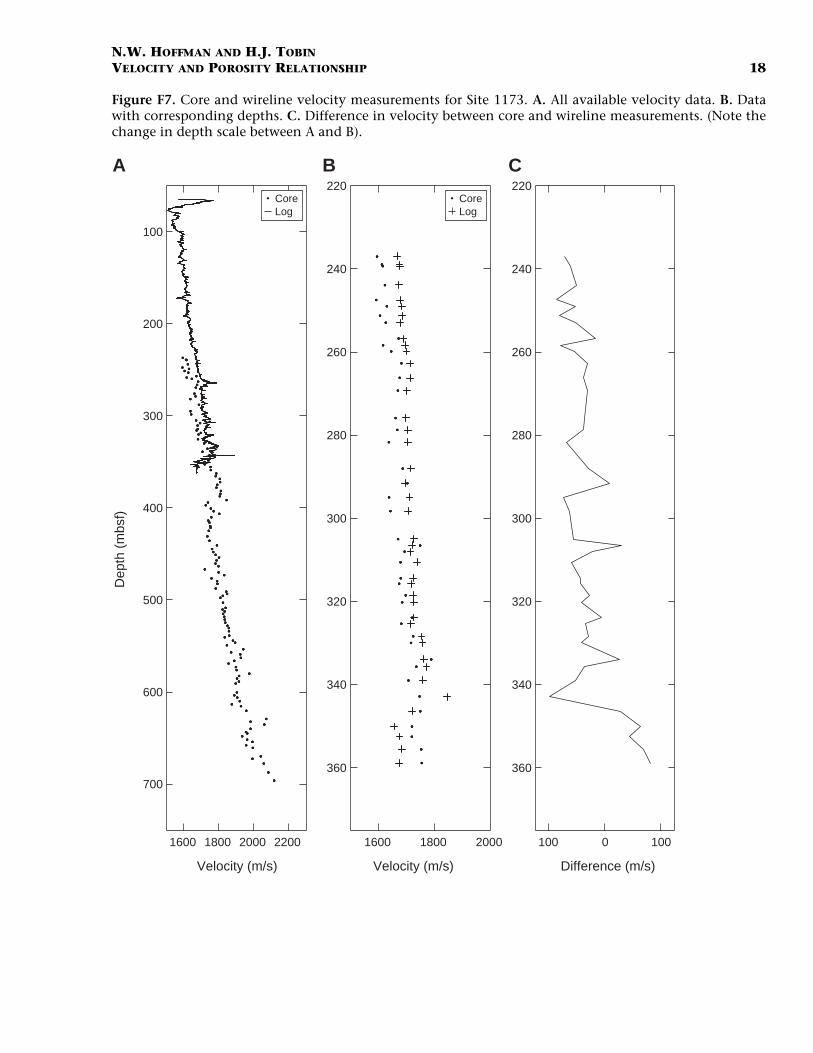
The wireline DSI data from Site 1173, reprocessed by Goldberg (thisvolume), was used to determine the in situ velocity correction. Thewireline velocities deviate from a general trend of increasing velocityand begin to decrease at ~345 meters below seafloor (mbsf) (Fig. F7),which is the boundary between the upper and lower Shikoku Basin fa-cies. Because of this change in velocity, the in situ correction was calcu-lated based only on the data from above ~340 mbsf.
As for the porosity data sets, core velocity and logging velocity mea-surements were not taken at the same depths. Using the same methoddescribed for the porosity correction, logging data were selected fordepths located ±20 cm from each core depth. The difference betweenthe core and logging data was calculated by subtracting the data sets atthe matching depths.
The difference between the core and wireline velocities is expected toincrease with depth (e.g., Hamilton, 1979); however, the standard devi-ation of the mean difference between the data sets is too large for anydepth-dependent trend to be apparent. Instead, we have chosen to usethe average difference between the core and wireline velocity data of43.39 m/s (with an error of ±29.05 m/s) as a constant in situ correction.This correction was subtracted from the core velocity data for Sites1173, 1174, and 808.
F7. Core and wireline velocity, p. 18.
Dep
th (
mbs
f)
CoreLog
CoreLog
100
200
300
400
500
600
700
220
240
260
280
300
320
340
360
220
240
260
280
300
320
340
360
1600 1800 2000 2200 1600 1800 2000 100 0 100
Velocity (m/s) Velocity (m/s) Difference (m/s)
A B C

N.W. HOFFMAN AND H.J. TOBINVELOCITY AND POROSITY RELATIONSHIP 5
VELOCITY-POROSITY RELATIONSHIP
The Shikoku Basin and Nankai accretionary prism sediments havebeen well imaged using seismic reflection methods (Bangs et al., 1999;Moore et al., 1999). Seismic velocity data are important for providinginformation about the large-scale structure of the prism. Other physicalproperties of the sediments are important for understanding prism hy-drology, sediment mechanical properties, and deformation styles (seeShipboard Scientific Party, 2001b). A conversion between seismic veloc-ity and porosity would provide information about regional porosityvariations in the underthrust sediments by allowing a conversion ofmarine seismic reflection data to porosity.
Numerous studies have been conducted in order to determine a rela-tionship between compressional velocity (or acoustic velocity) and po-rosity for a variety of sediment and rock types. One of the earliest andmost widely used transforms is the Wyllie time-average equation (Wyl-lie et al., 1958). This relationship is only reliable for consolidated sand-stones over a small porosity range of 25%–30% (Raymer et al., 1980).However, corrections need to be made to apply the transform to uncon-solidated sediments. An improved version of the time-average equa-tion, developed by Raymer et al. (1980), eliminates the need for acompaction factor correction but requires the use of a separate equationfor each of three porosity ranges. As neither the Wyllie time-averageequation nor the formulation suggested by Raymer et al. (1980) ade-quately fit the Nankai sediments, Hyndman et al. (1993) used the re-sults of Jarrard et al. (1989) and Han et al. (1986) to fit a smoothpolynomial to Site 808 data. This fitted polynomial is applicable for aporosity range of ~30%–60% using a clay content of 50%.
In order to improve further on previous studies and to determine arelationship that accurately predicts over a large range of porosity,Erickson and Jarrard (1998) completed a statistical analysis of unconsol-idated, high-porosity siliciclastic sediments from the Amazon Fan to de-velop a global velocity-porosity relationship. They identified threedominant variables affecting compressional wave velocity: porosity,shale fraction, and consolidation history. A key element of their formu-lation is the presence of a critical porosity, or a porosity threshold,across which the relationship between velocity and porosity fundamen-tally changes.
Critical Porosity
Raymer at al. (1980) recognized the concept of two separate porositydomains in which velocity exhibits different behaviors. The suspensiondomain for high-porosity rocks describes a medium where solid parti-cles are suspended in the fluid. The consolidated rock domain for low-porosity rocks describes a medium with a continuous frame-supportedmatrix. Nur et al. (1998) define this transition from a suspension to acontinuous matrix as the critical porosity. Most importantly, the criticalporosity transition divides the relationship between velocity and poros-ity into two domains. For porosities greater than the critical porosity,velocity is not strongly dependent on porosity. For values below thecritical porosity, velocity depends strongly on porosity and increasessignificantly with a small decrease in porosity.
It is important to note that the existence of a critical porosity transi-tion does not indicate the transition from a zero-strength suspension to

N.W. HOFFMAN AND H.J. TOBINVELOCITY AND POROSITY RELATIONSHIP 6
a frame-supported regime, but rather a transition where the frame mod-ulus increases beyond a threshold and causes a substantial velocity in-crease (Erickson and Jarrard, 1998).
Shale Fraction
Clay content was evaluated by Erickson and Jarrard (1998) as a possi-ble third-order factor affecting compressional wave velocity. The physi-cal dependence is indirect: clay content can affect porosity, which, inturn, affects velocity. Also, lithology directly affects velocity throughmatrix density and matrix velocity. By removing the effects of porosityand pressure to calculate residual velocities, Erickson and Jarrard (1998)determined that clay content has no direct influence in high-porositysediments. They suggest for high-porosity sediments that the bulk mod-ulus is dominated by the pore fluid modulus and lithology-dependentvariations in the matrix bulk modulus are overwhelmed. However, claycontent is assumed to be an important control on velocity for porositiesof <30% through its direct effect on the aggregate and frame bulk mod-uli (Erickson and Jarrard, 1998).
Because quantitative clay content data were not generally availablefor their logging-based study, Erickson and Jarrard (1998) used an em-pirical “shale fraction” log that is loosely predictive of clay content. Theshale fraction log (vsh) can be calculated by using the gamma ray logand the nonlinear response function for Tertiary rocks (Dresser Atlas,1982):
vsh = 0.083 × 2((3.7 × IGR) – 1) (1)
where IGR = (GRlog – GRsand)/(GRshale–GRsand). The terms GRlog, GRsand,and GRshale are the gamma ray (GR) values in API units. The sand(GRsand) and shale (GRshale) baselines are the minimum and maximumvalues, respectively, in the gamma ray log.
Consolidation History
Consolidation is known to affect the compressional velocities forhigh-porosity sediments (Blangy et al., 1993) by not only affecting theporosity but also the shear and frame bulk moduli by increasing inter-grain contacts (Erickson and Jarrard, 1998). To account for this, separatevelocity-porosity relationships have been determined for what aretermed “normally” and “highly” consolidated sediments. High consoli-dation is often seen with accretionary prism deformation, early cemen-tation, or deep burial. Sedimentary basins are an example of a normalconsolidation environment.
Empirical Velocity-Porosity Relationships
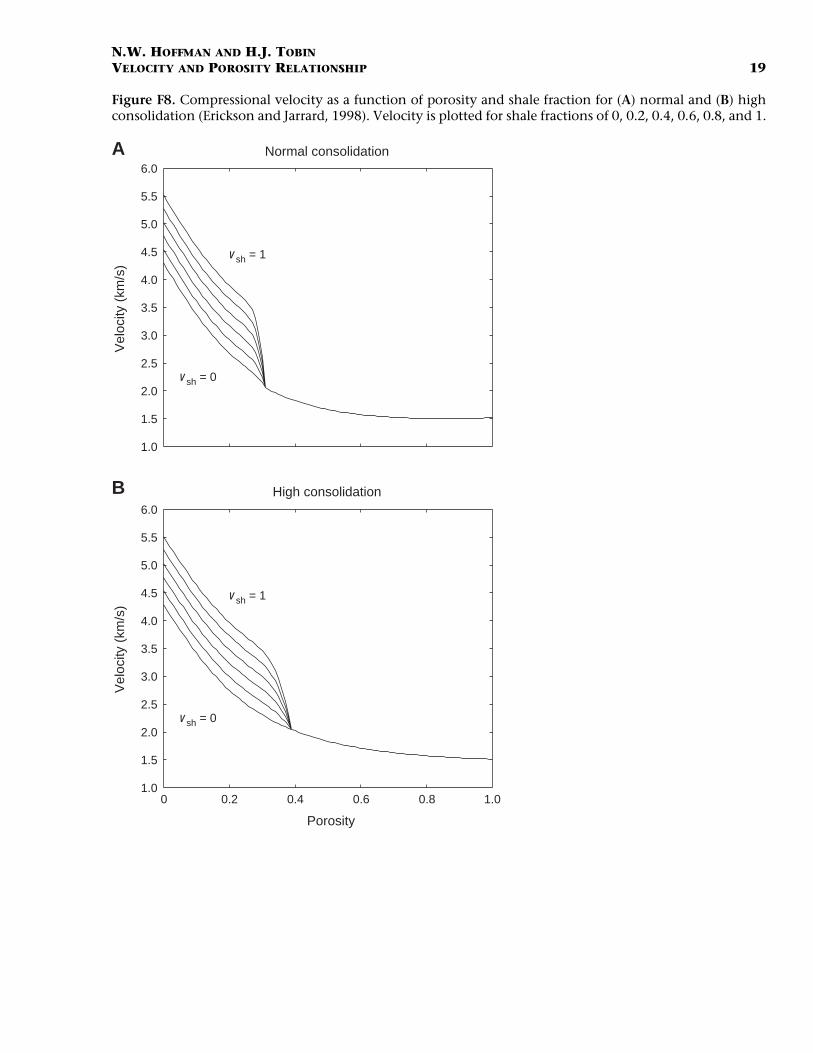
The global empirical relationships for compressional wave velocity(VP) in terms of fractional porosity (φ), shale fraction (vsh), and consoli-dation history are (Erickson and Jarrard, 1998) as follows. Normal con-solidation (Fig. F8):
VP = 0.739 + 0.552φ + 0.305/[(φ + 0.13)2 + 0.0725]
+ 0.61(vsh – 1.123)[X1], (2)
F8. Compressional velocity vs. po-rosity and shale fraction, p. 19.
vsh = 1
vsh = 0
vsh = 1
vsh = 0
0 0.2 0.4 0.6 0.8 1.01.0
1.5
2.0
2.5
3.0
3.5
4.0
4.5
5.0
5.5
6.0
1.0
1.5
2.0
2.5
3.0
3.5
4.0
4.5
5.0
5.5
6.0Normal consolidation
Porosity
High consolidation
Vel
ocity
(km
/s)
A
Vel
ocity
(km
/s)
B
N.W. HOFFMAN AND H.J. TOBINVELOCITY AND POROSITY RELATIONSHIP 7
where X1 = tanh[40(φ – φc)] – |tanh[40(φ – φc)]|; critical porosity (φc) =0.31.
High consolidation (Fig. F8):
VP = 1.11 + 0.178φ + 0.305/[(φ + 0.135)2 + 0.0775]
+ 0.61(vsh – 1)[X2], (3)
where X2 = tanh[20(φ – φc)] – |tanh[20(φ – φc)]|; critical porosity (φc) =0.39.
SHIKOKU BASIN VELOCITY-POROSITY RELATIONSHIP
In situ corrected core-based measurements of velocity and porositywere used for the underthrust sediments from Sites 1173, 1174, and 808to determine the formulation for the velocity-porosity relationship (Fig.F4). For the core velocity values, only measurements in the z-directionwere used, as they correspond to seismic interval velocities.
Shale Fraction
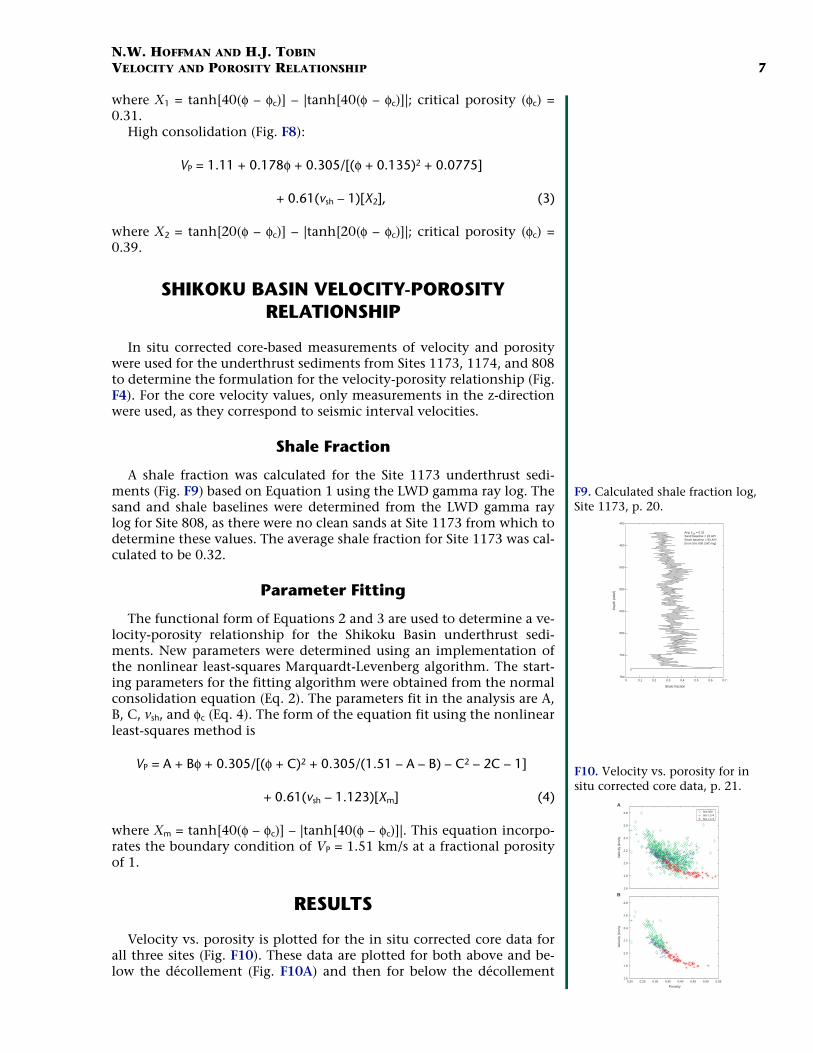
A shale fraction was calculated for the Site 1173 underthrust sedi-ments (Fig. F9) based on Equation 1 using the LWD gamma ray log. Thesand and shale baselines were determined from the LWD gamma raylog for Site 808, as there were no clean sands at Site 1173 from which todetermine these values. The average shale fraction for Site 1173 was cal-culated to be 0.32.
Parameter Fitting
The functional form of Equations 2 and 3 are used to determine a ve-locity-porosity relationship for the Shikoku Basin underthrust sedi-ments. New parameters were determined using an implementation ofthe nonlinear least-squares Marquardt-Levenberg algorithm. The start-ing parameters for the fitting algorithm were obtained from the normalconsolidation equation (Eq. 2). The parameters fit in the analysis are A,B, C, vsh, and φc (Eq. 4). The form of the equation fit using the nonlinearleast-squares method is
VP = A + Bφ + 0.305/[(φ + C)2 + 0.305/(1.51 – A – B) – C2 – 2C – 1]
+ 0.61(vsh – 1.123)[Xm] (4)
where Xm = tanh[40(φ – φc)] – |tanh[40(φ – φc)]|. This equation incorpo-rates the boundary condition of VP = 1.51 km/s at a fractional porosityof 1.
RESULTS
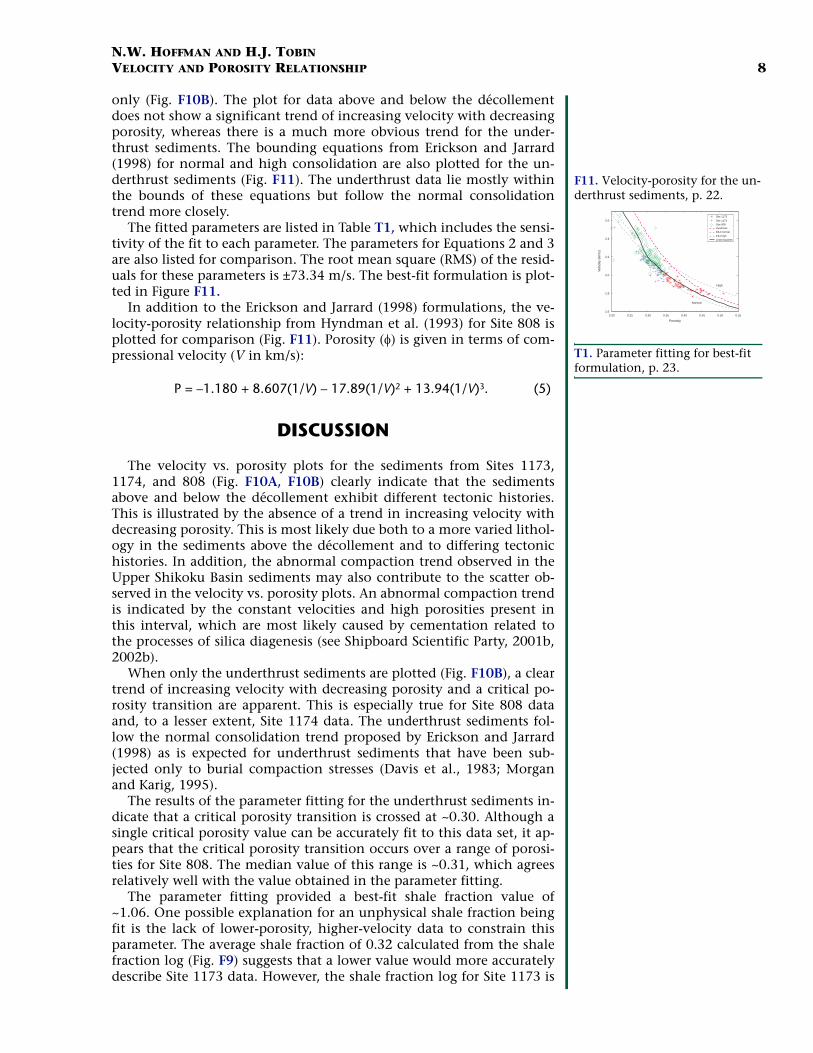
Velocity vs. porosity is plotted for the in situ corrected core data forall three sites (Fig. F10). These data are plotted for both above and be-low the décollement (Fig. F10A) and then for below the décollement
F9. Calculated shale fraction log, Site 1173, p. 20.
Shale fraction
Dep
th (
mbs
f)
Avg. vsh = 0.32Sand baseline = 23 APIShale baseline = 93 API(from Site 808 LWD log)
400
450
500
550
600
650
700
7500 0.1 0.2 0.3 0.4 0.5 0.6 0.7
F10. Velocity vs. porosity for in situ corrected core data, p. 21.
Site 808Site 1174Site 1173
Porosity
1.6
1.8
2.0
2.2
2.4
2.6
2.8
1.6
1.8
2.0
2.2
2.4
2.6
2.8
0.20 0.25 0.30 0.35 0.40 0.45 0.50 0.55
A
B
Vel
ocity
(km
/s)
Vel
ocity
(km
/s)
N.W. HOFFMAN AND H.J. TOBINVELOCITY AND POROSITY RELATIONSHIP 8
only (Fig. F10B). The plot for data above and below the décollementdoes not show a significant trend of increasing velocity with decreasingporosity, whereas there is a much more obvious trend for the under-thrust sediments. The bounding equations from Erickson and Jarrard(1998) for normal and high consolidation are also plotted for the un-derthrust sediments (Fig. F11). The underthrust data lie mostly withinthe bounds of these equations but follow the normal consolidationtrend more closely.
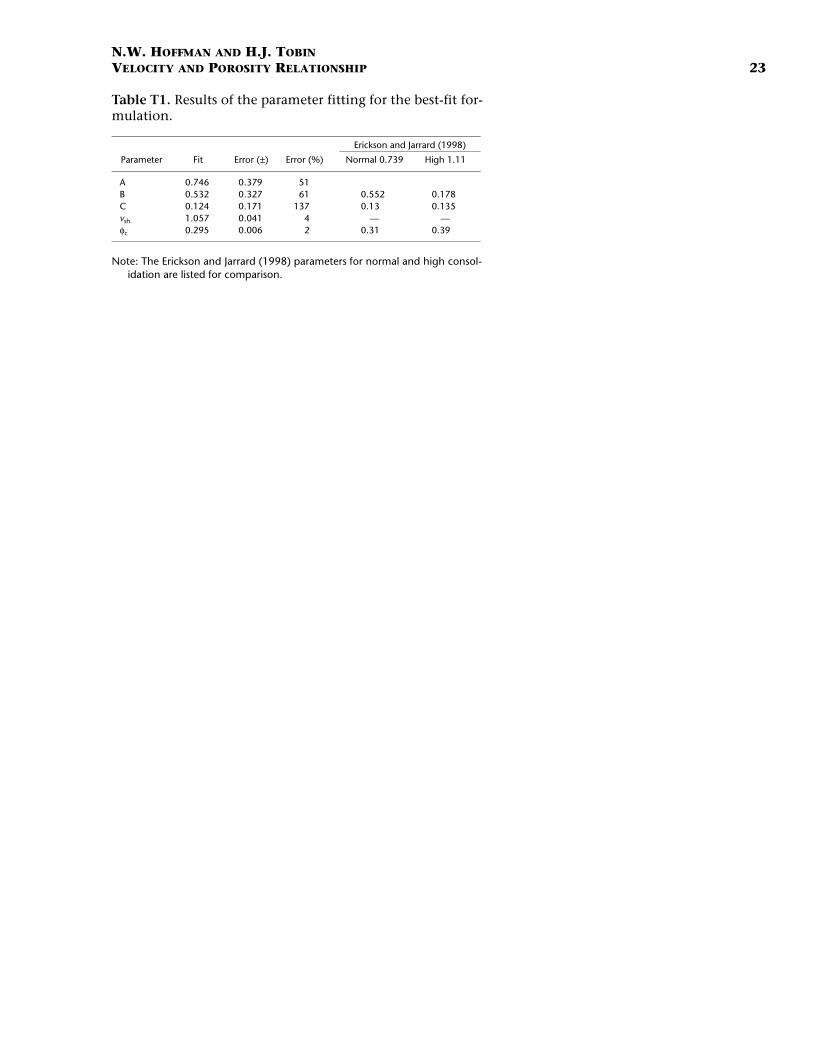
The fitted parameters are listed in Table T1, which includes the sensi-tivity of the fit to each parameter. The parameters for Equations 2 and 3are also listed for comparison. The root mean square (RMS) of the resid-uals for these parameters is ±73.34 m/s. The best-fit formulation is plot-ted in Figure F11.
In addition to the Erickson and Jarrard (1998) formulations, the ve-locity-porosity relationship from Hyndman et al. (1993) for Site 808 isplotted for comparison (Fig. F11). Porosity (�) is given in terms of com-pressional velocity (V in km/s):
P = –1.180 + 8.607(1/V) – 17.89(1/V)2 + 13.94(1/V)3. (5)
DISCUSSION
The velocity vs. porosity plots for the sediments from Sites 1173,1174, and 808 (Fig. F10A, F10B) clearly indicate that the sedimentsabove and below the décollement exhibit different tectonic histories.This is illustrated by the absence of a trend in increasing velocity withdecreasing porosity. This is most likely due both to a more varied lithol-ogy in the sediments above the décollement and to differing tectonichistories. In addition, the abnormal compaction trend observed in theUpper Shikoku Basin sediments may also contribute to the scatter ob-served in the velocity vs. porosity plots. An abnormal compaction trendis indicated by the constant velocities and high porosities present inthis interval, which are most likely caused by cementation related tothe processes of silica diagenesis (see Shipboard Scientific Party, 2001b,2002b).
When only the underthrust sediments are plotted (Fig. F10B), a cleartrend of increasing velocity with decreasing porosity and a critical po-rosity transition are apparent. This is especially true for Site 808 dataand, to a lesser extent, Site 1174 data. The underthrust sediments fol-low the normal consolidation trend proposed by Erickson and Jarrard(1998) as is expected for underthrust sediments that have been sub-jected only to burial compaction stresses (Davis et al., 1983; Morganand Karig, 1995).
The results of the parameter fitting for the underthrust sediments in-dicate that a critical porosity transition is crossed at ~0.30. Although asingle critical porosity value can be accurately fit to this data set, it ap-pears that the critical porosity transition occurs over a range of porosi-ties for Site 808. The median value of this range is ~0.31, which agreesrelatively well with the value obtained in the parameter fitting.
The parameter fitting provided a best-fit shale fraction value of~1.06. One possible explanation for an unphysical shale fraction beingfit is the lack of lower-porosity, higher-velocity data to constrain thisparameter. The average shale fraction of 0.32 calculated from the shalefraction log (Fig. F9) suggests that a lower value would more accuratelydescribe Site 1173 data. However, the shale fraction log for Site 1173 is
F11. Velocity-porosity for the un-derthrust sediments, p. 22.
Vel
ocity
(km
/s)
Porosity
Normal
High
Site 1173
Site 1174Site 808HyndmanE&J normal
E&J highLeast squares
2.6
2.4
2.2
2.0
1.8
1.60.20 0.25 0.30 0.35 0.40 0.45 0.50 0.55
T1. Parameter fitting for best-fit formulation, p. 23.

N.W. HOFFMAN AND H.J. TOBINVELOCITY AND POROSITY RELATIONSHIP 9
probably not accurate due to the lack of representative sand and shalebaselines. Further analysis needs to be done to accurately determinewhich shale fraction best describes the Shikoku Basin underthrust sedi-ments.
It is also important to note that the value of the shale fraction signif-icantly affects the values determined for the critical porosity in the pa-rameter fitting. An improved fit could probably be obtained by holdingthe shale fraction constant (at a value representative of the sediments atSite 1173) and allowing the critical porosity to vary.
The relationship derived by Hyndman et al. (1993) does not appearto fit either the lower- or higher-porosity sediments as well as the for-mulations suggested by Erickson and Jarrard (1998). The Hyndman etal. (1993) formulation does follow roughly the same trend but generallyoverestimates the velocity, especially for porosities near the critical po-rosity transition. However, this formulation was derived only for Site808 data, and different in situ corrections have been applied to the cur-rent core data set, which could account for some of the differences.
CONCLUSIONS
The underthrust sediments from Sites 1173, 1174, and 808 follow theglobal velocity-porosity trends proposed by Erickson and Jarrard (1998).The formulation for normal consolidation is a better fit to the data thanthe high-consolidation model, as is expected for tectonically unde-formed underthrust sediments.
New parameters fit to the normal consolidation model using a stan-dard nonlinear least-squares algorithm provides a single best-fit equa-tion that can be used to convert between velocity and porosity withreasonable uncertainty. This formulation will be used to predict poros-ity from seismic interval velocity for the underthrust sediments. Thenew formulation better predicts velocity than any of the previously de-termined relationships.
A critical porosity threshold appears to be crossed somewhere be-tween Sites 1174 and 808, at ~0.30. Although a single critical porosityvalue can be reliably fit to the data, there are a range of porosities forwhich velocity exhibits a stronger dependence on porosity.
ACKNOWLEDGMENTS
This research used samples and data provided by the Ocean DrillingProgram (ODP). ODP is sponsored by the U.S. National Science Founda-tion (NSF) and participating countries under management of JointOceanographic Institutions (JOI), Inc. A research assistantship for N.Hoffman was provided by JOI and U.S. Science Support Program(USSSP) postcruise funding for ODP Leg 190. The authors wish to thankJ.C. Moore for helpful suggestions and Lorri Peters for editorial review.
N.W. HOFFMAN AND H.J. TOBINVELOCITY AND POROSITY RELATIONSHIP 10
REFERENCES
Bangs, N.L., Taira, A., Kuramoto, S., Shipley, T.H., Moore, G.F., Mochizuki, K., Gulick,S.S., Zhao, Z., Nakamura, Y., Park, J.-O., Taylor, B.L., Morita, S., Ito, S., Hills, D.J.,Leslie, S.C., Alex, C.M., McCutcheon, A.J., Ike, T., Yagi, H., and Toyama, G., 1999.U.S.–Japan collaborative 3-D seismic investigation of the Nankai Trough plate-boundary interface and shallowmost seismogenic zone. Eos, Trans. Am. Geophys.Union, 80:569.
Blangy, J.P., Strandeness, S., Moos, D., and Nur, A., 1993. Ultrasonic velocities insands—revisited. Geophysics, 58:344–356.
Blum, P., 1997. Physical properties handbook: a guide to the shipboard measurementof physical properties of deep-sea cores. ODP Tech. Note, 26 [Online]. Availablefrom World Wide Web: <http://www-odp.tamu.edu/publications/tnotes/tn26/INDEX.HTM>. [Cited 2003-12-05]
Boyce, R.E., 1976. Definitions and laboratory techniques of compressional soundvelocity parameters and wet-water content, wet-bulk density, and porosity parame-ters by gravimetric and gamma-ray attenuation techniques. In Schlanger, S.O.,Jackson, E.D., et al., Init. Repts. DSDP, 33: Washington (U.S. Govt. Printing Office),931–958.
Davis, D., Suppe, J., and Dahlen, F.A., 1983. Mechanics of fold-and-thrust belts andaccretionary wedges. J. Geophys. Res., 88:1153–1172.
Dresser Atlas, 1982. Well Logging and Interpretation Techniques, The Course for HomeStudy (3rd ed.): USA. (Dresser Atlas Industries).
Erickson, S.N., and Jarrard, R.D., 1998. Velocity-porosity relationships for water-satu-rated siliciclastic sediments. J. Geophys. Res., 103:30385–30406.
Hamilton, E.L., 1965. Sound speed and related properties of sediments from Experi-mental Mohole (Guadalupe Site). Geophysics, 30:257–261.
Hamilton, E.L., 1979. Sound velocity gradients in marine sediments. J. Acoust. Soc.Am., 65:909–921.
Han, D., Nur, A., and Morgan, D., 1986. Effects of porosity and clay content on wavevelocities in sandstones. Geophysics, 51:2093–2107.
Hills, D.J., Moore, G.F., Bangs, N.L., Gulick, S.S., and Leg 196 Shipboard ScientificParty, 2001. Preliminary results from integration of 2D PSDM and ODP Leg 196LWD velocity data in the Nankai accretionary prism. Eos, Trans. Am. Geophys.Union, 82:F1221. (Abstract)
Hyndman, R.D., Moore, G.F., and Moran, K., 1993. Velocity, porosity, and pore-fluidloss from the Nankai subduction zone accretionary prism. In Hill, I.A., Taira, A.,Firth, J.V., et al., Proc. ODP, Sci. Results, 131: College Station, TX (Ocean DrillingProgram), 211–220.
Jarrard, R.D., Dadey, K.A., and Busch, W.H., 1989. Velocity and density of sedimentsof Eirik Ridge, Labrador Sea: control by porosity and mineralogy. In Srivastava, S.P.,Arthur, M.A., Clement, B., et al., Proc. ODP, Sci. Results, 105: College Station, TX(Ocean Drilling Program), 811–835.
Moore, G.F., Taira, A., Klaus, A., and Leg 190 Scientific Party, 2001. New insights intodeformation and fluid flow processes in the Nankai Trough accretionary prism:results of Ocean Drilling Program Leg 190. Geochem. Geophys. Geosyst., 2:10.1029/2001GC000166.
Moore, G.F., Taira, A., Kuramoto, S., Shipley, T.H., and Bangs, N.L., 1999. Structuralsetting of the 1999 U.S.–Japan Nankai Trough 3-D seismic reflection survey. Eos,80:F569.
Moore, J.C., 1989. Tectonics and hydrogeology of accretionary prisms: role of thedécollement zone. J. Struct. Geol., 11:95–106.
Morgan, J.K., and Karig, D.E., 1995. Décollement processes at the Nankai accretion-ary margin, Southeast Japan. J. Geophys. Res., 100:15221–15231.

N.W. HOFFMAN AND H.J. TOBINVELOCITY AND POROSITY RELATIONSHIP 11
Nur, A., Mavko, G., Dvorkin, J., and Galmudi, D., 1998. Critical porosity: a key torelating physical properties to porosity in rocks. Leading Edge, 17:357–362.
Raymer, L.L., Hunt, E.R., and Gardner, J.S., 1980. An improved sonic transit time-to-porosity transform. Trans. SPWLA 21st Annu. Log. Symp., P1–P13.
Shipboard Scientific Party, 1991. Site 808. In Taira, A., Hill, I., Firth, J.V., et al., Proc.ODP, Init. Repts., 131: College Station, TX (Ocean Drilling Program), 71–269.
Shipboard Scientific Party, 2001a. Explanatory notes. In Moore, G.F., Taira, A., Klaus,A., et al., Proc. ODP, Init. Repts., 190, 1–51 [CD-ROM]. Available from: Ocean Drill-ing Program, Texas A&M University, College Station TX 77845-9547, USA.
Shipboard Scientific Party, 2001b. Leg 190 summary. In Moore, G.F., Taira, A., Klaus,A., et al., Proc. ODP, Init. Repts., 190: College Station TX (Ocean Drilling Program),1–87.
Shipboard Scientific Party, 2001c. Site 1173. In Moore, G.F., Taira, A., Klaus, A., et al.,Proc. ODP, Init. Repts., 190, 1–147 [CD-ROM]. Available from: Ocean Drilling Pro-gram, Texas A&M University, College Station TX 77845-9547, USA.
Shipboard Scientific Party, 2001d. Site 1174. In Moore, G., Taira, A., Klaus, A., et al.,Proc. ODP, Init. Repts., 190, 1–149 [CD-ROM]. Available from: Ocean Drilling Pro-gram, Texas A&M University, College Station TX 77845-9547, USA.
Shipboard Scientific Party, 2002a. Explanatory notes. In Mikada, H., Becker, K.,Moore, J.C., Klaus, A., et al., Proc. ODP, Init. Repts., 196, 1–53 [CD-ROM]. Availablefrom: Ocean Drilling Program, Texas A&M University, College Station TX 77845-9547, USA.
Shipboard Scientific Party, 2002b. Leg 196 summary: deformation and fluid flow pro-cesses in the Nankai Trough accretionary prism: logging while drilling andadvanced CORKs. In Mikada, H., Becker, K., Moore, J.C., Klaus, A., et al., Proc. ODP,Init. Repts., 196: College Station TX (Ocean Drilling Program), 1–29.
Wyllie, M.R.J., Gregory, A.R., and Gardner, G.H.F., 1958. An experimental investiga-tion of factors affecting elastic wave velocities in porous media. Geophysics, 23:400.

N.W. HOFFMAN AND H.J. TOBINVELOCITY AND POROSITY RELATIONSHIP 12
Figure F1. Map showing the location of ODP Sites 1173, 1174, and 808 for Legs 190 and 196. The red boxoutlines the location of the three-dimensional seismic survey (Bangs et al., 1999; Moore et al., 1999). Depthcontours are in kilometers. (Shipboard Scientific Party, 2002b).
132°E 134° 136°
1173117311741174
1175117511761176
11781178
808808
KinanKinanSeamountsSeamounts
Shikoku Island
CapeMuroto
Nankai
Nankai
Troughough
432
1
4
3
2
1
32°
34°N

N.W
. HO
FFMA
N A
ND
H.J. T
OB
INV
EL
OC
ITY A
ND
PO
RO
SITY R
EL
AT
ION
SHIP
13
Figure tion data from Hills et al. (2001). Site 1173, where there is littleor no rd Scientific Party, 2002b). VE = vertical exaggeration.
10 km0
FrontalOOST
Site1174
Site808
Site1173
BSR
VE = 2.5
ShikokuBasin
NankaiTrough
Trench
of-
Imbricate thrust zone(ITZ)
Pro
toth
rust
zon
e (P
TZ
)
Frontalthrust
Dep
th b
elow
sea
leve
l (km
)
5
6
7
8
4
3
2
1
0
F2. Cross section showing major structural features based on seismic reflectectonic deformation in the sediments, is used as the reference site (Shipboa
Cover sequence Site1176
Site1175
Site1178
Bottom-simulatingreflector (BSR)Slope
basin
Landward-dipping reflector zone
(LDRZ)Large thrust-slice zone
(LTSZ)
Frontal out-sequence
thrust zone(OOST)
Seismogenic zone?

N.W. HOFFMAN AND H.J. TOBINVELOCITY AND POROSITY RELATIONSHIP 14
Figure F3. Stratigraphic column for Site 1173. Sites 1174 and 808 contain additional trench-fill sediments(Shipboard Scientific Party, 2001c).
Unit IA: outer trench–wedge faciesSand and silt turbidites, hemipelagic mud,rare volcanic ash
Unit IB: trench to basin transition faciesSilt turbidites, hemipelagic mud,volcanic ash
Unit II: upper Shikoku Basin faciesHemipelagic mudstone,abundant volcanic ash
Unit III: lower Shikoku Basin faciesHemipelagic mudstone,rare siliceous claystone,and calcareous claystone
Unit IV: volcaniclastic faciesVariegated mudstone, siliceous tuff
Unit V: basalt basement
100
200
300
400
500
600
700mid
dle
Mio
cene
late
Mio
cene
Plio
cene
Qua
tern
ary
83.37
102.14
343.77
687.99
724.89
0.46
1.25
2.52
4.00
7.20
9.00
11.80
13.60
Hempelagicmud/mudstone
Sandy mud/mudstone
Chaotic stratification,Slump folds
Silt turbidites
Sand turbidites
Volcanic ash
Gravel, pebblymud/mudstone
Age(Ma) Age
Depth(mbsf)
Graphiclithology Lithofacies description

N.W
. HO
FFMA
N A
ND
H.J. T
OB
INV
EL
OC
ITY A
ND
PO
RO
SITY R
EL
AT
ION
SHIP
15
Figure , and 808. The proto-décollement forSite 11 ts are in the z-direction only. In situcorrec
0
100
200
300
400
500
600
700
800
Dep
th (
mbs
f)
1. 5 2 2. 5
0
200
400
600
800
1000
1200
1400
VP (km/s)
808
F4. Core-based laboratory measurements of compressional velocity and porosity for Sites 1173, 117473 and the décollement for Sites 1174 and 808 are indicated by the black line. Velocity measuremen
tions have not yet been applied to these data.
0 0. 5 1
Porosity
1. 5 2 2. 5
0
100
200
300
400
500
600
700
800
VP (km/s)
0 0. 5 1
0
200
400
600
800
1000
1200
Porosity
1. 5 2 2. 5
0
200
400
600
800
1000
1200
VP (km/s)
0 0. 5 1
0
200
400
600
800
1000
1200
1400
Porosity
Site 1173 Site 1174 Site

N.W. HOFFMAN AND H.J. TOBINVELOCITY AND POROSITY RELATIONSHIP 16
Figure F5. Core and wireline log porosity measurements for Site 1173. A. All available porosity data. B. Po-rosity data with corresponding depths to within 10 cm. (Note the change in depth scale between A and B).
0.2 0.4 0.6 0.8
Porosity
Dep
th (
mbs
f)
0.2 0.4 0.6 0.8
Porosity
CoreLog
CoreLog
100
200
300
400
500
600
700
50
100
150
200
250
300
350
400
A B

N.W. HOFFMAN AND H.J. TOBINVELOCITY AND POROSITY RELATIONSHIP 17
Figure F6. Core and LWD porosity measurements for Site 1173. A. All available porosity data. B. Porositydata with corresponding depths to within 10 cm.
0.2 0.4 0.6 0.8
Porosity
Dep
th (
mbs
f)
0.2 0.4 0.6 0.8
Porosity
CoreLog
CoreLog
100
200
300
400
500
600
700
A B
N.W. HOFFMAN AND H.J. TOBINVELOCITY AND POROSITY RELATIONSHIP 18
Figure F7. Core and wireline velocity measurements for Site 1173. A. All available velocity data. B. Datawith corresponding depths. C. Difference in velocity between core and wireline measurements. (Note thechange in depth scale between A and B).
Dep
th (
mbs
f)
CoreLog
CoreLog
100
200
300
400
500
600
700
220
240
260
280
300
320
340
360
220
240
260
280
300
320
340
360
1600 1800 2000 2200 1600 1800 2000 100 0 100
Velocity (m/s) Velocity (m/s) Difference (m/s)
A B C
N.W. HOFFMAN AND H.J. TOBINVELOCITY AND POROSITY RELATIONSHIP 19
Figure F8. Compressional velocity as a function of porosity and shale fraction for (A) normal and (B) highconsolidation (Erickson and Jarrard, 1998). Velocity is plotted for shale fractions of 0, 0.2, 0.4, 0.6, 0.8, and 1.
vsh = 1
vsh = 0
vsh = 1
vsh = 0
0 0.2 0.4 0.6 0.8 1.01.0
1.5
2.0
2.5
3.0
3.5
4.0
4.5
5.0
5.5
6.0
1.0
1.5
2.0
2.5
3.0
3.5
4.0
4.5
5.0
5.5
6.0Normal consolidation
Porosity
High consolidation
Vel
ocity
(km
/s)
A
Vel
ocity
(km
/s)
B

N.W. HOFFMAN AND H.J. TOBINVELOCITY AND POROSITY RELATIONSHIP 20
Figure F9. Calculated shale fraction log for Site 1173. The average shale fraction calculated is 0.32. The sandand shale baselines were taken from the logging-while-drilling (LWD) gamma ray log from Site 808.
Shale fraction
Dep
th (
mbs
f)
Avg. vsh = 0.32Sand baseline = 23 APIShale baseline = 93 API(from Site 808 LWD log)
400
450
500
550
600
650
700
7500 0.1 0.2 0.3 0.4 0.5 0.6 0.7

N.W. HOFFMAN AND H.J. TOBINVELOCITY AND POROSITY RELATIONSHIP 21
Figure F10. Velocity vs. porosity for in situ corrected core data for Sites 1173, 1174, and 808. A. Sedimentsabove and below the décollement (projected décollement at Site 1173). B. Underthrust sediments.
Site 808Site 1174Site 1173
Porosity
1.6
1.8
2.0
2.2
2.4
2.6
2.8
1.6
1.8
2.0
2.2
2.4
2.6
2.8
0.20 0.25 0.30 0.35 0.40 0.45 0.50 0.55
A
B
Vel
ocity
(km
/s)
Vel
ocity
(km
/s)

N.W. HOFFMAN AND H.J. TOBINVELOCITY AND POROSITY RELATIONSHIP 22
Figure F11. Empirical velocity-porosity formulations for the underthrust sediments for Sites 1173, 1174,and 808. The least-squares fit (solid black line) is plotted for a shale fraction of 1. The formulations for nor-mal and high consolidation (Erickson and Jarrard [E&J], 1998) are plotted for shale fractions of 1 as well asthe formulation from Hyndman et al. (1993).
Vel
ocity
(km
/s)
Porosity
Normal
High
Site 1173
Site 1174Site 808HyndmanE&J normal
E&J highLeast squares
2.6
2.4
2.2
2.0
1.8
1.60.20 0.25 0.30 0.35 0.40 0.45 0.50 0.55
N.W. HOFFMAN AND H.J. TOBINVELOCITY AND POROSITY RELATIONSHIP 23
Table T1. Results of the parameter fitting for the best-fit for-mulation.
Note: The Erickson and Jarrard (1998) parameters for normal and high consol-idation are listed for comparison.
Parameter Fit Error (±) Error (%)
Erickson and Jarrard (1998)
Normal 0.739 High 1.11
A 0.746 0.379 51B 0.532 0.327 61 0.552 0.178C 0.124 0.171 137 0.13 0.135vsh 1.057 0.041 4 — —φc 0.295 0.006 2 0.31 0.39