Embed Size (px)
Citation preview
AN EMPIRICAL STUDY ON RELATIONSHIP BETWEEN EXCHANGE RATE AND
SECTORAL INDICES IN BSE
Dr.R.K.Sudhamathi1
& M.Ganeshwari2
1. Dr.R.K.Sudhamathi, Associate Professor, Department of Management,
PSGR Krishnammal College for Women.
2. Ganeshwari.M, PhD Research Scholar , Department of Management,
PSGR Krishnammal College for Women.
Abstract
The present study focuses on the relationship between exchange rate and sectoral
indices listed in Bombay Stock Exchange(BSE) over the period 1.4.2015-31.3.2018. To analyse
the sectoral relationship with exchange rate and vice versa, the ADF test, Johansen
cointergartion, Granger Causality test and Correlation is applied for the study. The study
found that exchange-rate changes have negative effects on some sectors but positive effects on
others. Import intensive sectors like Bank, Auto, FMCG, Metal, infrastructure, IT, Oil& gas,
realty and TECK responded negatively to the weakening rupee. Further, the study suggests
individual and institutional investors to diversify their portfolio and can enjoy with handsome
return from the market.
Keyword:Sectoral indices, Johansen cointergartion, Granger Causality test, portfolio
Introduction
Foreign exchange market stability and stock market growth are the twin economic
objectives that all the country needs to achieve. This is because the financial position of every
economy i.e., both developing and developed country can be assessed from its exchange rate
stability. Stock market price and exchange rates are interconnected directly or indirectly, because
today, world is turning into a global village due to trade liberalization and globalization. For
example, investors i.e., foreign people are busy investing their capital in the stock markets world
over. Hence, in this process international investment is booming quickly and capital is moving
all across the world. The advantagefor these investors is being determined by foreign exchange
rate. Moreover, fluctuation in the exchange rates may bring about uncertainty or otherwise in
these investors. Thus, foreign exchange is the major determinant of stock market fluctuations.
CIKITUSI JOURNAL FOR MULTIDISCIPLINARY RESEARCH
Volume 6, Issue 5, May 2019
ISSN NO: 0975-6876
http://cikitusi.com/197
In the earlier studies, researchers have investigated the impact of exchange rate on all
types of stocks under BSE and NSE.The present study is carried out to know the effectof
Exchange rate on all the sectors listed in BSE. The study will provide insights for investors
regarding the impact of exchange rate fluctuations over each sector.
Review of literature
Existing literature relating to the association between stock prices and exchange rates
shows diverse outlook. An early attempt has been made by (Saadet Kasman,2003) in this area
considered TRY/USD, financial sector index, production sector index, service sector index and
found that a long run relationship exist between only industry sector index with TRY/USD.
(KalimUllah, 2015) analyzed the relationship between both the market in Pakistan and concluded
there exist a bidirectional relationship between PKR/USD and KSE 100 i.e., investors can use
information of one market to predict the other market.
N.S.Nataraja, Ganesh.L and Sunil Kumar (2014) made a slight different study to detect
the impact of CNX Bank NIFTY with INR/USD. He found a negative correlation and Granger
causality test reveals uni -directional relationship between both the variables. Similar study has
been conducted by Uma Shankar Megha(2012) concluded that week rupee rate has significant
positive relationship with stock prices of Infosys and Wipro companies. Nikita Kagalwala
andDivyang Patel(2013) analyzed the relationship between Indian stock exchange and exchange
rate using monthly data and found that there is no or little impact of exchange rate on Indian
stock market.In recent days, economists are giving significance for the study of temporal relation
between exchange rates and stock returns, for theoretical as well as empirical reasons. The
development of any country’s economy is influenced by the changes in the series, stock price
and exchange rate. Also, the relationship between both the rates gives the guidelines in
predicting the future trends for each other by investors.
Data and methodology
To analyse the relationship between exchange rate and sectoral indices, this paper uses
daily data for exchange rate and all the sectors listed in BSE over the period 1.4.2015 –
31.3.2018. The data used for the study is USD/INR and all the 14 sectors listed in BSE
CIKITUSI JOURNAL FOR MULTIDISCIPLINARY RESEARCH
Volume 6, Issue 5, May 2019
ISSN NO: 0975-6876
http://cikitusi.com/198
i.e.,(Auto, Bank, Capital goods, consumer durables, FMCG, healthcare, Infrastructure, IT,
Metal,Oil & Gas, Power, PSU, Realty and TECK) and the data has been collected from NSE and
RBI websites.
The study start by testing stationarity for all the series using Augmented Dickey Fuller (ADF)
test to assess the order of integration of all the series. Further, the study proceed to test for
Granger causality test to find the short run relationship and co-integration between series
integrated to test the long run relationship between both the markets.
Research Gap
Going through various literatures it is found that most of the studies conducted on either
correlation among the stock markets of developed countries or about volatility. A few of them
conducted on sectoral diversification in countries other than India. It is observed that the
researcher hardly found any study of current data belonging to Indian stock market as far as
sectoral diversification is concerned. So it is an attempt to fill the gap.
Objective
The primary objective of the study is to analyse the dynamic relationship between exchange rate
and sectoral indices in long run and short run.
Analysis & Interpretation:
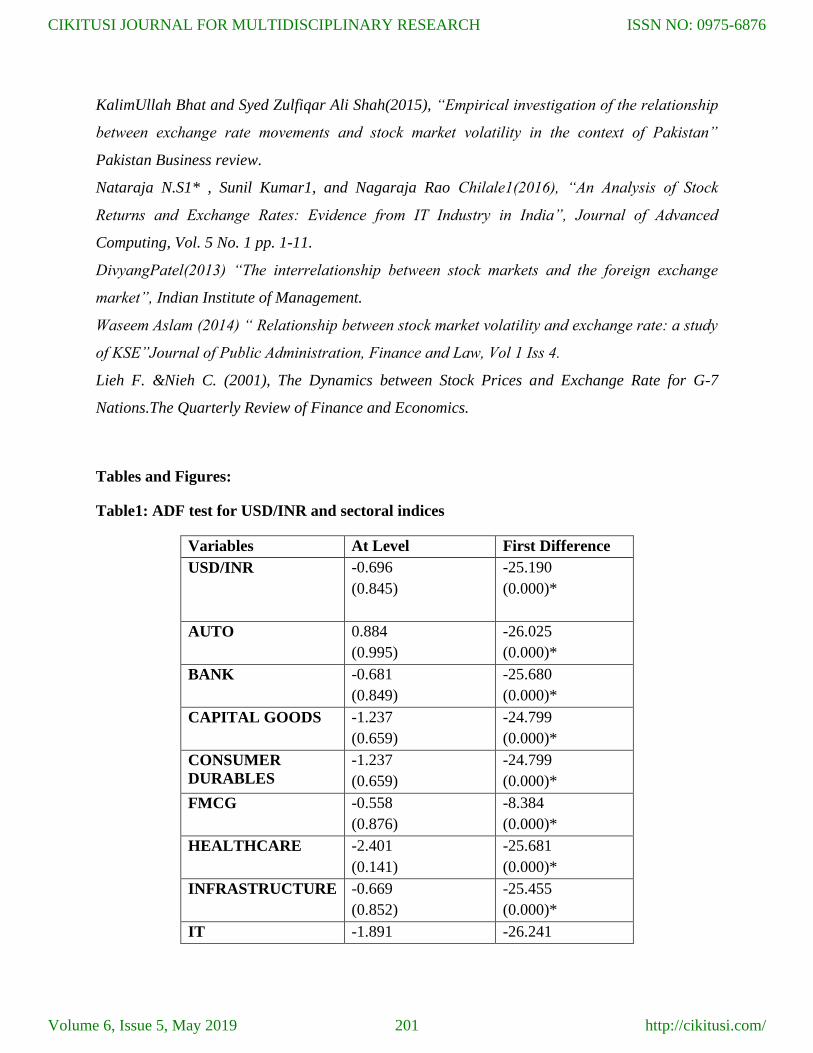
Table1: ADF test for USD/INR and sectoral indices
The above shows the results of ADF test for USD/INR and sectoral indices. The tests
were conducted at level and first difference for three years from April 2015 to March 2018.
Results revealed that at level and level both the variables were found to be greater than 0.05
which confirmed that null hypothesis cannot be rejected at level. It evidenced that the USD/INR
and sectors series was non stationary.
ADF statistics at first difference evidenced that USD/INR and sectoral indices were
found to be stationary since the p value is less than 0.05. Thus, the null hypothesis of non-
stationary are rejected at 1% level of significance.
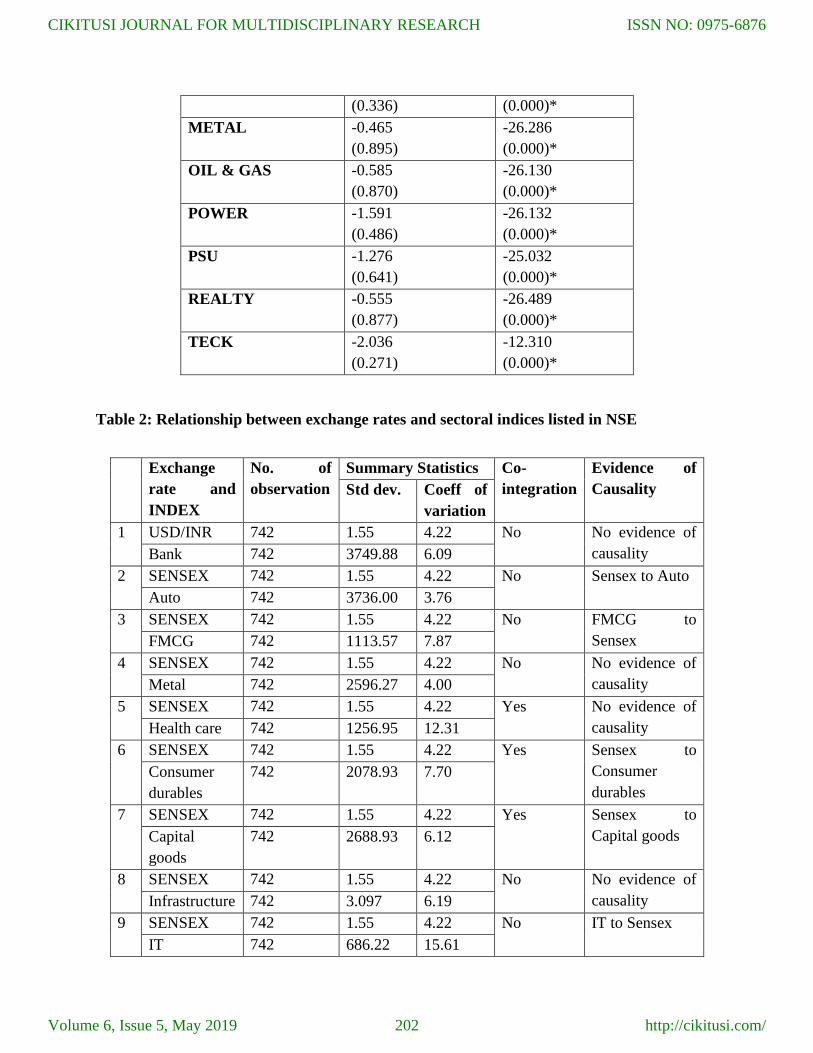
Table 2: Relationship between exchange rates and sectoral indices listed in NSE
From the above table, Co-integration test reveals that out of 14 industry sectors identified
only Capital goods, consumer durables, Healthcare and realty sectors were found to have long
CIKITUSI JOURNAL FOR MULTIDISCIPLINARY RESEARCH
Volume 6, Issue 5, May 2019
ISSN NO: 0975-6876
http://cikitusi.com/199
run relationship with exchange rate. Granger causality test reveals that sectors like Auto, FMCG,
consumer durables, capital goods IT, Oil& Gas, TECK and realty sectors were found to have
short run relationship with exchange rate.
Chart1: Relationship between exchange rates and sectoral indices listed in NSE
From the above chart, it is found that health care, capital goods, consumer durables, Power, PSU
are positively correlated with USD/INR. Most of the import extensive sectors like Bank, Auto,
FMCG, Metal, infrastructure, IT, Oil& gas, realty and TECK are negatively correlated with
USD/INR. These sectors respond negatively to weakening of rupee.
Conclusion
The knowledge of the stock market structure is important for both investors and portfolio
managers to invest rationally. The present paper is focused on analysis the relationship between
exchange rate and sectoral indices listed in BSE. The study found that different sectors
responded differently to the change in exchange rate fluctuations. Exchange-rate changes have
negative effects on some sectors but positive effects on others. Import intensive sectors like
Bank, Auto, FMCG, Metal, infrastructure, IT, Oil& gas, realty and TECK responded negatively
to the weakening rupee. All other sectors were found to be positively correlated with the
appreciating rupee during 2015 to 2018 and thus testifying differing effects of exchange rate
changes on the performance of stock indices across different sectors. The implication of the
result may help individual and institutional investors to diversify their portfolio and can enjoy
with handsome return from the market.
Biblography:
Saadetkasman(2003), “The relationship between exchange rates and Stock prices: A causality
analysis” Celal Bayar University.
CIKITUSI JOURNAL FOR MULTIDISCIPLINARY RESEARCH
Volume 6, Issue 5, May 2019
ISSN NO: 0975-6876
http://cikitusi.com/200
KalimUllah Bhat and Syed Zulfiqar Ali Shah(2015), “Empirical investigation of the relationship
between exchange rate movements and stock market volatility in the context of Pakistan”
Pakistan Business review.
Nataraja N.S1* , Sunil Kumar1, and Nagaraja Rao Chilale1(2016), “An Analysis of Stock
Returns and Exchange Rates: Evidence from IT Industry in India”, Journal of Advanced
Computing, Vol. 5 No. 1 pp. 1-11.
DivyangPatel(2013) “The interrelationship between stock markets and the foreign exchange
market”, Indian Institute of Management.
Waseem Aslam (2014) “ Relationship between stock market volatility and exchange rate: a study
of KSE”Journal of Public Administration, Finance and Law, Vol 1 Iss 4.
Lieh F. &Nieh C. (2001), The Dynamics between Stock Prices and Exchange Rate for G-7
Nations.The Quarterly Review of Finance and Economics.
Tables and Figures:
Table1: ADF test for USD/INR and sectoral indices
Variables At Level First Difference
USD/INR -0.696
(0.845)
-25.190
(0.000)*
AUTO 0.884
(0.995)
-26.025
(0.000)*
BANK -0.681
(0.849)
-25.680
(0.000)*
CAPITAL GOODS -1.237
(0.659)
-24.799
(0.000)*
CONSUMER
DURABLES
-1.237
(0.659)
-24.799
(0.000)*
FMCG -0.558
(0.876)
-8.384
(0.000)*
HEALTHCARE -2.401
(0.141)
-25.681
(0.000)*
INFRASTRUCTURE -0.669
(0.852)
-25.455
(0.000)*
IT -1.891 -26.241
CIKITUSI JOURNAL FOR MULTIDISCIPLINARY RESEARCH
Volume 6, Issue 5, May 2019
ISSN NO: 0975-6876
http://cikitusi.com/201
(0.336) (0.000)*
METAL -0.465
(0.895)
-26.286
(0.000)*
OIL & GAS -0.585
(0.870)
-26.130
(0.000)*
POWER -1.591
(0.486)
-26.132
(0.000)*
PSU -1.276
(0.641)
-25.032
(0.000)*
REALTY -0.555
(0.877)
-26.489
(0.000)*
TECK -2.036
(0.271)
-12.310
(0.000)*
Table 2: Relationship between exchange rates and sectoral indices listed in NSE
Exchange
rate and
INDEX
No. of
observation
Summary Statistics Co-
integration
Evidence of
Causality Std dev. Coeff of
variation
1 USD/INR 742 1.55 4.22 No No evidence of
causality Bank 742 3749.88 6.09
2 SENSEX 742 1.55 4.22 No Sensex to Auto
Auto 742 3736.00 3.76
3 SENSEX 742 1.55 4.22 No FMCG to
Sensex FMCG 742 1113.57 7.87
4 SENSEX 742 1.55 4.22 No No evidence of
causality Metal 742 2596.27 4.00
5 SENSEX 742 1.55 4.22 Yes No evidence of
causality Health care 742 1256.95 12.31
6 SENSEX 742 1.55 4.22 Yes Sensex to
Consumer
durables
Consumer
durables
742 2078.93 7.70
7 SENSEX 742 1.55 4.22 Yes Sensex to
Capital goods Capital
goods
742 2688.93 6.12
8 SENSEX 742 1.55 4.22 No No evidence of
causality Infrastructure 742 3.097 6.19
9 SENSEX 742 1.55 4.22 No IT to Sensex
IT 742 686.22 15.61
CIKITUSI JOURNAL FOR MULTIDISCIPLINARY RESEARCH
Volume 6, Issue 5, May 2019
ISSN NO: 0975-6876
http://cikitusi.com/202
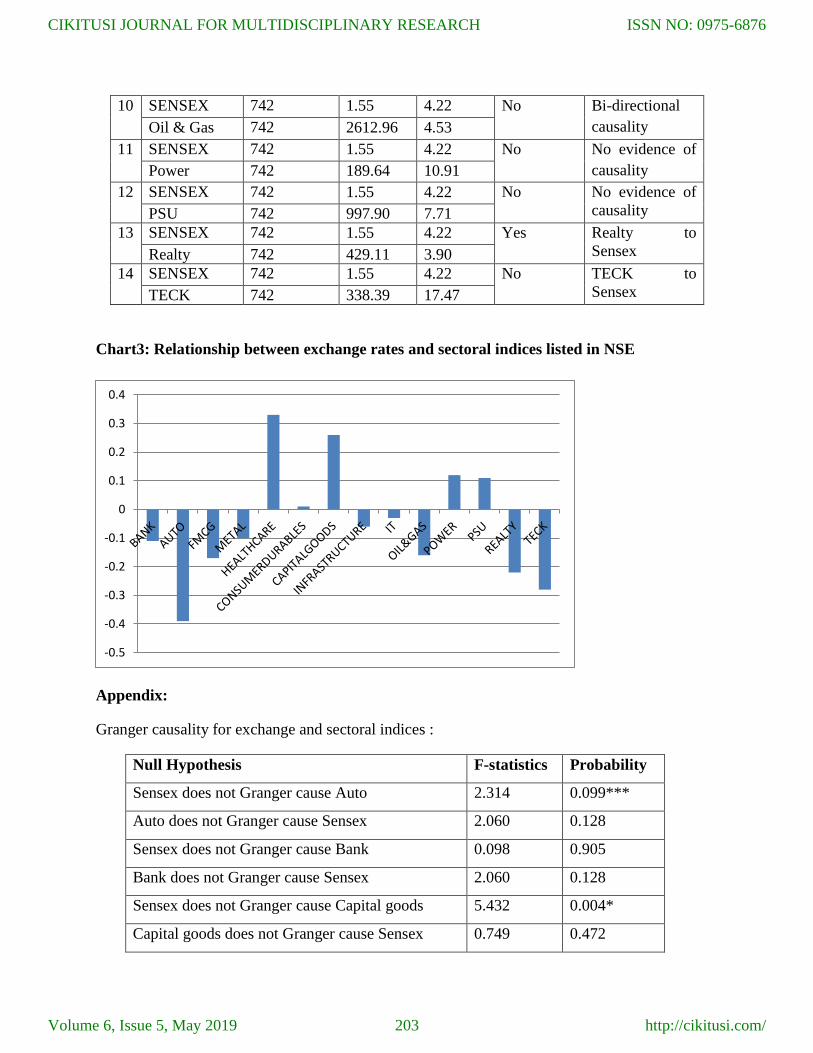
Chart3: Relationship between exchange rates and sectoral indices listed in NSE
Appendix:
Granger causality for exchange and sectoral indices :
Null Hypothesis F-statistics Probability
Sensex does not Granger cause Auto 2.314 0.099***
Auto does not Granger cause Sensex 2.060 0.128
Sensex does not Granger cause Bank 0.098 0.905
Bank does not Granger cause Sensex 2.060 0.128
Sensex does not Granger cause Capital goods 5.432 0.004*
Capital goods does not Granger cause Sensex 0.749 0.472
-0.5
-0.4
-0.3
-0.2
-0.1
0
0.1
0.2
0.3
0.4
10 SENSEX 742 1.55 4.22 No Bi-directional
causality Oil & Gas 742 2612.96 4.53
11 SENSEX 742 1.55 4.22 No No evidence of
causality Power 742 189.64 10.91
12 SENSEX 742 1.55 4.22 No No evidence of
causality PSU 742 997.90 7.71
13 SENSEX 742 1.55 4.22 Yes Realty to
Sensex Realty 742 429.11 3.90
14 SENSEX 742 1.55 4.22 No TECK to
Sensex TECK 742 338.39 17.47
CIKITUSI JOURNAL FOR MULTIDISCIPLINARY RESEARCH
Volume 6, Issue 5, May 2019
ISSN NO: 0975-6876
http://cikitusi.com/203

Sensex does not Granger cause FMCG 0.319 0.726
FMCG does not Granger cause Sensex 3.941 0.019*
Sensex does not Granger cause Consumer durables 5.432 0.004*
Consumer durables does not Granger cause Sensex 0.749 0.472
Sensex does not Granger cause IT 0.820 0.440
IT does not Granger cause Sensex 2.748 0.064**
Sensex does not Granger cause Oil & Gas 3.629 0.027*
Oil & Gas does not Granger cause Sensex 3.935 0.020*
Sensex does not Granger cause Power 2.261 0.104
Power does not Granger cause Sensex 0.522 0.593
Sensex does not Granger cause PSU 2.147 0.117
PSU does not Granger cause Sensex 1.375 0.253
Sensex does not Granger cause Realty 1.296 0.274
Realty does not Granger cause Sensex 3.048 0.048**
Sensex does not Granger cause TECK 1.299 0.273
TECK does not Granger cause Sensex 2.571 0.077***
*1% level of significance;
**5% level of significance;
***10% level of significance
Johansen Cointergation test
Cointergationfor sensex and auto
Unrestricted Cointegration Rank Test (Trace)
Hypothesized Trace 0.05
No. of CE(s) Eigenvalue Statistic Critical Value Prob.**
None 0.007090 5.667352 12.32090 0.4777
At most 1 0.000585 0.430874 4.129906 0.5750
Trace test indicates no cointegration at the 0.05 level
* denotes rejection of the hypothesis at the 0.05 level
**MacKinnon-Haug-Michelis (1999) p-values
CIKITUSI JOURNAL FOR MULTIDISCIPLINARY RESEARCH
Volume 6, Issue 5, May 2019
ISSN NO: 0975-6876
http://cikitusi.com/204
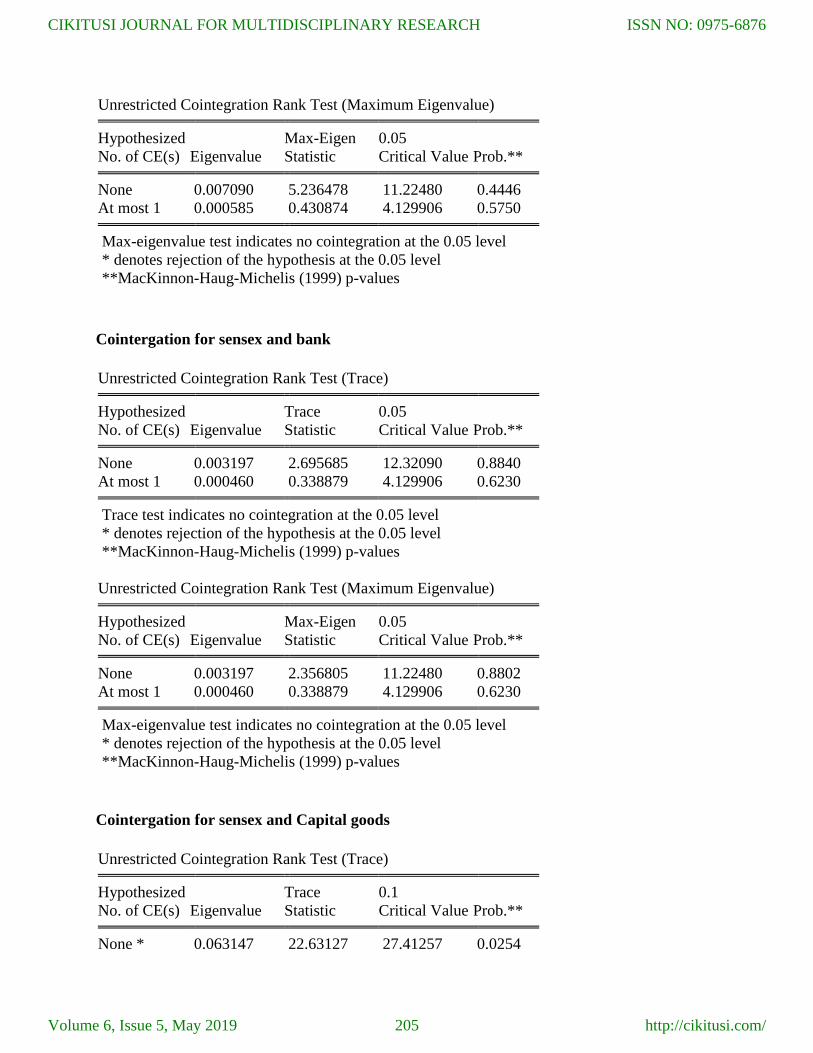
Unrestricted Cointegration Rank Test (Maximum Eigenvalue)
Hypothesized Max-Eigen 0.05
No. of CE(s) Eigenvalue Statistic Critical Value Prob.**
None 0.007090 5.236478 11.22480 0.4446
At most 1 0.000585 0.430874 4.129906 0.5750
Max-eigenvalue test indicates no cointegration at the 0.05 level
* denotes rejection of the hypothesis at the 0.05 level
**MacKinnon-Haug-Michelis (1999) p-values
Cointergation for sensex and bank
Unrestricted Cointegration Rank Test (Trace)
Hypothesized Trace 0.05
No. of CE(s) Eigenvalue Statistic Critical Value Prob.**
None 0.003197 2.695685 12.32090 0.8840
At most 1 0.000460 0.338879 4.129906 0.6230
Trace test indicates no cointegration at the 0.05 level
* denotes rejection of the hypothesis at the 0.05 level
**MacKinnon-Haug-Michelis (1999) p-values
Unrestricted Cointegration Rank Test (Maximum Eigenvalue)
Hypothesized Max-Eigen 0.05
No. of CE(s) Eigenvalue Statistic Critical Value Prob.**
None 0.003197 2.356805 11.22480 0.8802
At most 1 0.000460 0.338879 4.129906 0.6230
Max-eigenvalue test indicates no cointegration at the 0.05 level
* denotes rejection of the hypothesis at the 0.05 level
**MacKinnon-Haug-Michelis (1999) p-values
Cointergation for sensex and Capital goods
Unrestricted Cointegration Rank Test (Trace)
Hypothesized Trace 0.1
No. of CE(s) Eigenvalue Statistic Critical Value Prob.**
None * 0.063147 22.63127 27.41257 0.0254
CIKITUSI JOURNAL FOR MULTIDISCIPLINARY RESEARCH
Volume 6, Issue 5, May 2019
ISSN NO: 0975-6876
http://cikitusi.com/205
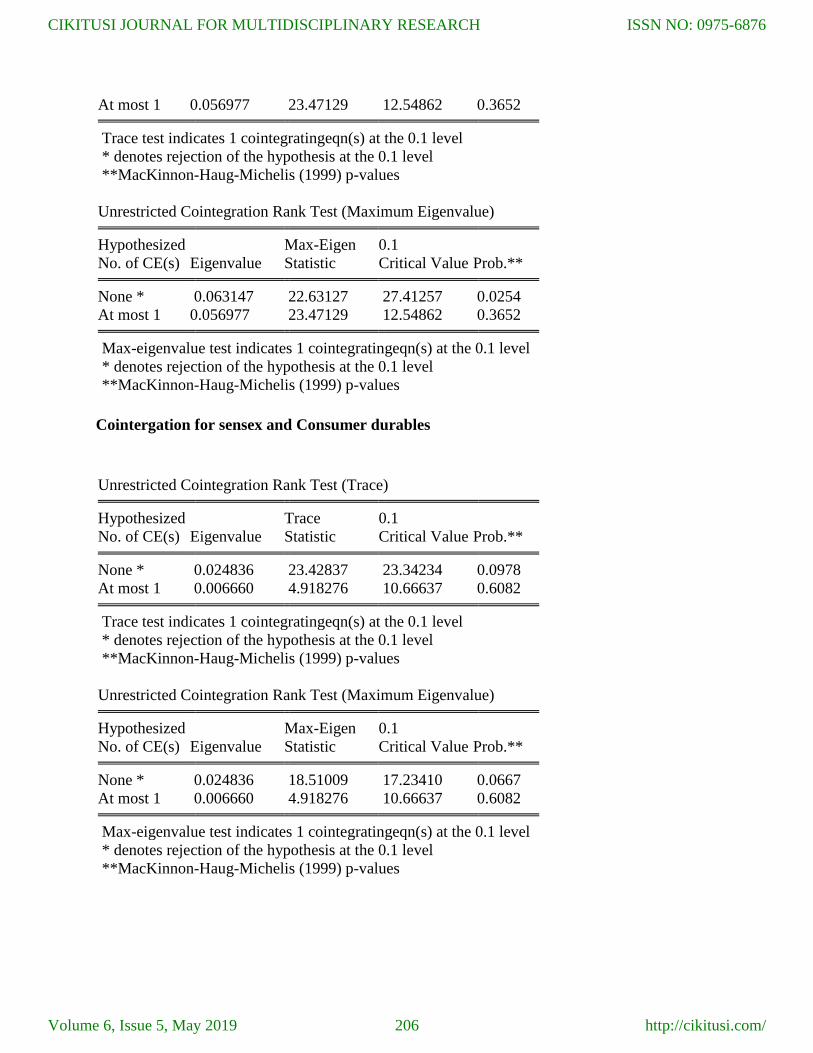
At most 1 0.056977 23.47129 12.54862 0.3652
Trace test indicates 1 cointegratingeqn(s) at the 0.1 level
* denotes rejection of the hypothesis at the 0.1 level
**MacKinnon-Haug-Michelis (1999) p-values
Unrestricted Cointegration Rank Test (Maximum Eigenvalue)
Hypothesized Max-Eigen 0.1
No. of CE(s) Eigenvalue Statistic Critical Value Prob.**
None * 0.063147 22.63127 27.41257 0.0254
At most 1 0.056977 23.47129 12.54862 0.3652
Max-eigenvalue test indicates 1 cointegratingeqn(s) at the 0.1 level
* denotes rejection of the hypothesis at the 0.1 level
**MacKinnon-Haug-Michelis (1999) p-values
Cointergation for sensex and Consumer durables
Unrestricted Cointegration Rank Test (Trace)
Hypothesized Trace 0.1
No. of CE(s) Eigenvalue Statistic Critical Value Prob.**
None * 0.024836 23.42837 23.34234 0.0978
At most 1 0.006660 4.918276 10.66637 0.6082
Trace test indicates 1 cointegratingeqn(s) at the 0.1 level
* denotes rejection of the hypothesis at the 0.1 level
**MacKinnon-Haug-Michelis (1999) p-values
Unrestricted Cointegration Rank Test (Maximum Eigenvalue)
Hypothesized Max-Eigen 0.1
No. of CE(s) Eigenvalue Statistic Critical Value Prob.**
None * 0.024836 18.51009 17.23410 0.0667
At most 1 0.006660 4.918276 10.66637 0.6082
Max-eigenvalue test indicates 1 cointegratingeqn(s) at the 0.1 level
* denotes rejection of the hypothesis at the 0.1 level
**MacKinnon-Haug-Michelis (1999) p-values
CIKITUSI JOURNAL FOR MULTIDISCIPLINARY RESEARCH
Volume 6, Issue 5, May 2019
ISSN NO: 0975-6876
http://cikitusi.com/206
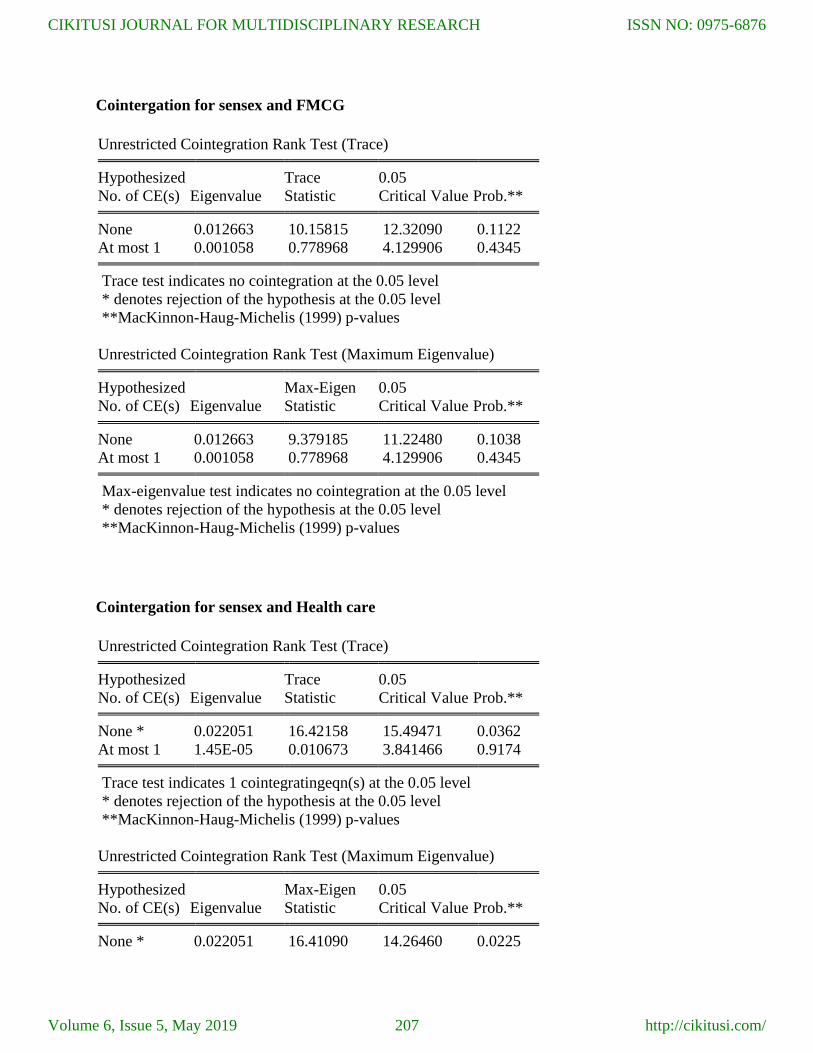
Cointergation for sensex and FMCG
Unrestricted Cointegration Rank Test (Trace)
Hypothesized Trace 0.05
No. of CE(s) Eigenvalue Statistic Critical Value Prob.**
None 0.012663 10.15815 12.32090 0.1122
At most 1 0.001058 0.778968 4.129906 0.4345
Trace test indicates no cointegration at the 0.05 level
* denotes rejection of the hypothesis at the 0.05 level
**MacKinnon-Haug-Michelis (1999) p-values
Unrestricted Cointegration Rank Test (Maximum Eigenvalue)
Hypothesized Max-Eigen 0.05
No. of CE(s) Eigenvalue Statistic Critical Value Prob.**
None 0.012663 9.379185 11.22480 0.1038
At most 1 0.001058 0.778968 4.129906 0.4345
Max-eigenvalue test indicates no cointegration at the 0.05 level
* denotes rejection of the hypothesis at the 0.05 level
**MacKinnon-Haug-Michelis (1999) p-values
Cointergation for sensex and Health care
Unrestricted Cointegration Rank Test (Trace)
Hypothesized Trace 0.05
No. of CE(s) Eigenvalue Statistic Critical Value Prob.**
None * 0.022051 16.42158 15.49471 0.0362
At most 1 1.45E-05 0.010673 3.841466 0.9174
Trace test indicates 1 cointegratingeqn(s) at the 0.05 level
* denotes rejection of the hypothesis at the 0.05 level
**MacKinnon-Haug-Michelis (1999) p-values
Unrestricted Cointegration Rank Test (Maximum Eigenvalue)
Hypothesized Max-Eigen 0.05
No. of CE(s) Eigenvalue Statistic Critical Value Prob.**
None * 0.022051 16.41090 14.26460 0.0225
CIKITUSI JOURNAL FOR MULTIDISCIPLINARY RESEARCH
Volume 6, Issue 5, May 2019
ISSN NO: 0975-6876
http://cikitusi.com/207
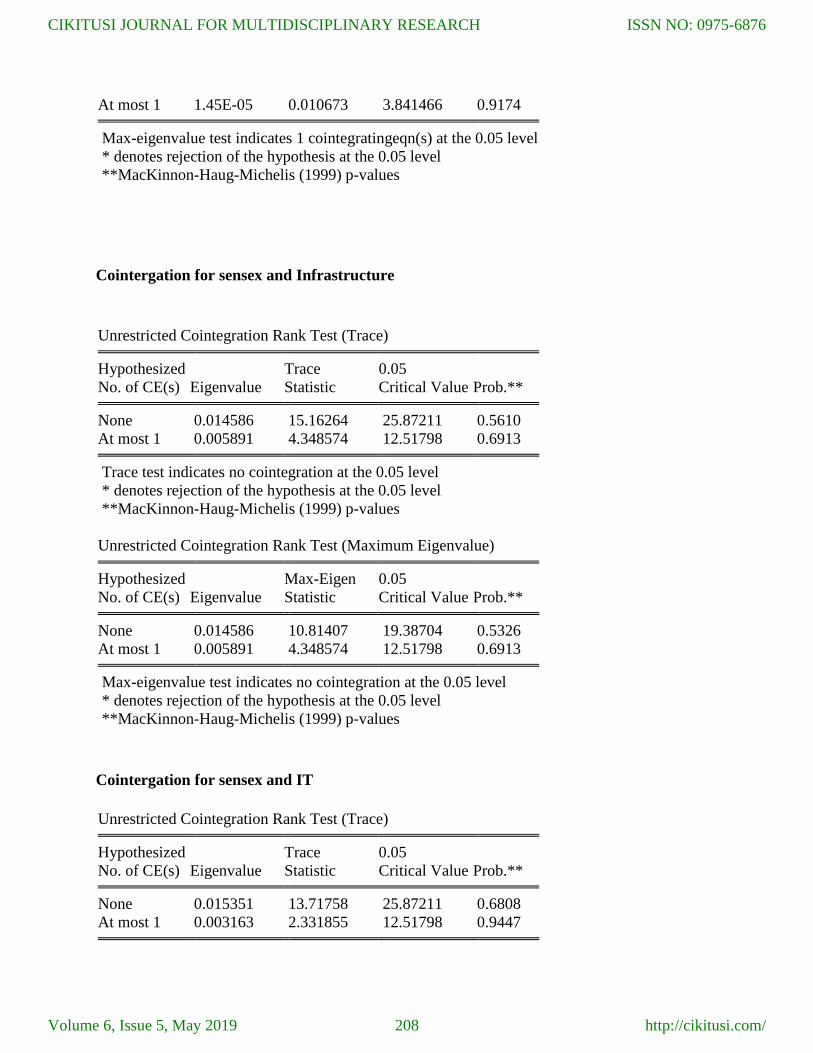
At most 1 1.45E-05 0.010673 3.841466 0.9174
Max-eigenvalue test indicates 1 cointegratingeqn(s) at the 0.05 level
* denotes rejection of the hypothesis at the 0.05 level
**MacKinnon-Haug-Michelis (1999) p-values
Cointergation for sensex and Infrastructure
Unrestricted Cointegration Rank Test (Trace)
Hypothesized Trace 0.05
No. of CE(s) Eigenvalue Statistic Critical Value Prob.**
None 0.014586 15.16264 25.87211 0.5610
At most 1 0.005891 4.348574 12.51798 0.6913
Trace test indicates no cointegration at the 0.05 level
* denotes rejection of the hypothesis at the 0.05 level
**MacKinnon-Haug-Michelis (1999) p-values
Unrestricted Cointegration Rank Test (Maximum Eigenvalue)
Hypothesized Max-Eigen 0.05
No. of CE(s) Eigenvalue Statistic Critical Value Prob.**
None 0.014586 10.81407 19.38704 0.5326
At most 1 0.005891 4.348574 12.51798 0.6913
Max-eigenvalue test indicates no cointegration at the 0.05 level
* denotes rejection of the hypothesis at the 0.05 level
**MacKinnon-Haug-Michelis (1999) p-values
Cointergation for sensex and IT
Unrestricted Cointegration Rank Test (Trace)
Hypothesized Trace 0.05
No. of CE(s) Eigenvalue Statistic Critical Value Prob.**
None 0.015351 13.71758 25.87211 0.6808
At most 1 0.003163 2.331855 12.51798 0.9447
CIKITUSI JOURNAL FOR MULTIDISCIPLINARY RESEARCH
Volume 6, Issue 5, May 2019
ISSN NO: 0975-6876
http://cikitusi.com/208

Trace test indicates no cointegration at the 0.05 level
* denotes rejection of the hypothesis at the 0.05 level
**MacKinnon-Haug-Michelis (1999) p-values
Unrestricted Cointegration Rank Test (Maximum Eigenvalue)
Hypothesized Max-Eigen 0.05
No. of CE(s) Eigenvalue Statistic Critical Value Prob.**
None 0.015351 11.38572 19.38704 0.4744
At most 1 0.003163 2.331855 12.51798 0.9447
Max-eigenvalue test indicates no cointegration at the 0.05 level
* denotes rejection of the hypothesis at the 0.05 level
**MacKinnon-Haug-Michelis (1999) p-values
Cointergation for sensex and Metal
Unrestricted Cointegration Rank Test (Trace)
Hypothesized Trace 0.05
No. of CE(s) Eigenvalue Statistic Critical Value Prob.**
None 0.016778 18.20055 25.87211 0.3306
At most 1 0.007845 5.780816 12.51798 0.4886
Trace test indicates no cointegration at the 0.05 level
* denotes rejection of the hypothesis at the 0.05 level
**MacKinnon-Haug-Michelis (1999) p-values
Unrestricted Cointegration Rank Test (Maximum Eigenvalue)
Hypothesized Max-Eigen 0.05
No. of CE(s) Eigenvalue Statistic Critical Value Prob.**
None 0.016778 12.41974 19.38704 0.3771
At most 1 0.007845 5.780816 12.51798 0.4886
Max-eigenvalue test indicates no cointegration at the 0.05 level
* denotes rejection of the hypothesis at the 0.05 level
**MacKinnon-Haug-Michelis (1999) p-values
Cointergation for sensex and Oil & Gas
Unrestricted Cointegration Rank Test (Trace)
CIKITUSI JOURNAL FOR MULTIDISCIPLINARY RESEARCH
Volume 6, Issue 5, May 2019
ISSN NO: 0975-6876
http://cikitusi.com/209
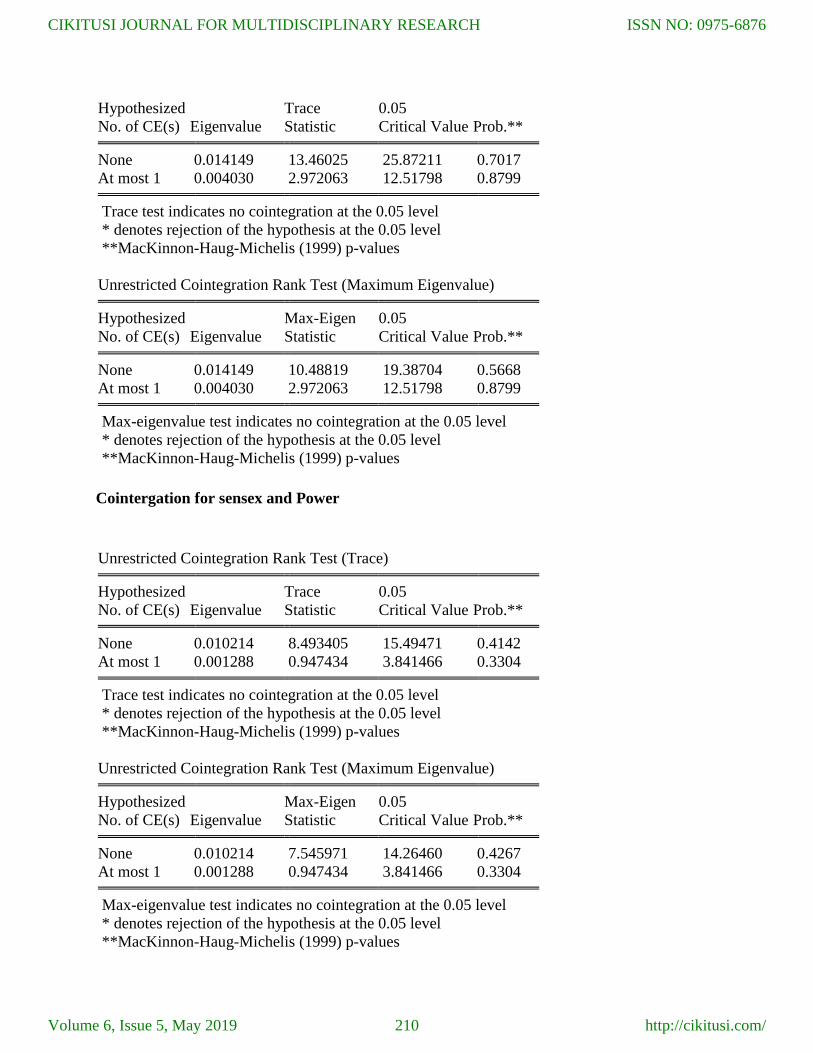
Hypothesized Trace 0.05
No. of CE(s) Eigenvalue Statistic Critical Value Prob.**
None 0.014149 13.46025 25.87211 0.7017
At most 1 0.004030 2.972063 12.51798 0.8799
Trace test indicates no cointegration at the 0.05 level
* denotes rejection of the hypothesis at the 0.05 level
**MacKinnon-Haug-Michelis (1999) p-values
Unrestricted Cointegration Rank Test (Maximum Eigenvalue)
Hypothesized Max-Eigen 0.05
No. of CE(s) Eigenvalue Statistic Critical Value Prob.**
None 0.014149 10.48819 19.38704 0.5668
At most 1 0.004030 2.972063 12.51798 0.8799
Max-eigenvalue test indicates no cointegration at the 0.05 level
* denotes rejection of the hypothesis at the 0.05 level
**MacKinnon-Haug-Michelis (1999) p-values
Cointergation for sensex and Power
Unrestricted Cointegration Rank Test (Trace)
Hypothesized Trace 0.05
No. of CE(s) Eigenvalue Statistic Critical Value Prob.**
None 0.010214 8.493405 15.49471 0.4142
At most 1 0.001288 0.947434 3.841466 0.3304
Trace test indicates no cointegration at the 0.05 level
* denotes rejection of the hypothesis at the 0.05 level
**MacKinnon-Haug-Michelis (1999) p-values
Unrestricted Cointegration Rank Test (Maximum Eigenvalue)
Hypothesized Max-Eigen 0.05
No. of CE(s) Eigenvalue Statistic Critical Value Prob.**
None 0.010214 7.545971 14.26460 0.4267
At most 1 0.001288 0.947434 3.841466 0.3304
Max-eigenvalue test indicates no cointegration at the 0.05 level
* denotes rejection of the hypothesis at the 0.05 level
**MacKinnon-Haug-Michelis (1999) p-values
CIKITUSI JOURNAL FOR MULTIDISCIPLINARY RESEARCH
Volume 6, Issue 5, May 2019
ISSN NO: 0975-6876
http://cikitusi.com/210
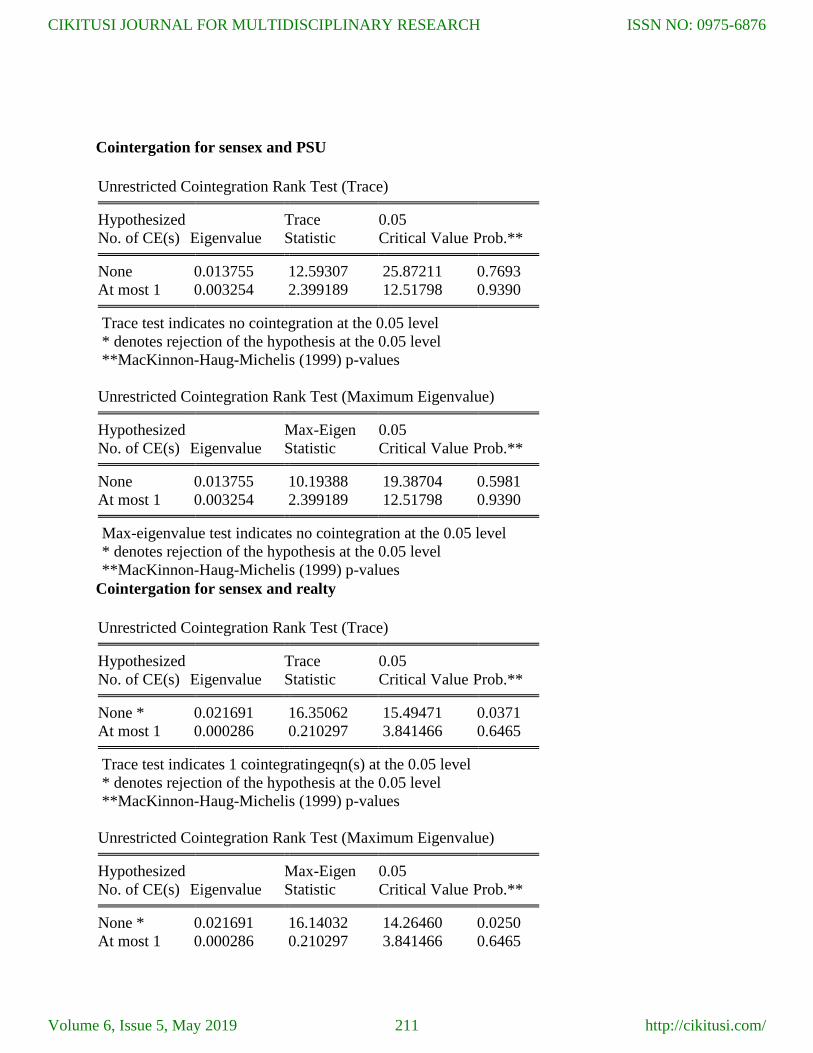
Cointergation for sensex and PSU
Unrestricted Cointegration Rank Test (Trace)
Hypothesized Trace 0.05
No. of CE(s) Eigenvalue Statistic Critical Value Prob.**
None 0.013755 12.59307 25.87211 0.7693
At most 1 0.003254 2.399189 12.51798 0.9390
Trace test indicates no cointegration at the 0.05 level
* denotes rejection of the hypothesis at the 0.05 level
**MacKinnon-Haug-Michelis (1999) p-values
Unrestricted Cointegration Rank Test (Maximum Eigenvalue)
Hypothesized Max-Eigen 0.05
No. of CE(s) Eigenvalue Statistic Critical Value Prob.**
None 0.013755 10.19388 19.38704 0.5981
At most 1 0.003254 2.399189 12.51798 0.9390
Max-eigenvalue test indicates no cointegration at the 0.05 level
* denotes rejection of the hypothesis at the 0.05 level
**MacKinnon-Haug-Michelis (1999) p-values
Cointergation for sensex and realty
Unrestricted Cointegration Rank Test (Trace)
Hypothesized Trace 0.05
No. of CE(s) Eigenvalue Statistic Critical Value Prob.**
None * 0.021691 16.35062 15.49471 0.0371
At most 1 0.000286 0.210297 3.841466 0.6465
Trace test indicates 1 cointegratingeqn(s) at the 0.05 level
* denotes rejection of the hypothesis at the 0.05 level
**MacKinnon-Haug-Michelis (1999) p-values
Unrestricted Cointegration Rank Test (Maximum Eigenvalue)
Hypothesized Max-Eigen 0.05
No. of CE(s) Eigenvalue Statistic Critical Value Prob.**
None * 0.021691 16.14032 14.26460 0.0250
At most 1 0.000286 0.210297 3.841466 0.6465
CIKITUSI JOURNAL FOR MULTIDISCIPLINARY RESEARCH
Volume 6, Issue 5, May 2019
ISSN NO: 0975-6876
http://cikitusi.com/211
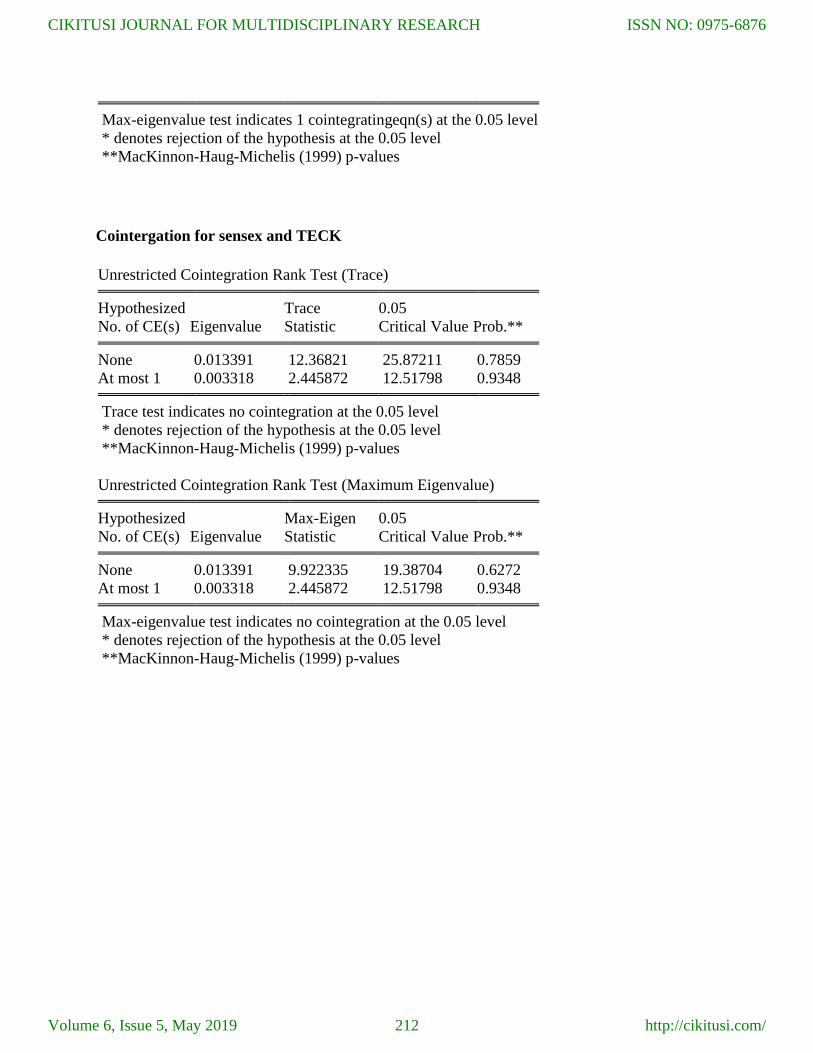
Max-eigenvalue test indicates 1 cointegratingeqn(s) at the 0.05 level
* denotes rejection of the hypothesis at the 0.05 level
**MacKinnon-Haug-Michelis (1999) p-values
Cointergation for sensex and TECK
Unrestricted Cointegration Rank Test (Trace)
Hypothesized Trace 0.05
No. of CE(s) Eigenvalue Statistic Critical Value Prob.**
None 0.013391 12.36821 25.87211 0.7859
At most 1 0.003318 2.445872 12.51798 0.9348
Trace test indicates no cointegration at the 0.05 level
* denotes rejection of the hypothesis at the 0.05 level
**MacKinnon-Haug-Michelis (1999) p-values
Unrestricted Cointegration Rank Test (Maximum Eigenvalue)
Hypothesized Max-Eigen 0.05
No. of CE(s) Eigenvalue Statistic Critical Value Prob.**
None 0.013391 9.922335 19.38704 0.6272
At most 1 0.003318 2.445872 12.51798 0.9348
Max-eigenvalue test indicates no cointegration at the 0.05 level
* denotes rejection of the hypothesis at the 0.05 level
**MacKinnon-Haug-Michelis (1999) p-values
CIKITUSI JOURNAL FOR MULTIDISCIPLINARY RESEARCH
Volume 6, Issue 5, May 2019
ISSN NO: 0975-6876
http://cikitusi.com/212