Embed Size (px)
Citation preview

11/18/2013
SC2013 TutorialHow to Analyze the Performance of Parallel Codes 101
A case study with Open|SpeedShop
Section 2Introduction into Tools and Open|SpeedShop

211/18/2013
Open|SpeedShop Tool Set Open Source Performance Analysis Tool Framework
Most common performance analysis steps all in one tool Combines tracing and sampling techniques Extensible by plugins for data collection and representation Gathers and displays several types of performance information
Flexible and Easy to use User access through:
GUI, Command Line, Python Scripting, convenience scripts Scalable Data Collection
Instrumentation of unmodified application binaries New option for hierarchical online data aggregation
Supports a wide range of systems Extensively used and tested on a variety of Linux clusters Cray XT/XE/XK and Blue Gene L/P/Q support
How to Analyze the Performance of Parallel Codes 101 - A Tutorial at SC'13
11/18/2013
srun –n4 –N1 smg2000 –n 65 65 65 osspcsamp “srun –n4 –N1 smg2000 –n 65 65 65” MPI Application
Post-mortemO|SS
http://www.openspeedshop.org/
Open|SpeedShop Workflow
411/18/2013
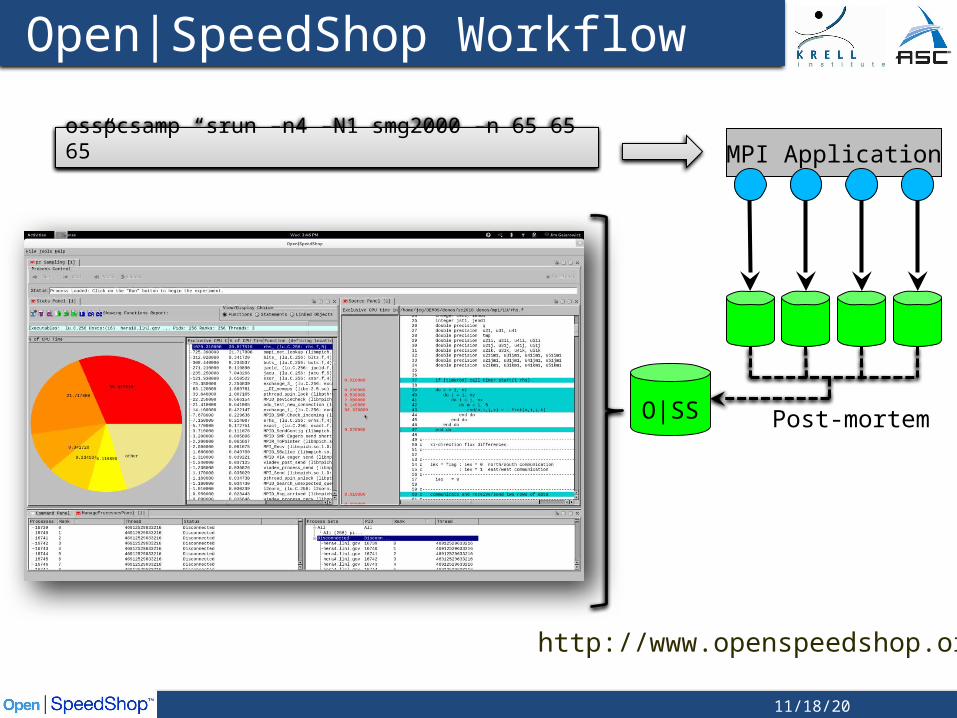
Alternative Interfaces Scripting language
Immediate command interface O|SS interactive command line (CLI)
Python module
How to Analyze the Performance of Parallel Codes 101 - A Tutorial at SC'13
Experiment Commands expAttach expCreate expDetach expGo expView
List Commands list –v exp list –v hosts list –v src
Session Commands setBreak openGui
import openss
my_filename=openss.FileList("myprog.a.out")my_exptype=openss.ExpTypeList("pcsamp")my_id=openss.expCreate(my_filename,my_exptype)
openss.expGo()
My_metric_list = openss.MetricList("exclusive")my_viewtype = openss.ViewTypeList("pcsamp”)result = openss.expView(my_id,my_viewtype,my_metric_list)
11/18/2013
Central Concept: Experiments Users pick experiments:
What to measure and from which sources? How to select, view, and analyze the resulting data?
Two main classes: Statistical Sampling
• Periodically interrupt execution and record location• Useful to get an overview • Low and uniform overhead
Event Tracing• Gather and store individual application events• Provides detailed per event information• Can lead to huge data volumes
O|SS can be extended with additional experiments

611/18/2013
Sampling Experiments in O|SS PC Sampling (pcsamp)
Record PC repeatedly at user defined time interval Low overhead overview of time distribution Good first step, lightweight overview
Call Path Profiling (usertime) PC Sampling and Call stacks for each sample Provides inclusive and exclusive timing data Use to find hot call paths, whom is calling who
Hardware Counters (hwc, hwctime, hwcsamp) Access to data like cache and TLB misses hwc, hwctime:
• Sample a HWC event based on an event threshold• Default event is PAPI_TOT_CYC overflows
hwcsamp:• Periodically sample up to 6 counter events based (hwcsamp)• Default events are PAPI_FP_OPS and PAPI_TOT_CYC
How to Analyze the Performance of Parallel Codes 101 - A Tutorial at SC'13
711/18/2013
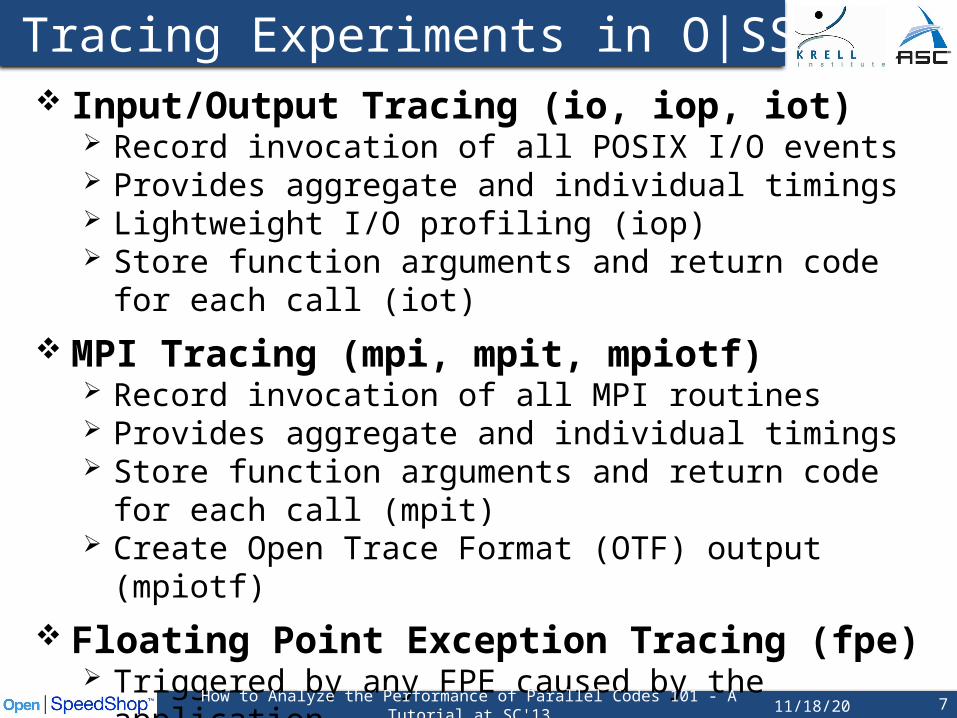
Tracing Experiments in O|SS Input/Output Tracing (io, iop, iot)
Record invocation of all POSIX I/O events Provides aggregate and individual timings Lightweight I/O profiling (iop) Store function arguments and return code for each call (iot)
MPI Tracing (mpi, mpit, mpiotf) Record invocation of all MPI routines Provides aggregate and individual timings Store function arguments and return code for each call (mpit) Create Open Trace Format (OTF) output (mpiotf)
Floating Point Exception Tracing (fpe) Triggered by any FPE caused by the application Helps pinpoint numerical problem areas
How to Analyze the Performance of Parallel Codes 101 - A Tutorial at SC'13

811/18/2013
Performance Analysis in Parallel How to deal with concurrency?
Any experiment can be applied to parallel application• Important step: aggregation or selection of data
Special experiments targeting parallelism/synchronization O|SS supports MPI and threaded codes
Automatically applied to all tasks/threads Default views aggregate across all tasks/threads Data from individual tasks/threads available Thread support (incl. OpenMP) based on POSIX threads
Specific parallel experiments (e.g., MPI) Wraps MPI calls and reports
• MPI routine time• MPI routine parameter information
The mpit experiment also store function arguments and return code for each call
How to Analyze the Performance of Parallel Codes 101 - A Tutorial at SC'13
911/18/2013
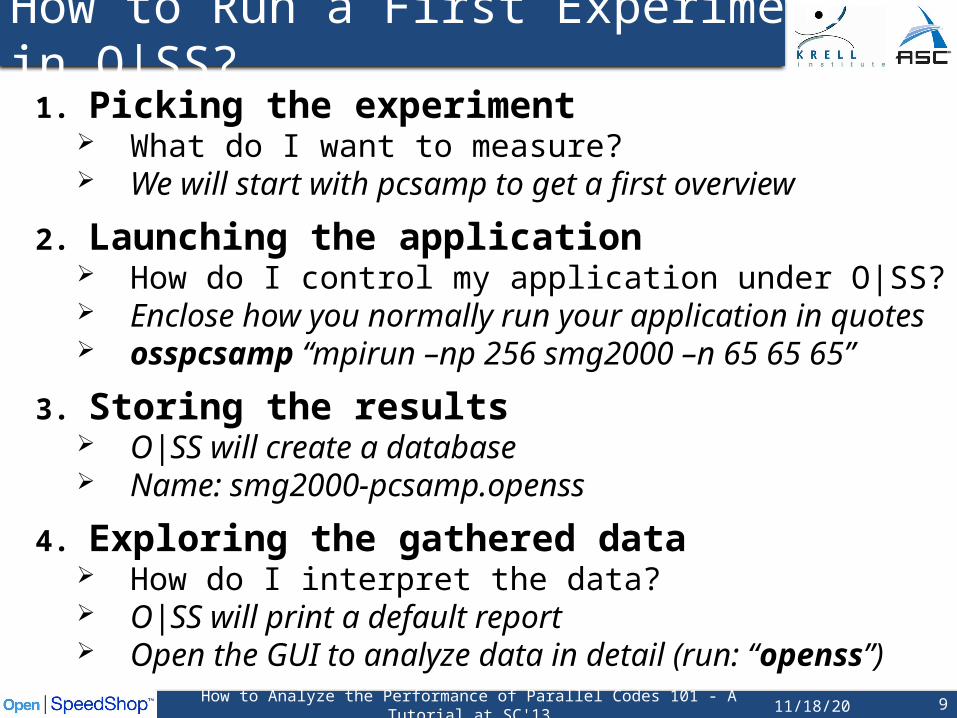
How to Run a First Experiment in O|SS?1. Picking the experiment
What do I want to measure? We will start with pcsamp to get a first overview
2. Launching the application How do I control my application under O|SS? Enclose how you normally run your application in quotes osspcsamp “mpirun –np 256 smg2000 –n 65 65 65”
3. Storing the results O|SS will create a database Name: smg2000-pcsamp.openss
4. Exploring the gathered data How do I interpret the data? O|SS will print a default report Open the GUI to analyze data in detail (run: “openss”)
How to Analyze the Performance of Parallel Codes 101 - A Tutorial at SC'13
1011/18/2013
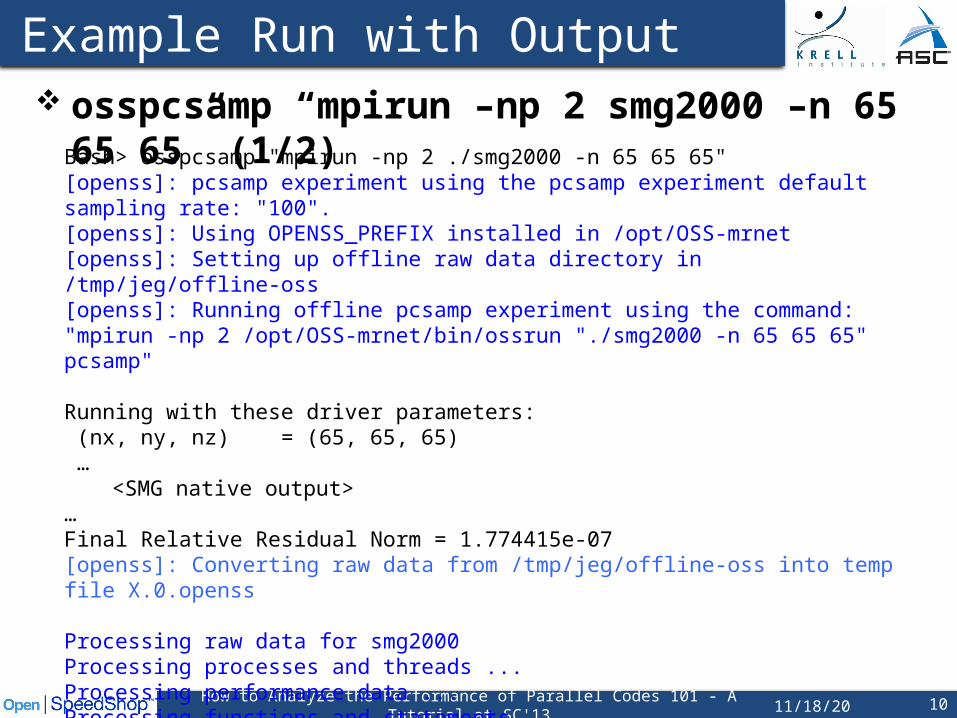
Example Run with Output osspcsamp “mpirun –np 2 smg2000 –n 65 65 65” (1/2)
How to Analyze the Performance of Parallel Codes 101 - A Tutorial at SC'13
Bash> osspcsamp "mpirun -np 2 ./smg2000 -n 65 65 65"[openss]: pcsamp experiment using the pcsamp experiment default sampling rate: "100".[openss]: Using OPENSS_PREFIX installed in /opt/OSS-mrnet[openss]: Setting up offline raw data directory in /tmp/jeg/offline-oss[openss]: Running offline pcsamp experiment using the command:"mpirun -np 2 /opt/OSS-mrnet/bin/ossrun "./smg2000 -n 65 65 65" pcsamp"
Running with these driver parameters: (nx, ny, nz) = (65, 65, 65) …
<SMG native output>…Final Relative Residual Norm = 1.774415e-07[openss]: Converting raw data from /tmp/jeg/offline-oss into temp file X.0.openss
Processing raw data for smg2000Processing processes and threads ...Processing performance data ...Processing functions and statements ...
1111/18/2013
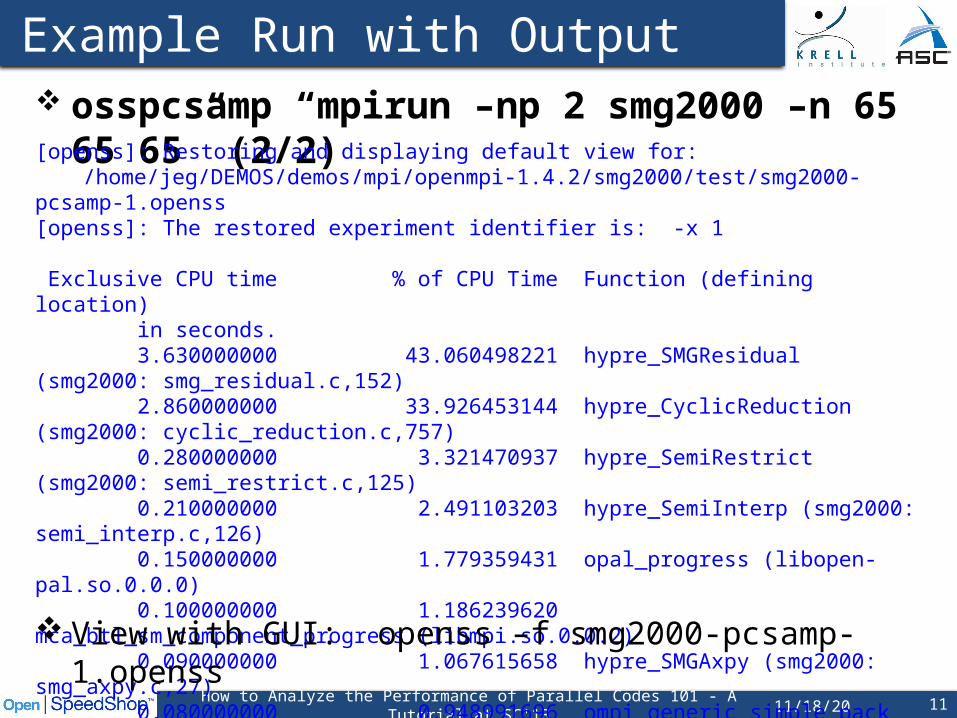
Example Run with Output osspcsamp “mpirun –np 2 smg2000 –n 65 65 65” (2/2)
How to Analyze the Performance of Parallel Codes 101 - A Tutorial at SC'13
[openss]: Restoring and displaying default view for:/home/jeg/DEMOS/demos/mpi/openmpi-1.4.2/smg2000/test/smg2000-pcsamp-1.openss
[openss]: The restored experiment identifier is: -x 1
Exclusive CPU time % of CPU Time Function (defining location) in seconds. 3.630000000 43.060498221 hypre_SMGResidual (smg2000: smg_residual.c,152) 2.860000000 33.926453144 hypre_CyclicReduction (smg2000: cyclic_reduction.c,757) 0.280000000 3.321470937 hypre_SemiRestrict (smg2000: semi_restrict.c,125) 0.210000000 2.491103203 hypre_SemiInterp (smg2000: semi_interp.c,126) 0.150000000 1.779359431 opal_progress (libopen-pal.so.0.0.0) 0.100000000 1.186239620 mca_btl_sm_component_progress (libmpi.so.0.0.2) 0.090000000 1.067615658 hypre_SMGAxpy (smg2000: smg_axpy.c,27) 0.080000000 0.948991696 ompi_generic_simple_pack (libmpi.so.0.0.2) 0.070000000 0.830367734 __GI_memcpy (libc-2.10.2.so) 0.070000000 0.830367734 hypre_StructVectorSetConstantValues (smg2000: struct_vector.c,537) 0.060000000 0.711743772 hypre_SMG3BuildRAPSym (smg2000: smg3_setup_rap.c,233) View with GUI: openss –f smg2000-pcsamp-1.openss
1211/18/2013
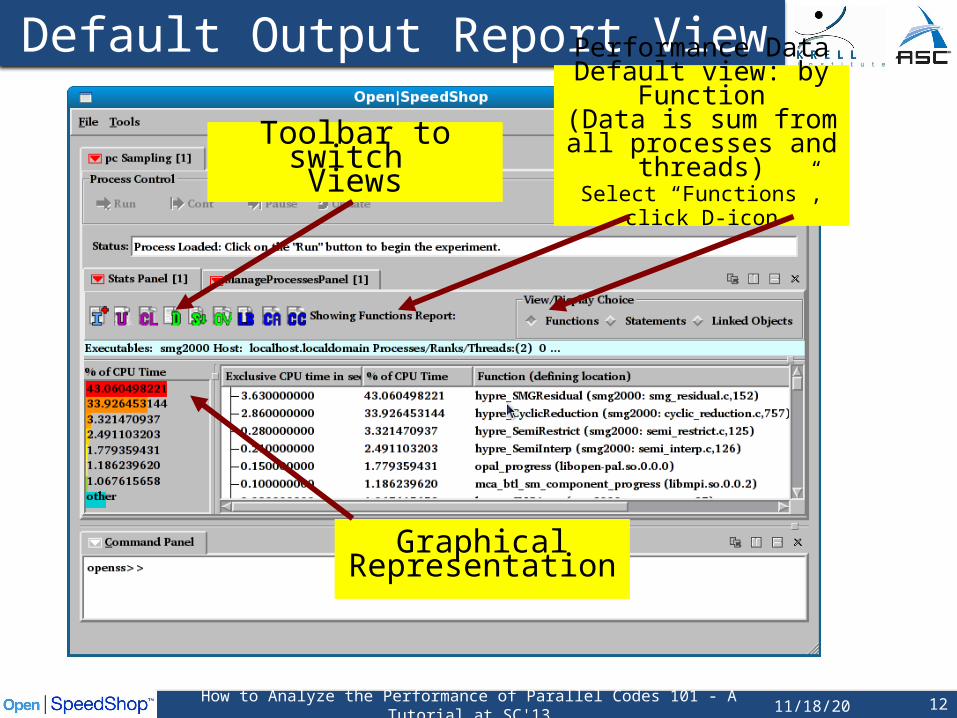
Default Output Report View
How to Analyze the Performance of Parallel Codes 101 - A Tutorial at SC'13
Performance DataDefault view: by Function
(Data is sum from all processes and threads)
Select “Functions”, click D-icon
Toolbar to switch Views
Graphical Representation
1311/18/2013
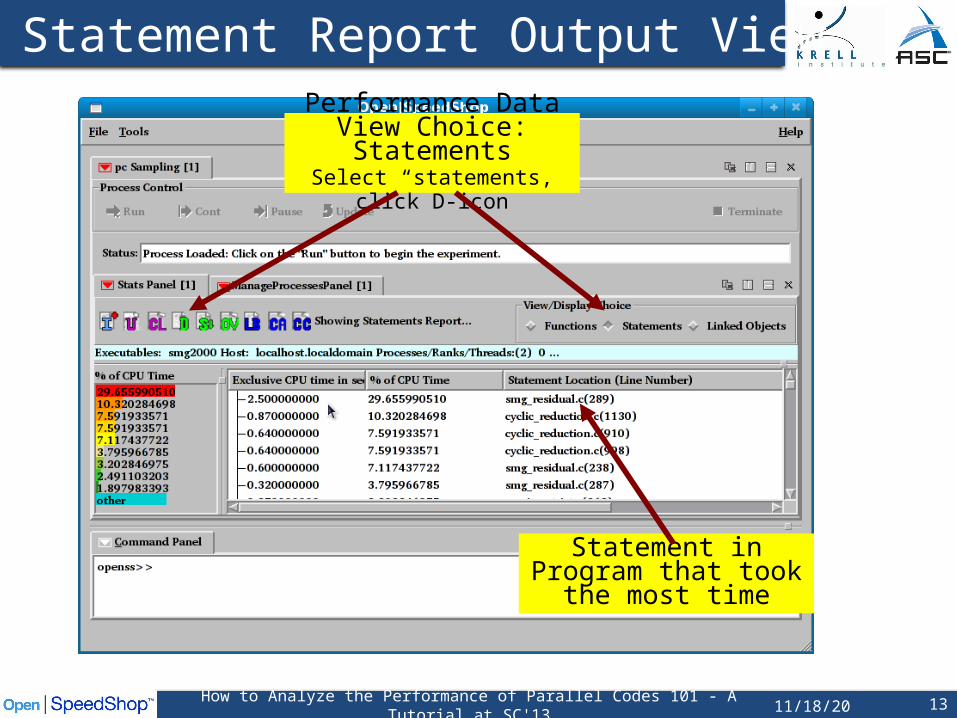
Statement Report Output View
How to Analyze the Performance of Parallel Codes 101 - A Tutorial at SC'13
Performance Data
View Choice: StatementsSelect “statements, click D-icon
Statement in Program that took the most time
1411/18/2013
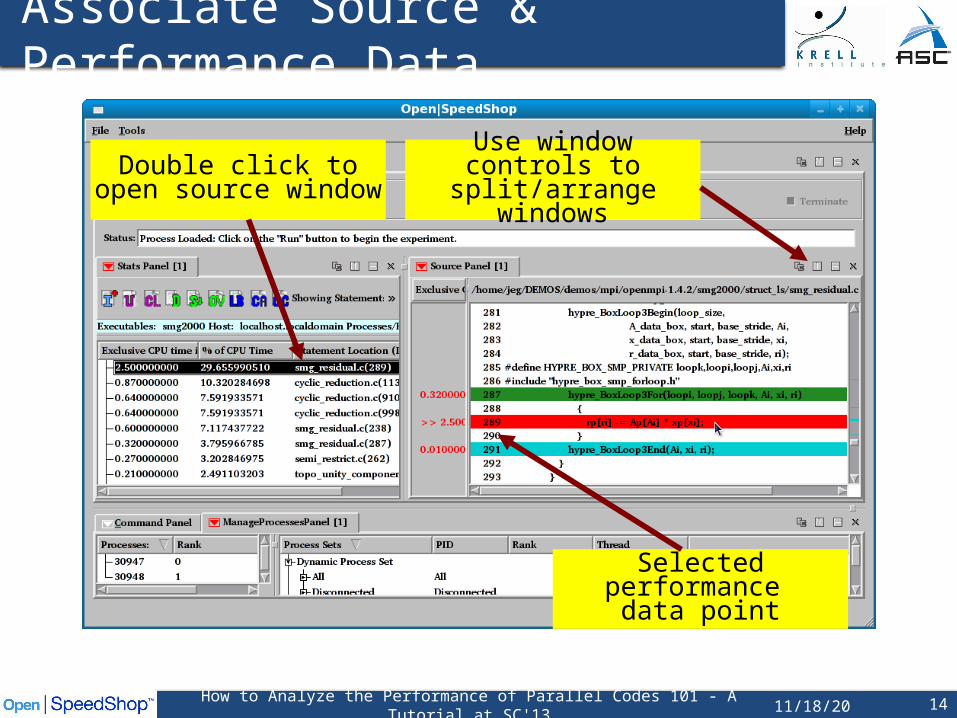
Associate Source & Performance Data
How to Analyze the Performance of Parallel Codes 101 - A Tutorial at SC'13
Double click to open
source windowUse window controls to split/arrange windows
Selected performance data point

1511/18/2013
Summary
How to Analyze the Performance of Parallel Codes 101 - A Tutorial at SC'13
Place the way you run your application normally in quotes and pass it as an argument to osspcsamp, or any of the other experiment convenience scripts: ossio, ossmpi, etc. osspcsamp “srun –N 8 –n 64 ./mpi_application app_args”
Open|SpeedShop sends a summary profile to stdout Open|SpeedShop creates a database file Display alternative views of the data with the GUI via:
openss –f <database file> Display alternative views of the data with the CLI via:
openss –cli –f <database file> On clusters, need to set OPENSS_RAWDATA_DIR
Should point to a directory in a shared file system More on this later – usually done in a module or dotkit file.
Start with pcsamp for overview of performance Then home into performance issues with other experiments

11/18/2013
Digging Deeper Multiple interfaces
GUI for easy display of performance data CLI makes remote access easy Python module allows easy integration into scripts
Usertime experiments provide inclusive/exclusive times Time spent inside a routine vs. its children Key view: butterfly
Comparisons Between experiments to study improvements/changes Between ranks/threads to understand differences/outliers
Dedicated views for parallel executions Load balance view Use custom comparison to compare ranks or threads
16