Embed Size (px)
Citation preview
112 Consolidated Financial Statements and Notes Independent Auditors' Fees
04
Consolidated Financial Statements and Notes
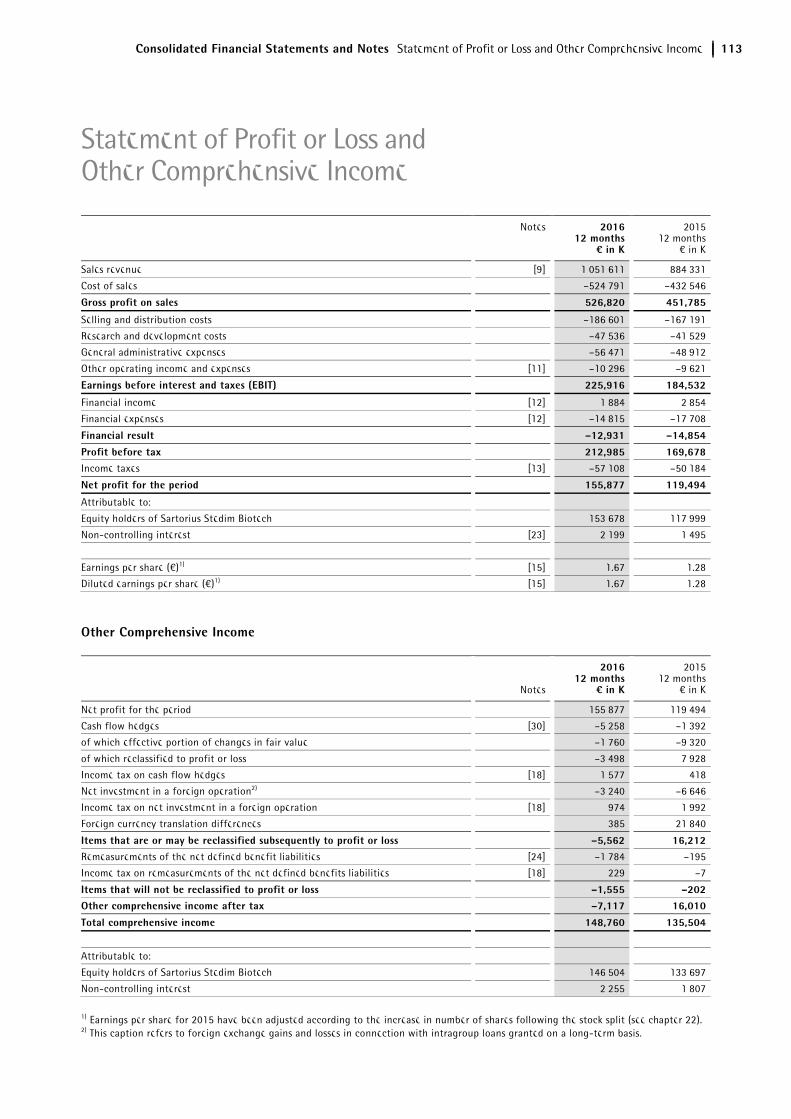
Consolidated Financial Statements and Notes Statement of Profit or Loss and Other Comprehensive Income 113
Notes 2016 12 months
¤ in K
201512 months
€ in K
Sales revenue [9] 1,051,611 884,331
Cost of sales –524,791 –432,546
Gross profit on sales 526,820 451,785
Selling and distribution costs –186,601 –167,191
Research and development costs –47,536 –41,529
General administrative expenses –56,471 –48,912
Other operating income and expenses [11] –10,296 –9,621
Earnings before interest and taxes (EBIT) 225,916 184,532
Financial income [12] 1,884 2,854
Financial expenses [12] –14,815 –17,708
Financial result –12,931 –14,854
Profit before tax 212,985 169,678Income taxes [13] –57,108 –50,184
Net profit for the period 155,877 119,494
Attributable to:
Equity holders of Sartorius Stedim Biotech 153,678 117,999
Non-controlling interest [23] 2,199 1,495
Earnings per share (€)1) [15] 1.67 1.28
Diluted earnings per share (€)1) [15] 1.67 1.28
Other Comprehensive Income
Notes
2016 12 months
¤ in K
201512 months
€ in K
Net profit for the period 155,877 119,494
Cash flow hedges [30] –5,258 –1,392
of which effective portion of changes in fair value –1,760 –9,320
of which reclassified to profit or loss –3,498 7,928
Income tax on cash flow hedges [18] 1,577 418
Net investment in a foreign operation2) –3,240 –6,646
Income tax on net investment in a foreign operation [18] 974 1,992
Foreign currency translation differences 385 21,840
Items that are or may be reclassified subsequently to profit or loss –5,562 16,212Remeasurements of the net defined benefit liabilities [24] –1,784 –195
Income tax on remeasurements of the net defined benefits liabilities [18] 229 –7
Items that will not be reclassified to profit or loss –1,555 –202Other comprehensive income after tax –7,117 16,010
Total comprehensive income 148,760 135,504
Attributable to:
Equity holders of Sartorius Stedim Biotech 146,504 133,697
Non-controlling interest 2,255 1,807
1) Earnings per share for 2015 have been adjusted according to the increase in number of shares following the stock split (see chapter 22). 2) This caption refers to foreign exchange gains and losses in connection with intragroup loans granted on a long-term basis.
Statement of Profit or Loss and Other Comprehensive Income
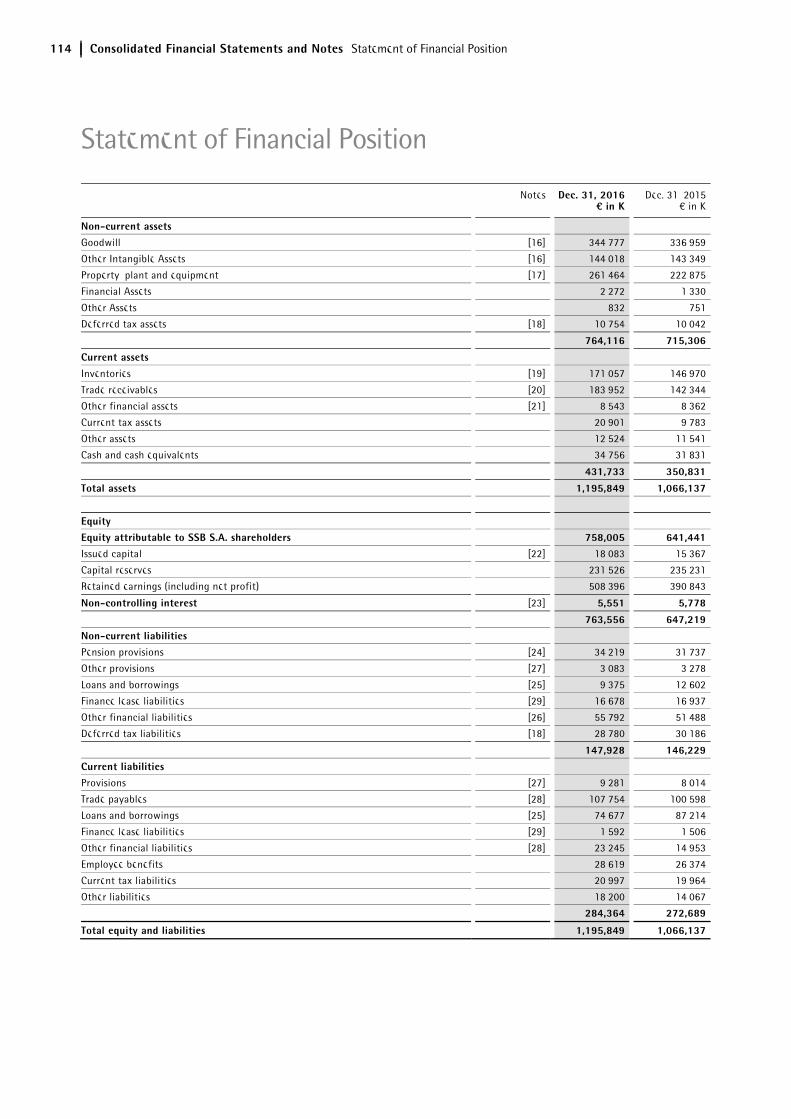
114 Consolidated Financial Statements and Notes Statement of Financial Position
Notes Dec. 31, 2016
¤ in K Dec. 31, 2015
€ in K
Non-current assets Goodwill [16] 344,777 336,959
Other Intangible Assets [16] 144,018 143,349
Property, plant and equipment [17] 261,464 222,875
Financial Assets 2,272 1,330
Other Assets 832 751
Deferred tax assets [18] 10,754 10,042
764,116 715,306
Current assets
Inventories [19] 171,057 146,970
Trade receivables [20] 183,952 142,344
Other financial assets [21] 8,543 8,362
Current tax assets 20,901 9,783
Other assets 12,524 11,541
Cash and cash equivalents 34,756 31,831
431,733 350,831
Total assets 1,195,849 1,066,137
Equity Equity attributable to SSB S.A. shareholders 758,005 641,441Issued capital [22] 18,083 15,367
Capital reserves 231,526 235,231
Retained earnings (including net profit) 508,396 390,843
Non-controlling interest [23] 5,551 5,778
763,556 647,219Non-current liabilities Pension provisions [24] 34,219 31,737
Other provisions [27] 3,083 3,278
Loans and borrowings [25] 9,375 12,602
Finance lease liabilities [29] 16,678 16,937
Other financial liabilities [26] 55,792 51,488
Deferred tax liabilities [18] 28,780 30,186
147,928 146,229
Current liabilities Provisions [27] 9,281 8,014
Trade payables [28] 107,754 100,598
Loans and borrowings [25] 74,677 87,214
Finance lease liabilities [29] 1,592 1,506
Other financial liabilities [28] 23,245 14,953
Employee benefits 28,619 26,374
Current tax liabilities 20,997 19,964
Other liabilities 18,200 14,067
284,364 272,689
Total equity and liabilities 1,195,849 1,066,137
Statement of Financial Position
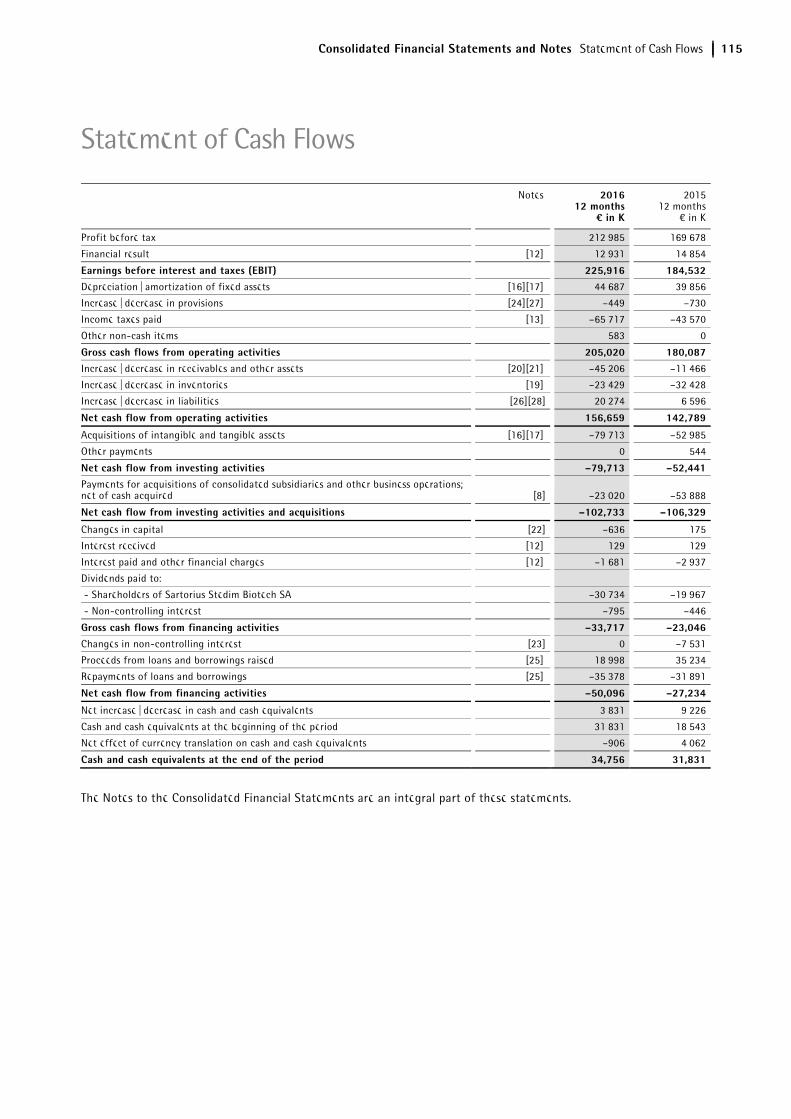
Consolidated Financial Statements and Notes Statement of Cash Flows 115
Notes 2016 12 months
¤ in K
201512 months
€ in K
Profit before tax 212,985 169,678
Financial result [12] 12,931 14,854
Earnings before interest and taxes (EBIT) 225,916 184,532Depreciation | amortization of fixed assets [16][17] 44,687 39,856
Increase | decrease in provisions [24][27] –449 –730
Income taxes paid [13] –65,717 –43,570
Other non-cash items 583 0
Gross cash flows from operating activities 205,020 180,087Increase | decrease in receivables and other assets [20][21] –45,206 –11,466
Increase | decrease in inventories [19] –23,429 –32,428
Increase | decrease in liabilities [26][28] 20,274 6,596
Net cash flow from operating activities 156,659 142,789
Acquisitions of intangible and tangible assets [16][17] –79,713 –52,985
Other payments 0 544
Net cash flow from investing activities –79,713 –52,441Payments for acquisitions of consolidated subsidiaries and other business operations; net of cash acquired [8] –23,020 –53,888
Net cash flow from investing activities and acquisitions –102,733 –106,329
Changes in capital [22] –636 175
Interest received [12] 129 129
Interest paid and other financial charges [12] –1,681 –2,937
Dividends paid to:
- Shareholders of Sartorius Stedim Biotech SA –30,734 –19,967
- Non-controlling interest –795 –446
Gross cash flows from financing activities –33,717 –23,046Changes in non-controlling interest [23] 0 –7,531
Proceeds from loans and borrowings raised [25] 18,998 35,234
Repayments of loans and borrowings [25] –35,378 –31,891
Net cash flow from financing activities –50,096 –27,234
Net increase | decrease in cash and cash equivalents 3,831 9,226
Cash and cash equivalents at the beginning of the period 31,831 18,543
Net effect of currency translation on cash and cash equivalents –906 4,062
Cash and cash equivalents at the end of the period 34,756 31,831
The Notes to the Consolidated Financial Statements are an integral part of these statements.
Statement of Cash Flows
116 Consolidated Financial Statements and Notes Statement of Changes in Equity
€ in K Issued
capital Capital
reserves Hedging reserves
Pensionreserves
Retainedearnings
Foreigncurrency
trans-lation
reservesGroup equity
Non-control-
ling interest
Totalequity
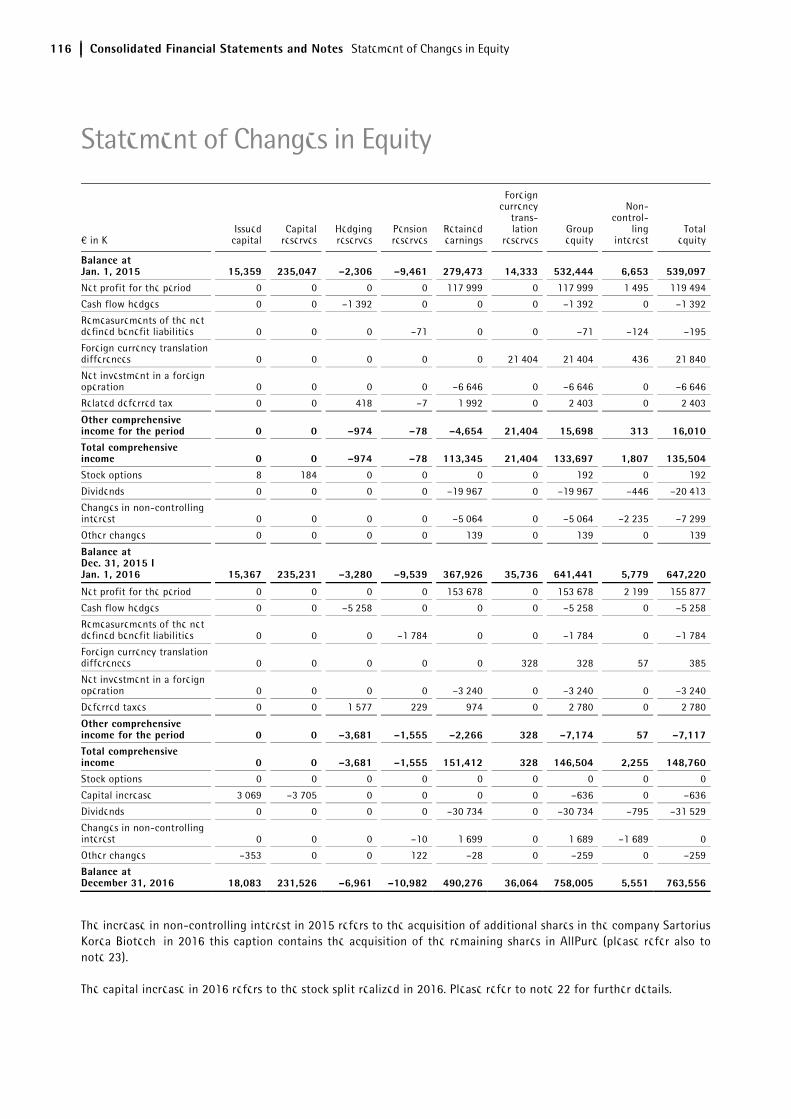
Balance at Jan. 1, 2015 15,359 235,047 –2,306 –9,461 279,473 14,333 532,444 6,653 539,097
Net profit for the period 0 0 0 0 117,999 0 117,999 1,495 119,494
Cash flow hedges 0 0 –1,392 0 0 0 –1,392 0 –1,392
Remeasurements of the net defined benefit liabilities 0 0 0 –71 0 0 –71 –124 –195
Foreign currency translation differences 0 0 0 0 0 21,404 21,404 436 21,840
Net investment in a foreign operation 0 0 0 0 –6,646 0 –6,646 0 –6,646
Related deferred tax 0 0 418 –7 1,992 0 2,403 0 2,403
Other comprehensive income for the period 0 0 –974 –78 –4,654 21,404 15,698 313 16,010
Total comprehensive income 0 0 –974 –78 113,345 21,404 133,697 1,807 135,504Stock options 8 184 0 0 0 0 192 0 192
Dividends 0 0 0 0 –19,967 0 –19,967 –446 –20,413
Changes in non-controlling interest 0 0 0 0 –5,064 0 –5,064 –2,235 –7,299
Other changes 0 0 0 0 139 0 139 0 139
Balance at Dec. 31, 2015 I Jan. 1, 2016 15,367 235,231 –3,280 –9,539 367,926 35,736 641,441 5,779 647,220
Net profit for the period 0 0 0 0 153,678 0 153,678 2,199 155,877
Cash flow hedges 0 0 –5,258 0 0 0 –5,258 0 –5,258
Remeasurements of the net defined benefit liabilities 0 0 0 –1,784 0 0 –1,784 0 –1,784
Foreign currency translation differences 0 0 0 0 0 328 328 57 385
Net investment in a foreign operation 0 0 0 0 –3,240 0 –3,240 0 –3,240
Deferred taxes 0 0 1,577 229 974 0 2,780 0 2,780
Other comprehensive income for the period 0 0 –3,681 –1,555 –2,266 328 –7,174 57 –7,117Total comprehensive income 0 0 –3,681 –1,555 151,412 328 146,504 2,255 148,760Stock options 0 0 0 0 0 0 0 0 0
Capital increase 3,069 –3,705 0 0 0 0 –636 0 –636
Dividends 0 0 0 0 –30,734 0 –30,734 –795 –31,529
Changes in non-controlling interest 0 0 0 –10 1,699 0 1,689 –1,689 0
Other changes –353 0 0 122 –28 0 –259 0 –259
Balance at December 31, 2016 18,083 231,526 –6,961 –10,982 490,276 36,064 758,005 5,551 763,556
The increase in non-controlling interest in 2015 refers to the acquisition of additional shares in the company Sartorius Korea Biotech, in 2016 this caption contains the acquisition of the remaining shares in AllPure (please refer also to note 23).
The capital increase in 2016 refers to the stock split realized in 2016. Please refer to note 22 for further details.
Statement of Changes in Equity
Consolidated Financial Statements and Notes Notes to the Financial Statements 117
1. General Information
Sartorius Stedim Biotech is a leading provider of cutting-edge equipment and services for the development, quality assurance and production processes of the biopharmaceutical industry. Its integrated solutions covering fermentation, filtration, purification, fluid management, cell culture media and lab technologies are supporting the biopharmaceutical industry around the world to develop and produce drugs safely, timely and economically. For next-generation processes, Sartorius Stedim Biotech focuses on single-use technologies and added-value services to meet the rapidly changing technology requirements of the industry it serves. Strongly rooted in the scientific community and closely allied with customers and technology partners, the company is dedicated to its philosophy of “Turning science into solutions.”
Headquartered in Aubagne, France, Sartorius Stedim Biotech S.A. is listed on the Euronext Paris (ISIN code: FR 0000053266).
Sartorius Stedim Biotech S.A.'s ultimate parent company is Sartorius AG, headquartered in Goettingen, Germany, and listed at several German stock exchanges (ISIN codes: 0007165607 ordinary shares, 0007165631 preference shares).
In compliance with the European Regulation 1606/2002 of July 19, 2002, requiring listed companies to use International Accounting Standards, the consolidated financial statements of the Sartorius Stedim Biotech Group for the year ended December 31, 2016, are compliant with the Standards and Interpretations IFRS and IFRIC of the IASB as adopted by the European Union, that are available at the following site:
http://ec.europa.eu/internal_market/accounting/ias/index_en.htm.
The consolidated financial statements are prepared in euros. Unless otherwise specified, all amounts are disclosed in thousands of euros (abbreviated as € in K). In some cases, the sum of the figures given in this report may not precisely equal the stated totals and percentages may not be exact due to rounding.
These consolidated financial statements were approved by the Board of Directors on February 16, 2017 and will be submitted for approval by the Shareholders' Meeting on April 4, 2017.
2. Effects of New Financial Reporting Standards
The following new accounting rules were applicable for the first time to the present financial statements and had no impact on the presentation of the company’s financial position and financial performance:
– Annual Improvements to IFRSs 2010 – 2012 Cycle (issued in December 2013)
Under the Annual Improvements project changes to seven standards were implemented. These amendments are supposed to clarify the existing regulations. Additionally those changes have an impact on disclosures. The affected standards are IFRS 2, IFRS 3, IFRS 8, IFRS 13, IAS 16, IAS 24 and IAS 38.
– Annual Improvements to IFRSs 2012 – 2014 Cycle (issued in September 2014)
This cycle concerns the standards IFRS 5, IFRS 7, IAS 19 and IAS 34.
– Amendments to IAS 1 (Disclosure Initiative)
These changes apply to various disclosure topics. It is clarified that disclosures in the notes are only required if the content is significant.
– Amendments to IAS 16 and 38 (Clarification of Acceptable Methods of Depreciation and Amortization)
These amendments provide guidance on the determination of an appropriate depreciation method. Methods based on revenue are generally not applicable to tangible assets, to intangible assets only in exceptional cases.
– Amendments to IAS 16 and 41 (Agriculture: Bearer Plants)
According to these changes bearer plants should be treated as property, plant & equipment in future.
– Amendments to IAS 19 (Employee Contributions)
The amendments clarify the regulations on the accounting of employee contributions in respect of service.
Notes to the Financial Statements
118 Consolidated Financial Statements and Notes Notes to the Financial Statements
– Amendments to IAS 27 (Equity-Methods in Separate Financial Statements)
This change reinforces the equity method as an alternative accounting treatment for shares in affiliated companies, joint ventures and associated entities in the individual financial statements of an investor.
– Amendments to IFRS 10, IFRS 12, and IAS 28 (Investment Entities: Applying the Consolidation Exception)
The amendments clarify which subsidiaries of investment entities have to be consolidated and which subsidiaries are to be carried at fair value.
– Amendments to IFRS 11 (Accounting for Acquisitions of Interests in Joint Operations)
In this project it was concluded that the most appropriate approach to account for the acquisition of an interest in a joint operation that is a business is to apply the relevant principles for business combinations in IFRS 3.
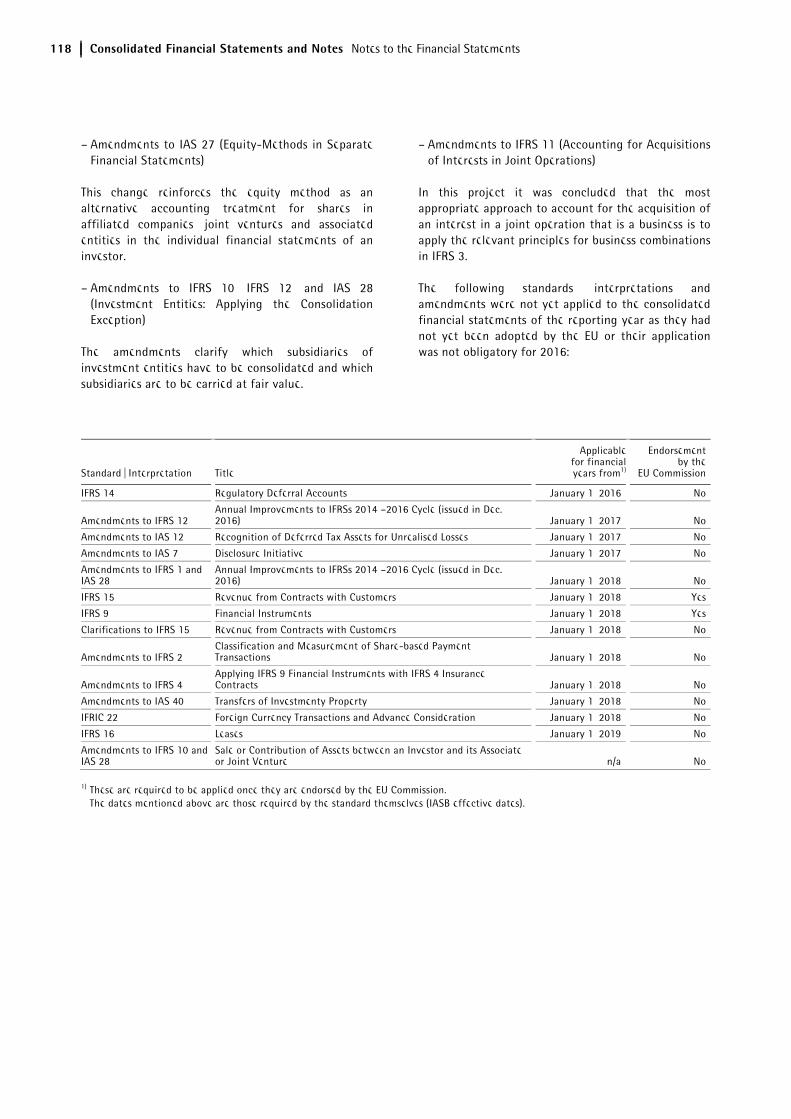
The following standards, interpretations and amendments were not yet applied to the consolidated financial statements of the reporting year as they had not yet been adopted by the EU or their application was not obligatory for 2016:
Standard | Interpretation Title
Applicablefor financialyears from1)
Endorsement by the
EU Commission
IFRS 14 Regulatory Deferral Accounts January 1, 2016 No
Amendments to IFRS 12 Annual Improvements to IFRSs 2014 –2016 Cycle (issued in Dec. 2016) January 1, 2017 No
Amendments to IAS 12 Recognition of Deferred Tax Assets for Unrealised Losses January 1, 2017 No
Amendments to IAS 7 Disclosure Initiative January 1, 2017 No
Amendments to IFRS 1 and IAS 28
Annual Improvements to IFRSs 2014 –2016 Cycle (issued in Dec. 2016) January 1, 2018 No
IFRS 15 Revenue from Contracts with Customers January 1, 2018 Yes
IFRS 9 Financial Instruments January 1, 2018 Yes
Clarifications to IFRS 15 Revenue from Contracts with Customers January 1, 2018 No
Amendments to IFRS 2 Classification and Measurement of Share-based Payment Transactions January 1, 2018 No
Amendments to IFRS 4 Applying IFRS 9 Financial Instruments with IFRS 4 Insurance Contracts January 1, 2018 No
Amendments to IAS 40 Transfers of Investmenty Property January 1, 2018 No
IFRIC 22 Foreign Currency Transactions and Advance Consideration January 1, 2018 No
IFRS 16 Leases January 1, 2019 No
Amendments to IFRS 10 and IAS 28
Sale or Contribution of Assets between an Investor and its Associate or Joint Venture n/a No
1) These are required to be applied once they are endorsed by the EU Commission.
The dates mentioned above are those required by the standard themselves (IASB effective dates).
Consolidated Financial Statements and Notes Notes to the Financial Statements 119
The following standards will be applicable in 2018 and 2019 respectively:
IFRS 15, Revenue from Contracts with Customers, defines a comprehensive framework for determining whether, in which amount and at which point in time revenue is to be recognized.
IFRS 15 may lead to a shift in revenues between repoting periods. This can essentially have an impact on the accounting of construction contracts in our Integrated Solutions business. Based on the latter, revenue is currently recognized according to the percentage of completion (PoC method) under which the progress of the project work performed is measured according to the costs incurred (cost-to-cost method). Under IFRS 15, control of an asset is the decisive criterion for recognition of revenue. Compared with the former recognition method according to IAS 11, IFRS 15 principles may prompt changes in the recognition of revenue.
Furthermore the application of IFRS 15 will lead to extended disclosure requirements regarding the type, amount, timing and uncertainties of revenues and cash flows arising from contracts with customers.
The new standards for the accounting for leases, IFRS 16, eliminates the classification of leases as either operating leases or finance leases for a lessee. Instead, all leases are treated in a similar way to finance leases under IAS 17. Leases are capitalized by recognizing the present value of the lease payments and showing them as lease assets (right-of-use assets) presented either separately from other assets or together with property, plant and equipment. The standard defines exceptions for short-term leases and leases of low-value items.
As a consequence of the application of IFRS 16 the Group expects an increase in assets and financial liabilities. Overall the impact on key ratios like equity ratios or net-debt-to-EBITDA is expected to be rather low.
IFRS 9 ultimately changes the rules for classification and measurement and impairment testing of financial instruments, as well as the guidelines for hedge ac-counting.
The new regulations regarding the classification of financial assets based on the business model and the related contractual cash flows are not expected to significantly change the Group's financial statements. Concerning the new hedge accounting requirements our preliminary analysis leads to the conclusion that the current hedging relations will also qualify as such under IFRS.
The transition of impairments from the incurred-loss model to the new expected-loss model will have an impact upon initial application. At this stage of the analysis the effect is expected to be low, especially because of the low credit losses incurred in the past years.
As described above the Group is currently assessing the effects of the new standards in various group-wide implementation projects. A reliable estimate of the effects of the new rules is not yet possible, but is expected to be rather limited overall. It is planned to provide a more detailed assessment within the next months.
3. Significant Accounting Policies
Basis of Preparation
The consolidated financial statements of the Group are based on the principle of the historical cost of acquisition, construction or production, with the exception of the items reflected at fair value, such as financial assets held for trading or available for sale, and derivatives.
Consolidation
The consolidated financial statements of the Sartorius Stedim Biotech Group include the annual financial statements of all companies, which are controlled directly or indirectly by Sartorius Stedim Biotech S.A. In terms of IFRS 10, Consolidated Financial Statements and Accounting for Investments in Subsidiaries, the Group Sartorius Stedim Biotech controls an entity when it is exposed to, or has rights to, variable returns from its involvement with the entity and has the liability to affect those returns through its power over the entity.
Such enterprises are included in the consolidated financial statements from the time when Sartorius Stedim Biotech S.A. or its subsidiaries obtains such control until the date on which control ceases.
Subsidiaries have been included on the basis of their annual financial statements for the same reporting period as the parent company, using uniform Group recognition and measurement methods.
120 Consolidated Financial Statements and Notes Notes to the Financial Statements
All intragroup assets and liabilities, equity, income, expenses and cash flows relating to transactions be-tween members of the Group are eliminated in full on consolidation.
Business Combinations
Business combinations are accounted according to the acquisition method. The identifiable acquired assets and assumed liabilities are generally recorded at fair value on the date of combination.
For significant acquisitions, the purchase price allocation is carried out with assistance from independent third-party valuation specialists. The valuations are based on the information available at the acquisition date.
The Group determines goodwill at the acquisition date as:
– the fair value of the consideration transferred; and
– the amount recognized for any non-controlling interest in the acquiree; and
– if the business combination is carried out in stages, the fair value of any previously held equity interest in the acquiree; less
– the net recognized amount for the identifiable assets acquired and liabilities assumed.
When the difference is negative, the purchase gain is recognized immediately in income.
Expenses directly related to business combinations are recorded in the profit or loss as they are incurred.
Foreign Currency Transactions
The presentation currency of the consolidated financial statements of the Sartorius Stedim Biotech Group is the euro (financial statements presented in thousands of euros). In the financial statements of each company, transactions denominated in foreign currencies have been translated into the functional currency of the subsidiary at the exchange rate applicable on the date of the transaction. Monetary assets and debts denominated in a foreign currency have been translated at the exchange rate on the balance sheet date. Rate gains and losses have been recognized in profit or loss for the period.
Translation of financial statements prepared in foreign currencies
Subsidiaries’ financial statements prepared in foreign currencies have been translated pursuant to IAS 21, The Effects of Changes in Foreign Exchange Rates, in accordance with the concept of a functional currency. Foreign subsidiaries have been regarded as independent subdivisions of the Sartorius Stedim Biotech Group. The assets (including goodwill) and liabilities of the entities that have a functional currency different from the presentation currency are translated at the exchange rate prevailing at the balance sheet date. The incomes, expenses, and cash flows of these entities have been translated using the average rate for the year, to the extent that this rate represents an approximate value of exchange rates used as of the date of the transaction in the absence of significant fluctuations. Resulting translation differences are recognized in other comprehensive income.
For long-term loans for which settlement is neither planned nor likely in the foreseeable future, the Group applies the principle of "net investment in a foreign operation." Exchange differences resulting from these loans are recognized in other comprehensive income in accordance with IAS 21.32.
Consolidated Financial Statements and Notes Notes to the Financial Statements 121
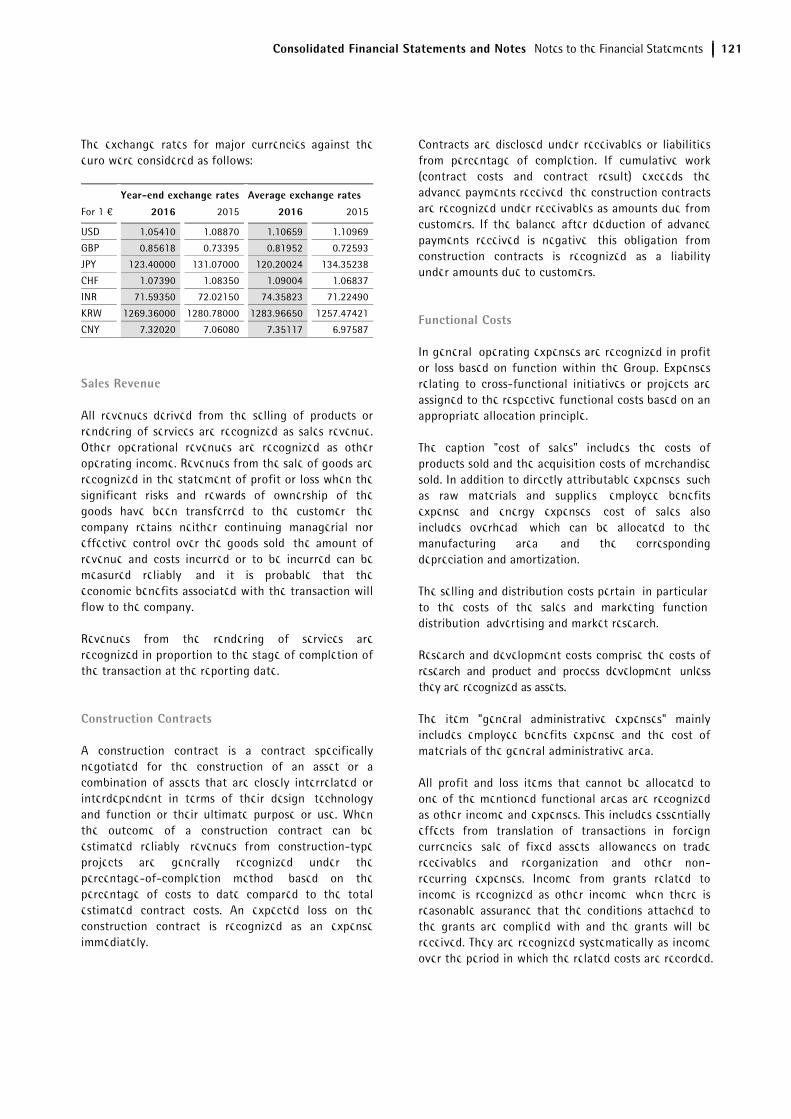
The exchange rates for major currencies against the euro were considered as follows:
Year-end exchange rates Average exchange rates
For 1 € 2016 2015 2016 2015
USD 1.05410 1.08870 1.10659 1.10969
GBP 0.85618 0.73395 0.81952 0.72593
JPY 123.40000 131.07000 120.20024 134.35238
CHF 1.07390 1.08350 1.09004 1.06837
INR 71.59350 72.02150 74.35823 71.22490
KRW 1269.36000 1280.78000 1283.96650 1257.47421
CNY 7.32020 7.06080 7.35117 6.97587
Sales Revenue
All revenues derived from the selling of products or rendering of services are recognized as sales revenue. Other operational revenues are recognized as other operating income. Revenues from the sale of goods are recognized in the statement of profit or loss when the significant risks and rewards of ownership of the goods have been transferred to the customer, the company retains neither continuing managerial nor effective control over the goods sold, the amount of revenue and costs incurred or to be incurred can be measured reliably, and it is probable that the economic benefits associated with the transaction will flow to the company.
Revenues from the rendering of services are recognized in proportion to the stage of completion of the transaction at the reporting date.
Construction Contracts
A construction contract is a contract specifically negotiated for the construction of an asset or a combination of assets that are closely interrelated or interdependent in terms of their design, technology and function or their ultimate purpose or use. When the outcome of a construction contract can be estimated reliably, revenues from construction-type projects are generally recognized under the percentage-of-completion method, based on the percentage of costs to date compared to the total estimated contract costs. An expected loss on the construction contract is recognized as an expense immediately.
Contracts are disclosed under receivables or liabilities from percentage of completion. If cumulative work (contract costs and contract result) exceeds the advance payments received, the construction contracts are recognized under receivables as amounts due from customers. If the balance after deduction of advance payments received is negative, this obligation from construction contracts is recognized as a liability under amounts due to customers.
Functional Costs
In general, operating expenses are recognized in profit or loss based on function within the Group. Expenses relating to cross-functional initiatives or projects are assigned to the respective functional costs based on an appropriate allocation principle.
The caption "cost of sales" includes the costs of products sold and the acquisition costs of merchandise sold. In addition to directly attributable expenses, such as raw materials and supplies, employee benefits expense and energy expenses, cost of sales also includes overhead, which can be allocated to the manufacturing area, and the corresponding depreciation and amortization.
The selling and distribution costs pertain, in particular, to the costs of the sales and marketing function, distribution, advertising and market research.
Research and development costs comprise the costs of research and product and process development, unless they are recognized as assets.
The item "general administrative expenses" mainly includes employee benefits expense and the cost of materials of the general administrative area.
All profit and loss items that cannot be allocated to one of the mentioned functional areas are recognized as other income and expenses. This includes essentially effects from translation of transactions in foreign currencies, sale of fixed assets, allowances on trade receivables and reorganization and other non-recurring expenses. Income from grants related to income is recognized as other income, when there is reasonable assurance that the conditions attached to the grants are complied with and the grants will be received. They are recognized systematically as income over the period in which the related costs are recorded.
122 Consolidated Financial Statements and Notes Notes to the Financial Statements
Borrowing Costs
Borrowing costs are expensed as incurred unless they are directly attributable to the acquisition, construction or production of a qualifying asset and are therefore part of the cost of that asset. A qualifying asset is defined as an asset that takes a substantial period of time (six to twelve months) to get ready for its intended use.
Income Taxes
Current income taxes are determined based on the respective local taxable income of the period and local tax rules. In addition, current income taxes include adjustments for uncertain tax payments or tax refunds for periods not yet assessed. Changes in deferred tax assets and liabilities are included in income taxes ex-cept for changes recognized in other comprehensive income or equity.
Deferred tax assets or liabilities are determined based on temporary differences between the carrying amounts and the tax basis of assets and liabilities (except in special cases provided by IAS 12) including loss carry forwards and tax credits. Measurement is based on the tax rates expected to be effective in the period in which an asset is realized or a liability is settled.
For this purpose, the tax rates and tax rules are used which have been enacted or substantively enacted at the reporting date. Deferred tax assets are recognized for deductible temporary differences and tax losses and unused tax credits only to the extent that it is probable that the Group will have future taxable income against which they can be charged.
Goodwill
Goodwill represents the future economic benefits arising from other assets acquired in a business combination that are not individually identified and separately recognized.
According to IAS 36, goodwill acquired in a business combination may not be amortized, but rather, must be tested annually for impairment and as soon as there is any indication of asset impairment.
For the purpose of impairment testing, goodwill must be allocated to each of the acquirer’s cash-generating units (CGUs) that are expected to benefit from the synergies of the combination. The CGU is the smallest group of assets that generates cash flows from
continuing use largely independent of the cash flows from other assets.
Other Intangible Assets
Intangible assets acquired are recorded at cost less the accumulated, regular amortization that is calculated according to the straight-line method and any impairment loss. The useful life of an intangible asset is the period during which the Group expects to use the asset.
Costs incurred within the scope of the development of new products and methods were capitalized as internally generated intangible assets if the following criteria were met:
– The technical feasibility of completing the intangible assets so that it will be available for use or sale;
– The intention to complete the intangible asset and use or sell it;
– The ability to use or sell the intangible asset;
– The demonstration of how the intangible asset will generate probable future economic benefits;
– The availability of adequate technical, financial and other resources to complete the development and to use or sell the intangible asset;
– The ability to measure reliably the expenditure attributable to the intangible asset during its development.
The capitalized development costs essentially cover the costs that were allocated to the staff involved in R&D, raw materials and supplies, outside services and directly attributable overhead. Intangible assets generated internally are amortized on a straight line basis over their useful lives, which generally do not exceed six years.
If an internally generated intangible asset may not be recognized, the development costs are included in the period in which they are incurred. Costs for research activities are reported as expenses in the period in which they are incurred.
Consolidated Financial Statements and Notes Notes to the Financial Statements 123
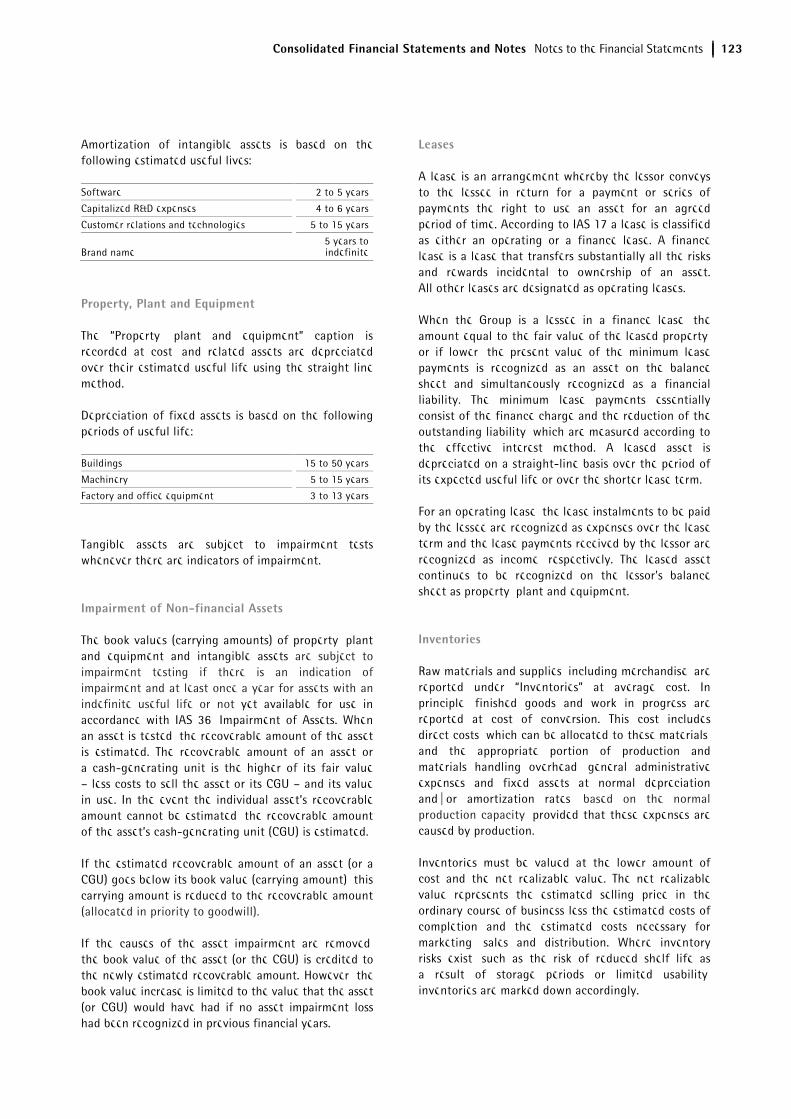
Amortization of intangible assets is based on the following estimated useful lives:
Software 2 to 5 years
Capitalized R&D expenses 4 to 6 years
Customer relations and technologies 5 to 15 years
Brand name 5 years to indefinite
Property, Plant and Equipment
The “Property, plant and equipment” caption is recorded at cost, and related assets are depreciated over their estimated useful life using the straight line method.
Depreciation of fixed assets is based on the following periods of useful life:
Buildings 15 to 50 years
Machinery 5 to 15 years
Factory and office equipment 3 to 13 years
Tangible assets are subject to impairment tests whenever there are indicators of impairment.
Impairment of Non-financial Assets
The book values (carrying amounts) of property, plant and equipment and intangible assets are subject to impairment testing if there is an indication of impairment and at least once a year for assets with an indefinite useful life or not yet available for use in accordance with IAS 36, Impairment of Assets. When an asset is tested, the recoverable amount of the asset is estimated. The recoverable amount of an asset or a cash-generating unit is the higher of its fair value – less costs to sell the asset or its CGU – and its value in use. In the event the individual asset’s recoverable amount cannot be estimated, the recoverable amount of the asset’s cash-generating unit (CGU) is estimated.
If the estimated recoverable amount of an asset (or a CGU) goes below its book value (carrying amount), this carrying amount is reduced to the recoverable amount (allocated in priority to goodwill).
If the causes of the asset impairment are removed, the book value of the asset (or the CGU) is credited to the newly estimated recoverable amount. However, the book value increase is limited to the value that the asset (or CGU) would have had if no asset impairment loss had been recognized in previous financial years.
Leases
A lease is an arrangement whereby the lessor conveys to the lessee in return for a payment or series of payments the right to use an asset for an agreed period of time. According to IAS 17 a lease is classified as either an operating or a finance lease. A finance lease is a lease that transfers substantially all the risks and rewards incidental to ownership of an asset. All other leases are designated as operating leases.
When the Group is a lessee in a finance lease, the amount equal to the fair value of the leased property, or if lower, the present value of the minimum lease payments is recognized as an asset on the balance sheet and simultaneously recognized as a financial liability. The minimum lease payments essentially consist of the finance charge and the reduction of the outstanding liability, which are measured according to the effective interest method. A leased asset is depreciated on a straight-line basis over the period of its expected useful life or over the shorter lease term.
For an operating lease, the lease instalments to be paid by the lessee are recognized as expenses over the lease term and the lease payments received by the lessor are recognized as income, respectively. The leased asset continues to be recognized on the lessor's balance sheet as property, plant and equipment.
Inventories
Raw materials and supplies, including merchandise, are reported under “Inventories” at average cost. In principle, finished goods and work in progress are reported at cost of conversion. This cost includes direct costs, which can be allocated to these materials, and the appropriate portion of production and materials handling overhead, general administrative expenses and fixed assets at normal depreciation and | or amortization rates, based on the normal production capacity, provided that these expenses are caused by production.
Inventories must be valued at the lower amount of cost and the net realizable value. The net realizable value represents the estimated selling price in the ordinary course of business less the estimated costs of completion and the estimated costs necessary for marketing, sales and distribution. Where inventory risks exist, such as the risk of reduced shelf life as a result of storage periods or limited usability, inventories are marked down accordingly.

124 Consolidated Financial Statements and Notes Notes to the Financial Statements
Pension Obligations
Pension provisions and similar obligations are recognized in the consolidated financial statements of Sartorius Stedim Biotech Group in accordance with actuarial principles. IAS 19, Employee Benefits, stipulates the Projected Unit Credit Method as the method of measurement. In addition to known pensions and life expectancies, this expected cash value method takes into account future salary and pension increases.
All remeasurements of the net defined benefit liability are recognized in other comprehensive income (pension reserves) in accordance with the standard IAS 19.
Provisions
A provision is recognized when a present obligation to third parties arising from past events has been incurred, an outflow of resources is probable and the amount of the obligation can be reasonably estimated. The amount recognized as a provision represents the best estimate of the obligation at the closing date. Provisions with a maturity of which the outcome is expected to intervene in over 12 months are discounted (determination of the present value of the expenditures expected to settle the obligation).
Provisions are reviewed regularly and adjusted as further information becomes available or circumstances change. The estimate of the provision for warranty costs is based on historical experience.
Restructuring provisions are set up in connection with programs that materially change the scope of business performed by a segment or business unit or the manner in which business is conducted. In most cases, restructuring expenses include termination benefits and compensation payments due to the termination of agreements with suppliers and dealers, including leasing contracts. Restructuring provisions are recognized when the Group has a detailed formal plan that has either commenced implementation or been announced.
Financial Instruments
A financial instrument is any contract that gives rise to a financial asset of one entity and a financial liability or equity instrument of another entity. Financial assets of the Group mainly include cash and cash equivalents, available-for-sale financial assets, trade and loan receivables and derivative financial instruments with a positive fair value.
Financial liabilities of the Group mainly comprise loans borrowed from banks, trade payables, finance lease payables and derivative financial instruments with a negative fair value.
Non-derivative Financial Instruments
Upon initial recognition, non-derivative financial instruments are recognized at their fair value plus transaction costs, except for financial assets at fair value through profit or loss for which transaction costs, as incurred, are recognized in profit or loss. At the acquisition date the Group determines the classification of financial instruments into one of the categories provided by IAS 39 "Financial instruments: recognition and measurement" (Available-for-sale financial assets, loans and receivables, financial liabilities). This classification determines the asset or liability financial valuation method in subsequent closing (amortized cost or fair value).
Cash and Cash Equivalents
The Group considers all highly liquid investments with less than three months maturity from the date of acquisition to be cash equivalents. This mainly includes checks, cash on hand and deposits in banks. Cash and cash equivalents are measured at fair value. For purposes of the consolidated cash flow statement, cash and cash equivalents include cash and cash equivalents as defined above.
Investments
Investments in non-consolidated subsidiaries and securities are measured at cost when no active market exists for these shares and securities and the fair values of these assets cannot be reliably measured.
Trade Receivables
Trade and other receivables are reported so that all discernible risks are covered. The book values of trade receivables and other receivables are representative of their fair value considering the maturity date and the credit risks. In determining the recoverability of trade receivables, the Group considers any change in the credit quality from the date the credit was originally granted.
Consolidated Financial Statements and Notes Notes to the Financial Statements 125
Loans and Receivables
Financial assets classified as loans and receivables are measured at amortized cost using the effective interest method less any impairment losses. Impairment losses on trade and other receivables are recognized using separate allowance accounts.
Financial Liabilities
Financial liabilities are measured, except for derivative financial instruments, at amortized cost using the effective interest method.
Derivative Financial Instruments
Derivative financial instruments, such as foreign currency exchange contracts and interest rate swap contracts, are measured at fair value. Derivative financial instruments are classified as held for trading unless they are designated as hedging instruments, for which hedge accounting is applied.
Cash Flow Hedges
The effective portion of changes in the fair value of derivative instruments designated as cash flow hedges is recognized in other comprehensive income. Any ineffective portion is recognized immediately in net income (financial result). Amounts accumulated in equity are reclassified into net income in the same periods in which the hedged item affects net income.
Statement of Cash Flows
In the statement of cash flows, cash flows are present-ed according to the allocation to operating activities, investing activities and financing activities.
Cash flows from operating activities are determined using the indirect method; i.e., expenses without an effect on payments are added to the profit before tax, while income without an effect on payments is subtracted. The cash flows from financing activities are composed primarily of changes in equity instruments including dividend payments and additions or repayments of loans.
4. Use of Judgments and Estimates
During the preparation of consolidated financial statements, management uses estimates and assumptions based on their best knowledge of the current and future situation. However, actual results may differ from these estimates. These estimates and assumptions are revised on a regular basis, and the impact of changes in estimates is recognized prospectively.
In addition, Group management exercises its judgment in defining the accounting treatment of specific trans-actions when the existing Standards and Inter-pretations do not specifically treat the accounting problems concerned.
Assumptions and estimates primarily concern the following topics:
Business Combinations
The accounting for business combinations requires that the assets acquired and liabilities assumed be recorded at their respective fair values on the date the Group obtains control. The application of the acquisition method requires certain estimates and assumptions to be made, especially concerning the fair values of the acquired intangible assets, property, plant and equipment and the liabilities assumed at the acquisition date, and the useful lives of the acquired intangible assets, property, plant and equipment.
These measurements are based to a large extent on anticipated cash flows. If actual cash flows vary from those used in calculating fair values, this may materially affect the Group’s future results of operations.
Impairment of Assets
An impairment test is conducted, if certain events lead to the assumption that an asset might be impaired. In this case, the carrying amount of the asset is compared to the recoverable amount, which is the higher of the net realizable value and the value in use. The calculation of the value in use is generally based on discounted cash flow methods using cash flow projections up to five years. These projections take into account past experience and represent management's best estimate about future sales revenue and cost developments. Cash flows after the planning period are extrapolated using individual growth rates. Key assumptions on which management
126 Consolidated Financial Statements and Notes Notes to the Financial Statements
has based its determination of the value in use include estimated growth rates, weighted average cost of capital and tax rates. These estimates can have a material impact on the respective values and ultimately the amount of any impairment.
Intangible Assets
The capitalization of self-constructed intangible assets also includes a significant level of judgment, e.g. the evaluation of feasibility of a development project, the expected market prospects and the determination of useful lives.
Trade and Other Receivables
The allowance for doubtful accounts involves significant management judgment and review of individual receivables based on individual customer creditworthiness and current economic trends as well as an analysis of historical bad debts on a portfolio basis.
Employee Benefits - Pension Provisions
Obligations for pension and other post-employment benefits are determined in accordance with actuarial valuations. These valuations rely on key assumptions including discount rates, expected salary increases and mortality rates. The discount rate assumptions are determined by reference to yields on high-quality corporate bonds of appropriate duration and currency at the end of the reporting period.
Due to changing market and economic conditions the underlying key assumptions may differ from actual developments and may lead to significant changes in pension and other post-employment benefit obligations.
Such differences are recognized in other compre-hensive income in the period in which they occur. For a sensitivity analysis, see note 24, Pension and Employee Benefits Provisions.
Provisions, Contingent Liabilities and Contingent Assets
Provisions are recognized for legal or constructive obligations that exist as of the balance sheet date. To determine the amount of the obligations, certain estimates and assumptions have to be applied, including the determination of the probability and the amount of future outflows of resources. Typically, significant estimates are involved in the determination of provisions related to onerous contracts, warranty costs, asset retirement obligations and legal proceedings.
Income Taxes
The Group operates in various tax jurisdictions and therefore has to determine tax positions under respective local tax laws and tax authorities’ views which can be complex and subject to different interpretations of taxpayers and local tax authorities. Deferred tax assets have to be recognized for all deductible temporary differences and unused tax losses to the extent that it is probable that future taxable profit will be available against which the deductible temporary differences and unused tax losses can be utilized. As future developments are uncertain and partly beyond management’s control, assumptions are necessary to estimate future taxable profits as well as the period in which deferred tax assets will be recovered.
Estimates are revised in the period in which there is sufficient evidence to revise the assumption. If management considers it probable that all or a portion of a deferred tax asset cannot be realized, the corresponding amount is not recorded as an asset.
Fair Value Measurement
A number of the Group’s accounting policies and disclosures require the measurement of fair values, for both financial and non-financial assets and liabilities, including Level 3 fair values (unobservable inputs).
If third party information, such as broker quotes or pricing services, is used to measure fair values, then management assesses the evidence obtained from the third parties to support the conclusion that these valuations meet the requirements of IFRS, including the level in the fair value hierarchy in which the valuations should be classified.
Consolidated Financial Statements and Notes Notes to the Financial Statements 127
When measuring the fair value of an asset or a liability, the Group uses observable market data as far as possible.
If the inputs used to measure the fair value of an asset or a liability fall into different levels of the fair value hierarchy, then the fair value measurement is categorized in its entirety in the same level of the fair value hierarchy as the lowest level input that is significant to the entire measurement.
5. Operating Segments
According to IFRS 8, Operating Segments the identification of reportable operating segments is based on the "management approach"; i.e. the segments are defined analogously to the internal financial reporting of an entity. Therefore, an area of activity is to be considered an operating segment if its business activities may result in revenues and expenses, its operating results are regularly reviewed by the entity's chief operating decision maker (= the Executive Members of the Board of Directors) and discrete financial information is available in its internal reporting. Internal control and reporting within Sartorius Stedim Biotech is based on the approach of operating as a "total solution provider" for its customers. Accordingly, there is only one single segment to be identified for Sartorius Stedim Biotech, driven by the product and customer perspective: Biopharm.
The key performance indicator of the operating segment of the Sartorius Stedim Biotech Group is the so-called “underlying EBITDA”, as the board monitors this performance measure at a consolidated level and they believe this measure is relevant to an understanding of the Group’s financial performance.
EBITDA corresponds to earnings before interest, taxes, depreciation and amortization; “underlying EBITDA” means EBITDA adjusted for extraordinary items. In this connection, extraordinary items are expenses and income that are of an exceptional or a one-time nature and accordingly distort the sustainable profitability of a segment and have a material impact on the net worth, financial position and earnings of the Group. Examples of such items are restructuring expenses, large Group projects as well as proceeds or losses from the disposal, sale or other transfer of financial assets or of property, plant and equipment, provided that these are not of a recurrent nature.
Underlying EBITDA is not a defined performance measure in IFRS. The Group’s definition of underlying EBITDA may not be comparable with similarly titled performance measures and disclosures by other entities.
Segment assets and segment liabilities are not analyzed on a regular basis to the chief operating decision maker and are therefore not part of the segment report.
128 Consolidated Financial Statements and Notes Notes to the Financial Statements
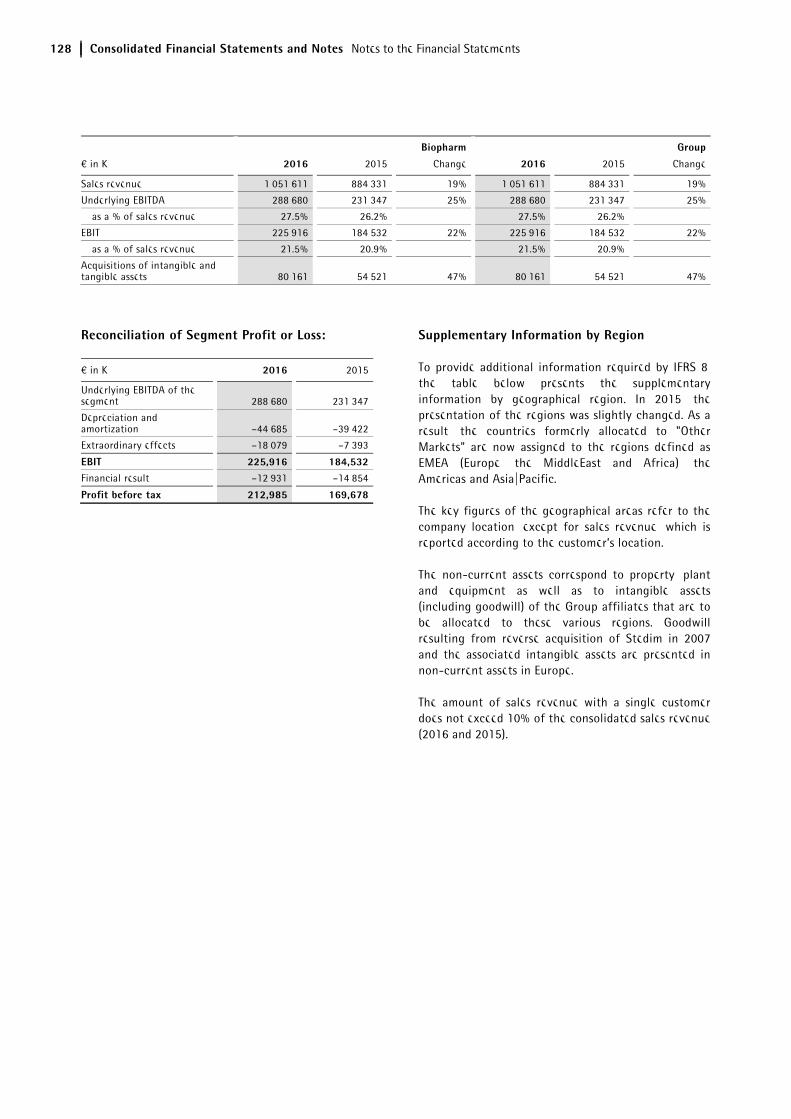
Biopharm Group
€ in K 2016 2015 Change 2016 2015 Change
Sales revenue 1,051,611 884,331 19% 1,051,611 884,331 19%
Underlying EBITDA 288,680 231,347 25% 288,680 231,347 25%
as a % of sales revenue 27.5% 26.2% 27.5% 26.2%
EBIT 225,916 184,532 22% 225,916 184,532 22%
as a % of sales revenue 21.5% 20.9% 21.5% 20.9%
Acquisitions of intangible and tangible assets 80,161 54,521 47% 80,161 54,521 47%
Reconciliation of Segment Profit or Loss:
€ in K 2016 2015
Underlying EBITDA of the segment 288,680 231,347
Depreciation and amortization –44,685 –39,422
Extraordinary effects –18,079 –7,393
EBIT 225,916 184,532Financial result –12,931 –14,854
Profit before tax 212,985 169,678
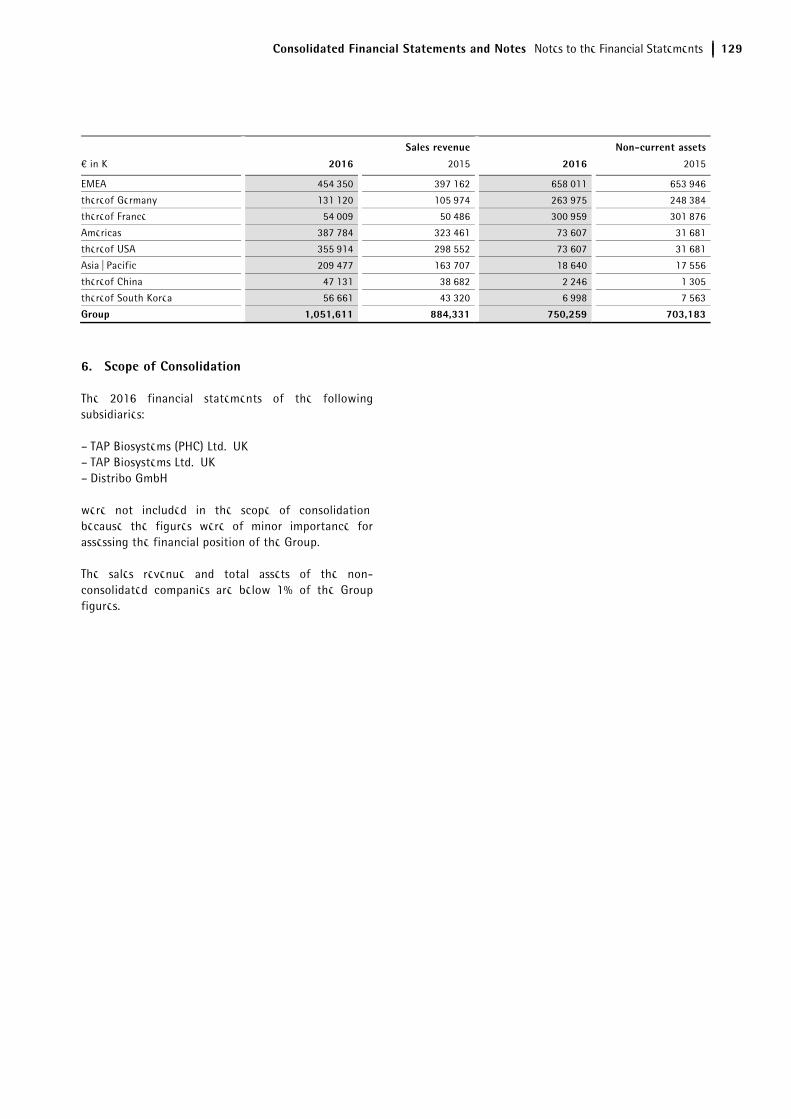
Supplementary Information by Region
To provide additional information required by IFRS 8, the table below presents the supplementary information by geographical region. In 2015, the presentation of the regions was slightly changed. As a result, the countries formerly allocated to "Other Markets" are now assigned to the regions defined as EMEA (Europe, the MiddleEast and Africa), the Americas and Asia|Pacific.
The key figures of the geographical areas refer to the company location, except for sales revenue, which is reported according to the customer’s location.
The non-current assets correspond to property, plant and equipment as well as to intangible assets (including goodwill) of the Group affiliates that are to be allocated to these various regions. Goodwill resulting from reverse acquisition of Stedim in 2007 and the associated intangible assets are presented in non-current assets in Europe.
The amount of sales revenue with a single customer does not exceed 10% of the consolidated sales revenue (2016 and 2015).
Consolidated Financial Statements and Notes Notes to the Financial Statements 129
Sales revenue Non-current assets
€ in K 2016 2015 2016 2015
EMEA 454,350 397,162 658,011 653,946
thereof Germany 131,120 105,974 263,975 248,384
thereof France 54,009 50,486 300,959 301,876
Americas 387,784 323,461 73,607 31,681
thereof USA 355,914 298,552 73,607 31,681
Asia | Pacific 209,477 163,707 18,640 17,556
thereof China 47,131 38,682 2,246 1,305
thereof South Korea 56,661 43,320 6,998 7,563
Group 1,051,611 884,331 750,259 703,183
6. Scope of Consolidation
The 2016 financial statements of the following subsidiaries:
– TAP Biosystems (PHC) Ltd., UK – TAP Biosystems Ltd., UK – Distribo GmbH
were not included in the scope of consolidation, because the figures were of minor importance for assessing the financial position of the Group.
The sales revenue and total assets of the non-consolidated companies are below 1% of the Group figures.

130 Consolidated Financial Statements and Notes Notes to the Financial Statements
The financial statements of the following companies have been included in the Group financial statements:
Ownership
in %
EMEA
Sartorius Stedim Biotech S.A., Aubagne, France Parent
company
Sartorius Stedim Belgium N.V., Brussels, Belgium 100
Sartorius Stedim Nordics Oy, Helsinki, Finland 100
Sartorius Stedim Biotech GmbH, Goettingen, Germany 100
Sartorius Stedim Plastics GmbH, Goettingen, Germany 100
Sartorius North America Holding GmbH, Hanover, Germany 100
Sartorius Stedim Systems GmbH, Guxhagen, Germany 100
Sartorius Stedim Cellca GmbH, Laupheim, Germany 100
Sartorius Stedim UK Ltd., Epsom, UK 100
Sartorius Stedim BioOutsource Ltd., Glasgow, UK 100
Sartorius Stedim Lab Ltd., Louth, UK 100
TAP Biosystems Group Ltd., Royston, UK 100
TAP ESOP Management Ltd., Royston, UK 100
The Automation Partnership Cambridge Ltd., Royston, UK 100
Sartorius Stedim FMT S.A.S., Aubagne, France 100
Sartorius Stedim France S.A.S., Aubagne, France 100
Sartorius Stedim Aseptics S.A., Lourdes, France 100
Sartorius Stedim Ireland Ltd., Dublin, Ireland 100
Sartorius Stedim Italy S.p.A., Florence, Italy 100
Sartorius Stedim Netherlands B.V., Amersfoort, Netherlands 100
Sartorius Stedim Austria GmbH, Vienna, Austria 100
Sartorius Stedim Poland sp. z.o.o., Kostrzyn, Poland 100
Sartorius Stedim RUS, St. Petersburg, Russia 100
Sartorius Stedim Switzerland AG, Tagelswangen, Switzerland 100
Sartorius Stedim Spain S.A., Madrid, Spain 100
Sartorius Stedim Hungaria Kft., Budapest, Hungary 100
Sartorius Stedim Bioprocess S.A.R.L., M'Hamdia, Tunisia 100
Americas Sartorius Stedim Filters Inc., Yauco, Puerto Rico 100
Sartorius Stedim North America Inc., Bohemia, New York, USA 100
AllPure Technologies, LLC , New Oxford, USA 100
Asia | Pacific Sartorius Stedim Australia Pty. Ltd., Dandenong South, Victoria, Australia 100
Sartorius Stedim Biotech (Beijing) Co. Ltd., Beijing, China 100
Sartorius Stedim (Shanghai) Trading Co. Ltd., Shanghai, China 100
Sartorius Stedim India Pvt. Ltd., Bangalore, India 100
Sartorius Stedim Japan K.K., Tokyo, Japan 100
Sartorius Korea Biotech Co. Ltd., Seoul, South Korea 69
Sartorius Stedim Malaysia Sdn. Bhd., Kuala Lumpur, Malaysia 100
Sartorius Stedim Singapore Pte. Ltd., Singapore 100
There are no associates or joint ventures included in the scope of consolidation, all companies are consolidated in full. The ownership rate equals the share in voting rights.

Consolidated Financial Statements and Notes Notes to the Financial Statements 131
7. Statement of Cash Flows
The statement of cash flows shows the impact of cash inflows and outflows on the cash and cash equivalents of the Group. The cash flows are classified by operating, investing and financing activities according to IAS 7 (Statement of Cash Flows).
In this context cash equivalents are assets than can be converted into cash within a short maturity (generally less than three months). The amount considered in the statement of cash flows is equal to the amount in the statement of financial position.
8. Business Combinations
Acquisition kSep Systems LLC
On July 29, 2016 Sartorius Stedim Biotech has ac-quired 100% of the shares in the centrifuge specialist kSep Systems LLC. The company based in Morrisville, North Carolina, USA has developed and markets sin-gle-use, fully automated centrifugation systems used for manufacturing biopharmaceuticals, such as vac-cines, cell-based therapeutics and monoclonal anti-bodies.
The purchase price allocation is disclosed below:
Fair values on the date of acquisition
¤ in K
Intangible assets 9,668
Property, plant and equipment 25
Inventories 1,238
Trade receivables 1,330
Other assets 447
Cash and cash equivalents 4,204
Deferred taxes - net –70
Provisions 0
Loans and borrowings 0
Other liabilities –2,480
Net assets acquired 14,362
Purchase price 27,223
Goodwill 12,861
The purchase price of approx. €27.2 million was paid in cash. The expenses directly attributable to the acquisi-tion amounting to €0.2 million were recognized as other expenses in profit or loss.
The acquisition of kSep is focused on a complementa-tion of SSB's offering for downstream bioprocessing, reducing both the time and cost of downstream purifi-cation steps for the Group's customers. The recognized goodwill represents this aspect as well as other assets not separately identifiable. The goodwill is not deduct-ible for tax purposes.
The contribution of the company since its initial con-solidation is not significant. If the acquisition had taken place as of January 1, 2016, Group sales revenue would have amounted to approx. €1,055.5 million, the impact on earnings is not material.
132 Consolidated Financial Statements and Notes Notes to the Financial Statements
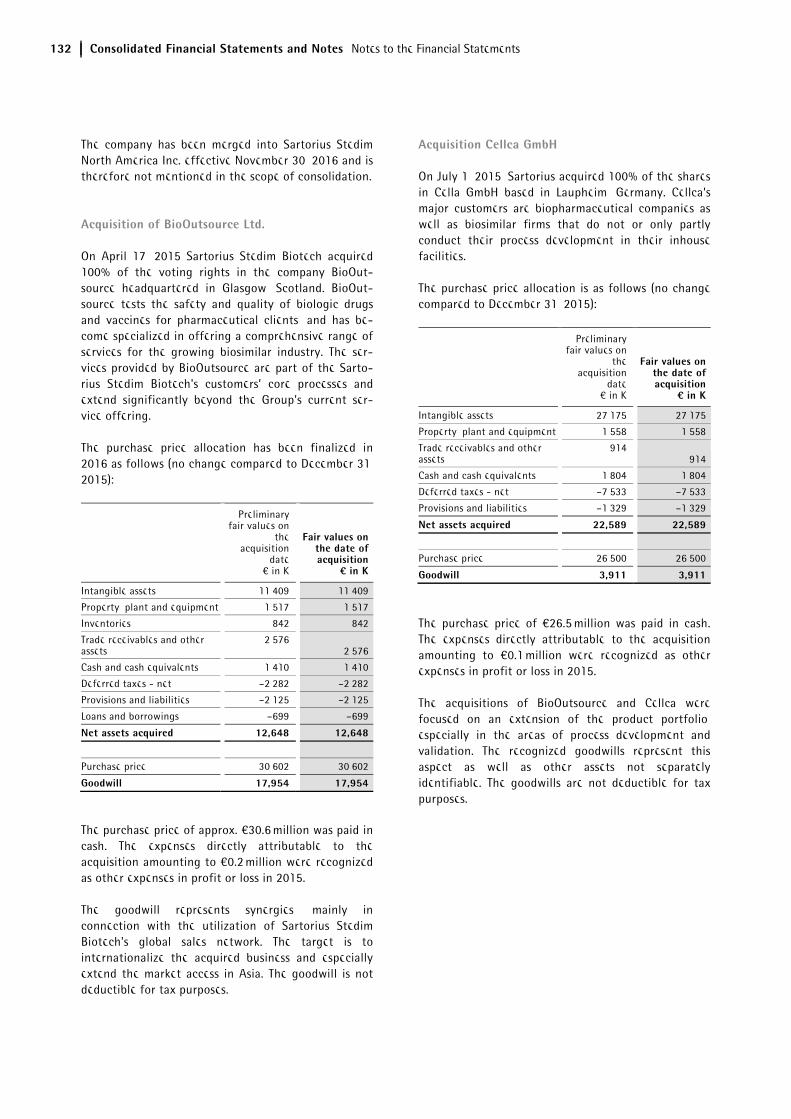
The company has been merged into Sartorius Stedim North America Inc. effective November 30, 2016 and is therefore not mentioned in the scope of consolidation.
Acquisition of BioOutsource Ltd.
On April 17, 2015 Sartorius Stedim Biotech acquired 100% of the voting rights in the company BioOut-source headquartered in Glasgow, Scotland. BioOut-source tests the safety and quality of biologic drugs and vaccines for pharmaceutical clients, and has be-come specialized in offering a comprehensive range of services for the growing biosimilar industry. The ser-vices provided by BioOutsource are part of the Sarto-rius Stedim Biotech's customers’ core processes and extend significantly beyond the Group's current ser-vice offering.
The purchase price allocation has been finalized in 2016 as follows (no change compared to December 31, 2015):
Preliminary fair values on
the acquisition
date € in K
Fair values on the date of acquisition
¤ in K
Intangible assets 11,409 11,409
Property, plant and equipment 1,517 1,517
Inventories 842 842
Trade receivables and other assets
2,576 2,576
Cash and cash equivalents 1,410 1,410
Deferred taxes - net –2,282 –2,282
Provisions and liabilities –2,125 –2,125
Loans and borrowings –699 –699
Net assets acquired 12,648 12,648
Purchase price 30,602 30,602
Goodwill 17,954 17,954
The purchase price of approx. €30.6 million was paid in cash. The expenses directly attributable to the acquisition amounting to €0.2 million were recognized as other expenses in profit or loss in 2015.
The goodwill represents synergies, mainly in connection with the utilization of Sartorius Stedim Biotech's global sales network. The target is to internationalize the acquired business and especially extend the market access in Asia. The goodwill is not deductible for tax purposes.
Acquisition Cellca GmbH
On July 1, 2015, Sartorius acquired 100% of the shares in Cella GmbH based in Laupheim, Germany. Cellca’s major customers are biopharmaceutical companies as well as biosimilar firms that do not or only partly conduct their process development in their inhouse facilities.
The purchase price allocation is as follows (no change compared to December 31, 2015):
Preliminary fair values on
the acquisition
date € in K
Fair values on the date of acquisition
¤ in K
Intangible assets 27,175 27,175
Property, plant and equipment 1,558 1,558
Trade receivables and other assets
914 914
Cash and cash equivalents 1,804 1,804
Deferred taxes - net –7,533 –7,533
Provisions and liabilities –1,329 –1,329
Net assets acquired 22,589 22,589
Purchase price 26,500 26,500
Goodwill 3,911 3,911
The purchase price of €26.5 million was paid in cash. The expenses directly attributable to the acquisition amounting to €0.1 million were recognized as other expenses in profit or loss in 2015.
The acquisitions of BioOutsource and Cellca were focused on an extension of the product portfolio, especially in the areas of process development and validation. The recognized goodwills represent this aspect as well as other assets not separately identifiable. The goodwills are not deductible for tax purposes.
Consolidated Financial Statements and Notes Notes to the Statement of Profit or Loss 133
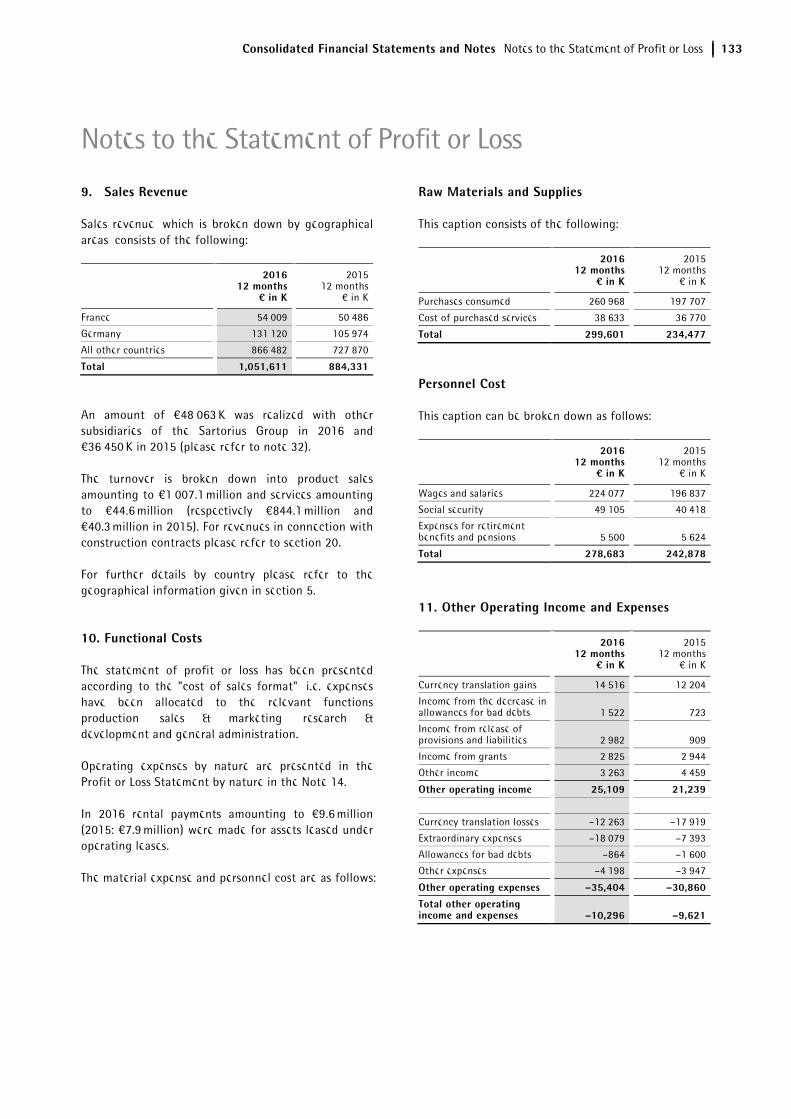
9. Sales Revenue
Sales revenue, which is broken down by geographical areas, consists of the following:
2016 12 months
¤ in K
201512 months
€ in K
France 54,009 50,486
Germany 131,120 105,974
All other countries 866,482 727,870
Total 1,051,611 884,331
An amount of €48,063 K was realized with other subsidiaries of the Sartorius Group in 2016 and €36,450 K in 2015 (please refer to note 32).
The turnover is broken down into product sales amounting to €1,007.1 million and services amounting to €44.6 million (respectively €844.1 million and €40.3 million in 2015). For revenues in connection with construction contracts please refer to section 20.
For further details by country please refer to the geographical information given in section 5.
10. Functional Costs
The statement of profit or loss has been presented according to the "cost of sales format", i.e. expenses have been allocated to the relevant functions production, sales & marketing, research & development and general administration.
Operating expenses by nature are presented in the Profit or Loss Statement by nature in the Note 14.
In 2016 rental payments amounting to €9.6 million (2015: €7.9 million) were made for assets leased under operating leases.
The material expense and personnel cost are as follows:
Raw Materials and Supplies
This caption consists of the following:
2016 12 months
¤ in K
201512 months
€ in K
Purchases consumed 260,968 197,707
Cost of purchased services 38,633 36,770
Total 299,601 234,477
Personnel Cost
This caption can be broken down as follows:
2016 12 months
¤ in K
201512 months
€ in K
Wages and salaries 224,077 196,837
Social security 49,105 40,418
Expenses for retirement benefits and pensions 5,500 5,624
Total 278,683 242,878
11. Other Operating Income and Expenses
2016 12 months
¤ in K
201512 months
€ in K
Currency translation gains 14,516 12,204
Income from the decrease in allowances for bad debts 1,522 723
Income from release of provisions and liabilities 2,982 909
Income from grants 2,825 2,944
Other income 3,263 4,459
Other operating income 25,109 21,239
Currency translation losses –12,263 –17,919
Extraordinary expenses –18,079 –7,393
Allowances for bad debts –864 –1,600
Other expenses –4,198 –3,947
Other operating expenses –35,404 –30,860
Total other operating income and expenses –10,296 –9,621
Notes to the Statement of Profit or Loss
134 Consolidated Financial Statements and Notes Notes to the Statement of Profit or Loss
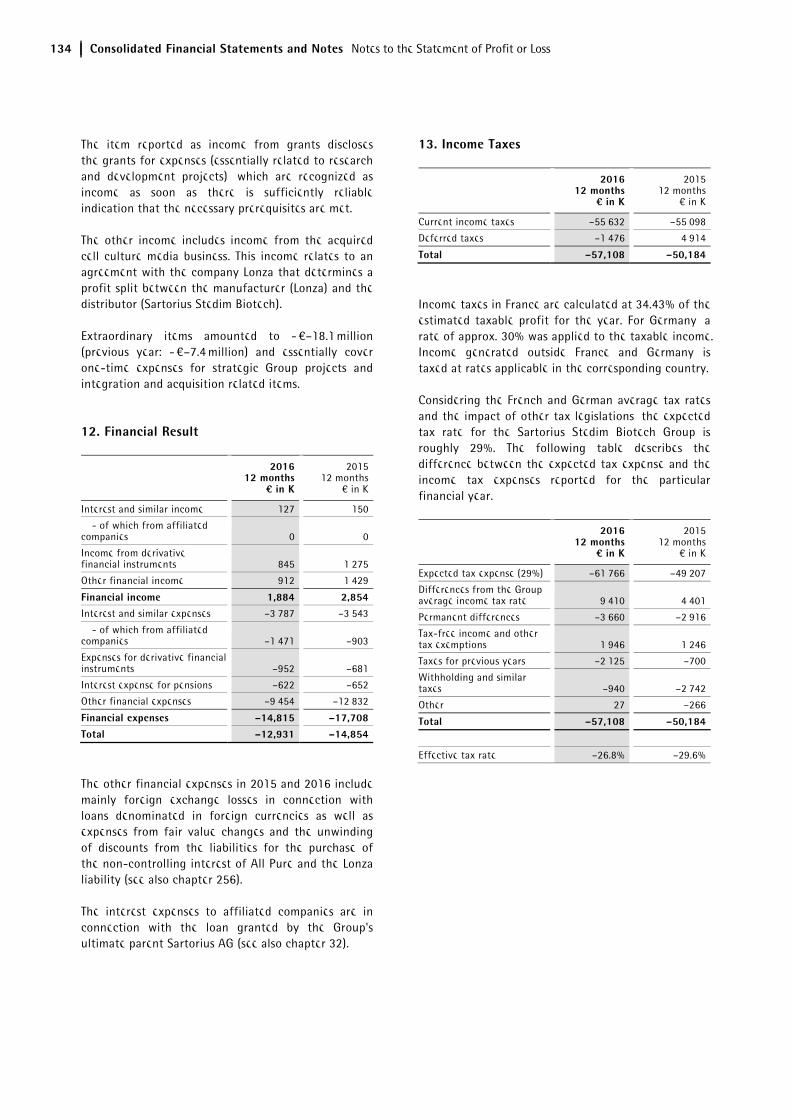
The item reported as income from grants discloses the grants for expenses (essentially related to research and development projects), which are recognized as income as soon as there is sufficiently reliable indication that the necessary prerequisites are met.
The other income includes income from the acquired cell culture media business. This income relates to an agreement with the company Lonza that determines a profit split between the manufacturer (Lonza) and the distributor (Sartorius Stedim Biotech).
Extraordinary items amounted to - €–18.1 million (previous year: - €–7.4 million) and essentially cover one-time expenses for strategic Group projects and integration and acquisition related items.
12. Financial Result
2016 12 months
¤ in K
201512 months
€ in K
Interest and similar income 127 150
- of which from affiliated companies 0 0
Income from derivative financial instruments 845 1,275
Other financial income 912 1,429
Financial income 1,884 2,854Interest and similar expenses –3,787 –3,543
- of which from affiliated companies –1,471 –903
Expenses for derivative financial instruments –952 –681
Interest expense for pensions –622 –652
Other financial expenses –9,454 –12,832
Financial expenses –14,815 –17,708
Total –12,931 –14,854
The other financial expenses in 2015 and 2016 include mainly foreign exchange losses in connection with loans denominated in foreign currencies as well as expenses from fair value changes and the unwinding of discounts from the liabilities for the purchase of the non-controlling interest of All Pure and the Lonza liability (see also chapter 256).
The interest expenses to affiliated companies are in connection with the loan granted by the Group's ultimate parent Sartorius AG (see also chapter 32).
13. Income Taxes
2016 12 months
¤ in K
201512 months
€ in K
Current income taxes –55,632 –55,098
Deferred taxes –1,476 4,914
Total –57,108 –50,184
Income taxes in France are calculated at 34.43% of the estimated taxable profit for the year. For Germany, a rate of approx. 30% was applied to the taxable income. Income generated outside France and Germany is taxed at rates applicable in the corresponding country.
Considering the French and German average tax rates and the impact of other tax legislations, the expected tax rate for the Sartorius Stedim Biotech Group is roughly 29%. The following table describes the difference between the expected tax expense and the income tax expenses reported for the particular financial year.
2016 12 months
¤ in K
201512 months
€ in K
Expected tax expense (29%) –61,766 –49,207
Differences from the Group average income tax rate 9,410 4,401
Permanent differences –3,660 –2,916
Tax-free income and other tax exemptions 1,946 1,246
Taxes for previous years –2,125 –700
Withholding and similar taxes –940 –2,742
Other 27 –266
Total –57,108 –50,184
Effective tax rate –26.8% –29.6%
Consolidated Financial Statements and Notes Notes to the Statement of Profit or Loss 135
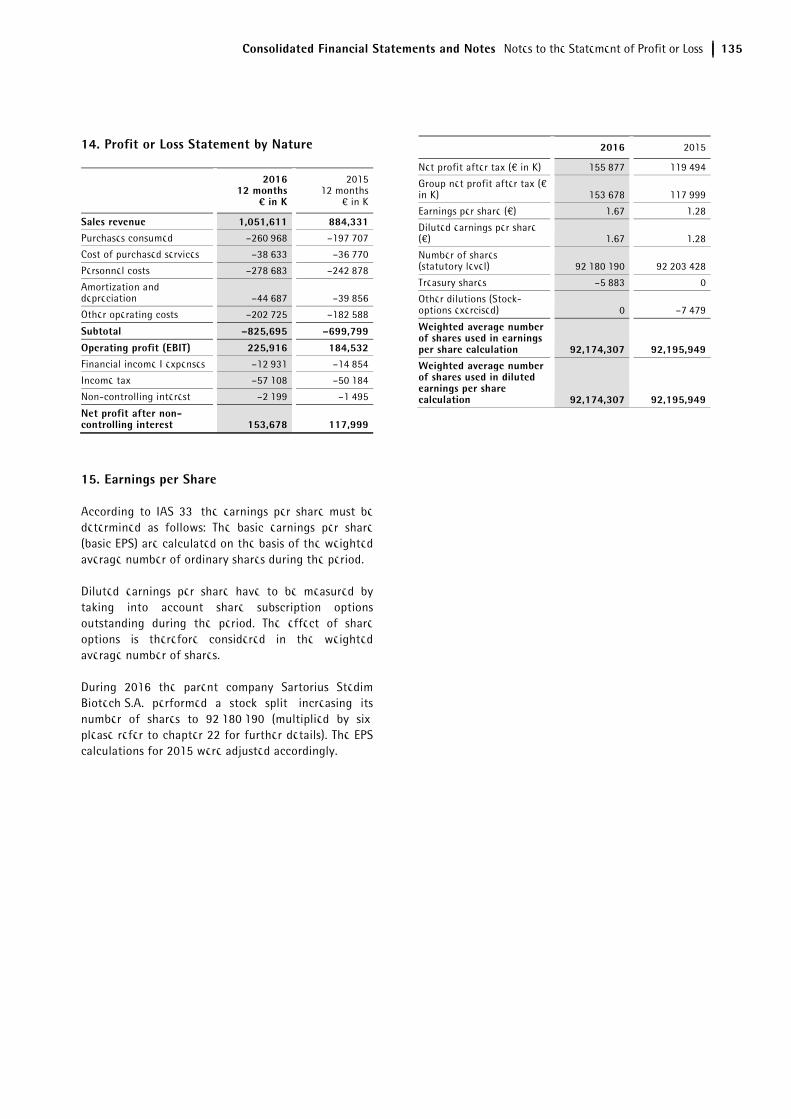
14. Profit or Loss Statement by Nature
2016 12 months
¤ in K
201512 months
€ in K
Sales revenue 1,051,611 884,331Purchases consumed –260,968 –197,707
Cost of purchased services –38,633 –36,770
Personnel costs –278,683 –242,878
Amortization and depreciation –44,687 –39,856
Other operating costs –202,725 –182,588
Subtotal –825,695 –699,799
Operating profit (EBIT) 225,916 184,532Financial income I expenses –12,931 –14,854
Income tax –57,108 –50,184
Non-controlling interest –2,199 –1,495
Net profit after non-controlling interest 153,678 117,999
15. Earnings per Share
According to IAS 33, the earnings per share must be determined as follows: The basic earnings per share (basic EPS) are calculated on the basis of the weighted average number of ordinary shares during the period.
Diluted earnings per share have to be measured by taking into account share subscription options outstanding during the period. The effect of share options is therefore considered in the weighted average number of shares.
During 2016 the parent company Sartorius Stedim Biotech S.A. performed a stock split, increasing its number of shares to 92,180,190 (multiplied by six, please refer to chapter 22 for further details). The EPS calculations for 2015 were adjusted accordingly.
2016 2015
Net profit after tax (€ in K) 155,877 119,494
Group net profit after tax (€ in K) 153,678 117,999
Earnings per share (€) 1.67 1.28
Diluted earnings per share (€) 1.67 1.28
Number of shares (statutory level) 92,180,190 92,203,428
Treasury shares –5,883 0
Other dilutions (Stock-options exercised) 0 –7,479
Weighted average number of shares used in earnings per share calculation 92,174,307 92,195,949Weighted average number of shares used in diluted earnings per share calculation 92,174,307 92,195,949
136 Consolidated Financial Statements and Notes Notes to the Individual Balance Sheet Items
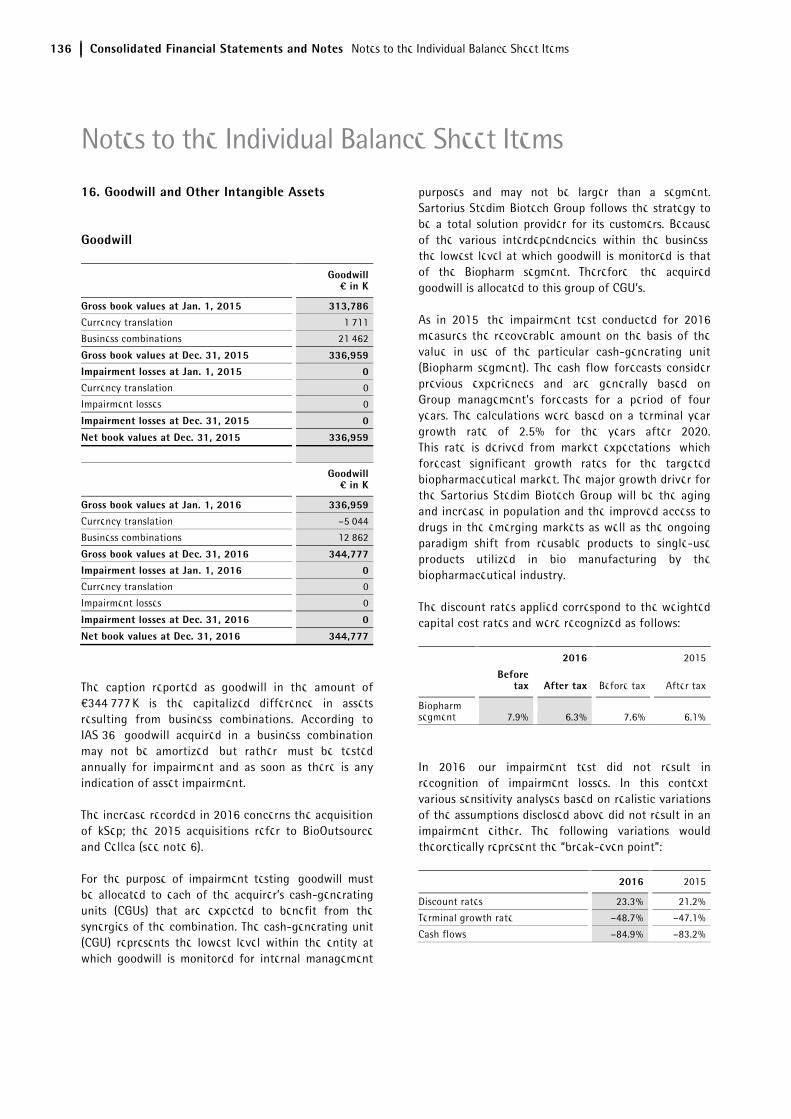
16. Goodwill and Other Intangible Assets
Goodwill
Goodwill¤ in K
Gross book values at Jan. 1, 2015 313,786Currency translation 1,711
Business combinations 21,462
Gross book values at Dec. 31, 2015 336,959
Impairment losses at Jan. 1, 2015 0Currency translation 0
Impairment losses 0
Impairment losses at Dec. 31, 2015 0
Net book values at Dec. 31, 2015 336,959
Goodwill¤ in K
Gross book values at Jan. 1, 2016 336,959
Currency translation –5,044
Business combinations 12,862
Gross book values at Dec. 31, 2016 344,777Impairment losses at Jan. 1, 2016 0Currency translation 0
Impairment losses 0
Impairment losses at Dec. 31, 2016 0
Net book values at Dec. 31, 2016 344,777
The caption reported as goodwill in the amount of €344,777 K is the capitalized difference in assets resulting from business combinations. According to IAS 36, goodwill acquired in a business combination may not be amortized, but rather, must be tested annually for impairment and as soon as there is any indication of asset impairment.
The increase recorded in 2016 concerns the acquisition of kSep; the 2015 acquisitions refer to BioOutsource and Cellca (see note 6).
For the purpose of impairment testing, goodwill must be allocated to each of the acquirer’s cash-generating units (CGUs) that are expected to benefit from the synergies of the combination. The cash-generating unit (CGU) represents the lowest level within the entity at which goodwill is monitored for internal management
purposes and may not be larger than a segment. Sartorius Stedim Biotech Group follows the strategy to be a total solution provider for its customers. Because of the various interdependencies within the business, the lowest level at which goodwill is monitored is that of the Biopharm segment. Therefore, the acquired goodwill is allocated to this group of CGU’s.
As in 2015, the impairment test conducted for 2016 measures the recoverable amount on the basis of the value in use of the particular cash-generating unit (Biopharm segment). The cash flow forecasts consider previous experiences and are generally based on Group management's forecasts for a period of four years. The calculations were based on a terminal year growth rate of 2.5% for the years after 2020. This rate is derived from market expectations, which forecast significant growth rates for the targeted biopharmaceutical market. The major growth driver for the Sartorius Stedim Biotech Group will be the aging and increase in population and the improved access to drugs in the emerging markets as well as the ongoing paradigm shift from reusable products to single-use products utilized in bio manufacturing by the biopharmaceutical industry.
The discount rates applied correspond to the weighted capital cost rates and were recognized as follows:
2016 2015
Before
tax After tax Before tax After tax
Biopharm segment 7.9% 6.3% 7.6% 6.1%
In 2016, our impairment test did not result in recognition of impairment losses. In this context, various sensitivity analyses based on realistic variations of the assumptions disclosed above did not result in an impairment either. The following variations would theoretically represent the “break-even point”:
2016 2015
Discount rates 23.3% 21.2%
Terminal growth rate –48.7% –47.1%
Cash flows –84.9% –83.2%
Notes to the Individual Balance Sheet Items

Consolidated Financial Statements and Notes Notes to the Individual Balance Sheet Items 137
Intangible Assets
Patents, licenses and
similar rights € in K
Brand name€ in K
Customer relationships
€ in K
Capitalized development
costs€ in K
Payments on account
€ in K Total¤ in K
Gross book values at Jan. 1, 2015 37,962 10,779 109,800 49,012 251 207,804Currency translation 2,067 –4 565 456 0 3,084
Business combinations 30,617 207 7,875 0 0 38,699
Acquisitions 644 0 0 8,154 67 8,865
Disposals –384 0 –275 –117 0 –776
Transfers 28 0 0 0 0 28
Gross book values at Dec. 31, 2015 70,933 10,982 117,965 57,506 318 257,704Amortization and impairment losses at Jan. 1, 2015 –15,234 0 –51,368 –28,042 0 –94,644Currency translation –888 1 –124 –270 0 –1,281
Amortization and impairment losses –5,487 –28 –8,374 –5,167 0 –19,056
Disposals 355 0 275 0 0 630
Transfers –5 0 0 0 0 –5
Amortization and impairment losses at Dec. 31, 2015 –21,259 –27 –59,590 –33,479 0 –114,355
Net book values at Dec. 31, 2015 49,674 10,955 58,375 24,027 318 143,349
Patents, licenses and
similar rights € in K
Brand name€ in K
Customer relationships
€ in K
Capitalized development
costs€ in K
Payments on account
€ in K Total¤ in K
Gross book values at Jan. 1, 2016 70,933 10,982 117,965 57,506 318 257,704Currency translation –1,115 –23 –1,941 –853 0 –3,932
Business combinations 4,244 102 5,323 0 0 9,668
Acquisitions 589 0 4 14,570 36 15,199
Disposals –94 0 0 –3,169 0 –3,263
Transfers 107 0 0 0 –318 –211
Gross book values at Dec. 31, 2016 74,664 11,060 121,351 68,054 36 275,165Amortization and impairment losses at Jan. 1, 2016 –21,259 –27 –59,590 –33,479 0 –114,355Currency translation 100 5 378 59 0 541
Amortization and impairment losses –6,759 –46 –8,498 –5,304 0 –20,607
Disposals 93 0 0 3,169 0 3,262
Transfers 11 0 0 0 0 11
Amortization and impairment losses at Dec. 31, 2016 –27,813 –68 –67,710 –35,556 0 –131,147
Net book values at Dec. 31, 2016 46,851 10,992 53,640 32,498 36 144,018
138 Consolidated Financial Statements and Notes Notes to the Individual Balance Sheet Items
The Stedim brand name acquired in 2007 is considered to have an indefinite useful life and is therefore not amortized. There is no foreseeable limit to the period over which the brand name is expected to generate net cash inflows for the Group. The brand name is tested annually for impairment and as soon as there is any indication of asset impairment.
Because of the integration of the Stedim brand into the Sartorius Stedim Biotech brand, a separate measurement of relevant cash flows is no longer possible. Therefore, no separate impairment test was carried out in 2016; the recoverable amount of the brand name was considered at the level of the "Biopharm segment" cash-generating unit (CGU).
The customer relationships obtained as part of the reverse acquisition of Stedim constitute a material intangible asset. The book value of these customer relationships amounted to €29.8 million (2015: €34.8 million) for the year ended December 31,2016; the remaining useful life is six years.
In 2016, the development costs of €14,570 K were recognized as assets (€8,154 K in 2015). The capitalized development costs essentially covered the costs that were allocated to the staff involved in R&D, raw materials and supplies, outside services and directly attributable overhead. Internally generated intangible assets were amortized according to the straight-line method over their useful life, which usually did not exceed five years.
Amortization of intangible assets is allocated to the corresponding functions in the statement of profit or loss. For capitalized development costs, amortization is disclosed in the line "cost of sales".
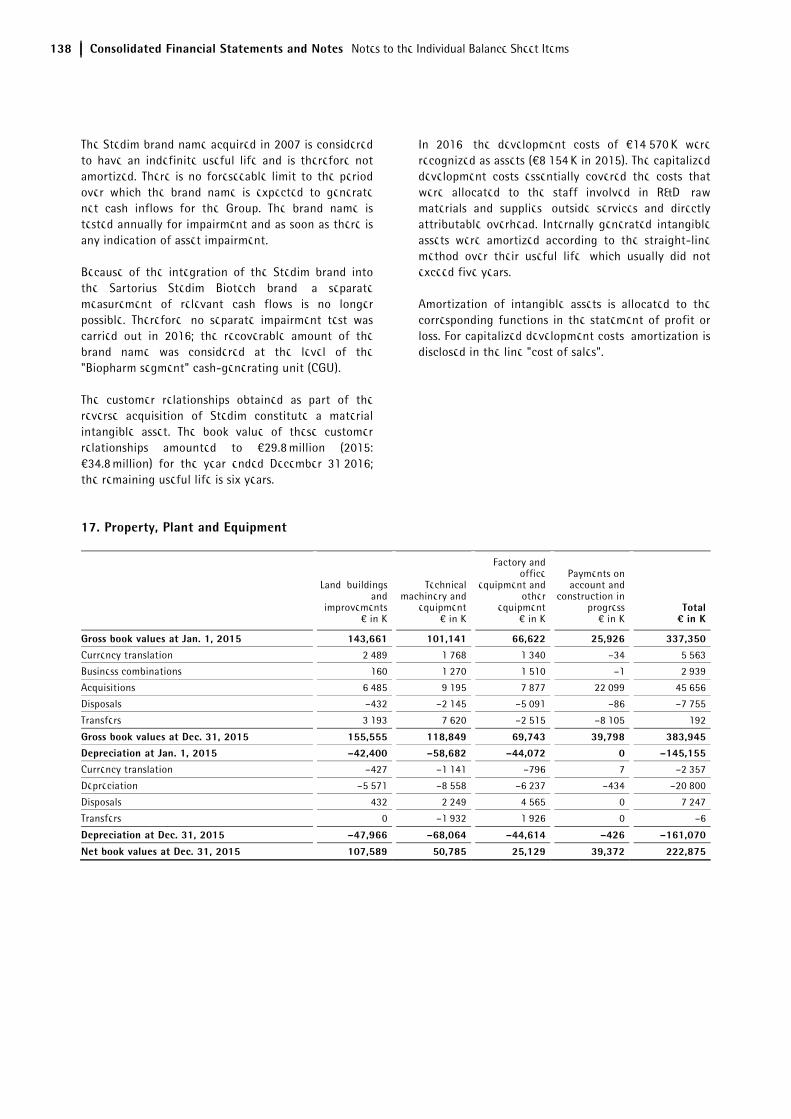
17. Property, Plant and Equipment
Land, buildings and
improvements€ in K
Technical machinery and
equipment€ in K
Factory and office
equipment and other
equipment€ in K
Payments on account and
construction in progress
€ in K Total¤ in K
Gross book values at Jan. 1, 2015 143,661 101,141 66,622 25,926 337,350Currency translation 2,489 1,768 1,340 –34 5,563
Business combinations 160 1,270 1,510 –1 2,939
Acquisitions 6,485 9,195 7,877 22,099 45,656
Disposals –432 –2,145 –5,091 –86 –7,755
Transfers 3,193 7,620 –2,515 –8,105 192
Gross book values at Dec. 31, 2015 155,555 118,849 69,743 39,798 383,945Depreciation at Jan. 1, 2015 –42,400 –58,682 –44,072 0 –145,155Currency translation –427 –1,141 –796 7 –2,357
Depreciation –5,571 –8,558 –6,237 –434 –20,800
Disposals 432 2,249 4,565 0 7,247
Transfers 0 –1,932 1,926 0 –6
Depreciation at Dec. 31, 2015 –47,966 –68,064 –44,614 –426 –161,070
Net book values at Dec. 31, 2015 107,589 50,785 25,129 39,372 222,875
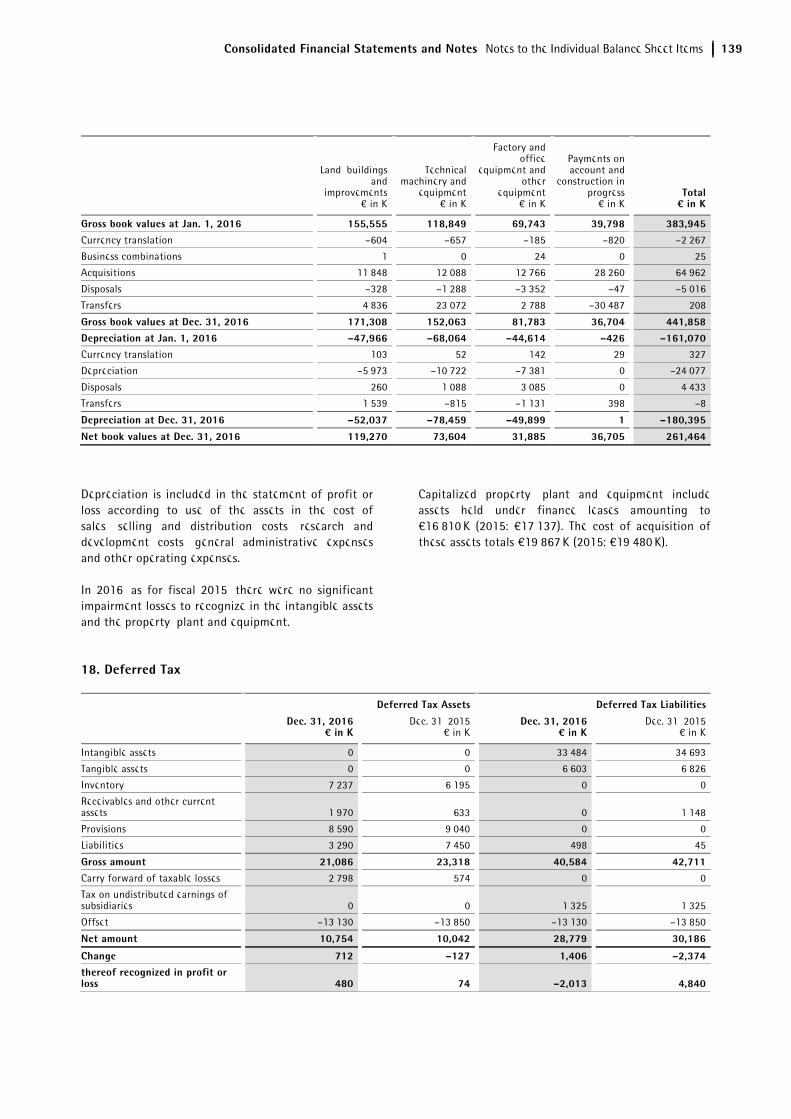
Consolidated Financial Statements and Notes Notes to the Individual Balance Sheet Items 139
Land, buildings and
improvements€ in K
Technical machinery and
equipment€ in K
Factory and office
equipment and other
equipment€ in K
Payments on account and
construction in progress
€ in K Total¤ in K
Gross book values at Jan. 1, 2016 155,555 118,849 69,743 39,798 383,945Currency translation –604 –657 –185 –820 –2,267
Business combinations 1 0 24 0 25
Acquisitions 11,848 12,088 12,766 28,260 64,962
Disposals –328 –1,288 –3,352 –47 –5,016
Transfers 4,836 23,072 2,788 –30,487 208
Gross book values at Dec. 31, 2016 171,308 152,063 81,783 36,704 441,858Depreciation at Jan. 1, 2016 –47,966 –68,064 –44,614 –426 –161,070Currency translation 103 52 142 29 327
Depreciation –5,973 –10,722 –7,381 0 –24,077
Disposals 260 1,088 3,085 0 4,433
Transfers 1,539 –815 –1,131 398 –8
Depreciation at Dec. 31, 2016 –52,037 –78,459 –49,899 1 –180,395
Net book values at Dec. 31, 2016 119,270 73,604 31,885 36,705 261,464
Depreciation is included in the statement of profit or loss according to use of the assets in the cost of sales, selling and distribution costs, research and development costs, general administrative expenses and other operating expenses.
In 2016, as for fiscal 2015, there were no significant impairment losses to recognize in the intangible assets and the property, plant and equipment.
Capitalized property, plant and equipment include assets held under finance leases amounting to €16,810 K (2015: €17,137). The cost of acquisition of these assets totals €19,867 K (2015: €19,480 K).
18. Deferred Tax
Deferred Tax Assets Deferred Tax Liabilities
Dec. 31, 2016
¤ in KDec. 31, 2015
€ in KDec. 31, 2016
¤ in K Dec. 31, 2015
€ in K
Intangible assets 0 0 33,484 34,693
Tangible assets 0 0 6,603 6,826
Inventory 7,237 6,195 0 0
Receivables and other current assets 1,970 633 0 1,148
Provisions 8,590 9,040 0 0
Liabilities 3,290 7,450 498 45
Gross amount 21,086 23,318 40,584 42,711Carry forward of taxable losses 2,798 574 0 0
Tax on undistributed earnings of subsidiaries 0 0 1,325 1,325
Offset –13,130 –13,850 –13,130 –13,850
Net amount 10,754 10,042 28,779 30,186
Change 712 –127 1,406 –2,374thereof recognized in profit or loss 480 74 –2,013 4,840

140 Consolidated Financial Statements and Notes Notes to the Individual Balance Sheet Items
Deferred Tax Assets
On the balance sheet date, the Group had unused tax loss amounts carried forward of €12.0 million to be deducted from future taxable profits (€6.0 million in 2015). A deferred tax amount was reported on approx. €8.3 million of these losses (€2.6 million in 2015). Concerning the remaining losses to be carried forward, no deferred tax amounts were recognized because of the lack of visibility of future taxable profits.
Deferred tax assets in the amount of €2.7 million (€0.1 million) relate to companies that reported losses in this year under review or in the earlier reporting year.
Deferred Tax Liabilities
The deferred tax liabilities in connection with intangible assets refer to assets acquired in business combinations and consequently are mainly linked to customer relationships and technologies.
The Group did not record deferred tax liabilities on approx. €390 million (€307 million) in cumulative undistributed earnings of subsidiaries because these earnings are intended to be reinvested in these operations. When the dividends are paid out, an amount of 5% of the dividends will be taxed under the French and German taxation rules and, if applicable, with withholding tax. Furthermore, additional income tax consequences could arise in the case of an intermediate holding company.
In fiscal 2016, as in the previous years, the tax effect from hedging instruments, and the deferred tax assets from the recognition of the remeasurements of defined benefit liabilities (assets) and the amount of income taxes incurred by the net investment in a foreign operation were recognized in other comprehensive income. The income taxes recognized in other comprehensive income are disclosed as follows in the table:
€ in K 2016 2015
Cash flow hedges 1,577 418
Remeasurements of the net defined benefit obligations 229 –7
Net investment in a foreign operation 974 1,992
Total 2,780 2,403
19. Inventories
Dec. 31, 2016 ¤ in K
Dec. 31, 2015€ in K
Raw materials and supplies 57,203 37,765
Work in progress 50,454 45,632
Finished goods and merchandise 59,152 60,280
Payments on account 4,248 3,293
Total 171,057 146,970
Dec. 31, 2016
¤ in K Dec. 31, 2015
€ in K
Gross amount inventories 182,577 160,048
Write-downs –11,520 –13,078
Net Amount Inventories 171,057 146,970
20. Current Trade Receivables | Other Receivables
Dec. 31, 2016
¤ in K Dec. 31, 2015
€ in K
Trade receivables from third parties 168,247 132,964
Amounts due from customers for contract work 3,130 3,678
Receivables from subsidiaries of the Sartorius AG Group 12,575 5,702
Trade receivables 183,952 142,344
The "Receivables from subsidiaries of the Sartorius AG Group" item refers to other companies of the Sartorius Group (please refer to section 32).
In some of the Group’s business areas, the Group carries out long-term construction contracts. These customer-specific contracts are recognized by the application of IAS 11, Construction Contracts, based on the percentage of completion method.
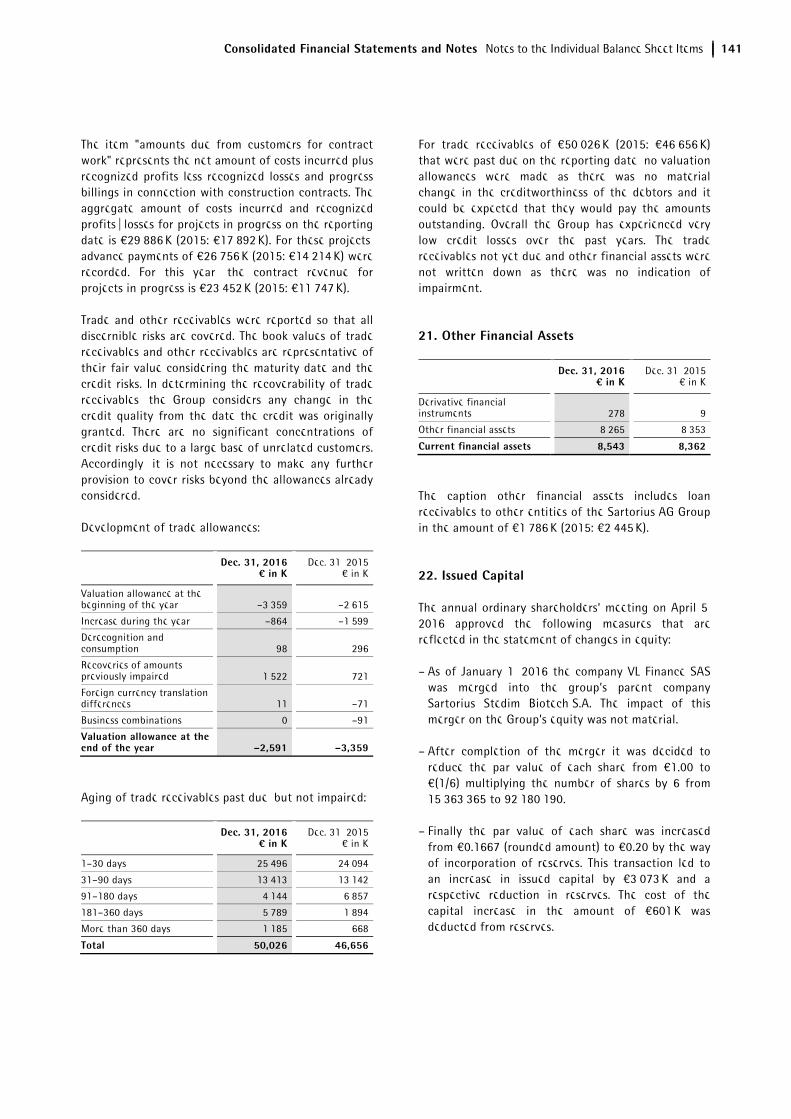
Consolidated Financial Statements and Notes Notes to the Individual Balance Sheet Items 141
The item "amounts due from customers for contract work" represents the net amount of costs incurred plus recognized profits less recognized losses and progress billings in connection with construction contracts. The aggregate amount of costs incurred and recognized profits | losses for projects in progress on the reporting date is €29,886 K (2015: €17,892 K). For these projects, advance payments of €26,756 K (2015: €14,214 K) were recorded. For this year, the contract revenue for projects in progress is €23,452 K (2015: €11,747 K).
Trade and other receivables were reported so that all discernible risks are covered. The book values of trade receivables and other receivables are representative of their fair value considering the maturity date and the credit risks. In determining the recoverability of trade receivables, the Group considers any change in the credit quality from the date the credit was originally granted. There are no significant concentrations of credit risks due to a large base of unrelated customers. Accordingly, it is not necessary to make any further provision to cover risks beyond the allowances already considered.
Development of trade allowances:
Dec. 31, 2016 ¤ in K
Dec. 31, 2015€ in K
Valuation allowance at the beginning of the year –3,359 –2,615
Increase during the year –864 –1,599
Derecognition and consumption 98 296
Recoveries of amounts previously impaired 1,522 721
Foreign currency translation differences 11 –71
Business combinations 0 –91
Valuation allowance at the end of the year –2,591 –3,359
Aging of trade receivables past due, but not impaired:
Dec. 31, 2016 ¤ in K
Dec. 31, 2015€ in K
1–30 days 25,496 24,094
31–90 days 13,413 13,142
91–180 days 4,144 6,857
181–360 days 5,789 1,894
More than 360 days 1,185 668
Total 50,026 46,656
For trade receivables of €50,026 K (2015: €46,656 K) that were past due on the reporting date, no valuation allowances were made as there was no material change in the creditworthiness of the debtors and it could be expected that they would pay the amounts outstanding. Overall the Group has experienced very low credit losses over the past years. The trade receivables not yet due and other financial assets were not written down as there was no indication of impairment.
21. Other Financial Assets
Dec. 31, 2016
¤ in K Dec. 31, 2015
€ in K
Derivative financial instruments 278 9
Other financial assets 8,265 8,353
Current financial assets 8,543 8,362
The caption other financial assets includes loan receivables to other entities of the Sartorius AG Group in the amount of €1,786 K (2015: €2,445 K).
22. Issued Capital
The annual ordinary shareholders‘ meeting on April 5, 2016 approved the following measures that are reflected in the statement of changes in equity:
– As of January 1, 2016 the company VL Finance SAS was merged into the group’s parent company Sartorius Stedim Biotech S.A. The impact of this merger on the Group’s equity was not material.
– After completion of the merger it was decided to reduce the par value of each share from €1.00 to €(1/6) multiplying the number of shares by 6 from 15,363,365 to 92,180,190.
– Finally the par value of each share was increased from €0.1667 (rounded amount) to €0.20 by the way of incorporation of reserves. This transaction led to an increase in issued capital by €3,073 K and a respective reduction in reserves. The cost of the capital increase in the amount of €601 K was deducted from reserves.
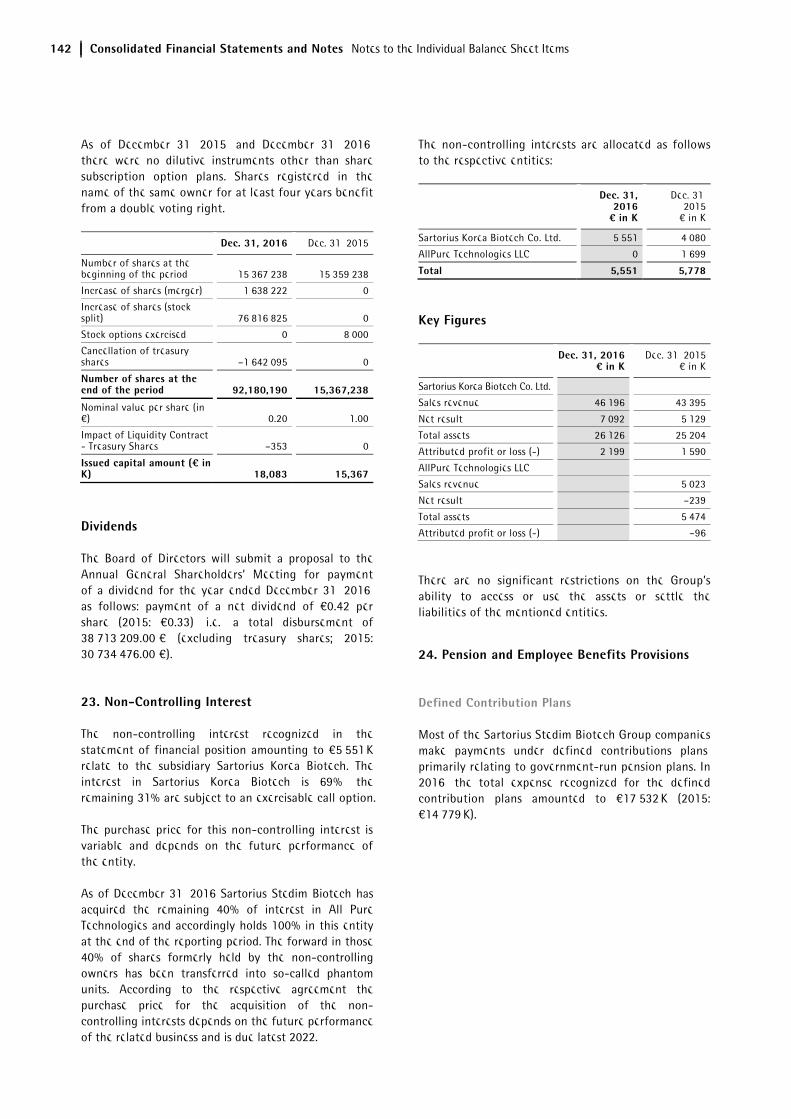
142 Consolidated Financial Statements and Notes Notes to the Individual Balance Sheet Items
As of December 31, 2015, and December 31, 2016, there were no dilutive instruments other than share subscription option plans. Shares registered in the name of the same owner for at least four years benefit from a double voting right.
Dec. 31, 2016 Dec. 31, 2015
Number of shares at the beginning of the period 15,367,238 15,359,238
Increase of shares (merger) 1,638,222 0
Increase of shares (stock split) 76,816,825 0
Stock options exercised 0 8,000
Cancellation of treasury shares –1,642,095 0
Number of shares at the end of the period 92,180,190 15,367,238
Nominal value per share (in €) 0.20 1.00
Impact of Liquidity Contract - Treasury Shares –353 0
Issued capital amount (¤ in K) 18,083 15,367
Dividends
The Board of Directors will submit a proposal to the Annual General Shareholders’ Meeting for payment of a dividend for the year ended December 31, 2016, as follows: payment of a net dividend of €0.42 per share (2015: €0.33), i.e., a total disbursement of 38,713,209.00 € (excluding treasury shares; 2015: 30,734,476.00 €).
23. Non-Controlling Interest
The non-controlling interest recognized in the statement of financial position amounting to €5,551 K relate to the subsidiary Sartorius Korea Biotech. The interest in Sartorius Korea Biotech is 69%, the remaining 31% are subject to an exercisable call option.
The purchase price for this non-controlling interest is variable and depends on the future performance of the entity.
As of December 31, 2016 Sartorius Stedim Biotech has acquired the remaining 40% of interest in All Pure Technologies and accordingly holds 100% in this entity at the end of the reporting period. The forward in those 40% of shares formerly held by the non-controlling owners has been transferred into so-called phantom units. According to the respective agreement the purchase price for the acquisition of the non-controlling interests depends on the future performance of the related business and is due latest 2022.
The non-controlling interests are allocated as follows to the respective entities:
Dec. 31, 2016 ¤ in K
Dec. 31, 2015
€ in K
Sartorius Korea Biotech Co. Ltd. 5,551 4,080
AllPure Technologies LLC 0 1,699
Total 5,551 5,778
Key Figures
Dec. 31, 2016
¤ in K Dec. 31, 2015
€ in K
Sartorius Korea Biotech Co. Ltd.
Sales revenue 46,196 43,395
Net result 7,092 5,129
Total assets 26,126 25,204
Attributed profit or loss (-) 2,199 1,590
AllPure Technologies LLC
Sales revenue 5,023
Net result –239
Total assets 5,474
Attributed profit or loss (-) –96
There are no significant restrictions on the Group’s ability to access or use the assets or settle the liabilities of the mentioned entities.
24. Pension and Employee Benefits Provisions
Defined Contribution Plans
Most of the Sartorius Stedim Biotech Group companies make payments under defined contributions plans, primarily relating to government-run pension plans. In 2016, the total expense recognized for the defined contribution plans amounted to €17,532 K (2015: €14,779 K).
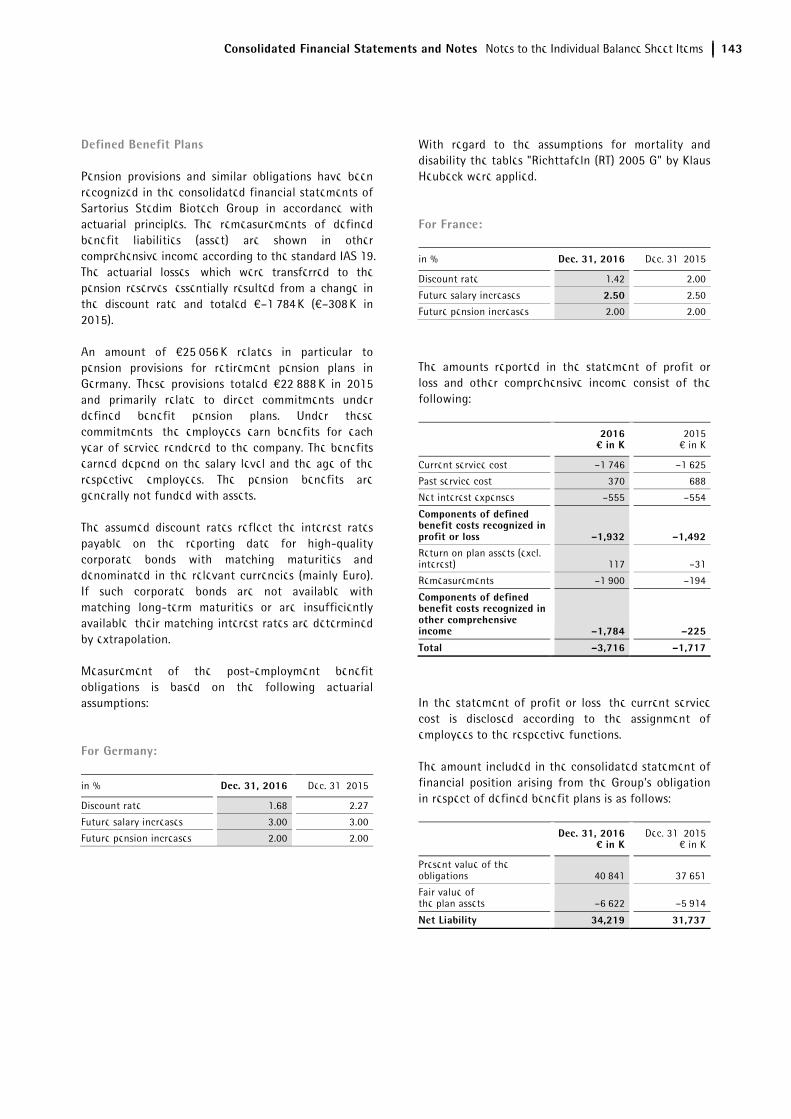
Consolidated Financial Statements and Notes Notes to the Individual Balance Sheet Items 143
Defined Benefit Plans
Pension provisions and similar obligations have been recognized in the consolidated financial statements of Sartorius Stedim Biotech Group in accordance with actuarial principles. The remeasurements of defined benefit liabilities (asset) are shown in other comprehensive income according to the standard IAS 19. The actuarial losses, which were transferred to the pension reserves, essentially resulted from a change in the discount rate and totaled €–1,784 K (€–308 K in 2015).
An amount of €25,056 K relates in particular to pension provisions for retirement pension plans in Germany. These provisions totaled €22,888 K in 2015 and primarily relate to direct commitments under defined benefit pension plans. Under these commitments, the employees earn benefits for each year of service rendered to the company. The benefits earned depend on the salary level and the age of the respective employees. The pension benefits are generally not funded with assets.
The assumed discount rates reflect the interest rates payable on the reporting date for high-quality corporate bonds with matching maturities and denominated in the relevant currencies (mainly Euro). If such corporate bonds are not available with matching long-term maturities or are insufficiently available, their matching interest rates are determined by extrapolation.
Measurement of the post-employment benefit obligations is based on the following actuarial assumptions:
For Germany:
in % Dec. 31, 2016 Dec. 31, 2015
Discount rate 1.68 2.27
Future salary increases 3.00 3.00
Future pension increases 2.00 2.00
With regard to the assumptions for mortality and disability the tables "Richttafeln (RT) 2005 G" by Klaus Heubeck were applied.
For France:
in % Dec. 31, 2016 Dec. 31, 2015
Discount rate 1.42 2.00
Future salary increases 2.50 2.50
Future pension increases 2.00 2.00
The amounts reported in the statement of profit or loss and other comprehensive income consist of the following:
2016 ¤ in K
2015€ in K
Current service cost –1,746 –1,625
Past service cost 370 688
Net interest expenses –555 –554
Components of defined benefit costs recognized in profit or loss –1,932 –1,492Return on plan assets (excl. interest) 117 –31
Remeasurements –1,900 –194
Components of defined benefit costs recognized in other comprehensive income –1,784 –225
Total –3,716 –1,717
In the statement of profit or loss, the current service cost is disclosed according to the assignment of employees to the respective functions.
The amount included in the consolidated statement of financial position arising from the Group's obligation in respect of defined benefit plans is as follows:
Dec. 31, 2016
¤ in K Dec. 31, 2015
€ in K
Present value of the obligations 40,841 37,651
Fair value of the plan assets –6,622 –5,914
Net Liability 34,219 31,737
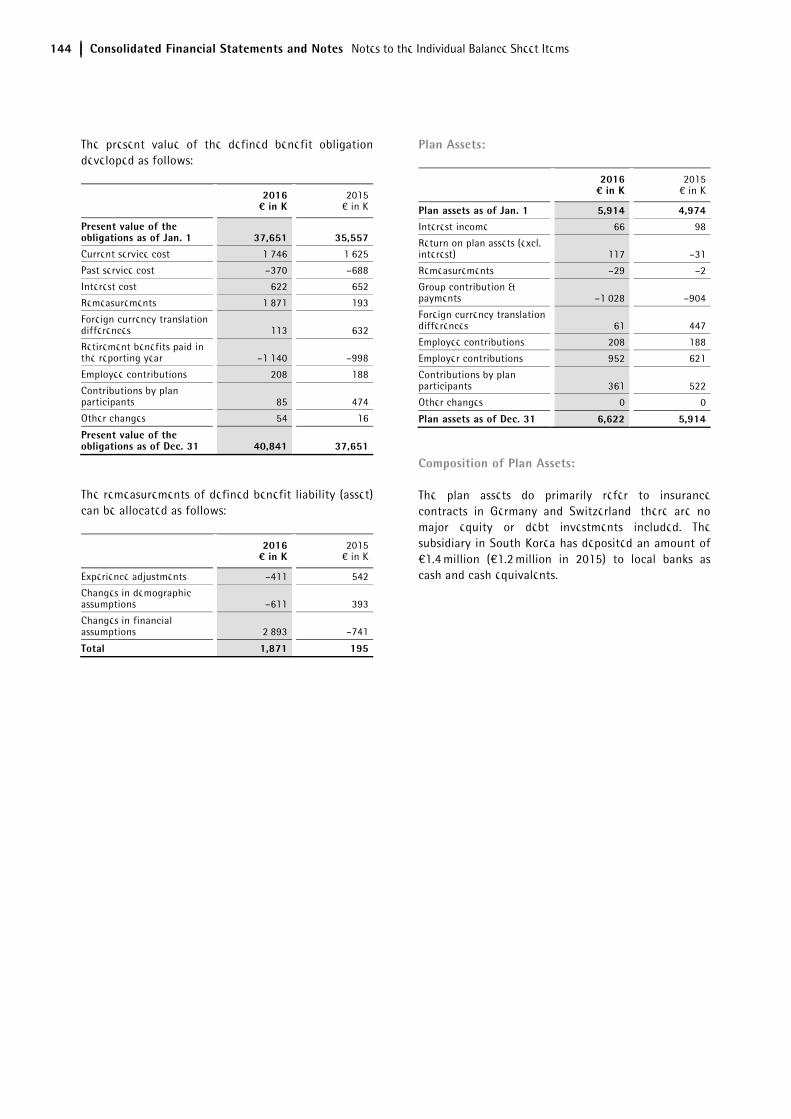
144 Consolidated Financial Statements and Notes Notes to the Individual Balance Sheet Items
The present value of the defined benefit obligation developed as follows:
2016 ¤ in K
2015€ in K
Present value of the obligations as of Jan. 1 37,651 35,557Current service cost 1,746 1,625
Past service cost –370 –688
Interest cost 622 652
Remeasurements 1,871 193
Foreign currency translation differences 113 632
Retirement benefits paid in the reporting year –1,140 –998
Employee contributions 208 188
Contributions by plan participants 85 474
Other changes 54 16
Present value of the obligations as of Dec. 31 40,841 37,651
The remeasurements of defined benefit liability (asset) can be allocated as follows:
2016 ¤ in K
2015€ in K
Experience adjustments –411 542
Changes in demographic assumptions –611 393
Changes in financial assumptions 2,893 –741
Total 1,871 195
Plan Assets:
2016 ¤ in K
2015€ in K
Plan assets as of Jan. 1 5,914 4,974Interest income 66 98
Return on plan assets (excl. interest) 117 –31
Remeasurements –29 –2
Group contribution & payments –1,028 –904
Foreign currency translation differences 61 447
Employee contributions 208 188
Employer contributions 952 621
Contributions by plan participants 361 522
Other changes 0 0
Plan assets as of Dec. 31 6,622 5,914
Composition of Plan Assets:
The plan assets do primarily refer to insurance contracts in Germany and Switzerland, there are no major equity or debt investments included. The subsidiary in South Korea has deposited an amount of €1.4 million (€1.2 million in 2015) to local banks as cash and cash equivalents.
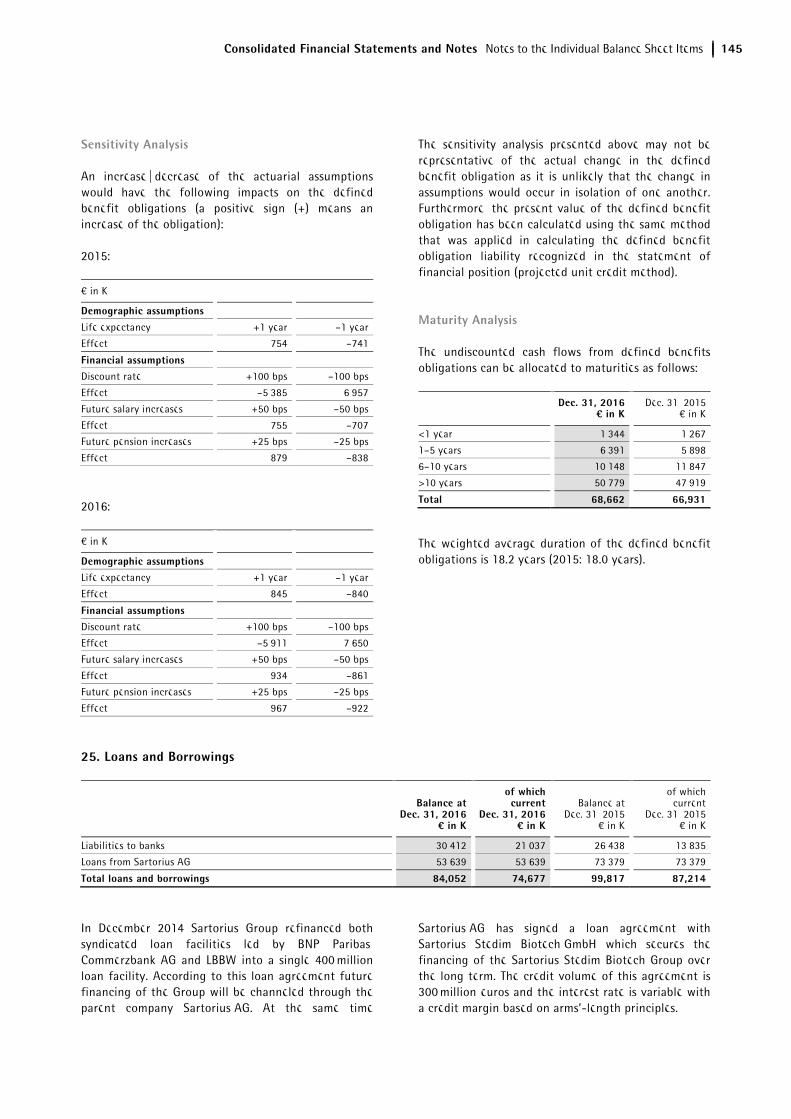
Consolidated Financial Statements and Notes Notes to the Individual Balance Sheet Items 145
Sensitivity Analysis
An increase | decrease of the actuarial assumptions would have the following impacts on the defined benefit obligations (a positive sign (+) means an increase of the obligation):
2015:
€ in K
Demographic assumptions
Life expectancy +1 year –1 year
Effect 754 –741
Financial assumptions Discount rate +100 bps –100 bps
Effect –5,385 6,957
Future salary increases +50 bps –50 bps
Effect 755 –707
Future pension increases +25 bps –25 bps
Effect 879 –838
2016:
€ in K
Demographic assumptions Life expectancy +1 year –1 year
Effect 845 –840
Financial assumptions Discount rate +100 bps –100 bps
Effect –5,911 7,650
Future salary increases +50 bps –50 bps
Effect 934 –861
Future pension increases +25 bps –25 bps
Effect 967 –922
The sensitivity analysis presented above may not be representative of the actual change in the defined benefit obligation as it is unlikely that the change in assumptions would occur in isolation of one another. Furthermore, the present value of the defined benefit obligation has been calculated using the same method that was applied in calculating the defined benefit obligation liability recognized in the statement of financial position (projected unit credit method).
Maturity Analysis
The undiscounted cash flows from defined benefits obligations can be allocated to maturities as follows:
Dec. 31, 2016
¤ in K Dec. 31, 2015
€ in K
<1 year 1,344 1,267
1–5 years 6,391 5,898
6–10 years 10,148 11,847
>10 years 50,779 47,919
Total 68,662 66,931
The weighted average duration of the defined benefit obligations is 18.2 years (2015: 18.0 years).
25. Loans and Borrowings
Balance at Dec. 31, 2016
¤ in K
of which current
Dec. 31, 2016¤ in K
Balance at Dec. 31, 2015
€ in K
of which current
Dec. 31, 2015€ in K
Liabilities to banks 30,412 21,037 26,438 13,835
Loans from Sartorius AG 53,639 53,639 73,379 73,379
Total loans and borrowings 84,052 74,677 99,817 87,214
In December 2014 Sartorius Group refinanced both syndicated loan facilities led by BNP Paribas, Commerzbank AG and LBBW into a single 400 million loan facility. According to this loan agreement future financing of the Group will be channeled through the parent company Sartorius AG. At the same time
Sartorius AG has signed a loan agreement with Sartorius Stedim Biotech GmbH which secures the financing of the Sartorius Stedim Biotech Group over the long term. The credit volume of this agreement is 300 million euros and the interest rate is variable with a credit margin based on arms’-length principles.
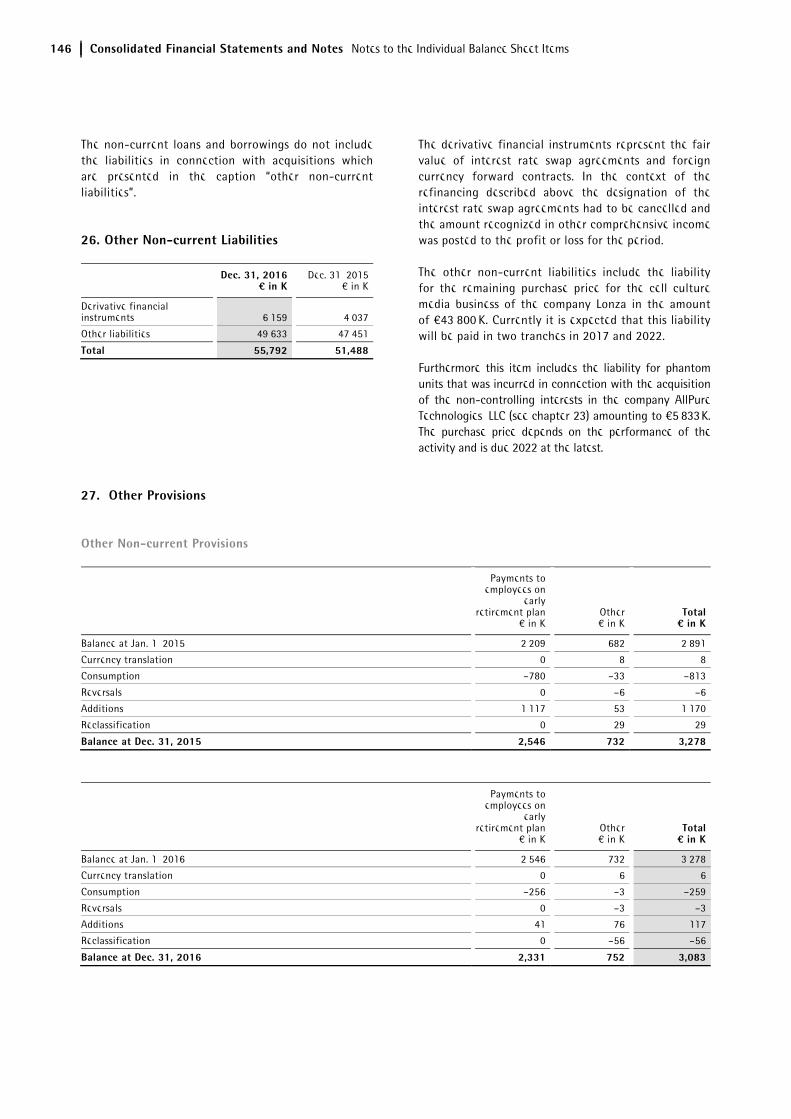
146 Consolidated Financial Statements and Notes Notes to the Individual Balance Sheet Items
The non-current loans and borrowings do not include the liabilities in connection with acquisitions which are presented in the caption “other non-current liabilities”.
26. Other Non-current Liabilities
Dec. 31, 2016
¤ in K Dec. 31, 2015
€ in K
Derivative financial instruments 6,159 4,037
Other liabilities 49,633 47,451
Total 55,792 51,488
The derivative financial instruments represent the fair value of interest rate swap agreements and foreign currency forward contracts. In the context of the refinancing described above the designation of the interest rate swap agreements had to be cancelled and the amount recognized in other comprehensive income was posted to the profit or loss for the period.
The other non-current liabilities include the liability for the remaining purchase price for the cell culture media business of the company Lonza in the amount of €43,800 K. Currently it is expected that this liability will be paid in two tranches in 2017 and 2022.
Furthermore this item includes the liability for phantom units that was incurred in connection with the acquisition of the non-controlling interests in the company AllPure Technologies, LLC (see chapter 23) amounting to €5,833 K. The purchase price depends on the performance of the activity and is due 2022 at the latest.
27. Other Provisions
Other Non-current Provisions
Payments to employees on
early retirement plan
€ in KOther € in K
Total¤ in K
Balance at Jan. 1, 2015 2,209 682 2,891
Currency translation 0 8 8
Consumption –780 –33 –813
Reversals 0 –6 –6
Additions 1,117 53 1,170
Reclassification 0 29 29
Balance at Dec. 31, 2015 2,546 732 3,278
Payments to employees on
early retirement plan
€ in KOther € in K
Total¤ in K
Balance at Jan. 1, 2016 2,546 732 3,278
Currency translation 0 6 6
Consumption –256 –3 –259
Reversals 0 –3 –3
Additions 41 76 117
Reclassification 0 –56 –56
Balance at Dec. 31, 2016 2,331 752 3,083
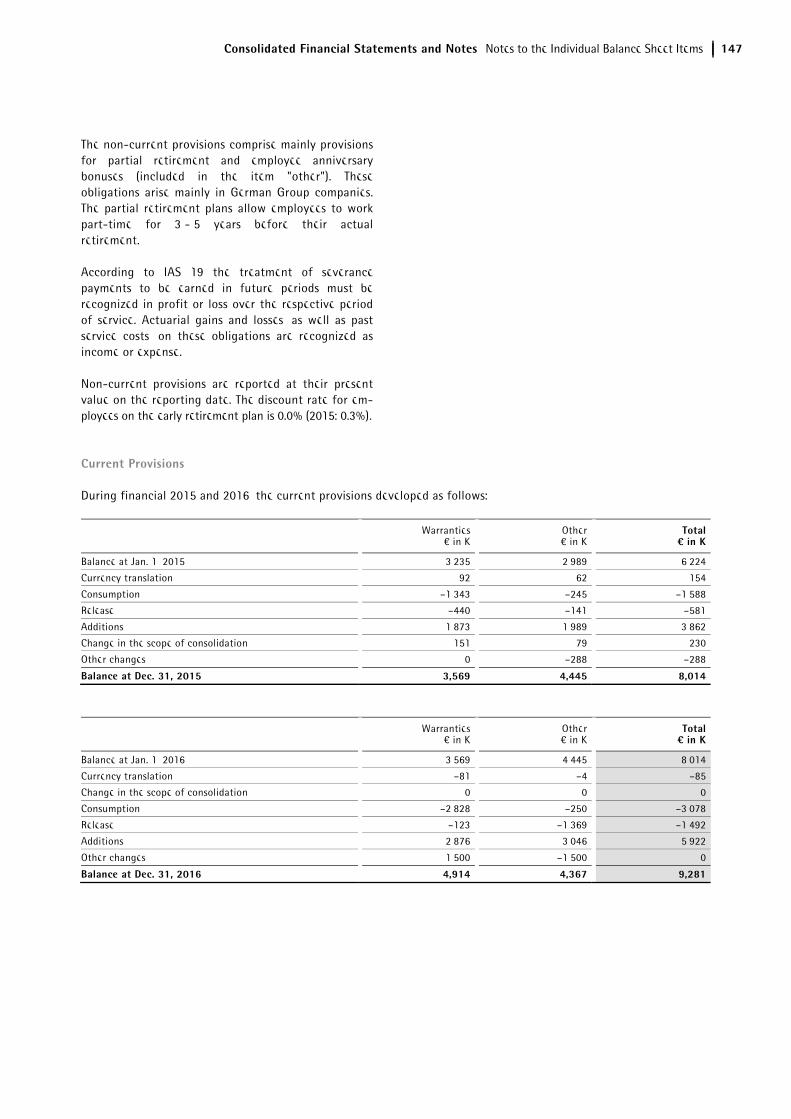
Consolidated Financial Statements and Notes Notes to the Individual Balance Sheet Items 147
The non-current provisions comprise mainly provisions for partial retirement and employee anniversary bonuses (included in the item "other"). These obligations arise mainly in German Group companies. The partial retirement plans allow employees to work part-time for 3 - 5 years before their actual retirement.
According to IAS 19 the treatment of severance payments to be earned in future periods must be recognized in profit or loss over the respective period of service. Actuarial gains and losses, as well as past service costs, on these obligations are recognized as income or expense.
Non-current provisions are reported at their present value on the reporting date. The discount rate for em-ployees on the early retirement plan is 0.0% (2015: 0.3%).
Current Provisions
During financial 2015 and 2016, the current provisions developed as follows:
Warranties€ in K
Other € in K
Total¤ in K
Balance at Jan. 1, 2015 3,235 2,989 6,224
Currency translation 92 62 154
Consumption –1,343 –245 –1,588
Release –440 –141 –581
Additions 1,873 1,989 3,862
Change in the scope of consolidation 151 79 230
Other changes 0 –288 –288
Balance at Dec. 31, 2015 3,569 4,445 8,014
Warranties€ in K
Other € in K
Total¤ in K
Balance at Jan. 1, 2016 3,569 4,445 8,014
Currency translation –81 –4 –85
Change in the scope of consolidation 0 0 0
Consumption –2,828 –250 –3,078
Release –123 –1,369 –1,492
Additions 2,876 3,046 5,922
Other changes 1,500 –1,500 0
Balance at Dec. 31, 2016 4,914 4,367 9,281
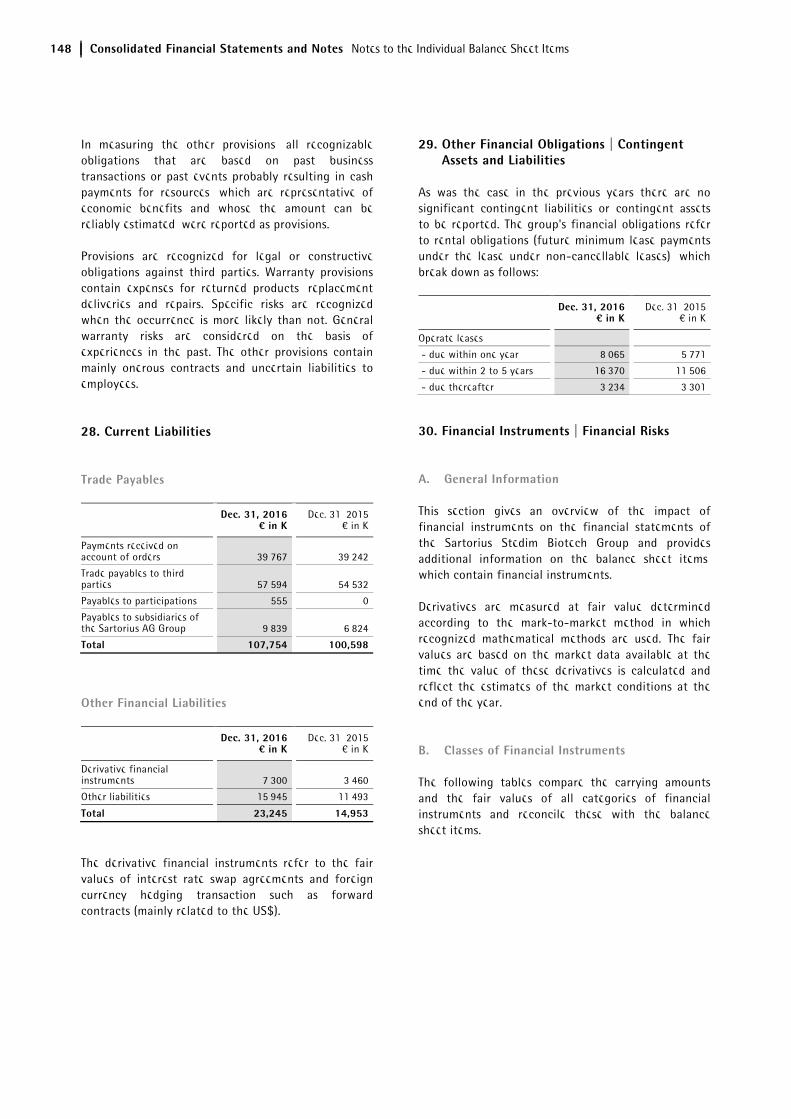
148 Consolidated Financial Statements and Notes Notes to the Individual Balance Sheet Items
In measuring the other provisions, all recognizable obligations that are based on past business transactions or past events probably resulting in cash payments for resources, which are representative of economic benefits and whose the amount can be reliably estimated, were reported as provisions.
Provisions are recognized for legal or constructive obligations against third parties. Warranty provisions contain expenses for returned products, replacement deliveries and repairs. Specific risks are recognized when the occurrence is more likely than not. General warranty risks are considered on the basis of experiences in the past. The other provisions contain mainly onerous contracts and uncertain liabilities to employees.
28. Current Liabilities
Trade Payables
Dec. 31, 2016 ¤ in K
Dec. 31, 2015€ in K
Payments received on account of orders 39,767 39,242
Trade payables to third parties 57,594 54,532
Payables to participations 555 0
Payables to subsidiaries of the Sartorius AG Group 9,839 6,824
Total 107,754 100,598
Other Financial Liabilities
Dec. 31, 2016
¤ in K Dec. 31, 2015
€ in K
Derivative financial instruments 7,300 3,460
Other liabilities 15,945 11,493
Total 23,245 14,953
The derivative financial instruments refer to the fair values of interest rate swap agreements and foreign currency hedging transaction such as forward contracts (mainly related to the US$).
29. Other Financial Obligations | Contingent Assets and Liabilities
As was the case in the previous years there are no significant contingent liabilities or contingent assets to be reported. The group's financial obligations refer to rental obligations (future minimum lease payments under the lease under non-cancellable leases), which break down as follows:
Dec. 31, 2016 ¤ in K
Dec. 31, 2015€ in K
Operate leases
- due within one year 8,065 5,771
- due within 2 to 5 years 16,370 11,506
- due thereafter 3,234 3,301
30. Financial Instruments | Financial Risks
A. General Information
This section gives an overview of the impact of financial instruments on the financial statements of the Sartorius Stedim Biotech Group and provides additional information on the balance sheet items, which contain financial instruments.
Derivatives are measured at fair value determined according to the mark-to-market method in which recognized mathematical methods are used. The fair values are based on the market data available at the time the value of these derivatives is calculated and reflect the estimates of the market conditions at the end of the year.
B. Classes of Financial Instruments
The following tables compare the carrying amounts and the fair values of all categories of financial instruments and reconcile these with the balance sheet items.
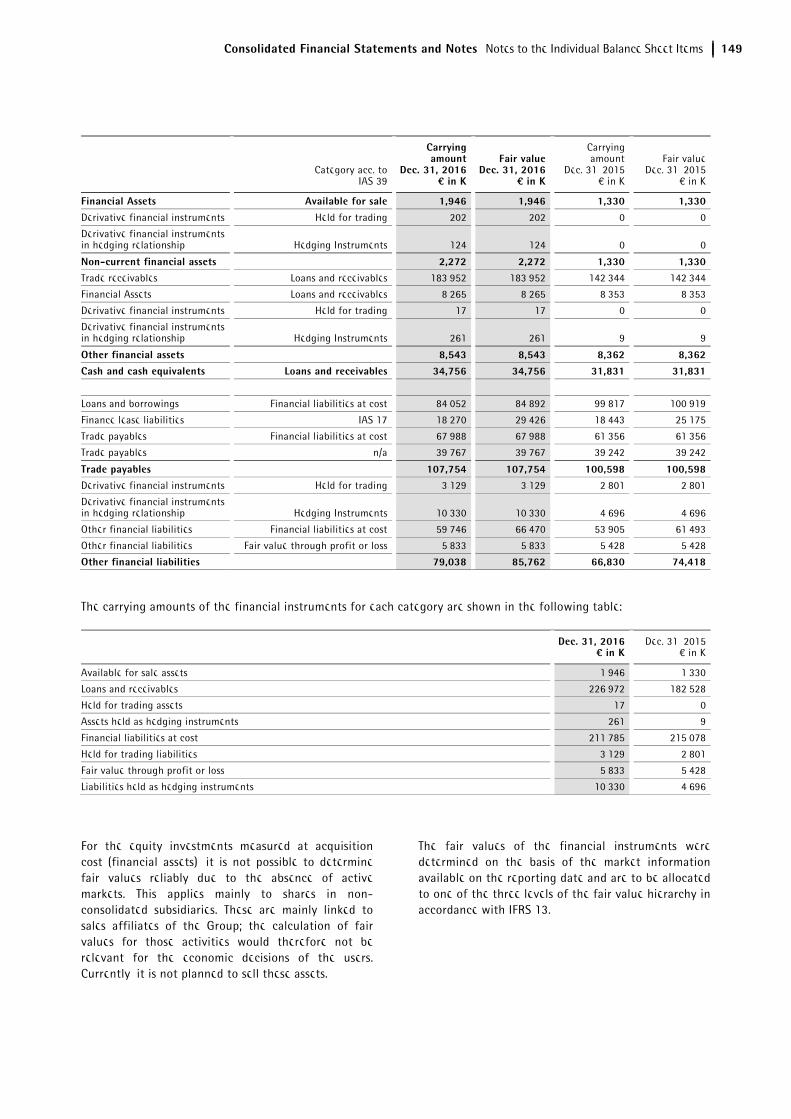
Consolidated Financial Statements and Notes Notes to the Individual Balance Sheet Items 149
Category acc. to
IAS 39
Carrying amount
Dec. 31, 2016¤ in K
Fair valueDec. 31, 2016
¤ in K
Carrying amount
Dec. 31, 2015 € in K
Fair valueDec. 31, 2015
€ in K
Financial Assets Available for sale 1,946 1,946 1,330 1,330
Derivative financial instruments Held for trading 202 202 0 0
Derivative financial instruments in hedging relationship Hedging Instruments 124 124 0 0
Non-current financial assets 2,272 2,272 1,330 1,330Trade receivables Loans and receivables 183,952 183,952 142,344 142,344
Financial Assets Loans and receivables 8,265 8,265 8,353 8,353
Derivative financial instruments Held for trading 17 17 0 0
Derivative financial instruments in hedging relationship Hedging Instruments 261 261 9 9
Other financial assets 8,543 8,543 8,362 8,362
Cash and cash equivalents Loans and receivables 34,756 34,756 31,831 31,831
Loans and borrowings Financial liabilities at cost 84,052 84,892 99,817 100,919
Finance lease liabilities IAS 17 18,270 29,426 18,443 25,175
Trade payables Financial liabilities at cost 67,988 67,988 61,356 61,356
Trade payables n/a 39,767 39,767 39,242 39,242
Trade payables 107,754 107,754 100,598 100,598Derivative financial instruments Held for trading 3,129 3,129 2,801 2,801
Derivative financial instruments in hedging relationship Hedging Instruments 10,330 10,330 4,696 4,696
Other financial liabilities Financial liabilities at cost 59,746 66,470 53,905 61,493
Other financial liabilities Fair value through profit or loss 5,833 5,833 5,428 5,428
Other financial liabilities 79,038 85,762 66,830 74,418
The carrying amounts of the financial instruments for each category are shown in the following table:
Dec. 31, 2016
¤ in K Dec. 31, 2015
€ in K
Available for sale assets 1,946 1,330
Loans and receivables 226,972 182,528
Held for trading assets 17 0
Assets held as hedging instruments 261 9
Financial liabilities at cost 211,785 215,078
Held for trading liabilities 3,129 2,801
Fair value through profit or loss 5,833 5,428
Liabilities held as hedging instruments 10,330 4,696
For the equity investments measured at acquisition cost (financial assets), it is not possible to determine fair values reliably due to the absence of active markets. This applies mainly to shares in non-consolidated subsidiaries. These are mainly linked to sales affiliates of the Group; the calculation of fair values for those activities would therefore not be relevant for the economic decisions of the users. Currently, it is not planned to sell these assets.
The fair values of the financial instruments were determined on the basis of the market information available on the reporting date and are to be allocated to one of the three levels of the fair value hierarchy in accordance with IFRS 13.
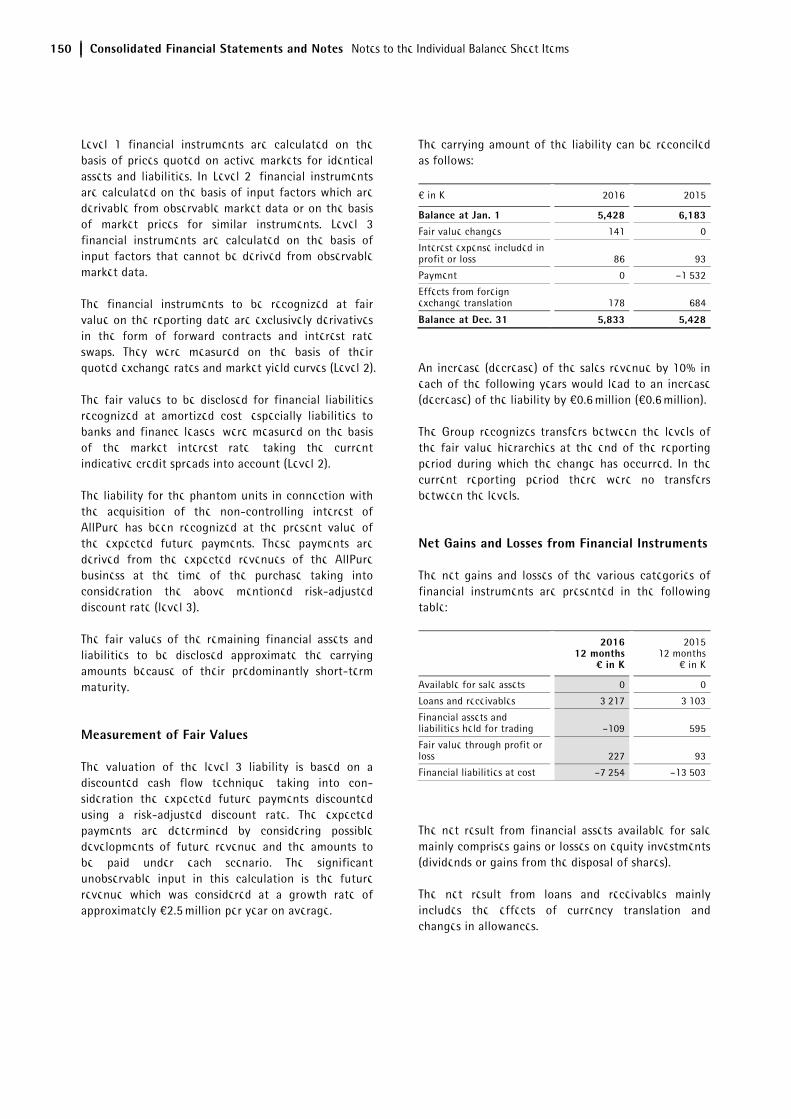
150 Consolidated Financial Statements and Notes Notes to the Individual Balance Sheet Items
Level 1 financial instruments are calculated on the basis of prices quoted on active markets for identical assets and liabilities. In Level 2, financial instruments are calculated on the basis of input factors which are derivable from observable market data or on the basis of market prices for similar instruments. Level 3 financial instruments are calculated on the basis of input factors that cannot be derived from observable market data.
The financial instruments to be recognized at fair value on the reporting date are exclusively derivatives in the form of forward contracts and interest rate swaps. They were measured on the basis of their quoted exchange rates and market yield curves (Level 2).
The fair values to be disclosed for financial liabilities recognized at amortized cost, especially liabilities to banks and finance leases, were measured on the basis of the market interest rate, taking the current indicative credit spreads into account (Level 2).
The liability for the phantom units in connection with the acquisition of the non-controlling interest of AllPure has been recognized at the present value of the expected future payments. These payments are derived from the expected revenues of the AllPure business at the time of the purchase taking into consideration the above mentioned risk-adjusted discount rate (level 3).
The fair values of the remaining financial assets and liabilities to be disclosed approximate the carrying amounts because of their predominantly short-term maturity.
Measurement of Fair Values
The valuation of the level 3 liability is based on a discounted cash flow technique, taking into con-sideration the expected future payments discounted using a risk-adjusted discount rate. The expected payments are determined by considering possible developments of future revenue and the amounts to be paid under each scenario. The significant unobservable input in this calculation is the future revenue which was considered at a growth rate of approximately €2.5 million per year on average.
The carrying amount of the liability can be reconciled as follows:
€ in K 2016 2015
Balance at Jan. 1 5,428 6,183
Fair value changes 141 0
Interest expense included in profit or loss 86 93
Payment 0 –1,532
Effects from foreign exchange translation 178 684
Balance at Dec. 31 5,833 5,428
An increase (decrease) of the sales revenue by 10% in each of the following years would lead to an increase (decrease) of the liability by €0.6 million (€0.6 million).
The Group recognizes transfers between the levels of the fair value hierarchies at the end of the reporting period during which the change has occurred. In the current reporting period there were no transfers between the levels.
Net Gains and Losses from Financial Instruments
The net gains and losses of the various categories of financial instruments are presented in the following table:
2016 12 months
¤ in K
201512 months
€ in K
Available for sale assets 0 0
Loans and receivables 3,217 3,103
Financial assets and liabilities held for trading –109 595
Fair value through profit or loss 227 93
Financial liabilities at cost –7,254 –13,503
The net result from financial assets available for sale mainly comprises gains or losses on equity investments (dividends or gains from the disposal of shares).
The net result from loans and receivables mainly includes the effects of currency translation and changes in allowances.
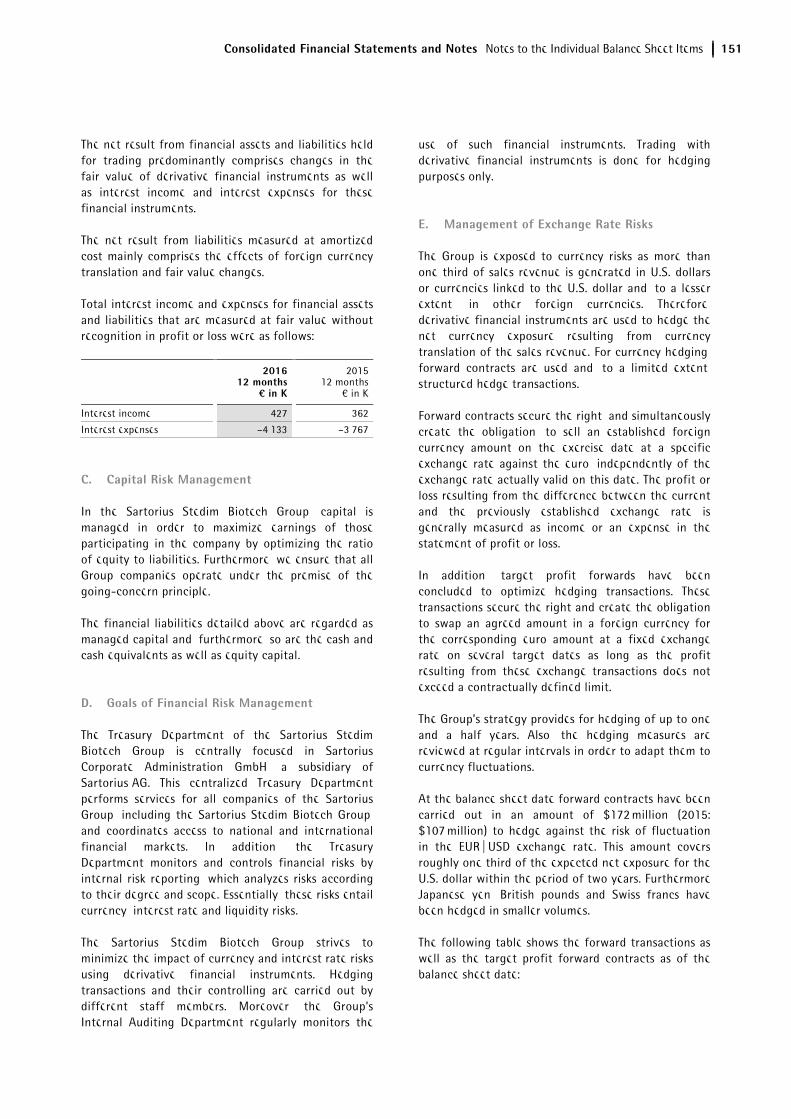
Consolidated Financial Statements and Notes Notes to the Individual Balance Sheet Items 151
The net result from financial assets and liabilities held for trading predominantly comprises changes in the fair value of derivative financial instruments as well as interest income and interest expenses for these financial instruments.
The net result from liabilities measured at amortized cost mainly comprises the effects of foreign currency translation and fair value changes.
Total interest income and expenses for financial assets and liabilities that are measured at fair value without recognition in profit or loss were as follows:
2016 12 months
¤ in K
201512 months
€ in K
Interest income 427 362
Interest expenses –4,133 –3,767
C. Capital Risk Management
In the Sartorius Stedim Biotech Group, capital is managed in order to maximize earnings of those participating in the company by optimizing the ratio of equity to liabilities. Furthermore, we ensure that all Group companies operate under the premise of the going-concern principle.
The financial liabilities detailed above are regarded as managed capital and, furthermore, so are the cash and cash equivalents as well as equity capital.
D. Goals of Financial Risk Management
The Treasury Department of the Sartorius Stedim Biotech Group is centrally focused in Sartorius Corporate Administration GmbH, a subsidiary of Sartorius AG. This centralized Treasury Department performs services for all companies of the Sartorius Group, including the Sartorius Stedim Biotech Group, and coordinates access to national and international financial markets. In addition, the Treasury Department monitors and controls financial risks by internal risk reporting, which analyzes risks according to their degree and scope. Essentially, these risks entail currency, interest rate and liquidity risks.
The Sartorius Stedim Biotech Group strives to minimize the impact of currency and interest rate risks using derivative financial instruments. Hedging transactions and their controlling are carried out by different staff members. Moreover, the Group’s Internal Auditing Department regularly monitors the
use of such financial instruments. Trading with derivative financial instruments is done for hedging purposes only.
E. Management of Exchange Rate Risks
The Group is exposed to currency risks as more than one third of sales revenue is generated in U.S. dollars or currencies linked to the U.S. dollar and, to a lesser extent, in other foreign currencies. Therefore, derivative financial instruments are used to hedge the net currency exposure resulting from currency translation of the sales revenue. For currency hedging, forward contracts are used and, to a limited extent, structured hedge transactions.
Forward contracts secure the right, and simultaneously create the obligation, to sell an established foreign currency amount on the exercise date at a specific exchange rate against the euro, independently of the exchange rate actually valid on this date. The profit or loss resulting from the difference between the current and the previously established exchange rate is generally measured as income or an expense in the statement of profit or loss.
In addition, target profit forwards have been concluded to optimize hedging transactions. These transactions secure the right and create the obligation to swap an agreed amount in a foreign currency for the corresponding euro amount at a fixed exchange rate on several target dates as long as the profit resulting from these exchange transactions does not exceed a contractually defined limit.
The Group’s strategy provides for hedging of up to one and a half years. Also, the hedging measures are reviewed at regular intervals in order to adapt them to currency fluctuations.
At the balance sheet date forward contracts have been carried out in an amount of $172 million (2015: $107 million) to hedge against the risk of fluctuation in the EUR | USD exchange rate. This amount covers roughly one third of the expected net exposure for the U.S. dollar within the period of two years. Furthermore, Japanese yen, British pounds and Swiss francs have been hedged in smaller volumes.
The following table shows the forward transactions as well as the target profit forward contracts as of the balance sheet date:

152 Consolidated Financial Statements and Notes Notes to the Individual Balance Sheet Items
Dec. 31, 2015 Currency Volume Maturity Fair value ¤ in
K
Forward contract USD 15,000,000 Q1 2016 –1,098
USD 14,500,000 Q2 2016 –734
USD 15,500,000 Q3 2016 –680
USD 15,000,000 Q4 2016 –844
USD 11,500,000 Q1 2017 –463
USD 10,500,000 Q2 2017 –520
USD 12,000,000 Q3 2017 –577
USD 13,000,000 Q4 2017 –492
USD 107,000,000 –5,407 Target Profit Forward USD 14,000,000 Q3 2017 –43 Forward contract GBP –500,000 Q1 2016 4 Forward contract CHF –2,000,000 Q1 2016 –49
CHF –1,000,000 Q2 2016 –51
CHF –3,000,000 –100 Target Profit Forward JPY 525,000,000 Q3 2017 –23
Dec. 31, 2016 Currency Volume Maturity Fair value ¤ in
K
Forward contract USD 18,500 Q1 2017 –1,538
USD 21,500 Q2 2017 –1,922
USD 19,000 Q3 2017 –1,729
USD 20,000 Q4 2017 –1,282
USD 18,000 Q1 2018 –1,118
USD 15,000 Q2 2018 –1,033
USD 15,000 Q3 2018 –788
USD 16,000 Q4 2018 –1,011
USD 10,000 Q1 2019 –253
USD 9,000 Q2 2019 –215
USD 7,000 Q3 2019 –110
USD 3,000 Q4 2019 8
USD 172,000 –10,991
Structured forward contract USD 6,000 Q1 2017 –118
USD 6,000 Q2 2017 –118
USD 6,000 Q3 2017 –118
USD 6,000 Q4 2017 –118
USD 6,000 Q1 2018 –118
USD 4,000 Q2 2018 –38
USD 3,000 Q3 2018 2
USD 2,000 Q4 2018 1
USD 39,000 –627 Forward contract CHF 4,000 Q1 2017 41
CHF 2,000 Q2 2017 40
CHF 2,000 Q3 2017 39
CHF 2,000 Q4 2017 40
CHF 2,000 Q1 2018 40
CHF 12,000 200 Structured forward contract JPY –75,000 Q1 2017 –25
JPY –75,000 Q2 2017 –25
JPY –75,000 Q3 2017 –25
JPY –25,000 Q4 2017 –8
JPY –250,000 –84

Consolidated Financial Statements and Notes Notes to the Individual Balance Sheet Items 153
Derivative financial instruments are measured at the time of acquisition at cost and at fair value on subsequent balance sheet dates. The changes in value of the derivative financial instruments are recognized in the statement of profit or loss on the balance sheet date. If the derivative financial instruments serve to hedge against cash flow risk and a qualified hedging relationship exists based on the criteria of IAS 39, the valuation adjustments are recognized in other comprehensive income (cumulative amount in 2016: €–9.9 million;2015: €–4.7 million). The amounts recognized in equity are included in the profit or loss in the period in which the hedged transactions affect this result.
If the U.S. dollar would have depreciated 10% against the euro, the equity would have increased by €25.0 million (2015: €14.6 million) and the result would have been increased by €1.0 million (2015: €3.6 million).
Vice versa, if the U.S. dollar would have appreciated 10% against the euro, the resulting impact of the result would have been - €4.6 million (2015: - €4.5 million) and the other comprehensive income - €23.5 million (2015: - €17.9 million).
A variation of the Swiss Franc (CHF) against the Euro would primarily have an impact on the valuation of the liability in connection with the acquisition of the cell culture media business of Lonza in 2012 (denominated in CHF). An increase of the CHF against the Euro by 5% would lead to an increase of the liability amounting to €2.3 million (2015: €2.2 million), a decrease of the CHF against the Euro by 5% would lead to a decrease of the liability amounting to €2.1 million (€2.0 million).
F. Interest Risk Management
Sartorius Stedim Biotech is mainly financed through its parent company Sartorius AG. This major loan is taken out at variable interest rates; therefore the Group continues to be exposed to interest rate risks. To control the interest risk, an appropriate ratio between fixed and variable loans is maintained. Furthermore, the Group concluded interest rate hedges in the form of interest swaps, which cover the majority of the loans outstanding at variable interest rates. As a result, the Group receives the particular (variable) interest rate valid on the market and pays a fixed interest rate.
The following table provides an overview of the interest hedging contracts available on the reporting date.
Instrument
Hedging volume as of
Dec. 31, 2016 ¤ in K
Hedging volume as of
Dec. 31, 2015€ in K End of term
Hedged interest rate
Fair value as of
Dec. 31, 2016 ¤ in K
Fair value as ofDec. 31, 2015
€ in K
Swaps 40,000 40,000up to Aug.
2018 1.68% –1.79% –1,353 –1,920
Total –1,353 –1,920
The Group's general hedging strategy is to secure roughly 50% of the risk exposure for a period up to five years. As of Dec. 31, 2016 the raised loans with variable interest rates amount to approx. €50 million and the hedged volume is up to €40 million for the next two years.
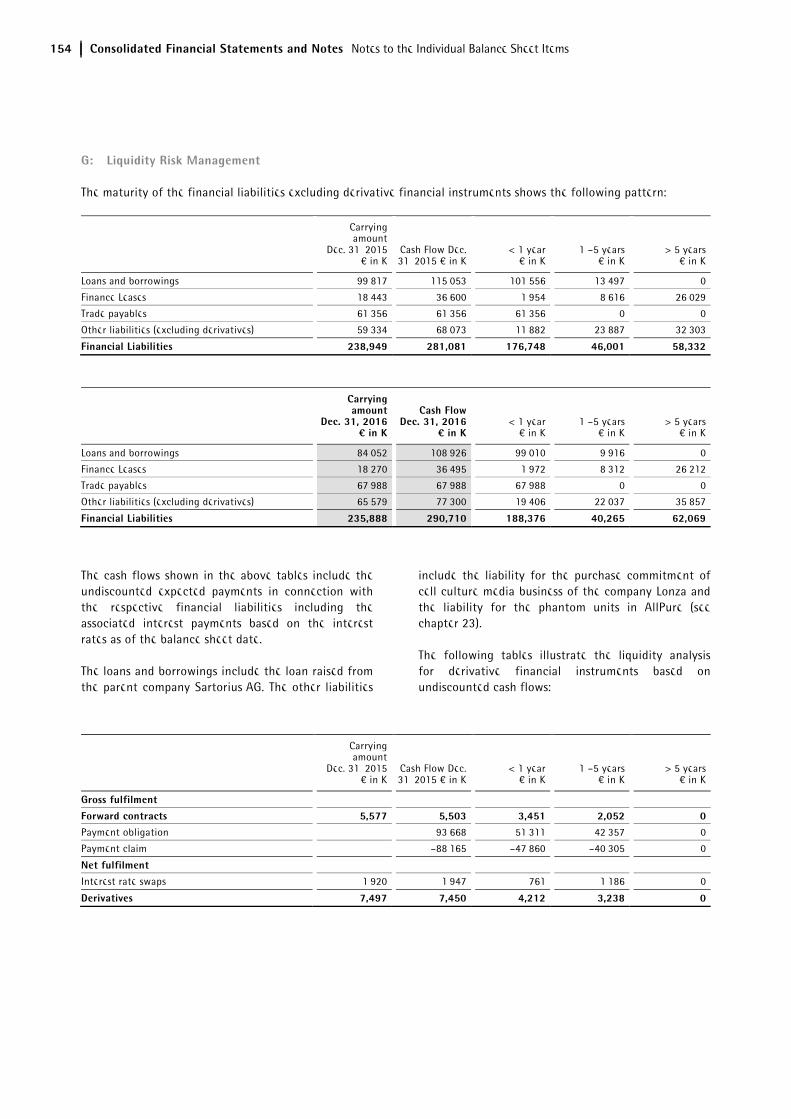
154 Consolidated Financial Statements and Notes Notes to the Individual Balance Sheet Items
G: Liquidity Risk Management
The maturity of the financial liabilities excluding derivative financial instruments shows the following pattern:
Carrying amount
Dec. 31, 2015€ in K
Cash Flow Dec. 31, 2015 € in K
< 1 year€ in K
1 –5 years € in K
> 5 years€ in K
Loans and borrowings 99,817 115,053 101,556 13,497 0
Finance Leases 18,443 36,600 1,954 8,616 26,029
Trade payables 61,356 61,356 61,356 0 0
Other liabilities (excluding derivatives) 59,334 68,073 11,882 23,887 32,303
Financial Liabilities 238,949 281,081 176,748 46,001 58,332
Carrying amount
Dec. 31, 2016¤ in K
Cash Flow Dec. 31, 2016
¤ in K< 1 year
€ in K1 –5 years
€ in K > 5 years
€ in K
Loans and borrowings 84,052 108,926 99,010 9,916 0
Finance Leases 18,270 36,495 1,972 8,312 26,212
Trade payables 67,988 67,988 67,988 0 0
Other liabilities (excluding derivatives) 65,579 77,300 19,406 22,037 35,857
Financial Liabilities 235,888 290,710 188,376 40,265 62,069
The cash flows shown in the above tables include the undiscounted expected payments in connection with the respective financial liabilities including the associated interest payments based on the interest rates as of the balance sheet date.
The loans and borrowings include the loan raised from the parent company Sartorius AG. The other liabilities
include the liability for the purchase commitment of cell culture media business of the company Lonza and the liability for the phantom units in AllPure (see chapter 23).
The following tables illustrate the liquidity analysis for derivative financial instruments based on undiscounted cash flows:
Carrying amount
Dec. 31, 2015€ in K
Cash Flow Dec. 31, 2015 € in K
< 1 year€ in K
1 –5 years € in K
> 5 years€ in K
Gross fulfilment
Forward contracts 5,577 5,503 3,451 2,052 0Payment obligation 93,668 51,311 42,357 0
Payment claim –88,165 –47,860 –40,305 0
Net fulfilment Interest rate swaps 1,920 1,947 761 1,186 0
Derivatives 7,497 7,450 4,212 3,238 0
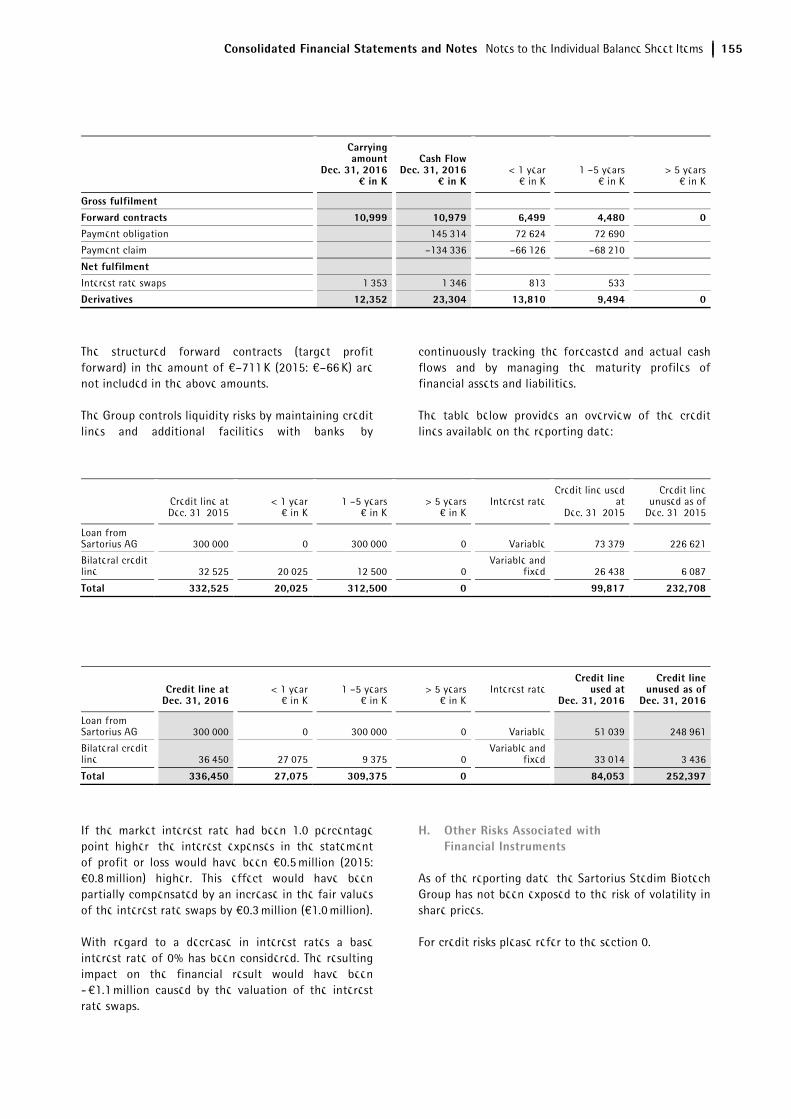
Consolidated Financial Statements and Notes Notes to the Individual Balance Sheet Items 155
Carrying amount
Dec. 31, 2016¤ in K
Cash Flow Dec. 31, 2016
¤ in K< 1 year
€ in K1 –5 years
€ in K > 5 years
€ in K
Gross fulfilment
Forward contracts 10,999 10,979 6,499 4,480 0Payment obligation 145,314 72,624 72,690
Payment claim –134,336 –66,126 –68,210
Net fulfilment Interest rate swaps 1,353 1,346 813 533
Derivatives 12,352 23,304 13,810 9,494 0
The structured forward contracts (target profit forward) in the amount of €–711 K (2015: €–66 K) are not included in the above amounts.
The Group controls liquidity risks by maintaining credit lines and additional facilities with banks, by
continuously tracking the forecasted and actual cash flows and by managing the maturity profiles of financial assets and liabilities.
The table below provides an overview of the credit lines available on the reporting date:
Credit line at Dec. 31, 2015
< 1 year € in K
1 –5 years€ in K
> 5 years€ in K
Interest rateCredit line used
at Dec. 31, 2015
Credit lineunused as of
Dec. 31, 2015
Loan from Sartorius AG 300,000 0 300,000 0 Variable 73,379 226,621
Bilateral credit line 32,525 20,025 12,500 0
Variable and fixed 26,438 6,087
Total 332,525 20,025 312,500 0 99,817 232,708
Credit line at
Dec. 31, 2016 < 1 year
€ in K 1 –5 years
€ in K> 5 years
€ in KInterest rate
Credit line used at
Dec. 31, 2016
Credit lineunused as of
Dec. 31, 2016
Loan from Sartorius AG 300,000 0 300,000 0 Variable 51,039 248,961
Bilateral credit line 36,450 27,075 9,375 0
Variable and fixed 33,014 3,436
Total 336,450 27,075 309,375 0 84,053 252,397
If the market interest rate had been 1.0 percentage point higher, the interest expenses in the statement of profit or loss would have been €0.5 million (2015: €0.8 million) higher. This effect would have been partially compensated by an increase in the fair values of the interest rate swaps by €0.3 million (€1.0 million).
With regard to a decrease in interest rates a base interest rate of 0% has been considered. The resulting impact on the financial result would have been - €1.1 million caused by the valuation of the interest rate swaps.
H. Other Risks Associated with Financial Instruments
As of the reporting date, the Sartorius Stedim Biotech Group has not been exposed to the risk of volatility in share prices.
For credit risks please refer to the section 0.

156 Consolidated Financial Statements and Notes Notes to the Individual Balance Sheet Items
31. Share-based Payments
Share-based payments relate to stock option plans allocated to Group personnel.
The various stock option plans outstanding at December 31, 2015, and December 31, 2016, are summarized as follows:
Dec. 31, 2016 Number of
options
Dec. 31, 2015 Number of
options
Outstanding at beginning of period 0 8,000
Allocated during the period 0 0
Cancelled during the period 0 0
Exercised during the period 0 –8,000
Lapsed in the period 0 0
Outstanding at end of period 0 0
Exercisable at the end of period 0 0
Date of General Meeting authorizing the plan
Date on which the Board granted approval
Initial number of
shares to be
subscribed
Number of shares to
be subscribed
by directors
and executives
Number of directors
and executives concerned
Number of initial
bene-ficiaries
Subscrip-tion on
price in €
Number of shares
subscribed over the
fiscal year 2015
Number of options granted
and exercisable at Dec. 31,
2015
Number of options
subject to target
performance at Dec. 31,
2015
Total of number
of bene-
ficiaries of valid options
June 10, 2005 Sept. 15, 2005 127,500 0 0 15 18.87 5,000 0 0 0
June 10, 2005 Nov. 10, 2006 35,000 0 0 2 29.51 3,000 0 0 0
Total 162,500 0 17 8,000 0 0 0
0
The cost for 2016 is €0 K. No new additional stock options were granted in 2016. All options have now been exercised, the program is therefore closed.
Sartorius Stedim Biotech share purchase options have been allocated by the Group to some of its senior managerial employees and directors. The fair value of services performed as consideration for the allocation of these options is measured by reference to the fair value of these options at the date of allocation. In order to perform this estimate, the Group uses a binomial-type mathematic model.
The total fair value of each plan thus measured is recognized as an expense spread over the full vesting period of the plan. This expense is recognized under personnel costs and offset by an increase in reserves. Cash received by the Group upon the exercise of these
options is recognized in the cash and cash equivalents with a corresponding item in the issued capital and the reserves.
On the level of Sartorius Stedim Biotech's majority shareholder Sartorius AG, share-based payments exist in the form of so-called phantom stock units. Under this plan the respective board member is granted a certain number of phantom stocks each year that represent an agreed amount of money. The exercise of these stocks is not possible before four years and is depending on certain requirements regarding the performance of the Sartorius AG shares. When the stocks are paid out the amount is based on the share price at the exercise date. The payment is capped at an amount of 2.5 times the share price at the time these virtual options were granted. For further details please refer to the Remuneration Report.
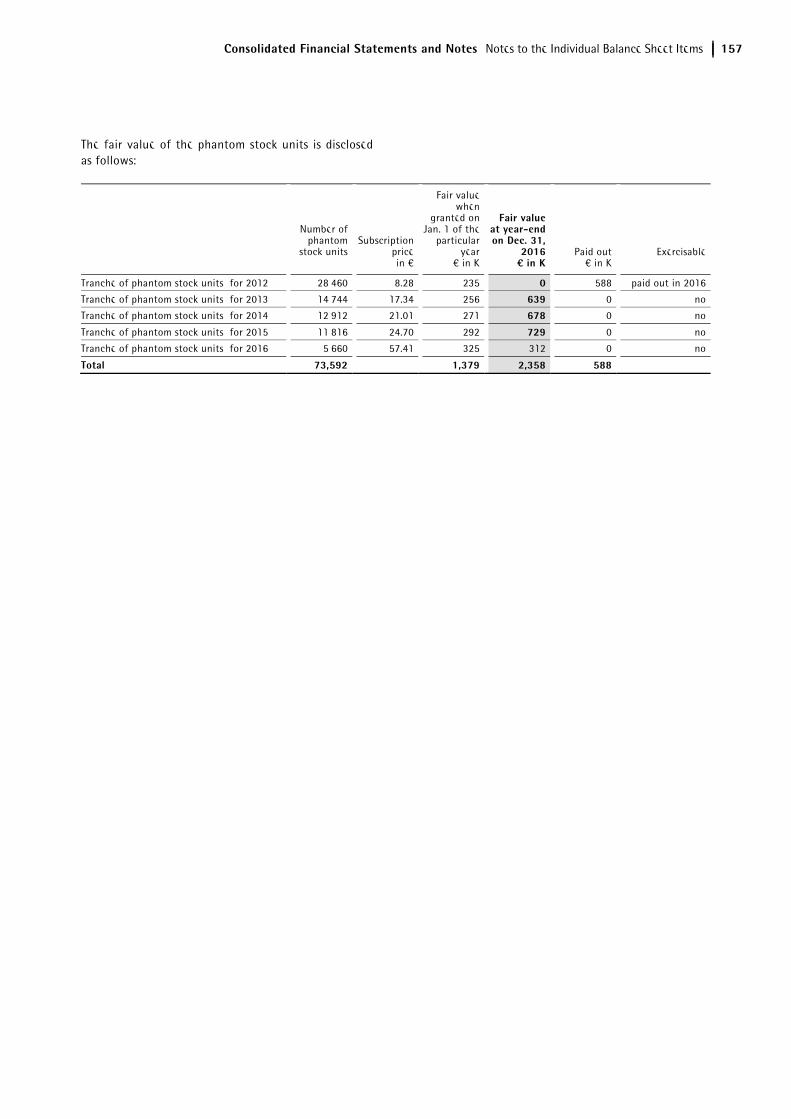
Consolidated Financial Statements and Notes Notes to the Individual Balance Sheet Items 157
The fair value of the phantom stock units is disclosed as follows:
Number of phantom
stock unitsSubscription
pricein €
Fair value when
granted on Jan. 1 of the
particular year
€ in K
Fair value at year-end on Dec. 31,
2016¤ in K
Paid out € in K
Exercisable
Tranche of phantom stock units for 2012 28,460 8.28 235 0 588 paid out in 2016
Tranche of phantom stock units for 2013 14,744 17.34 256 639 0 no
Tranche of phantom stock units for 2014 12,912 21.01 271 678 0 no
Tranche of phantom stock units for 2015 11,816 24.70 292 729 0 no
Tranche of phantom stock units for 2016 5,660 57.41 325 312 0 no
Total 73,592 1,379 2,358 588
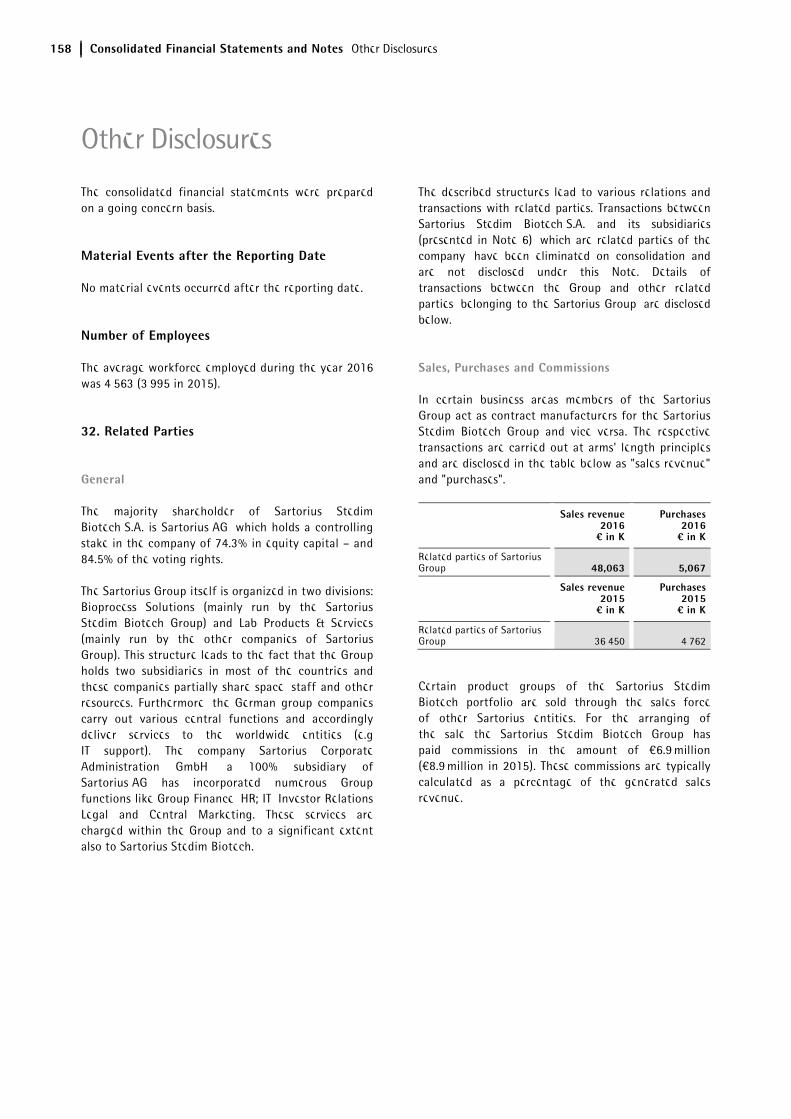
158 Consolidated Financial Statements and Notes Other Disclosures
The consolidated financial statements were prepared on a going concern basis.
Material Events after the Reporting Date
No material events occurred after the reporting date.
Number of Employees
The average workforce employed during the year 2016 was 4,563 (3,995 in 2015).
32. Related Parties
General
The majority shareholder of Sartorius Stedim Biotech S.A. is Sartorius AG, which holds a controlling stake in the company of 74.3% in equity capital – and 84.5% of the voting rights.
The Sartorius Group itself is organized in two divisions: Bioprocess Solutions (mainly run by the Sartorius Stedim Biotech Group) and Lab Products & Services (mainly run by the other companies of Sartorius Group). This structure leads to the fact that the Group holds two subsidiaries in most of the countries and these companies partially share space, staff and other resources. Furthermore, the German group companies carry out various central functions and accordingly deliver services to the worldwide entities (e.g IT support). The company Sartorius Corporate Administration GmbH, a 100% subsidiary of Sartorius AG has incorporated numerous Group functions like Group Finance, HR; IT, Investor Relations, Legal and Central Marketing. These services are charged within the Group and to a significant extent also to Sartorius Stedim Biotech.
The described structures lead to various relations and transactions with related parties. Transactions between Sartorius Stedim Biotech S.A. and its subsidiaries (presented in Note 6), which are related parties of the company, have been eliminated on consolidation and are not disclosed under this Note. Details of transactions between the Group and other related parties, belonging to the Sartorius Group, are disclosed below.
Sales, Purchases and Commissions
In certain business areas members of the Sartorius Group act as contract manufacturers for the Sartorius Stedim Biotech Group and vice versa. The respective transactions are carried out at arms' length principles and are disclosed in the table below as "sales revenue" and "purchases".
Sales revenue 2016 ¤ in K
Purchases2016¤ in K
Related parties of Sartorius Group 48,063 5,067
Sales revenue 2015 ¤ in K
Purchases2015¤ in K
Related parties of Sartorius Group 36,450 4,762
Certain product groups of the Sartorius Stedim Biotech portfolio are sold through the sales force of other Sartorius entities. For the arranging of the sale the Sartorius Stedim Biotech Group has paid commissions in the amount of €6.9 million (€8.9 million in 2015). These commissions are typically calculated as a percentage of the generated sales revenue.
Other Disclosures
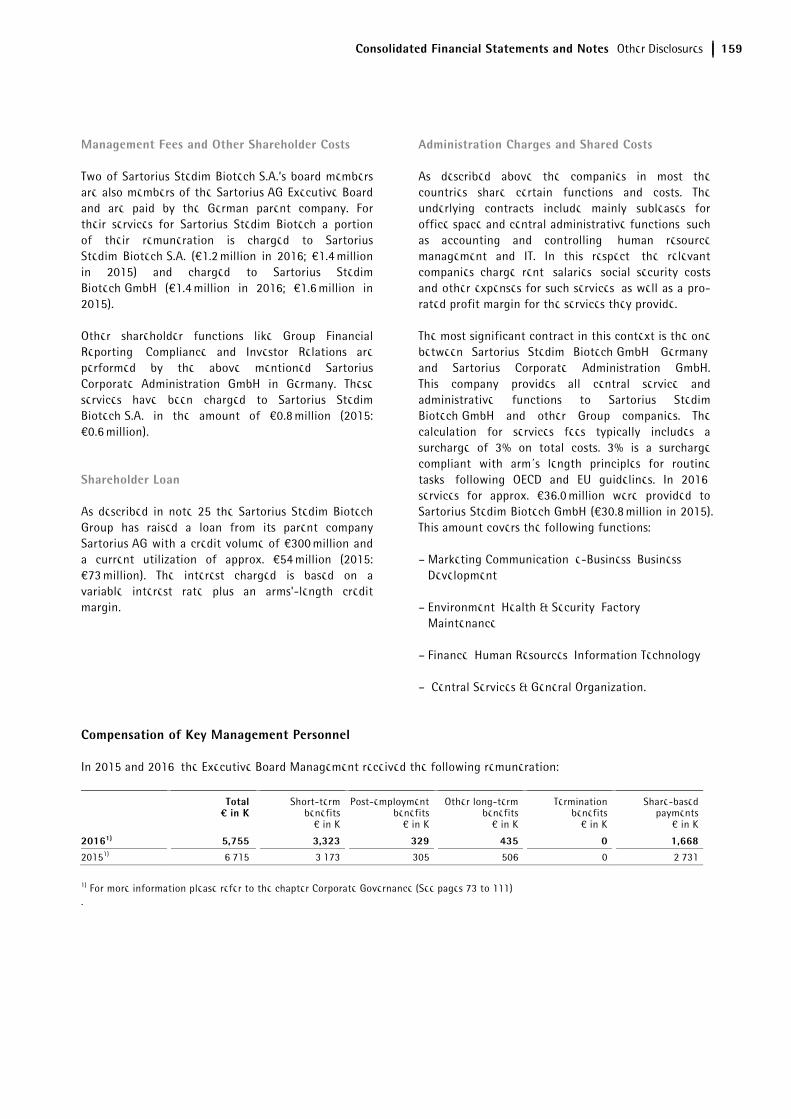
Consolidated Financial Statements and Notes Other Disclosures 159
Management Fees and Other Shareholder Costs
Two of Sartorius Stedim Biotech S.A.’s board members are also members of the Sartorius AG Executive Board and are paid by the German parent company. For their services for Sartorius Stedim Biotech a portion of their remuneration is charged to Sartorius Stedim Biotech S.A. (€1.2 million in 2016; €1.4 million in 2015) and charged to Sartorius Stedim Biotech GmbH (€1.4 million in 2016; €1.6 million in 2015).
Other shareholder functions like Group Financial Reporting, Compliance and Investor Relations are performed by the above mentioned Sartorius Corporate Administration GmbH in Germany. These services have been charged to Sartorius Stedim Biotech S.A. in the amount of €0.8 million (2015: €0.6 million).
Shareholder Loan
As described in note 25 the Sartorius Stedim Biotech Group has raised a loan from its parent company Sartorius AG with a credit volume of €300 million and a current utilization of approx. €54 million (2015: €73 million). The interest charged is based on a variable interest rate plus an arms'-length credit margin.
Administration Charges and Shared Costs
As described above the companies in most the countries share certain functions and costs. The underlying contracts include mainly subleases for office space and central administrative functions, such as accounting and controlling, human resource management and IT. In this respect, the relevant companies charge rent, salaries, social security costs and other expenses for such services, as well as a pro-rated profit margin for the services they provide.
The most significant contract in this context is the one between Sartorius Stedim Biotech GmbH, Germany, and Sartorius Corporate Administration GmbH. This company provides all central service and administrative functions to Sartorius Stedim Biotech GmbH and other Group companies. The calculation for services fees typically includes a surcharge of 3% on total costs. 3% is a surcharge compliant with arm´s length principles for routine tasks, following OECD and EU guidelines. In 2016, services for approx. €36.0 million were provided to Sartorius Stedim Biotech GmbH (€30.8 million in 2015). This amount covers the following functions:
– Marketing Communication, e-Business, Business Development
– Environment, Health & Security, Factory Maintenance
– Finance, Human Resources, Information Technology
– Central Services & General Organization.
Compensation of Key Management Personnel
In 2015 and 2016, the Executive Board Management received the following remuneration:
Total ¤ in K
Short-term benefits
€ in K
Post-employmentbenefits
€ in K
Other long-termbenefits
€ in K
Termination benefits
€ in K
Share-based payments
€ in K
20161) 5,755 3,323 329 435 0 1,66820151) 6,715 3,173 305 506 0 2,731
1) For more information please refer to the chapter Corporate Governance (See pages 73 to 111) .