Embed Size (px)
Citation preview
TELEGRAPH ROAD
JERS
EY AV
ENUE
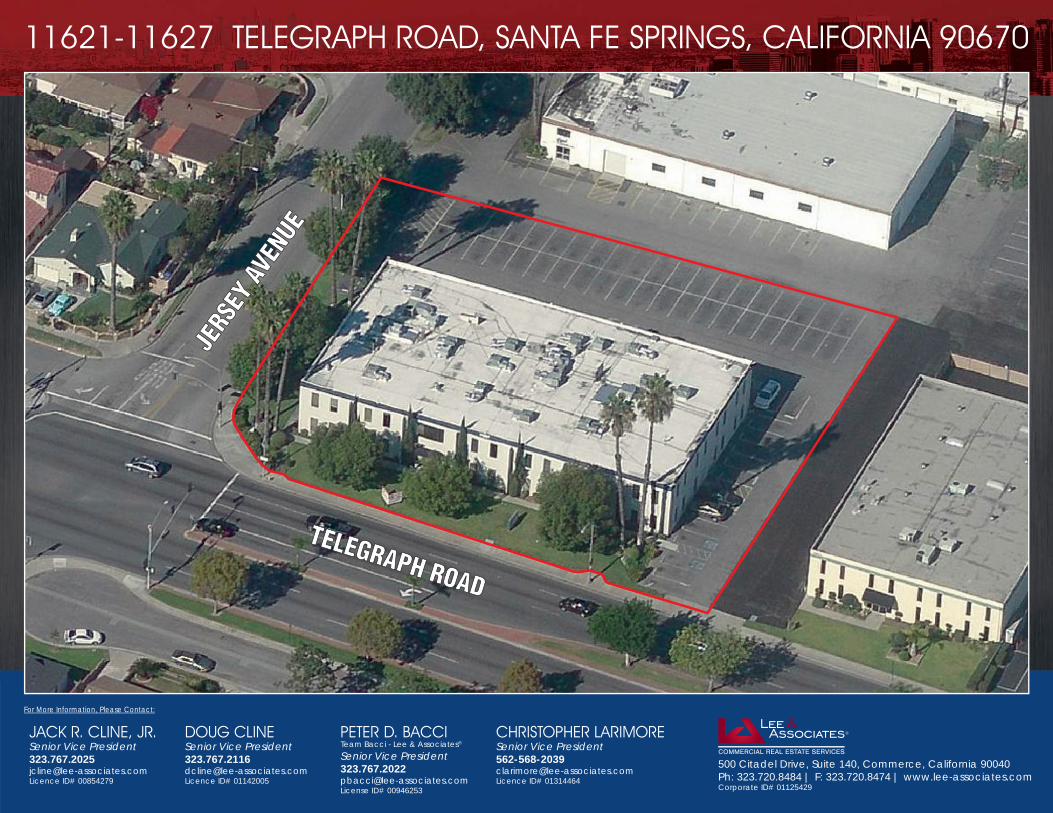
11621-11627 TELEGRAPH ROAD, SANTA FE SPRINGS, CALIFORNIA 90670
500 Citadel Drive, Suite 140, Commerce, California 90040Ph: 323.720.8484 | F: 323.720.8474 | www.lee-associates.comCorporate ID# 01125429
For More Information, Please Contact:
JACK R. CLINE, JR.Senior Vice [email protected] ID# 00854279
DOUG CLINESenior Vice [email protected] ID# 01142005
PETER D. BACCITeam Bacci - Lee & Associates®
Senior Vice [email protected] ID# 00946253
CHRISTOPHER LARIMORESenior Vice [email protected] ID# 01314464
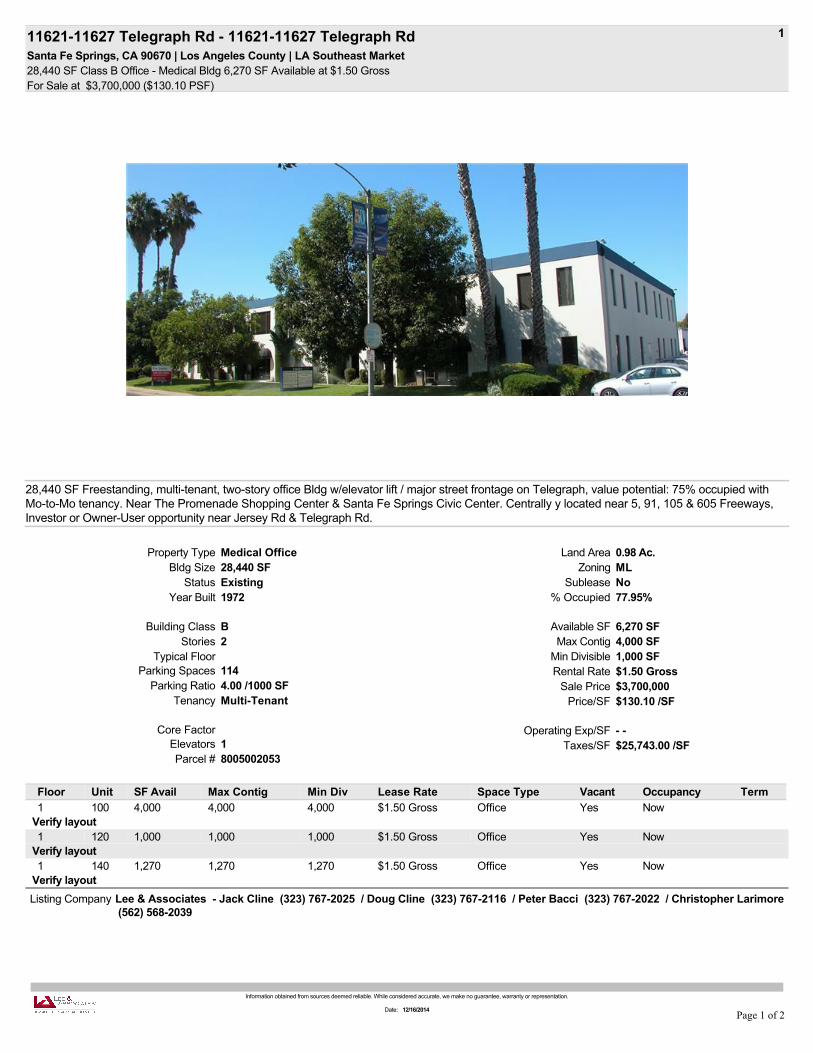
11162111627 Telegraph Rd 1162111627 Telegraph RdSanta Fe Springs, CA 90670 | Los Angeles County | LA Southeast Market28,440 SF Class B Office Medical Bldg 6,270 SF Available at $1.50 GrossFor Sale at $3,700,000 ($130.10 PSF)
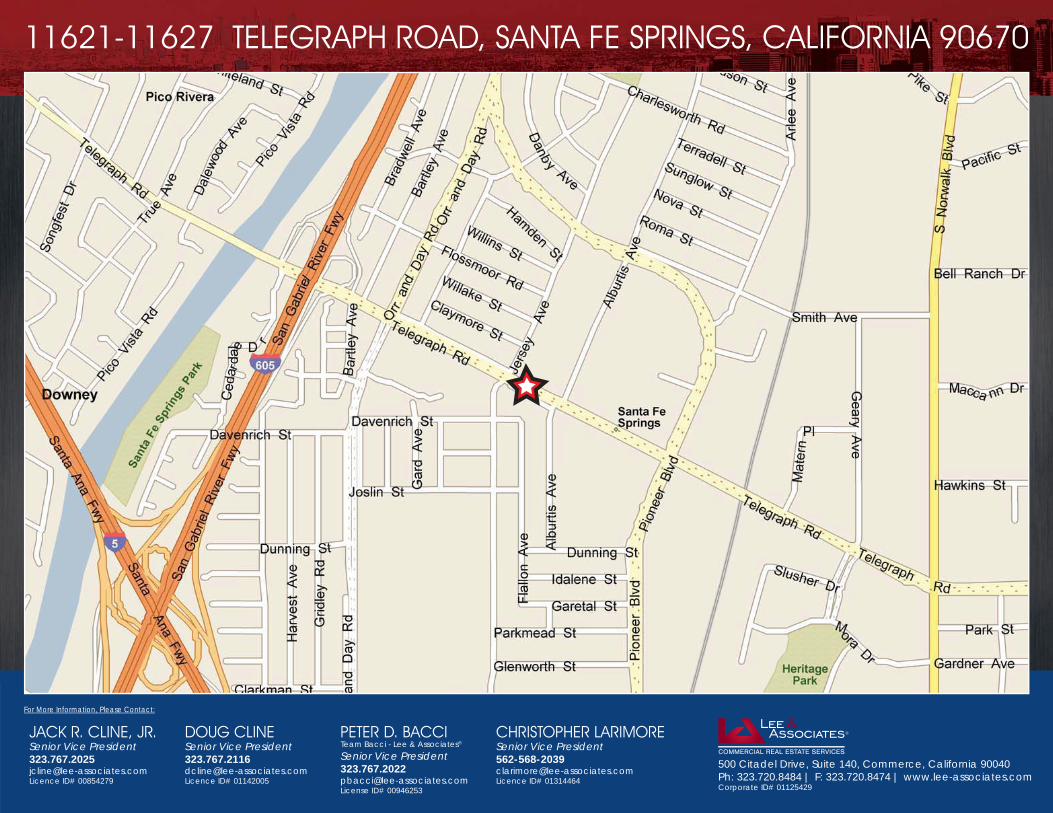
28,440 SF Freestanding, multitenant, twostory office Bldg w/elevator lift / major street frontage on Telegraph, value potential: 75% occupied withMotoMo tenancy. Near The Promenade Shopping Center & Santa Fe Springs Civic Center. Centrally y located near 5, 91, 105 & 605 Freeways,Investor or OwnerUser opportunity near Jersey Rd & Telegraph Rd.
Property Type Medical Office
Bldg Size 28,440 SFStatus Existing
Year Built 1972
Building Class BStories 2
Typical Floor Parking Spaces 114Parking Ratio 4.00 /1000 SF
Tenancy MultiTenant
Core Factor Elevators 1Parcel # 8005002053
Land Area 0.98 Ac.Zoning ML
Sublease No% Occupied 77.95%
Available SF 6,270 SFMax Contig 4,000 SFMin Divisible 1,000 SFRental Rate $1.50 GrossSale Price $3,700,000Price/SF $130.10 /SF
Operating Exp/SF
Taxes/SF $25,743.00 /SF
Floor Unit SF Avail Max Contig Min Div Lease Rate Space Type Vacant Occupancy Term1 100 4,000 4,000 4,000 $1.50 Gross Office Yes NowVerify layout1 120 1,000 1,000 1,000 $1.50 Gross Office Yes NowVerify layout1 140 1,270 1,270 1,270 $1.50 Gross Office Yes NowVerify layout
Listing Company Lee & Associates Jack Cline (323) 7672025 / Doug Cline (323) 7672116 / Peter Bacci (323) 7672022 / Christopher Larimore (562) 5682039
Information obtained from sources deemed reliable. While considered accurate, we make no guarantee, warranty or representation.
Date: 12/16/2014
Page 1 of 2
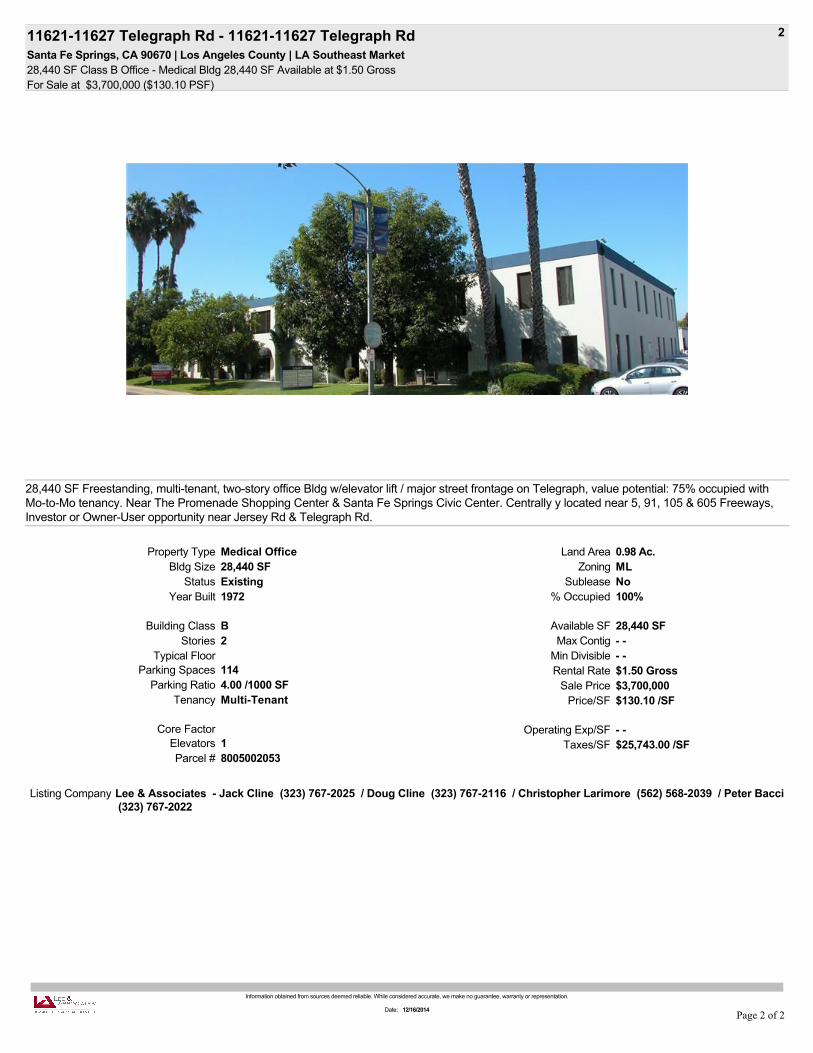
21162111627 Telegraph Rd 1162111627 Telegraph RdSanta Fe Springs, CA 90670 | Los Angeles County | LA Southeast Market28,440 SF Class B Office Medical Bldg 28,440 SF Available at $1.50 GrossFor Sale at $3,700,000 ($130.10 PSF)
28,440 SF Freestanding, multitenant, twostory office Bldg w/elevator lift / major street frontage on Telegraph, value potential: 75% occupied withMotoMo tenancy. Near The Promenade Shopping Center & Santa Fe Springs Civic Center. Centrally y located near 5, 91, 105 & 605 Freeways,Investor or OwnerUser opportunity near Jersey Rd & Telegraph Rd.
Property Type Medical Office
Bldg Size 28,440 SFStatus Existing
Year Built 1972
Building Class BStories 2
Typical Floor Parking Spaces 114Parking Ratio 4.00 /1000 SF
Tenancy MultiTenant
Core Factor Elevators 1Parcel # 8005002053
Land Area 0.98 Ac.Zoning ML
Sublease No% Occupied 100%
Available SF 28,440 SFMax Contig Min Divisible Rental Rate $1.50 GrossSale Price $3,700,000Price/SF $130.10 /SF
Operating Exp/SF
Taxes/SF $25,743.00 /SF
Listing Company Lee & Associates Jack Cline (323) 7672025 / Doug Cline (323) 7672116 / Christopher Larimore (562) 5682039 / Peter Bacci (323) 7672022
Information obtained from sources deemed reliable. While considered accurate, we make no guarantee, warranty or representation.
Date: 12/16/2014
Page 2 of 2
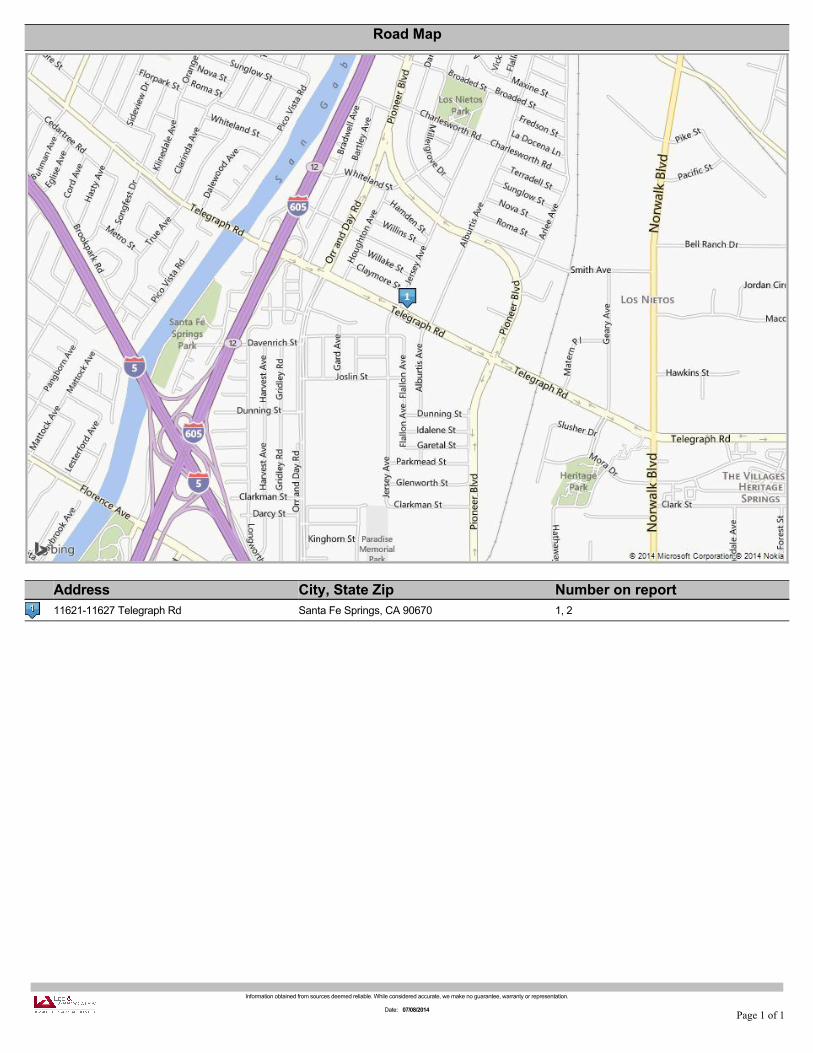
Road Map
Address City, State Zip Number on report1162111627 Telegraph Rd Santa Fe Springs, CA 90670 1, 2
Information obtained from sources deemed reliable. While considered accurate, we make no guarantee, warranty or representation.
Date: 07/08/2014
Page 1 of 1
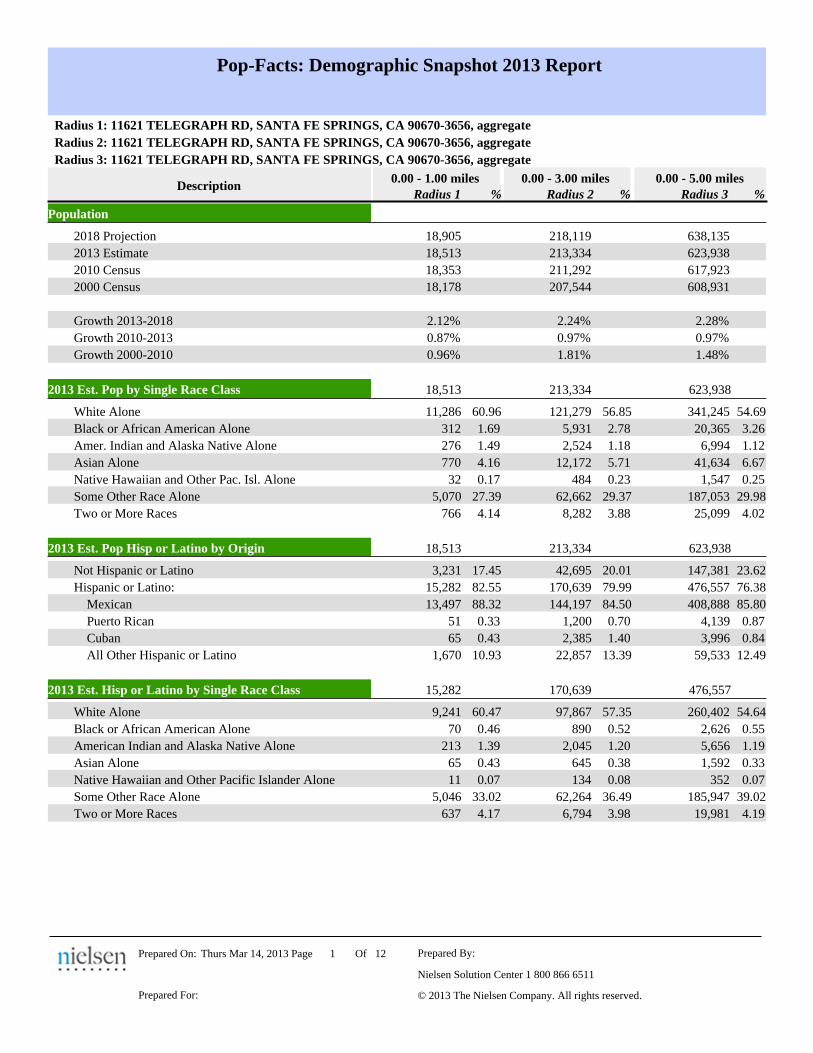
Pop-Facts: Demographic Snapshot 2013 Report
Radius 1: 11621 TELEGRAPH RD, SANTA FE SPRINGS, CA 90670-3656, aggregate
Radius 2: 11621 TELEGRAPH RD, SANTA FE SPRINGS, CA 90670-3656, aggregate
Radius 3: 11621 TELEGRAPH RD, SANTA FE SPRINGS, CA 90670-3656, aggregate
Radius 3Radius 2
0.00 - 5.00 miles0.00 - 3.00 miles0.00 - 1.00 miles
% % %Radius 1Description
Population
638,135218,11918,905 2018 Projection
623,938213,33418,513 2013 Estimate
617,923211,29218,353 2010 Census
608,931207,54418,178 2000 Census
2.28%2.24%2.12% Growth 2013-2018
0.97%0.97%0.87% Growth 2010-2013
1.48%1.81%0.96% Growth 2000-2010
2013 Est. Pop by Single Race Class 213,334 623,93818,513
341,245 54.6956.85121,27911,286 White Alone 60.96
20,365 3.262.785,931312 Black or African American Alone 1.69
6,994 1.121.182,524276 Amer. Indian and Alaska Native Alone 1.49
41,634 6.675.7112,172770 Asian Alone 4.16
1,547 0.250.2348432 Native Hawaiian and Other Pac. Isl. Alone 0.17
187,053 29.9829.3762,6625,070 Some Other Race Alone 27.39
25,099 4.023.888,282766 Two or More Races 4.14
2013 Est. Pop Hisp or Latino by Origin 213,334 623,93818,513
147,381 23.6220.0142,6953,231 Not Hispanic or Latino 17.45
476,557 76.3879.99170,63915,282 Hispanic or Latino: 82.55
408,888 85.8084.50144,19713,497 Mexican 88.32
4,139 0.870.701,20051 Puerto Rican 0.33
3,996 0.841.402,38565 Cuban 0.43
59,533 12.4913.3922,8571,670 All Other Hispanic or Latino 10.93
2013 Est. Hisp or Latino by Single Race Class 170,639 476,55715,282
260,402 54.6457.3597,8679,241 White Alone 60.47
2,626 0.550.5289070 Black or African American Alone 0.46
5,656 1.191.202,045213 American Indian and Alaska Native Alone 1.39
1,592 0.330.3864565 Asian Alone 0.43
352 0.070.0813411 Native Hawaiian and Other Pacific Islander Alone 0.07
185,947 39.0236.4962,2645,046 Some Other Race Alone 33.02
19,981 4.193.986,794637 Two or More Races 4.17
Nielsen Solution Center 1 800 866 6511
Prepared By:
Prepared For:
121 OfPage
© 2013 The Nielsen Company. All rights reserved.
Thurs Mar 14, 2013Prepared On:
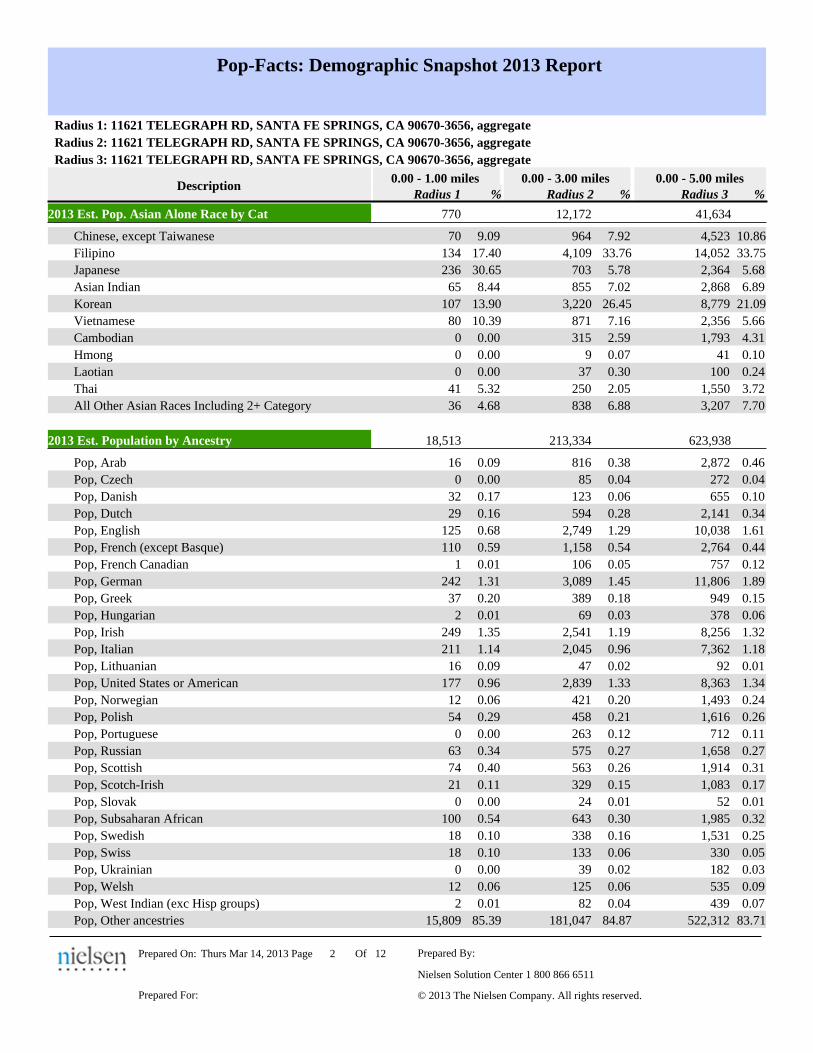
Pop-Facts: Demographic Snapshot 2013 Report
Radius 1: 11621 TELEGRAPH RD, SANTA FE SPRINGS, CA 90670-3656, aggregate
Radius 2: 11621 TELEGRAPH RD, SANTA FE SPRINGS, CA 90670-3656, aggregate
Radius 3: 11621 TELEGRAPH RD, SANTA FE SPRINGS, CA 90670-3656, aggregate
Radius 3Radius 2
0.00 - 5.00 miles0.00 - 3.00 miles0.00 - 1.00 miles
% % %Radius 1Description
2013 Est. Pop. Asian Alone Race by Cat 12,172 41,634770
4,523 10.867.9296470 Chinese, except Taiwanese 9.09
14,052 33.7533.764,109134 Filipino 17.40
2,364 5.685.78703236 Japanese 30.65
2,868 6.897.0285565 Asian Indian 8.44
8,779 21.0926.453,220107 Korean 13.90
2,356 5.667.1687180 Vietnamese 10.39
1,793 4.312.593150 Cambodian 0.00
41 0.100.0790 Hmong 0.00
100 0.240.30370 Laotian 0.00
1,550 3.722.0525041 Thai 5.32
3,207 7.706.8883836 All Other Asian Races Including 2+ Category 4.68
2013 Est. Population by Ancestry 213,334 623,93818,513
2,872 0.460.3881616 Pop, Arab 0.09
272 0.040.04850 Pop, Czech 0.00
655 0.100.0612332 Pop, Danish 0.17
2,141 0.340.2859429 Pop, Dutch 0.16
10,038 1.611.292,749125 Pop, English 0.68
2,764 0.440.541,158110 Pop, French (except Basque) 0.59
757 0.120.051061 Pop, French Canadian 0.01
11,806 1.891.453,089242 Pop, German 1.31
949 0.150.1838937 Pop, Greek 0.20
378 0.060.03692 Pop, Hungarian 0.01
8,256 1.321.192,541249 Pop, Irish 1.35
7,362 1.180.962,045211 Pop, Italian 1.14
92 0.010.024716 Pop, Lithuanian 0.09
8,363 1.341.332,839177 Pop, United States or American 0.96
1,493 0.240.2042112 Pop, Norwegian 0.06
1,616 0.260.2145854 Pop, Polish 0.29
712 0.110.122630 Pop, Portuguese 0.00
1,658 0.270.2757563 Pop, Russian 0.34
1,914 0.310.2656374 Pop, Scottish 0.40
1,083 0.170.1532921 Pop, Scotch-Irish 0.11
52 0.010.01240 Pop, Slovak 0.00
1,985 0.320.30643100 Pop, Subsaharan African 0.54
1,531 0.250.1633818 Pop, Swedish 0.10
330 0.050.0613318 Pop, Swiss 0.10
182 0.030.02390 Pop, Ukrainian 0.00
535 0.090.0612512 Pop, Welsh 0.06
439 0.070.04822 Pop, West Indian (exc Hisp groups) 0.01
522,312 83.7184.87181,04715,809 Pop, Other ancestries 85.39
Nielsen Solution Center 1 800 866 6511
Prepared By:
Prepared For:
122 OfPage
© 2013 The Nielsen Company. All rights reserved.
Thurs Mar 14, 2013Prepared On:
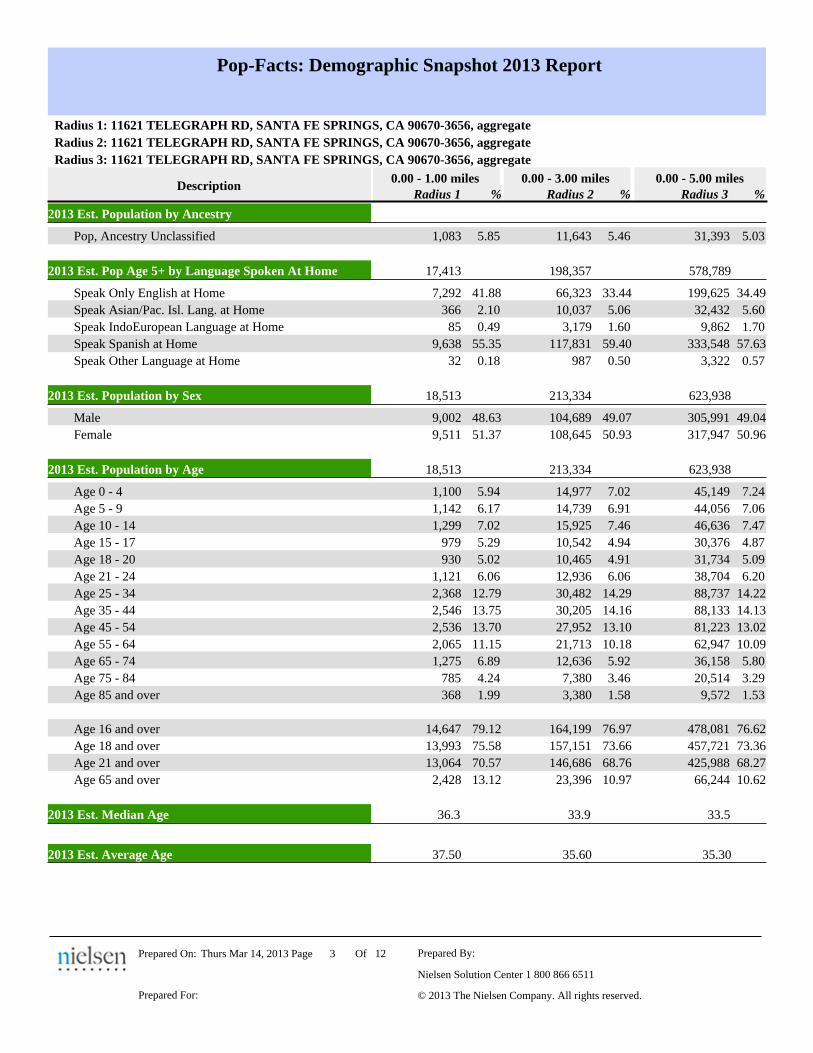
Pop-Facts: Demographic Snapshot 2013 Report
Radius 1: 11621 TELEGRAPH RD, SANTA FE SPRINGS, CA 90670-3656, aggregate
Radius 2: 11621 TELEGRAPH RD, SANTA FE SPRINGS, CA 90670-3656, aggregate
Radius 3: 11621 TELEGRAPH RD, SANTA FE SPRINGS, CA 90670-3656, aggregate
Radius 3Radius 2
0.00 - 5.00 miles0.00 - 3.00 miles0.00 - 1.00 miles
% % %Radius 1Description
2013 Est. Population by Ancestry
31,393 5.035.4611,6431,083 Pop, Ancestry Unclassified 5.85
2013 Est. Pop Age 5+ by Language Spoken At Home 198,357 578,78917,413
199,625 34.4933.4466,3237,292 Speak Only English at Home 41.88
32,432 5.605.0610,037366 Speak Asian/Pac. Isl. Lang. at Home 2.10
9,862 1.701.603,17985 Speak IndoEuropean Language at Home 0.49
333,548 57.6359.40117,8319,638 Speak Spanish at Home 55.35
3,322 0.570.5098732 Speak Other Language at Home 0.18
2013 Est. Population by Sex 213,334 623,93818,513
305,991 49.0449.07104,6899,002 Male 48.63
317,947 50.9650.93108,6459,511 Female 51.37
2013 Est. Population by Age 213,334 623,93818,513
45,149 7.247.0214,9771,100 Age 0 - 4 5.94
44,056 7.066.9114,7391,142 Age 5 - 9 6.17
46,636 7.477.4615,9251,299 Age 10 - 14 7.02
30,376 4.874.9410,542979 Age 15 - 17 5.29
31,734 5.094.9110,465930 Age 18 - 20 5.02
38,704 6.206.0612,9361,121 Age 21 - 24 6.06
88,737 14.2214.2930,4822,368 Age 25 - 34 12.79
88,133 14.1314.1630,2052,546 Age 35 - 44 13.75
81,223 13.0213.1027,9522,536 Age 45 - 54 13.70
62,947 10.0910.1821,7132,065 Age 55 - 64 11.15
36,158 5.805.9212,6361,275 Age 65 - 74 6.89
20,514 3.293.467,380785 Age 75 - 84 4.24
9,572 1.531.583,380368 Age 85 and over 1.99
478,081 76.6276.97164,19914,647 Age 16 and over 79.12
457,721 73.3673.66157,15113,993 Age 18 and over 75.58
425,988 68.2768.76146,68613,064 Age 21 and over 70.57
66,244 10.6210.9723,3962,428 Age 65 and over 13.12
2013 Est. Median Age 33.9 33.536.3
2013 Est. Average Age 35.60 35.3037.50
Nielsen Solution Center 1 800 866 6511
Prepared By:
Prepared For:
123 OfPage
© 2013 The Nielsen Company. All rights reserved.
Thurs Mar 14, 2013Prepared On:
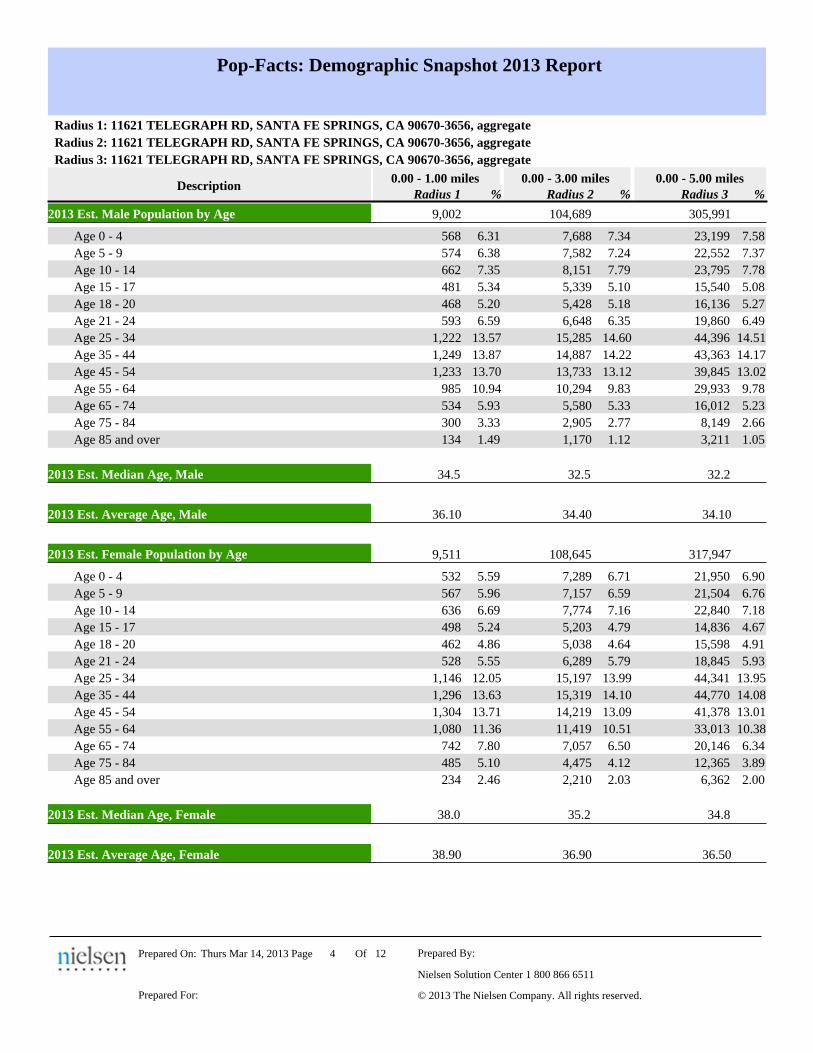
Pop-Facts: Demographic Snapshot 2013 Report
Radius 1: 11621 TELEGRAPH RD, SANTA FE SPRINGS, CA 90670-3656, aggregate
Radius 2: 11621 TELEGRAPH RD, SANTA FE SPRINGS, CA 90670-3656, aggregate
Radius 3: 11621 TELEGRAPH RD, SANTA FE SPRINGS, CA 90670-3656, aggregate
Radius 3Radius 2
0.00 - 5.00 miles0.00 - 3.00 miles0.00 - 1.00 miles
% % %Radius 1Description
2013 Est. Male Population by Age 104,689 305,9919,002
23,199 7.587.347,688568 Age 0 - 4 6.31
22,552 7.377.247,582574 Age 5 - 9 6.38
23,795 7.787.798,151662 Age 10 - 14 7.35
15,540 5.085.105,339481 Age 15 - 17 5.34
16,136 5.275.185,428468 Age 18 - 20 5.20
19,860 6.496.356,648593 Age 21 - 24 6.59
44,396 14.5114.6015,2851,222 Age 25 - 34 13.57
43,363 14.1714.2214,8871,249 Age 35 - 44 13.87
39,845 13.0213.1213,7331,233 Age 45 - 54 13.70
29,933 9.789.8310,294985 Age 55 - 64 10.94
16,012 5.235.335,580534 Age 65 - 74 5.93
8,149 2.662.772,905300 Age 75 - 84 3.33
3,211 1.051.121,170134 Age 85 and over 1.49
2013 Est. Median Age, Male 32.5 32.234.5
2013 Est. Average Age, Male 34.40 34.1036.10
2013 Est. Female Population by Age 108,645 317,9479,511
21,950 6.906.717,289532 Age 0 - 4 5.59
21,504 6.766.597,157567 Age 5 - 9 5.96
22,840 7.187.167,774636 Age 10 - 14 6.69
14,836 4.674.795,203498 Age 15 - 17 5.24
15,598 4.914.645,038462 Age 18 - 20 4.86
18,845 5.935.796,289528 Age 21 - 24 5.55
44,341 13.9513.9915,1971,146 Age 25 - 34 12.05
44,770 14.0814.1015,3191,296 Age 35 - 44 13.63
41,378 13.0113.0914,2191,304 Age 45 - 54 13.71
33,013 10.3810.5111,4191,080 Age 55 - 64 11.36
20,146 6.346.507,057742 Age 65 - 74 7.80
12,365 3.894.124,475485 Age 75 - 84 5.10
6,362 2.002.032,210234 Age 85 and over 2.46
2013 Est. Median Age, Female 35.2 34.838.0
2013 Est. Average Age, Female 36.90 36.5038.90
Nielsen Solution Center 1 800 866 6511
Prepared By:
Prepared For:
124 OfPage
© 2013 The Nielsen Company. All rights reserved.
Thurs Mar 14, 2013Prepared On:
Pop-Facts: Demographic Snapshot 2013 Report
Radius 1: 11621 TELEGRAPH RD, SANTA FE SPRINGS, CA 90670-3656, aggregate
Radius 2: 11621 TELEGRAPH RD, SANTA FE SPRINGS, CA 90670-3656, aggregate
Radius 3: 11621 TELEGRAPH RD, SANTA FE SPRINGS, CA 90670-3656, aggregate
Radius 3Radius 2
0.00 - 5.00 miles0.00 - 3.00 miles0.00 - 1.00 miles
% % %Radius 1Description
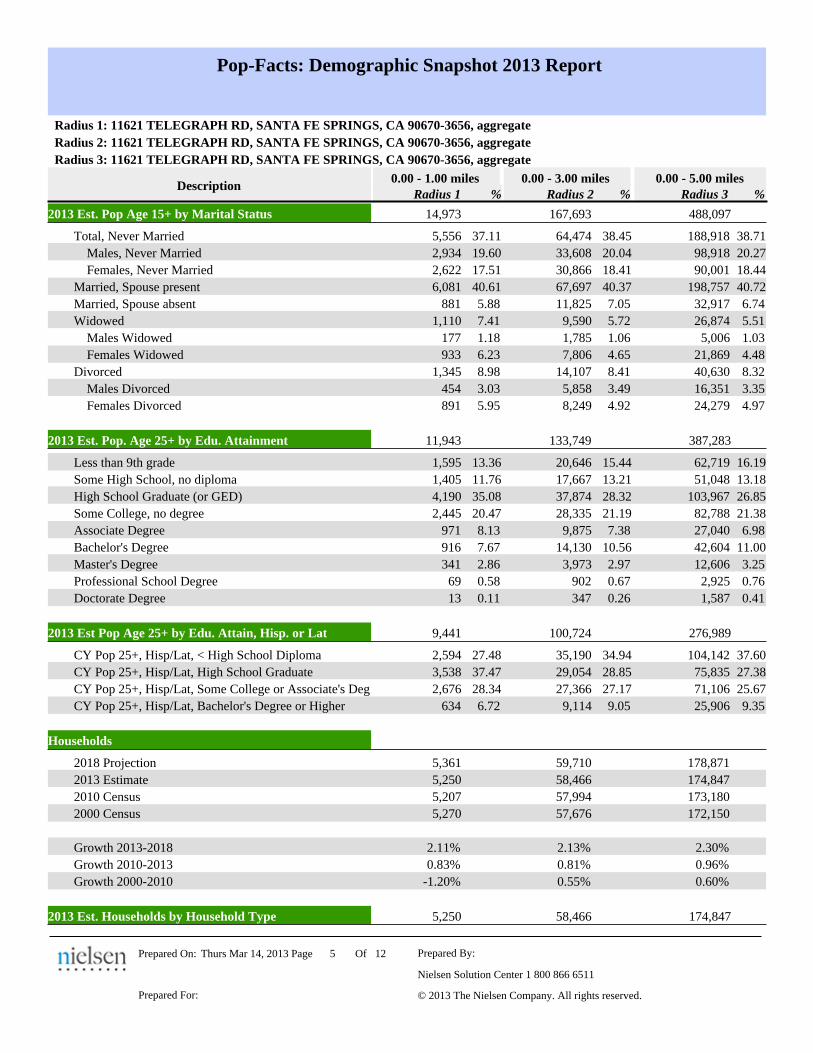
2013 Est. Pop Age 15+ by Marital Status 167,693 488,09714,973
188,918 38.7138.4564,4745,556 Total, Never Married 37.11
98,918 20.2720.0433,6082,934 Males, Never Married 19.60
90,001 18.4418.4130,8662,622 Females, Never Married 17.51
198,757 40.7240.3767,6976,081 Married, Spouse present 40.61
32,917 6.747.0511,825881 Married, Spouse absent 5.88
26,874 5.515.729,5901,110 Widowed 7.41
5,006 1.031.061,785177 Males Widowed 1.18
21,869 4.484.657,806933 Females Widowed 6.23
40,630 8.328.4114,1071,345 Divorced 8.98
16,351 3.353.495,858454 Males Divorced 3.03
24,279 4.974.928,249891 Females Divorced 5.95
2013 Est. Pop. Age 25+ by Edu. Attainment 133,749 387,28311,943
62,719 16.1915.4420,6461,595 Less than 9th grade 13.36
51,048 13.1813.2117,6671,405 Some High School, no diploma 11.76
103,967 26.8528.3237,8744,190 High School Graduate (or GED) 35.08
82,788 21.3821.1928,3352,445 Some College, no degree 20.47
27,040 6.987.389,875971 Associate Degree 8.13
42,604 11.0010.5614,130916 Bachelor's Degree 7.67
12,606 3.252.973,973341 Master's Degree 2.86
2,925 0.760.6790269 Professional School Degree 0.58
1,587 0.410.2634713 Doctorate Degree 0.11
2013 Est Pop Age 25+ by Edu. Attain, Hisp. or Lat 100,724 276,9899,441
104,142 37.6034.9435,1902,594 CY Pop 25+, Hisp/Lat, < High School Diploma 27.48
75,835 27.3828.8529,0543,538 CY Pop 25+, Hisp/Lat, High School Graduate 37.47
71,106 25.6727.1727,3662,676 CY Pop 25+, Hisp/Lat, Some College or Associate's Deg 28.34
25,906 9.359.059,114634 CY Pop 25+, Hisp/Lat, Bachelor's Degree or Higher 6.72
Households
178,87159,7105,361 2018 Projection
174,84758,4665,250 2013 Estimate
173,18057,9945,207 2010 Census
172,15057,6765,270 2000 Census
2.30%2.13%2.11% Growth 2013-2018
0.96%0.81%0.83% Growth 2010-2013
0.60%0.55%-1.20% Growth 2000-2010
2013 Est. Households by Household Type 58,466 174,8475,250
Nielsen Solution Center 1 800 866 6511
Prepared By:
Prepared For:
125 OfPage
© 2013 The Nielsen Company. All rights reserved.
Thurs Mar 14, 2013Prepared On:
Pop-Facts: Demographic Snapshot 2013 Report
Radius 1: 11621 TELEGRAPH RD, SANTA FE SPRINGS, CA 90670-3656, aggregate
Radius 2: 11621 TELEGRAPH RD, SANTA FE SPRINGS, CA 90670-3656, aggregate
Radius 3: 11621 TELEGRAPH RD, SANTA FE SPRINGS, CA 90670-3656, aggregate
Radius 3Radius 2
0.00 - 5.00 miles0.00 - 3.00 miles0.00 - 1.00 miles
% % %Radius 1Description
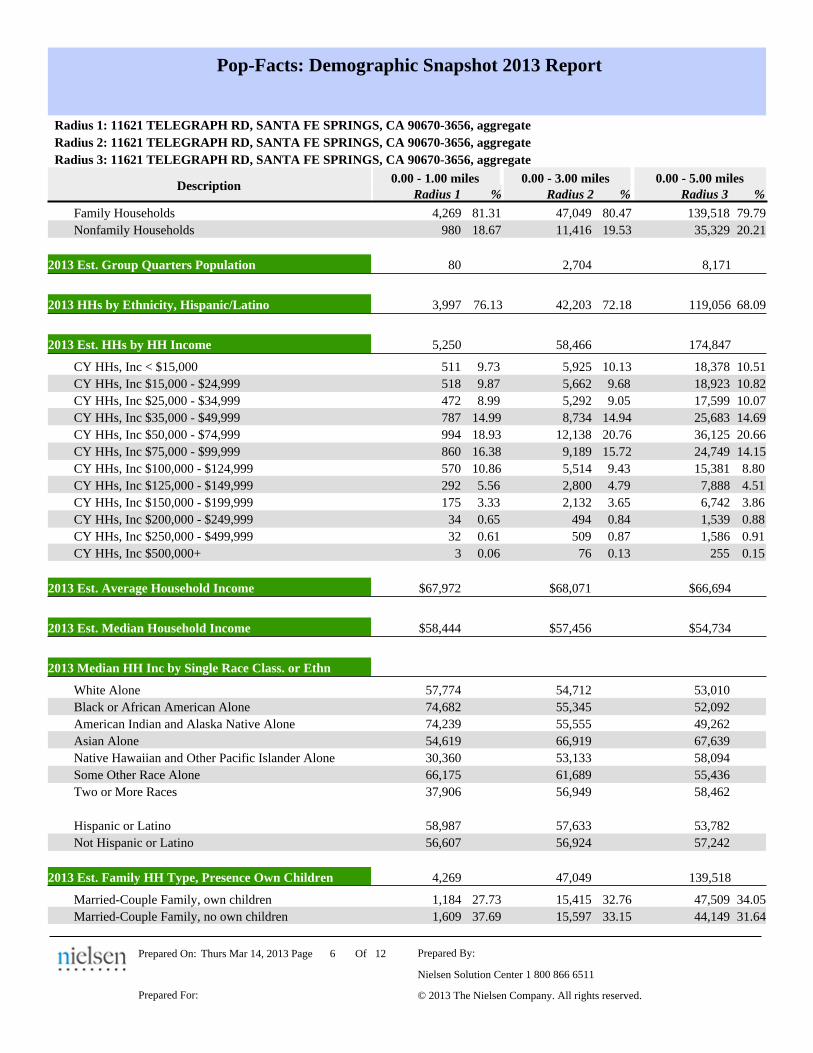
139,518 79.7980.4747,0494,269 Family Households 81.31
35,329 20.2119.5311,416980 Nonfamily Households 18.67
2013 Est. Group Quarters Population 2,704 8,17180
2013 HHs by Ethnicity, Hispanic/Latino 76.13 72.18 68.0942,203 119,0563,997
2013 Est. HHs by HH Income 58,466 174,8475,250
18,378 10.5110.135,925511 CY HHs, Inc < $15,000 9.73
18,923 10.829.685,662518 CY HHs, Inc $15,000 - $24,999 9.87
17,599 10.079.055,292472 CY HHs, Inc $25,000 - $34,999 8.99
25,683 14.6914.948,734787 CY HHs, Inc $35,000 - $49,999 14.99
36,125 20.6620.7612,138994 CY HHs, Inc $50,000 - $74,999 18.93
24,749 14.1515.729,189860 CY HHs, Inc $75,000 - $99,999 16.38
15,381 8.809.435,514570 CY HHs, Inc $100,000 - $124,999 10.86
7,888 4.514.792,800292 CY HHs, Inc $125,000 - $149,999 5.56
6,742 3.863.652,132175 CY HHs, Inc $150,000 - $199,999 3.33
1,539 0.880.8449434 CY HHs, Inc $200,000 - $249,999 0.65
1,586 0.910.8750932 CY HHs, Inc $250,000 - $499,999 0.61
255 0.150.13763 CY HHs, Inc $500,000+ 0.06
2013 Est. Average Household Income $68,071 $66,694$67,972
2013 Est. Median Household Income $57,456 $54,734$58,444
2013 Median HH Inc by Single Race Class. or Ethn
53,01054,71257,774 White Alone
52,09255,34574,682 Black or African American Alone
49,26255,55574,239 American Indian and Alaska Native Alone
67,63966,91954,619 Asian Alone
58,09453,13330,360 Native Hawaiian and Other Pacific Islander Alone
55,43661,68966,175 Some Other Race Alone
58,46256,94937,906 Two or More Races
53,78257,63358,987 Hispanic or Latino
57,24256,92456,607 Not Hispanic or Latino
2013 Est. Family HH Type, Presence Own Children 47,049 139,5184,269
47,509 34.0532.7615,4151,184 Married-Couple Family, own children 27.73
44,149 31.6433.1515,5971,609 Married-Couple Family, no own children 37.69
Nielsen Solution Center 1 800 866 6511
Prepared By:
Prepared For:
126 OfPage
© 2013 The Nielsen Company. All rights reserved.
Thurs Mar 14, 2013Prepared On:
Pop-Facts: Demographic Snapshot 2013 Report
Radius 1: 11621 TELEGRAPH RD, SANTA FE SPRINGS, CA 90670-3656, aggregate
Radius 2: 11621 TELEGRAPH RD, SANTA FE SPRINGS, CA 90670-3656, aggregate
Radius 3: 11621 TELEGRAPH RD, SANTA FE SPRINGS, CA 90670-3656, aggregate
Radius 3Radius 2
0.00 - 5.00 miles0.00 - 3.00 miles0.00 - 1.00 miles
% % %Radius 1Description
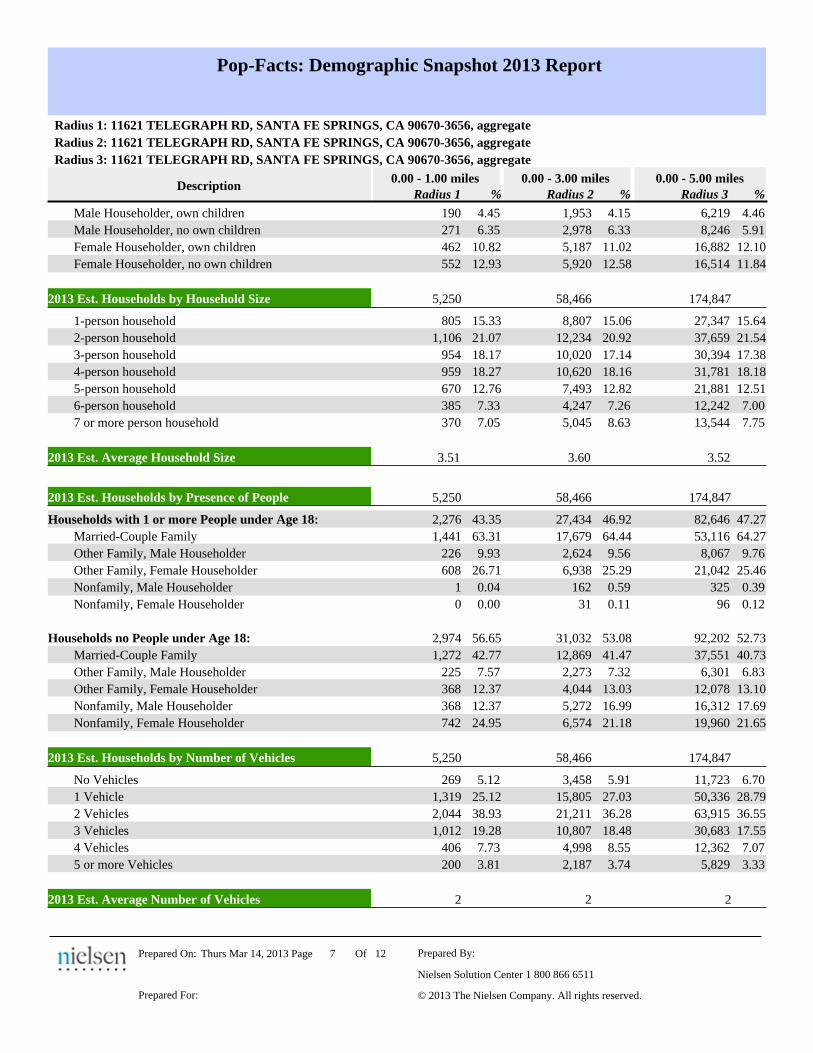
6,219 4.464.151,953190 Male Householder, own children 4.45
8,246 5.916.332,978271 Male Householder, no own children 6.35
16,882 12.1011.025,187462 Female Householder, own children 10.82
16,514 11.8412.585,920552 Female Householder, no own children 12.93
2013 Est. Households by Household Size 58,466 174,8475,250
27,347 15.6415.068,807805 1-person household 15.33
37,659 21.5420.9212,2341,106 2-person household 21.07
30,394 17.3817.1410,020954 3-person household 18.17
31,781 18.1818.1610,620959 4-person household 18.27
21,881 12.5112.827,493670 5-person household 12.76
12,242 7.007.264,247385 6-person household 7.33
13,544 7.758.635,045370 7 or more person household 7.05
2013 Est. Average Household Size 3.60 3.523.51
2013 Est. Households by Presence of People 58,466 174,8475,250
82,646 47.2746.9227,4342,276Households with 1 or more People under Age 18: 43.35
53,116 64.2764.4417,6791,441 Married-Couple Family 63.31
8,067 9.769.562,624226 Other Family, Male Householder 9.93
21,042 25.4625.296,938608 Other Family, Female Householder 26.71
325 0.390.591621 Nonfamily, Male Householder 0.04
96 0.120.11310 Nonfamily, Female Householder 0.00
92,202 52.7353.0831,0322,974Households no People under Age 18: 56.65
37,551 40.7341.4712,8691,272 Married-Couple Family 42.77
6,301 6.837.322,273225 Other Family, Male Householder 7.57
12,078 13.1013.034,044368 Other Family, Female Householder 12.37
16,312 17.6916.995,272368 Nonfamily, Male Householder 12.37
19,960 21.6521.186,574742 Nonfamily, Female Householder 24.95
2013 Est. Households by Number of Vehicles 58,466 174,8475,250
11,723 6.705.913,458269 No Vehicles 5.12
50,336 28.7927.0315,8051,319 1 Vehicle 25.12
63,915 36.5536.2821,2112,044 2 Vehicles 38.93
30,683 17.5518.4810,8071,012 3 Vehicles 19.28
12,362 7.078.554,998406 4 Vehicles 7.73
5,829 3.333.742,187200 5 or more Vehicles 3.81
2013 Est. Average Number of Vehicles 2 22
Nielsen Solution Center 1 800 866 6511
Prepared By:
Prepared For:
127 OfPage
© 2013 The Nielsen Company. All rights reserved.
Thurs Mar 14, 2013Prepared On:
Pop-Facts: Demographic Snapshot 2013 Report
Radius 1: 11621 TELEGRAPH RD, SANTA FE SPRINGS, CA 90670-3656, aggregate
Radius 2: 11621 TELEGRAPH RD, SANTA FE SPRINGS, CA 90670-3656, aggregate
Radius 3: 11621 TELEGRAPH RD, SANTA FE SPRINGS, CA 90670-3656, aggregate
Radius 3Radius 2
0.00 - 5.00 miles0.00 - 3.00 miles0.00 - 1.00 miles
% % %Radius 1Description
Family Households
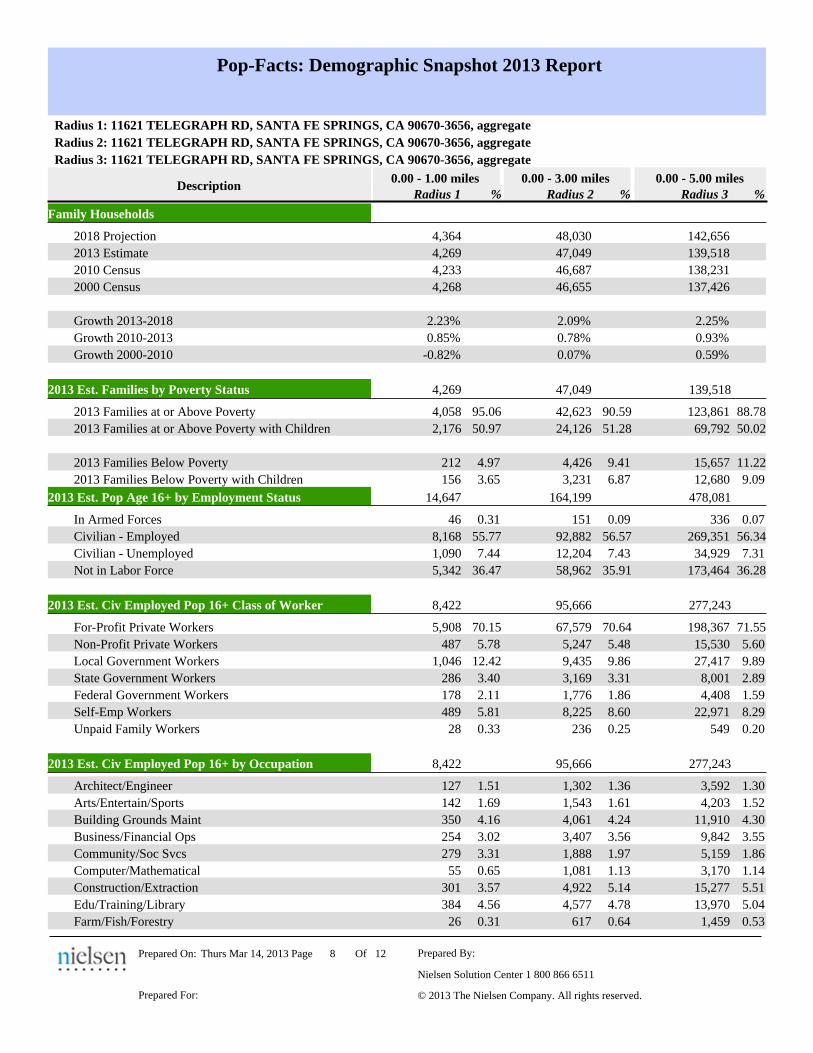
142,65648,0304,364 2018 Projection
139,51847,0494,269 2013 Estimate
138,23146,6874,233 2010 Census
137,42646,6554,268 2000 Census
2.25%2.09%2.23% Growth 2013-2018
0.93%0.78%0.85% Growth 2010-2013
0.59%0.07%-0.82% Growth 2000-2010
2013 Est. Families by Poverty Status 47,049 139,5184,269
123,861 88.7890.5942,6234,058 2013 Families at or Above Poverty 95.06
69,792 50.0251.2824,1262,176 2013 Families at or Above Poverty with Children 50.97
15,657 11.229.414,426212 2013 Families Below Poverty 4.97
12,680 9.096.873,231156 2013 Families Below Poverty with Children 3.65
2013 Est. Pop Age 16+ by Employment Status 164,199 478,08114,647
336 0.070.0915146 In Armed Forces 0.31
269,351 56.3456.5792,8828,168 Civilian - Employed 55.77
34,929 7.317.4312,2041,090 Civilian - Unemployed 7.44
173,464 36.2835.9158,9625,342 Not in Labor Force 36.47
2013 Est. Civ Employed Pop 16+ Class of Worker 95,666 277,2438,422
198,367 71.5570.6467,5795,908 For-Profit Private Workers 70.15
15,530 5.605.485,247487 Non-Profit Private Workers 5.78
27,417 9.899.869,4351,046 Local Government Workers 12.42
8,001 2.893.313,169286 State Government Workers 3.40
4,408 1.591.861,776178 Federal Government Workers 2.11
22,971 8.298.608,225489 Self-Emp Workers 5.81
549 0.200.2523628 Unpaid Family Workers 0.33
2013 Est. Civ Employed Pop 16+ by Occupation 95,666 277,2438,422
3,592 1.301.361,302127 Architect/Engineer 1.51
4,203 1.521.611,543142 Arts/Entertain/Sports 1.69
11,910 4.304.244,061350 Building Grounds Maint 4.16
9,842 3.553.563,407254 Business/Financial Ops 3.02
5,159 1.861.971,888279 Community/Soc Svcs 3.31
3,170 1.141.131,08155 Computer/Mathematical 0.65
15,277 5.515.144,922301 Construction/Extraction 3.57
13,970 5.044.784,577384 Edu/Training/Library 4.56
1,459 0.530.6461726 Farm/Fish/Forestry 0.31
Nielsen Solution Center 1 800 866 6511
Prepared By:
Prepared For:
128 OfPage
© 2013 The Nielsen Company. All rights reserved.
Thurs Mar 14, 2013Prepared On:
Pop-Facts: Demographic Snapshot 2013 Report
Radius 1: 11621 TELEGRAPH RD, SANTA FE SPRINGS, CA 90670-3656, aggregate
Radius 2: 11621 TELEGRAPH RD, SANTA FE SPRINGS, CA 90670-3656, aggregate
Radius 3: 11621 TELEGRAPH RD, SANTA FE SPRINGS, CA 90670-3656, aggregate
Radius 3Radius 2
0.00 - 5.00 miles0.00 - 3.00 miles0.00 - 1.00 miles
% % %Radius 1Description
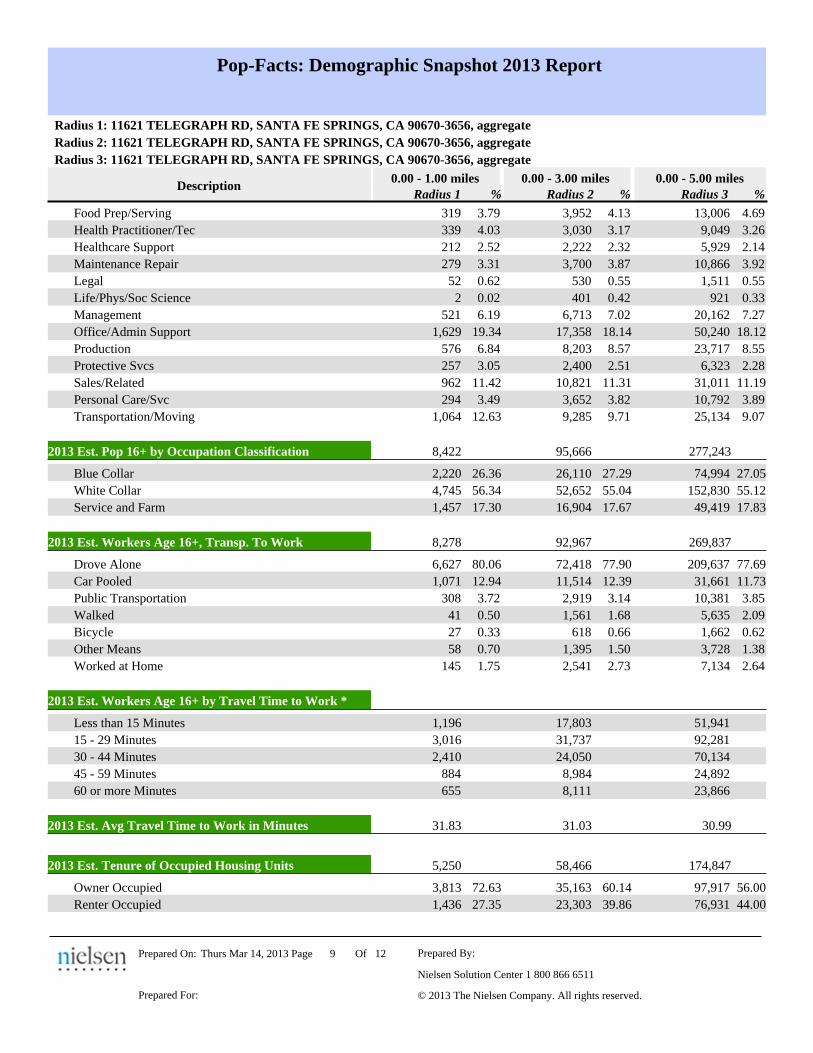
13,006 4.694.133,952319 Food Prep/Serving 3.79
9,049 3.263.173,030339 Health Practitioner/Tec 4.03
5,929 2.142.322,222212 Healthcare Support 2.52
10,866 3.923.873,700279 Maintenance Repair 3.31
1,511 0.550.5553052 Legal 0.62
921 0.330.424012 Life/Phys/Soc Science 0.02
20,162 7.277.026,713521 Management 6.19
50,240 18.1218.1417,3581,629 Office/Admin Support 19.34
23,717 8.558.578,203576 Production 6.84
6,323 2.282.512,400257 Protective Svcs 3.05
31,011 11.1911.3110,821962 Sales/Related 11.42
10,792 3.893.823,652294 Personal Care/Svc 3.49
25,134 9.079.719,2851,064 Transportation/Moving 12.63
2013 Est. Pop 16+ by Occupation Classification 95,666 277,2438,422
74,994 27.0527.2926,1102,220 Blue Collar 26.36
152,830 55.1255.0452,6524,745 White Collar 56.34
49,419 17.8317.6716,9041,457 Service and Farm 17.30
2013 Est. Workers Age 16+, Transp. To Work 92,967 269,8378,278
209,637 77.6977.9072,4186,627 Drove Alone 80.06
31,661 11.7312.3911,5141,071 Car Pooled 12.94
10,381 3.853.142,919308 Public Transportation 3.72
5,635 2.091.681,56141 Walked 0.50
1,662 0.620.6661827 Bicycle 0.33
3,728 1.381.501,39558 Other Means 0.70
7,134 2.642.732,541145 Worked at Home 1.75
2013 Est. Workers Age 16+ by Travel Time to Work *
51,94117,8031,196 Less than 15 Minutes
92,28131,7373,016 15 - 29 Minutes
70,13424,0502,410 30 - 44 Minutes
24,8928,984884 45 - 59 Minutes
23,8668,111655 60 or more Minutes
2013 Est. Avg Travel Time to Work in Minutes 31.03 30.9931.83
2013 Est. Tenure of Occupied Housing Units 58,466 174,8475,250
97,917 56.0060.1435,1633,813 Owner Occupied 72.63
76,931 44.0039.8623,3031,436 Renter Occupied 27.35
Nielsen Solution Center 1 800 866 6511
Prepared By:
Prepared For:
129 OfPage
© 2013 The Nielsen Company. All rights reserved.
Thurs Mar 14, 2013Prepared On:
Pop-Facts: Demographic Snapshot 2013 Report
Radius 1: 11621 TELEGRAPH RD, SANTA FE SPRINGS, CA 90670-3656, aggregate
Radius 2: 11621 TELEGRAPH RD, SANTA FE SPRINGS, CA 90670-3656, aggregate
Radius 3: 11621 TELEGRAPH RD, SANTA FE SPRINGS, CA 90670-3656, aggregate
Radius 3Radius 2
0.00 - 5.00 miles0.00 - 3.00 miles0.00 - 1.00 miles
% % %Radius 1Description
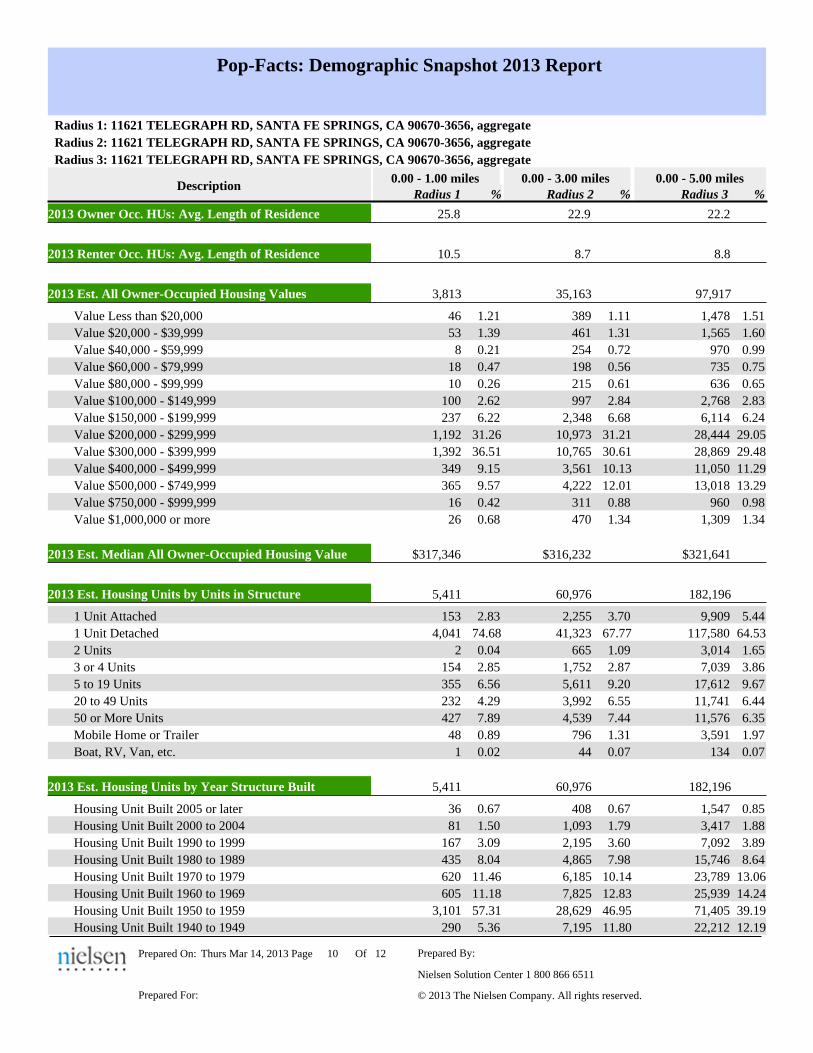
2013 Owner Occ. HUs: Avg. Length of Residence 22.9 22.225.8
2013 Renter Occ. HUs: Avg. Length of Residence 8.7 8.810.5
2013 Est. All Owner-Occupied Housing Values 35,163 97,9173,813
1,478 1.511.1138946 Value Less than $20,000 1.21
1,565 1.601.3146153 Value $20,000 - $39,999 1.39
970 0.990.722548 Value $40,000 - $59,999 0.21
735 0.750.5619818 Value $60,000 - $79,999 0.47
636 0.650.6121510 Value $80,000 - $99,999 0.26
2,768 2.832.84997100 Value $100,000 - $149,999 2.62
6,114 6.246.682,348237 Value $150,000 - $199,999 6.22
28,444 29.0531.2110,9731,192 Value $200,000 - $299,999 31.26
28,869 29.4830.6110,7651,392 Value $300,000 - $399,999 36.51
11,050 11.2910.133,561349 Value $400,000 - $499,999 9.15
13,018 13.2912.014,222365 Value $500,000 - $749,999 9.57
960 0.980.8831116 Value $750,000 - $999,999 0.42
1,309 1.341.3447026 Value $1,000,000 or more 0.68
2013 Est. Median All Owner-Occupied Housing Value $316,232 $321,641$317,346
2013 Est. Housing Units by Units in Structure 60,976 182,1965,411
9,909 5.443.702,255153 1 Unit Attached 2.83
117,580 64.5367.7741,3234,041 1 Unit Detached 74.68
3,014 1.651.096652 2 Units 0.04
7,039 3.862.871,752154 3 or 4 Units 2.85
17,612 9.679.205,611355 5 to 19 Units 6.56
11,741 6.446.553,992232 20 to 49 Units 4.29
11,576 6.357.444,539427 50 or More Units 7.89
3,591 1.971.3179648 Mobile Home or Trailer 0.89
134 0.070.07441 Boat, RV, Van, etc. 0.02
2013 Est. Housing Units by Year Structure Built 60,976 182,1965,411
1,547 0.850.6740836 Housing Unit Built 2005 or later 0.67
3,417 1.881.791,09381 Housing Unit Built 2000 to 2004 1.50
7,092 3.893.602,195167 Housing Unit Built 1990 to 1999 3.09
15,746 8.647.984,865435 Housing Unit Built 1980 to 1989 8.04
23,789 13.0610.146,185620 Housing Unit Built 1970 to 1979 11.46
25,939 14.2412.837,825605 Housing Unit Built 1960 to 1969 11.18
71,405 39.1946.9528,6293,101 Housing Unit Built 1950 to 1959 57.31
22,212 12.1911.807,195290 Housing Unit Built 1940 to 1949 5.36
Nielsen Solution Center 1 800 866 6511
Prepared By:
Prepared For:
1210 OfPage
© 2013 The Nielsen Company. All rights reserved.
Thurs Mar 14, 2013Prepared On:
Pop-Facts: Demographic Snapshot 2013 Report
Radius 1: 11621 TELEGRAPH RD, SANTA FE SPRINGS, CA 90670-3656, aggregate
Radius 2: 11621 TELEGRAPH RD, SANTA FE SPRINGS, CA 90670-3656, aggregate
Radius 3: 11621 TELEGRAPH RD, SANTA FE SPRINGS, CA 90670-3656, aggregate
Radius 3Radius 2
0.00 - 5.00 miles0.00 - 3.00 miles0.00 - 1.00 miles
% % %Radius 1Description
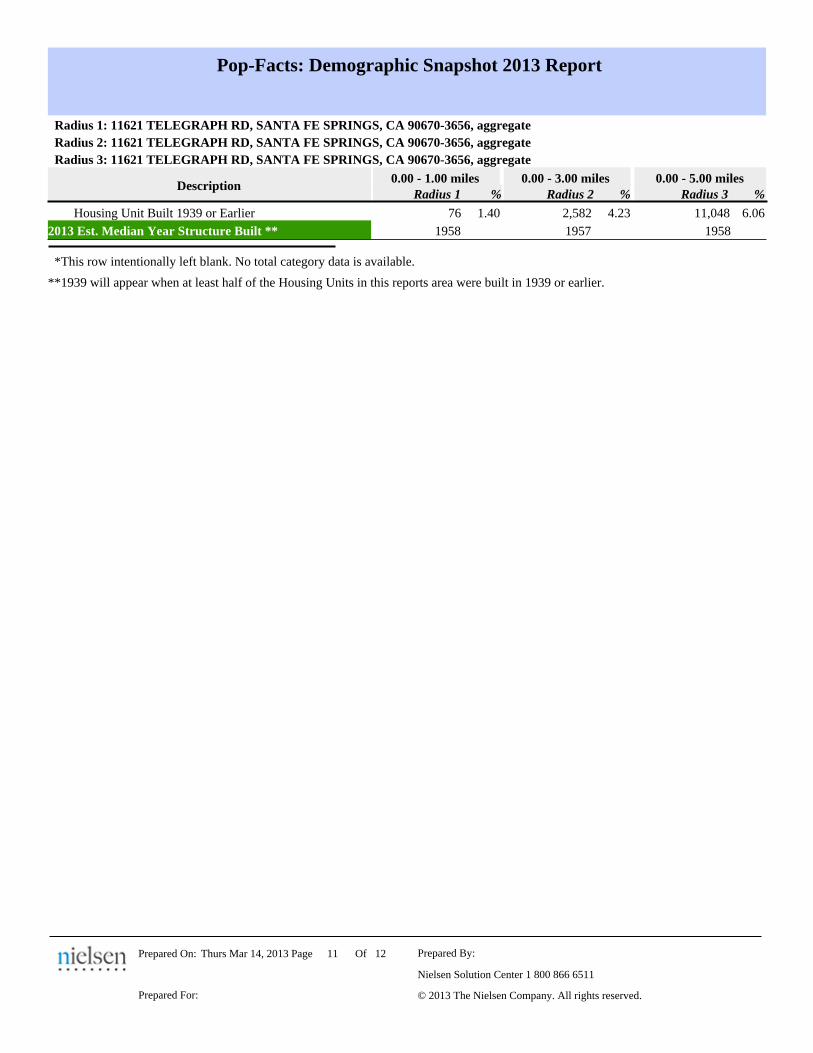
11,048 6.064.232,58276 Housing Unit Built 1939 or Earlier 1.40
2013 Est. Median Year Structure Built ** 1957 19581958
*This row intentionally left blank. No total category data is available.
**1939 will appear when at least half of the Housing Units in this reports area were built in 1939 or earlier.
Nielsen Solution Center 1 800 866 6511
Prepared By:
Prepared For:
1211 OfPage
© 2013 The Nielsen Company. All rights reserved.
Thurs Mar 14, 2013Prepared On:
Pop-Facts: Demographic Snapshot 2013 Report
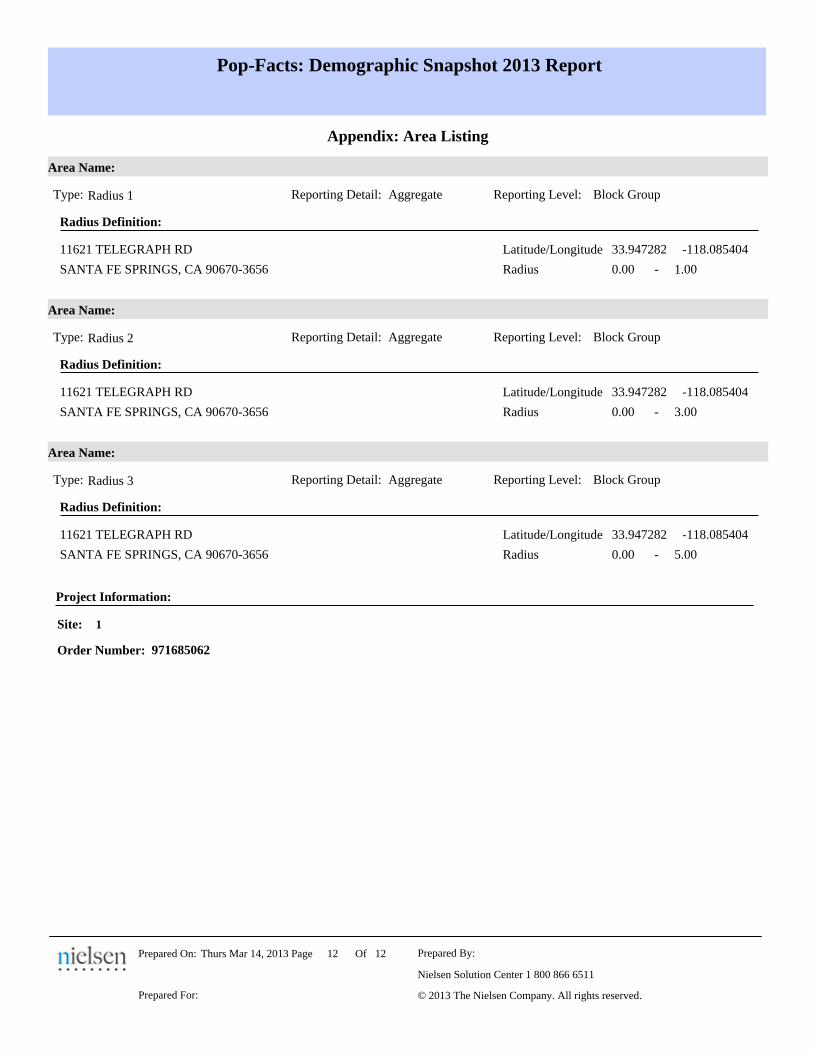
Appendix: Area Listing
Radius Definition:
Block GroupType: Radius 1 Reporting Detail: Aggregate Reporting Level:
Area Name:
SANTA FE SPRINGS, CA 90670-3656 -Radius
Latitude/Longitude11621 TELEGRAPH RD
0.00 1.00
-118.08540433.947282
Radius Definition:
Block GroupType: Radius 2 Reporting Detail: Aggregate Reporting Level:
Area Name:
SANTA FE SPRINGS, CA 90670-3656 -Radius
Latitude/Longitude11621 TELEGRAPH RD
0.00 3.00
-118.08540433.947282
Radius Definition:
Block GroupType: Radius 3 Reporting Detail: Aggregate Reporting Level:
Area Name:
SANTA FE SPRINGS, CA 90670-3656 -Radius
Latitude/Longitude11621 TELEGRAPH RD
0.00 5.00
-118.08540433.947282
1
971685062
Project Information:
Order Number:
Site:
Nielsen Solution Center 1 800 866 6511
Prepared By:
Prepared For:
1212 OfPage
© 2013 The Nielsen Company. All rights reserved.
Thurs Mar 14, 2013Prepared On:

Executive Summary 2013
Radius 1: 11621 TELEGRAPH RD, SANTA FE SPRINGS, CA 90670-3656, 0.00 - 1.00 Miles, Total
The population in this area is estimated to change from 18,353 to 18,513, resulting in a growth of 0.9% between
2010 and the current year. Over the next five years, the population is projected to grow by 2.1%.
The population in the United States is estimated to change from 308,745,538 to 314,861,807, resulting in a growth
of 2.0% between 2010 and the current year. Over the next five years, the population is projected to grow by 3.3%.
The current year median age for this area is 36.3, while the average age is 37.5. Five years from now, the median age
is projected to be 37.2.
The current year median age for the United States is 37.5, while the average age is 38.3. Five years from now, the
median age is projected to be 38.3.
Of this area's current year estimated population:
61.0% are White Alone, 1.7% are Black or African Am. Alone, 1.5% are Am. Indian and Alaska Nat. Alone, 4.2%
are Asian Alone, 0.2% are Nat. Hawaiian and Other Pacific Isl. Alone, 27.4% are Some Other Race, and 4.1% are
Two or More Races.
Of the United States's current year estimated population:
71.5% are White Alone, 12.7% are Black or African Am. Alone, 1.0% are Am. Indian and Alaska Nat. Alone, 5.0%
are Asian Alone, 0.2% are Nat. Hawaiian and Other Pacific Isl. Alone, 6.6% are Some Other Race, and 3.1% are
Two or More Races.
This area's current estimated Hispanic or Latino population is 82.5%, while the United States current estimated
Hispanic or Latino population is 17.3%.
The number of households in this area is estimated to change from 5,207 to 5,250, resulting in an increase of 0.8%
between 2010 and the current year. Over the next five years, the number of households is projected to increase by
2.1%.
The number of households in the United States is estimated to change from 116,716,292 to 119,206,509, resulting in
an increase of 2.1% between 2010 and the current year. Over the next five years, the number of households is
projected to increase by 3.5%.
The average household income is estimated to be $67,972 for the current year, while the average household income
for the United States is estimated to be $69,637 for the same time frame.
The average household income in this area is projected to change over the next five years, from $67,972 to $68,779.
The average household income in the United States is projected to change over the next five years, from $69,637 to
$71,917.
© 2013 The Nielsen Company. All rights reserved.Prepared For:
Nielsen Solution Center 1 800 866 6511
Prepared By: 10OfPage 1Thurs Mar 14, 2013Prepared On:
Executive Summary 2013
Radius 1: 11621 TELEGRAPH RD, SANTA FE SPRINGS, CA 90670-3656, 0.00 - 1.00 Miles, Total
For this area, 88.2% of the labor force is estimated to be employed for the current year.
The employment status of the population age 16 and over is as follows:
0.3% are in the Armed Forces, 55.8% are employed civilians, 7.4% are unemployed civilians, and 36.5% are not in
the labor force.
For the United States, 90.1% of the labor force is estimated to be employed for the current year.
The employment status of the population age 16 and over is as follows:
0.5% are in the Armed Forces, 57.9% are employed civilians, 6.4% are unemployed civilians, and 35.3% are not in
the labor force.
The occupational classifications for this area are as follows:
26.4% hold blue collar occupations, 56.3% hold white collar occupations, and 17.3% are occupied as service & farm
workers.
The occupational classifications for the United States are as follows:
20.6% hold blue collar occupations, 60.8% hold white collar occupations, and 18.6% are occupied as service & farm
workers.
For the civilian employed population age 16 and over in this area, it is estimated that they are employed in the
following occupational categories:
1.5% are in Architecture and Engineering, 1.7% are in Arts, Entertainment and Sports, 3.0% are in Business and
Financial Operations, 0.7% are in Computers and Mathematics, 4.6% are in Education, Training and Libraries, 4.0%
are in Healthcare Practioners and Technicians, 2.5% are in Healthcare Support, 0.0% are in Life, Physical and Social
Sciences, 6.2% are in Management, 19.3% are in Office and Administrative Support.
3.3% are in Community and Social Services, 3.8% are in Food Preparation and Serving, 0.6% are in Legal Services,
3.0% are in Protective Services, 11.4% are in Sales and Related Services, 3.5% are in Personal Care Services.
4.2% are in Building and Grounds Maintenance, 3.6% are in Construction and Extraction, 0.3% are in Farming,
Fishing and Forestry, 3.3% are in Maintenance and Repair, 6.8% are in Production, 12.6% are in Transportation and
Moving.
For the civilian employed population age 16 and over in the United States, it is estimated that they are employed in
the following occupational categories:
1.8% are in Architecture and Engineering, 1.9% are in Arts, Entertainment and Sports, 4.7% are in Business and
Financial Operations, 2.5% are in Computers and Mathematics, 6.1% are in Education, Training and Libraries, 5.4%
are in Healthcare Practioners and Technicians, 2.5% are in Healthcare Support, 0.9% are in Life, Physical and Social
Sciences, 9.7% are in Management, 14.0% are in Office and Administrative Support.
1.7% are in Community and Social Services, 5.6% are in Food Preparation and Serving, 1.2% are in Legal Services,
2.2% are in Protective Services, 11.1% are in Sales and Related Services, 3.5% are in Personal Care Services.
4.0% are in Building and Grounds Maintenance, 5.3% are in Construction and Extraction, 0.7% are in Farming,
Fishing and Forestry, 3.3% are in Maintenance and Repair, 6.0% are in Production, 6.0% are in Transportation and
Moving.
© 2013 The Nielsen Company. All rights reserved.Prepared For:
Nielsen Solution Center 1 800 866 6511
Prepared By: 10OfPage 2Thurs Mar 14, 2013Prepared On:
Executive Summary 2013
Radius 1: 11621 TELEGRAPH RD, SANTA FE SPRINGS, CA 90670-3656, 0.00 - 1.00 Miles, Total
Currently, it is estimated that 2.9% of the population age 25 and over in this area had earned a Master's Degree,
0.6% had earned a Professional School Degree, 0.1% had earned a Doctorate Degree and 7.7% had earned a
Bachelor's Degree.
In comparison, for the United States, it is estimated that for the population over age 25, 7.3% had earned a
Master'sDegree, 1.9% had earned a Professional School Degree, 1.2% had earned a Doctorate Degree and 17.7%
had earned a Bachelor's Degree.
Most of the dwellings in this area (72.6%) are estimated to be Owner-Occupied for the current year. For the entire
country the majority of the housing units are Owner-Occupied (65.0%).
The majority of dwellings in this area (74.7%) are estimated to be structures of 1 Unit Detached for the current year.
The majority of dwellings in the United States (61.5%) are estimated to be structures of 1 Unit Detached for the
same year.
The majority of housing units in this area (57.3%) are estimated to have been Housing Unit Built 1950 to 1959 for
the current year.
The majority of housing units in the United States (16.1%) are estimated to have been Housing Unit Built 1970 to
1979 for the current year.
© 2013 The Nielsen Company. All rights reserved.Prepared For:
Nielsen Solution Center 1 800 866 6511
Prepared By: 10OfPage 3Thurs Mar 14, 2013Prepared On:
Executive Summary 2013
Radius 2: 11621 TELEGRAPH RD, SANTA FE SPRINGS, CA 90670-3656, 0.00 - 3.00 Miles, Total
The population in this area is estimated to change from 211,292 to 213,334, resulting in a growth of 1.0% between
2010 and the current year. Over the next five years, the population is projected to grow by 2.2%.
The population in the United States is estimated to change from 308,745,538 to 314,861,807, resulting in a growth
of 2.0% between 2010 and the current year. Over the next five years, the population is projected to grow by 3.3%.
The current year median age for this area is 33.9, while the average age is 35.6. Five years from now, the median age
is projected to be 35.2.
The current year median age for the United States is 37.5, while the average age is 38.3. Five years from now, the
median age is projected to be 38.3.
Of this area's current year estimated population:
56.8% are White Alone, 2.8% are Black or African Am. Alone, 1.2% are Am. Indian and Alaska Nat. Alone, 5.7%
are Asian Alone, 0.2% are Nat. Hawaiian and Other Pacific Isl. Alone, 29.4% are Some Other Race, and 3.9% are
Two or More Races.
Of the United States's current year estimated population:
71.5% are White Alone, 12.7% are Black or African Am. Alone, 1.0% are Am. Indian and Alaska Nat. Alone, 5.0%
are Asian Alone, 0.2% are Nat. Hawaiian and Other Pacific Isl. Alone, 6.6% are Some Other Race, and 3.1% are
Two or More Races.
This area's current estimated Hispanic or Latino population is 80.0%, while the United States current estimated
Hispanic or Latino population is 17.3%.
The number of households in this area is estimated to change from 57,994 to 58,466, resulting in an increase of 0.8%
between 2010 and the current year. Over the next five years, the number of households is projected to increase by
2.1%.
The number of households in the United States is estimated to change from 116,716,292 to 119,206,509, resulting in
an increase of 2.1% between 2010 and the current year. Over the next five years, the number of households is
projected to increase by 3.5%.
The average household income is estimated to be $68,071 for the current year, while the average household income
for the United States is estimated to be $69,637 for the same time frame.
The average household income in this area is projected to change over the next five years, from $68,071 to $68,898.
The average household income in the United States is projected to change over the next five years, from $69,637 to
$71,917.
© 2013 The Nielsen Company. All rights reserved.Prepared For:
Nielsen Solution Center 1 800 866 6511
Prepared By: 10OfPage 4Thurs Mar 14, 2013Prepared On:

Executive Summary 2013
Radius 2: 11621 TELEGRAPH RD, SANTA FE SPRINGS, CA 90670-3656, 0.00 - 3.00 Miles, Total
For this area, 88.4% of the labor force is estimated to be employed for the current year.
The employment status of the population age 16 and over is as follows:
0.1% are in the Armed Forces, 56.6% are employed civilians, 7.4% are unemployed civilians, and 35.9% are not in
the labor force.
For the United States, 90.1% of the labor force is estimated to be employed for the current year.
The employment status of the population age 16 and over is as follows:
0.5% are in the Armed Forces, 57.9% are employed civilians, 6.4% are unemployed civilians, and 35.3% are not in
the labor force.
The occupational classifications for this area are as follows:
27.3% hold blue collar occupations, 55.0% hold white collar occupations, and 17.7% are occupied as service & farm
workers.
The occupational classifications for the United States are as follows:
20.6% hold blue collar occupations, 60.8% hold white collar occupations, and 18.6% are occupied as service & farm
workers.
For the civilian employed population age 16 and over in this area, it is estimated that they are employed in the
following occupational categories:
1.4% are in Architecture and Engineering, 1.6% are in Arts, Entertainment and Sports, 3.6% are in Business and
Financial Operations, 1.1% are in Computers and Mathematics, 4.8% are in Education, Training and Libraries, 3.2%
are in Healthcare Practioners and Technicians, 2.3% are in Healthcare Support, 0.4% are in Life, Physical and Social
Sciences, 7.0% are in Management, 18.1% are in Office and Administrative Support.
2.0% are in Community and Social Services, 4.1% are in Food Preparation and Serving, 0.6% are in Legal Services,
2.5% are in Protective Services, 11.3% are in Sales and Related Services, 3.8% are in Personal Care Services.
4.2% are in Building and Grounds Maintenance, 5.1% are in Construction and Extraction, 0.6% are in Farming,
Fishing and Forestry, 3.9% are in Maintenance and Repair, 8.6% are in Production, 9.7% are in Transportation and
Moving.
For the civilian employed population age 16 and over in the United States, it is estimated that they are employed in
the following occupational categories:
1.8% are in Architecture and Engineering, 1.9% are in Arts, Entertainment and Sports, 4.7% are in Business and
Financial Operations, 2.5% are in Computers and Mathematics, 6.1% are in Education, Training and Libraries, 5.4%
are in Healthcare Practioners and Technicians, 2.5% are in Healthcare Support, 0.9% are in Life, Physical and Social
Sciences, 9.7% are in Management, 14.0% are in Office and Administrative Support.
1.7% are in Community and Social Services, 5.6% are in Food Preparation and Serving, 1.2% are in Legal Services,
2.2% are in Protective Services, 11.1% are in Sales and Related Services, 3.5% are in Personal Care Services.
4.0% are in Building and Grounds Maintenance, 5.3% are in Construction and Extraction, 0.7% are in Farming,
Fishing and Forestry, 3.3% are in Maintenance and Repair, 6.0% are in Production, 6.0% are in Transportation and
Moving.
© 2013 The Nielsen Company. All rights reserved.Prepared For:
Nielsen Solution Center 1 800 866 6511
Prepared By: 10OfPage 5Thurs Mar 14, 2013Prepared On:
Executive Summary 2013
Radius 2: 11621 TELEGRAPH RD, SANTA FE SPRINGS, CA 90670-3656, 0.00 - 3.00 Miles, Total
Currently, it is estimated that 3.0% of the population age 25 and over in this area had earned a Master's Degree,
0.7% had earned a Professional School Degree, 0.3% had earned a Doctorate Degree and 10.6% had earned a
Bachelor's Degree.
In comparison, for the United States, it is estimated that for the population over age 25, 7.3% had earned a
Master'sDegree, 1.9% had earned a Professional School Degree, 1.2% had earned a Doctorate Degree and 17.7%
had earned a Bachelor's Degree.
Most of the dwellings in this area (60.1%) are estimated to be Owner-Occupied for the current year. For the entire
country the majority of the housing units are Owner-Occupied (65.0%).
The majority of dwellings in this area (67.8%) are estimated to be structures of 1 Unit Detached for the current year.
The majority of dwellings in the United States (61.5%) are estimated to be structures of 1 Unit Detached for the
same year.
The majority of housing units in this area (47.0%) are estimated to have been Housing Unit Built 1950 to 1959 for
the current year.
The majority of housing units in the United States (16.1%) are estimated to have been Housing Unit Built 1970 to
1979 for the current year.
© 2013 The Nielsen Company. All rights reserved.Prepared For:
Nielsen Solution Center 1 800 866 6511
Prepared By: 10OfPage 6Thurs Mar 14, 2013Prepared On:
Executive Summary 2013
Radius 3: 11621 TELEGRAPH RD, SANTA FE SPRINGS, CA 90670-3656, 0.00 - 5.00 Miles, Total
The population in this area is estimated to change from 617,923 to 623,938, resulting in a growth of 1.0% between
2010 and the current year. Over the next five years, the population is projected to grow by 2.3%.
The population in the United States is estimated to change from 308,745,538 to 314,861,807, resulting in a growth
of 2.0% between 2010 and the current year. Over the next five years, the population is projected to grow by 3.3%.
The current year median age for this area is 33.5, while the average age is 35.3. Five years from now, the median age
is projected to be 34.8.
The current year median age for the United States is 37.5, while the average age is 38.3. Five years from now, the
median age is projected to be 38.3.
Of this area's current year estimated population:
54.7% are White Alone, 3.3% are Black or African Am. Alone, 1.1% are Am. Indian and Alaska Nat. Alone, 6.7%
are Asian Alone, 0.2% are Nat. Hawaiian and Other Pacific Isl. Alone, 30.0% are Some Other Race, and 4.0% are
Two or More Races.
Of the United States's current year estimated population:
71.5% are White Alone, 12.7% are Black or African Am. Alone, 1.0% are Am. Indian and Alaska Nat. Alone, 5.0%
are Asian Alone, 0.2% are Nat. Hawaiian and Other Pacific Isl. Alone, 6.6% are Some Other Race, and 3.1% are
Two or More Races.
This area's current estimated Hispanic or Latino population is 76.4%, while the United States current estimated
Hispanic or Latino population is 17.3%.
The number of households in this area is estimated to change from 173,180 to 174,847, resulting in an increase of
1.0% between 2010 and the current year. Over the next five years, the number of households is projected to increase
by 2.3%.
The number of households in the United States is estimated to change from 116,716,292 to 119,206,509, resulting in
an increase of 2.1% between 2010 and the current year. Over the next five years, the number of households is
projected to increase by 3.5%.
The average household income is estimated to be $66,694 for the current year, while the average household income
for the United States is estimated to be $69,637 for the same time frame.
The average household income in this area is projected to change over the next five years, from $66,694 to $67,489.
The average household income in the United States is projected to change over the next five years, from $69,637 to
$71,917.
© 2013 The Nielsen Company. All rights reserved.Prepared For:
Nielsen Solution Center 1 800 866 6511
Prepared By: 10OfPage 7Thurs Mar 14, 2013Prepared On:

Executive Summary 2013
Radius 3: 11621 TELEGRAPH RD, SANTA FE SPRINGS, CA 90670-3656, 0.00 - 5.00 Miles, Total
For this area, 88.5% of the labor force is estimated to be employed for the current year.
The employment status of the population age 16 and over is as follows:
0.1% are in the Armed Forces, 56.3% are employed civilians, 7.3% are unemployed civilians, and 36.3% are not in
the labor force.
For the United States, 90.1% of the labor force is estimated to be employed for the current year.
The employment status of the population age 16 and over is as follows:
0.5% are in the Armed Forces, 57.9% are employed civilians, 6.4% are unemployed civilians, and 35.3% are not in
the labor force.
The occupational classifications for this area are as follows:
27.0% hold blue collar occupations, 55.1% hold white collar occupations, and 17.8% are occupied as service & farm
workers.
The occupational classifications for the United States are as follows:
20.6% hold blue collar occupations, 60.8% hold white collar occupations, and 18.6% are occupied as service & farm
workers.
For the civilian employed population age 16 and over in this area, it is estimated that they are employed in the
following occupational categories:
1.3% are in Architecture and Engineering, 1.5% are in Arts, Entertainment and Sports, 3.5% are in Business and
Financial Operations, 1.1% are in Computers and Mathematics, 5.0% are in Education, Training and Libraries, 3.3%
are in Healthcare Practioners and Technicians, 2.1% are in Healthcare Support, 0.3% are in Life, Physical and Social
Sciences, 7.3% are in Management, 18.1% are in Office and Administrative Support.
1.9% are in Community and Social Services, 4.7% are in Food Preparation and Serving, 0.5% are in Legal Services,
2.3% are in Protective Services, 11.2% are in Sales and Related Services, 3.9% are in Personal Care Services.
4.3% are in Building and Grounds Maintenance, 5.5% are in Construction and Extraction, 0.5% are in Farming,
Fishing and Forestry, 3.9% are in Maintenance and Repair, 8.6% are in Production, 9.1% are in Transportation and
Moving.
For the civilian employed population age 16 and over in the United States, it is estimated that they are employed in
the following occupational categories:
1.8% are in Architecture and Engineering, 1.9% are in Arts, Entertainment and Sports, 4.7% are in Business and
Financial Operations, 2.5% are in Computers and Mathematics, 6.1% are in Education, Training and Libraries, 5.4%
are in Healthcare Practioners and Technicians, 2.5% are in Healthcare Support, 0.9% are in Life, Physical and Social
Sciences, 9.7% are in Management, 14.0% are in Office and Administrative Support.
1.7% are in Community and Social Services, 5.6% are in Food Preparation and Serving, 1.2% are in Legal Services,
2.2% are in Protective Services, 11.1% are in Sales and Related Services, 3.5% are in Personal Care Services.
4.0% are in Building and Grounds Maintenance, 5.3% are in Construction and Extraction, 0.7% are in Farming,
Fishing and Forestry, 3.3% are in Maintenance and Repair, 6.0% are in Production, 6.0% are in Transportation and
Moving.
© 2013 The Nielsen Company. All rights reserved.Prepared For:
Nielsen Solution Center 1 800 866 6511
Prepared By: 10OfPage 8Thurs Mar 14, 2013Prepared On:

Executive Summary 2013
Radius 3: 11621 TELEGRAPH RD, SANTA FE SPRINGS, CA 90670-3656, 0.00 - 5.00 Miles, Total
Currently, it is estimated that 3.3% of the population age 25 and over in this area had earned a Master's Degree,
0.8% had earned a Professional School Degree, 0.4% had earned a Doctorate Degree and 11.0% had earned a
Bachelor's Degree.
In comparison, for the United States, it is estimated that for the population over age 25, 7.3% had earned a
Master'sDegree, 1.9% had earned a Professional School Degree, 1.2% had earned a Doctorate Degree and 17.7%
had earned a Bachelor's Degree.
Most of the dwellings in this area (56.0%) are estimated to be Owner-Occupied for the current year. For the entire
country the majority of the housing units are Owner-Occupied (65.0%).
The majority of dwellings in this area (64.5%) are estimated to be structures of 1 Unit Detached for the current year.
The majority of dwellings in the United States (61.5%) are estimated to be structures of 1 Unit Detached for the
same year.
The majority of housing units in this area (39.2%) are estimated to have been Housing Unit Built 1950 to 1959 for
the current year.
The majority of housing units in the United States (16.1%) are estimated to have been Housing Unit Built 1970 to
1979 for the current year.
© 2013 The Nielsen Company. All rights reserved.Prepared For:
Nielsen Solution Center 1 800 866 6511
Prepared By: 10OfPage 9Thurs Mar 14, 2013Prepared On:
Executive Summary 2013
Radius 3: 11621 TELEGRAPH RD, SANTA FE SPRINGS, CA 90670-3656, 0.00 - 5.00 Miles, Total
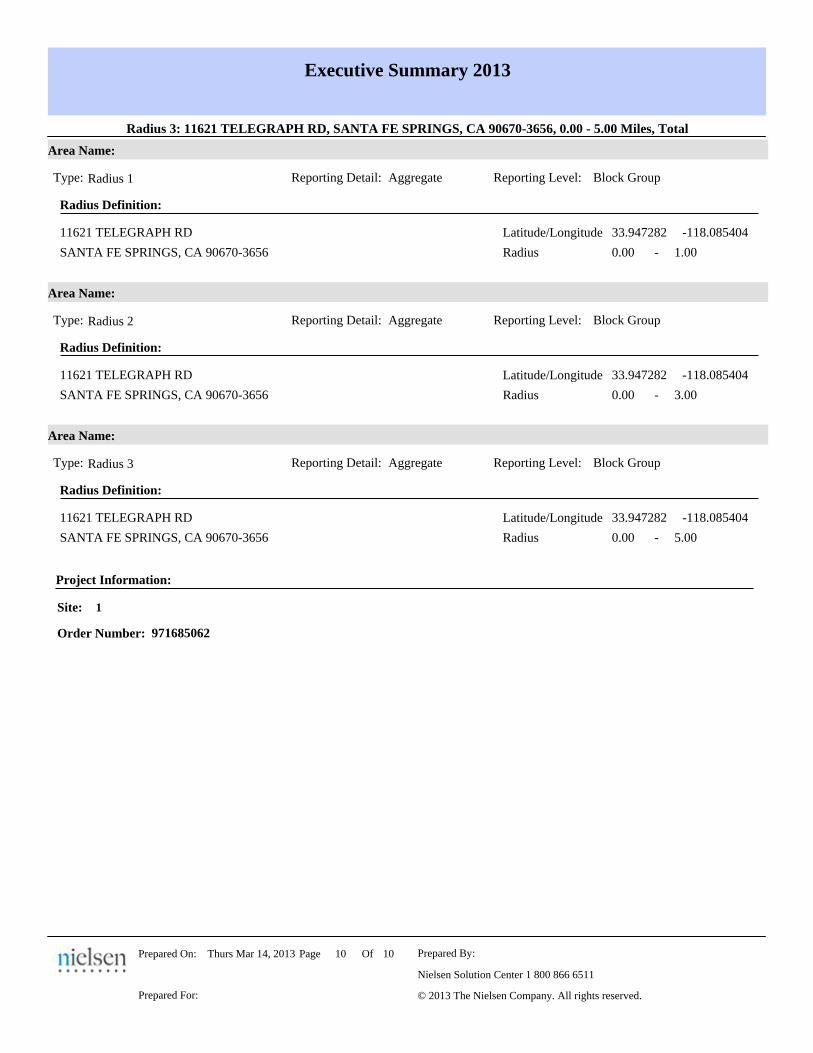
Radius Definition:
Block GroupType: Radius 1 Reporting Detail: Aggregate Reporting Level:
Area Name:
SANTA FE SPRINGS, CA 90670-3656 -Radius
Latitude/Longitude11621 TELEGRAPH RD
0.00 1.00
-118.08540433.947282
Radius Definition:
Block GroupType: Radius 2 Reporting Detail: Aggregate Reporting Level:
Area Name:
SANTA FE SPRINGS, CA 90670-3656 -Radius
Latitude/Longitude11621 TELEGRAPH RD
0.00 3.00
-118.08540433.947282
Radius Definition:
Block GroupType: Radius 3 Reporting Detail: Aggregate Reporting Level:
Area Name:
SANTA FE SPRINGS, CA 90670-3656 -Radius
Latitude/Longitude11621 TELEGRAPH RD
0.00 5.00
-118.08540433.947282
1
971685062
Project Information:
Order Number:
Site:
© 2013 The Nielsen Company. All rights reserved.Prepared For:
Nielsen Solution Center 1 800 866 6511
Prepared By: 10OfPage 10Thurs Mar 14, 2013Prepared On: