Embed Size (px)
Citation preview
269
12. Validated Reverse Phase HPLC Method for the Determination
of Azacitidine in Pharmaceutical Dosage Forms
12.1 Introduction
Azacitidine is an anti-cancer drug used for the treatment of metastatic
colorectal cancer. The drug is official in Martindale, Extra
Pharmacopoeia 159. Its profile is shown in table 12.1.
270
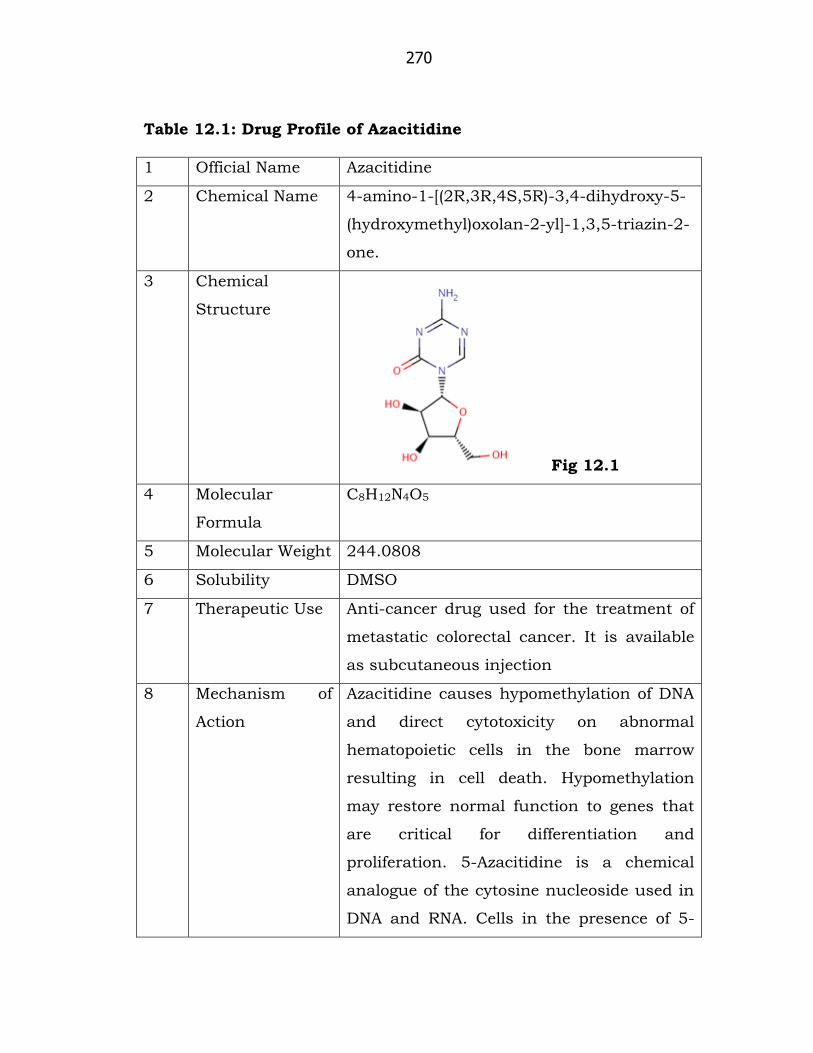
Table 12.1: Drug Profile of Azacitidine
1 Official Name Azacitidine
2 Chemical Name 4-amino-1-[(2R,3R,4S,5R)-3,4-dihydroxy-5-
(hydroxymethyl)oxolan-2-yl]-1,3,5-triazin-2-
one.
3 Chemical
Structure
Fig 12.1
4 Molecular
Formula
C8H12N4O5
5 Molecular Weight 244.0808
6 Solubility DMSO
7 Therapeutic Use Anti-cancer drug used for the treatment of
metastatic colorectal cancer. It is available
as subcutaneous injection
8 Mechanism of
Action
Azacitidine causes hypomethylation of DNA
and direct cytotoxicity on abnormal
hematopoietic cells in the bone marrow
resulting in cell death. Hypomethylation
may restore normal function to genes that
are critical for differentiation and
proliferation. 5-Azacitidine is a chemical
analogue of the cytosine nucleoside used in
DNA and RNA. Cells in the presence of 5-
271
Azacitidine incorporate it into DNA during
transcription and RNA during translation.
The incorporation of 5-Azacitidine into DNA
or RNA inhibits methyltransferase thereby
causing demethylation in that sequence,
affecting the way that cell regulation
proteins are able to bind to the DNA/RNA
substrate 159.
Aim Of the work
Few HPLC methods for quantitative determination of Azacitidine in
formulations were reported in the literature. These reports included
the determination of biological activity of azacitidine 160-164. The aim of
this work is to develop and validate a rapid, economical and sensitive
HPLC method for quantitative determination of Azacitidine in bulk
drug samples and injectable preparations. In order to minimize batch-
to-batch variation there is an immense need for developing a rapid,
sensitive and validated analytical method for day-to-day analysis of
the drug in pharmaceutical dosage forms.
272
12.2 EXPERIMENTAL
Chemicals and reagents:
Azacitidine bulk drug (99.85 % purity) and formulations were kind
gifts from TherDose Pharma Pvt. Ltd.,Hyderabd, India.
Instrumentation:
The HPLC system consisted of a Shimadzu LC–2010 AHT module with
PDA Detector. Data acquisition was performed by LC solutions
software operated on a Pentium® IV microprocessor. Zorbax Bonus RP
250 x 4.6, 5µm at ambient temperature, with gradient elution of 0.02
M Ammonium acetate in water. The flow rate was set 1.0 ml/min and
the analysis was performed at a wavelength of 242 nm using Photo
Diode Array (PDA) detector. The mobile phase was degassed and
filtered through 0.2 µm membrane filter before pumping into HPLC
system.
Preparation of solutions:
Preparation of drug stock solution:
Accurately weighed 20.0 mg of Azacitidine standard and transferred to
a 25 ml volumetric flask. Dissolved and brought to volume with
diluent (DMSO) and mixed. (Concentration 0.80 mg/ml).
273
Method validation:
System suitability:
The system suitability was assessed by replicate analysis of six
injections of the drug at a concentration of 0.80 mg/ml. The
acceptance criteria were not more than 2% for the percentage relative
standard deviation (% RSD) for the peak area and 1.5% for retention
time of Azacitidine peaks. The number of theoretical plates should not
be less than 2500.
Determination of Limit of Detection and Limit of Quantitation
(Sensitivity):
Limit of detection
The limit of detection is determined by calculating the signal to noise
ratio (3) and by comparing test results from samples with known
concentrations of analyte with those of blank samples and
establishing the minimum level at which the analyte can be reliably
detected.
Stock solution for LOD / LOQ:
Accurately weighed 10.13 mg of Azacitidine standard and transferred
into a 100 mL volumetric flask. Dissolved and brought to volume with
the diluent and mixed (Concentration 0.1013 mg/ml)-Stock solution-I
274
1ml of above stock solution-I taken in to a 10 ml volumetric flask,
dissolved and brought to volume with the diluent. –Stock solution-II
(Concentration-0.01013 mg/ml)
1.3 ml of above stock solution-II was taken into a 100 ml volumetric
flask and volume was made with diluent and injected into the
chromatograph. (Concentration-0.00013 mgml).
Limit of Quantitation
The limit of quantitation is determined by calculating the signal to
noise ratio (10) and by comparing test results from samples with
known concentrations of analyte with those of blank samples and
establishing the minimum level at which the analyte can be reliably
detected.
Linearity (Calibration curve):
Stock solution: Accurately weighed 100.15 mg of azacitidine into a
25 ml volumetric flask. Dissolved and volume was made up with the
diluent to the mark and mixed. (Concentration 4.006 mg/ml)
Level solutions: Prepared a series of the test solutions (level solutions)
described below at different concentrations (100% above and below
the target concentration) using the above stock solution.
Level 50%: Transferred 1.0ml of the stock solution into a 10ml
volumetric flask and brought up to volume with the diluent.
275
(Concentration 0.4006mg/ml). This level solution was prepared in
duplicate.
Level 75%: Transferred 1.5ml of the stock solution into a 10ml
volumetric flask and brought up to volume with the diluent.
(Concentration 0.6009mg/ml). This level solution was prepared in
duplicate.
Level 100%: Transferred 2.0ml of the stock solution into a 10ml
volumetric flask and brought up to volume with the
diluent).(concentration 0.8012mg/ml). This level solution was
prepared in duplicate.
Level 125%: Transferred 2.5ml of the stock solution into a 10ml
volumetric flask and brought up to volume with diluent.(concentration
1.0015mg/ml). This level solution was prepared in duplicate.
Level 150%: Transferred 3.0ml of the stock solution into a10ml
volumetric flask and brought up to volume with diluent.(concentration
1.2018mg/ml). This level solution was prepared in duplicate.
About 5 l of each of the above prepared solutions was injected onto
the chromatographic system connected to a Zorbax Bonus RP C18
column (250mm x 4.6, 5 µ) and calculated the average area in each
case.
Statistical evaluation: A graph between the concentration and the
average area was plotted. Points for linearity were observed. Using
276
method of least squares a line of best fit was taken and calculated the
Correlation Coefficient, Slope and y-intercept.
Accuracy and precision:
Accuracy was calculated with respect to above prepared solution at
the levels of 75%, 100% and 125% of the normal or target
concentration. The accuracy of the method was demonstrated
through recovery experiment on 3 samples at concentration 75%,
100% and 125% of the actual concentration employed in the usual
procedure. The actual concentration employed in the determination
was 0.8 mg/ml of Azacitidine containing the excipients used in the
inventor formulation and the recovery was calculated in each of the
case using the regression line equation.
Calculations: Calculated the amount of azacitidine found in each of
these test solutions using the calibration curve. The table below
summarizes the amount added vs. amount found and calculated
using the calibration curve and percentage recovery.
Demonstration of precision was done under two categories-injection
reproducibility and method precision. The injection reproducibility
was assessed by injecting six replicate injections of the standard
solution of Azacitidine and the relative standard deviation of the
replicate injections was calculated.
277
Injection Reproducibility
Relative standard deviation of RT and Area of the above system
suitability solution were calculated for injection reproducibility.
Method Precision
The method precision was performed by analyzing a sample solution
of Azacitidine at working concentration six times (Six replicate sample
preparations). The percentage relative standard deviation was
calculated for azacitidine assay values.
Application of the Method to Dosage Forms
Standard solution preparation:
Accurately weighed 6.71mg of Azacitidine working standard (Lot No.
71107AR002) in to a 10ml volumetric flask, dissolved with diluent
and volume made up to the mark with diluent (Concentration
0.671mg/ml).
Test solution preparation:
Dissolved and accurately transferred the contents of Vidaza 100
mg/vial (Lot No.1577875) with diluent in to a 200ml volumetric flask
and volume made up to the mark with diluent (Concentration
0.50mg/ml).
Injected above prepared solutions in to the chromatographic system
and calculated the % of assay
278
STABILITY:
Sample Preparation : About 20.18 mg of Azacitidine was accurately
weighed and transferred to a 25 ml volumetric flask . Dissolved and
brought to volume with the diluent and mixed well. (Concentration
0.807mg/ml).
The validity of the assay solutions was demonstrated for a period of
48 hours at 25 0 C by chromatographing the same solution at periodic
intervals.
Procedure: About 5 l of the standard solution was injected at 0, 24
and 48 hrs onto the column of the chromatographic system and
recorded the peak areas in the chromatograms.
Specificity:
The specificity of the method was demonstrated by interference check
by injecting the diluent (DMSO) blank and mobile phase to determine
whether any peaks in the diluent and placebo peaks are co-eluting
with azacitidine peak. chromatograms
About 5 l of dimethyl sulfoxide and mobile phase solution were
injected onto column.
No interference of peaks eluted in the diluent (DMSO), and mobile
phase with azacitidine peak was observed.
279
12.3 RESULTS AND DISCUSSION
Method development and optimization:
Azacitidine is freely soluble in DMSO.The drug can be separated on a
Zorbax SB – C18 column in reverse phase mode. The optimization of
the method development was done by changing mobile composition by
gradient elution. The peak shape and symmetry were good with of
0.02 M Ammonium acetate in water and Azacitidine peaks were
resolved with greater than 1.0 resolution at a flow rate of 1.0 ml/min.
Method Validation:
System Suitability:
Resolution was not less than 1.0, number of theoretical plates was
not less than 2500, and percentage relative standard deviation
(%RSD) for RT was not more than 1.5% and Peak Area was not more
than 2.0 % for Azacitidine peaks.
The %RSD of peak area and RT for the drug are within 2% indicating
the suitability of the system (Table 12.2). The efficiency of the column
as expressed by number of theoretical plates for the 6 replicate
injections was 4974 and the tailing factor was 1.10.
280
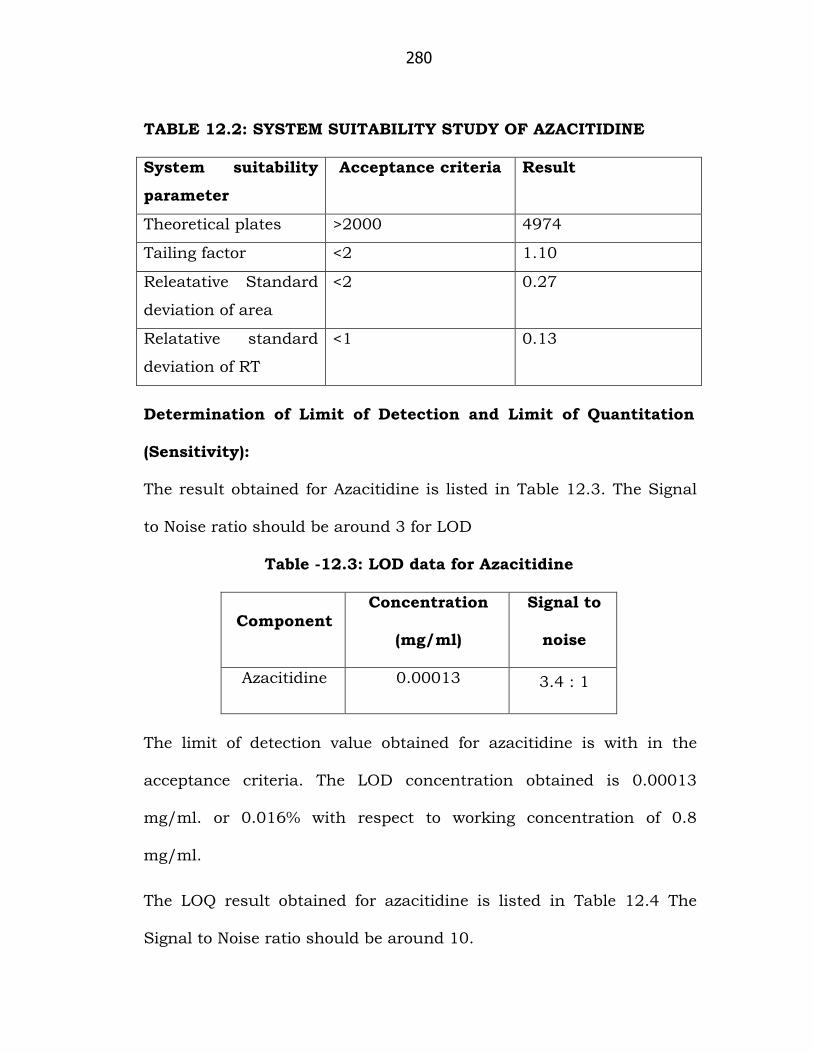
TABLE 12.2: SYSTEM SUITABILITY STUDY OF AZACITIDINE
System suitability
parameter
Acceptance criteria Result
Theoretical plates >2000 4974
Tailing factor <2 1.10
Releatative Standard
deviation of area
<2 0.27
Relatative standard
deviation of RT
<1 0.13
Determination of Limit of Detection and Limit of Quantitation
(Sensitivity):
The result obtained for Azacitidine is listed in Table 12.3. The Signal
to Noise ratio should be around 3 for LOD
Table -12.3: LOD data for Azacitidine
Component Concentration
(mg/ml)
Signal to
noise
Azacitidine 0.00013 3.4 : 1
The limit of detection value obtained for azacitidine is with in the
acceptance criteria. The LOD concentration obtained is 0.00013
mg/ml. or 0.016% with respect to working concentration of 0.8
mg/ml.
The LOQ result obtained for azacitidine is listed in Table 12.4 The
Signal to Noise ratio should be around 10.
281
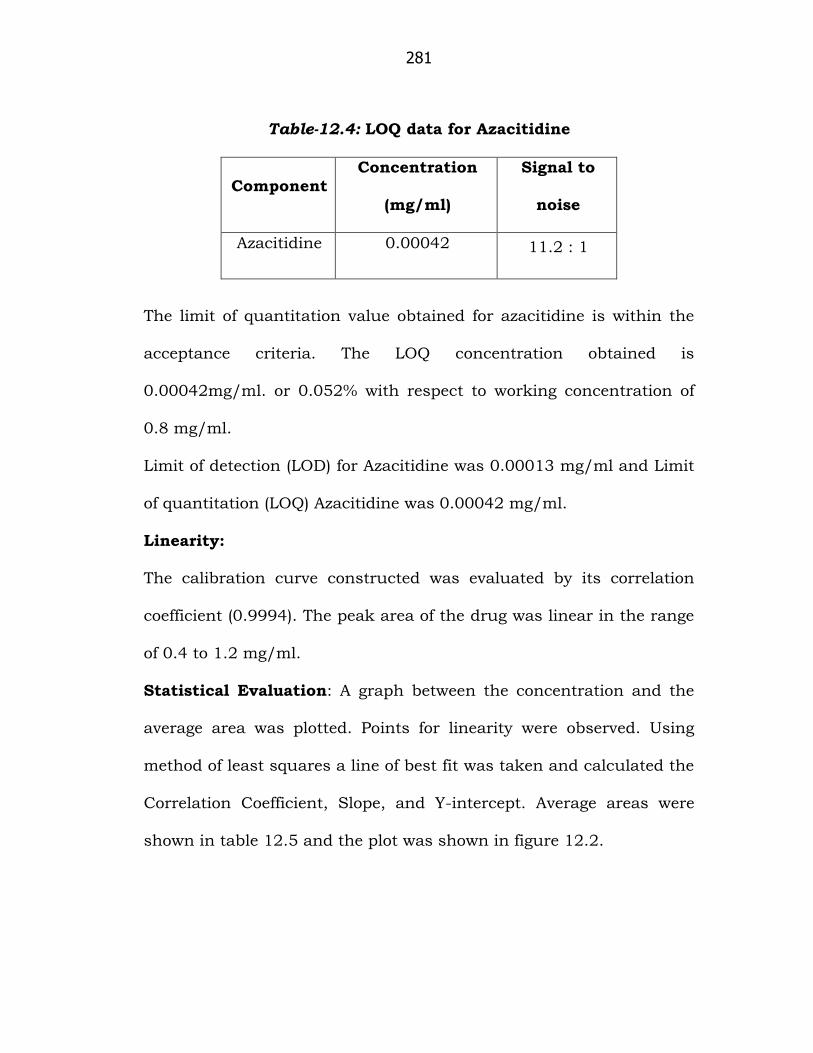
Table-12.4: LOQ data for Azacitidine
Component Concentration
(mg/ml)
Signal to
noise
Azacitidine 0.00042 11.2 : 1
The limit of quantitation value obtained for azacitidine is within the
acceptance criteria. The LOQ concentration obtained is
0.00042mg/ml. or 0.052% with respect to working concentration of
0.8 mg/ml.
Limit of detection (LOD) for Azacitidine was 0.00013 mg/ml and Limit
of quantitation (LOQ) Azacitidine was 0.00042 mg/ml.
Linearity:
The calibration curve constructed was evaluated by its correlation
coefficient (0.9994). The peak area of the drug was linear in the range
of 0.4 to 1.2 mg/ml.
Statistical Evaluation: A graph between the concentration and the
average area was plotted. Points for linearity were observed. Using
method of least squares a line of best fit was taken and calculated the
Correlation Coefficient, Slope, and Y-intercept. Average areas were
shown in table 12.5 and the plot was shown in figure 12.2.
282
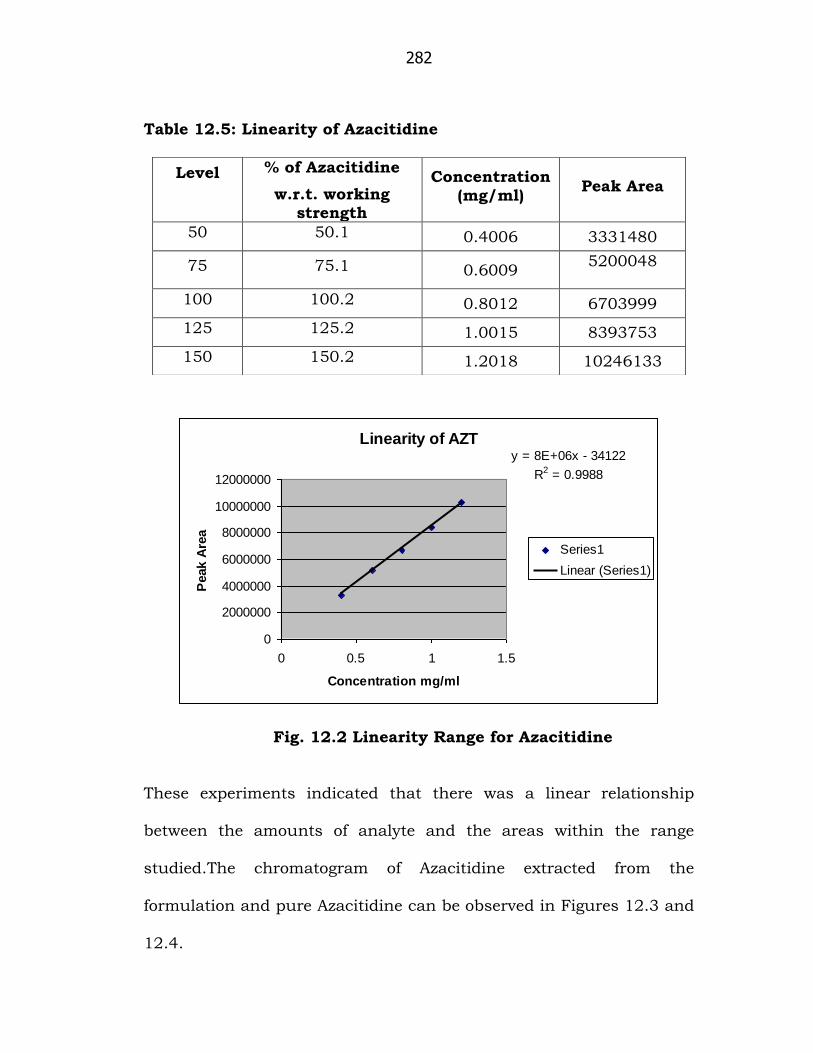
Table 12.5: Linearity of Azacitidine
Linearity of AZTy = 8E+06x - 34122
R2 = 0.9988
0
2000000
4000000
6000000
8000000
10000000
12000000
0 0.5 1 1.5
Concentration mg/ml
Peak A
rea
Series1
Linear (Series1)
Fig. 12.2 Linearity Range for Azacitidine
These experiments indicated that there was a linear relationship
between the amounts of analyte and the areas within the range
studied.The chromatogram of Azacitidine extracted from the
formulation and pure Azacitidine can be observed in Figures 12.3 and
12.4.
Level
% of Azacitidine
w.r.t. working strength
Concentration (mg/ml)
Peak Area
50 50.1 0.4006 3331480
75 75.1 0.6009 5200048
100 100.2 0.8012 6703999
125 125.2 1.0015 8393753
150 150.2 1.2018 10246133
283
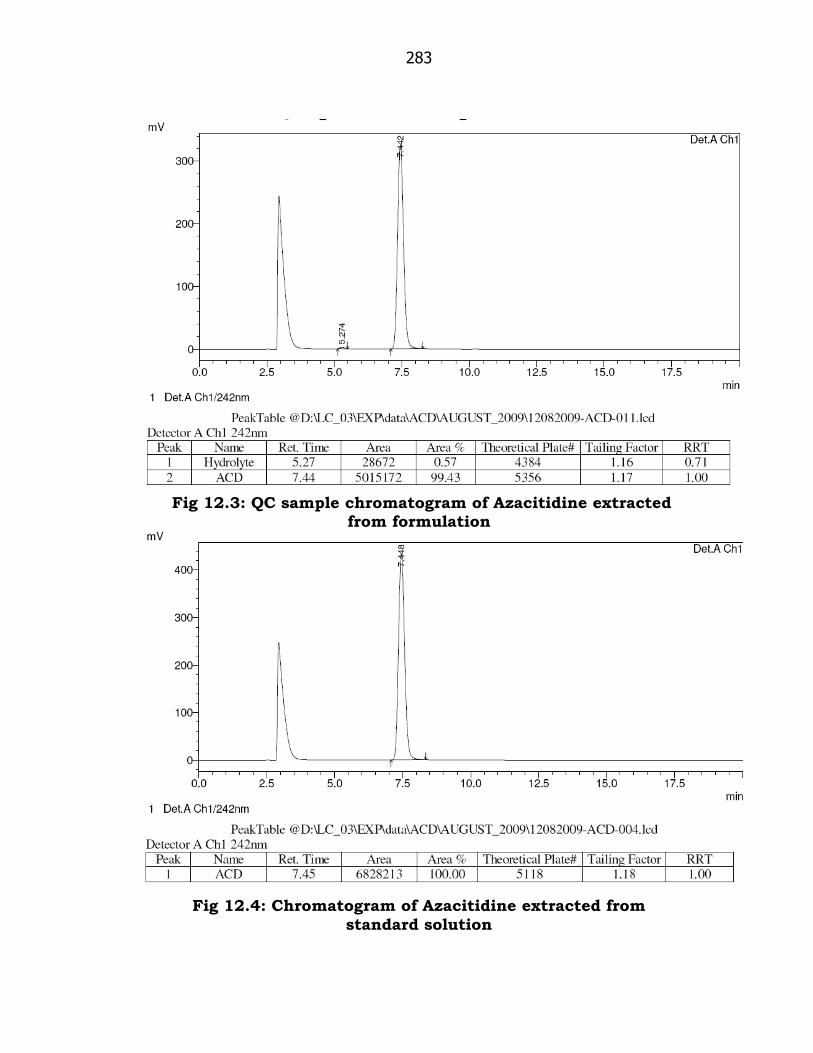
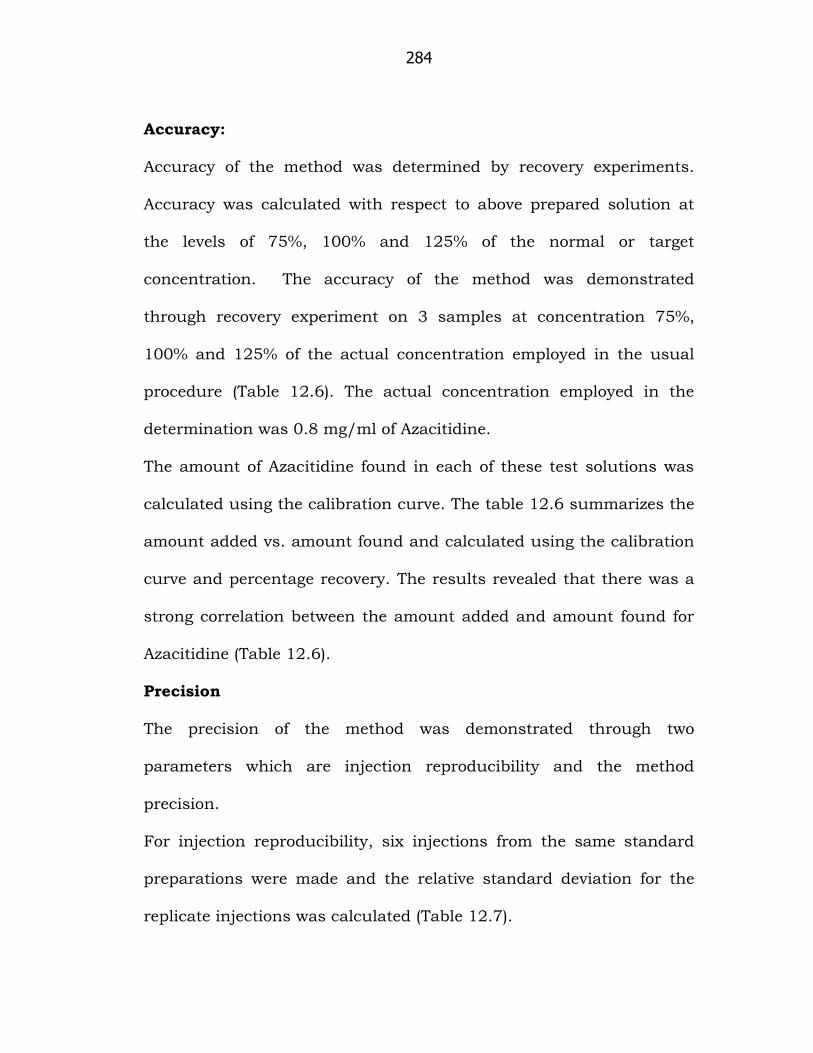
Fig 12.3: QC sample chromatogram of Azacitidine extracted from formulation
Fig 12.4: Chromatogram of Azacitidine extracted from
standard solution
284
Accuracy:
Accuracy of the method was determined by recovery experiments.
Accuracy was calculated with respect to above prepared solution at
the levels of 75%, 100% and 125% of the normal or target
concentration. The accuracy of the method was demonstrated
through recovery experiment on 3 samples at concentration 75%,
100% and 125% of the actual concentration employed in the usual
procedure (Table 12.6). The actual concentration employed in the
determination was 0.8 mg/ml of Azacitidine.
The amount of Azacitidine found in each of these test solutions was
calculated using the calibration curve. The table 12.6 summarizes the
amount added vs. amount found and calculated using the calibration
curve and percentage recovery. The results revealed that there was a
strong correlation between the amount added and amount found for
Azacitidine (Table 12.6).
Precision
The precision of the method was demonstrated through two
parameters which are injection reproducibility and the method
precision.
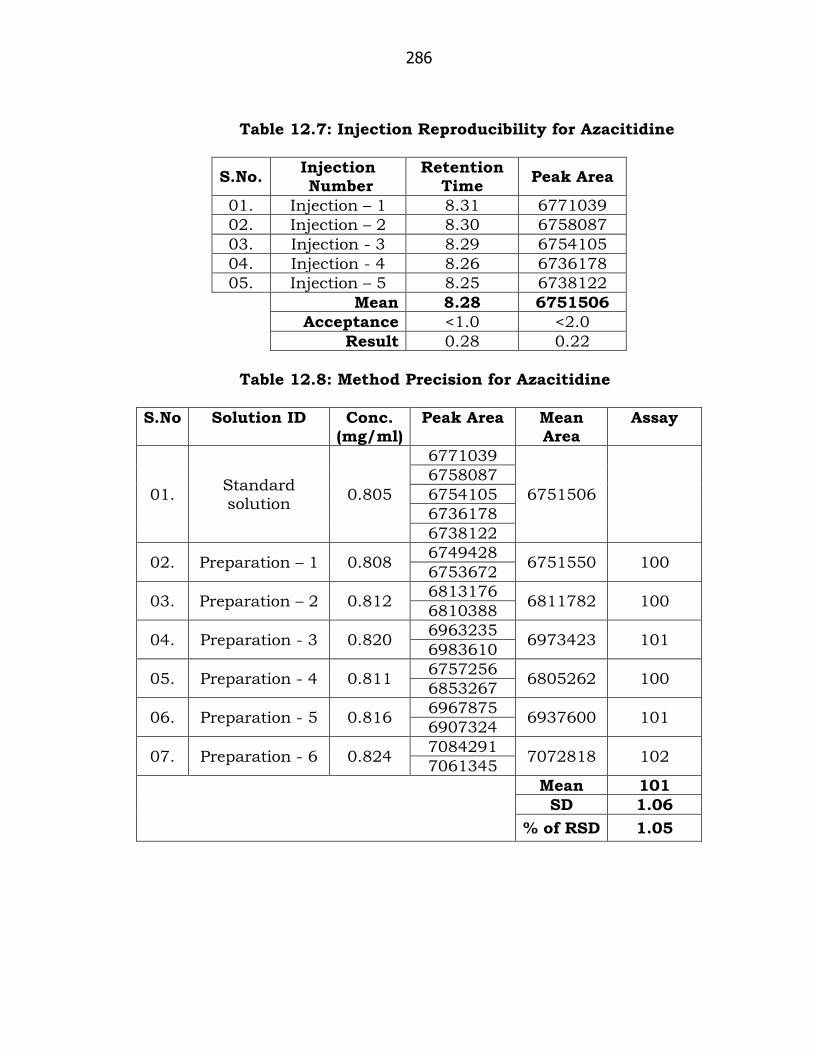
For injection reproducibility, six injections from the same standard
preparations were made and the relative standard deviation for the
replicate injections was calculated (Table 12.7).
285
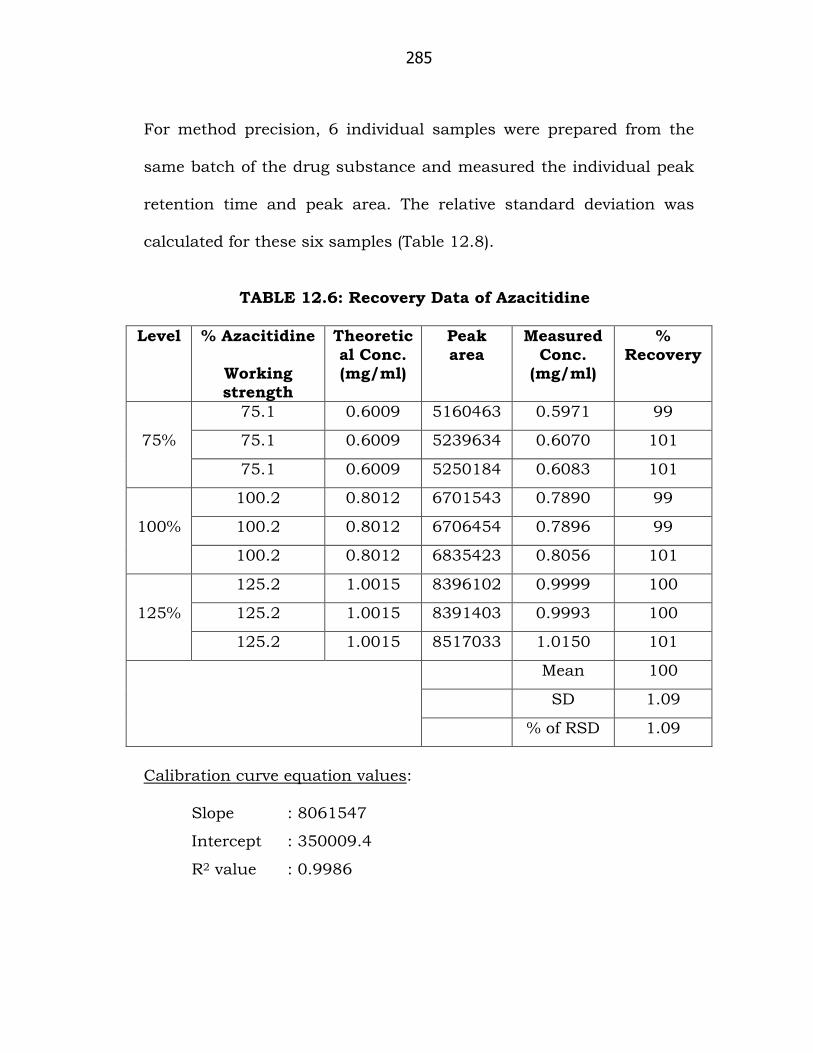
For method precision, 6 individual samples were prepared from the
same batch of the drug substance and measured the individual peak
retention time and peak area. The relative standard deviation was
calculated for these six samples (Table 12.8).
TABLE 12.6: Recovery Data of Azacitidine
Level % Azacitidine
Working
strength
Theoretic
al Conc. (mg/ml)
Peak
area
Measured
Conc. (mg/ml)
%
Recovery
75%
75.1 0.6009 5160463 0.5971 99
75.1 0.6009 5239634 0.6070 101
75.1 0.6009 5250184 0.6083 101
100%
100.2 0.8012 6701543 0.7890 99
100.2 0.8012 6706454 0.7896 99
100.2 0.8012 6835423 0.8056 101
125%
125.2 1.0015 8396102 0.9999 100
125.2 1.0015 8391403 0.9993 100
125.2 1.0015 8517033 1.0150 101
Mean 100
SD 1.09
% of RSD 1.09
Calibration curve equation values:
Slope : 8061547
Intercept : 350009.4
R2 value : 0.9986
286
Table 12.7: Injection Reproducibility for Azacitidine
S.No. Injection Number
Retention Time
Peak Area
01. Injection – 1 8.31 6771039
02. Injection – 2 8.30 6758087
03. Injection - 3 8.29 6754105
04. Injection - 4 8.26 6736178
05. Injection – 5 8.25 6738122
Mean 8.28 6751506
Acceptance <1.0 <2.0
Result 0.28 0.22
Table 12.8: Method Precision for Azacitidine
S.No Solution ID Conc. (mg/ml)
Peak Area Mean Area
Assay
01. Standard solution
0.805
6771039
6751506
6758087
6754105
6736178
6738122
02. Preparation – 1 0.808 6749428
6751550 100 6753672
03. Preparation – 2 0.812 6813176
6811782 100 6810388
04. Preparation - 3 0.820 6963235
6973423 101 6983610
05. Preparation - 4 0.811 6757256
6805262 100 6853267
06. Preparation - 5 0.816 6967875
6937600 101 6907324
07. Preparation - 6 0.824 7084291
7072818 102 7061345
Mean 101
SD 1.06
% of RSD 1.05
287
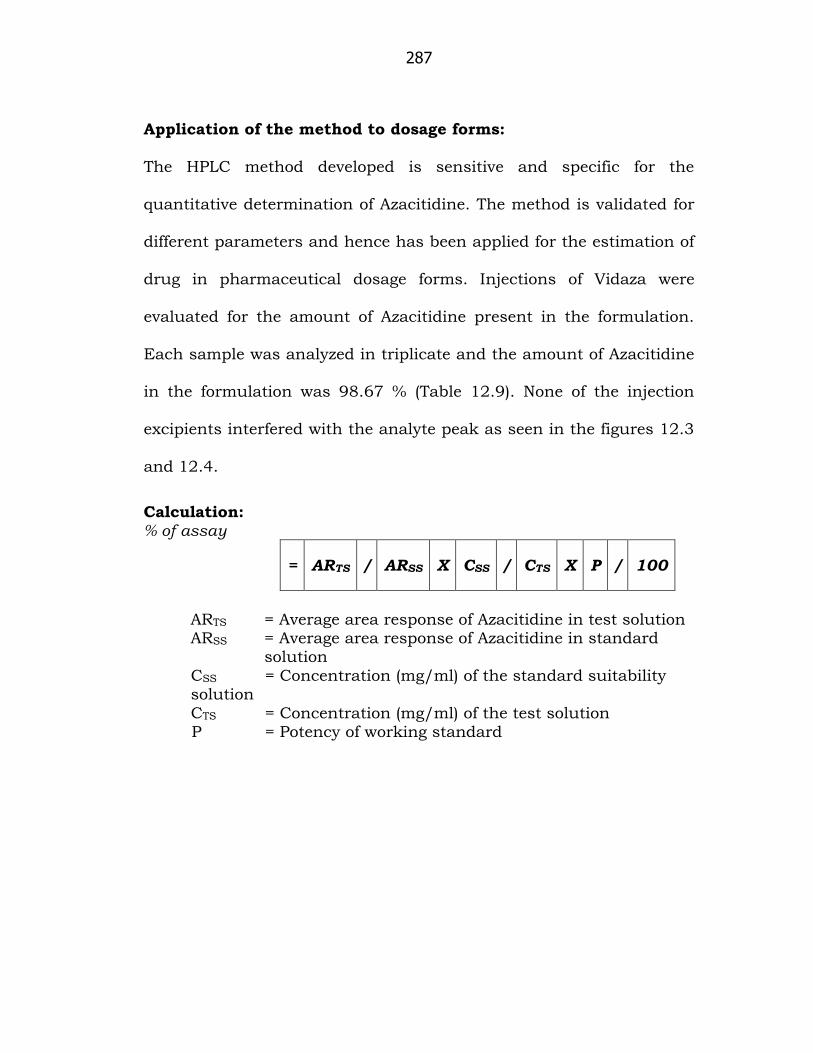
Application of the method to dosage forms:
The HPLC method developed is sensitive and specific for the
quantitative determination of Azacitidine. The method is validated for
different parameters and hence has been applied for the estimation of
drug in pharmaceutical dosage forms. Injections of Vidaza were
evaluated for the amount of Azacitidine present in the formulation.
Each sample was analyzed in triplicate and the amount of Azacitidine
in the formulation was 98.67 % (Table 12.9). None of the injection
excipients interfered with the analyte peak as seen in the figures 12.3
and 12.4.
Calculation: % of assay
= ARTS / ARSS X CSS / CTS X P / 100
ARTS = Average area response of Azacitidine in test solution ARSS = Average area response of Azacitidine in standard
solution
CSS = Concentration (mg/ml) of the standard suitability solution
CTS = Concentration (mg/ml) of the test solution P = Potency of working standard
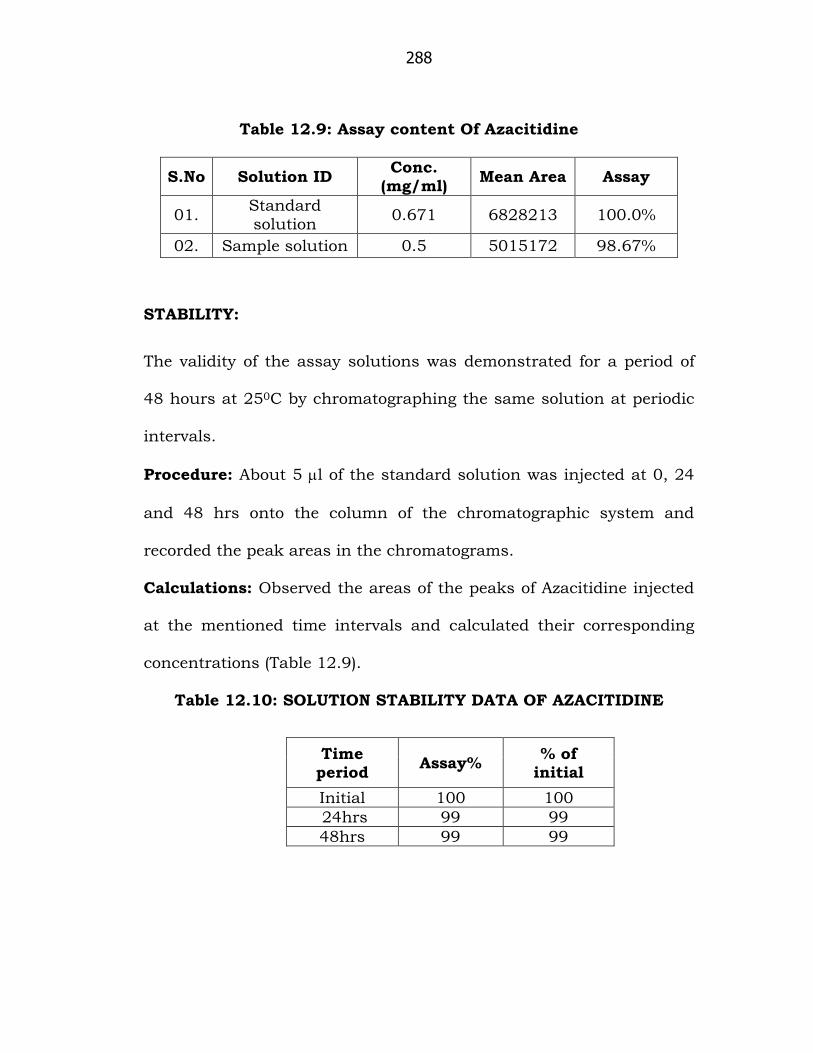
288
Table 12.9: Assay content Of Azacitidine
S.No Solution ID Conc.
(mg/ml) Mean Area Assay
01. Standard solution
0.671 6828213 100.0%
02. Sample solution 0.5 5015172 98.67%
STABILITY:
The validity of the assay solutions was demonstrated for a period of
48 hours at 250C by chromatographing the same solution at periodic
intervals.
Procedure: About 5 l of the standard solution was injected at 0, 24
and 48 hrs onto the column of the chromatographic system and
recorded the peak areas in the chromatograms.
Calculations: Observed the areas of the peaks of Azacitidine injected
at the mentioned time intervals and calculated their corresponding
concentrations (Table 12.9).
Table 12.10: SOLUTION STABILITY DATA OF AZACITIDINE
Time period
Assay% % of
initial
Initial 100 100
24hrs 99 99
48hrs 99 99
289
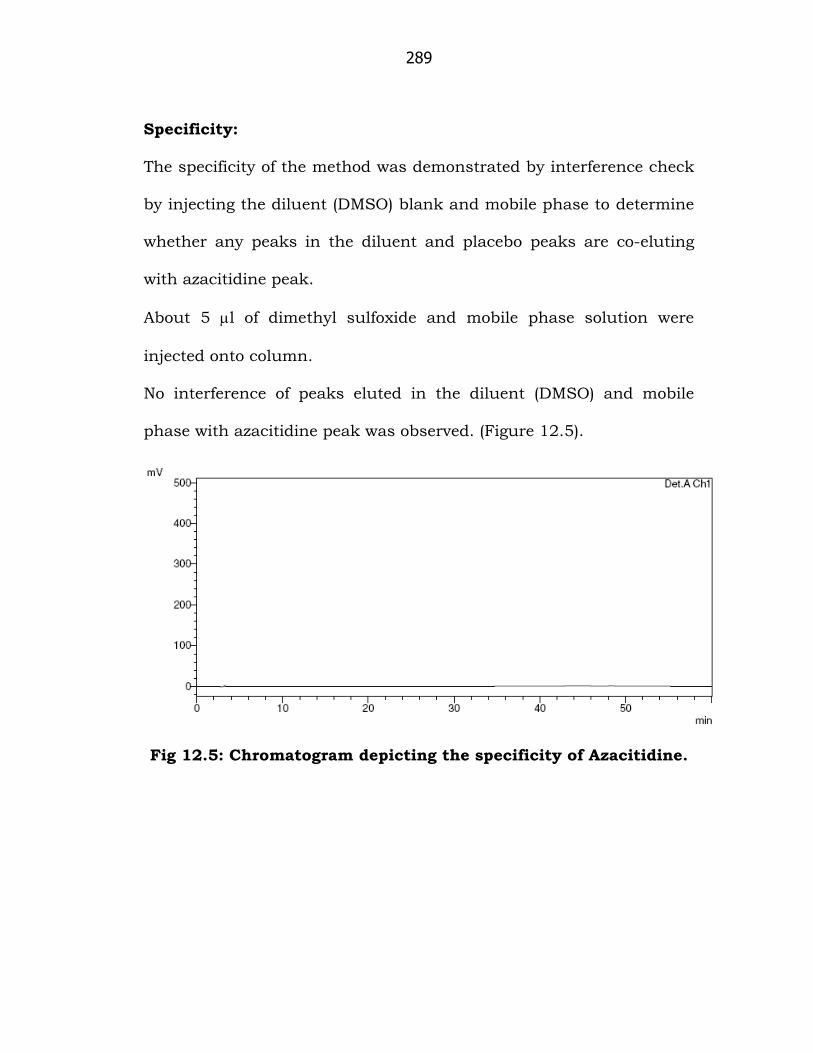
Specificity:
The specificity of the method was demonstrated by interference check
by injecting the diluent (DMSO) blank and mobile phase to determine
whether any peaks in the diluent and placebo peaks are co-eluting
with azacitidine peak.
About 5 l of dimethyl sulfoxide and mobile phase solution were
injected onto column.
No interference of peaks eluted in the diluent (DMSO) and mobile
phase with azacitidine peak was observed. (Figure 12.5).
Fig 12.5: Chromatogram depicting the specificity of Azacitidine.
290
12.4 Conclusion
A simple and gradient reverse phase high performance liquid
chromatography (RP-HPLC) method was developed and validated for
quantitative determination of Azacitidine in bulk drug samples and
formulations. The method was validated for accuracy, precision,
linearity, specificity, limit of detection and limit of quantitation.
Azacitidine was analyzed by using Zorbax Bonus – C18 (250 mm x 4.6
mm, 5 μm) at ambient temperature, with gradient elution of 0.02 M
Ammonium acetate in water. The flow rate was set 1.0 ml/min and
the analysis was performed at a wavelength of 267 nm using Photo
Diode Array (PDA) detector. Efficient UV detection at 242 nm enabled
determination of azacitidine with no interference from injectable
solution excipients or solvents. The retention time (RT) for Azacitidine
was around 8 min. The calibration curves were linear over a
concentration range from 0.4 mg to 1.4 mg/ml. Limit of detection
(LOD) for Azacitidine was 0.00013 mg/ml and Limit of quantitation
(LOQ) Azacitidine was 0.00042 mg/ml. The developed method was
successfully applied to estimate the amount of Azacitidine in injection
formulations. The proposed HPLC method is accurate, precise,
specific, sensitive, and efficient and can be used in routine analysis in
quality control laboratories.