Embed Size (px)
Citation preview
WOLVERHAMPTON HOMES STAR SURVEY 2012 M·E·L RESEARCH
Measurement ���� Evaluation ���� Learning: Using evidence to shape better services
Wolverhampton Homes Tenant Satisfaction Survey 2012
FINAL REPORT
WOLVERHAMPTON HOMES STAR SURVEY 2012 M·E·L RESEARCH
Measurement ���� Evaluation ���� Learning: Using evidence to shape better services
Contents Page
Summary.................................................................................................................................... 3
Project details and acknowledgements ................................................................................. 5
1) Introduction................................................................................................................... 6
2) Your views..................................................................................................................... 7
3) Benchmarking............................................................................................................. 16
4) Key driver analysis..................................................................................................... 18
5) Your service priorities................................................................................................ 21
6) Advice and support services .................................................................................... 22
7) Rent advice and support ........................................................................................... 24
8) Welfare Reforms......................................................................................................... 26
9) Your neighbourhood.................................................................................................. 28
10) Contact and communication..................................................................................... 32
11) Keeping you informed and tenant involvement ..................................................... 36
12) Using the internet ....................................................................................................... 39
13) Gas Servicing.............................................................................................................. 42
14) Estate Services ........................................................................................................... 43
15) General......................................................................................................................... 46
16) Conclusion of survey findings.................................................................................. 50
Appendices.............................................................................................................................. 52
Appendix 1 – Sample composition....................................................................................... 53
Appendix 2 – Tenants survey questionnaire....................................................................... 54
WOLVERHAMPTON HOMES STAR SURVEY 2012 M·E·L RESEARCH
Measurement ���� Evaluation ���� Learning: Using evidence to shape better services
Summary
This section provides a summary of the key findings from the Wolverhampton Homes Tenant
Survey. Detailed findings are presented in the subsequent sections of this report.
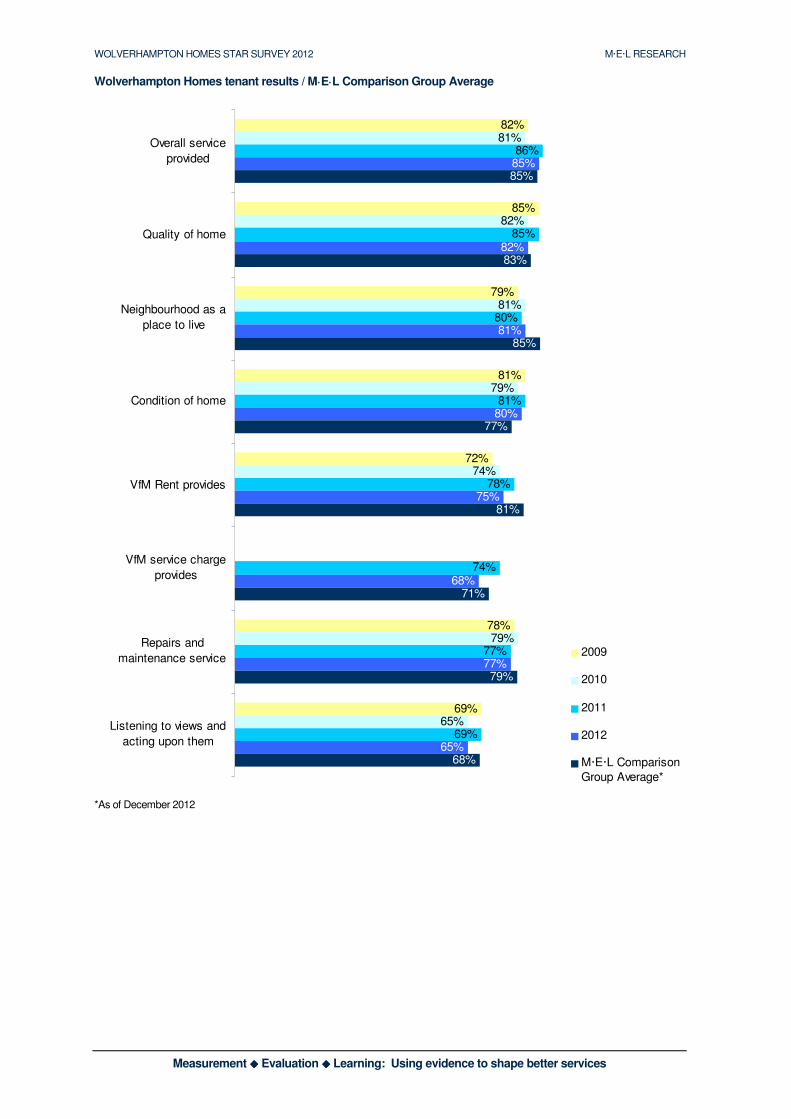
Taking everything into account, 85% of tenants are satisfied with the service provided by
Wolverhampton Homes. Comparison with the 2011 results shows similar satisfaction levels (86%).
82% of tenants are satisfied with the overall quality of their home. Comparison with the 2011 results
shows slightly lower satisfaction levels (85%). This is similar to the M·E·L Comparison Group average
(83%).
81% of tenants are satisfied with their neighbourhood as a place to live. Comparison with the results
from 2011 show similar satisfaction levels (80%). This falls below the M·E·L Comparison Group average
(85%).
80% of tenants are satisfied with the overall condition of their home. Again, results are very similar
to the 2011 satisfaction (81%). This compares favourably to the M·E·L Comparison Group falling above
the group average (77%).
75% of tenants are satisfied that rent provides value for money. This rises to 88% for tenants living in
a bungalow, but drops to 55% for tenants living in a maisonette. Comparisons with the 2011 results are
slightly lower (78%). This falls below the M·E·L Comparison Group average (81%).
Of those tenants who pay a service charge, 68% are satisfied that it provides value for money.
Although there has been a drop in satisfaction compared to the 2011 results (74%) this falls within the
margin of error and is not significant. This falls slightly below the M·E·L Comparison Group average (71%).
77% of tenants are satisfied with the way Wolverhampton Homes deals with repairs and
maintenance. The 2011 satisfaction result is identical. Satisfaction with repairs and maintenance is a key
driver of overall satisfaction levels and improving satisfaction with the repairs and maintenance service will
improve overall satisfaction levels.
65% of tenants are satisfied that Wolverhampton Homes listens to their views and acts upon them.
The 2011 result was 69%, a drop of 4% (although not statistically significant). The key driver analysis
shows that satisfaction is closely correlated with satisfaction with the repairs and maintenance service.
Addressing the perception that Wolverhampton Homes does not listen to views and act upon them will
therefore have a positive impact on satisfaction with repairs and maintenance.
All benchmarking information can be found in Section 3.
WOLVERHAMPTON HOMES STAR SURVEY 2012 M·E·L RESEARCH
Measurement ���� Evaluation ���� Learning: Using evidence to shape better services
Wolverhampton Homes tenant results / M·E·L Comparison Group Average
82%
85%
79%
81%
72%
78%
69%
81%
82%
81%
79%
74%
79%
65%
86%
85%
80%
81%
78%
74%
77%
69%
85%
82%
81%
80%
75%
68%
77%
65%
85%
83%
85%
77%
81%
71%
79%
68%
Overall service
provided
Quality of home
Neighbourhood as a
place to live
Condition of home
VfM Rent provides
VfM service charge
provides
Repairs and
maintenance service
Listening to views and
acting upon them
2009
2010
2011
2012
M·E·L Comparison
Group Average*
*As of December 2012
WOLVERHAMPTON HOMES STAR SURVEY 2012 M·E·L RESEARCH
Measurement ���� Evaluation ���� Learning: Using evidence to shape better services 5
Project details and acknowledgements
M·E·L Research
8 Holt Court
Aston Science Park
Birmingham B7 4AX
Tel: 0121 604 4664
Fax: 0121 604 6776
Email: [email protected]
Web: www.m-e-l.co.uk
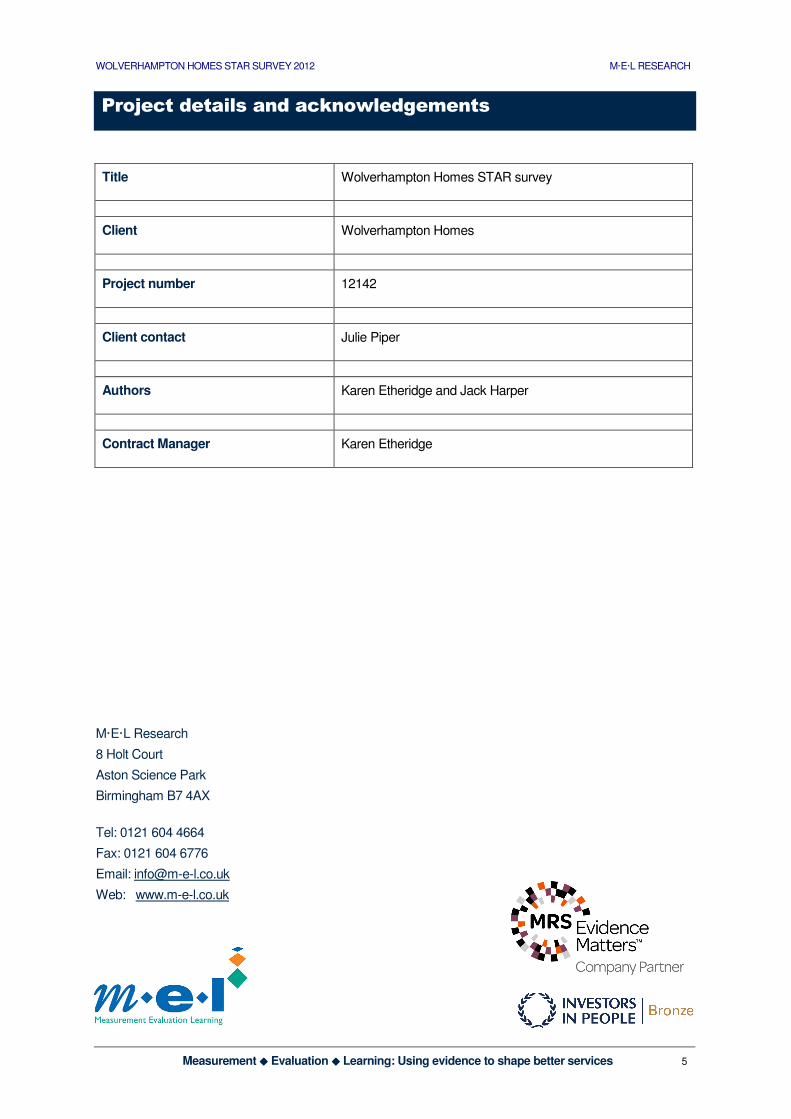
Title Wolverhampton Homes STAR survey
Client Wolverhampton Homes
Project number 12142
Client contact Julie Piper
Authors Karen Etheridge and Jack Harper
Contract Manager Karen Etheridge
WOLVERHAMPTON HOMES STAR SURVEY 2012 M·E·L RESEARCH
Measurement ���� Evaluation ���� Learning: Using evidence to shape better services 6
1) Introduction
Wolverhampton Homes commissioned M·E·L Research to undertake their 2012 Survey of Tenants and
Residents (STAR) on its behalf.
Survey response
Fieldwork was undertaken during October and November 2012. A mailing to 2,900 tenants was followed by
two reminder mailings of the full questionnaire to non respondents. This approach yielded a 42% response
rate.
Statistical reliability and reporting conventions
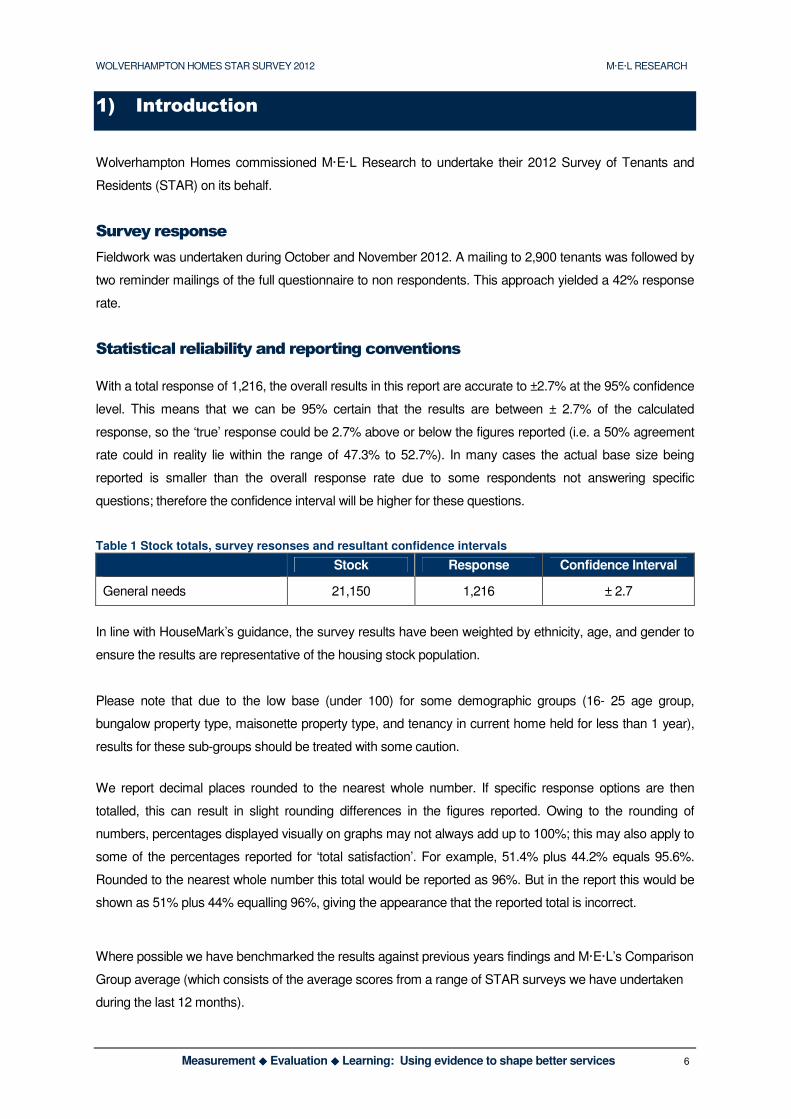
With a total response of 1,216, the overall results in this report are accurate to ±2.7% at the 95% confidence
level. This means that we can be 95% certain that the results are between ± 2.7% of the calculated
response, so the ‘true’ response could be 2.7% above or below the figures reported (i.e. a 50% agreement
rate could in reality lie within the range of 47.3% to 52.7%). In many cases the actual base size being
reported is smaller than the overall response rate due to some respondents not answering specific
questions; therefore the confidence interval will be higher for these questions.
Table 1 Stock totals, survey resonses and resultant confidence intervals
Stock Response Confidence Interval
General needs 21,150 1,216 ± 2.7
In line with HouseMark’s guidance, the survey results have been weighted by ethnicity, age, and gender to
ensure the results are representative of the housing stock population.
Please note that due to the low base (under 100) for some demographic groups (16- 25 age group,
bungalow property type, maisonette property type, and tenancy in current home held for less than 1 year),
results for these sub-groups should be treated with some caution.
We report decimal places rounded to the nearest whole number. If specific response options are then
totalled, this can result in slight rounding differences in the figures reported. Owing to the rounding of
numbers, percentages displayed visually on graphs may not always add up to 100%; this may also apply to
some of the percentages reported for ‘total satisfaction’. For example, 51.4% plus 44.2% equals 95.6%.
Rounded to the nearest whole number this total would be reported as 96%. But in the report this would be
shown as 51% plus 44% equalling 96%, giving the appearance that the reported total is incorrect.
Where possible we have benchmarked the results against previous years findings and M·E·L’s Comparison
Group average (which consists of the average scores from a range of STAR surveys we have undertaken
during the last 12 months).
WOLVERHAMPTON HOMES STAR SURVEY 2012 M·E·L RESEARCH
Measurement ���� Evaluation ���� Learning: Using evidence to shape better services 7
2) Your views
This section presents findings on tenants’ satisfaction with services provided by Wolverhampton
Homes
Satisfaction with the service provided by Wolverhampton Homes
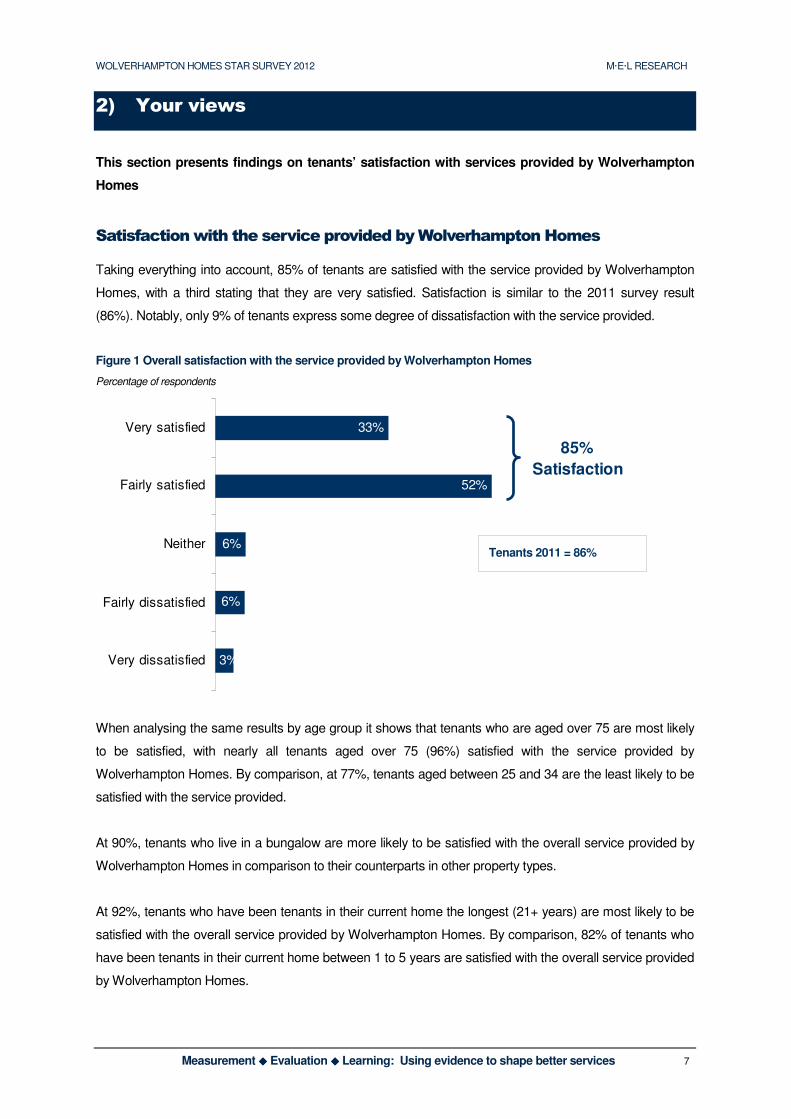
Taking everything into account, 85% of tenants are satisfied with the service provided by Wolverhampton
Homes, with a third stating that they are very satisfied. Satisfaction is similar to the 2011 survey result
(86%). Notably, only 9% of tenants express some degree of dissatisfaction with the service provided.
Figure 1 Overall satisfaction with the service provided by Wolverhampton Homes
Percentage of respondents
33%
52%
6%
6%
3%
Very satisfied
Fairly satisfied
Neither
Fairly dissatisfied
Very dissatisfied
85%
Satisfaction
When analysing the same results by age group it shows that tenants who are aged over 75 are most likely
to be satisfied, with nearly all tenants aged over 75 (96%) satisfied with the service provided by
Wolverhampton Homes. By comparison, at 77%, tenants aged between 25 and 34 are the least likely to be
satisfied with the service provided.
At 90%, tenants who live in a bungalow are more likely to be satisfied with the overall service provided by
Wolverhampton Homes in comparison to their counterparts in other property types.
At 92%, tenants who have been tenants in their current home the longest (21+ years) are most likely to be
satisfied with the overall service provided by Wolverhampton Homes. By comparison, 82% of tenants who
have been tenants in their current home between 1 to 5 years are satisfied with the overall service provided
by Wolverhampton Homes.
Tenants 2011 = 86%
WOLVERHAMPTON HOMES STAR SURVEY 2012 M·E·L RESEARCH
Measurement ���� Evaluation ���� Learning: Using evidence to shape better services 8
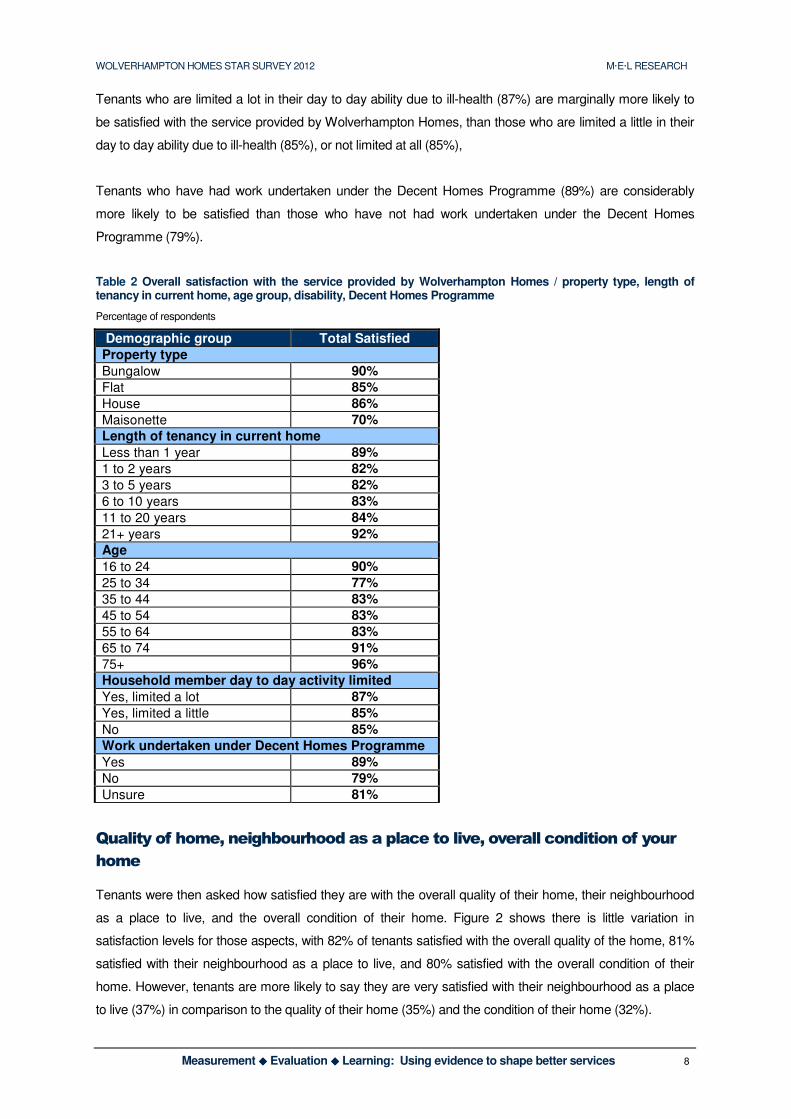
Tenants who are limited a lot in their day to day ability due to ill-health (87%) are marginally more likely to
be satisfied with the service provided by Wolverhampton Homes, than those who are limited a little in their
day to day ability due to ill-health (85%), or not limited at all (85%),
Tenants who have had work undertaken under the Decent Homes Programme (89%) are considerably
more likely to be satisfied than those who have not had work undertaken under the Decent Homes
Programme (79%).
Table 2 Overall satisfaction with the service provided by Wolverhampton Homes / property type, length of tenancy in current home, age group, disability, Decent Homes Programme
Percentage of respondents
Demographic group Total Satisfied
Property type
Bungalow 90%
Flat 85%
House 86%
Maisonette 70%
Length of tenancy in current home
Less than 1 year 89%
1 to 2 years 82%
3 to 5 years 82%
6 to 10 years 83%
11 to 20 years 84%
21+ years 92%
Age
16 to 24 90%
25 to 34 77%
35 to 44 83%
45 to 54 83%
55 to 64 83%
65 to 74 91%
75+ 96%
Household member day to day activity limited
Yes, limited a lot 87%
Yes, limited a little 85%
No 85%
Work undertaken under Decent Homes Programme
Yes 89%
No 79%
Unsure 81%
Quality of home, neighbourhood as a place to live, overall condition of your
home
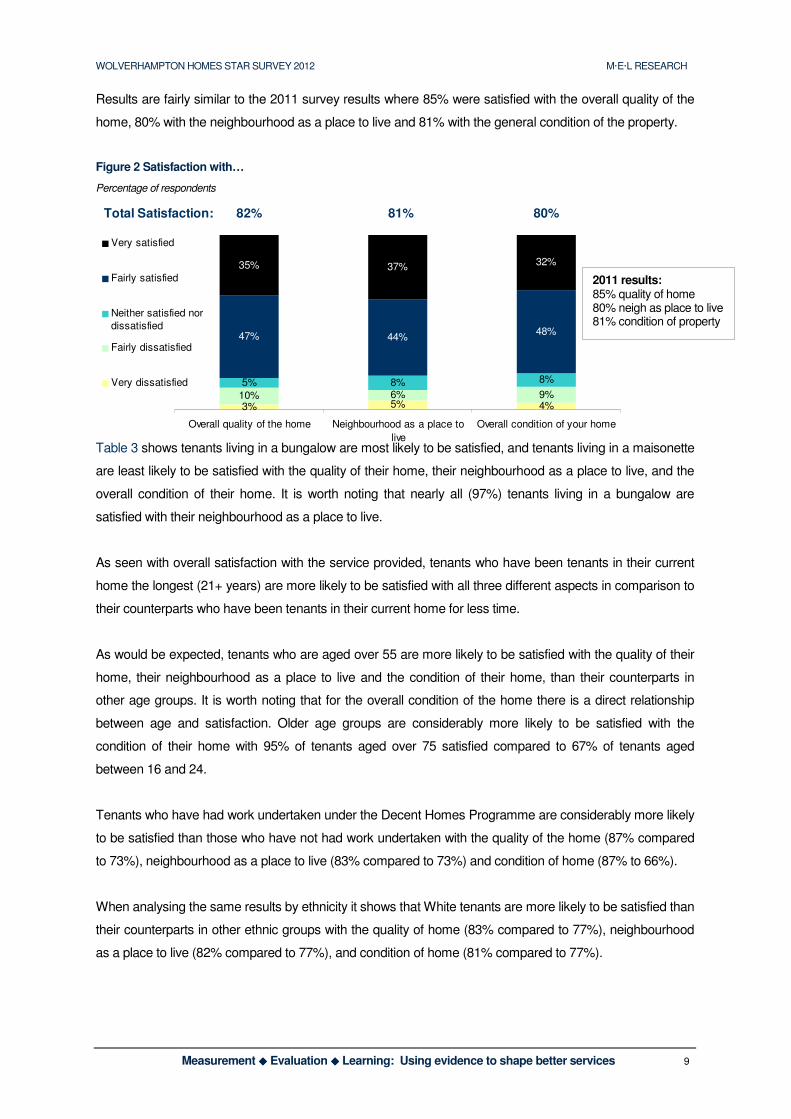
Tenants were then asked how satisfied they are with the overall quality of their home, their neighbourhood
as a place to live, and the overall condition of their home. Figure 2 shows there is little variation in
satisfaction levels for those aspects, with 82% of tenants satisfied with the overall quality of the home, 81%
satisfied with their neighbourhood as a place to live, and 80% satisfied with the overall condition of their
home. However, tenants are more likely to say they are very satisfied with their neighbourhood as a place
to live (37%) in comparison to the quality of their home (35%) and the condition of their home (32%).
WOLVERHAMPTON HOMES STAR SURVEY 2012 M·E·L RESEARCH
Measurement ���� Evaluation ���� Learning: Using evidence to shape better services 9
3% 5% 4%10% 6% 9%5% 8% 8%
47% 44%48%
35% 37% 32%
Overall quality of the home Neighbourhood as a place to
live
Overall condition of your home
Very satisfied
Fairly satisfied
Neither satisfied nor
dissatisfied
Fairly dissatisfied
Very dissatisfied
Total Satisfaction: 82% 81% 80%
Results are fairly similar to the 2011 survey results where 85% were satisfied with the overall quality of the
home, 80% with the neighbourhood as a place to live and 81% with the general condition of the property.
Figure 2 Satisfaction with…
Percentage of respondents
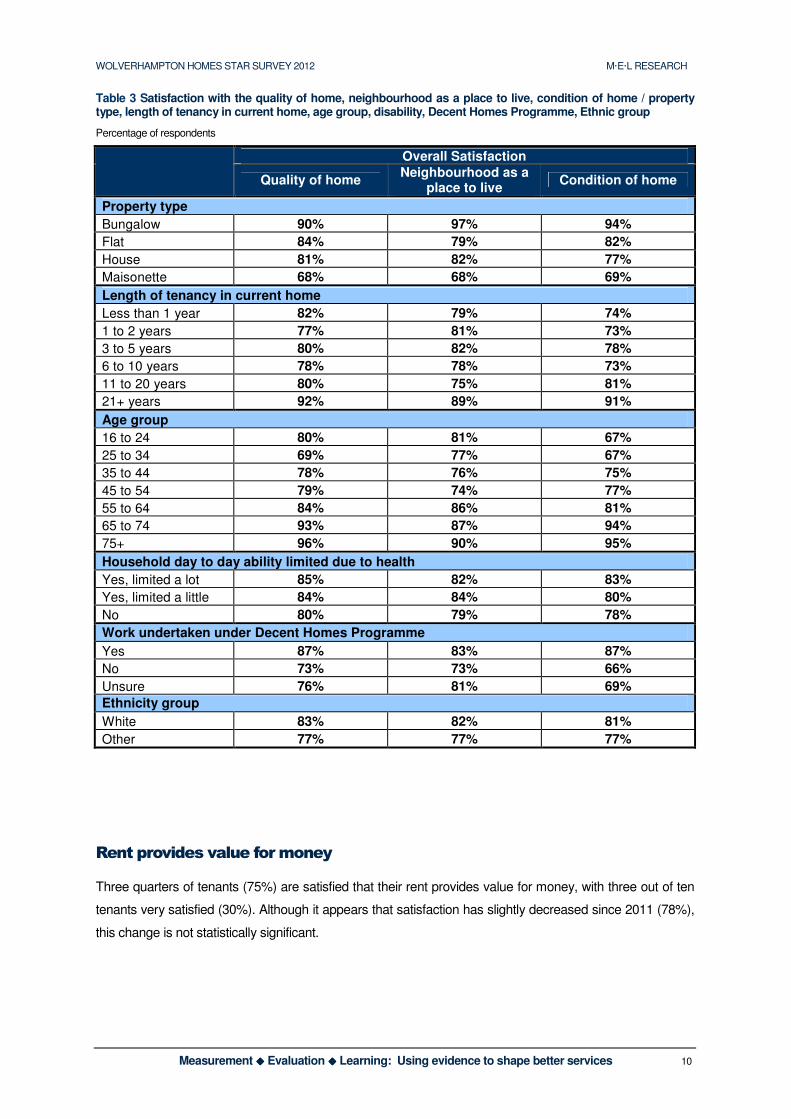
Table 3 shows tenants living in a bungalow are most likely to be satisfied, and tenants living in a maisonette
are least likely to be satisfied with the quality of their home, their neighbourhood as a place to live, and the
overall condition of their home. It is worth noting that nearly all (97%) tenants living in a bungalow are
satisfied with their neighbourhood as a place to live.
As seen with overall satisfaction with the service provided, tenants who have been tenants in their current
home the longest (21+ years) are more likely to be satisfied with all three different aspects in comparison to
their counterparts who have been tenants in their current home for less time.
As would be expected, tenants who are aged over 55 are more likely to be satisfied with the quality of their
home, their neighbourhood as a place to live and the condition of their home, than their counterparts in
other age groups. It is worth noting that for the overall condition of the home there is a direct relationship
between age and satisfaction. Older age groups are considerably more likely to be satisfied with the
condition of their home with 95% of tenants aged over 75 satisfied compared to 67% of tenants aged
between 16 and 24.
Tenants who have had work undertaken under the Decent Homes Programme are considerably more likely
to be satisfied than those who have not had work undertaken with the quality of the home (87% compared
to 73%), neighbourhood as a place to live (83% compared to 73%) and condition of home (87% to 66%).
When analysing the same results by ethnicity it shows that White tenants are more likely to be satisfied than
their counterparts in other ethnic groups with the quality of home (83% compared to 77%), neighbourhood
as a place to live (82% compared to 77%), and condition of home (81% compared to 77%).
2011 results: 85% quality of home 80% neigh as place to live 81% condition of property
WOLVERHAMPTON HOMES STAR SURVEY 2012 M·E·L RESEARCH
Measurement ���� Evaluation ���� Learning: Using evidence to shape better services 10
Table 3 Satisfaction with the quality of home, neighbourhood as a place to live, condition of home / property type, length of tenancy in current home, age group, disability, Decent Homes Programme, Ethnic group
Percentage of respondents
Overall Satisfaction
Quality of home Neighbourhood as a
place to live Condition of home
Property type
Bungalow 90% 97% 94%
Flat 84% 79% 82%
House 81% 82% 77%
Maisonette 68% 68% 69%
Length of tenancy in current home
Less than 1 year 82% 79% 74%
1 to 2 years 77% 81% 73%
3 to 5 years 80% 82% 78%
6 to 10 years 78% 78% 73%
11 to 20 years 80% 75% 81%
21+ years 92% 89% 91%
Age group
16 to 24 80% 81% 67%
25 to 34 69% 77% 67%
35 to 44 78% 76% 75%
45 to 54 79% 74% 77%
55 to 64 84% 86% 81%
65 to 74 93% 87% 94%
75+ 96% 90% 95%
Household day to day ability limited due to health
Yes, limited a lot 85% 82% 83%
Yes, limited a little 84% 84% 80%
No 80% 79% 78%
Work undertaken under Decent Homes Programme
Yes 87% 83% 87%
No 73% 73% 66%
Unsure 76% 81% 69%
Ethnicity group
White 83% 82% 81%
Other 77% 77% 77%
Rent provides value for money
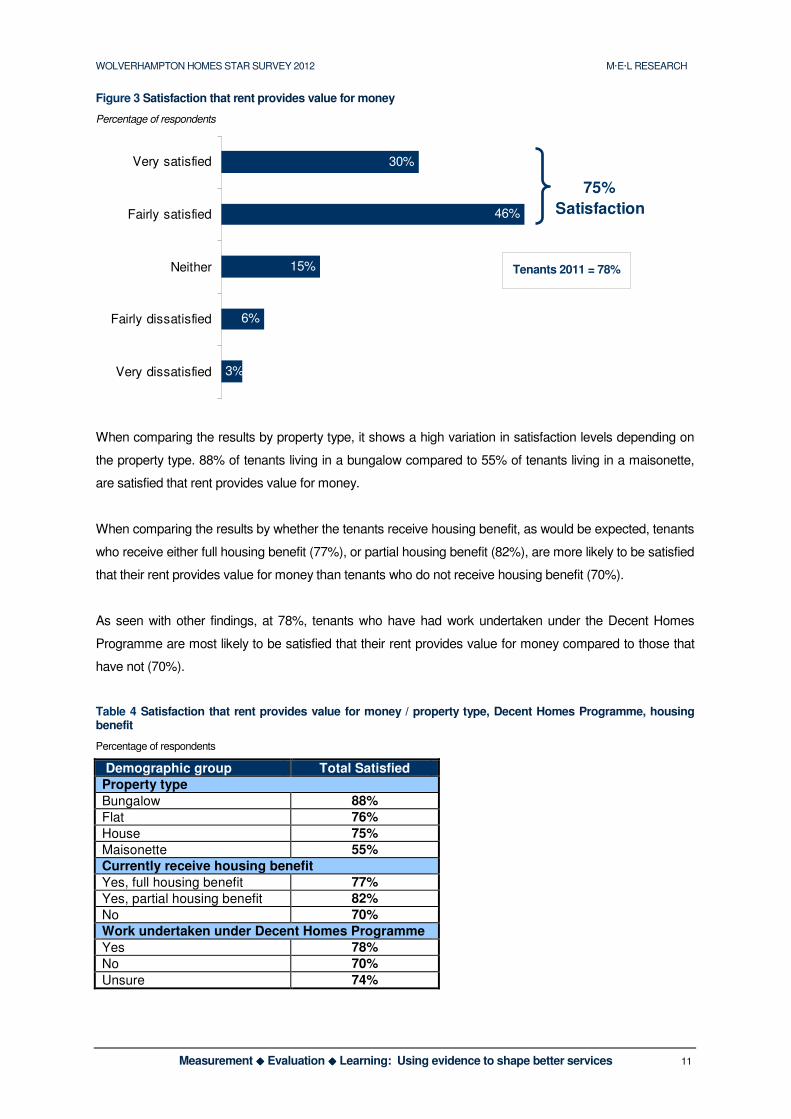
Three quarters of tenants (75%) are satisfied that their rent provides value for money, with three out of ten
tenants very satisfied (30%). Although it appears that satisfaction has slightly decreased since 2011 (78%),
this change is not statistically significant.
WOLVERHAMPTON HOMES STAR SURVEY 2012 M·E·L RESEARCH
Measurement ���� Evaluation ���� Learning: Using evidence to shape better services 11
Figure 3 Satisfaction that rent provides value for money
Percentage of respondents
30%
46%
15%
6%
3%
Very satisfied
Fairly satisfied
Neither
Fairly dissatisfied
Very dissatisfied
75%
Satisfaction
When comparing the results by property type, it shows a high variation in satisfaction levels depending on
the property type. 88% of tenants living in a bungalow compared to 55% of tenants living in a maisonette,
are satisfied that rent provides value for money.
When comparing the results by whether the tenants receive housing benefit, as would be expected, tenants
who receive either full housing benefit (77%), or partial housing benefit (82%), are more likely to be satisfied
that their rent provides value for money than tenants who do not receive housing benefit (70%).
As seen with other findings, at 78%, tenants who have had work undertaken under the Decent Homes
Programme are most likely to be satisfied that their rent provides value for money compared to those that
have not (70%).
Table 4 Satisfaction that rent provides value for money / property type, Decent Homes Programme, housing benefit
Percentage of respondents
Demographic group Total Satisfied
Property type
Bungalow 88%
Flat 76%
House 75%
Maisonette 55%
Currently receive housing benefit
Yes, full housing benefit 77%
Yes, partial housing benefit 82%
No 70%
Work undertaken under Decent Homes Programme
Yes 78%
No 70%
Unsure 74%
Tenants 2011 = 78%
WOLVERHAMPTON HOMES STAR SURVEY 2012 M·E·L RESEARCH
Measurement ���� Evaluation ���� Learning: Using evidence to shape better services 12
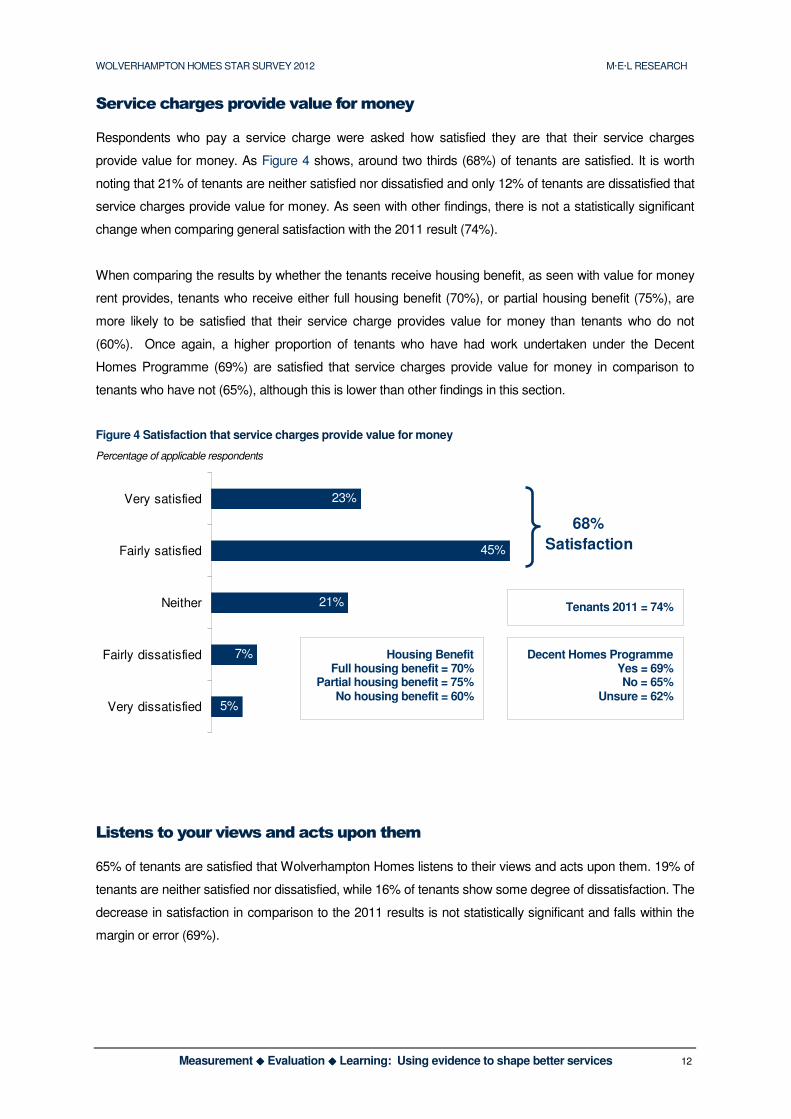
Service charges provide value for money
Respondents who pay a service charge were asked how satisfied they are that their service charges
provide value for money. As Figure 4 shows, around two thirds (68%) of tenants are satisfied. It is worth
noting that 21% of tenants are neither satisfied nor dissatisfied and only 12% of tenants are dissatisfied that
service charges provide value for money. As seen with other findings, there is not a statistically significant
change when comparing general satisfaction with the 2011 result (74%).
When comparing the results by whether the tenants receive housing benefit, as seen with value for money
rent provides, tenants who receive either full housing benefit (70%), or partial housing benefit (75%), are
more likely to be satisfied that their service charge provides value for money than tenants who do not
(60%). Once again, a higher proportion of tenants who have had work undertaken under the Decent
Homes Programme (69%) are satisfied that service charges provide value for money in comparison to
tenants who have not (65%), although this is lower than other findings in this section.
Figure 4 Satisfaction that service charges provide value for money
Percentage of applicable respondents
23%
45%
21%
7%
5%
Very satisfied
Fairly satisfied
Neither
Fairly dissatisfied
Very dissatisfied
68%
Satisfaction
Listens to your views and acts upon them
65% of tenants are satisfied that Wolverhampton Homes listens to their views and acts upon them. 19% of
tenants are neither satisfied nor dissatisfied, while 16% of tenants show some degree of dissatisfaction. The
decrease in satisfaction in comparison to the 2011 results is not statistically significant and falls within the
margin or error (69%).
Tenants 2011 = 74%
Decent Homes Programme Yes = 69% No = 65%
Unsure = 62%
Housing Benefit Full housing benefit = 70%
Partial housing benefit = 75% No housing benefit = 60%

WOLVERHAMPTON HOMES STAR SURVEY 2012 M·E·L RESEARCH
Measurement ���� Evaluation ���� Learning: Using evidence to shape better services 13
33%
45%
8%
8%
6%
Very satisfied
Fairly satisfied
Neither
Fairly dissatisfied
Very dissatisfied
77%
Satisfaction
22%
43%
19%
10%
6%
Very satisfied
Fairly satisfied
Neither
Fairly dissatisfied
Very dissatisfied
65%
Satisfaction
Figure 5 Satisfaction that Wolverhampton Homes listens to your views and acts upon them
Percentage of respondents
Repairs and maintenance service
Around three quarters (77%) of tenants are satisfied with the way Wolverhampton Homes deals with repairs
and maintenance, with a third of tenants very satisfied. There is no change in satisfaction levels in
comparison to the 2011 results. Satisfaction rises to 79% for tenants who have had work undertaken under
the Decent Homes Programme but drops to 74% for tenants who have not had work undertaken.
Figure 6 Satisfaction with the way Wolverhmapton Homes deals with repairs and maintenance
Percentage of respondents
Tenants 2011 = 69%
Tenants 2011 = 77%
Decent Homes Programme Yes = 79% No = 74%
Unsure = 74%
WOLVERHAMPTON HOMES STAR SURVEY 2012 M·E·L RESEARCH
Measurement ���� Evaluation ���� Learning: Using evidence to shape better services 14
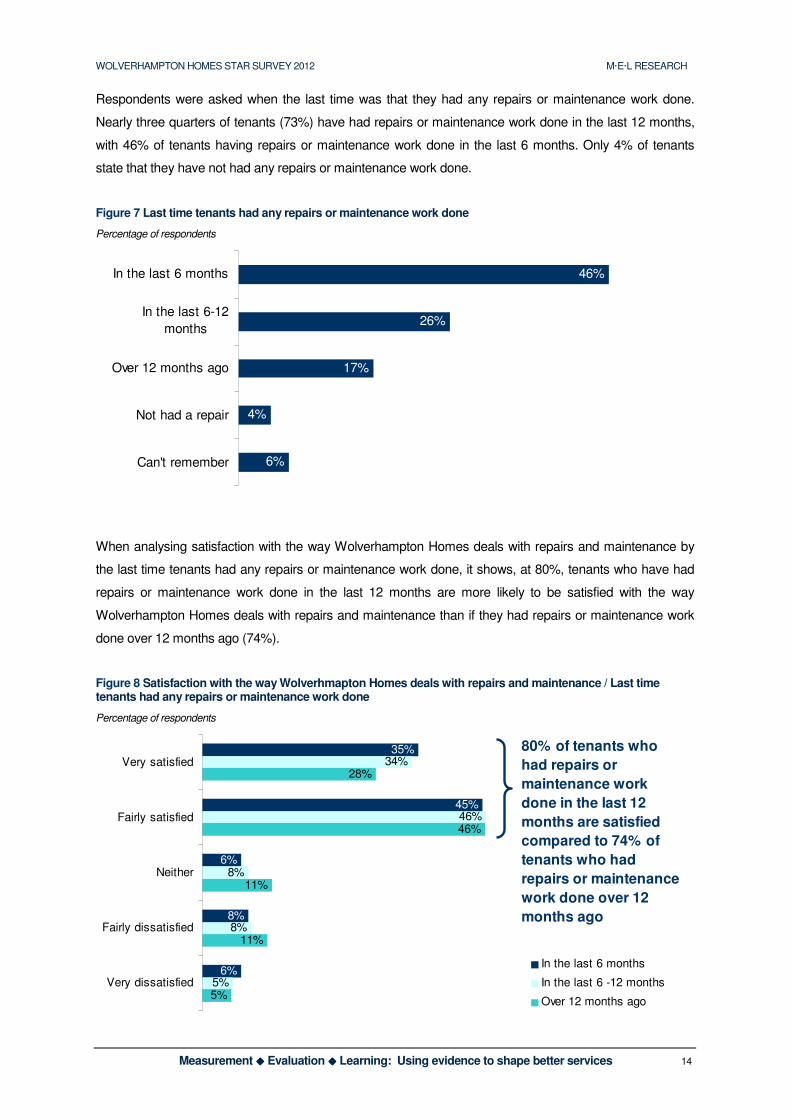
Respondents were asked when the last time was that they had any repairs or maintenance work done.
Nearly three quarters of tenants (73%) have had repairs or maintenance work done in the last 12 months,
with 46% of tenants having repairs or maintenance work done in the last 6 months. Only 4% of tenants
state that they have not had any repairs or maintenance work done.
Figure 7 Last time tenants had any repairs or maintenance work done
Percentage of respondents
46%
26%
17%
4%
6%
In the last 6 months
In the last 6-12
months
Over 12 months ago
Not had a repair
Can't remember
When analysing satisfaction with the way Wolverhampton Homes deals with repairs and maintenance by
the last time tenants had any repairs or maintenance work done, it shows, at 80%, tenants who have had
repairs or maintenance work done in the last 12 months are more likely to be satisfied with the way
Wolverhampton Homes deals with repairs and maintenance than if they had repairs or maintenance work
done over 12 months ago (74%).
Figure 8 Satisfaction with the way Wolverhmapton Homes deals with repairs and maintenance / Last time tenants had any repairs or maintenance work done
Percentage of respondents
35%
45%
6%
8%
6%
34%
46%
8%
8%
5%
28%
46%
11%
5%
11%
Very satisfied
Fairly satisfied
Neither
Fairly dissatisfied
Very dissatisfied
In the last 6 months
In the last 6 -12 months
Over 12 months ago
80% of tenants who
had repairs or
maintenance work
done in the last 12
months are satisfied
compared to 74% of
tenants who had
repairs or maintenance
work done over 12
months ago
WOLVERHAMPTON HOMES STAR SURVEY 2012 M·E·L RESEARCH
Measurement ���� Evaluation ���� Learning: Using evidence to shape better services 15
17%
23%60%
Yes
No
Don’t know
Work
undertaken
under Decent
Homes
Standard
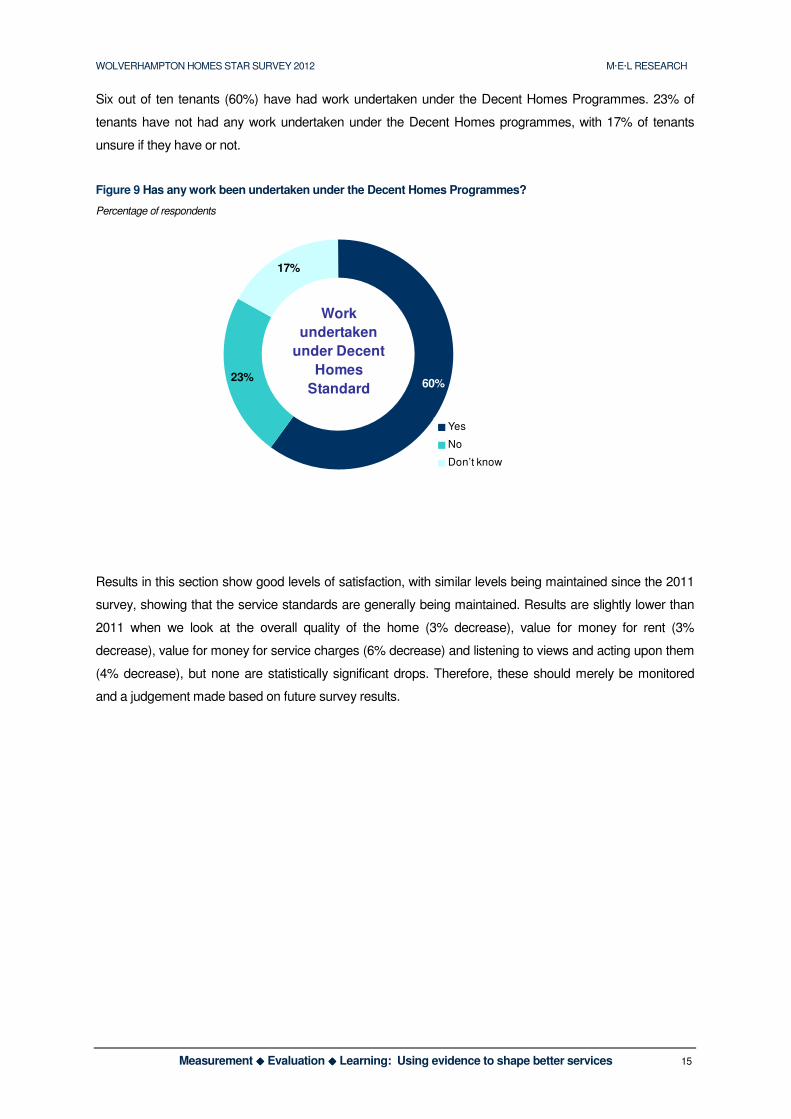
Six out of ten tenants (60%) have had work undertaken under the Decent Homes Programmes. 23% of
tenants have not had any work undertaken under the Decent Homes programmes, with 17% of tenants
unsure if they have or not.
Figure 9 Has any work been undertaken under the Decent Homes Programmes?
Percentage of respondents
Results in this section show good levels of satisfaction, with similar levels being maintained since the 2011
survey, showing that the service standards are generally being maintained. Results are slightly lower than
2011 when we look at the overall quality of the home (3% decrease), value for money for rent (3%
decrease), value for money for service charges (6% decrease) and listening to views and acting upon them
(4% decrease), but none are statistically significant drops. Therefore, these should merely be monitored
and a judgement made based on future survey results.

WOLVERHAMPTON HOMES STAR SURVEY 2012 M·E·L RESEARCH
Measurement ���� Evaluation ���� Learning: Using evidence to shape better services 16
3) Benchmarking
This section presents benchmarking and comparison of findings
Table 5 shows a comparison between the findings shown in this year’s STAR survey with the results from
previous years. When comparing this year’s findings with the results from 2011, we can see results are
relatively similar for some, whilst minor drops for others. However, all changes in satisfaction from 2011 to
2012 fall within the margin of error and are therefore not statistically significant (for there to be a statistically
significant change in satisfaction there would have to be a minimum change in satisfaction of 6.3%).
Table 5 Comparison between 2009, 2010, 2011 and 2012 results (excluding not applicable)
Percentage of General needs respondents
Satisfaction
Measure 2009 2010 2011 2012
Significant at 95%
Overall service provided 82% 81% 86% ▼85% No
Quality of home 85% 82% 85% ▼82% No
Neighbourhood as a place to live 79% 81% 80% ▲81% No
Condition of home 81% 79% 81% ▼80% No
VfM rent provides 72% 74% 78% ▼75% No
VfM service charge provides - - 74% ▼68% No
Repairs and maintenance service 78% 79% 77% - 77% -
Listening to views and acting upon them 69% 65% 69% ▼65% No
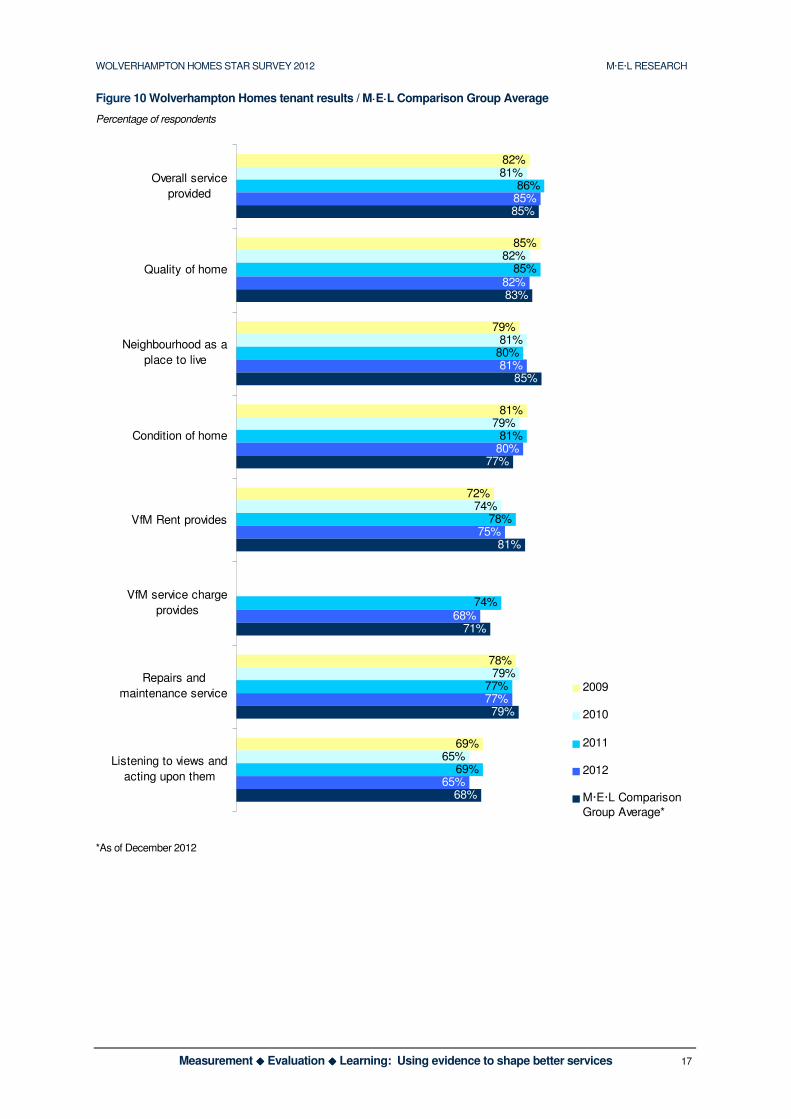
As Figure 10 overleaf shows, overall satisfaction with the service provided for Wolverhampton Homes
tenants is similar to the M·E·L Comparison Group Average. Satisfaction levels shown by Wolverhampton
Homes tenants for the overall condition of the home are above the M·E·L Comparison Group Average.
However, satisfaction levels are slightly lower than M·E·L’s Comparison Group average for quality of home,
neighbourhood as a place to live, value for money rent provides, value for money service charges provide,
repairs and maintenance, and listening to views and acting upon them, although most are only minor
differences.
WOLVERHAMPTON HOMES STAR SURVEY 2012 M·E·L RESEARCH
Measurement ���� Evaluation ���� Learning: Using evidence to shape better services 17
Figure 10 Wolverhampton Homes tenant results / M·E·L Comparison Group Average
Percentage of respondents
82%
85%
79%
81%
72%
78%
69%
81%
82%
81%
79%
74%
79%
65%
86%
85%
80%
81%
78%
74%
77%
69%
85%
82%
81%
80%
75%
68%
77%
65%
85%
83%
85%
77%
81%
71%
79%
68%
Overall service
provided
Quality of home
Neighbourhood as a
place to live
Condition of home
VfM Rent provides
VfM service charge
provides
Repairs and
maintenance service
Listening to views and
acting upon them
2009
2010
2011
2012
M·E·L Comparison
Group Average*
*As of December 2012
WOLVERHAMPTON HOMES STAR SURVEY 2012 M·E·L RESEARCH
Measurement ���� Evaluation ���� Learning: Using evidence to shape better services 18
4) Key driver analysis
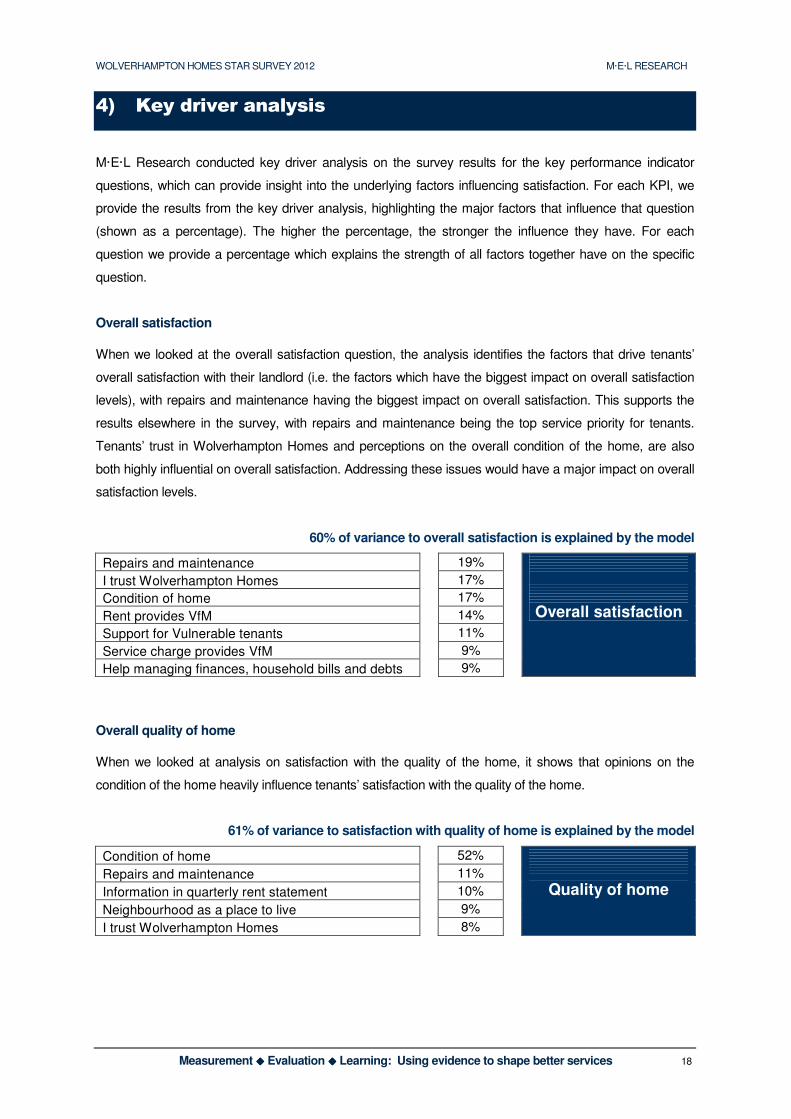
M·E·L Research conducted key driver analysis on the survey results for the key performance indicator
questions, which can provide insight into the underlying factors influencing satisfaction. For each KPI, we
provide the results from the key driver analysis, highlighting the major factors that influence that question
(shown as a percentage). The higher the percentage, the stronger the influence they have. For each
question we provide a percentage which explains the strength of all factors together have on the specific
question.
Overall satisfaction
When we looked at the overall satisfaction question, the analysis identifies the factors that drive tenants’
overall satisfaction with their landlord (i.e. the factors which have the biggest impact on overall satisfaction
levels), with repairs and maintenance having the biggest impact on overall satisfaction. This supports the
results elsewhere in the survey, with repairs and maintenance being the top service priority for tenants.
Tenants’ trust in Wolverhampton Homes and perceptions on the overall condition of the home, are also
both highly influential on overall satisfaction. Addressing these issues would have a major impact on overall
satisfaction levels.
60% of variance to overall satisfaction is explained by the model
Repairs and maintenance 19%
I trust Wolverhampton Homes 17%
Condition of home 17%
Rent provides VfM 14%
Support for Vulnerable tenants 11%
Service charge provides VfM 9%
Help managing finances, household bills and debts 9%
Overall satisfaction
Overall quality of home
When we looked at analysis on satisfaction with the quality of the home, it shows that opinions on the
condition of the home heavily influence tenants’ satisfaction with the quality of the home.
61% of variance to satisfaction with quality of home is explained by the model
Condition of home 52%
Repairs and maintenance 11%
Information in quarterly rent statement 10%
Neighbourhood as a place to live 9%
I trust Wolverhampton Homes 8%
Quality of home

WOLVERHAMPTON HOMES STAR SURVEY 2012 M·E·L RESEARCH
Measurement ���� Evaluation ���� Learning: Using evidence to shape better services 19
Neighbourhood as a place to live
Analysis for satisfaction with the neighbourhood as a place to live shows that levels would increase if a
higher proportion of tenants agree that ‘My local area is a place where people get on well together’. As seen
with the key driver analysis carried out for the quality of the home, tenants’ perception on the condition of
their home also influences their opinion on their neighbourhood as a place to live.
41% of variance to satisfaction with neighbourhood as a place to live is explained by the model
‘My local area is a place where people get on well together’
28%
Condition of home 24%
Neighbourhood improved in last 3 years 18%
Quality of home 13%
Neighbourhood as a place to live
Value for money for rent
Analysis of satisfaction that rent provides value for money shows, as would be expected, that this is heavily
influenced by tenants perceptions that their service charges provide value for money.
62% of variance to satisfaction that rent provides VfM is explained by the model
Service charges provide VfM 50%
Overall service in relation to rent and service charges
15%
‘My local area is a place where people get on well together’
13%
Moving or swapping your home 9%
Claiming housing benefit & other welfare benefits 9%
Rent provides value for money
Value for money for service charges
Analysis of satisfaction that service charges provide value for money shows that perceptions of the overall
service in relation to rent and service charges has a major influence on this indicator. Interaction with
tenants also influences satisfaction, therefore satisfaction would improve if tenants feel that Wolverhampton
Homes listens to their views and acts upon them, or keeps them informed.
51% of variance to satisfaction that service charges provide VfM is explained by the model
Overall service in relation to rent and service charges
22%
Landlord listens to views and acts upon them 22%
Keeping tenants informed 18%
Claiming housing benefit & other welfare benefits 10%
Service charges provide VfM
WOLVERHAMPTON HOMES STAR SURVEY 2012 M·E·L RESEARCH
Measurement ���� Evaluation ���� Learning: Using evidence to shape better services 20
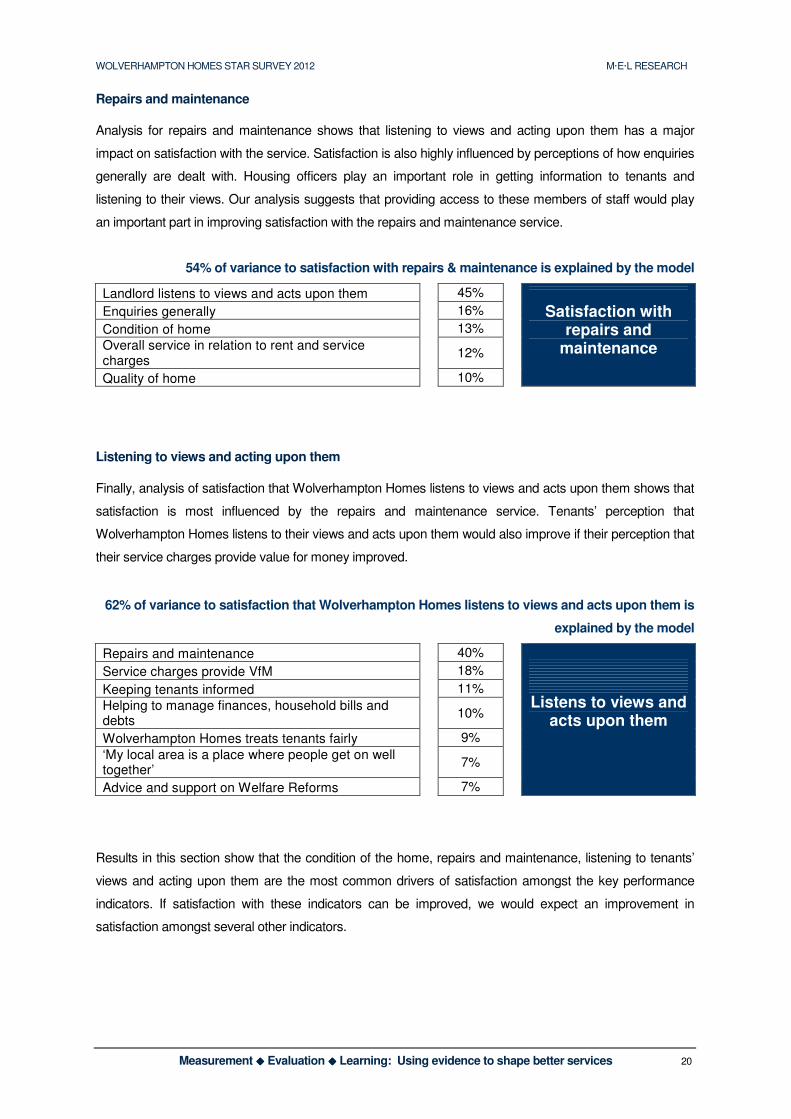
Repairs and maintenance
Analysis for repairs and maintenance shows that listening to views and acting upon them has a major
impact on satisfaction with the service. Satisfaction is also highly influenced by perceptions of how enquiries
generally are dealt with. Housing officers play an important role in getting information to tenants and
listening to their views. Our analysis suggests that providing access to these members of staff would play
an important part in improving satisfaction with the repairs and maintenance service.
54% of variance to satisfaction with repairs & maintenance is explained by the model
Landlord listens to views and acts upon them 45%
Enquiries generally 16%
Condition of home 13%
Overall service in relation to rent and service charges
12%
Quality of home 10%
Satisfaction with repairs and
maintenance
Listening to views and acting upon them
Finally, analysis of satisfaction that Wolverhampton Homes listens to views and acts upon them shows that
satisfaction is most influenced by the repairs and maintenance service. Tenants’ perception that
Wolverhampton Homes listens to their views and acts upon them would also improve if their perception that
their service charges provide value for money improved.
62% of variance to satisfaction that Wolverhampton Homes listens to views and acts upon them is
explained by the model
Repairs and maintenance 40%
Service charges provide VfM 18%
Keeping tenants informed 11%
Helping to manage finances, household bills and debts
10%
Wolverhampton Homes treats tenants fairly 9%
‘My local area is a place where people get on well together’
7%
Advice and support on Welfare Reforms 7%
Listens to views and acts upon them
Results in this section show that the condition of the home, repairs and maintenance, listening to tenants’
views and acting upon them are the most common drivers of satisfaction amongst the key performance
indicators. If satisfaction with these indicators can be improved, we would expect an improvement in
satisfaction amongst several other indicators.

WOLVERHAMPTON HOMES STAR SURVEY 2012 M·E·L RESEARCH
Measurement ���� Evaluation ���� Learning: Using evidence to shape better services 21
64%
61%
33%
31%
30%
27%
21%
9%
2%
Repairs and maintenance
The overall quality of your
home
Keeping tenants informed
Dealing with anti-social
behaviour
Listening to tenants’
views and acting upon
them
Your neighbourhood as a
place to live
Value for money for your
rent (and service charges)
Support and advice on
claiming welfare benefits
and paying rent
Money advice and help
with budgeting
5) Your service priorities
This section presents tenants’ service priorities.
Tenants were asked to select from a list of nine options, the three services they consider to be the most
important. As the chart below shows, the top service priority for tenants is the repairs and maintenance
service (64%), while the overall quality of home (61%) also has a similar proportion of tenants
considering it to be important. This supports the findings of the key driver analysis that repairs and
maintenance and the home are key influencers of satisfaction. It is worth noting that the repairs and
maintenance service, and the overall quality of home, were also seen as the top two service priorities for
tenants in 2011. The least important service for tenants is money advice and help with budgeting, with only
2% of tenants considering it to be important to them.
Figure 11 Priorities for Wolverhampton Homes tenants…
Percentage of respondents – multiple responses

WOLVERHAMPTON HOMES STAR SURVEY 2012 M·E·L RESEARCH
Measurement ���� Evaluation ���� Learning: Using evidence to shape better services 22
7% 3% 5%
6%7% 7%
36% 37% 37%
30% 32% 28%
21% 21% 23%
Moving home Support for new
tenants
Support for
vulnerable tenants
Very satisfied
Fairly satisfied
Neither
Fairly dissatisfied
Very dissatisfied
Total Satisfaction: 51% 53% 51%
6) Advice and support services
This section presents tenants’ satisfaction with advice and support services. These results exclude
not applicable responses.
Respondents were asked how satisfied they are with the advice and support they receive from
Wolverhampton Homes regarding moving home, support for new tenants, and support for vulnerable
tenants. There is little variation in satisfaction levels for all three aspects with 53% of tenants satisfied with
the advice and support for new tenants, 51% satisfied with the advice and support about moving home, and
51% satisfied with the advice and support for vulnerable tenants. It is worth noting that although satisfaction
levels are low, this can be accounted for by a high proportion of tenants neither satisfied nor dissatisfied
with each aspect - 36% for moving home, and 37% for both support for new tenants and support for
vulnerable tenants.
When we compare results to the 2011 survey, we can see a drop in satisfaction with the support for new
tenants (from 67%) and support for vulnerable tenants (from 58%). However, the proportion of tenants
neither satisfied nor dissatisfied has increased significantly since 2011 (from 24% for new tenants and 30%
for vulnerable tenants), rather than dissatisfaction increasing.
Figure 12 Satisfaction with…
Percentage of applicable respondents
Tenants living in a house are generally less satisfied than tenants living in other property types. Older
tenants and those who have been living in their current property for longer periods of time are less satisfied.
Tenants with a disability are generally more satisfied than those without.
2011 results: 67% support for new tenants 58% support for vulnerable tenants

WOLVERHAMPTON HOMES STAR SURVEY 2012 M·E·L RESEARCH
Measurement ���� Evaluation ���� Learning: Using evidence to shape better services 23
Table 6 Satisfaction with… / length of tenancy in current home
Percentage of applicable respondents
General Satisfaction
Length of tenancy in current home Moving home
Support for new tenants
Support for vulnerable tenants
Less than 1 year 72% 71% 57%
1 to 2 years 61% 51% 50%
3 to 5 years 51% 59% 58%
6 to 10 years 46% 55% 49%
11 to 20 years 38% 39% 41%
21+ years 43% 48% 54%
WOLVERHAMPTON HOMES STAR SURVEY 2012 M·E·L RESEARCH
Measurement ���� Evaluation ���� Learning: Using evidence to shape better services 24
4% 4%5% 7%
19%
46%
32%
27%
40%
17%
Claiming housing benefit and
other welfare benefits
Helping you to manage your
finances, household bills and
debts
Very satisfied
Fairly satisfied
Neither
Fairly dissatisfied
Very dissatisfied
Total Satisfaction: 72% 44%
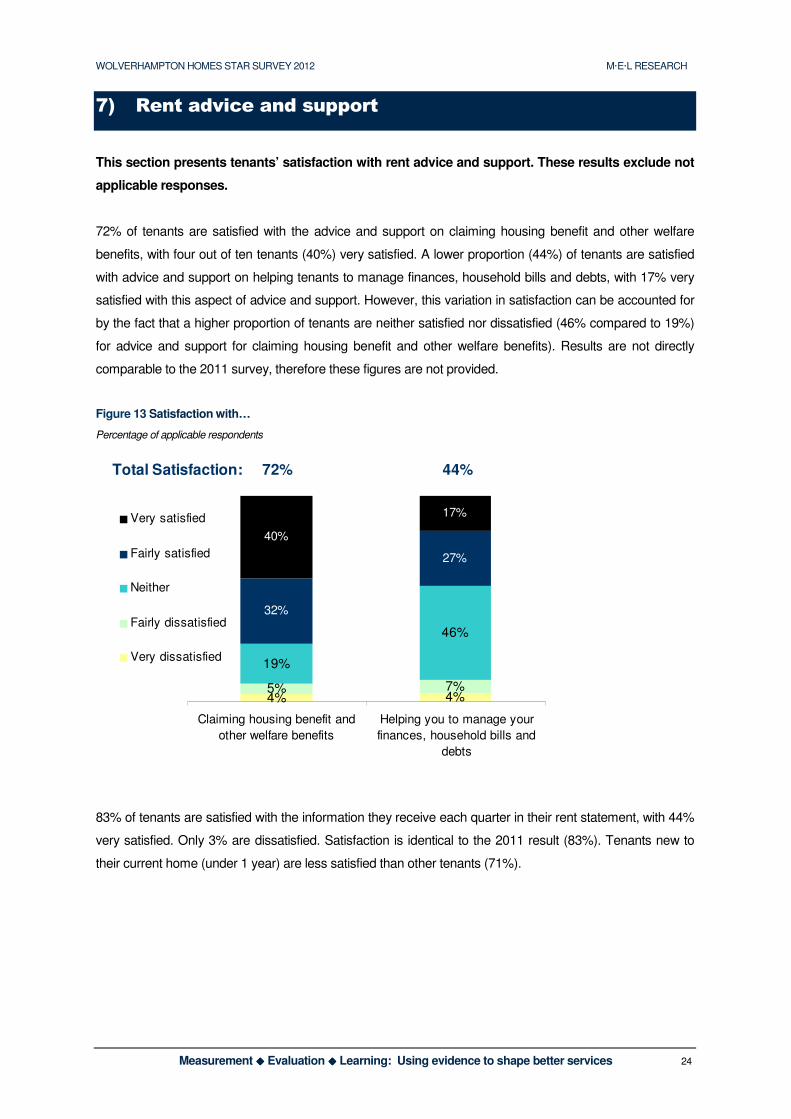
7) Rent advice and support
This section presents tenants’ satisfaction with rent advice and support. These results exclude not
applicable responses.
72% of tenants are satisfied with the advice and support on claiming housing benefit and other welfare
benefits, with four out of ten tenants (40%) very satisfied. A lower proportion (44%) of tenants are satisfied
with advice and support on helping tenants to manage finances, household bills and debts, with 17% very
satisfied with this aspect of advice and support. However, this variation in satisfaction can be accounted for
by the fact that a higher proportion of tenants are neither satisfied nor dissatisfied (46% compared to 19%)
for advice and support for claiming housing benefit and other welfare benefits). Results are not directly
comparable to the 2011 survey, therefore these figures are not provided.
Figure 13 Satisfaction with…
Percentage of applicable respondents
83% of tenants are satisfied with the information they receive each quarter in their rent statement, with 44%
very satisfied. Only 3% are dissatisfied. Satisfaction is identical to the 2011 result (83%). Tenants new to
their current home (under 1 year) are less satisfied than other tenants (71%).

WOLVERHAMPTON HOMES STAR SURVEY 2012 M·E·L RESEARCH
Measurement ���� Evaluation ���� Learning: Using evidence to shape better services 25
44%
38%
15%
1%
2%
Very satisfied
Fairly satisfied
Neither
Fairly dissatisfied
Very dissatisfied
83%
Satisfaction
Figure 14 Satisfaction with information received each quarter in rent statement
Percentage of applicable respondents
Taking everything into account, around three quarters (74%) of tenants are satisfied with the service
provided by Wolverhampton Homes in relation to their rent and service charges, with around a quarter of
tenants very satisfied (28%). Only 8% of tenants are dissatisfied. Satisfaction is slightly lower than 2011
(79%). Tenants new to their current home (under 1 year) and tenants aged 35-44 are less satisfied than
other tenants (62% each).
Figure 15 Satisfaction with the service provided by Wolverhampton Homes in relation to your rent and service charges
Percentage of respondents
28%
46%
18%
7%
1%
Very satisfied
Fairly satisfied
Neither
Fairly
dissatisfied
Very dissatisfied
74%
Satisfaction
Results in this section are generally positive, with high levels of satisfaction for the information received
each quarter in the rent statement (83%) and 74% satisfied with the service in relation to rent and service
charges. Satisfaction is lowest for the advice and support in helping tenants to manage their finances,
household bills and debts (44%), although there are a high proportion of tenants who are neither satisfied
nor dissatisfied (46%).
Tenants 2011 = 83%
Tenants 2011 = 79%

WOLVERHAMPTON HOMES STAR SURVEY 2012 M·E·L RESEARCH
Measurement ���� Evaluation ���� Learning: Using evidence to shape better services 26
53%
19%
28%
Yes
No
Unsure
Affected
by
Welfare
Reforms
8) Welfare Reforms
This section presents findings on tenants understanding of the Welfare Reforms.
Respondents who receive welfare benefits, housing benefits, tax credits or a state pension, were asked
how much they know about the Government’s new Welfare Reforms. Only 4% said that they know a lot
about the Government’s new Welfare Reforms. 10% said they know quite a lot, 44% have heard about it,
whilst 42% said that they do not know anything about it. A higher proportion of tenants new to their property
i.e. less than 1 year in their current home (55%) and younger tenants i.e. 16-24s (52%) do not know about
the reforms.
Figure 16 How much do you know about the Government’s new Welfare Reforms?
Percentage of respondent who receive welfare benefits, housing benefits, tax credits or state pension
4%
10%
44%
42%
I know a lot
I know quite a lot
I have heard about
it
I don't know
anything about it
19% of tenants who receive welfare benefits, housing benefits, tax credits or a state pension, feel that they
are going to be affected by the Welfare Reforms. 28% feel that they are not going to be affected, while just
over half (53%) are unsure whether they are going to be affected by the Welfare Reforms.
Figure 17 Affected by Welfare Reforms
Percentage of respondent who receive welfare benefits, housing benefits, tax credits or state pension

WOLVERHAMPTON HOMES STAR SURVEY 2012 M·E·L RESEARCH
Measurement ���� Evaluation ���� Learning: Using evidence to shape better services 27
36%
64%
Yes
No
Contact
regarding
Welfare
Reforms
Only 42% of tenants are satisfied with the advice and support they receive from Wolverhampton Homes
regarding Welfare Reforms. However, it is worth noting that half (49%) are neither satisfied nor dissatisfied.
A higher proportion of tenants new to their homes i.e. less than 1 year in their current home (32%) and the
35-44 age group (31%) are less satisfied than their counterparts.
Figure 18 Satisfaction with the advice and support recevied from Wolverhampton Homes regarding Welfare Reforms
Percentage of respondent who receive welfare benefits, housing benefits, tax credits or state pension
13%
29%
49%
6%
3%
Very satisfied
Fairly satisfied
Neither
Fairly dissatisfied
Very dissatisfied
42%
Satisfaction
Respondents were asked if they wanted Wolverhampton Homes to contact them about the Welfare
Reforms. Around 36% said that they want to be contacted.
Figure 19 Do you want Wolverhampton Homes to contact you about the Welfare Reforms
Percentage of respondent who receive welfare benefits, housing benefits, tax credits or state pension
Results in this section show that there is a knowledge gap, with a high proportion not knowing anything
about the reforms (42%) and 53% unsure if they will be affected. Further work needs to be done to help
these tenants understand the reforms and determine whether they will be affected, otherwise there could
potentially be serious consequences for many tenants.
WOLVERHAMPTON HOMES STAR SURVEY 2012 M·E·L RESEARCH
Measurement ���� Evaluation ���� Learning: Using evidence to shape better services 28
9) Your neighbourhood
This section sets out how Wolverhampton Homes’ tenants feel about their neighbourhood.
Neighbourhood problems
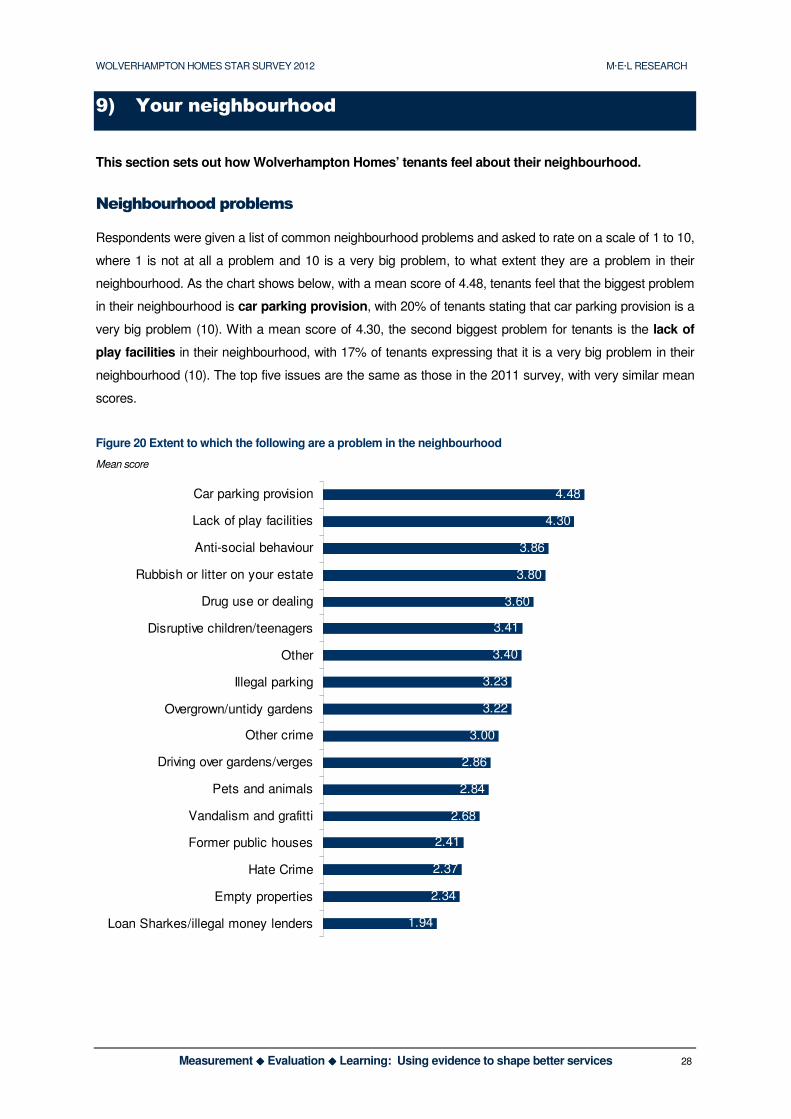
Respondents were given a list of common neighbourhood problems and asked to rate on a scale of 1 to 10,
where 1 is not at all a problem and 10 is a very big problem, to what extent they are a problem in their
neighbourhood. As the chart shows below, with a mean score of 4.48, tenants feel that the biggest problem
in their neighbourhood is car parking provision, with 20% of tenants stating that car parking provision is a
very big problem (10). With a mean score of 4.30, the second biggest problem for tenants is the lack of
play facilities in their neighbourhood, with 17% of tenants expressing that it is a very big problem in their
neighbourhood (10). The top five issues are the same as those in the 2011 survey, with very similar mean
scores.
Figure 20 Extent to which the following are a problem in the neighbourhood
Mean score
4.48
4.30
3.86
3.80
3.60
3.41
3.40
3.23
3.22
3.00
2.86
2.84
2.68
2.41
2.37
2.34
1.94
Car parking provision
Lack of play facilities
Anti-social behaviour
Rubbish or litter on your estate
Drug use or dealing
Disruptive children/teenagers
Other
Illegal parking
Overgrown/untidy gardens
Other crime
Driving over gardens/verges
Pets and animals
Vandalism and grafitti
Former public houses
Hate Crime
Empty properties
Loan Sharkes/illegal money lenders
WOLVERHAMPTON HOMES STAR SURVEY 2012 M·E·L RESEARCH
Measurement ���� Evaluation ���� Learning: Using evidence to shape better services 29
Has the neighbourhood improved or declined?
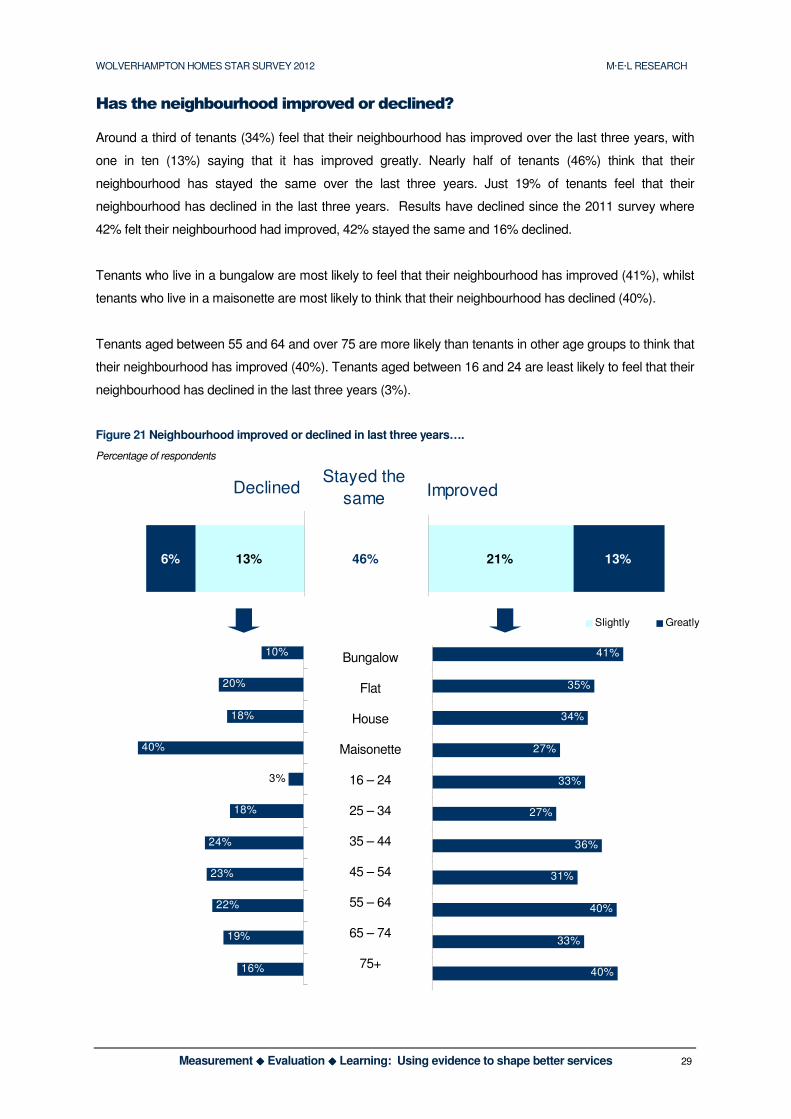
Around a third of tenants (34%) feel that their neighbourhood has improved over the last three years, with
one in ten (13%) saying that it has improved greatly. Nearly half of tenants (46%) think that their
neighbourhood has stayed the same over the last three years. Just 19% of tenants feel that their
neighbourhood has declined in the last three years. Results have declined since the 2011 survey where
42% felt their neighbourhood had improved, 42% stayed the same and 16% declined.
Tenants who live in a bungalow are most likely to feel that their neighbourhood has improved (41%), whilst
tenants who live in a maisonette are most likely to think that their neighbourhood has declined (40%).
Tenants aged between 55 and 64 and over 75 are more likely than tenants in other age groups to think that
their neighbourhood has improved (40%). Tenants aged between 16 and 24 are least likely to feel that their
neighbourhood has declined in the last three years (3%).
Figure 21 Neighbourhood improved or declined in last three years….
Percentage of respondents
21% 13%1
Slightly Greatly
13%6% 1
Stayed the
sameDeclined
46%
Improved
41%
35%
34%
27%
33%
27%
36%
31%
40%
40%
33%
Bungalow
Flat
House
Maisonette
16 to 24
25 to 34
35 to 44
45 to 54
55 to 64
65 to 74
75+
10%
20%
18%
40%
18%
24%
23%
22%
3%
16%
19%
Bungalow
Flat
House
Maisonette
16 to 24
25 to 34
35 to 44
45 to 54
55 to 64
65 to 74
75 to 99
Bungalow
Flat
House
Maisonette
16 – 24
25 – 34
35 – 44
45 – 54
55 – 64
65 – 74
75+
WOLVERHAMPTON HOMES STAR SURVEY 2012 M·E·L RESEARCH
Measurement ���� Evaluation ���� Learning: Using evidence to shape better services 30
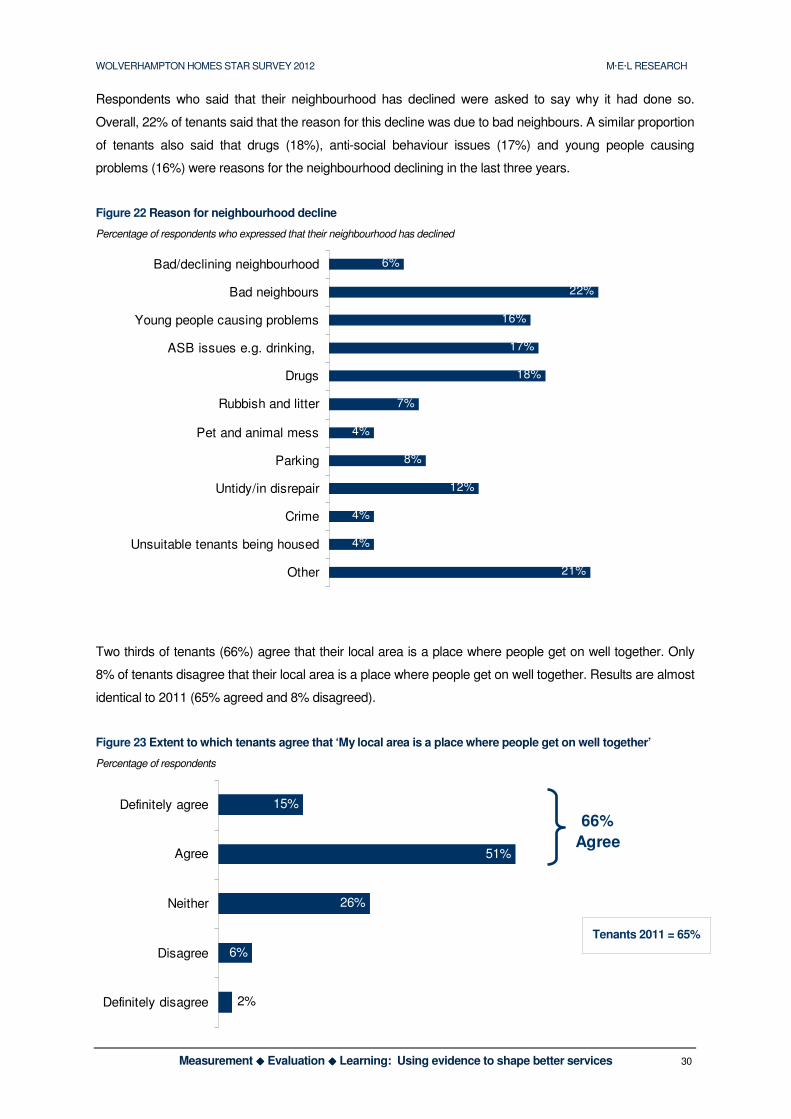
Respondents who said that their neighbourhood has declined were asked to say why it had done so.
Overall, 22% of tenants said that the reason for this decline was due to bad neighbours. A similar proportion
of tenants also said that drugs (18%), anti-social behaviour issues (17%) and young people causing
problems (16%) were reasons for the neighbourhood declining in the last three years.
Figure 22 Reason for neighbourhood decline
Percentage of respondents who expressed that their neighbourhood has declined
6%
22%
16%
17%
18%
7%
4%
8%
12%
4%
4%
21%
Bad/declining neighbourhood
Bad neighbours
Young people causing problems
ASB issues e.g. drinking,
Drugs
Rubbish and litter
Pet and animal mess
Parking
Untidy/in disrepair
Crime
Unsuitable tenants being housed
Other
Two thirds of tenants (66%) agree that their local area is a place where people get on well together. Only
8% of tenants disagree that their local area is a place where people get on well together. Results are almost
identical to 2011 (65% agreed and 8% disagreed).
Figure 23 Extent to which tenants agree that ‘My local area is a place where people get on well together’
Percentage of respondents
15%
51%
26%
6%
2%
Definitely agree
Agree
Neither
Disagree
Definitely disagree
66%
Agree
Tenants 2011 = 65%
WOLVERHAMPTON HOMES STAR SURVEY 2012 M·E·L RESEARCH
Measurement ���� Evaluation ���� Learning: Using evidence to shape better services 31
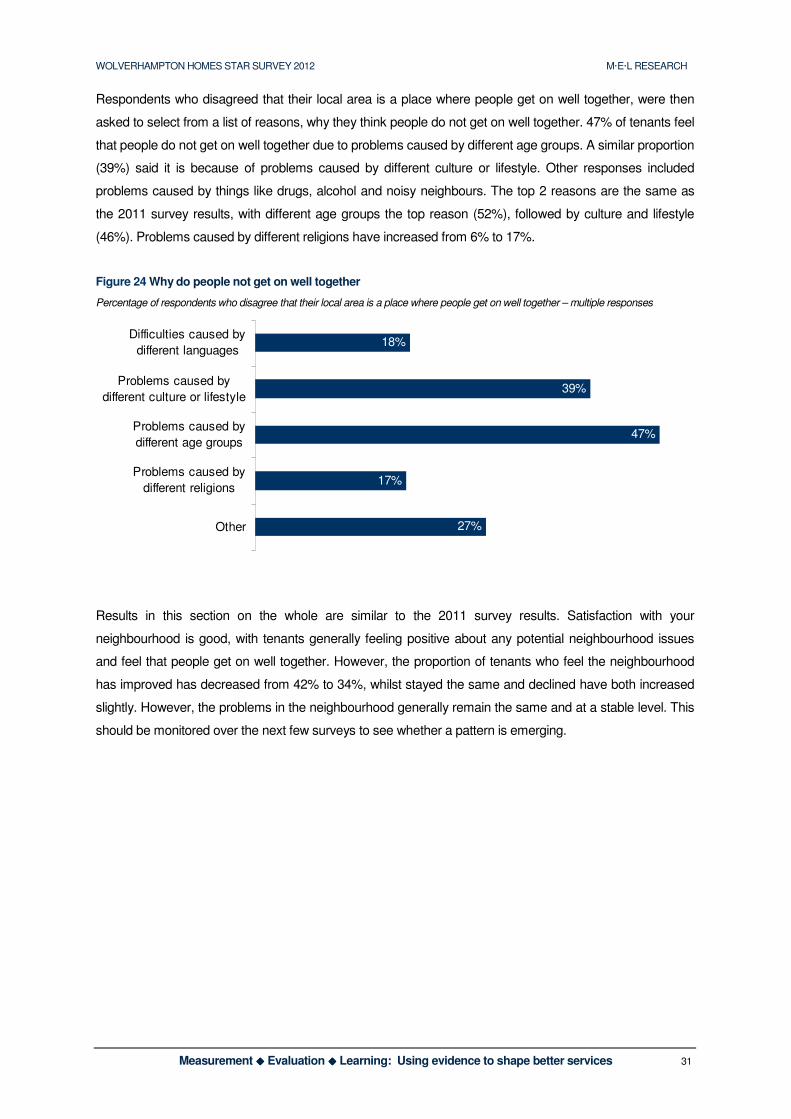
Respondents who disagreed that their local area is a place where people get on well together, were then
asked to select from a list of reasons, why they think people do not get on well together. 47% of tenants feel
that people do not get on well together due to problems caused by different age groups. A similar proportion
(39%) said it is because of problems caused by different culture or lifestyle. Other responses included
problems caused by things like drugs, alcohol and noisy neighbours. The top 2 reasons are the same as
the 2011 survey results, with different age groups the top reason (52%), followed by culture and lifestyle
(46%). Problems caused by different religions have increased from 6% to 17%.
Figure 24 Why do people not get on well together
Percentage of respondents who disagree that their local area is a place where people get on well together – multiple responses
18%
39%
47%
17%
27%
Difficulties caused by
different languages
Problems caused by
different culture or lifestyle
Problems caused by
different age groups
Problems caused by
different religions
Other
Results in this section on the whole are similar to the 2011 survey results. Satisfaction with your
neighbourhood is good, with tenants generally feeling positive about any potential neighbourhood issues
and feel that people get on well together. However, the proportion of tenants who feel the neighbourhood
has improved has decreased from 42% to 34%, whilst stayed the same and declined have both increased
slightly. However, the problems in the neighbourhood generally remain the same and at a stable level. This
should be monitored over the next few surveys to see whether a pattern is emerging.
WOLVERHAMPTON HOMES STAR SURVEY 2012 M·E·L RESEARCH
Measurement ���� Evaluation ���� Learning: Using evidence to shape better services 32
45%
55%
Yes
No
Contacted
Wolverhampton
Homes in the
last 12 months
4%
2%
2%
0%
1%
0%
1%
2%
80%
7%
Phoned Homes Direct
Phoned the direct number of the person
required
Visited One Stop Shop
Wrote
Emailed
Facebook/Twitter
Feedback sheet from Tenants Update
Open meetings / get togethers
Can't remember
Other
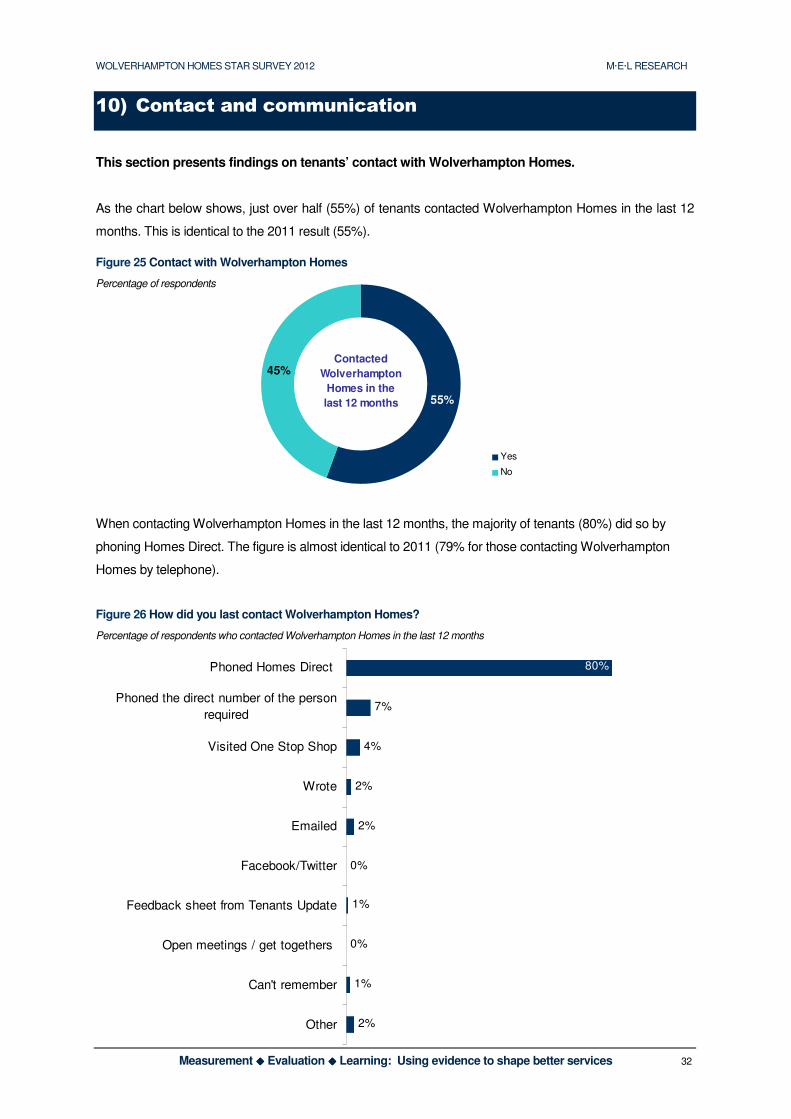
10) Contact and communication
This section presents findings on tenants’ contact with Wolverhampton Homes.
As the chart below shows, just over half (55%) of tenants contacted Wolverhampton Homes in the last 12
months. This is identical to the 2011 result (55%).
Figure 25 Contact with Wolverhampton Homes
Percentage of respondents
When contacting Wolverhampton Homes in the last 12 months, the majority of tenants (80%) did so by
phoning Homes Direct. The figure is almost identical to 2011 (79% for those contacting Wolverhampton
Homes by telephone).
Figure 26 How did you last contact Wolverhampton Homes?
Percentage of respondents who contacted Wolverhampton Homes in the last 12 months
WOLVERHAMPTON HOMES STAR SURVEY 2012 M·E·L RESEARCH
Measurement ���� Evaluation ���� Learning: Using evidence to shape better services 33
Throughout this section we refer to the 2011 results. It should be taken into account that the 2011 survey
asked tenants whether they contacted Wolverhampton homes by telephone, whereas the 2012 survey
asked whether they made contact via the Homes Direct number or a direct telephone number. Throughout
this section for 2012, we provide figures for the Homes Direct results as well separately, as these are key
indicators for Wolverhampton Homes.
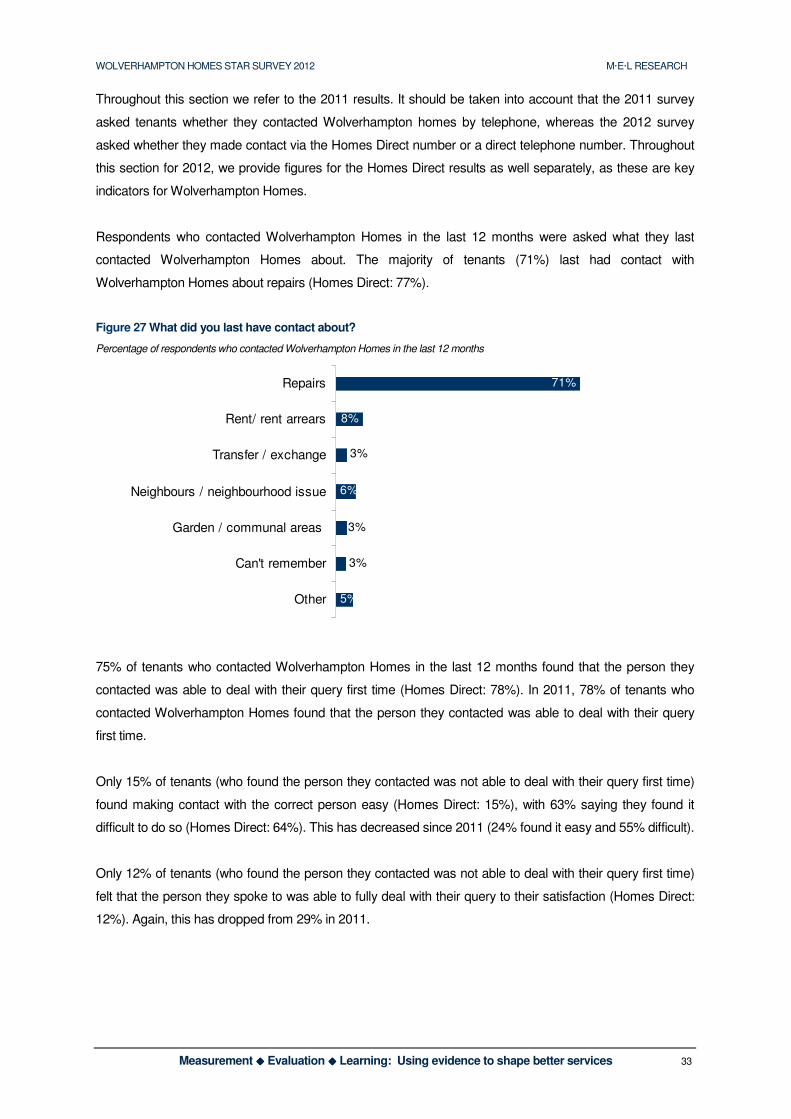
Respondents who contacted Wolverhampton Homes in the last 12 months were asked what they last
contacted Wolverhampton Homes about. The majority of tenants (71%) last had contact with
Wolverhampton Homes about repairs (Homes Direct: 77%).
Figure 27 What did you last have contact about?
Percentage of respondents who contacted Wolverhampton Homes in the last 12 months
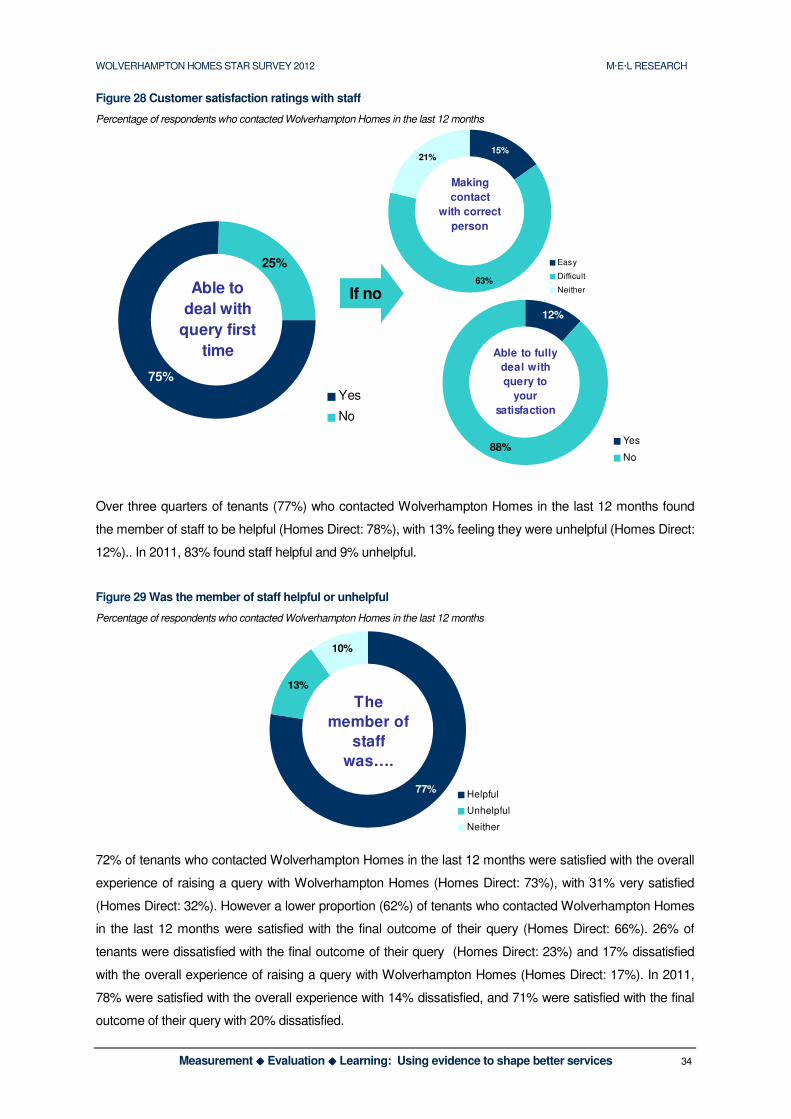
75% of tenants who contacted Wolverhampton Homes in the last 12 months found that the person they
contacted was able to deal with their query first time (Homes Direct: 78%). In 2011, 78% of tenants who
contacted Wolverhampton Homes found that the person they contacted was able to deal with their query
first time.
Only 15% of tenants (who found the person they contacted was not able to deal with their query first time)
found making contact with the correct person easy (Homes Direct: 15%), with 63% saying they found it
difficult to do so (Homes Direct: 64%). This has decreased since 2011 (24% found it easy and 55% difficult).
Only 12% of tenants (who found the person they contacted was not able to deal with their query first time)
felt that the person they spoke to was able to fully deal with their query to their satisfaction (Homes Direct:
12%). Again, this has dropped from 29% in 2011.
71%
8%
6%
5%
3%
3%
3%
Repairs
Rent/ rent arrears
Transfer / exchange
Neighbours / neighbourhood issue
Garden / communal areas
Can't remember
Other
WOLVERHAMPTON HOMES STAR SURVEY 2012 M·E·L RESEARCH
Measurement ���� Evaluation ���� Learning: Using evidence to shape better services 34
75%
25%
Yes
No
Able to
deal with
query first
time
21%
63%
15%
Easy
Difficult
Neither
Making
contact
with correct
person
12%
88%Yes
No
Able to fully
deal with
query to
your
satisfaction
10%
77%
13%
Helpful
Unhelpful
Neither
The
member of
staff
was….
Figure 28 Customer satisfaction ratings with staff
Percentage of respondents who contacted Wolverhampton Homes in the last 12 months
Over three quarters of tenants (77%) who contacted Wolverhampton Homes in the last 12 months found
the member of staff to be helpful (Homes Direct: 78%), with 13% feeling they were unhelpful (Homes Direct:
12%).. In 2011, 83% found staff helpful and 9% unhelpful.
Figure 29 Was the member of staff helpful or unhelpful
Percentage of respondents who contacted Wolverhampton Homes in the last 12 months
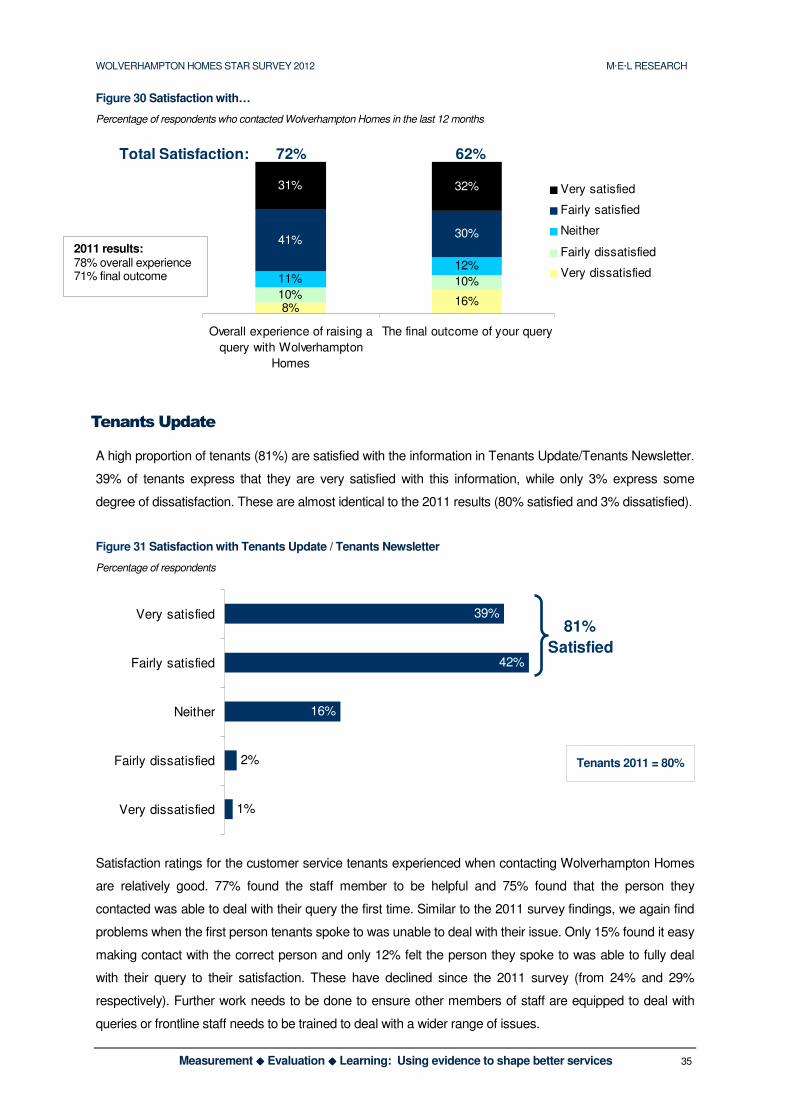
72% of tenants who contacted Wolverhampton Homes in the last 12 months were satisfied with the overall
experience of raising a query with Wolverhampton Homes (Homes Direct: 73%), with 31% very satisfied
(Homes Direct: 32%). However a lower proportion (62%) of tenants who contacted Wolverhampton Homes
in the last 12 months were satisfied with the final outcome of their query (Homes Direct: 66%). 26% of
tenants were dissatisfied with the final outcome of their query (Homes Direct: 23%) and 17% dissatisfied
with the overall experience of raising a query with Wolverhampton Homes (Homes Direct: 17%). In 2011,
78% were satisfied with the overall experience with 14% dissatisfied, and 71% were satisfied with the final
outcome of their query with 20% dissatisfied.
If no
WOLVERHAMPTON HOMES STAR SURVEY 2012 M·E·L RESEARCH
Measurement ���� Evaluation ���� Learning: Using evidence to shape better services 35
8%16%
10%10%11%12%
41%30%
31% 32%
Overall experience of raising a
query with Wolverhampton
Homes
The final outcome of your query
Very satisfied
Fairly satisfied
Neither
Fairly dissatisfied
Very dissatisfied
Total Satisfaction: 72% 62%
Figure 30 Satisfaction with…
Percentage of respondents who contacted Wolverhampton Homes in the last 12 months
Tenants Update
A high proportion of tenants (81%) are satisfied with the information in Tenants Update/Tenants Newsletter.
39% of tenants express that they are very satisfied with this information, while only 3% express some
degree of dissatisfaction. These are almost identical to the 2011 results (80% satisfied and 3% dissatisfied).
Figure 31 Satisfaction with Tenants Update / Tenants Newsletter
Percentage of respondents
39%
42%
16%
2%
1%
Very satisfied
Fairly satisfied
Neither
Fairly dissatisfied
Very dissatisfied
81%
Satisfied
Satisfaction ratings for the customer service tenants experienced when contacting Wolverhampton Homes
are relatively good. 77% found the staff member to be helpful and 75% found that the person they
contacted was able to deal with their query the first time. Similar to the 2011 survey findings, we again find
problems when the first person tenants spoke to was unable to deal with their issue. Only 15% found it easy
making contact with the correct person and only 12% felt the person they spoke to was able to fully deal
with their query to their satisfaction. These have declined since the 2011 survey (from 24% and 29%
respectively). Further work needs to be done to ensure other members of staff are equipped to deal with
queries or frontline staff needs to be trained to deal with a wider range of issues.
2011 results: 78% overall experience 71% final outcome
Tenants 2011 = 80%

WOLVERHAMPTON HOMES STAR SURVEY 2012 M·E·L RESEARCH
Measurement ���� Evaluation ���� Learning: Using evidence to shape better services 36
11) Keeping you informed and tenant involvement
This section presents tenants opinions about being kept informed and tenant involvement
Around three quarters (77%) of tenants feel that Wolverhampton Homes are good at keeping tenants
informed about things that might affect them as a tenant, with around three out of ten (29%) saying they are
very good. Only 5% of tenants feel that Wolverhampton Homes are poor at keeping tenants informed.
Results are similar to the 2011 survey (79% good and 6% poor).
Figure 32 How good or poor is Wolverhampton Homes at keeping tenants informed about things that might affect them as a tenant?
Percentage of respondents
29%
49%
17%
3%
2%
Very good
Fairly good
Neither
Fairly poor
Very poor
77%
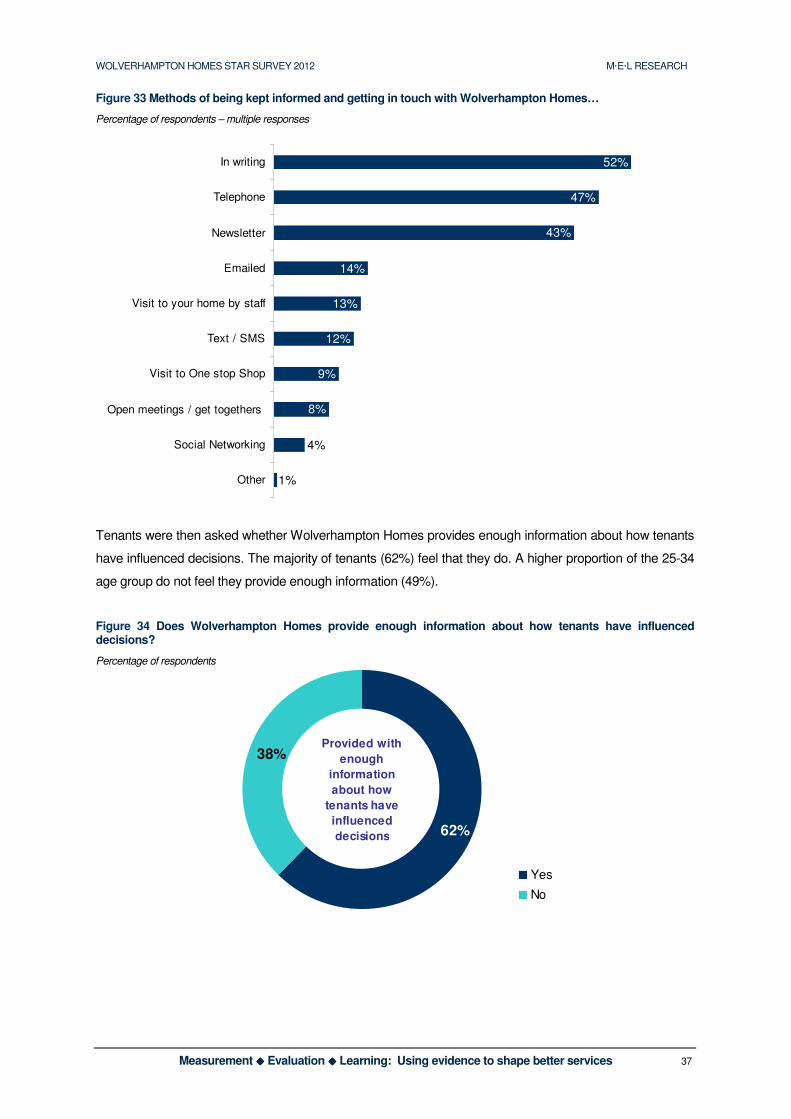
Respondents were asked to choose from a list of 10 options, which methods of being kept informed and
getting in touch with Wolverhampton Homes they are happy to use. As Figure 33 shows, just over half of
tenants (52%) are happy to be kept informed and get in touch with Wolverhampton Homes in writing.
Similar proportions are happy to use the telephone (47%) and receive a newsletter (43%). The 2011
survey results showed that 55% were happy to be kept informed by telephone and 55% also in writing. The
proportion who prefer email is relatively similar (16% in 2011)
Tenants 2011 = 79%
WOLVERHAMPTON HOMES STAR SURVEY 2012 M·E·L RESEARCH
Measurement ���� Evaluation ���� Learning: Using evidence to shape better services 37
38%
62%
Yes
No
Provided with
enough
information
about how
tenants have
influenced
decisions
52%
47%
43%
14%
13%
12%
9%
8%
1%
4%
In writing
Telephone
Newsletter
Emailed
Visit to your home by staff
Text / SMS
Visit to One stop Shop
Open meetings / get togethers
Social Networking
Other
Figure 33 Methods of being kept informed and getting in touch with Wolverhampton Homes…
Percentage of respondents – multiple responses
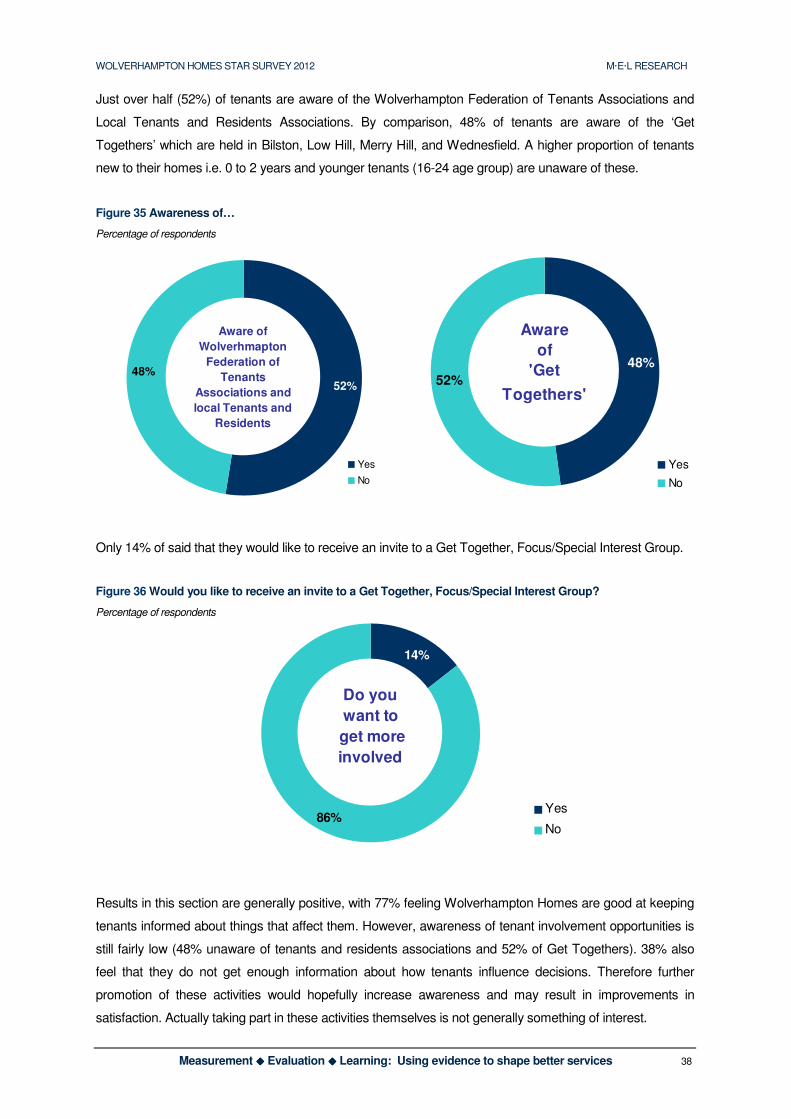
Tenants were then asked whether Wolverhampton Homes provides enough information about how tenants
have influenced decisions. The majority of tenants (62%) feel that they do. A higher proportion of the 25-34
age group do not feel they provide enough information (49%).
Figure 34 Does Wolverhampton Homes provide enough information about how tenants have influenced decisions?
Percentage of respondents
WOLVERHAMPTON HOMES STAR SURVEY 2012 M·E·L RESEARCH
Measurement ���� Evaluation ���� Learning: Using evidence to shape better services 38
48%
52%
Yes
No
Aware of
Wolverhmapton
Federation of
Tenants
Associations and
local Tenants and
Residents
48%
52%
Yes
No
Aware
of
'Get
Togethers'
86%
14%
Yes
No
Do you
want to
get more
involved
Just over half (52%) of tenants are aware of the Wolverhampton Federation of Tenants Associations and
Local Tenants and Residents Associations. By comparison, 48% of tenants are aware of the ‘Get
Togethers’ which are held in Bilston, Low Hill, Merry Hill, and Wednesfield. A higher proportion of tenants
new to their homes i.e. 0 to 2 years and younger tenants (16-24 age group) are unaware of these.
Figure 35 Awareness of…
Percentage of respondents
Only 14% of said that they would like to receive an invite to a Get Together, Focus/Special Interest Group.
Figure 36 Would you like to receive an invite to a Get Together, Focus/Special Interest Group?
Percentage of respondents
Results in this section are generally positive, with 77% feeling Wolverhampton Homes are good at keeping
tenants informed about things that affect them. However, awareness of tenant involvement opportunities is
still fairly low (48% unaware of tenants and residents associations and 52% of Get Togethers). 38% also
feel that they do not get enough information about how tenants influence decisions. Therefore further
promotion of these activities would hopefully increase awareness and may result in improvements in
satisfaction. Actually taking part in these activities themselves is not generally something of interest.

WOLVERHAMPTON HOMES STAR SURVEY 2012 M·E·L RESEARCH
Measurement ���� Evaluation ���� Learning: Using evidence to shape better services 39
22%
44%
57%
61%
63%
77%
77%
55%
42%
21%
7%
Bungalow
Flat
House
Maisonette
16 - 24
25 - 34
35 - 44
45 - 54
55 - 64
65 - 74
75+
12) Using the internet
This section presents tenants internet usage.
As the chart below shows, 50% of tenants have access to the internet. There is a high degree of variation in
the proportion of tenants who have internet access depending on the property type. 22% of tenants living in
a bungalow, and 61% of tenants living in a maisonette, have access to the internet. When analysing the
results by age it shows, at 77%, tenants aged between 25 and 44 are more likely than tenants in other age
groups to have access to the internet. Results are relatively similar to the 2011 survey, where 45% said
they have access.
Figure 37 Access to the internet
Percentage of respondents
Yes No
50%
50%

WOLVERHAMPTON HOMES STAR SURVEY 2012 M·E·L RESEARCH
Measurement ���� Evaluation ���� Learning: Using evidence to shape better services 40
Tenants who have access to the internet were asked which devices they use to connect to the internet. The
majority (92%) of tenants connect to the internet using a PC, Laptop, or tablet. 29% of tenants connect to
the internet using a smart phone, while 17% use a Digital TV to connect to the internet. In the 2011
survey, 94% said they use a PC/Laptop/Tablet, whilst 18% used a smartphone which has since increased.
Figure 38 Device used to access the internet
Percentage of respondents who have access to the internet – multiple responses
92%
17%
29%
PC / Laptop /
tablet
Digital TV
Smartphone
90% of tenants connect to the internet using their own internet connection. By comparison only; 10% use
their family or friends internet connection, 8% use a community centre/ library / other public internet
connection, and 3% use a work connection. Results are almost identical to the 2011 survey.
Figure 39 Connection used to go online
Percentage of respondents who have access to the internet – multiple responses
90%
10%
8%
3%
My own internet
connection
Family / friends
internet connect
Community centre /
library / other public
internet connection
Work connection
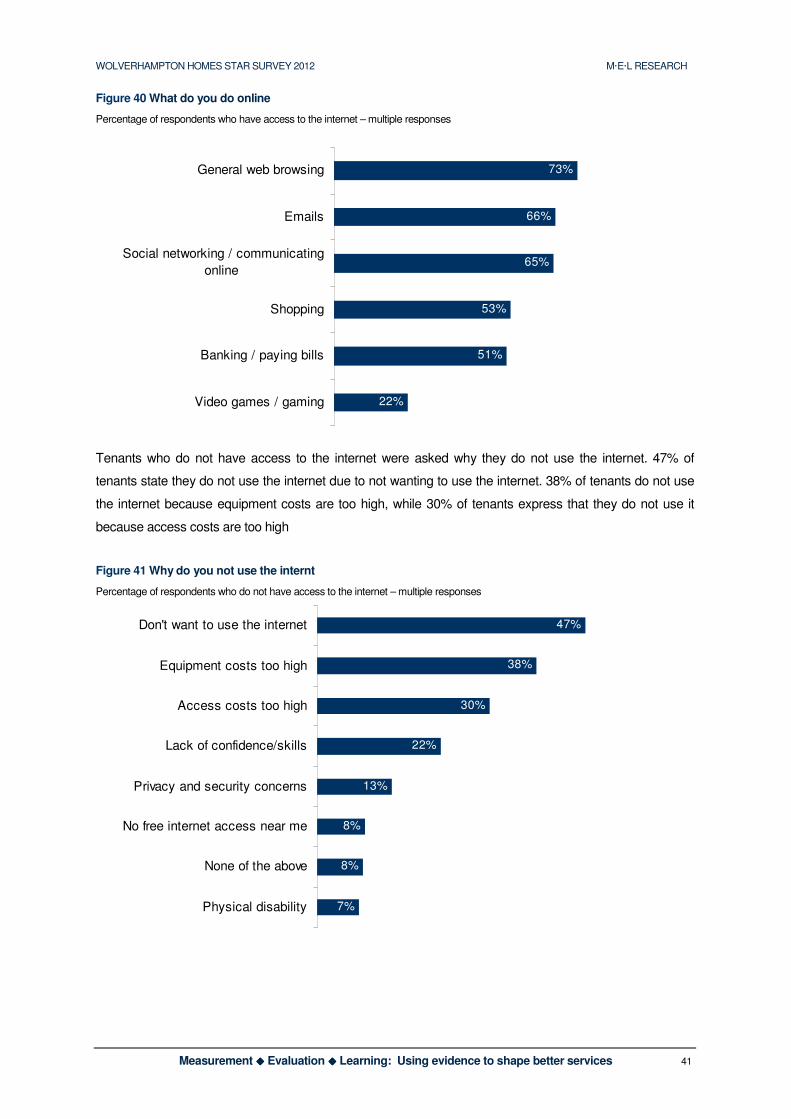
As Figure 40 overleaf shows, 73% of tenants who have access to the internet use it for general web
browsing, 66% of tenants who have access to the internet use it for emails, and a similar proportion (65%)
use it for social networking / communicating online. Results are almost identical to the 2011 survey.
WOLVERHAMPTON HOMES STAR SURVEY 2012 M·E·L RESEARCH
Measurement ���� Evaluation ���� Learning: Using evidence to shape better services 41
47%
38%
30%
22%
13%
8%
8%
7%
Don't want to use the internet
Equipment costs too high
Access costs too high
Lack of confidence/skills
Privacy and security concerns
No free internet access near me
None of the above
Physical disability
73%
66%
65%
53%
51%
22%
General web browsing
Emails
Social networking / communicating
online
Shopping
Banking / paying bills
Video games / gaming
Figure 40 What do you do online
Percentage of respondents who have access to the internet – multiple responses
Tenants who do not have access to the internet were asked why they do not use the internet. 47% of
tenants state they do not use the internet due to not wanting to use the internet. 38% of tenants do not use
the internet because equipment costs are too high, while 30% of tenants express that they do not use it
because access costs are too high
Figure 41 Why do you not use the internt
Percentage of respondents who do not have access to the internet – multiple responses
WOLVERHAMPTON HOMES STAR SURVEY 2012 M·E·L RESEARCH
Measurement ���� Evaluation ���� Learning: Using evidence to shape better services 42
93% 95%90%
Tradesperson show proof of
identity
Gas servicing appointment kept Tradesperson explain what
would happen
6%
7%
6%
6%
25%
27%
28%
27%
65%
65%
63%
64%
Being told when the
tradesperson would call
The attitude of the
tradesperson
Keeping dirt and mess to
a minimum
With gas servicing
arrangements in general
Very dissatisfied Fairly dissatisfied Neither Fairly satisfied Very sastisfied
Total
90%
92%
91%
91%
13) Gas Servicing
This section sets out how tenants who have an annual Gas Service feel about it
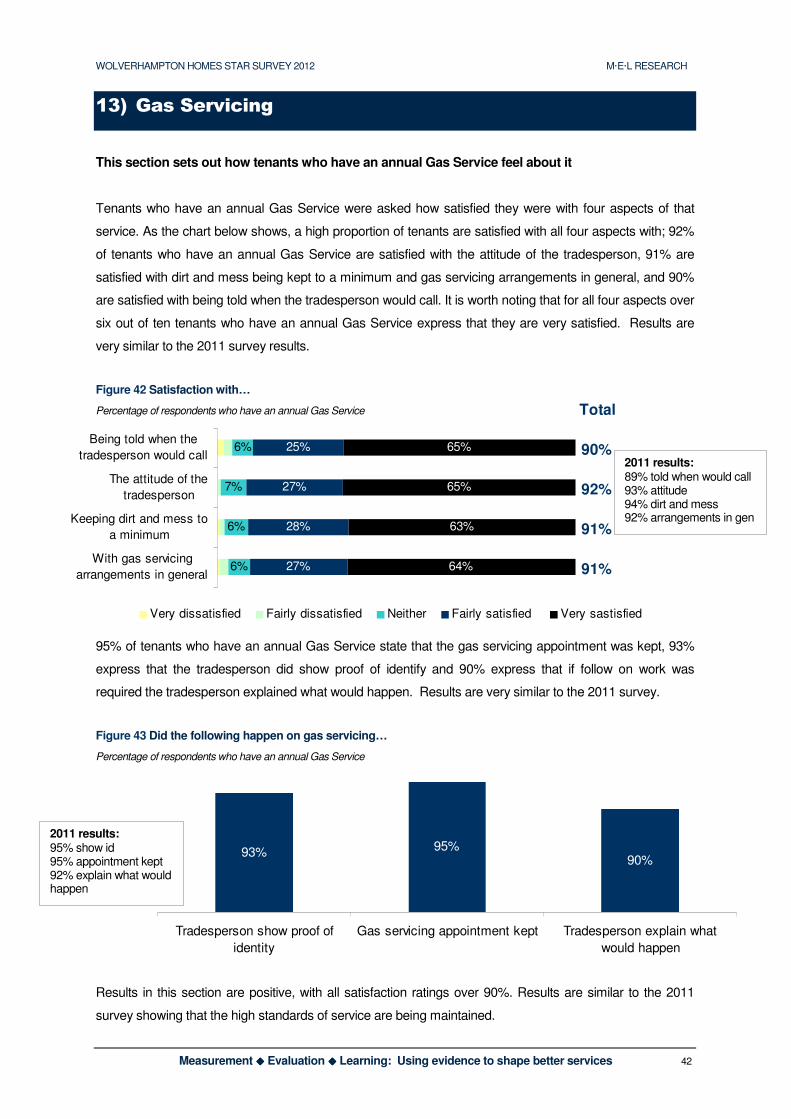
Tenants who have an annual Gas Service were asked how satisfied they were with four aspects of that
service. As the chart below shows, a high proportion of tenants are satisfied with all four aspects with; 92%
of tenants who have an annual Gas Service are satisfied with the attitude of the tradesperson, 91% are
satisfied with dirt and mess being kept to a minimum and gas servicing arrangements in general, and 90%
are satisfied with being told when the tradesperson would call. It is worth noting that for all four aspects over
six out of ten tenants who have an annual Gas Service express that they are very satisfied. Results are
very similar to the 2011 survey results.
Figure 42 Satisfaction with…
Percentage of respondents who have an annual Gas Service
95% of tenants who have an annual Gas Service state that the gas servicing appointment was kept, 93%
express that the tradesperson did show proof of identify and 90% express that if follow on work was
required the tradesperson explained what would happen. Results are very similar to the 2011 survey.
Figure 43 Did the following happen on gas servicing…
Percentage of respondents who have an annual Gas Service
Results in this section are positive, with all satisfaction ratings over 90%. Results are similar to the 2011
survey showing that the high standards of service are being maintained.
2011 results: 89% told when would call 93% attitude 94% dirt and mess 92% arrangements in gen
2011 results: 95% show id 95% appointment kept 92% explain what would happen
WOLVERHAMPTON HOMES STAR SURVEY 2012 M·E·L RESEARCH
Measurement ���� Evaluation ���� Learning: Using evidence to shape better services 43
14) Estate Services
This section sets out tenants who live in a flat, maisonette or bedsit satisfaction with the estate
services. Please note the 2011 STAR survey did not filter out anyone who perceived themselves to
receive estate services (for example tenants who live in houses).
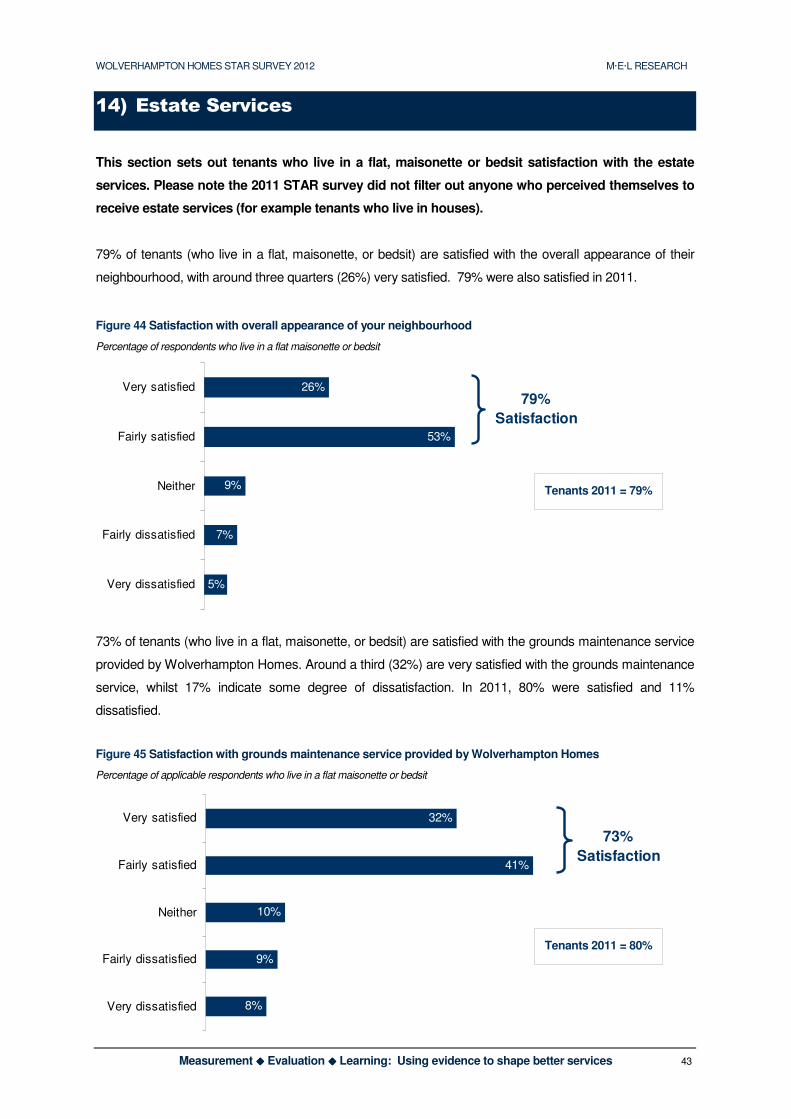
79% of tenants (who live in a flat, maisonette, or bedsit) are satisfied with the overall appearance of their
neighbourhood, with around three quarters (26%) very satisfied. 79% were also satisfied in 2011.
Figure 44 Satisfaction with overall appearance of your neighbourhood
Percentage of respondents who live in a flat maisonette or bedsit
26%
53%
9%
7%
5%
Very satisfied
Fairly satisfied
Neither
Fairly dissatisfied
Very dissatisfied
79%
Satisfaction
73% of tenants (who live in a flat, maisonette, or bedsit) are satisfied with the grounds maintenance service
provided by Wolverhampton Homes. Around a third (32%) are very satisfied with the grounds maintenance
service, whilst 17% indicate some degree of dissatisfaction. In 2011, 80% were satisfied and 11%
dissatisfied.
Figure 45 Satisfaction with grounds maintenance service provided by Wolverhampton Homes
Percentage of applicable respondents who live in a flat maisonette or bedsit
32%
41%
10%
9%
8%
Very satisfied
Fairly satisfied
Neither
Fairly dissatisfied
Very dissatisfied
73%
Satisfaction
Tenants 2011 = 79%
Tenants 2011 = 80%

WOLVERHAMPTON HOMES STAR SURVEY 2012 M·E·L RESEARCH
Measurement ���� Evaluation ���� Learning: Using evidence to shape better services 44
74% of tenants (who live in a flat, maisonette, or bedsit) are satisfied with the cleaning of internal communal
areas, with 39% very satisfied. A smaller proportion (68%) of tenants are satisfied with the cleaning of
external communal areas. Results are relatively similar to the 2011 survey (73% and 71% respectively).
Figure 46 Satisfaction with the cleaning of…
Percentage of applicable respondents who live in a flat maisonette or bedsit
8% 12%8% 6%
11% 14%
35%37%
38% 31%
Internal communal areas External communal areas
Very satisfied
Fairly satisfied
Neither
Fairly dissatisfied
Very dissatisfied
Total Satisfaction: 74% 68%
72% of tenants (who live in a flat, maisonette, or bedsit) are satisfied with the overall estate services
provided by Wolverhampton Homes. 28% are very satisfied. Results have dropped slightly since the 2011
survey when 78% were satisfied and 7% dissatisfied.
Figure 47 Satisfaction with the overall estate services provided by Wolverhampton Homes
Percentage of applicable respondents who live in a flat maisonette or bedsit
28%
44%
17%
5%
5%
Very satisfied
Fairly satisfied
Neither
Fairly dissatisfied
Very dissatisfied
72%
Satisfaction
Two thirds of tenants (who live in a flat, maisonette, or bedsit) (66%) are satisfied with the Concierge
Service. A fairly high proportion (24%) are neither satisfied nor dissatisfied, with only 10% dissatisfied.
Results have dropped slightly since 2011 where 73% were satisfied. 75% of tenants on Wolverhampton
Homes’ concierge list are satisfied with the concierge service, with 31% very satisfied.
Tenants 2011 = 78%
2011 results: 73% internal 71% external

WOLVERHAMPTON HOMES STAR SURVEY 2012 M·E·L RESEARCH
Measurement ���� Evaluation ���� Learning: Using evidence to shape better services 45
Figure 48 Satisfaction with the Concierge Service
Percentage of applicable respondents who live in a flat maisonette or bedsit
26%
40%
24%
31%
43%
17%
7%
3%
4%
5%
Very satisfied
Fairly satisfied
Neither
Fairly dissatisfied
Very dissatisfied Survey Responses
WH concierge List
75% of tenants on
Wolverhampton
Homes known
concierge list are
satisfied compared
to 66% of all tenants
who responded
Tenants (who live in a flat, maisonette, or bedsit) were finally asked to choose which area they wish
Wolverhampton Homes would focus its attention upon within or around their block. Similar proportions
would like Wolverhampton Homes to focus its attention on security (27%), cleaning (25%) and grounds
maintenance (24%). Security was top of the list in 2011 (26%), followed by litter removal (21%), decoration
(19%) and grounds maintenance (18%).
Figure 49 Which area should Wolverhampton Homes focus its attention
Percentage of respondents who live in a flat maisonette or bedsit
27%
25%
24%
14%
10%
Security
Cleaning
Grounds maintenance
Decoration
Fly tipping
Results in this section are generally positive, particularly with the overall appearance of the neighbourhood
79%). Although satisfaction with the various estate services are fairly good, they have seen a slight drop
across all indicators, ranging from an 7% drop for the concierge service and for the grounds maintenance
service and 6% for the overall estate services. Further investigation may need to be done on what has
caused this general drop across the board.
Tenants 2011 = 73%
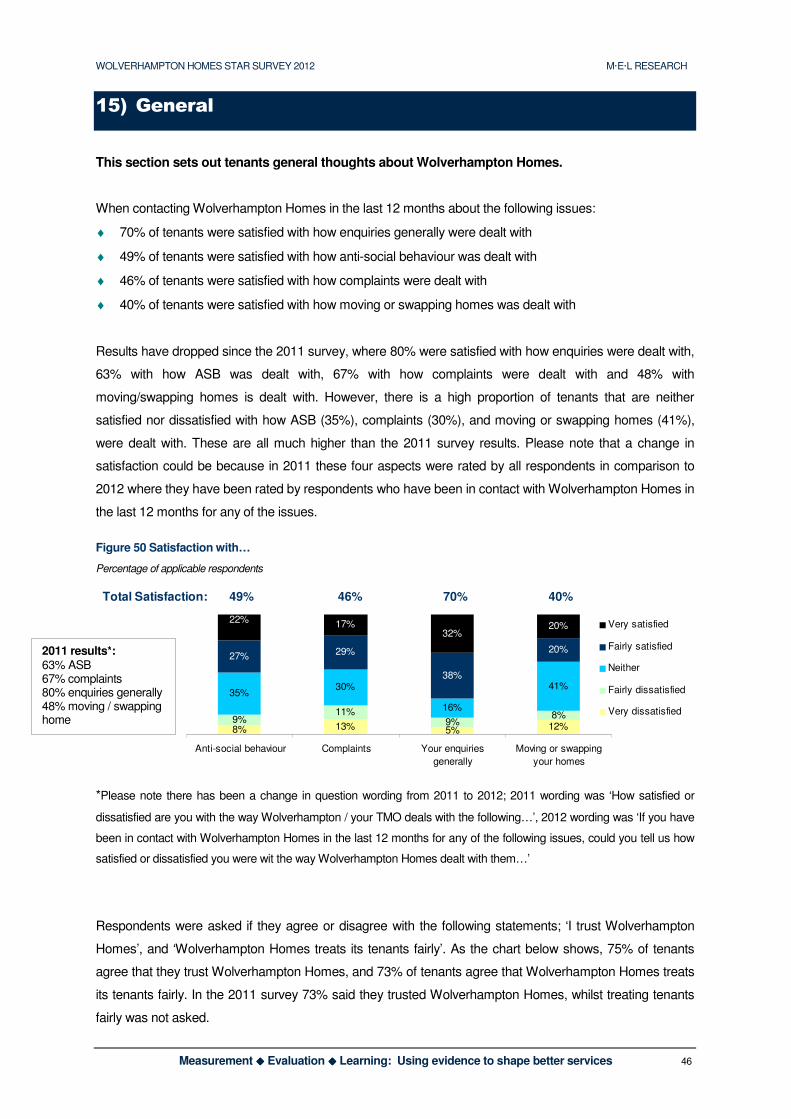
WOLVERHAMPTON HOMES STAR SURVEY 2012 M·E·L RESEARCH
Measurement ���� Evaluation ���� Learning: Using evidence to shape better services 46
8% 13% 5% 12%9%
11%9%
8%
35%30%
16%
41%
27% 29%
38%
20%
17%32%
22%20%
Anti-social behaviour Complaints Your enquiries
generally
Moving or swapping
your homes
Very satisfied
Fairly satisfied
Neither
Fairly dissatisfied
Very dissatisfied
Total Satisfaction: 49% 46% 70% 40%
15) General
This section sets out tenants general thoughts about Wolverhampton Homes.
When contacting Wolverhampton Homes in the last 12 months about the following issues:
♦ 70% of tenants were satisfied with how enquiries generally were dealt with
♦ 49% of tenants were satisfied with how anti-social behaviour was dealt with
♦ 46% of tenants were satisfied with how complaints were dealt with
♦ 40% of tenants were satisfied with how moving or swapping homes was dealt with
Results have dropped since the 2011 survey, where 80% were satisfied with how enquiries were dealt with,
63% with how ASB was dealt with, 67% with how complaints were dealt with and 48% with
moving/swapping homes is dealt with. However, there is a high proportion of tenants that are neither
satisfied nor dissatisfied with how ASB (35%), complaints (30%), and moving or swapping homes (41%),
were dealt with. These are all much higher than the 2011 survey results. Please note that a change in
satisfaction could be because in 2011 these four aspects were rated by all respondents in comparison to
2012 where they have been rated by respondents who have been in contact with Wolverhampton Homes in
the last 12 months for any of the issues.
Figure 50 Satisfaction with…
Percentage of applicable respondents
*Please note there has been a change in question wording from 2011 to 2012; 2011 wording was ‘How satisfied or
dissatisfied are you with the way Wolverhampton / your TMO deals with the following…’, 2012 wording was ‘If you have
been in contact with Wolverhampton Homes in the last 12 months for any of the following issues, could you tell us how
satisfied or dissatisfied you were wit the way Wolverhampton Homes dealt with them…’
Respondents were asked if they agree or disagree with the following statements; ‘I trust Wolverhampton
Homes’, and ‘Wolverhampton Homes treats its tenants fairly’. As the chart below shows, 75% of tenants
agree that they trust Wolverhampton Homes, and 73% of tenants agree that Wolverhampton Homes treats
its tenants fairly. In the 2011 survey 73% said they trusted Wolverhampton Homes, whilst treating tenants
fairly was not asked.
2011 results*: 63% ASB 67% complaints 80% enquiries generally 48% moving / swapping home
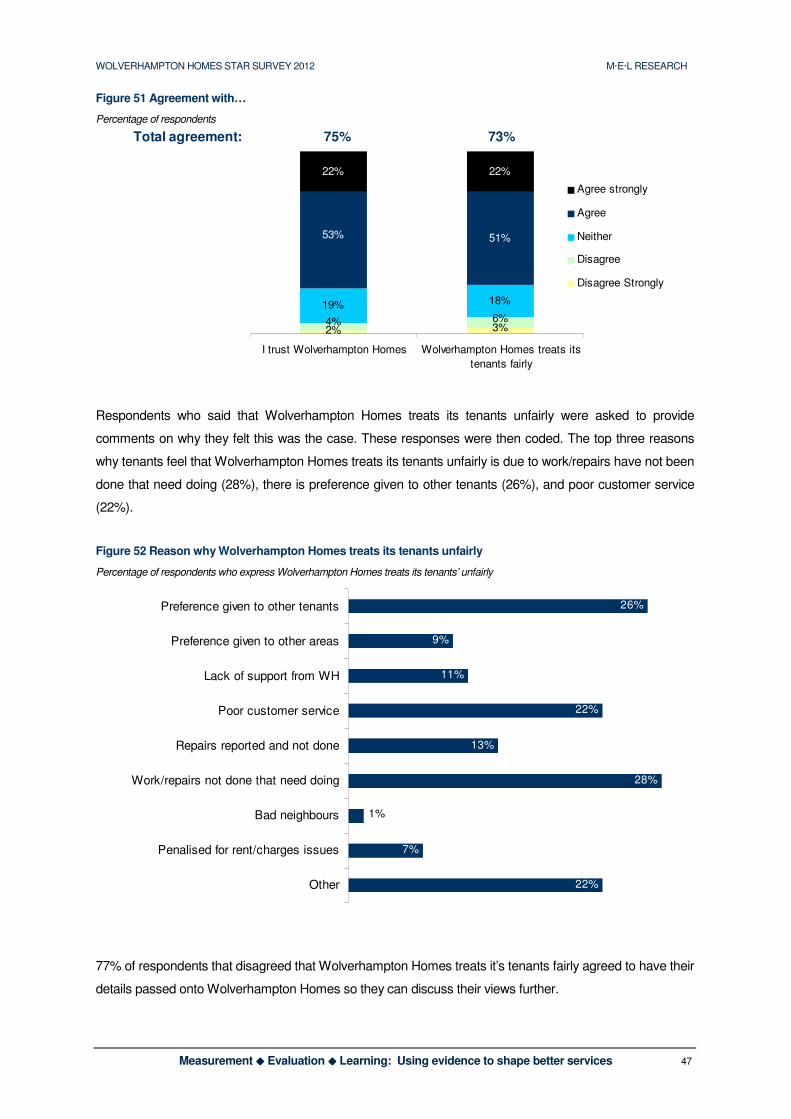
WOLVERHAMPTON HOMES STAR SURVEY 2012 M·E·L RESEARCH
Measurement ���� Evaluation ���� Learning: Using evidence to shape better services 47
19% 18%
51%
22% 22%
2% 3%4% 6%
53%
I trust Wolverhampton Homes Wolverhampton Homes treats its
tenants fairly
Agree strongly
Agree
Neither
Disagree
Disagree Strongly
Total agreement: 75% 73%
Figure 51 Agreement with…
Percentage of respondents
Respondents who said that Wolverhampton Homes treats its tenants unfairly were asked to provide
comments on why they felt this was the case. These responses were then coded. The top three reasons
why tenants feel that Wolverhampton Homes treats its tenants unfairly is due to work/repairs have not been
done that need doing (28%), there is preference given to other tenants (26%), and poor customer service
(22%).
Figure 52 Reason why Wolverhampton Homes treats its tenants unfairly
Percentage of respondents who express Wolverhampton Homes treats its tenants’ unfairly
26%
9%
11%
22%
13%
28%
7%
22%
1%
Preference given to other tenants
Preference given to other areas
Lack of support from WH
Poor customer service
Repairs reported and not done
Work/repairs not done that need doing
Bad neighbours
Penalised for rent/charges issues
Other
77% of respondents that disagreed that Wolverhampton Homes treats it’s tenants fairly agreed to have their
details passed onto Wolverhampton Homes so they can discuss their views further.
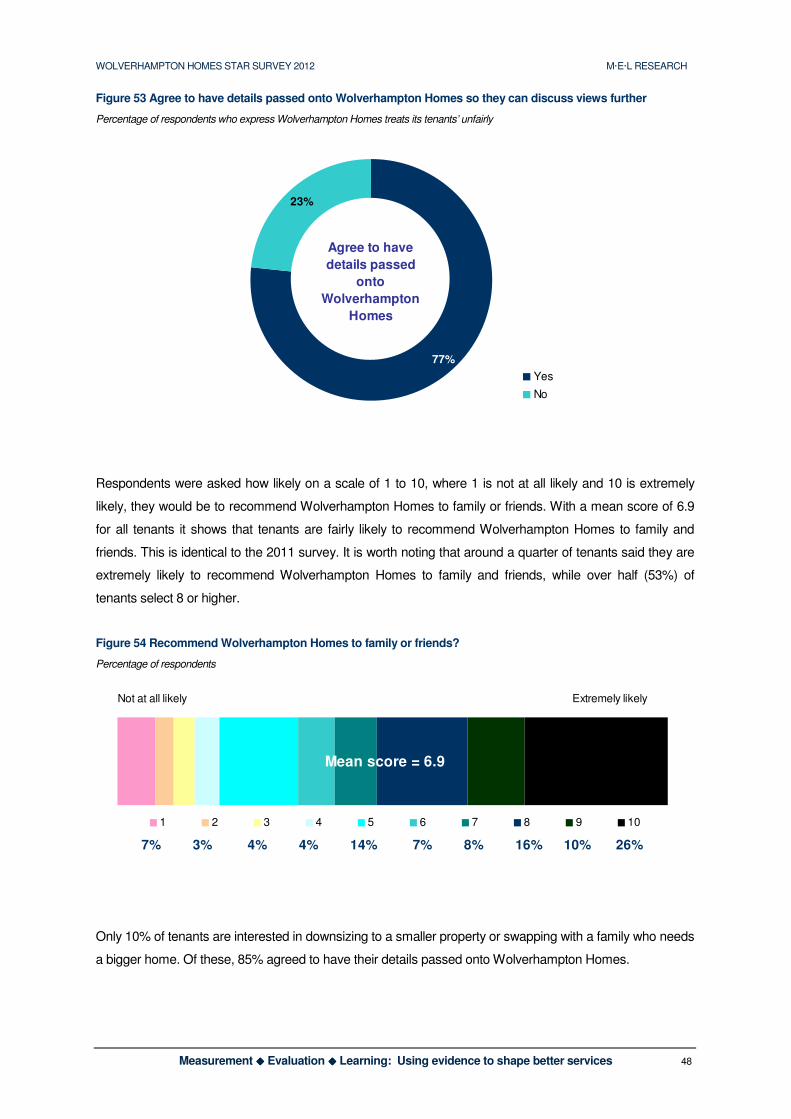
WOLVERHAMPTON HOMES STAR SURVEY 2012 M·E·L RESEARCH
Measurement ���� Evaluation ���� Learning: Using evidence to shape better services 48
1 2 3 4 5 6 7 8 9 10
7% 3% 4% 4% 14% 7% 8% 16% 10% 26%
Mean score = 6.9
Not at all likely Extremely likely
77%
23%
Yes
No
Agree to have
details passed
onto
Wolverhampton
Homes
Figure 53 Agree to have details passed onto Wolverhampton Homes so they can discuss views further
Percentage of respondents who express Wolverhampton Homes treats its tenants’ unfairly
Respondents were asked how likely on a scale of 1 to 10, where 1 is not at all likely and 10 is extremely
likely, they would be to recommend Wolverhampton Homes to family or friends. With a mean score of 6.9
for all tenants it shows that tenants are fairly likely to recommend Wolverhampton Homes to family and
friends. This is identical to the 2011 survey. It is worth noting that around a quarter of tenants said they are
extremely likely to recommend Wolverhampton Homes to family and friends, while over half (53%) of
tenants select 8 or higher.
Figure 54 Recommend Wolverhampton Homes to family or friends?
Percentage of respondents
Only 10% of tenants are interested in downsizing to a smaller property or swapping with a family who needs
a bigger home. Of these, 85% agreed to have their details passed onto Wolverhampton Homes.
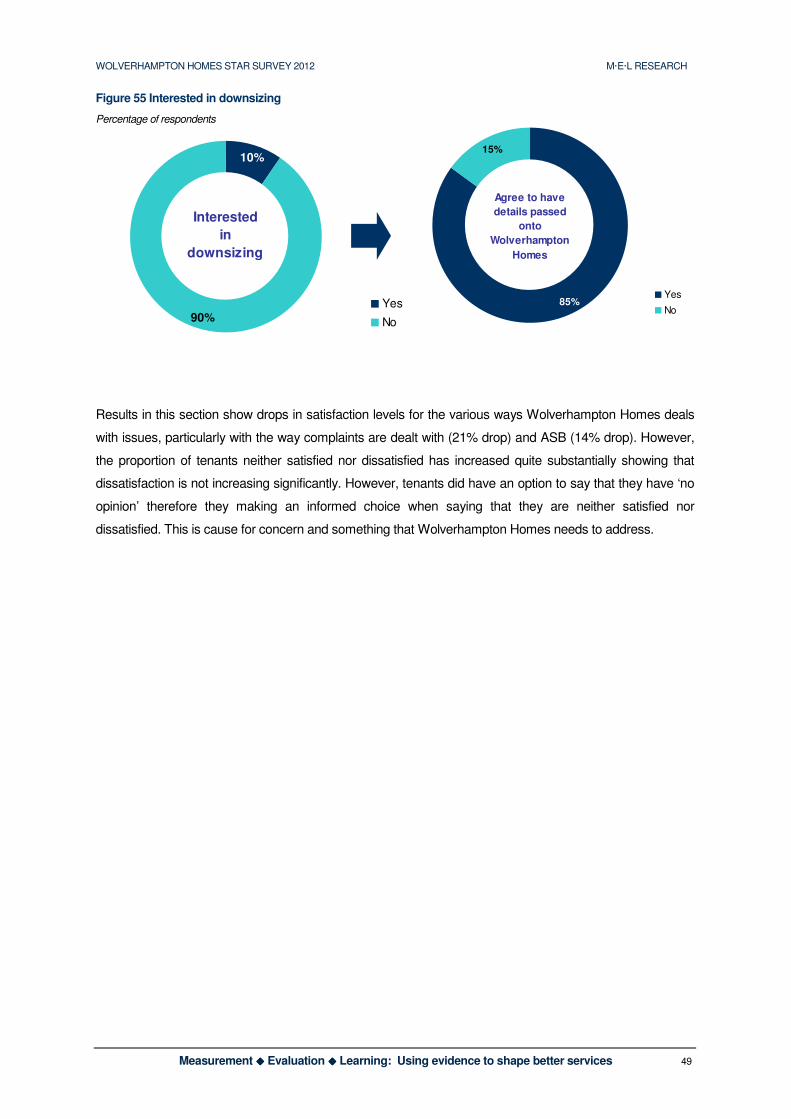
WOLVERHAMPTON HOMES STAR SURVEY 2012 M·E·L RESEARCH
Measurement ���� Evaluation ���� Learning: Using evidence to shape better services 49
90%
10%
Yes
No
Interested
in
downsizing
85%
15%
Yes
No
Agree to have
details passed
onto
Wolverhampton
Homes
Figure 55 Interested in downsizing
Percentage of respondents
Results in this section show drops in satisfaction levels for the various ways Wolverhampton Homes deals
with issues, particularly with the way complaints are dealt with (21% drop) and ASB (14% drop). However,
the proportion of tenants neither satisfied nor dissatisfied has increased quite substantially showing that
dissatisfaction is not increasing significantly. However, tenants did have an option to say that they have ‘no
opinion’ therefore they making an informed choice when saying that they are neither satisfied nor
dissatisfied. This is cause for concern and something that Wolverhampton Homes needs to address.
WOLVERHAMPTON HOMES STAR SURVEY 2012 M·E·L RESEARCH
Measurement ���� Evaluation ���� Learning: Using evidence to shape better services 50
16) Conclusion of survey findings
In summary, the 2012 survey shows that Wolverhampton Homes is continuing to perform at a good
standard and many results are consistent with those in the 2011 survey. This section looks to identify the
key areas of success and the areas that need further improvement.
Areas of success:
Your Views
Results for this section are generally very good, with high satisfaction levels for the overall service provided
by Wolverhampton Homes (85%), overall quality of the home (82%), neighbourhood as a place to live
(81%) and condition of the home (80%). Although some areas have seen small drops, these are not
significant.
Gas Servicing
Satisfaction with the gas servicing, the customer service and staff involved in undertaking the work are very
high, with all results over 90%. 95% said the gas servicing appointment was kept, 93% said the
tradesperson showed proof of identity and 92% were satisfied with the attitude of the tradesperson.
Decent Homes Programme
In HouseMark’s recent publication1 it demonstrates that although there is no evidence that the higher the
amount a landlord spends on maintenance the higher a tenant’s satisfaction is, when looking at the
difference Decent Homes makes there is a correlation, as seen with this survey, which suggests that
improvements to properties will have some positive impact on satisfaction levels.
Areas for improvement:
Advice and Support Services
Results in this section show lower satisfaction levels than we would generally expect to see. Furthermore,
when we compare results to the 2011 survey, we can see a drop in satisfaction with the support for new
tenants (from 67% to 53%) and support for vulnerable tenants (from 58% to 51%). However, dissatisfaction
levels are generally low, with large proportions of tenants neither satisfied nor dissatisfied (37%, 37% and
WOLVERHAMPTON HOMES STAR SURVEY 2012 M·E·L RESEARCH
Measurement ���� Evaluation ���� Learning: Using evidence to shape better services 51
36% respectively). However, the proportion of tenants neither satisfied nor dissatisfied has increased
significantly since 2011 (from 24% for new tenants and 30% for vulnerable tenants), rather than
dissatisfaction increasing. These tenants need to be moved from the ‘neither’ option back to satisfied to
rectify this decline.
Welfare Reforms
Results show that there is a knowledge gap about the welfare reforms, with a high proportion not knowing
anything about the reforms (42%) and 53% unsure if they will be affected. Offering further advice and
support to tenants on how they may personally be affected is needed to make sure those that may be
affected are armed with the information and tools they need, to minimise the impact of the changes.
Contact and Communication
Satisfaction ratings for the customer service tenants experienced when contacting Wolverhampton Homes
are relatively good. However, as we found with the 2011 survey findings, problems arise when the first
person tenants spoke to was unable to deal with their issue. Only 15% found it easy making contact with
the correct person and only 12% felt the person they spoke to was able to fully deal with their query to their
satisfaction. These figures have both dropped since the 2011 survey from 24% and 29% respectively.
Further work needs to be done to ensure other members of staff are equipped to deal with queries, or
frontline staff need to be trained to deal with a wider range of issues.
Estate services
Although results in this section are generally positive, they have seen a slight drop across all indicators
since 2011, ranging from an 7% drop for the concierge services (to 66%), 7% for the grounds maintenance
service (to 73%) and 6% for the overall estate services (to 72%). Further research with this group of tenants
may be needed to identify why results have dropped to ensure this is rectified.
Dealing with issues
Satisfaction levels have also seen a decline since 2011 with the various ways Wolverhampton Homes
deals with issues. This is particularly prominent with the way complaints are dealt with (21% drop to 46%)
and ASB (14% drop to 49%). However, dissatisfaction levels are generally low, but the proportion of tenants
who are neither satisfied nor dissatisfied has increased quite substantially. This is cause for concern and
something that Wolverhampton Homes needs to address.
1 HouseMark STAR benchmarking service; Summary of findings 2011/12, January 2013
WOLVERHAMPTON HOMES STAR SURVEY 2012 M·E·L RESEARCH
Measurement ���� Evaluation ���� Learning: Using evidence to shape better services 52
Appendices
Appendix 1: Sample composition
Appendix 2: Tenants survey questionnaire
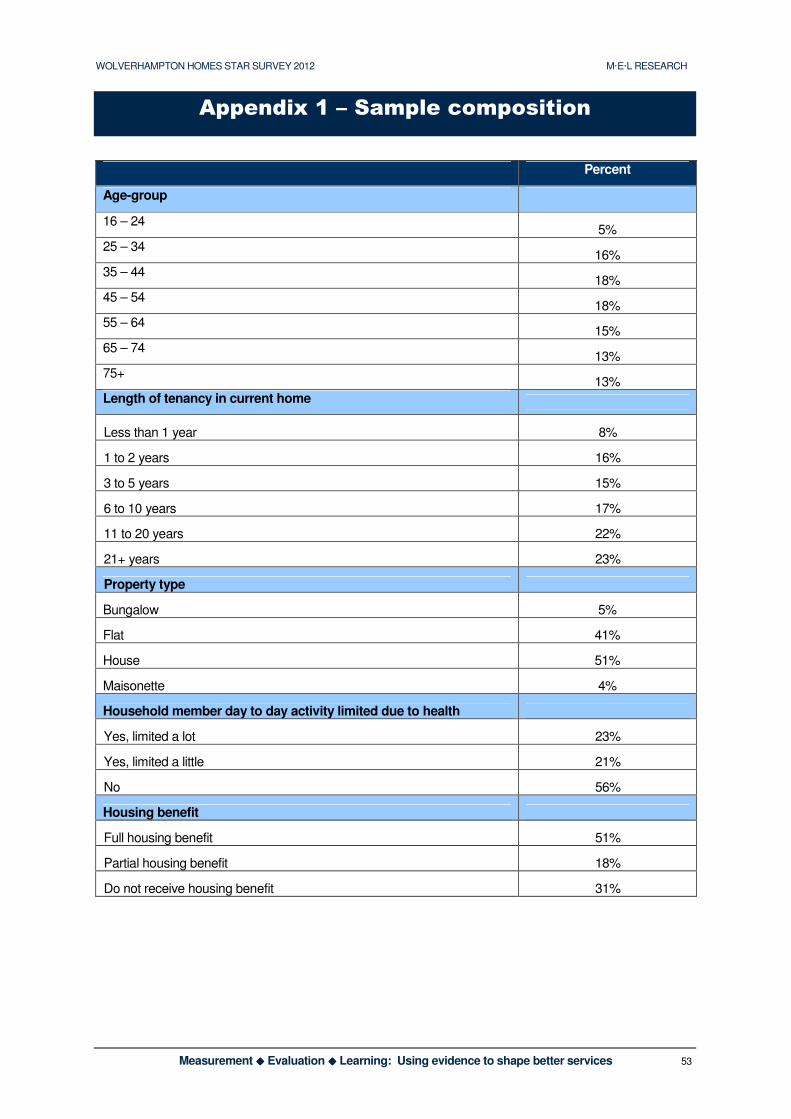
WOLVERHAMPTON HOMES STAR SURVEY 2012 M·E·L RESEARCH
Measurement ���� Evaluation ���� Learning: Using evidence to shape better services 53
Appendix 1 – Sample composition
Percent
Age-group
16 – 24 5%
25 – 34 16%
35 – 44 18%
45 – 54 18%
55 – 64 15%
65 – 74 13%
75+ 13%
Length of tenancy in current home
Less than 1 year 8%
1 to 2 years 16%
3 to 5 years 15%
6 to 10 years 17%
11 to 20 years 22%
21+ years 23%
Property type
Bungalow 5%
Flat 41%
House 51%
Maisonette 4%
Household member day to day activity limited due to health
Yes, limited a lot 23%
Yes, limited a little 21%
No 56%
Housing benefit
Full housing benefit 51%
Partial housing benefit 18%
Do not receive housing benefit 31%
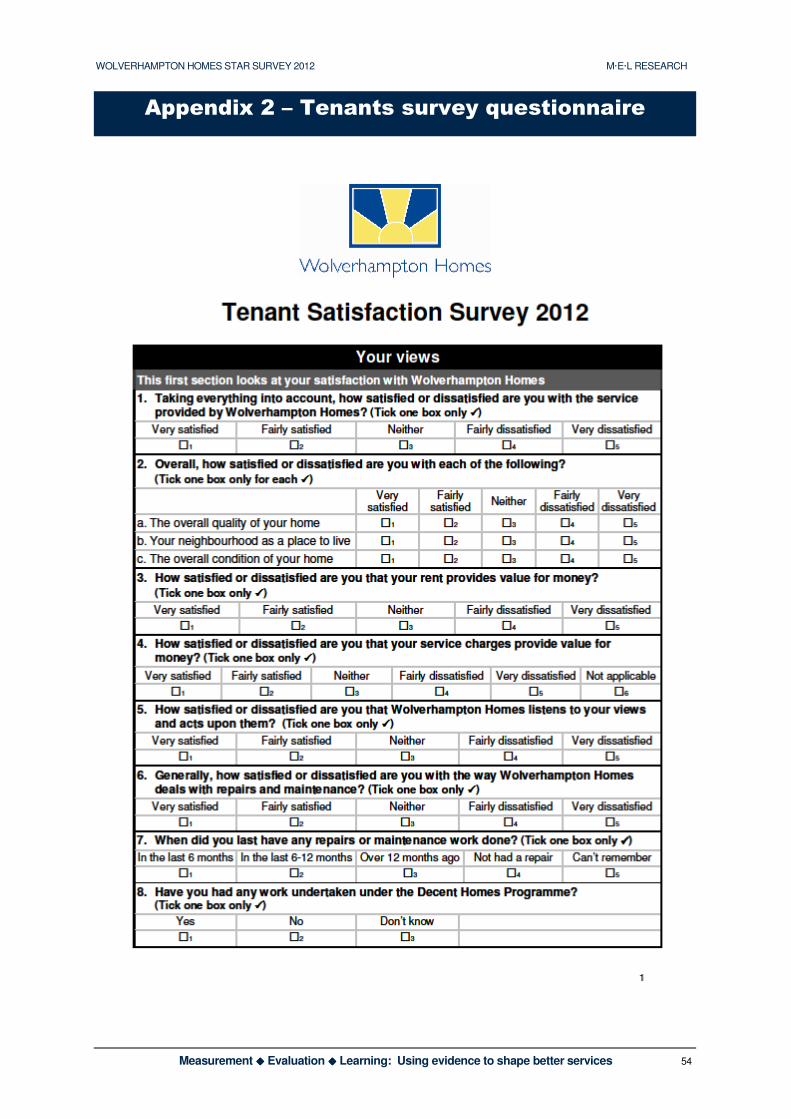
WOLVERHAMPTON HOMES STAR SURVEY 2012 M·E·L RESEARCH
Measurement ���� Evaluation ���� Learning: Using evidence to shape better services 54
Appendix 2 – Tenants survey questionnaire
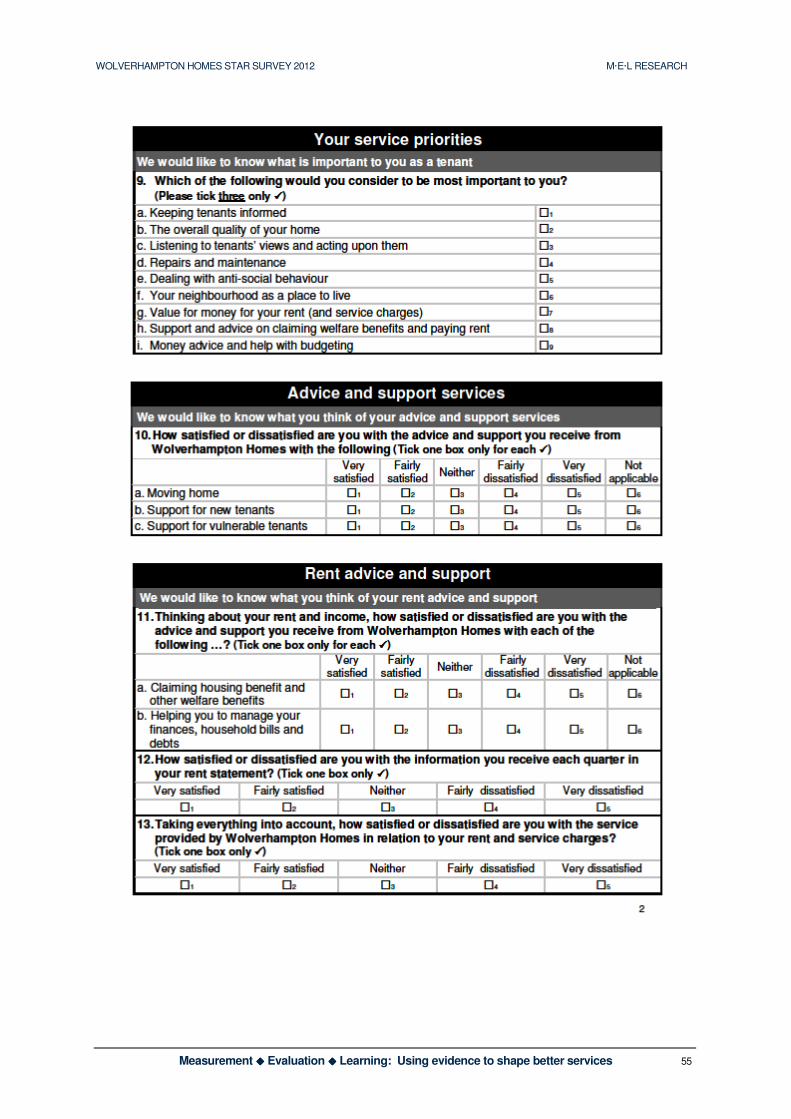
WOLVERHAMPTON HOMES STAR SURVEY 2012 M·E·L RESEARCH
Measurement ���� Evaluation ���� Learning: Using evidence to shape better services 55
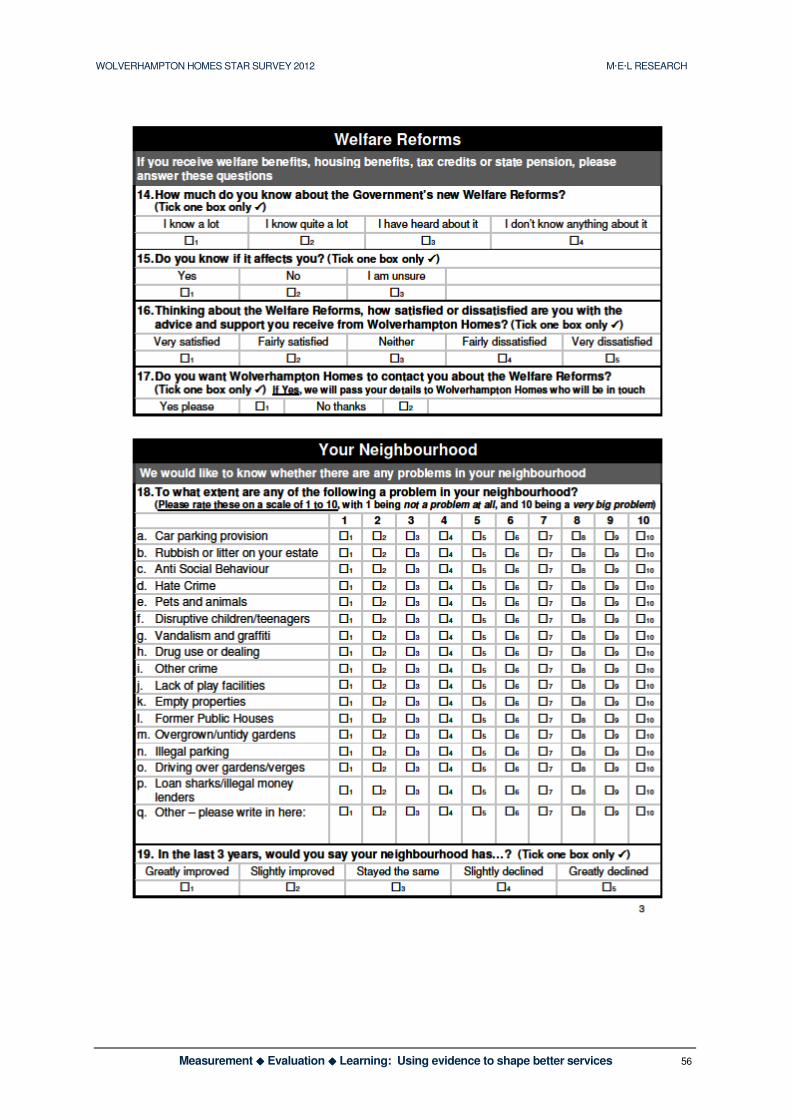
WOLVERHAMPTON HOMES STAR SURVEY 2012 M·E·L RESEARCH
Measurement ���� Evaluation ���� Learning: Using evidence to shape better services 56
WOLVERHAMPTON HOMES STAR SURVEY 2012 M·E·L RESEARCH
Measurement ���� Evaluation ���� Learning: Using evidence to shape better services 57
WOLVERHAMPTON HOMES STAR SURVEY 2012 M·E·L RESEARCH
Measurement ���� Evaluation ���� Learning: Using evidence to shape better services 58

WOLVERHAMPTON HOMES STAR SURVEY 2012 M·E·L RESEARCH
Measurement ���� Evaluation ���� Learning: Using evidence to shape better services 59
WOLVERHAMPTON HOMES STAR SURVEY 2012 M·E·L RESEARCH
Measurement ���� Evaluation ���� Learning: Using evidence to shape better services 60

WOLVERHAMPTON HOMES STAR SURVEY 2012 M·E·L RESEARCH
Measurement ���� Evaluation ���� Learning: Using evidence to shape better services 61
WOLVERHAMPTON HOMES STAR SURVEY 2012 M·E·L RESEARCH
Measurement ���� Evaluation ���� Learning: Using evidence to shape better services 1