Embed Size (px)
Citation preview

12.2. Measures of Central Tendency: The Mean, Median, and Mode
1

A. Find the mean, median, and mode for a set of
data.
Objective
2
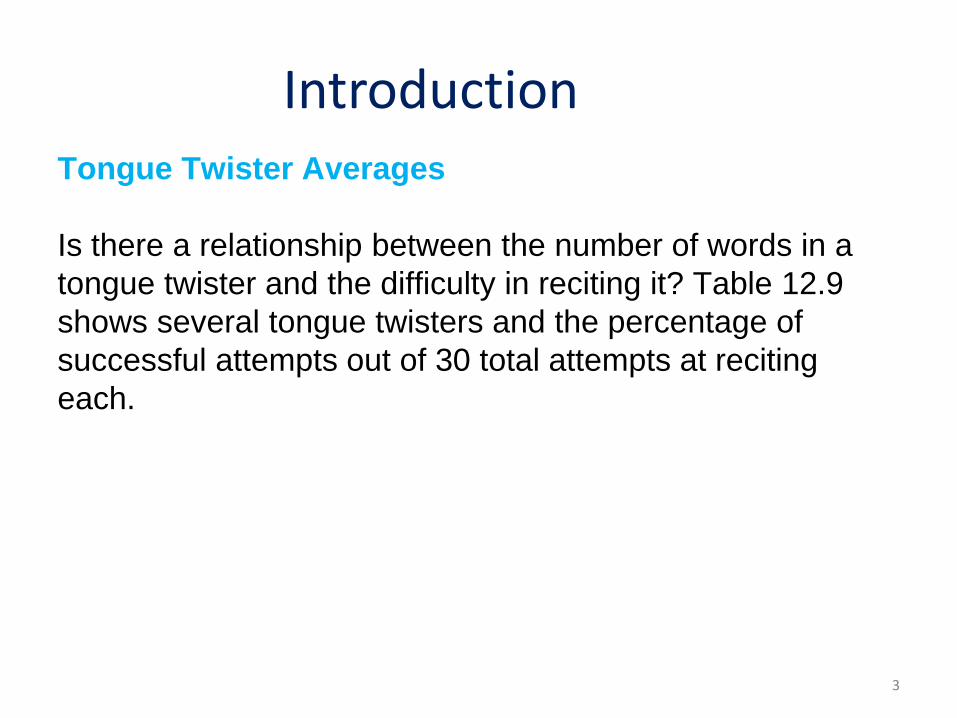
Tongue Twister Averages
Is there a relationship between the number of words in a
tongue twister and the difficulty in reciting it? Table 12.9
shows several tongue twisters and the percentage of
successful attempts out of 30 total attempts at reciting
each.
Introduction
3
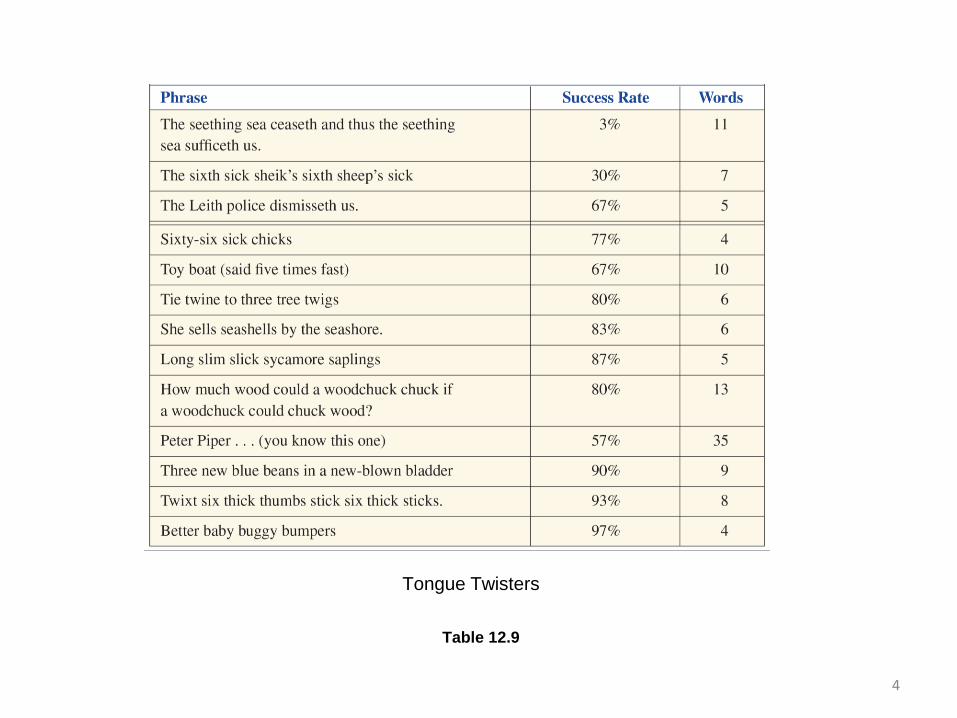
Tongue Twisters
Table 12.9
4
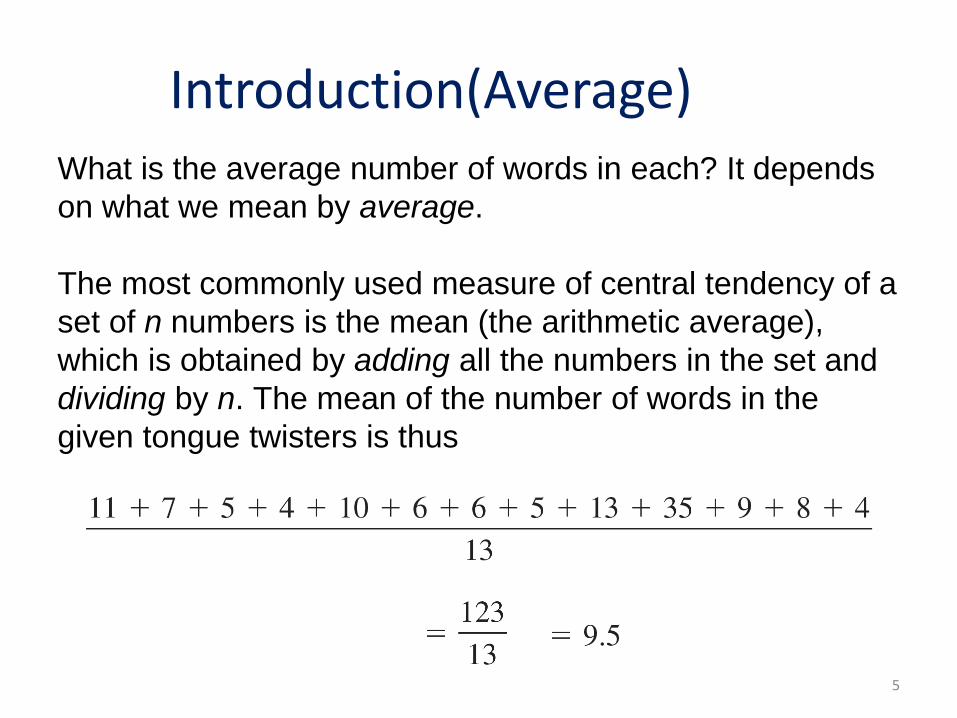
What is the average number of words in each? It depends
on what we mean by average.
The most commonly used measure of central tendency of a
set of n numbers is the mean (the arithmetic average),
which is obtained by adding all the numbers in the set and
dividing by n. The mean of the number of words in the
given tongue twisters is thus
Introduction(Average)
5

Another measure of central tendency is the median, the
middle value of an ordered set of numbers (there are as
many values above as below the median). Let us arrange
the number of words in each twister in ascending order.
4 4 5 5 6 6 7 8 9 10 11 13 35
In this case, the median number of words is 7.
The easiest average to compute is the mode, the value
occurring most often. We see that 4, 5, and 6 are modes for
these numbers; they occur twice each.
Introduction( Median, Mode )
6

If Peter Piper were replaced by “Zack zapped Zeus zinc,”
the most common number of words (the mode) would then
be 4.
So what is the average number of words in these tongue
twisters? Either 4, 5, 6, 7, or 9.5.
Introduction
7

Following is the definition of the Mean.
Alberto used a different kind of measure, called the mode.
Definition of the Mean and the Mode
8

Thus, it is possible for a set of numbers to have more than
one mode or no mode at all. The mean and the mode are
useful because they give an indication of a sort of center of
the set.
For this reason, they are called measures of central
tendency.
Mean and Mode Measures of Central Tendency
9

There is a third commonly used measure of central
tendency, called the median.
Definition of the Median Measure of central tendency
10
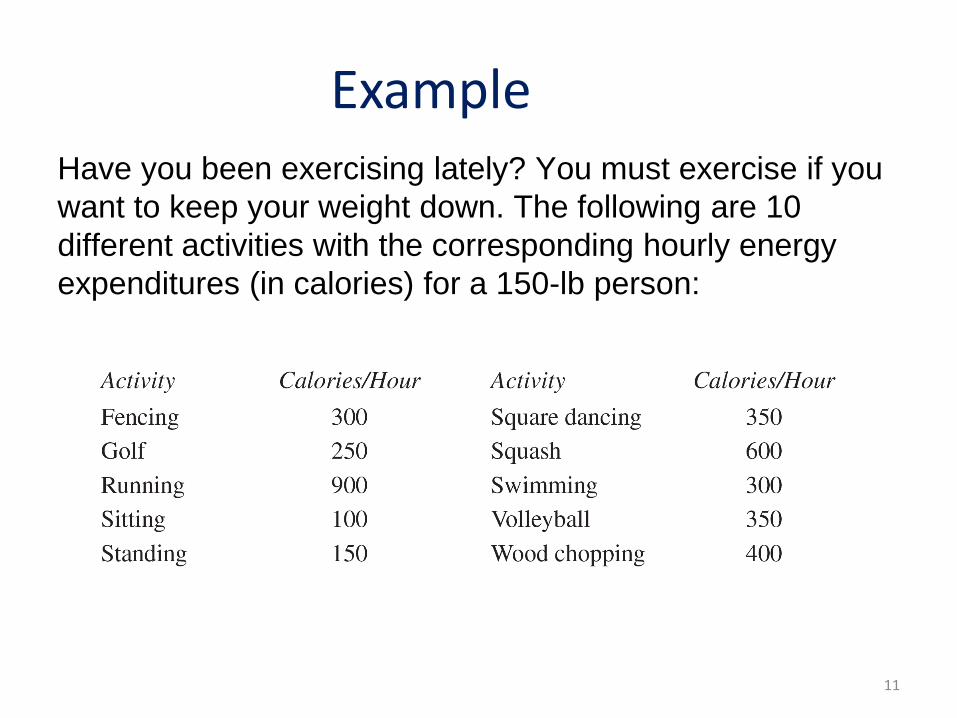
Have you been exercising lately? You must exercise if you
want to keep your weight down. The following are 10
different activities with the corresponding hourly energy
expenditures (in calories) for a 150-lb person:
Example
11

(a) Find the mean of these numbers.
(b) Find the median number of calories spent in these
activities.
(c) Find the mode of these numbers.
Example
12
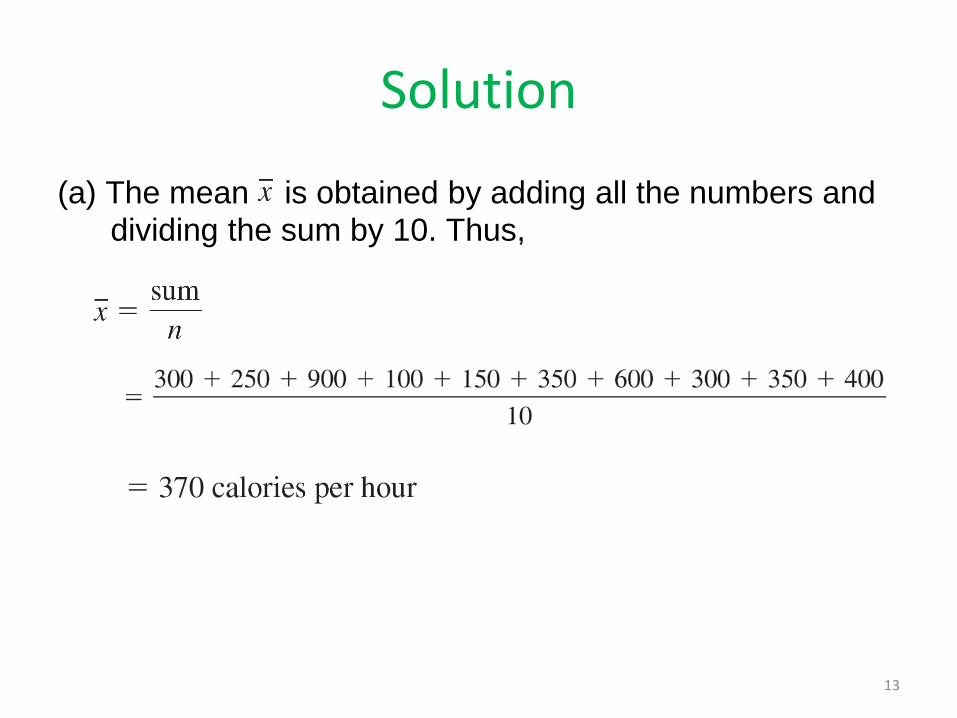
Solution
(a) The mean is obtained by adding all the numbers and dividing the sum by 10. Thus,
13

Solution
(b) To find the median, we must first arrange the numbers
in order of magnitude, as follows:
14

Solution We have an even number of items, and there is no
“middle” value. the median is the mean (average) of the
two middle items.
(c) The mode is the number with the greatest frequency if
there is one such number. In this case, the numbers
300 and 350 both occur twice, whereas all other
numbers occur just once.
Thus, there are two modes, 300 and 350; the data are
bimodal.
15

16

Example
How much do you make an hour? Effective July24, 2009, the federal minimum wage was increased to $7.25 per hour. For the frequency distribution of wage rates given in the table, find the following:
(a) The mean rate
(b) The mode
(c) The median rate
17

Table
Wage Frequency
7.70 3
7.80 6
7.90 6
8.00 8
8.10 5
8.20 2
Total 30
18

Solution(a)
Wage Rate Frequency Frequency X Rate
7.70 3 23.10
7.80 6 46.80
7.90 6 47.40
8.00 8 64.00
8.10 5 40.50
8.20 2 16.40
Total 30 238.20
Mean 7.94
19
Solution
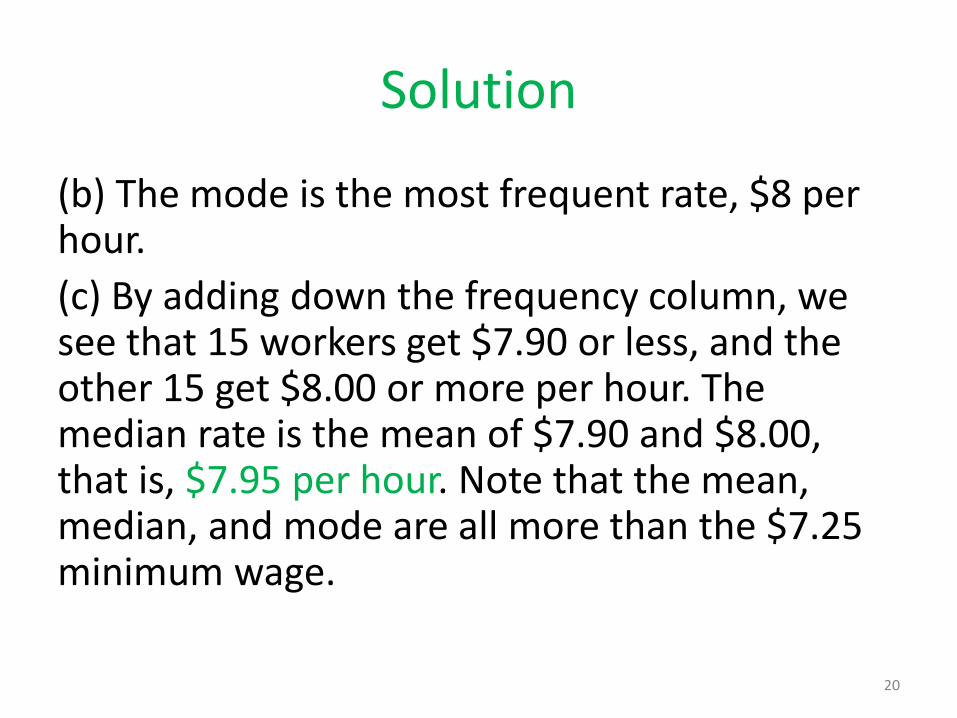
(b) The mode is the most frequent rate, $8 per hour.
(c) By adding down the frequency column, we see that 15 workers get $7.90 or less, and the other 15 get $8.00 or more per hour. The median rate is the mean of $7.90 and $8.00, that is, $7.95 per hour. Note that the mean, median, and mode are all more than the $7.25 minimum wage.
20

Example
The 10 largest payrolls in Major League Baseball, approximated to the nearest million, are in the last column of the table.
a. Find the mean of the payrolls.
b. Find the median of the payrolls.
c. Find the mode of the payrolls.
d. Why is the mean higher than the median?
21
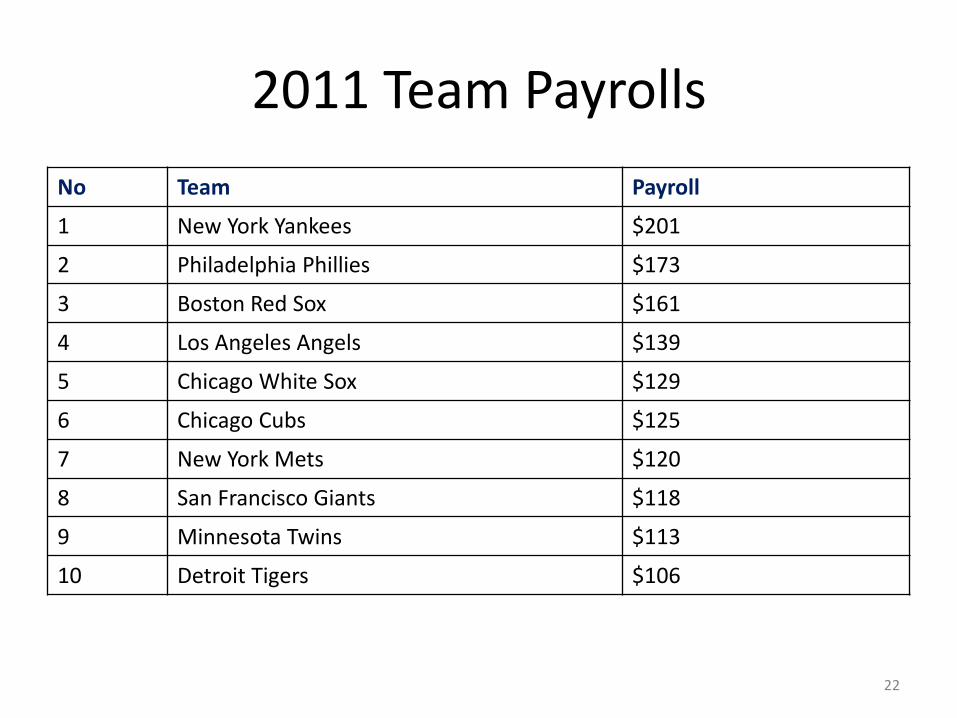
2011 Team Payrolls
No Team Payroll
1 New York Yankees $201
2 Philadelphia Phillies $173
3 Boston Red Sox $161
4 Los Angeles Angels $139
5 Chicago White Sox $129
6 Chicago Cubs $125
7 New York Mets $120
8 San Francisco Giants $118
9 Minnesota Twins $113
10 Detroit Tigers $106
22

Solution
(a) The mean of the 10 payrolls is: 201 + 173 + 161 + 139 + 129 + 125 + 120 + 118 + 113 + 106
10
=1385
10≈ 139 million
(b) The numbers are: 201 173 161 139 129 125 120 118 113 106
Median: =129+125
2= 127
(c) There is no mode. (d) The mean 139 is higher than the median 127 because of the New York Yankee’s large payroll. If the New York Yankee’s $201 million is excluded from the calculations, the mean is about $133 million, an amount closer to the median.
23

Example
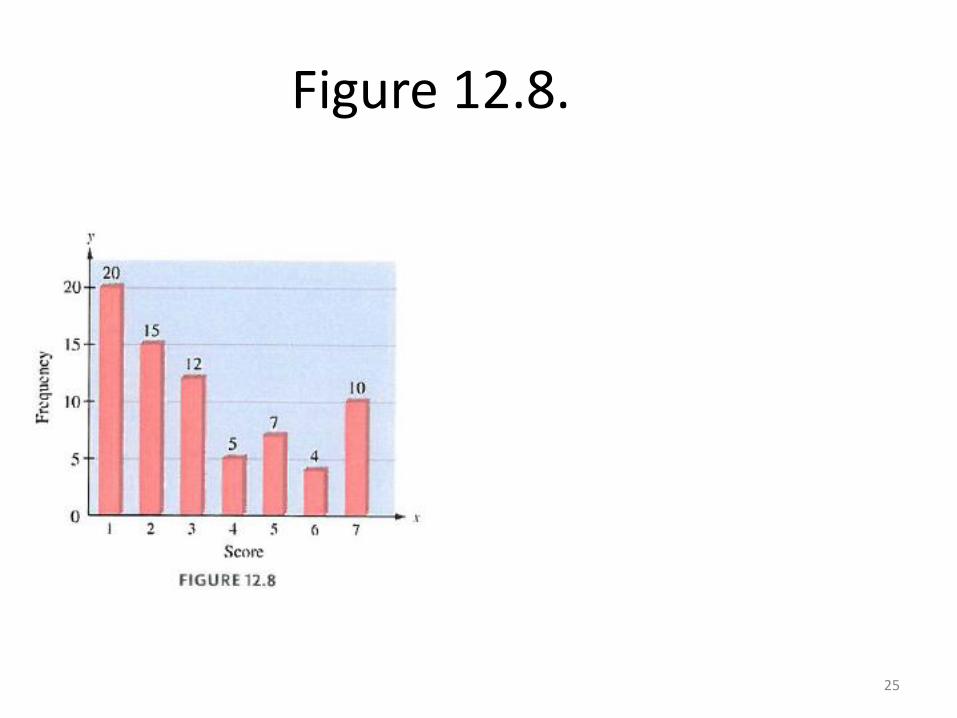
The figure 12.8 show the distribution of scores on a placement test for students at South High School. In the chart, 𝑥 is the score and 𝑦 is the frequency. Which of the following statements is true?
a. The mode and the mean are the same.
b. The mode and the median are the same.
c. The median is less than the mode.
d. The median is greater than the mode.
24
25
Figure 12.8.

Solution
The chart show that the mode is 𝑥 = 1. It also shows that more than 20 students scored higher than 1. Hence the median must be greater than 1( the mode) and therefore statement (d) is correct.
26

![GEODL-07 Block-04 [Measures of Central Tendency: …...37 [Measures of Central Tendency: Mean, Median and Mode] (Measures of Central Tendency) fdlh lewg dh dsUnzh; izo`fÙk dks la{ksi](https://img.pdfslide.net/doc/110x75/5f360e4f409497301e65d78c/geodl-07-block-04-measures-of-central-tendency-37-measures-of-central-tendency.jpg)