Embed Size (px)
Citation preview

Section 3.1
Measures of Central Tendency:Mode, Median, and Mean
3.1 / 1

Measures of Central Tendency
• The Mode• This is the value that occurs most
frequently in a data set• Example:• Find the Mode• 6, 7, 2, 3, 4, 6, 2, 6 mode is 6.• 6, 7, 2, 3, 4, 5, 9, 8 no mode
3.1 / 2

The Median• This is the central value of an ordered
distribution.
• To find the median of raw data:• Order the data from smallest to largest.• For an odd number of values pick the middle
value. or• For an even number of values compute the
average of the middle two values3.1 / 3

Find the median:
Rearrange: 1, 2, 2, 3, 4, 5, 7
The median is 3.
a. Data: 5, 2, 7, 1, 4, 3, 2
b. Data: 31, 57, 12, 22, 43, 50Rearrange: 12, 22, 31, 43, 50, 57
The median is the average of the middle two values =
372
4331
For an ordered data set of n values:Position of the middle value =
1
2
n

The MeanThis average uses the exact value of each entry.This average is sometimes called the arithmetic mean.
The mean of a collection of data is found by:• summing all the entries, and• dividing by the number of entries
entriesofnumber
entriesallofsummean
Example find the Mean: 6, 7, 2, 3, 4, 5, 2, 8
6.4625.48
37
8
82543276mean
3.1 / 5
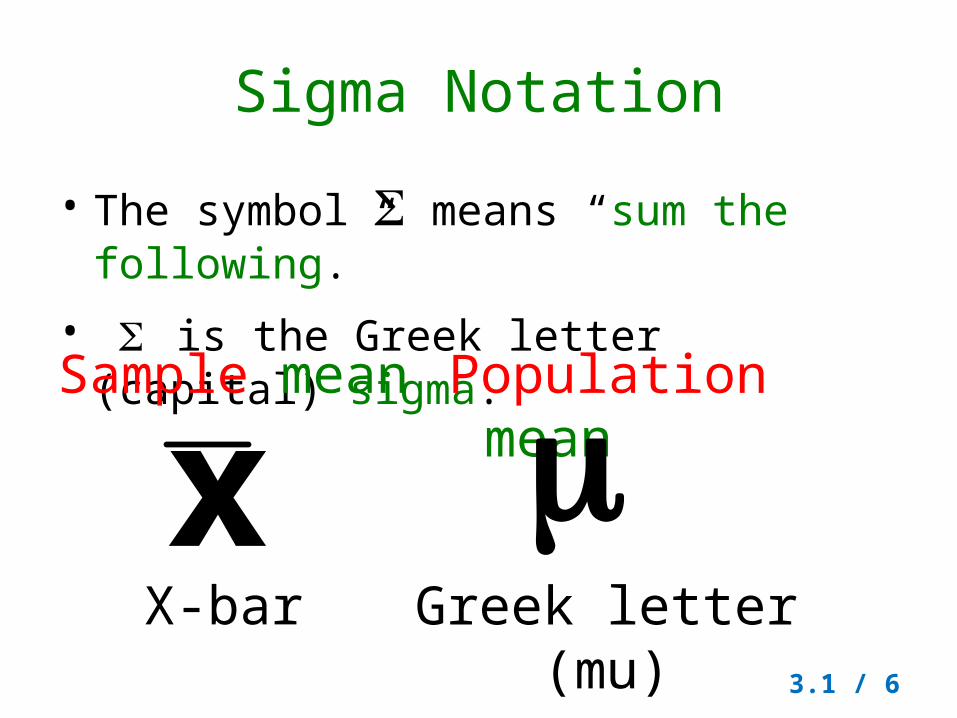
Sigma Notation
• The symbol means “sum the following.”
• is the Greek letter (capital) sigma.
Sample mean
xX-bar
Population mean
Greek letter (mu)
3.1 / 6

Number of entries in a set of data
• If the data represents a sample, the number of
entries = n.
• If the data represents an entire population, the
number of entries = N.Sample mean Population
meanx
xn
x
N
3.1 / 7

Example Comparing the Median and the Mean
Five employees in a manufacturing plant earn salaries of $19,700, $20,400, $21,500, $22,600 and $23,000 annually.The section manager has an annual salary of $95,000.a. Find the median annual salary for the six peopleSolution: First arrange the salaries in order.$19,700, $20,400, $21,500, $22,600 $23,000 $95,000Since there is an even number of data items, six, the median is the
average of the two middle items.
Median = $21,500 + $22,600 = $44,100 = $22,050 2 2
3.1 / 8

Example cont.
b. Find the mean annual salary for the six people.
Solution: We find the mean annual salary by adding the six annual salaries and dividing by 6.
Mean = 19,700+ $20,400+ $21,500+ $22,600+ $23,000+ $95,000
6=$202,200 6= $33,700
3.1 / 9
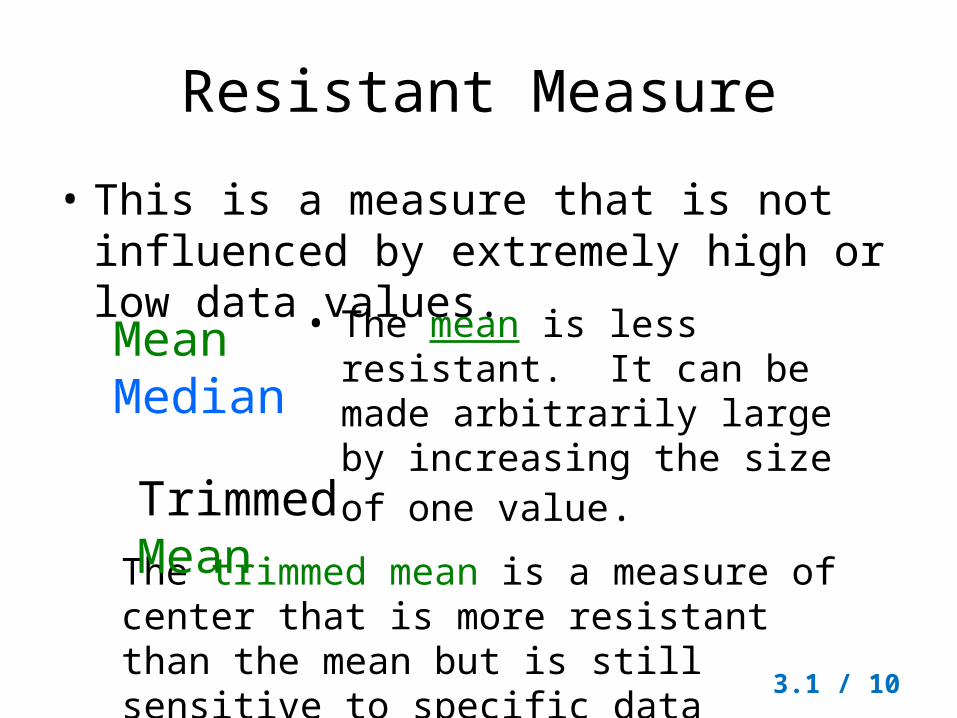
Resistant Measure
• This is a measure that is not influenced by extremely high or low data values.
MeanMedian
• The mean is less resistant. It can be made arbitrarily large by increasing the size of one value.
The trimmed mean is a measure of center that is more resistant than the mean but is still sensitive to specific data values.
Trimmed Mean
3.1 / 10

To calculate a (5 or 10%) trimmed mean
• Order the data from smallest to largest.• Delete the bottom 5 or 10% of the data.• Delete the same percent from the top of the data.• Compute the mean of the remaining 80 or 90% of the data.• Example: Compute a 10% trimmed mean
• Delete the top and bottom 10%• New data list:
17, 18, 20, 20, 25, 30, 32, 3610% trimmed mean =
15, 17, 18, 20, 20, 25, 30, 32, 36, 60
8.248
198n
x 3.1 / 11
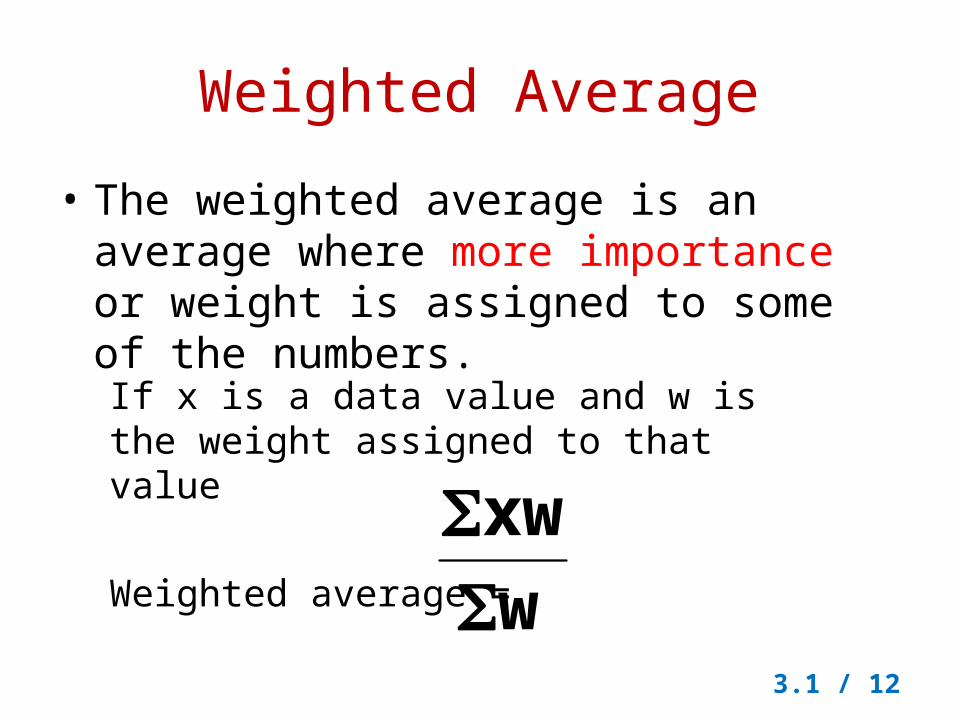
Weighted Average
• The weighted average is an average where more importance or weight is assigned to some of the numbers.
If x is a data value and w is the weight assigned to that value
Weighted average =
w
xw
3.1 / 12

Calculating a Weighted Average
In a pageant, the interview is worth 30% and appearance is worth 70%. Find the weighted
average for a contestant with an interview score of 90 and an appearance score of 80.
8300.1
56270.700.30
0.70(80)0.30(90)average Weighted
Assignment 4

Mean, Mode, Median (Calc.) • Given the data set
{13, 3, 10, 9, 7, 10, 12, 8, 6, 3, 9, 6, 11, 5, 9, 13, 8, 7, 7}find the mean, median and mode.
• Enter the data into a list.• Find the Mean and Median: • Method 1: (fast and easy)
Press 2nd MODE (QUIT) to return to the home screen.Press 2nd STAT (LIST). Arrow to the right to MATH.Choose option #3: mean( if you want the mean.Choose option #4: median( if you want the median.Your choice will appear on the home screen waiting for you to tell it which list to use.Remember the List names appear on the face of the calculator above the number keys 1-6.
3.1 / 14

Mean, Mode, Median cont. (Calc.) • Method 2: (a bit more sophisticated)
Press STAT. Arrow to the right to CALC. Now choose option #1: 1-Var Stats.
• When 1-Var Stats appears on the home screen, tell the calculator the name of the list you are using (such as: 1-Var Stats L1)Press ENTER.
• Arrow up and down the screen to see the statistical information about the data.
3.1 / 15

Mean, Mode, Median cont. (Calc.) • Find the Mode: (While there is no specific calculator function
to find the mode, the calculator is helpful in ordering the data so that you can find the mode easily.)
• Sort the data into ascending or descending order to help find the mode. STAT, #2 SortA(, and specify L1, or the list you are using.
• Look at the list (STAT, #1 EDIT). Examine the data to see which value(s) appear(s) most often.
• The mode for this data set is 7 and 9. Each of these values appears 3 times in the data set.
• Also see the example on finding mean, median and mode with grouped data.
3.1 / 16

Mean, Mode, Median with Grouped Data (Calc.)
• Mean, Mode, Median with Grouped Data• Find the mean, median and mode for this grouped data of
test scores. • Scores 65 70 75 80 85 90 95 100 • Frequency 2 3 2 5 8 7 5 3
• This problem could be solved by entering ALL 35 scores into one list, with the score 65 appearing twice, 70 appearing 3 times, and so on. But if we deal with the data as we deal with a frequency histogram, we can accomplish our task more quickly.
3.1 / 17

Mean, Mode, Median with Grouped Data cont. (Calc.)
• Enter the scores into L1 and the frequencies into L2.Find the Mean and Median:
• Method 1: (fast and easy) Press 2nd MODE (QUIT) to return to the home screen.Press 2nd STAT (LIST). Arrow to the right to MATH.Choose option #3: mean( if you want the mean.Choose option #4: median( if you want the median.
Your choice will appear on the home screen waiting for you to tell it which list to use. This time we will tell the calculator the list containing the scores AND the list containing the frequencies. Use comma to separate the lists.mean(L1,L2) or median(L1,L2)
3.1 / 18
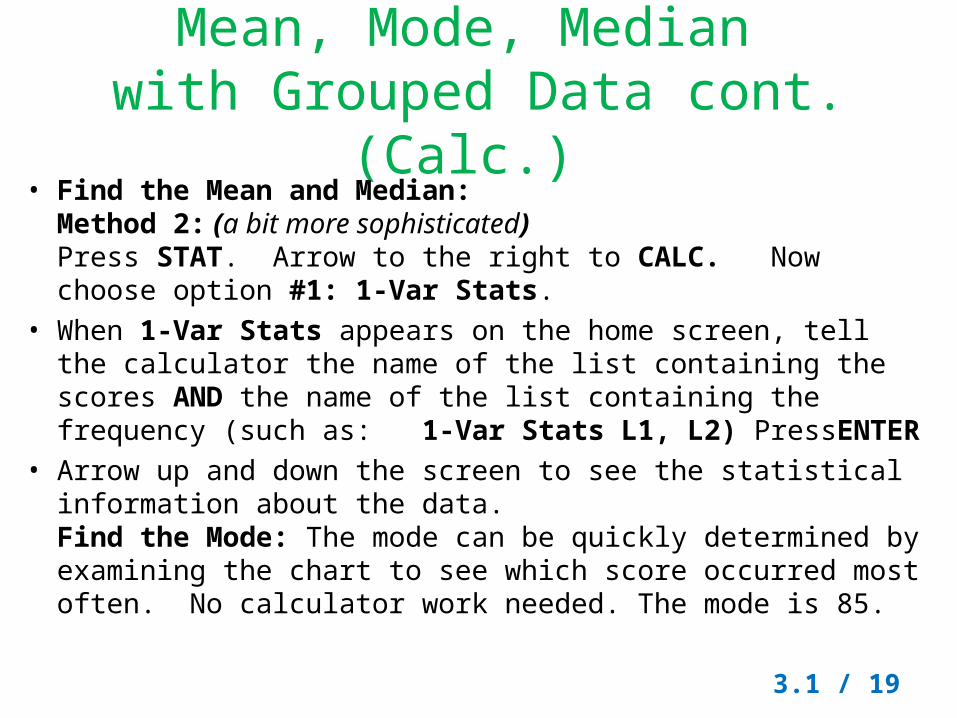
Mean, Mode, Median with Grouped Data cont. (Calc.)
• Find the Mean and Median:Method 2: (a bit more sophisticated) Press STAT. Arrow to the right to CALC. Now choose option #1: 1-Var Stats.
• When 1-Var Stats appears on the home screen, tell the calculator the name of the list containing the scores AND the name of the list containing the frequency (such as: 1-Var Stats L1, L2) PressENTER
• Arrow up and down the screen to see the statistical information about the data.Find the Mode: The mode can be quickly determined by examining the chart to see which score occurred most often. No calculator work needed. The mode is 85.
3.1 / 19


![GEODL-07 Block-04 [Measures of Central Tendency: …...37 [Measures of Central Tendency: Mean, Median and Mode] (Measures of Central Tendency) fdlh lewg dh dsUnzh; izo`fÙk dks la{ksi](https://img.pdfslide.net/doc/110x75/5f360e4f409497301e65d78c/geodl-07-block-04-measures-of-central-tendency-37-measures-of-central-tendency.jpg)