Embed Size (px)
Citation preview
Proceedings America Society of Mining and Reclamation, 2004
1249
COMPARISON OF THREE METHODS TO MEASURE ACIDITY OF
COAL-MINE DRAINAGE1
Brent Means2 and Tiff Hilton
Abstract. Although the Standard Methods 2310 hot peroxide acidity procedure is widely
used for measuring the acidity of mine drainage, little work has been done to determine if
“hot acidity” data actually describe the base requirement for neutralization of mine
drainage. This study compared three methods for estimating the acidity of net-acidic
waters emanating from the Manor, Millerstein, Ike, and Morris coal mines in
Pennsylvania: Standard Methods 2310 hot acidity titration to pH 8.2 endpoint, cold
acidity titration to treatment endpoint pH as high as 11.0, and calculated acidity. The
results showed poor agreement between hot acidity and calculated acidity for three of the
four waters. For two of the waters, Mg hydrolysis during the hot-acidity titration
indicated greater acidity than that computed based on pH and dissolved Fe, Mn, and Al.
The poor agreement for the other water resulted from incomplete hydrolysis of Mn
during the hot acidity titration. The agreement between the acidity measured by the
treatment acidity titration and the other two acidity methods was within 16 mg/L (as
CaCO3) for the Manor and Millerstein waters, but greater than 200 mg/L (as CaCO3) for
the Ike and Morris waters. The fair agreement between all methods for Manor and
Millerstein is a result of pH, Al, Fe, and Mn being the main source of acidity in the
waters. The poor agreement between the acidity methods for the Ike and Morris waters is
a result of the treatment acidity titration measuring a large amount of additional “acidity”
at high pH from the hydrolysis of Mg and other constituents. While the exact sources of
acidity measured by a treatment titration is unknown, results from PHREEQC aqueous
speciation calculations showed that the formation of cation-hydroxl complexes in the
Morris water at pH 11.0 contributed 40 mg/L of acidity. The authors hypothesize that
Mg hydrolysis and the formation of base-consuming complexes are the reason why
acidity measured by treatment titrations at high pH is often greater than that measured by
hot acidity titrations to pH 8.2 or 8.3. The authors also hypothesize that the neutralization
of carbonic acid is the reason why the acidity measured by “cold” titrations at low to mid
pH is often greater than that measured by hot acidity titrations. The results of this study
have practical importance because they show hot acidity titrations should not be used to
universally describe the acidity of mine drainage. This is especially true when estimating
the acidity produced when Mg-rich mine drainage is chemically treated to high pH. This
study also showed that over treating Mg-rich mine drainage not only increases chemical
costs but also increases sludge production. _________________________________
1Paper was presented at the 2004 National Meeting of the American Society of Mining and
Reclamation and the 25th
West Virginia Surface Mine Drainage Task Force, April 19-24,
2004. Published by ASMR, 3134 Montavesta Rd., Lexington, KY 40502. 2Brent Means, Hydrogeologist, U.S. Office of Surface Mining, 415 Market Street, Harrisburg,
PA 17011 ([email protected], Tel. 717-782-4036); Tiff Hilton, Mining Engineer, WOPEC
Inc., RR2 Box 294B, Lewisburg, WV 24901 ([email protected], Tel. 304-645-7633).
Proceedings America Society of Mining and Reclamation, 2004 pp 1249-1277
DOI: 10.21000/JASMR04011249
Proceedings America Society of Mining and Reclamation, 2004
1250
Introduction
It has long been recognized that acidity is an important measure for characterizing mine
drainage (Rose and Cravotta, 1998; ADTI, 2000; Kirby, 2002). Various methods can be useful
to determine the acidity of water and these methods fit into one of three categories: cold acidity,
hot acidity, or calculated acidity. Both cold and hot acidity (A.P.H.A, 1998) are laboratory
procedures that measure acidity by titrating water with a strong base (e.g. NaOH), while the
calculated acidity method (Hedin et al., 1994) determines acidity by using a pH measurement
and dissolved metal concentrations. Coal-mining professionals in Appalachia have long
considered a Standard Methods 2310 hot acidity titration performed to pH 8.3 (American Public
Health Association, 1998) as the industry standard for measuring the acidity of mine drainage.
This may have developed as a result of regulatory agencies, such as Pennsylvania Department of
Environmental Protection (PADEP), requiring that acidity measurements (to 8.3) be included as
part of the hydrologic data submitted in a mining permit (Pennsylvania Department of
Environmental Protection, 2004). Results of hot acidity titrations are used to quantify the
severity of mine drainage (Rose and Cravotta, 1998) and to calculate limestone consumption in
passive treatment systems (Hedin et al., 1994). Recent work by Kirby and Cravotta (2004)
identifies the sources of acidity measured by a hot acidity titration. However, little work has been
done to describe the acidity of mine drainage at titration endpoints higher than pH 8.3, which is
consistent with active treatment methods, or to evaluate the appropriateness of ubiquitously
using hot acidity results to describe the acidity of mine drainage. This paper addresses these
points by comparing the results of applying cold, hot, and calculated acidity methods to four net-
acidic discharges emanating from bituminous coal mines in Pennsylvania. First, a background
section reviews both the geochemistry of acidity and the three acidity methods used in this study.
Second, a site selection section discusses the reasoning behind choosing the four mine waters.
Third, a discussion section presents the results of the applying the acidity methods to the four
mine waters. Finally, practical implications of the results are discussed.
Proceedings America Society of Mining and Reclamation, 2004
1251
Background
Overview of Acidity in Mine Drainage
Mine drainage commonly contains elevated amounts of dissolved metals (Rose and Cravotta,
1998). In fact, U.S. Office of Surface Mining’s (OSM) mine drainage inventory shows that 360
of 1470 post-primacy discharges in the Appalachian coal fields have aluminum, iron, or
manganese concentration of greater than 50 mg/L (unpublished data). At favorable pH
conditions, Al3+
, Fe2+
, Fe3+
, and Mn2+
metals participate in hydrolysis reactions and produce
acidity:
HOHAlHAl 3)(03 32
3 (1)
HOHFeOHOFe
s2)(5.225.0
)(322
2 (2)
HOHFeHFe 3)(03 32
3 (3)
HMnOOHOMn
s25.0
)(222
2 (4)
Fe2+
and Mn2+
are redox dependent and are shown in equations (2) and (4) as precipitating as
chemically oxidized solids, which are typically formed when passively treating mine drainage or
after prolonged exposure of mine waters to atmospheric conditions in surface-water
environments. During chemical treatment of mine drainage, Fe2+
and Mn2+
can precipitate as
chemically reduced solids (Equations (5) and (6)); however, the acidity generated is identical to
that expressed in Equations (3) and (4).
HOHFeHFe 2)(02 22
2 (5)
HOHMnHMn 2)(02 22
2 (6)
In addition to elevated metals, many Appalachian discharges are characterized by low pH.
OSM’s mine drainage inventory shows that 430 of 1470 post-primacy discharges in the
Proceedings America Society of Mining and Reclamation, 2004
1252
Appalachian coal fields have pH < 3.5 (unpublished data). Acidity from low pH (e.g. pH<3.0) is
substantial and can be calculated by Equation (7):
pHLofCaCOmgpHacidity 10000,50/ 3 (7)
In addition to metal acidity and pH acidity, bisulfate (HSO4-), carbonic acid (H2CO3), and
hydrogen sulfide (H2S) are known to contribute to the acidity of fresh mine drainage (Jageman et
al., 1988; Rose and Cravotta, 1998). Payne and Yeates (1970) also documented positive
interferences from magnesium to hot acidity values.
Acidity Methods
Calculated Acidity
Equations (1) through (6) show the amount of acidity produced through hydrolysis is
proportional to the concentrations of dissolved metals expressed as mole equivalents. For
instance, Equation (1) shows that 3 moles of acidity are produced for every 1 mole of Al3+
participating in a hydrolysis reaction. This stoichiometry permits the development of an
equation that uses dissolved aluminum concentration to estimate acidity generation from
hydrolysis and precipitation.
27
350
33 Al
acidityAl (8)
where Al3+
Acidity is the amount of acidity in mg/L of CaCO3, Al3+
is dissolved Aluminum
concentration in mg/L, and the values of 27 and 50 are the molecular weight of aluminum and
the conversion factor for expressing acidity as CaCO3, respectively.
Hedin et al., (1994) combined Equation (7) with Equation (8) to yield an equation capable of
estimating both metal (Fe, Al, and Mn) and pH acidity.
pHMnAlFeFe
Acidity 10100055
2
27
3
56
3
56
250
2332
(9)
Proceedings America Society of Mining and Reclamation, 2004
1253
where Acidity = metal (Fe, Al, and Mn) and pH acidity as mg/L of CaCO3 and Fe2+
, Fe 3+
, Al3+
,
and Mn2+
are the analytical concentrations of dissolved metals in mg/L.
Equation (9) uses results from a field-measured pH coupled with results from a laboratory
analysis for metals (dissolved) from a field-filtered sample. The accuracy of the acidity
estimation for low -pH discharges is highly sensitive to the accuracy of the pH reading. For
example, the pH contribution to acidity for pH 3.0 and pH 2.7 water is 50 mg/L (as CaCO3) and
100 mg/L (as CaCO3), respectively. This example illustrates the importance of using a calibrated
pH meter to measure field pH when using Equation (9). A laboratory-measured pH should not
be substituted for a field-measured pH since a lab pH could be unrepresentative if pH-altering
chemical reactions, such as hydrolysis and exsolution of CO2, occurred during sample transport
(Cravotta and Kirby, 2004). It is also important that metal concentrations used in Equation (9)
are from analysis of a field-filtered sample as opposed to an unfiltered or laboratory-filtered
sample. It is common practice to consider chemical species contained in a field-filtered (0.45
m) sample as dissolved, while an unfiltered sample contains both dissolved and suspended
species. The use of metal concentrations from an analysis of an unfiltered sample could result in
an artificially high calculated acidity, if the sample contained suspended matter (e.g. metal
hydroxides and oxides) that is not actually a source of acidity (already hydrolyzed) but could not
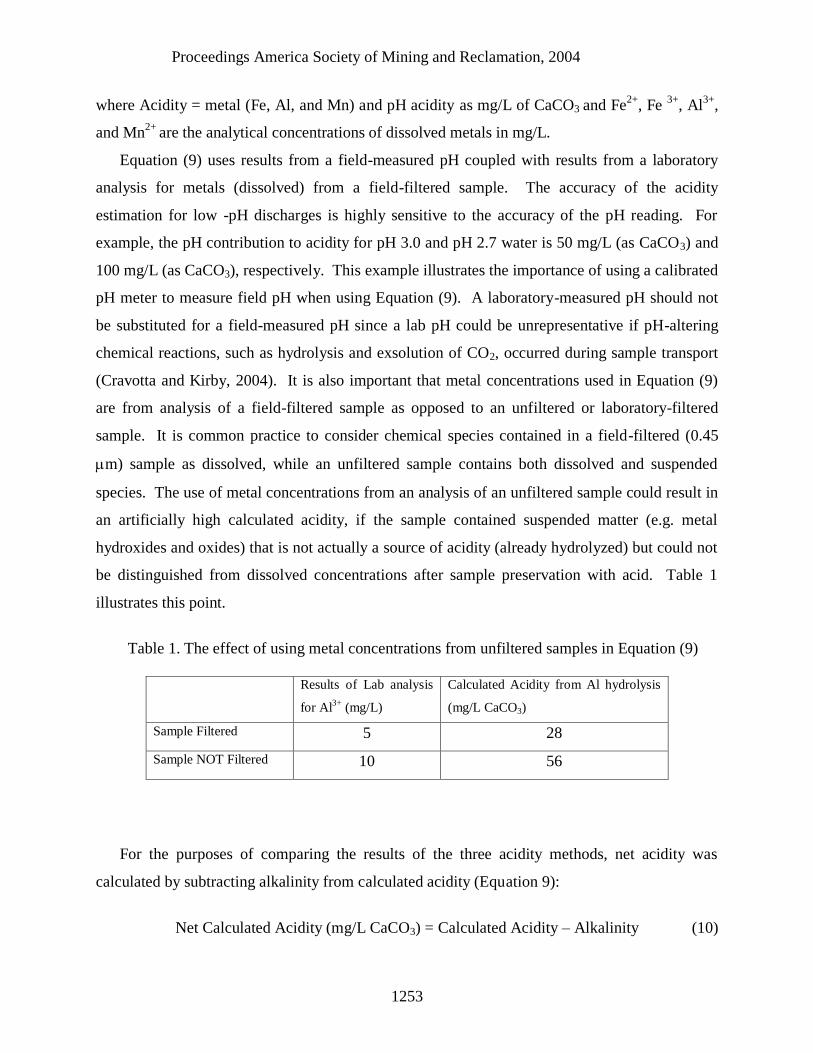
be distinguished from dissolved concentrations after sample preservation with acid. Table 1
illustrates this point.
Table 1. The effect of using metal concentrations from unfiltered samples in Equation (9)
Results of Lab analysis
for Al3+
(mg/L)
Calculated Acidity from Al hydrolysis
(mg/L CaCO3)
Sample Filtered 5 28
Sample NOT Filtered 10 56
For the purposes of comparing the results of the three acidity methods, net acidity was
calculated by subtracting alkalinity from calculated acidity (Equation 9):
Net Calculated Acidity (mg/L CaCO3) = Calculated Acidity – Alkalinity (10)
Proceedings America Society of Mining and Reclamation, 2004
1254
Hot Acidity
The adjective “hot,” in hot acidity titration, refers to the boiling of the sample before the
water is titrated with a strong base to a specified pH endpoint. Several published hot acidity
procedures exist (APHA, 1998; ASTM, 1984; U.S.EPA, 1979), however, most laboratories in
Pennsylvania use either Standard Methods 2310 (APHA, 1998) or EPA 305.1 (U.S. EPA, 1979)
procedures (Means, unpublished data). Although the EPA (1979) procedure specifies the hot
acidity titration endpoint pH of 8.2, and the APHA (1998) and ASTM (1984) procedures specify
the endpoint pH of 8.3, all three methods employ consistent steps. Kirby and Cravotta (2004)
offer a thorough discussion of the hot acidity titration procedure, resulting in an abbreviated
discussion for this paper. The general hot acidity steps are to (1) titrate the water using a sulfuric
acid to pH less than 4.5 to neutralize alkalinity; (2) add five drops of a 30% solution of hydrogen
peroxide (H2O2) for metal oxidation; (3) boil the sample for two to five minutes to remove all
carbonate species, accelerate oxidation and precipitation of metals, and then allow the sample to
cool to room temperature; (4) titrate the water using a strong base to pH 8.3 to neutralize acidity;
and (5) calculate hot acidity by subtracting the equivalent of acid added from the equivalent of
base added and express hot acidity as mg/L of CaCO3. For the purpose of this paper, there are
two important points in this procedure. First, the procedure intentionally does not measure
carbonate acidity (H2CO3). Secondly, step (5) yields a hot acidity result that characterizes water
as net acidic (positive value) or net alkaline (negative value).
Treatment Acidity
The authors developed the treatment acidity procedure as a means to measure the base
consumption for actual treatment of raw mine water to effluent limits. A treatment acidity
titration is a variant of a “conventional” cold acidity titration. There are two general differences
between a treatment titration and a cold acidity titration. First, unlike a conventional cold acidity
titration, a treatment acidity titration is a group of individual titrations with each titration using a
different pH endpoint. The person performing the titration determines the number of titrations
and the range in pH endpoints by studying the raw water chemistry and estimating the
approximate range in pH which the water will meet effluent standards (Table 2). At the end of
each titration, acidity is calculated and the water is filtered and analyzed for dissolved metal
concentrations. This process describes the behavior of metals as the pH of the water is increased
Proceedings America Society of Mining and Reclamation, 2004
1255
and provides the pH where effluent standards are met. The second difference is the point at
which the titration ends. In most cases, a “conventional” cold acidity titration requires chemical
be added until pH no longer drifts from the desired endpoint, whereas, a treatment titration is
finished immediately after the pH endpoint is reached and pH is free to drift downwards as
hydrolysis reactions continue to occur. This distinction stems from the difference in goals for
each procedure. The goal of a cold acidity titration is to calculate the acidity of the water at a
predetermined pH endpoint, while the goal of a treatment titration is to estimate the acidity
neutralized when alkali chemical is added to the water by a full-scale treatment system.
Treatment systems add sufficient treatment chemical to meet effluent standards, not a “stable”
pH endpoint. As a result, the acidity measured from both methodologies will differ.
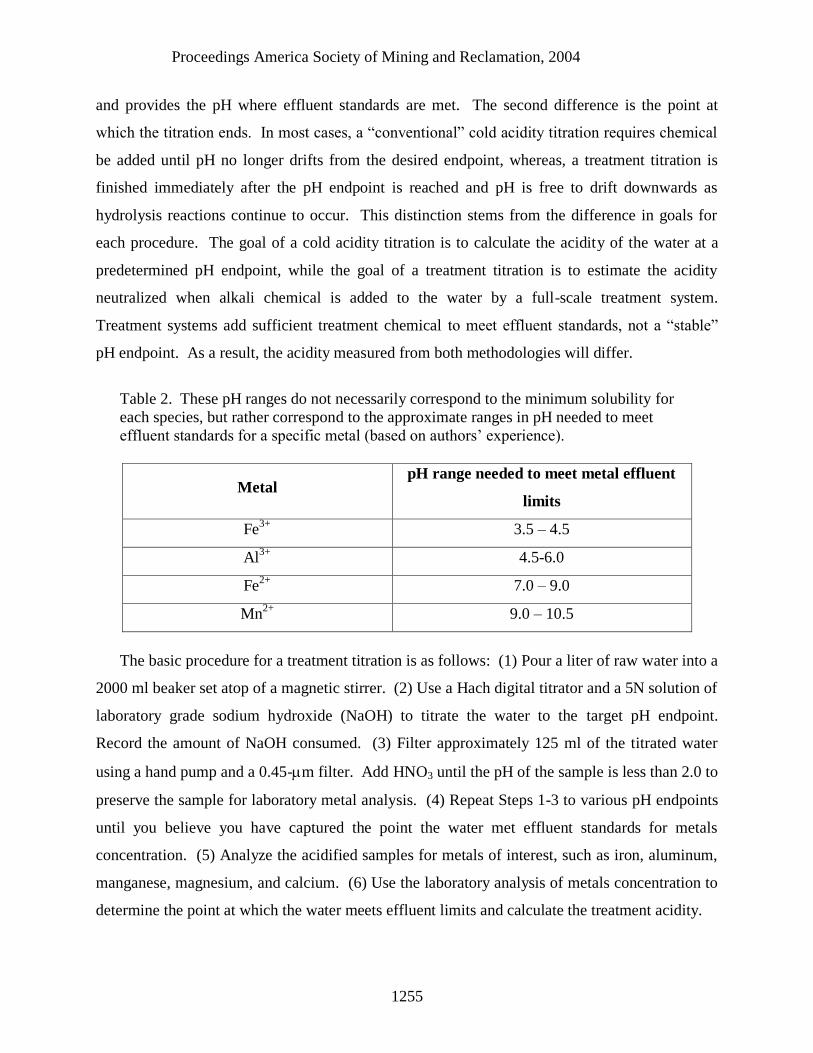
Table 2. These pH ranges do not necessarily correspond to the minimum solubility for
each species, but rather correspond to the approximate ranges in pH needed to meet
effluent standards for a specific metal (based on authors’ experience).
Metal pH range needed to meet metal effluent
limits
Fe3+
3.5 – 4.5
Al3+
4.5-6.0
Fe2+
7.0 – 9.0
Mn2+
9.0 – 10.5
The basic procedure for a treatment titration is as follows: (1) Pour a liter of raw water into a
2000 ml beaker set atop of a magnetic stirrer. (2) Use a Hach digital titrator and a 5N solution of
laboratory grade sodium hydroxide (NaOH) to titrate the water to the target pH endpoint.
Record the amount of NaOH consumed. (3) Filter approximately 125 ml of the titrated water
using a hand pump and a 0.45-m filter. Add HNO3 until the pH of the sample is less than 2.0 to
preserve the sample for laboratory metal analysis. (4) Repeat Steps 1-3 to various pH endpoints
until you believe you have captured the point the water met effluent standards for metals
concentration. (5) Analyze the acidified samples for metals of interest, such as iron, aluminum,
manganese, magnesium, and calcium. (6) Use the laboratory analysis of metals concentration to
determine the point at which the water meets effluent limits and calculate the treatment acidity.
Proceedings America Society of Mining and Reclamation, 2004
1256
Water Quality Collection and Analysis
Calculated Acidity
The following procedure was used to determine calculated acidities. In the field, mine
drainage was passed through a 0.45-m filter using a hand-held vacuum pump. Half of the water
was preserved with reagent-grade HCl to pH < 2.0 for determining ferrous iron concentrations.
The remainder of the water was preserved with reagent-grade HNO3 to pH < 2.0. Cardan
Laboratories of Northern Cambria, Pennsylvania determined metal concentrations using atomic
absorption (APHA, 1998). At the time of sampling, pH was measured in the field using a Hydac
pH meter calibrated in pH 4.0 and 7.0 buffer solutions. A sample was collected, placed on ice,
and analyzed for alkalinity within 24 hours using a Hach alkalinity titration kit.
Hot Acidity
Unfiltered water samples were collected and placed on ice until hot acidity titrations were
performed. During the manual hot acidity titrations, Cardan Laboratories performed additional
steps than required by Standard Methods 2310 procedures (APHA, 1998). For example, after the
hot peroxide boil a small portion of water was filtered and analyzed for metal concentrations to
study the effect of the hot peroxide boil. Also, the water was titrated to pH endpoints 8.2 and
11.0 for the purpose of investigating sources of acidity at higher pH. At each pH endpoint, a
portion of water was filtered and analyzed for metal concentrations to identify the sources of
acidity. This paper refers to the hot acidity titration performed to pH 8.2 endpoint as “hot acidity
(pH 8.2)” and the hot acidity titration performed to pH 11.0 endpoint as “hot acidity (pH 11.0).”
Treatment Acidity
Unfiltered water samples were collected and refrigerated and treatment acidity titrations were
performed within 24 hours. Pennsylvania Bureau of Laboratories determined metal
concentrations from the filtered water obtained at each of the different titration endpoints using
inductively coupled plasma emission mass spectrometry (APHA, 1998).
Proceedings America Society of Mining and Reclamation, 2004
1257
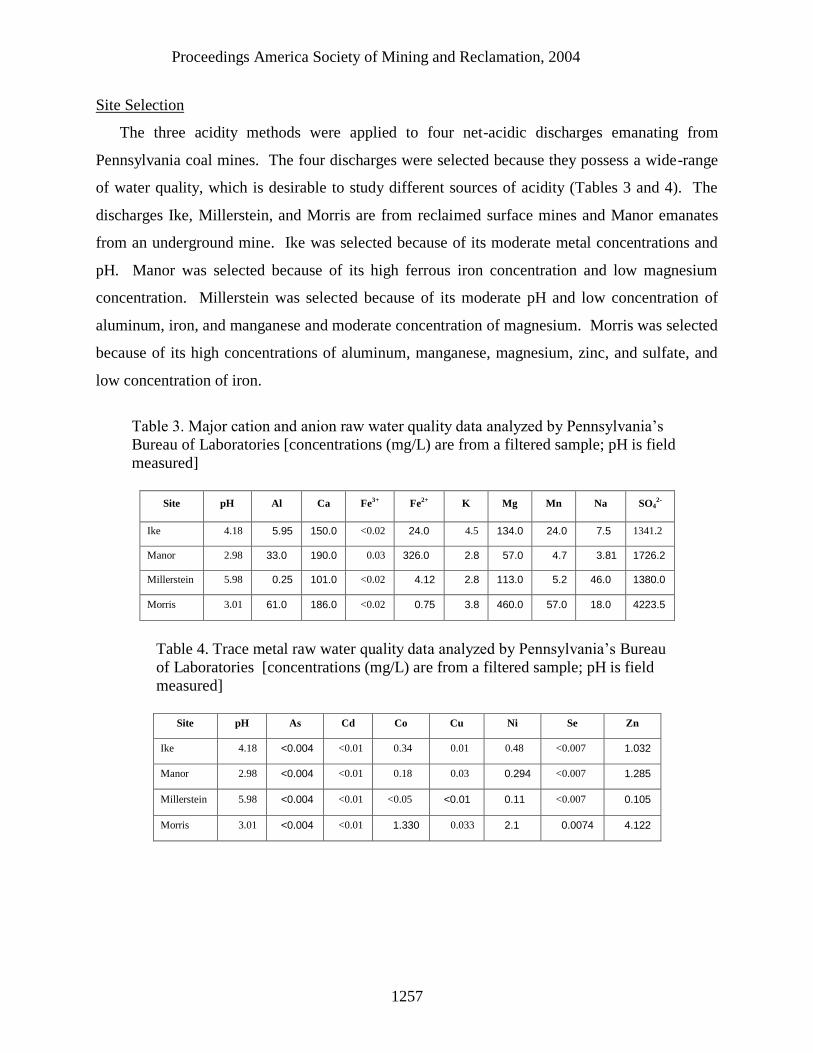
Site Selection
The three acidity methods were applied to four net-acidic discharges emanating from
Pennsylvania coal mines. The four discharges were selected because they possess a wide-range
of water quality, which is desirable to study different sources of acidity (Tables 3 and 4). The
discharges Ike, Millerstein, and Morris are from reclaimed surface mines and Manor emanates
from an underground mine. Ike was selected because of its moderate metal concentrations and
pH. Manor was selected because of its high ferrous iron concentration and low magnesium
concentration. Millerstein was selected because of its moderate pH and low concentration of
aluminum, iron, and manganese and moderate concentration of magnesium. Morris was selected
because of its high concentrations of aluminum, manganese, magnesium, zinc, and sulfate, and
low concentration of iron.
Table 3. Major cation and anion raw water quality data analyzed by Pennsylvania’s
Bureau of Laboratories [concentrations (mg/L) are from a filtered sample; pH is field
measured]
Site pH Al Ca Fe3+
Fe2+
K Mg Mn Na SO42-
Ike 4.18 5.95 150.0 <0.02 24.0 4.5 134.0 24.0 7.5 1341.2
Manor 2.98 33.0 190.0 0.03 326.0 2.8 57.0 4.7 3.81 1726.2
Millerstein 5.98 0.25 101.0 <0.02 4.12 2.8 113.0 5.2 46.0 1380.0
Morris 3.01 61.0 186.0 <0.02 0.75 3.8 460.0 57.0 18.0 4223.5
Table 4. Trace metal raw water quality data analyzed by Pennsylvania’s Bureau
of Laboratories [concentrations (mg/L) are from a filtered sample; pH is field
measured]
Site pH As Cd Co Cu Ni Se Zn
Ike 4.18 <0.004 <0.01 0.34 0.01 0.48 <0.007 1.032
Manor 2.98 <0.004 <0.01 0.18 0.03 0.294 <0.007 1.285
Millerstein 5.98 <0.004 <0.01 <0.05 <0.01 0.11 <0.007 0.105
Morris 3.01 <0.004 <0.01 1.330 0.033 2.1 0.0074 4.122
Proceedings America Society of Mining and Reclamation, 2004
1258
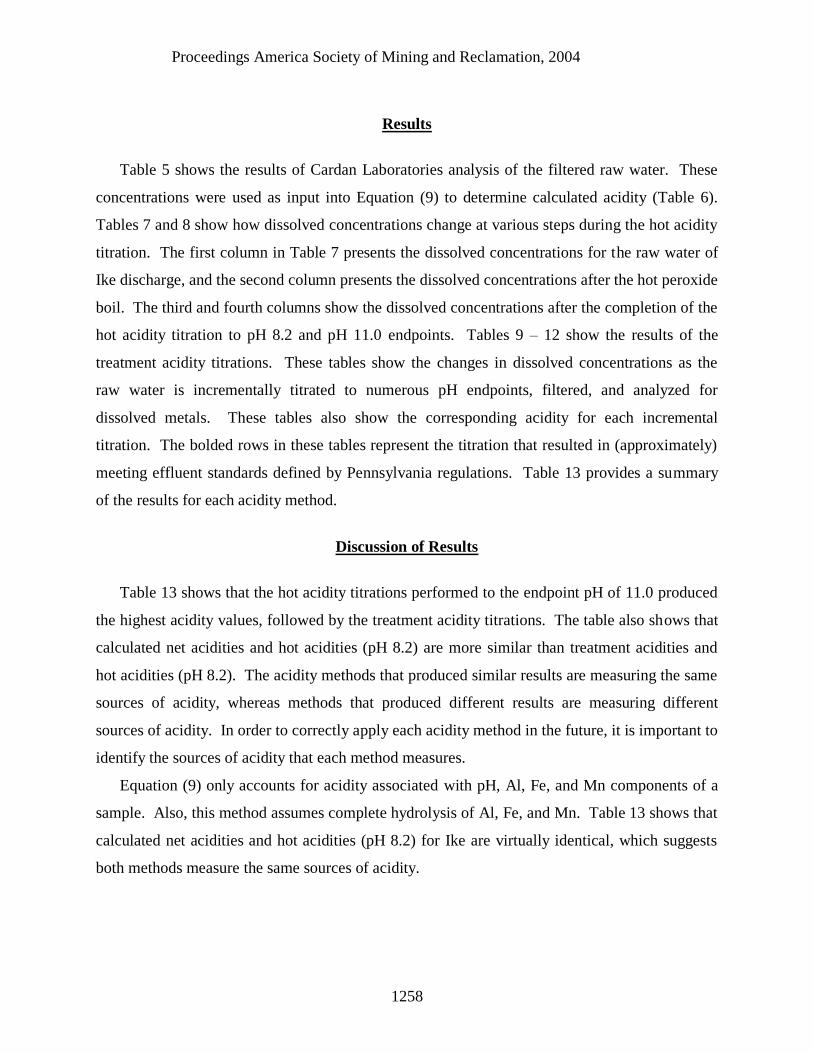
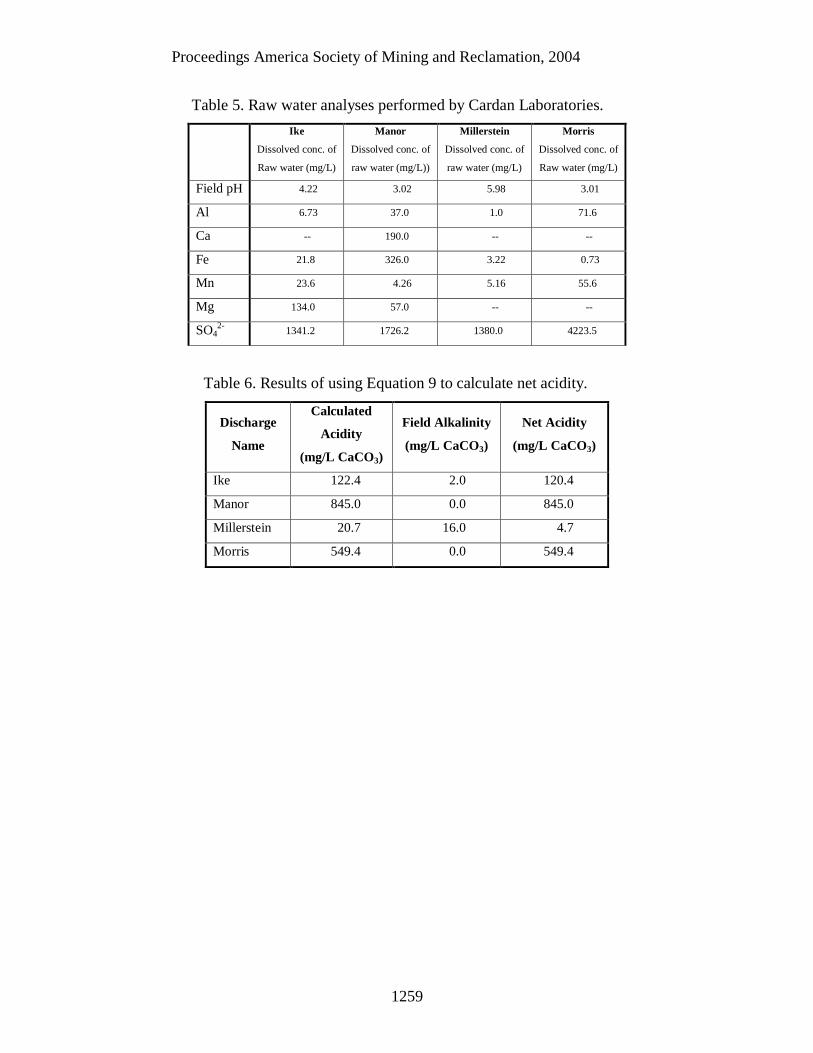
Results
Table 5 shows the results of Cardan Laboratories analysis of the filtered raw water. These
concentrations were used as input into Equation (9) to determine calculated acidity (Table 6).
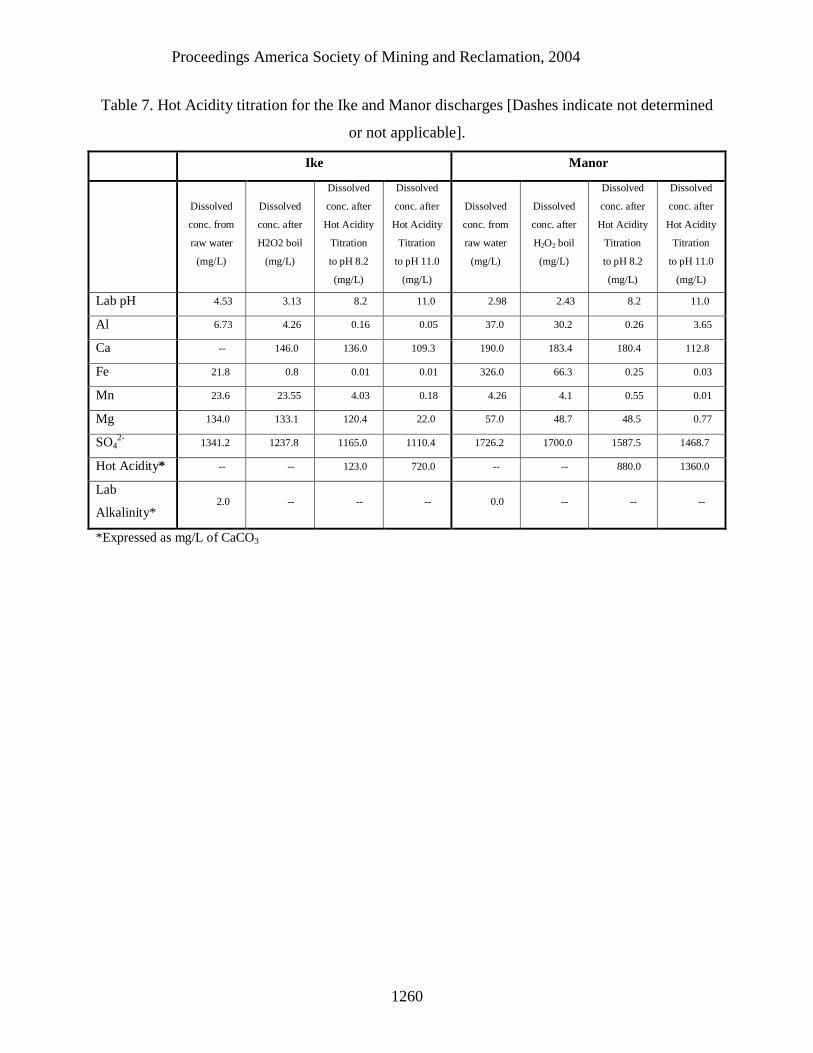
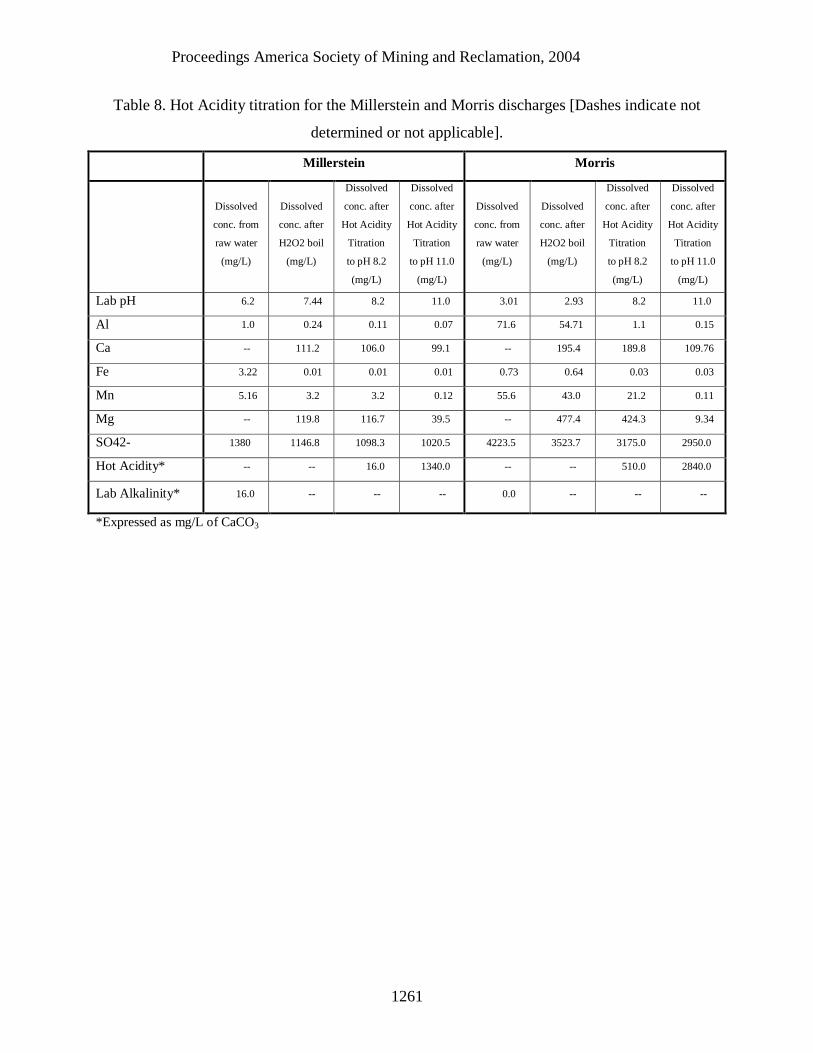
Tables 7 and 8 show how dissolved concentrations change at various steps during the hot acidity
titration. The first column in Table 7 presents the dissolved concentrations for the raw water of
Ike discharge, and the second column presents the dissolved concentrations after the hot peroxide
boil. The third and fourth columns show the dissolved concentrations after the completion of the
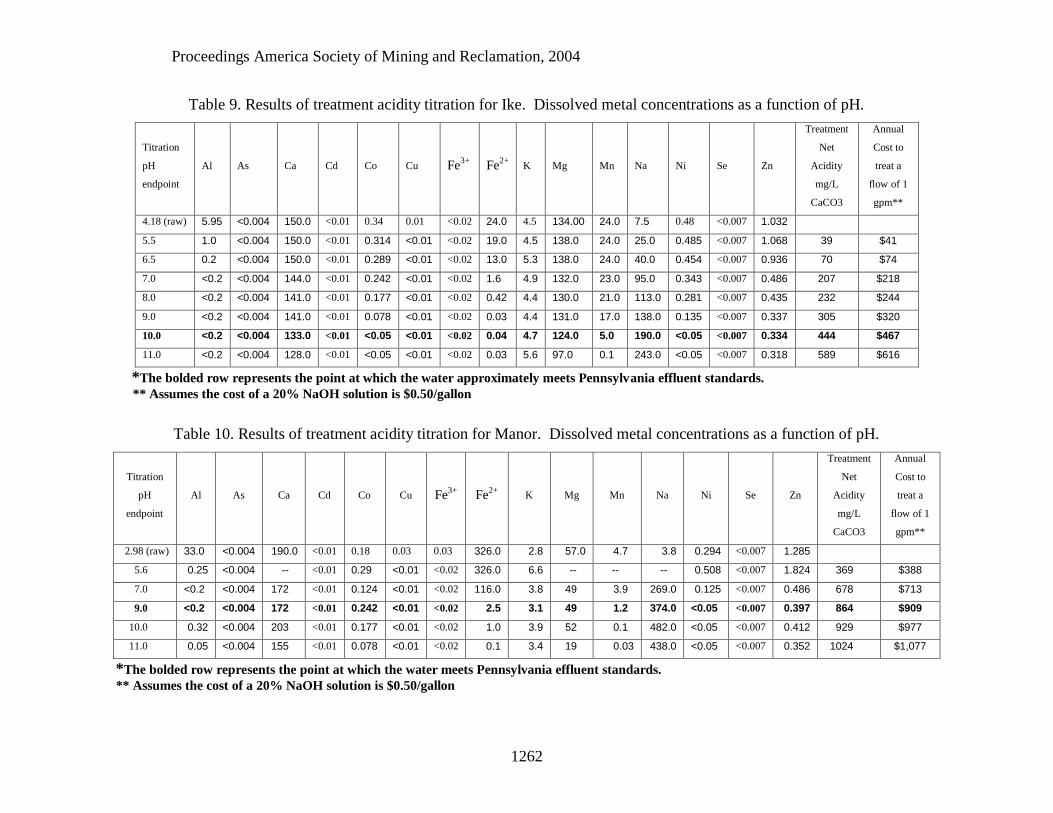
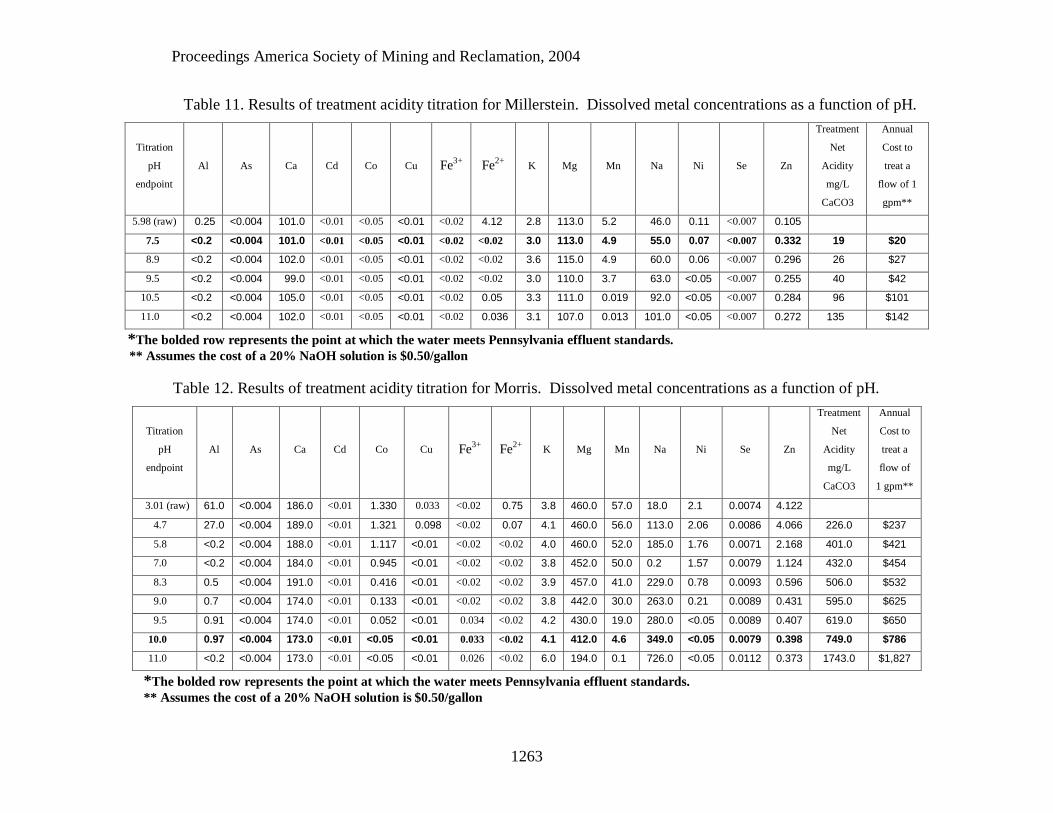
hot acidity titration to pH 8.2 and pH 11.0 endpoints. Tables 9 – 12 show the results of the
treatment acidity titrations. These tables show the changes in dissolved concentrations as the
raw water is incrementally titrated to numerous pH endpoints, filtered, and analyzed for
dissolved metals. These tables also show the corresponding acidity for each incremental
titration. The bolded rows in these tables represent the titration that resulted in (approximately)
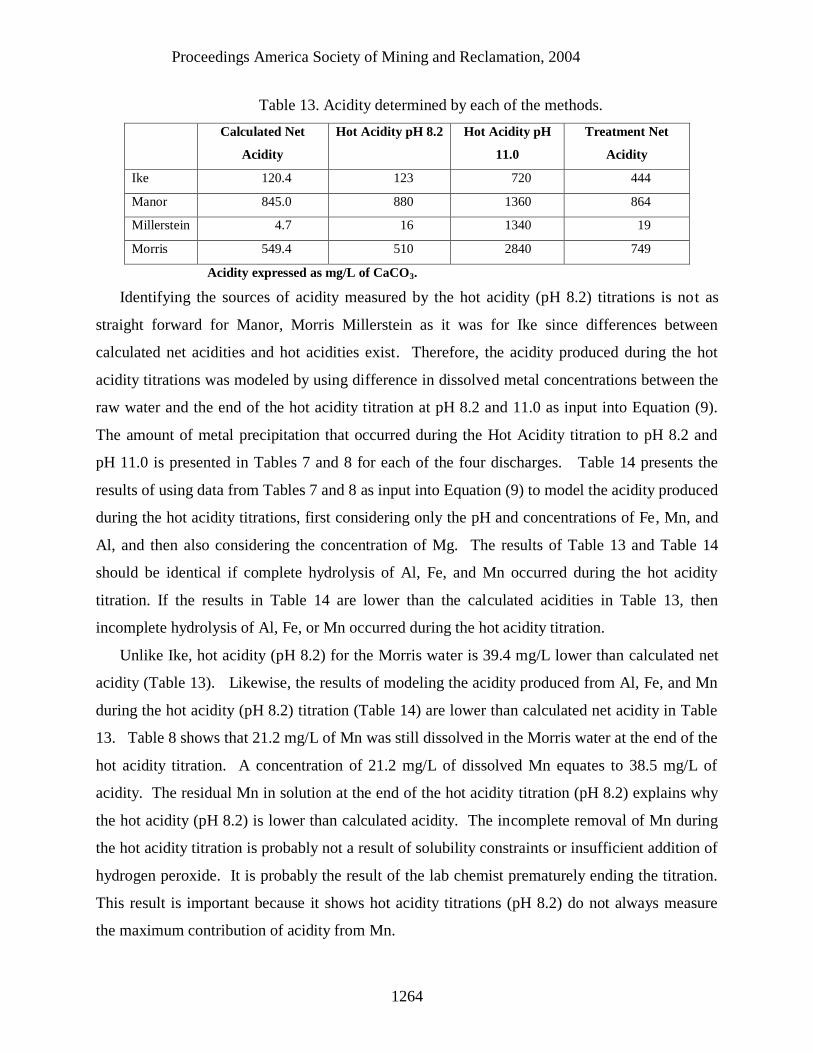
meeting effluent standards defined by Pennsylvania regulations. Table 13 provides a summary
of the results for each acidity method.
Discussion of Results
Table 13 shows that the hot acidity titrations performed to the endpoint pH of 11.0 produced
the highest acidity values, followed by the treatment acidity titrations. The table also shows that
calculated net acidities and hot acidities (pH 8.2) are more similar than treatment acidities and
hot acidities (pH 8.2). The acidity methods that produced similar results are measuring the same
sources of acidity, whereas methods that produced different results are measuring different
sources of acidity. In order to correctly apply each acidity method in the future, it is important to
identify the sources of acidity that each method measures.
Equation (9) only accounts for acidity associated with pH, Al, Fe, and Mn components of a
sample. Also, this method assumes complete hydrolysis of Al, Fe, and Mn. Table 13 shows that
calculated net acidities and hot acidities (pH 8.2) for Ike are virtually identical, which suggests
both methods measure the same sources of acidity.
Proceedings America Society of Mining and Reclamation, 2004
1259
Table 5. Raw water analyses performed by Cardan Laboratories.
Ike
Dissolved conc. of
Raw water (mg/L)
Manor
Dissolved conc. of
raw water (mg/L))
Millerstein
Dissolved conc. of
raw water (mg/L)
Morris
Dissolved conc. of
Raw water (mg/L)
Field pH 4.22 3.02 5.98 3.01
Al 6.73 37.0 1.0 71.6
Ca -- 190.0 -- --
Fe 21.8 326.0 3.22 0.73
Mn 23.6 4.26 5.16 55.6
Mg 134.0 57.0 -- --
SO42-
1341.2 1726.2 1380.0 4223.5
Table 6. Results of using Equation 9 to calculate net acidity.
Discharge
Name
Calculated
Acidity
(mg/L CaCO3)
Field Alkalinity
(mg/L CaCO3)
Net Acidity
(mg/L CaCO3)
Ike 122.4 2.0 120.4
Manor 845.0 0.0 845.0
Millerstein 20.7 16.0 4.7
Morris 549.4 0.0 549.4
Proceedings America Society of Mining and Reclamation, 2004
1260
Table 7. Hot Acidity titration for the Ike and Manor discharges [Dashes indicate not determined
or not applicable].
Ike Manor
Dissolved
conc. from
raw water
(mg/L)
Dissolved
conc. after
H2O2 boil
(mg/L)
Dissolved
conc. after
Hot Acidity
Titration
to pH 8.2
(mg/L)
Dissolved
conc. after
Hot Acidity
Titration
to pH 11.0
(mg/L)
Dissolved
conc. from
raw water
(mg/L)
Dissolved
conc. after
H2O2 boil
(mg/L)
Dissolved
conc. after
Hot Acidity
Titration
to pH 8.2
(mg/L)
Dissolved
conc. after
Hot Acidity
Titration
to pH 11.0
(mg/L)
Lab pH 4.53 3.13 8.2 11.0 2.98 2.43 8.2 11.0
Al 6.73 4.26 0.16 0.05 37.0 30.2 0.26 3.65
Ca -- 146.0 136.0 109.3 190.0 183.4 180.4 112.8
Fe 21.8 0.8 0.01 0.01 326.0 66.3 0.25 0.03
Mn 23.6 23.55 4.03 0.18 4.26 4.1 0.55 0.01
Mg 134.0 133.1 120.4 22.0 57.0 48.7 48.5 0.77
SO42-
1341.2 1237.8 1165.0 1110.4 1726.2 1700.0 1587.5 1468.7
Hot Acidity* -- -- 123.0 720.0 -- -- 880.0 1360.0
Lab
Alkalinity* 2.0 -- -- -- 0.0 -- -- --
*Expressed as mg/L of CaCO3
Proceedings America Society of Mining and Reclamation, 2004
1261
Table 8. Hot Acidity titration for the Millerstein and Morris discharges [Dashes indicate not
determined or not applicable].
Millerstein Morris
Dissolved
conc. from
raw water
(mg/L)
Dissolved
conc. after
H2O2 boil
(mg/L)
Dissolved
conc. after
Hot Acidity
Titration
to pH 8.2
(mg/L)
Dissolved
conc. after
Hot Acidity
Titration
to pH 11.0
(mg/L)
Dissolved
conc. from
raw water
(mg/L)
Dissolved
conc. after
H2O2 boil
(mg/L)
Dissolved
conc. after
Hot Acidity
Titration
to pH 8.2
(mg/L)
Dissolved
conc. after
Hot Acidity
Titration
to pH 11.0
(mg/L)
Lab pH 6.2 7.44 8.2 11.0 3.01 2.93 8.2 11.0
Al 1.0 0.24 0.11 0.07 71.6 54.71 1.1 0.15
Ca -- 111.2 106.0 99.1 -- 195.4 189.8 109.76
Fe 3.22 0.01 0.01 0.01 0.73 0.64 0.03 0.03
Mn 5.16 3.2 3.2 0.12 55.6 43.0 21.2 0.11
Mg -- 119.8 116.7 39.5 -- 477.4 424.3 9.34
SO42- 1380 1146.8 1098.3 1020.5 4223.5 3523.7 3175.0 2950.0
Hot Acidity* -- -- 16.0 1340.0 -- -- 510.0 2840.0
Lab Alkalinity* 16.0 -- -- -- 0.0 -- -- --
*Expressed as mg/L of CaCO3
Proceedings America Society of Mining and Reclamation, 2004
1262
Table 9. Results of treatment acidity titration for Ike. Dissolved metal concentrations as a function of pH.
Titration
pH
endpoint
Al As Ca Cd Co Cu Fe3+
Fe2+
K Mg Mn Na Ni Se Zn
Treatment
Net
Acidity
mg/L
CaCO3
Annual
Cost to
treat a
flow of 1
gpm**
4.18 (raw) 5.95 <0.004 150.0 <0.01 0.34 0.01 <0.02 24.0 4.5 134.00 24.0 7.5 0.48 <0.007 1.032
5.5 1.0 <0.004 150.0 <0.01 0.314 <0.01 <0.02 19.0 4.5 138.0 24.0 25.0 0.485 <0.007 1.068 39 $41
6.5 0.2 <0.004 150.0 <0.01 0.289 <0.01 <0.02 13.0 5.3 138.0 24.0 40.0 0.454 <0.007 0.936 70 $74
7.0 <0.2 <0.004 144.0 <0.01 0.242 <0.01 <0.02 1.6 4.9 132.0 23.0 95.0 0.343 <0.007 0.486 207 $218
8.0 <0.2 <0.004 141.0 <0.01 0.177 <0.01 <0.02 0.42 4.4 130.0 21.0 113.0 0.281 <0.007 0.435 232 $244
9.0 <0.2 <0.004 141.0 <0.01 0.078 <0.01 <0.02 0.03 4.4 131.0 17.0 138.0 0.135 <0.007 0.337 305 $320
10.0 <0.2 <0.004 133.0 <0.01 <0.05 <0.01 <0.02 0.04 4.7 124.0 5.0 190.0 <0.05 <0.007 0.334 444 $467
11.0 <0.2 <0.004 128.0 <0.01 <0.05 <0.01 <0.02 0.03 5.6 97.0 0.1 243.0 <0.05 <0.007 0.318 589 $616
*The bolded row represents the point at which the water approximately meets Pennsylvania effluent standards.
** Assumes the cost of a 20% NaOH solution is $0.50/gallon
Table 10. Results of treatment acidity titration for Manor. Dissolved metal concentrations as a function of pH.
Titration
pH
endpoint
Al As Ca Cd Co Cu Fe3+
Fe2+
K Mg Mn Na Ni Se Zn
Treatment
Net
Acidity
mg/L
CaCO3
Annual
Cost to
treat a
flow of 1
gpm**
2.98 (raw) 33.0 <0.004 190.0 <0.01 0.18 0.03 0.03 326.0 2.8 57.0 4.7 3.8 0.294 <0.007 1.285
5.6 0.25 <0.004 -- <0.01 0.29 <0.01 <0.02 326.0 6.6 -- -- -- 0.508 <0.007 1.824 369 $388
7.0 <0.2 <0.004 172 <0.01 0.124 <0.01 <0.02 116.0 3.8 49 3.9 269.0 0.125 <0.007 0.486 678 $713
9.0 <0.2 <0.004 172 <0.01 0.242 <0.01 <0.02 2.5 3.1 49 1.2 374.0 <0.05 <0.007 0.397 864 $909
10.0 0.32 <0.004 203 <0.01 0.177 <0.01 <0.02 1.0 3.9 52 0.1 482.0 <0.05 <0.007 0.412 929 $977
11.0 0.05 <0.004 155 <0.01 0.078 <0.01 <0.02 0.1 3.4 19 0.03 438.0 <0.05 <0.007 0.352 1024 $1,077
*The bolded row represents the point at which the water meets Pennsylvania effluent standards.
** Assumes the cost of a 20% NaOH solution is $0.50/gallon
Proceedings America Society of Mining and Reclamation, 2004
1263
Table 11. Results of treatment acidity titration for Millerstein. Dissolved metal concentrations as a function of pH.
Titration
pH
endpoint
Al As Ca Cd Co Cu Fe3+
Fe2+
K Mg Mn Na Ni Se Zn
Treatment
Net
Acidity
mg/L
CaCO3
Annual
Cost to
treat a
flow of 1
gpm**
5.98 (raw) 0.25 <0.004 101.0 <0.01 <0.05 <0.01 <0.02 4.12 2.8 113.0 5.2 46.0 0.11 <0.007 0.105
7.5 <0.2 <0.004 101.0 <0.01 <0.05 <0.01 <0.02 <0.02 3.0 113.0 4.9 55.0 0.07 <0.007 0.332 19 $20
8.9 <0.2 <0.004 102.0 <0.01 <0.05 <0.01 <0.02 <0.02 3.6 115.0 4.9 60.0 0.06 <0.007 0.296 26 $27
9.5 <0.2 <0.004 99.0 <0.01 <0.05 <0.01 <0.02 <0.02 3.0 110.0 3.7 63.0 <0.05 <0.007 0.255 40 $42
10.5 <0.2 <0.004 105.0 <0.01 <0.05 <0.01 <0.02 0.05 3.3 111.0 0.019 92.0 <0.05 <0.007 0.284 96 $101
11.0 <0.2 <0.004 102.0 <0.01 <0.05 <0.01 <0.02 0.036 3.1 107.0 0.013 101.0 <0.05 <0.007 0.272 135 $142
*The bolded row represents the point at which the water meets Pennsylvania effluent standards.
** Assumes the cost of a 20% NaOH solution is $0.50/gallon
Table 12. Results of treatment acidity titration for Morris. Dissolved metal concentrations as a function of pH.
Titration
pH
endpoint
Al As Ca Cd Co Cu Fe3+
Fe2+
K Mg Mn Na Ni Se Zn
Treatment
Net
Acidity
mg/L
CaCO3
Annual
Cost to
treat a
flow of
1 gpm**
3.01 (raw) 61.0 <0.004 186.0 <0.01 1.330 0.033 <0.02 0.75 3.8 460.0 57.0 18.0 2.1 0.0074 4.122
4.7 27.0 <0.004 189.0 <0.01 1.321 0.098 <0.02 0.07 4.1 460.0 56.0 113.0 2.06 0.0086 4.066 226.0 $237
5.8 <0.2 <0.004 188.0 <0.01 1.117 <0.01 <0.02 <0.02 4.0 460.0 52.0 185.0 1.76 0.0071 2.168 401.0 $421
7.0 <0.2 <0.004 184.0 <0.01 0.945 <0.01 <0.02 <0.02 3.8 452.0 50.0 0.2 1.57 0.0079 1.124 432.0 $454
8.3 0.5 <0.004 191.0 <0.01 0.416 <0.01 <0.02 <0.02 3.9 457.0 41.0 229.0 0.78 0.0093 0.596 506.0 $532
9.0 0.7 <0.004 174.0 <0.01 0.133 <0.01 <0.02 <0.02 3.8 442.0 30.0 263.0 0.21 0.0089 0.431 595.0 $625
9.5 0.91 <0.004 174.0 <0.01 0.052 <0.01 0.034 <0.02 4.2 430.0 19.0 280.0 <0.05 0.0089 0.407 619.0 $650
10.0 0.97 <0.004 173.0 <0.01 <0.05 <0.01 0.033 <0.02 4.1 412.0 4.6 349.0 <0.05 0.0079 0.398 749.0 $786
11.0 <0.2 <0.004 173.0 <0.01 <0.05 <0.01 0.026 <0.02 6.0 194.0 0.1 726.0 <0.05 0.0112 0.373 1743.0 $1,827
*The bolded row represents the point at which the water meets Pennsylvania effluent standards. ** Assumes the cost of a 20% NaOH solution is $0.50/gallon
Proceedings America Society of Mining and Reclamation, 2004
1264
Table 13. Acidity determined by each of the methods.
Calculated Net
Acidity
Hot Acidity pH 8.2 Hot Acidity pH
11.0
Treatment Net
Acidity
Ike 120.4 123 720 444
Manor 845.0 880 1360 864
Millerstein 4.7 16 1340 19
Morris 549.4 510 2840 749
Acidity expressed as mg/L of CaCO3.
Identifying the sources of acidity measured by the hot acidity (pH 8.2) titrations is not as
straight forward for Manor, Morris Millerstein as it was for Ike since differences between
calculated net acidities and hot acidities exist. Therefore, the acidity produced during the hot
acidity titrations was modeled by using difference in dissolved metal concentrations between the
raw water and the end of the hot acidity titration at pH 8.2 and 11.0 as input into Equation (9).
The amount of metal precipitation that occurred during the Hot Acidity titration to pH 8.2 and
pH 11.0 is presented in Tables 7 and 8 for each of the four discharges. Table 14 presents the
results of using data from Tables 7 and 8 as input into Equation (9) to model the acidity produced
during the hot acidity titrations, first considering only the pH and concentrations of Fe, Mn, and
Al, and then also considering the concentration of Mg. The results of Table 13 and Table 14
should be identical if complete hydrolysis of Al, Fe, and Mn occurred during the hot acidity
titration. If the results in Table 14 are lower than the calculated acidities in Table 13, then
incomplete hydrolysis of Al, Fe, or Mn occurred during the hot acidity titration.
Unlike Ike, hot acidity (pH 8.2) for the Morris water is 39.4 mg/L lower than calculated net
acidity (Table 13). Likewise, the results of modeling the acidity produced from Al, Fe, and Mn
during the hot acidity (pH 8.2) titration (Table 14) are lower than calculated net acidity in Table
13. Table 8 shows that 21.2 mg/L of Mn was still dissolved in the Morris water at the end of the
hot acidity titration. A concentration of 21.2 mg/L of dissolved Mn equates to 38.5 mg/L of
acidity. The residual Mn in solution at the end of the hot acidity titration (pH 8.2) explains why
the hot acidity (pH 8.2) is lower than calculated acidity. The incomplete removal of Mn during
the hot acidity titration is probably not a result of solubility constraints or insufficient addition of
hydrogen peroxide. It is probably the result of the lab chemist prematurely ending the titration.
This result is important because it shows hot acidity titrations (pH 8.2) do not always measure
the maximum contribution of acidity from Mn.
Proceedings America Society of Mining and Reclamation, 2004
1265
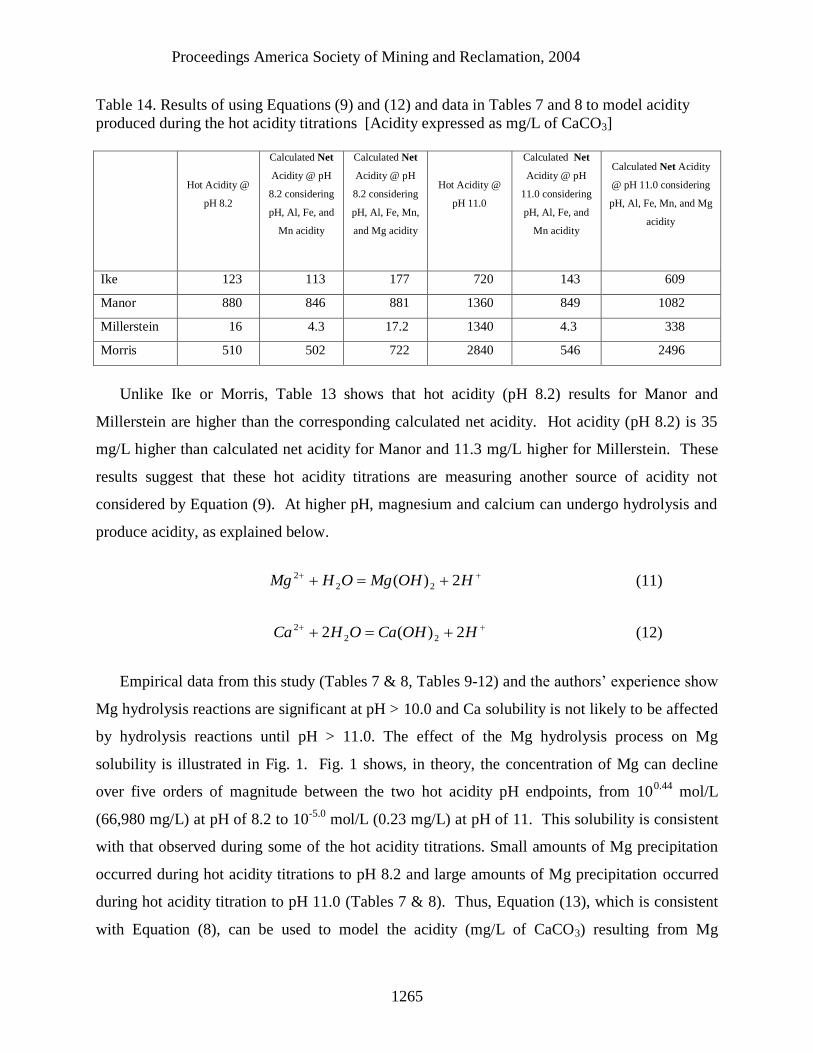
Table 14. Results of using Equations (9) and (12) and data in Tables 7 and 8 to model acidity
produced during the hot acidity titrations [Acidity expressed as mg/L of CaCO3]
Hot Acidity @
pH 8.2
Calculated Net
Acidity @ pH
8.2 considering
pH, Al, Fe, and
Mn acidity
Calculated Net
Acidity @ pH
8.2 considering
pH, Al, Fe, Mn,
and Mg acidity
Hot Acidity @
pH 11.0
Calculated Net
Acidity @ pH
11.0 considering
pH, Al, Fe, and
Mn acidity
Calculated Net Acidity
@ pH 11.0 considering
pH, Al, Fe, Mn, and Mg
acidity
Ike 123 113 177 720 143 609
Manor 880 846 881 1360 849 1082
Millerstein 16 4.3 17.2 1340 4.3 338
Morris 510 502 722 2840 546 2496
Unlike Ike or Morris, Table 13 shows that hot acidity (pH 8.2) results for Manor and
Millerstein are higher than the corresponding calculated net acidity. Hot acidity (pH 8.2) is 35
mg/L higher than calculated net acidity for Manor and 11.3 mg/L higher for Millerstein. These
results suggest that these hot acidity titrations are measuring another source of acidity not
considered by Equation (9). At higher pH, magnesium and calcium can undergo hydrolysis and
produce acidity, as explained below.
HOHMgOHMg 2)( 22
2 (11)
HOHCaOHCa 2)(2 22
2 (12)
Empirical data from this study (Tables 7 & 8, Tables 9-12) and the authors’ experience show
Mg hydrolysis reactions are significant at pH > 10.0 and Ca solubility is not likely to be affected
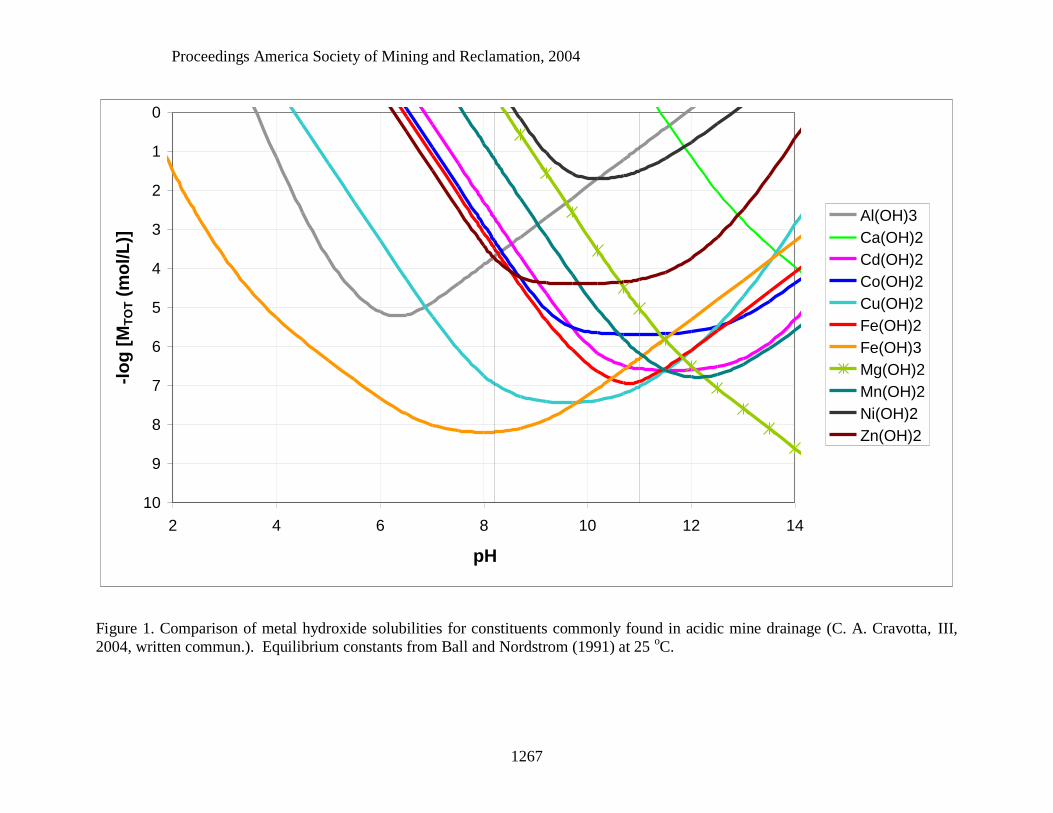
by hydrolysis reactions until pH > 11.0. The effect of the Mg hydrolysis process on Mg
solubility is illustrated in Fig. 1. Fig. 1 shows, in theory, the concentration of Mg can decline
over five orders of magnitude between the two hot acidity pH endpoints, from 100.44
mol/L
(66,980 mg/L) at pH of 8.2 to 10-5.0
mol/L (0.23 mg/L) at pH of 11. This solubility is consistent
with that observed during some of the hot acidity titrations. Small amounts of Mg precipitation
occurred during hot acidity titrations to pH 8.2 and large amounts of Mg precipitation occurred
during hot acidity titration to pH 11.0 (Tables 7 & 8). Thus, Equation (13), which is consistent
with Equation (8), can be used to model the acidity (mg/L of CaCO3) resulting from Mg
Proceedings America Society of Mining and Reclamation, 2004
1266
hydrolysis at high pH. It should not be automatically assumed that reductions in Mg and Ca
during acidity titrations resulted in acidity production. Reduction in Mg and Ca may be
attributable to adsorption to precipitates or to the precipitation of calcium carbonate.
24
250
2MgMgAcidity (13)
While the results show that hot acidities for Manor and Millerstein are greater than calculated net
acidities, the results also show Mg precipitated during the hot acidity titrations. Tables 7 and 8
show that 8.5 mg/L of Mg precipitated during the Manor Hot Acidity titration to pH 8.2 and 3.1
mg/L precipitated during the Millerstein titration. Equation (13) was used to evaluate whether
the difference between the acidity measured by the hot acidity (pH 8.2) titrations and calculated
acidity for Manor and Millerstein may be due to the hydrolysis of Mg. The hydrolysis of 8.5
mg/L of Mg results in 35 mg/L of acidity and hydrolysis of 3.1 mg/L of Mg results in 12.9 mg/L
of acidity. As Table 14 shows, the addition of the Mg acidity to the calculated net acidity that
only considers Al, Fe, and Mn hydrolysis results in acidity values that are almost identical to the
hot acidities (pH 8.2) for Manor and Millerstein. The hydrolysis of Mg is the source of acidity
that resulted in a higher hot acidity (pH 8.2) for Manor and Millerstein. These results suggest
that for Manor and Millerstein a hot acidity titration to pH 8.2 mainly measured acidity due to
pH, Al, Fe, and Mn but also measured a small amount of acidity from the hydrolysis of Mg.
This is consistent with the work of Payne and Yeates (1970).
Proceedings America Society of Mining and Reclamation, 2004
1267
0
1
2
3
4
5
6
7
8
9
10
2 4 6 8 10 12 14
pH
-lo
g [
MT
OT (
mo
l/L
)]
Al(OH)3
Ca(OH)2
Cd(OH)2
Co(OH)2
Cu(OH)2
Fe(OH)2
Fe(OH)3
Mg(OH)2
Mn(OH)2
Ni(OH)2
Zn(OH)2
Figure 1. Comparison of metal hydroxide solubilities for constituents commonly found in acidic mine drainage (C. A. Cravotta, III,
2004, written commun.). Equilibrium constants from Ball and Nordstrom (1991) at 25 oC.
Proceedings America Society of Mining and Reclamation, 2004
1268
A similar process to that used above was used to try to identify the sources of acidity
measured during the treatment titrations (Tables 9 – 12). It was assumed that a decline in metal
concentration during the treatment titrations was a result of hydrolysis reactions. The amount of
metal precipitation (via hydrolysis) that occurred between each treatment titration was calculated
by subtracting the metal concentrations at the end of each treatment titration from the metal
concentrations in the raw water (Tables 9 – 12). These results were then used as input into
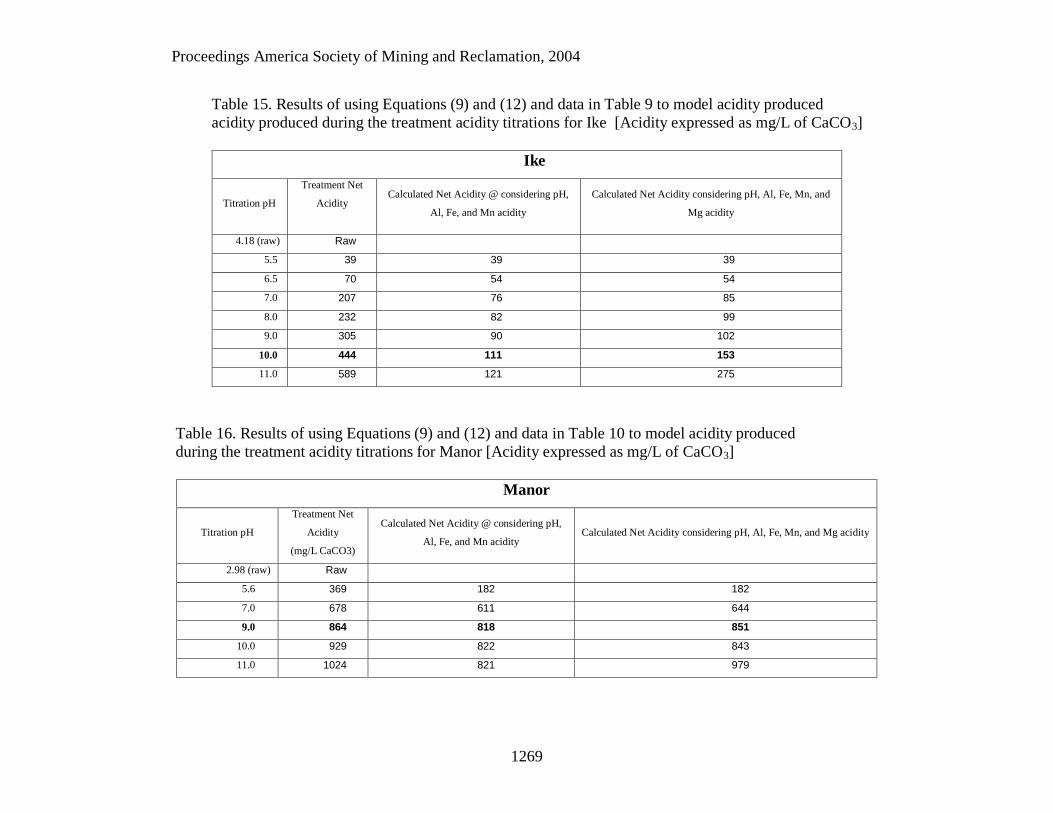
Equation (9) to calculate acidity production from pH, Al, Fe, and Mn. Tables 15 – 18 show the
results of using Equation (9) to model the treatment titrations. The following discussion will
focus on the bolded rows in Tables 9-12 and 15-18 since these rows represent the (approximate)
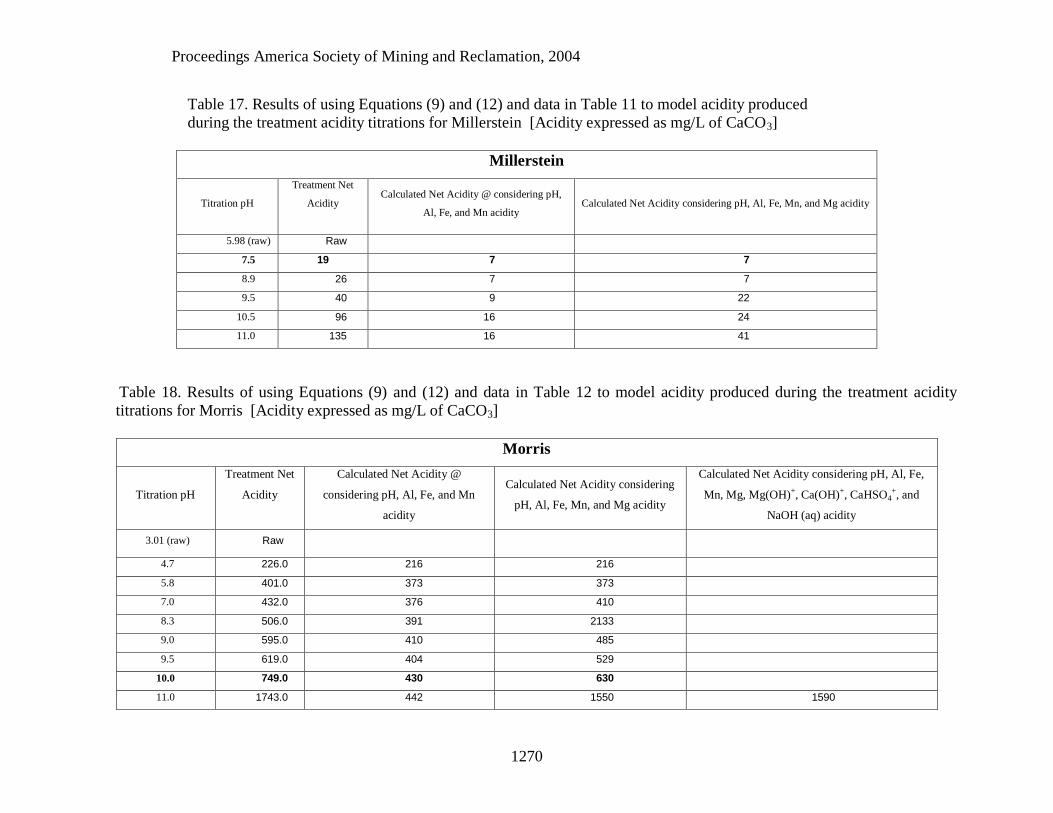
point at which effluent standards are met. Tables 15-18 show that for all cases but Millerstein,
the treatment titration acidity is considerably higher than the results using Equation (9). This is
probably because only a small amount of Mn had to be precipitated for Millerstein to meet
effluent standards, so the pH did not have to be raised as high as normally required for
significant Mn removal. Tables 15-18 show that it is at high pH (e.g. pH > 9) that sources of
acidity not considered by Equation (9) become significant (i.e. treatment acidities > calculated
net acidities). The other waters had either high levels of Mn or Fe2+
, which require high pH for
precipitation by hydrolysis. Ike, Manor, and Morris did not meet effluent standards until the pH
was raised to approximately 10.0, 9.0, and 11.0, respectively. As Tables 15, 16, and 18 show, the
large difference between the calculated net acidity and the treatment titration acidity indicates
that another source(s) of acidity, not considered by Equation (9) was present which resulted in
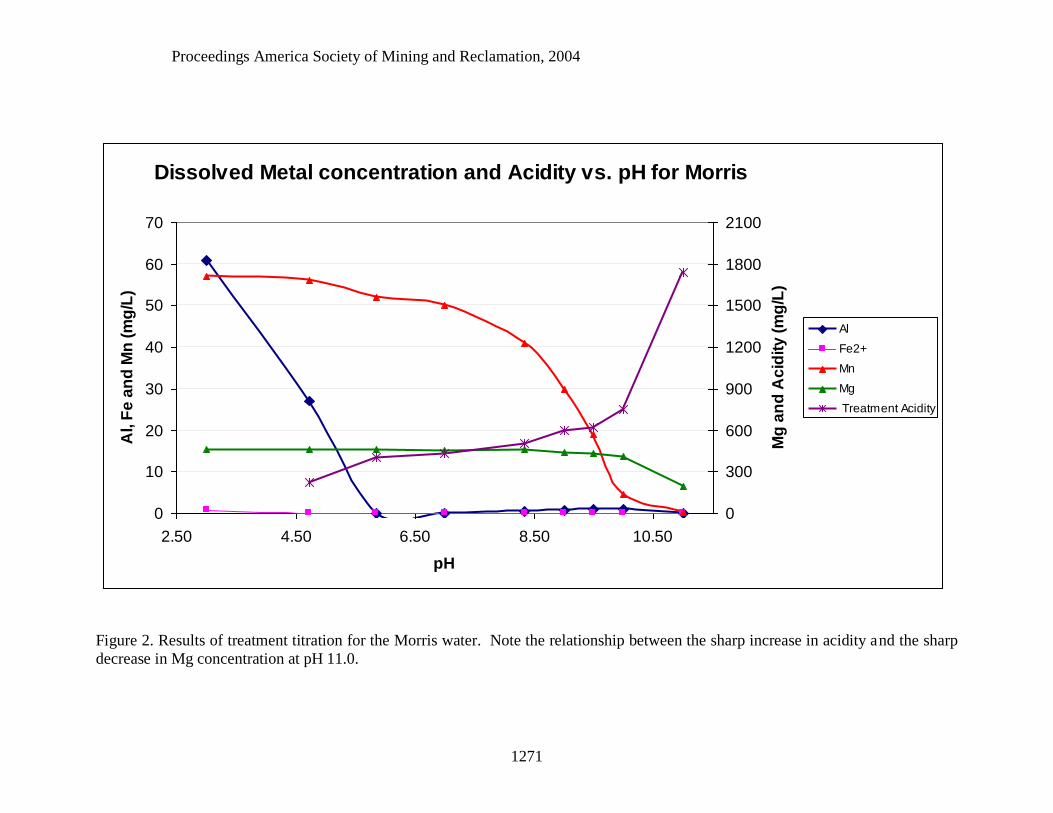
much higher treatment titration acidities. Tables 9 – 12 show large reductions in Mg occurred
during the Treatment Titrations at high pH. While the results of the Manor and Millerstein hot
acidity titrations showed that Mg produced acidity during the hot acidity titrations, the results of
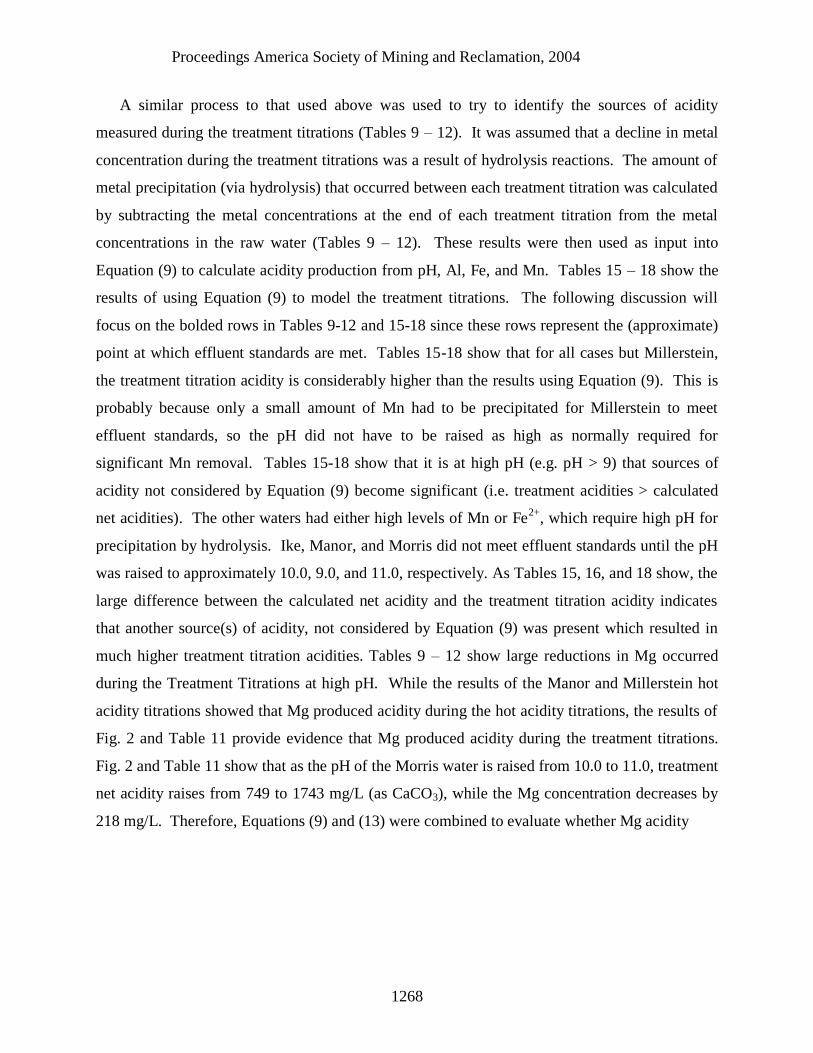
Fig. 2 and Table 11 provide evidence that Mg produced acidity during the treatment titrations.
Fig. 2 and Table 11 show that as the pH of the Morris water is raised from 10.0 to 11.0, treatment
net acidity raises from 749 to 1743 mg/L (as CaCO3), while the Mg concentration decreases by
218 mg/L. Therefore, Equations (9) and (13) were combined to evaluate whether Mg acidity
Proceedings America Society of Mining and Reclamation, 2004
1269
Table 15. Results of using Equations (9) and (12) and data in Table 9 to model acidity produced
acidity produced during the treatment acidity titrations for Ike [Acidity expressed as mg/L of CaCO3]
Ike
Titration pH
Treatment Net
Acidity
Calculated Net Acidity @ considering pH,
Al, Fe, and Mn acidity
Calculated Net Acidity considering pH, Al, Fe, Mn, and
Mg acidity
4.18 (raw) Raw
5.5 39 39 39
6.5 70 54 54
7.0 207 76 85
8.0 232 82 99
9.0 305 90 102
10.0 444 111 153
11.0 589 121 275
Table 16. Results of using Equations (9) and (12) and data in Table 10 to model acidity produced
during the treatment acidity titrations for Manor [Acidity expressed as mg/L of CaCO3]
Manor
Titration pH
Treatment Net
Acidity
(mg/L CaCO3)
Calculated Net Acidity @ considering pH,
Al, Fe, and Mn acidity Calculated Net Acidity considering pH, Al, Fe, Mn, and Mg acidity
2.98 (raw) Raw
5.6 369 182 182
7.0 678 611 644
9.0 864 818 851
10.0 929 822 843
11.0 1024 821 979
Proceedings America Society of Mining and Reclamation, 2004
1270
Table 17. Results of using Equations (9) and (12) and data in Table 11 to model acidity produced
during the treatment acidity titrations for Millerstein [Acidity expressed as mg/L of CaCO3]
Millerstein
Titration pH
Treatment Net
Acidity
Calculated Net Acidity @ considering pH,
Al, Fe, and Mn acidity Calculated Net Acidity considering pH, Al, Fe, Mn, and Mg acidity
5.98 (raw) Raw
7.5 19 7 7
8.9 26 7 7
9.5 40 9 22
10.5 96 16 24
11.0 135 16 41
Table 18. Results of using Equations (9) and (12) and data in Table 12 to model acidity produced during the treatment acidity
titrations for Morris [Acidity expressed as mg/L of CaCO3]
Morris
Titration pH
Treatment Net
Acidity
Calculated Net Acidity @
considering pH, Al, Fe, and Mn
acidity
Calculated Net Acidity considering
pH, Al, Fe, Mn, and Mg acidity
Calculated Net Acidity considering pH, Al, Fe,
Mn, Mg, Mg(OH)+, Ca(OH)+, CaHSO4+, and
NaOH (aq) acidity
3.01 (raw) Raw
4.7 226.0 216 216
5.8 401.0 373 373
7.0 432.0 376 410
8.3 506.0 391 2133
9.0 595.0 410 485
9.5 619.0 404 529
10.0 749.0 430 630
11.0 1743.0 442 1550 1590
Proceedings America Society of Mining and Reclamation, 2004
1271
Figure 2. Results of treatment titration for the Morris water. Note the relationship between the sharp increase in acidity and the sharp
decrease in Mg concentration at pH 11.0.
Dissolved Metal concentration and Acidity vs. pH for Morris
0
10
20
30
40
50
60
70
2.50 4.50 6.50 8.50 10.50
pH
Al, F
e a
nd
Mn
(m
g/L
)
0
300
600
900
1200
1500
1800
2100
Mg
an
d A
cid
ity (
mg
/L)
Al
Fe2+
Mn
Mg
Treatment Acidity
Proceedings America Society of Mining and Reclamation, 2004
1272
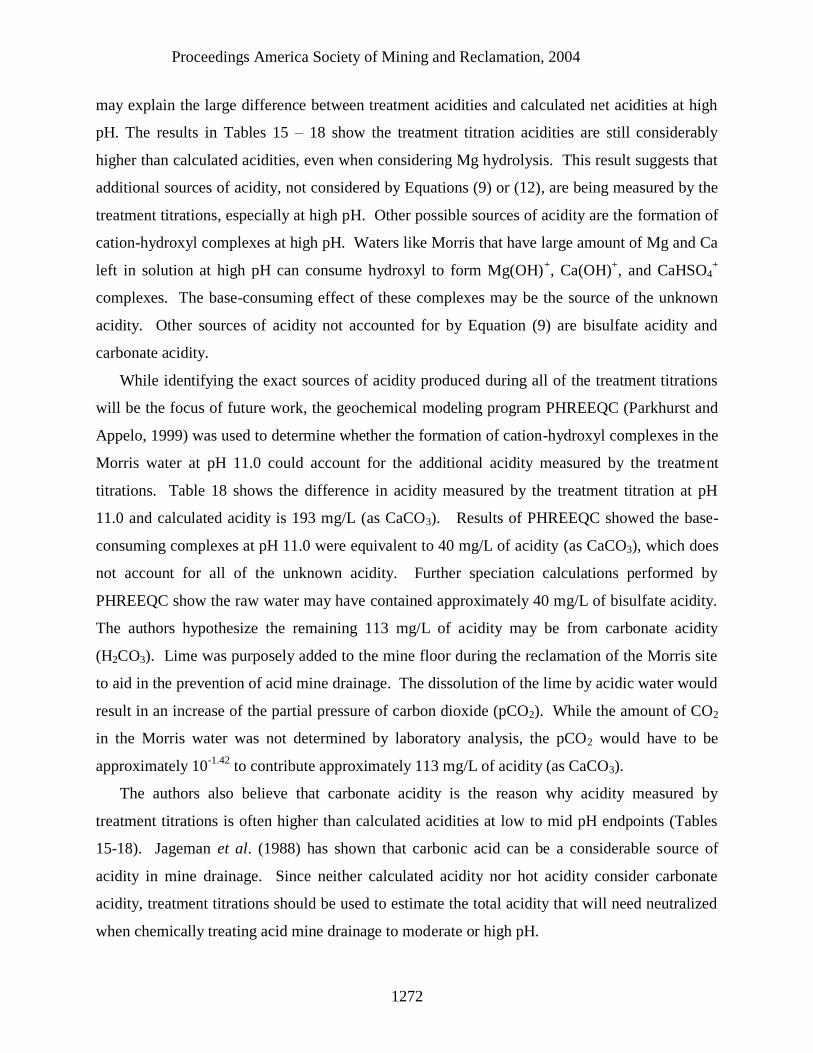
may explain the large difference between treatment acidities and calculated net acidities at high
pH. The results in Tables 15 – 18 show the treatment titration acidities are still considerably
higher than calculated acidities, even when considering Mg hydrolysis. This result suggests that
additional sources of acidity, not considered by Equations (9) or (12), are being measured by the
treatment titrations, especially at high pH. Other possible sources of acidity are the formation of
cation-hydroxyl complexes at high pH. Waters like Morris that have large amount of Mg and Ca
left in solution at high pH can consume hydroxyl to form Mg(OH)+, Ca(OH)
+, and CaHSO4
+
complexes. The base-consuming effect of these complexes may be the source of the unknown
acidity. Other sources of acidity not accounted for by Equation (9) are bisulfate acidity and
carbonate acidity.
While identifying the exact sources of acidity produced during all of the treatment titrations
will be the focus of future work, the geochemical modeling program PHREEQC (Parkhurst and
Appelo, 1999) was used to determine whether the formation of cation-hydroxyl complexes in the
Morris water at pH 11.0 could account for the additional acidity measured by the treatment
titrations. Table 18 shows the difference in acidity measured by the treatment titration at pH
11.0 and calculated acidity is 193 mg/L (as CaCO3). Results of PHREEQC showed the base-
consuming complexes at pH 11.0 were equivalent to 40 mg/L of acidity (as CaCO3), which does
not account for all of the unknown acidity. Further speciation calculations performed by
PHREEQC show the raw water may have contained approximately 40 mg/L of bisulfate acidity.
The authors hypothesize the remaining 113 mg/L of acidity may be from carbonate acidity
(H2CO3). Lime was purposely added to the mine floor during the reclamation of the Morris site
to aid in the prevention of acid mine drainage. The dissolution of the lime by acidic water would
result in an increase of the partial pressure of carbon dioxide (pCO2). While the amount of CO2
in the Morris water was not determined by laboratory analysis, the pCO2 would have to be
approximately 10-1.42
to contribute approximately 113 mg/L of acidity (as CaCO3).
The authors also believe that carbonate acidity is the reason why acidity measured by
treatment titrations is often higher than calculated acidities at low to mid pH endpoints (Tables
15-18). Jageman et al. (1988) has shown that carbonic acid can be a considerable source of
acidity in mine drainage. Since neither calculated acidity nor hot acidity consider carbonate
acidity, treatment titrations should be used to estimate the total acidity that will need neutralized
when chemically treating acid mine drainage to moderate or high pH.
Proceedings America Society of Mining and Reclamation, 2004
1273
Practical Considerations
This study shows that the acidity of mine drainage depends on the method used for
determination and the titration endpoint. This is an important point because it proves that the
commonly used Standard Methods 2310 hot acidity should not be used to universally define the
acidity of mine drainage, as is commonly the case. The results of this study show that hot acidity
(pH 8.2) titrations mostly measure acidity from pH, Al, Fe, and Mn, which are the regulated
parameters in mine drainage. While mine drainage contains elevated levels of numerous
different metals, Al, Fe, and Mn are the metals that are capable of generating considerable
acidity within both the pH range of natural waters and the pH range of effluent water emanating
from limestone-based passive treatment systems. Therefore, hot acidity (pH 8.2) measurements
are suitable for assessing the impact to streams receiving untreated mine drainage and for
predicting the non-carbonate acidity that will need neutralized when passively treating water
with limestone.
This study also showed that hot acidity (pH 8.2) titrations and calculated net acidities
primarily measure identical sources of acidity. Nevertheless, the authors caution against using
Equation (9) as a unanimous substitution for a hot acidity titration. Low pH mine water
containing high levels of sulfate is likely to contain considerable bisulfate. This source of acidity
would be measured by a hot acidity titration but not considered by Equation (9). Misapplication
of Equation (9) to waters containing considerable bisulfate would result in a mischaracterization
of the acidity encountered in the pH range of natural waters.
Standard Methods 2310 hot acidity titration and calculated acidity (Equation (9)) are
designed to measure specific sources of acidity. In fact, the Standard Methods procedure
requires the addition of oxidants and boiling to ensure only the desired sources of acidity are
measured. Treatment titrations indiscriminately measure acidity, including carbonate acidity, as
pH is raised. As the results show, a treatment titration is the most appropriate method for
measuring the acidity neutralized by chemical treatment systems treating to high pH. The results
of a treatment titration are useful to operators of active treatment systems. For example, Table
11 shows the Morris water needs to be treated to (approximately) pH 10.0 to meet effluent
standards. The consequence of over treating this water to pH 11.0 is severe. The acidity
increases from 749 mg/L to 1743 mg/L as CaCO3 and 219 mg/L of Mg precipitates. The effect
of increased acidity and Mg precipitation is twofold. First, the annual cost to treat each gallon
Proceedings America Society of Mining and Reclamation, 2004
1274
per minute of flow with a 20% solution of caustic soda increases from $786 to $1,827 (assuming
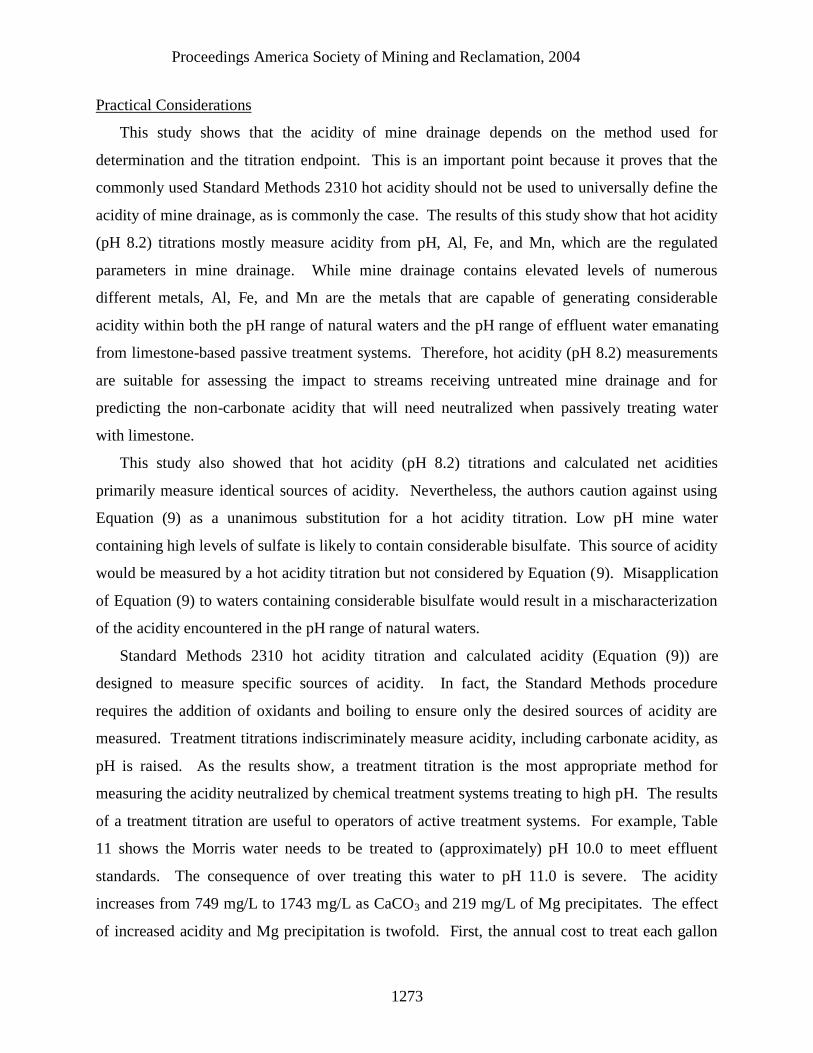
$0.50/gal) (Table 12). Secondly, as Fig. 3 shows, the precipitation of an additional 219 mg/L of
Mg results in a doubling in sludge volume. On the other hand, Table 10 shows that over treating
the Manor water by two pH units will not double chemical costs, as is the case with Morris, since
little Mg exists in the Manor water. Treatment titrations provide treatment plant operators with
the information needed to increase treatment efficiency and reduce treatment costs.
Figure 3. Sludge volumes for Morris discharge titration. Left
to right, titrated to pH 9.0, titrated to pH 10.0, titrated to pH 11.0
An additional point worth mentioning is that every 1 mg/L of Mg is capable of producing 4.1
mg/L of acidity (as CaCO3). This should be of great importance to operators treating mine water
to high pH, since Mg is generally present in large amounts in mine drainage. The authors’
experience is that mine drainage emanating from surface mines in Pennsylvania and West
Virginia generally has greater than 80 mg/L of Mg whereas mine drainage emanating from
underground mines generally has less than 80 mg/L of Mg. Over treating mine drainage may
release large amounts of Mg acidity.
Conclusion
This study showed that hot acidity measurements should not be used to universally define the
acidity of mine drainage. The acidity of mine drainage varies with the method used for
pH 9.0 pH 11.0 pH 10.0
Proceedings America Society of Mining and Reclamation, 2004
1275
determination and with the titration endpoint. For the most part, this study showed Standard
Methods 2310 hot acidity procedure and calculated acidity (Equation (9)) measure the same
sources of acidity. These methods are suitable for estimating the noncarbonate (i.e. pH and
metal) acidity encountered while using a limestone-based passive treatment system to treat mine
drainage, but are not suitable for estimating the acidity encountered while chemically treating
water at high pH. The results of the treatment titrations showed that large amounts of acidity are
released at high pH. The data shows that the hydrolysis of Mg contributes to acidity at high pH;
however, additional unknown sources of acidity exist and their identification will be the focus of
future work. The authors hypothesize that the formation of cation-hydroxyl complexes may be
responsible for the additional acidity. Data produced by the treatment titrations show that the
behavior of Mg in mine water treated to high pH increases both chemical costs and sludge
volumes.
Acknowledgments
The authors are grateful to Dr. Art Rose of Penn State University, Dr. Chuck Cravotta of the
U.S. Geological Survey, and Dr. Carl Kirby of Bucknell University for their valuable insight and
countless discussions on the subject of acidity.
Literature Cited
Acid Drainage Technology Initiative, 2000, Prediction of Water Quality at Surface Coal Mines,
The National Mine Land Reclamation Center, West Virginia University, Morgantown, WV,
241 p.
American Public Health Association, 1998, Standard methods for the examination of water and
wastewater (20th
). Washington, D.C, American Public Health Association, p. 2-24 to 2-26.
American Society for Testing and Materials, 1984, Annual book of ASTM standards, section 11,
water: Philadelphia, v. 11.01, p. 125-133.
Ball, J. W., and Nordstrom, D. K., 1991, User's manual for WATEQ4F with revised data base:
U.S. Geological Survey Open-File Report 91-183, 189 p.
Proceedings America Society of Mining and Reclamation, 2004
1276
Cravotta, C. A., III, and Kirby, C. S., 2004, Acidity and Alkalinity in Mine Drainage: Practical
Considerations, in Proceedings of the 2004 National Meeting of American Society of Mining
& Reclamation and the 25th
West Virginia Surface Mine Drainage Task Force, April 18-24,
2004, Lexington, Ky. American Society of Mining & Reclamation.
Fishman, M. J. and Friedman, L. C., eds., 1989, Methods for determination of inorganic
substances in water and fluvial sediments: U.S. Geological Survey Techniques of Water
Resources Investigations, Book 5, Chapter Al, 545 p.
Jageman, T.C., Yokley, R.A., and Heunisch G.W., 1988, The use of Pre-Aeration to Reduce the
Cost of Neutralizing Acid Mine Drainage, in Proceedings of the 1988 National Meeting of
American Society for Surface Mining & Reclamation, April 19-21, 1988, Pittsburgh, Pa.
Kirby, C. S., 2002, Problems in Acidity and Alkalinity Measurements in Mine Drainage, In
Proceeding of the 19th
Annual Meeting of American Society of Mining and Reclamation,
Lexington, Ky. June9-13, 2002: Lexington, Ky., American Society for Mining &
Reclamation Conference, Lexington, p 1068-1072.
Kirby, C. S., and Cravotta, C. A., III, 2004, Acidity and Alkalinity of Mine Drainage:
Theoretical Considerations, in Proceedings of the 2004 National Meeting of American
Society of Mining & Reclamation and the 25th
West Virginia Surface Mine Drainage Task
Force, April 18-24, 2004, Lexington, Ky. American Society of Mining & Reclamation.
Hedin, R. S., 2004, The use of measured and calculated values to improve the quality of mine
drainage data sets, in Proceedings of the 2004 National Meeting of American Society of
Mining & Reclamation and the 25th
West Virginia Surface Mine Drainage Task Force, April
18-24, 2004, Lexington, Ky. American Society of Mining & Reclamation.
Hedin, R. S, Nairn, R. W., Kleinmann, R. L. P., 1994, Passive Treatment of Coal Mine Drainage:
U.S. Bureau of Mines Info. Circ. No. 9389, 35 p.
Parkhurst, D. L. and Appelo, C. A. J., 1999, User's guide to PHREEQC (Version 2)—A
computer program for speciation, batch-reaction, one-dimensional transport, and inverse
geochemical calculations: U.S. Geological Survey Water-Resources Investigations Report
99-4259, 310 p.
Payne, D. A., and Yeates, T. E., 1970, The effects of magnesium on acidity determinations, in 3rd
Symposium on Coal Mine Drainage Research, National Coal Association/Bituminous Coal
Research, Inc., Pittsburgh, Pa., p. 200-223.
Proceedings America Society of Mining and Reclamation, 2004
1277
Pennsylvania Department of Environmental Protection, 2004, Bituminous Surface Mine Permit
Application 5600-PM-MR0311.
Rose, A. W., and Cravotta, C. A., III, 1998, Geochemistry of coal-mine drainage, in Brady,
K.B.C., Smith, M.W., and Schueck., J., eds, Coal Mine Drainage Prediction and Pollution
Prevention in Pennsylvania: Harrisburg, Pa., Pennsylvania Department of Environmental
Protection, 5600-BK-DEP2256, p. 1.1-1.22
U.S. Environmental Protection Agency, 1979, Acidity 305.1 in Methods for chemical analysis of
water and wastes, EPA/600/4-79/020, Cincinnati, OH.