Embed Size (px)
Citation preview

13-09-2008 BWGHF Liège
Heart transplantation 2008

Evolution of life expectancy at birthin Belgium
source: NIS

number of procedures and donor shortage
current results cost remaining problems perspectives

NUMBER OF HEART TRANSPLANTS REPORTED BY YEAR
189 317665
1182
2158
2710
31373362
4001 4171 4197 4365 4439 4399 4263 41673833
3563 3410 3367 3269 3180 3026 3095
0
500
1000
1500
2000
2500
3000
3500
4000
4500
Nu
mb
er
of
Tra
ns
pla
nts
ISHLT 2007
NOTE: This figure includes only the heart transplants that are reported to the ISHLT Transplant Registry. As such, this should not be construed as evidence that the number of hearts transplanted worldwide has declined in recent years.
J Heart Lung Transplant 2007;26: 769-781

U.S. Waiting List Registrations 1998-2007
0
1000
2000
3000
4000
5000
1998 1999 2000 2001 2002 2003 2004 2005 2006 2007Year of Snapshot
Nu
mb
er
of
Re
gis
tra
tio
ns
Heart Lung Heart-LungHeart - Active Lung - Active Heart-Lung - Active
Source: OPTN and UNOS

U.S. Wait List Death Rates 1998-2007
0
2
4
6
8
10
12
14
1998 1999 2000 2001 2002 2003 2004 2005 2006 2007
Year
Heart Lung
Pe
rce
nt
Source: OPTN and UNOS

heart transplantation in Belgium
heart transplantation in Belgium
28 4
19
37
8093
127
108
154
124130
115
98111116
96 9184 81 80
87
71 69 69 70
'82 '84 '86 '88 '90 '92 '94 '96 '98 '00 '02 '04 '06
1 3 4 5 6 7 N active centers
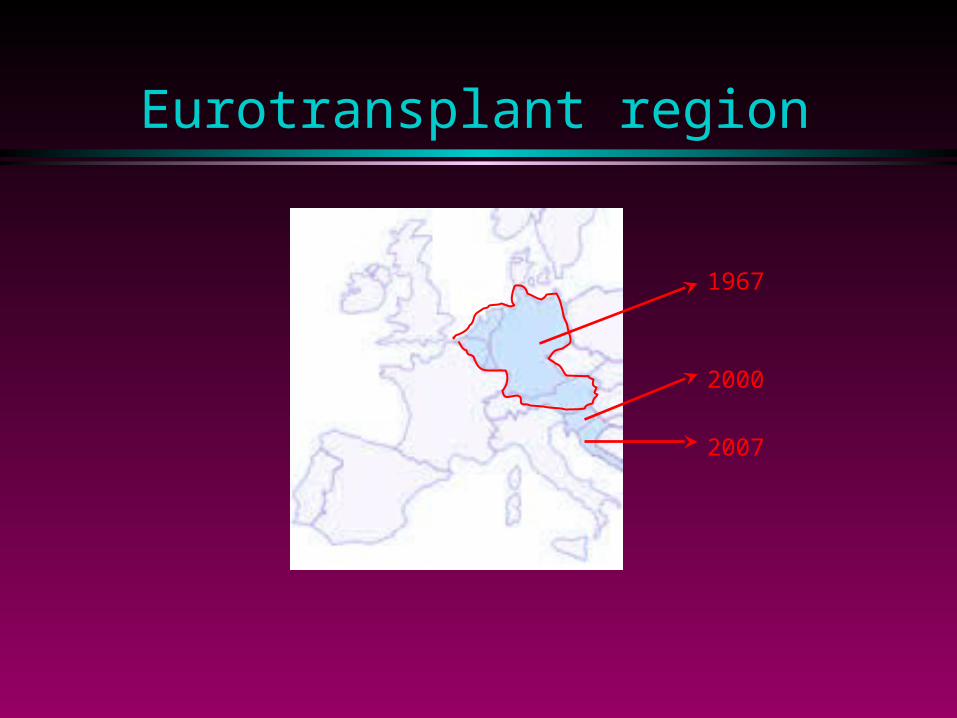
Eurotransplant region
1967
2007
2000

Donor and Transplant Statistics 2007
0
5
10
15
20
25
30
2001 2002 2003 2004 2005 2006 2007
Austria
B elg ium
G ermany
Netherlands
S lovenia
Eurotransplant annual donor rate pmp

ET waiting list for HTx

ET HTx waiting list mortality
0
50
100
150
200
250
300
350
1995 1997 1999 2001 2003 2005 2007

Mortality on the heart waiting list
263 241 225 244 187
82 83 6039 39
193 155 147 104 101
0%
20%
40%
60%
80%
100%
2003 2004 2005 2006 2007
inactive elective urgent
source: www.optn.org and Eurotransplant Annual Reports
61 75 61 93 76
109 112 118141 102
24 35 34 29 36
0%
20%
40%
60%
80%
100%
2003 2004 2005 2006 2007
USA
ET
538 479 432 387 327
194
222 213 263 214
0.92→0.47 pmp
~1.23pmp
the expert help of Jacqueline Smits is gratefully acknowledged

reporting of potential donors in Belgium
137 138 136 156 151 155 179208
175209
238 217 202 213242
271 292
366152 147 149
185 187152
163171
162
190158
148143
162149
167
209
175
0
50
100
150
200
250
300
350
400
450
500
550
1990 1991 1992 1993 1994 1995 1996 1997 1998 1999 2000 2001 2002 2003 2004 2005 2006 2007
Year
n d
on
ors
Donor Hospitals Txp C enters
Donor and Transplant Statistics 2007 - 20/03/2008
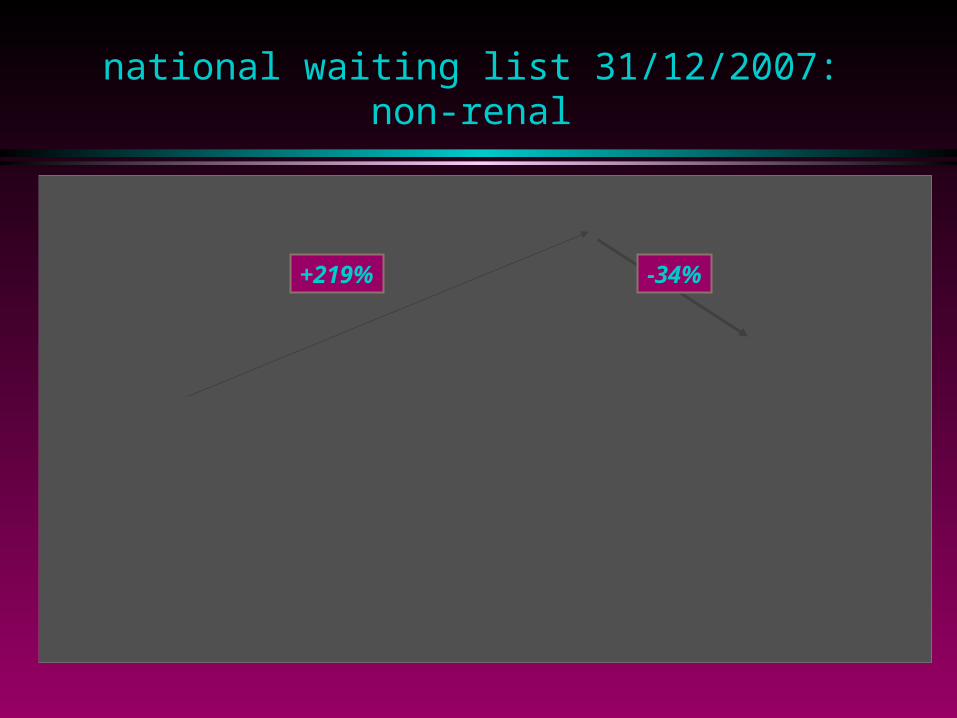
national waiting list 31/12/2007: non-renal
78 80
102
159
184
243 249
185
166
34 33 35 40 33 34 32 29 2832 3042
5159
4660 56 52
18 16 1930 27
37 34 3037
0
50
100
150
200
250
300
1999 2000 2001 2002 2003 2004 2005 2006 2007
Y ear
n pa
tient
s
L iver
Heart
L ung
P ancreas
+219% -34%

patient and donor age
0
10
20
30
40
50
0- 10 11- 17 18- 34 35- 49 50- 59 60+
patients
donors
%

♀♂
patients donors
vrouw
18%man
82%
vrouw
29%man
71%

Congenital2%
ReTX2%
Myopathy45%
Misc.3%
Valvular3%
CAD45%
1/1982-6/2006
DIAGNOSIS IN ADULT HEART TRANSPLANTS
203040506070
% o
f Cas
es
Myopathy CAD
CAD38%
Valvular2%
Misc.10%
Myopathy45%
ReTX2%
Congenital3%
1/2003-6/2006
ISHLT 2007 J Heart Lung Transplant 2007;26: 769-781

reason for transplantation
CADCMPreHTxothercongenitalvalvular
‘87-’93 ‘94-’00
’01-’07

HEART TRANSPLANTATION Kaplan-Meier Survival (1/1982-6/2005)
0
20
40
60
80
100
0 1 2 3 4 5 6 7 8 9 10 11 12 13 14 15 16 17 18 19 20 21 22
Years
Su
rviv
al
(%)
Half-life = 10.0 yearsConditional Half-life = 13.0 years
N=70,702
ISHLT 2007
N at risk at 22 years: 33
HEART TRANSPLANTATION Kaplan-Meier Survival (1/1982-6/2005)
J Heart Lung Transplant 2007;26: 769-781

01/01/08
survivalsurvival
%%
yearsyears
the expert help of A. Belmans and of H. Ector, MD, PhD is gratefully acknowledged
0
10
20
30
40
50
60
70
80
90
100
0 1 2 3 4 5 6 7 8 9 10 11 12 13 14 15 16 17
REMATCH
gen. pop.
ISHLT
HTx UZL

Overall graft survival rates by country,
corrected for local vs non-local donor, urgency status, CIT and VAD
5060708090
100
0 3 6 9 12
Adults, first heart only transplants in ET, in 1997 (N=665)
5060708090
100
0 3 6 9 12
Crude rates Corrected rates
P=0.0007 P=0.004
Post-transplant time (m) Post-transplant time (m)
ET meeting’99_JS.31
- Belgium- The Neth.- Austria- Germany

Mortality rates after heart transplantation.How to compare centre-specific outcome data ?
Crude centre effects, case-mix adjusted (with 95% CI). Centres sorted by transplant volume
-6
-4
-2
0
2
4
6
8
10
12
1 2 2 3 8 8 9 9 11 11 11 11 13 13 17 17 17 18 18 19 23 26 26 26 26 26 26 26 26 32 33 39 41 41 43 43 44 45 46 53 60 75 90 127
140
volume (24-months period)
GO
OD
B
AD
Ln(RR)
Smits JMA et al. Transplantation 2003;75:90-6.

cost/QALYcurrency amount source year
HTx - adults
- children
US $ 1992
US $ 2004
~45,000
~50,000
NL
US
2003
2006
dialysis US $ 2003
CAN $
€
84 – 108,000
71 – 125,000
54 – 60,000
US
CA
Greece
2000
2003
2007
LVAD US $
₤
36 – 86,000
40,000
UK
UK
2008
2005
ICD US $ 2005 34 – 70,000 US 2005
CRT-P
-D
₤
₤
~17,000
~24,000
UK
UK
2007
2007
statins - 2°
- 1°
₤
₤
10 – 17,000
20 – 48,000
UK
UK
2007
2007

01/01/08
acute rejection year 1acute rejection year 1
0
5
10
15
20
25
30
35
40
45
50
'87
'89
'91
'93
'95
'97
'99
'01
'03
'05
'07
% pts
17.4%
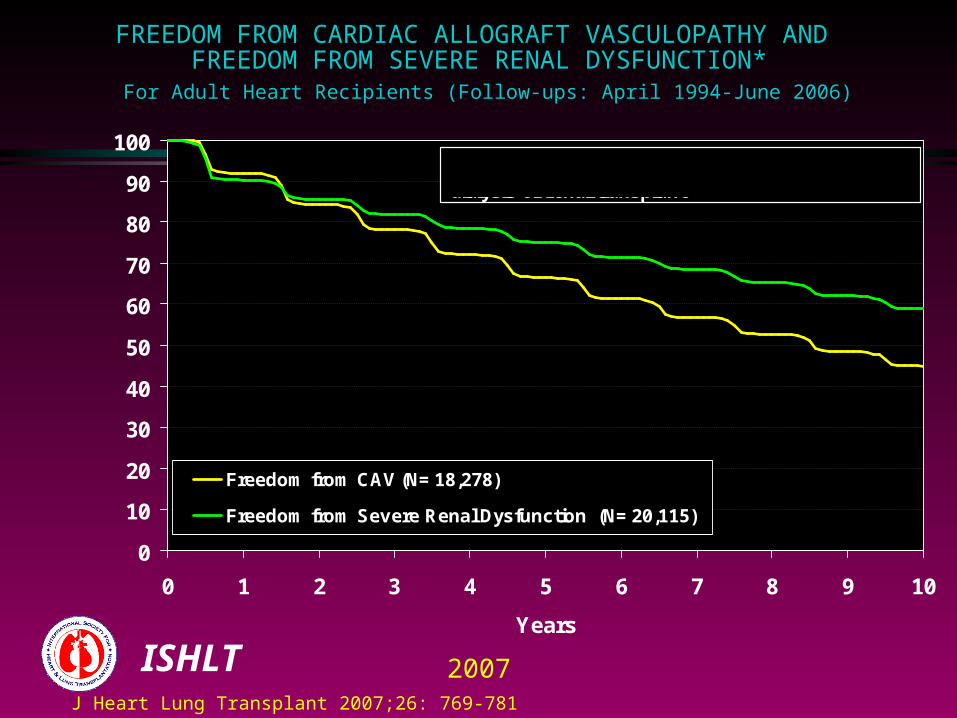
FREEDOM FROM CARDIAC ALLOGRAFT VASCULOPATHY AND FREEDOM FROM SEVERE RENAL DYSFUNCTION* For Adult Heart Recipients (Follow-ups: April 1994-June 2006)
0
10
20
30
40
50
60
70
80
90
100
0 1 2 3 4 5 6 7 8 9 10
Years
Freedom from CAV (N= 18,278)
Freedom from Severe Renal Dysfunction (N= 20,115)
* Severe renal dysfunction = Creatinine > 2.5 mg/dl, dialysis or renal transplant
% F
ree
do
m f
rom
CA
V o
r F
ree
do
m
fro
m S
ev
ere
Re
na
l D
ys
fuc
nti
on
ISHLT 2007 J Heart Lung Transplant 2007;26: 769-781

FREEDOM FROM MALIGNANCYFor Adult Heart Recipients (Follow-ups: April 1994 - June 2006)
50
60
70
80
90
100
0 1 2 3 4 5 6 7 8 9 10
Years
All malignancy Lymph Skin Other
% F
ree
fro
m M
ali
gn
an
cy
ISHLT 2007 J Heart Lung Transplant 2007;26: 769-781

perspectives
xenotransplantation
improved mechanical support systems(BTT, destination therapy, bridge to recovery ?)
new drugs PSI (sirolimus, everolimus)
monitoring through gene expression profiling rejection (acute and chronic)
tailored immunosuppression