Embed Size (px)
Citation preview
1
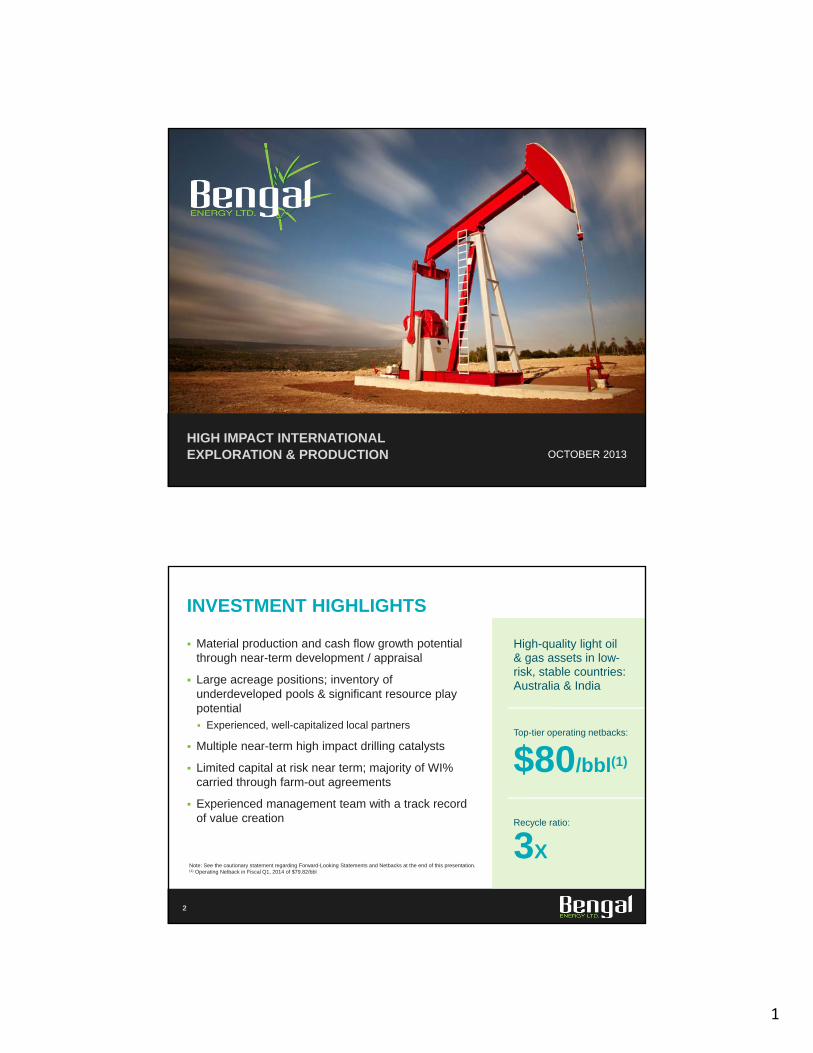
HIGH IMPACT INTERNATIONAL EXPLORATION & PRODUCTION OCTOBER 2013
2
INVESTMENT HIGHLIGHTS
High-quality light oil & gas assets in low-risk, stable countries: Australia & India
Material production and cash flow growth potential through near-term development / appraisal
Large acreage positions; inventory of underdeveloped pools & significant resource play potential Experienced, well-capitalized local partners
Multiple near-term high impact drilling catalysts
Limited capital at risk near term; majority of WI% carried through farm-out agreements
Experienced management team with a track record of value creation
Note: See the cautionary statement regarding Forward-Looking Statements and Netbacks at the end of this presentation.(1) Operating Netback in Fiscal Q1, 2014 of $79.82/bbl
Recycle ratio:
3X
$80/bbl(1)
Top-tier operating netbacks:
2
3
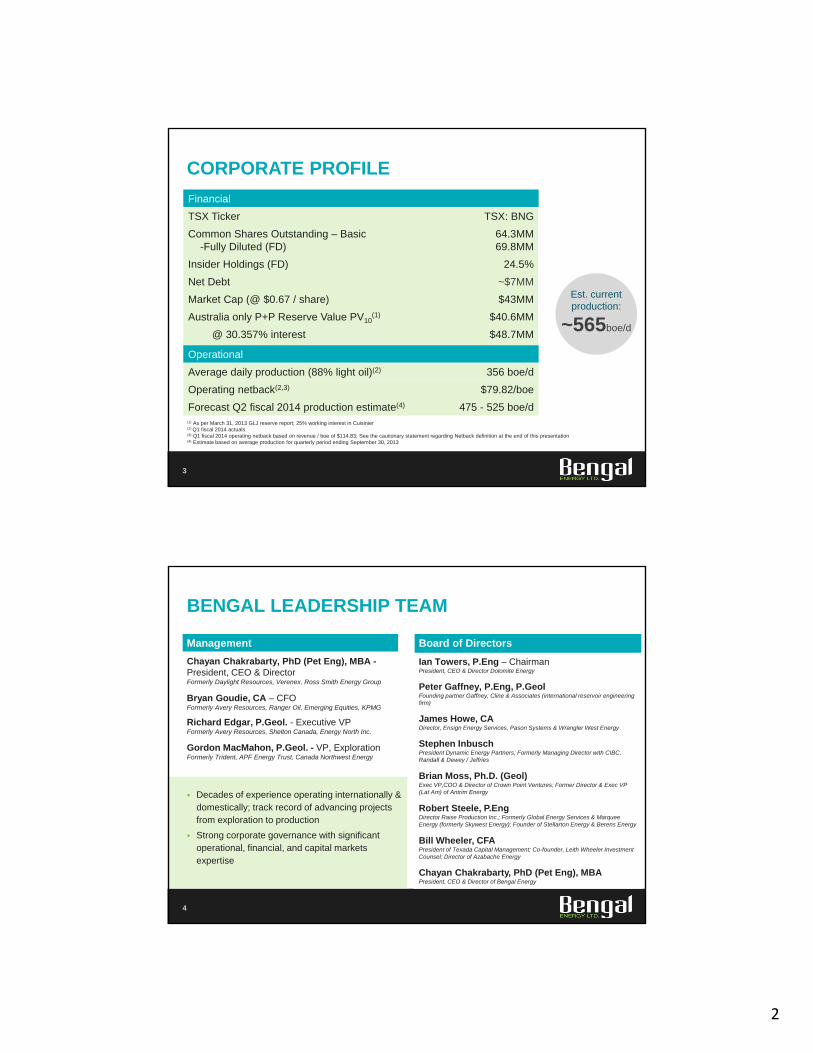
CORPORATE PROFILE
Financial
TSX Ticker TSX: BNG
Common Shares Outstanding – Basic-Fully Diluted (FD)
64.3MM69.8MM
Insider Holdings (FD) 24.5%
Net Debt ~$7MM
Market Cap (@ $0.67 / share) $43MM
Australia only P+P Reserve Value PV10(1) $40.6MM
@ 30.357% interest $48.7MM
Operational
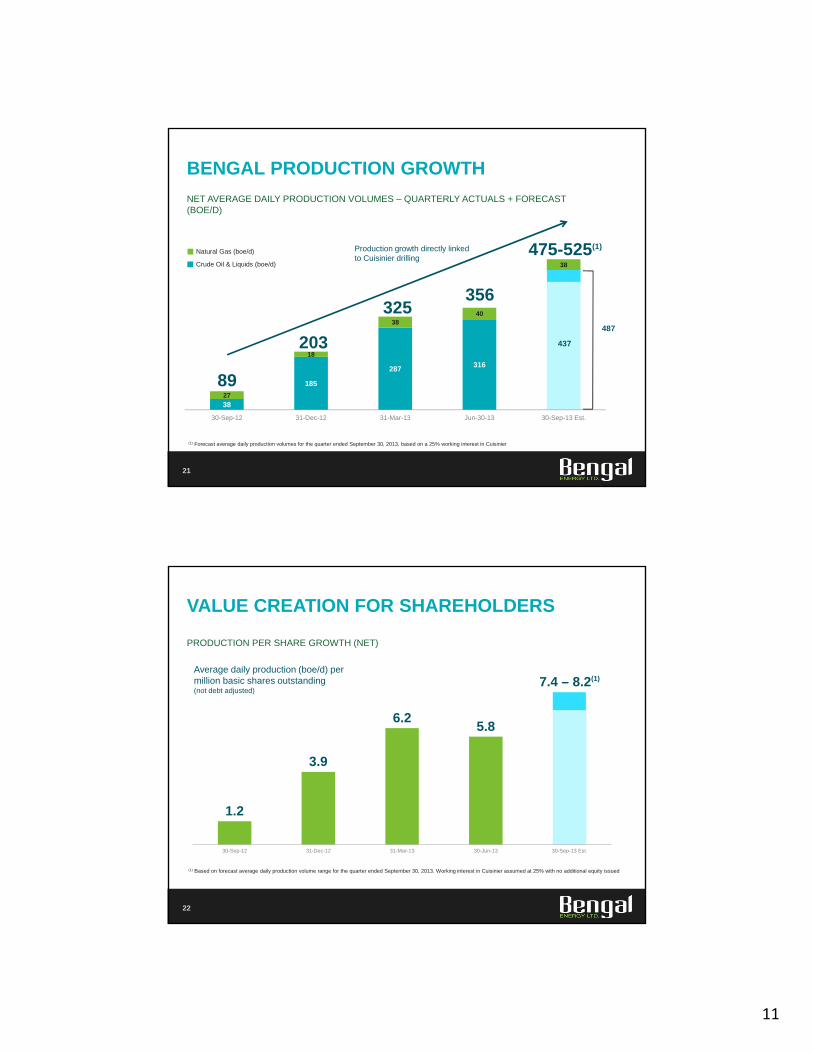
Average daily production (88% light oil)(2) 356 boe/d
Operating netback(2,3) $79.82/boe
Forecast Q2 fiscal 2014 production estimate(4) 475 - 525 boe/d(1) As per March 31, 2013 GLJ reserve report; 25% working interest in Cuisinier (2) Q1 fiscal 2014 actuals(3) Q1 fiscal 2014 operating netback based on revenue / boe of $114.83; See the cautionary statement regarding Netback definition at the end of this presentation(4) Estimate based on average production for quarterly period ending September 30, 2013
Est. current production:
~565boe/d
4
BENGAL LEADERSHIP TEAM
Decades of experience operating internationally & domestically; track record of advancing projects from exploration to production
Strong corporate governance with significant operational, financial, and capital markets expertise
Board of Directors
Ian Towers, P.Eng – ChairmanPresident, CEO & Director Dolomite Energy
Peter Gaffney, P.Eng, P.GeolFounding partner Gaffney, Cline & Associates (international reservoir engineering firm)
James Howe, CADirector, Ensign Energy Services, Pason Systems & Wrangler West Energy
Stephen InbuschPresident Dynamic Energy Partners; Formerly Managing Director with CIBC, Randall & Dewey / Jeffries
Brian Moss, Ph.D. (Geol)Exec VP,COO & Director of Crown Point Ventures; Former Director & Exec VP (Lat Am) of Antrim Energy
Robert Steele, P.EngDirector Raise Production Inc.; Formerly Global Energy Services & Marquee Energy (formerly Skywest Energy); Founder of Stellarton Energy & Berens Energy
Bill Wheeler, CFAPresident of Texada Capital Management; Co-founder, Leith Wheeler Investment Counsel; Director of Azabache Energy
Chayan Chakrabarty, PhD (Pet Eng), MBAPresident, CEO & Director of Bengal Energy
Management
Chayan Chakrabarty, PhD (Pet Eng), MBA -President, CEO & DirectorFormerly Daylight Resources, Verenex, Ross Smith Energy Group
Bryan Goudie, CA – CFOFormerly Avery Resources, Ranger Oil, Emerging Equities, KPMG
Richard Edgar, P.Geol. - Executive VPFormerly Avery Resources, Shelton Canada, Energy North Inc.
Gordon MacMahon, P.Geol. - VP, ExplorationFormerly Trident, APF Energy Trust, Canada Northwest Energy
3
5
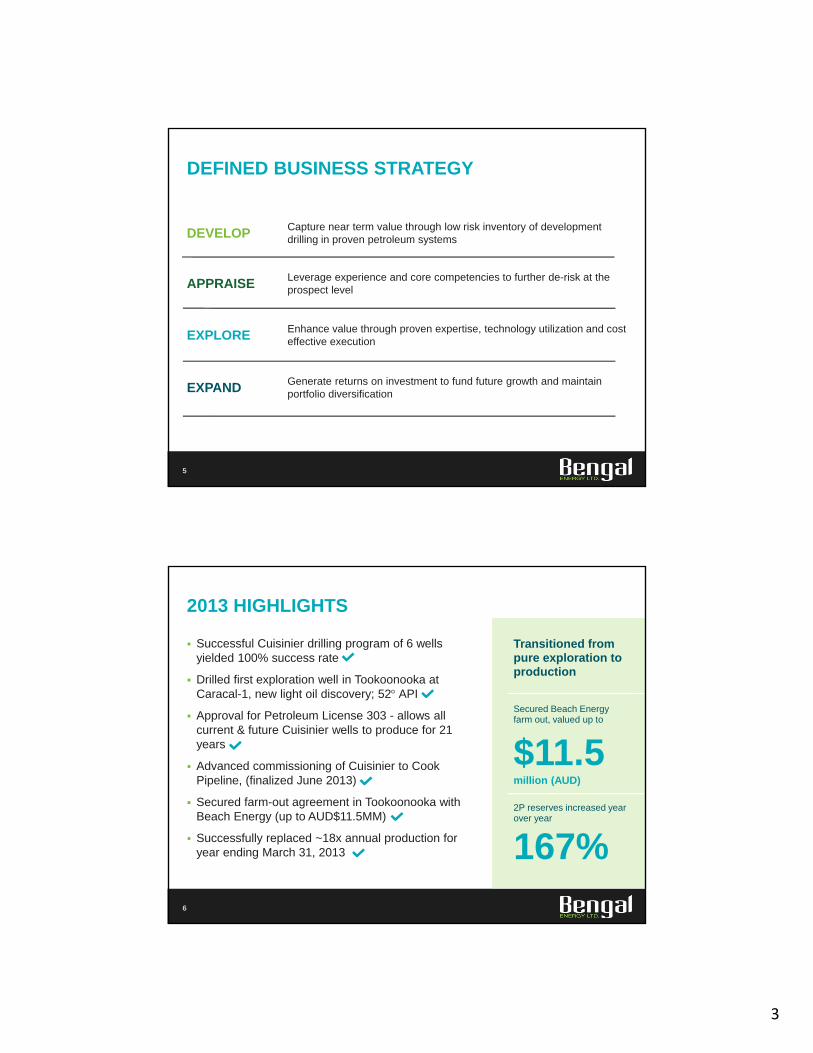
DEFINED BUSINESS STRATEGY
DEVELOP Capture near term value through low risk inventory of development drilling in proven petroleum systems
APPRAISE Leverage experience and core competencies to further de-risk at theprospect level
EXPLORE Enhance value through proven expertise, technology utilization and cost effective execution
EXPAND Generate returns on investment to fund future growth and maintain portfolio diversification
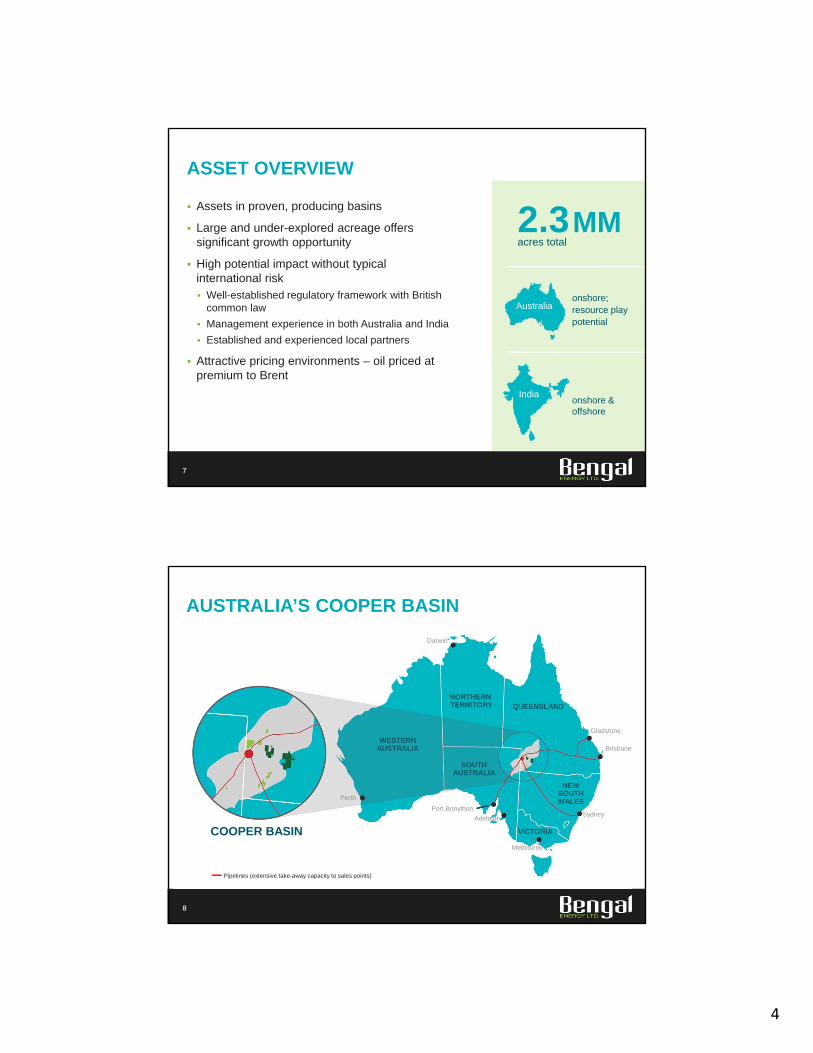
Successful Cuisinier drilling program of 6 wells yielded 100% success rate
Drilled first exploration well in Tookoonooka at Caracal-1, new light oil discovery; 52 API
Approval for Petroleum License 303 - allows all current & future Cuisinier wells to produce for 21 years
Advanced commissioning of Cuisinier to Cook Pipeline, (finalized June 2013)
Secured farm-out agreement in Tookoonooka with Beach Energy (up to AUD$11.5MM)
Successfully replaced ~18x annual production for year ending March 31, 2013
6
2013 HIGHLIGHTS
Transitioned from pure exploration to production
$11.5million (AUD)
Secured Beach Energy farm out, valued up to
2P reserves increased year over year
167%
4
7
ASSET OVERVIEW
Assets in proven, producing basins
Large and under-explored acreage offers significant growth opportunity
High potential impact without typical international risk Well-established regulatory framework with British
common law
Management experience in both Australia and India
Established and experienced local partners
Attractive pricing environments – oil priced at premium to Brent
2.3MMacres total
onshore & offshore
onshore; resource play potential
Australia
India
8
AUSTRALIA’S COOPER BASIN
NORTHERN TERRITORY
WESTERNAUSTRALIA
SOUTHAUSTRALIA
VICTORIA
NEWSOUTHWALES
QUEENSLAND
Darwin
Sydney
Melbourne
Adelaide
Perth
Port Bonython
Gladstone
Brisbane
COOPER BASIN
Pipelines (extensive take-away capacity to sales points)

5
9
COOPER BASIN HIGHLIGHTS
Most prolific onshore basin in Australia
Under explored & under exploited: creates opportunity Transfer knowledge and technology from mature basins
to enhance recovery & success factors
Resource play potential
Pipeline and transportation infrastructure sufficient and growing
Products priced off global benchmarks
5.05 Tcfof sales gas produced to June 2012(1)
barrels oil & liquids produced to June 2012(1)
247MM
(1) Source: Government of South Australia, Department of Manufacturing, Innovation, Trade, Resources and Energy bid document, “Cooper Basin, CO2012-A – South Australia Acreage Release”. August 2012.
BARTABARROLKA
TOOKOONOOKACUISINIERDISCOVERY
CARACAL-1DISCOVERY
ASPEN
MURTEREE
BARTA BLOCK:
10
BENGAL’S COOPERBASIN OPERATIONS
Cuisinier light oil discovery (52° API)
Partnered with experienced area operator
360,000 acres
30.4% working interest(1)
TOOKOONOOKA BLOCK:
654,000 acres
100% working interest(2)
Caracal Discovery cased as light oil producer
Beach Energy Farm-in (AUD$11.5MM max)
(1) Post-closing of acquisition of additional 5.357% working interest, expected Q4 calendar 2013(2) Upon completion of the Beach Energy farm-in, working interest reduces to 50%
SOUTHAUSTRALIA
NEWSOUTHWALES
QUEENSLAND
Non-Operated Operated100km

6
2013 PROGRAM SET THE STAGE FOR MORE AGGRESSIVE DEVELOPMENT PROGRAM IN 2014
11
BARTA PERMIT (PL 303): CUISINIER
Attractive cash flow potential with strong operating netbacks in Cuisinier(1) coupled with rising production
Continued reserves growth anticipated as drilling continues
Prospects identified on Cuisinier North 3D will be targeted for drilling in 2014
Continued investment in infrastructure will enhance fluid handling, and reduce costs
METER
0 9465(1) Cuisinier operating netbacks of $89.05/ bbl reported in Bengal’s Q1 fiscal 2014 (2) Production volumes cited are cum. to June. 2012. Source: State of Queensland Department of Employment, Economic Development and Innovation (DEEDI)
Cuisiner Discovery
Cook Field Hutton/ BirkheadOil 3.1MMbbl (produced to June 2012)(2)
3D Seismic
3D Seismic upcoming projects
Existing wells
CUISINIERNORTH 3D
BARTA NORTHDISCOVERY
CONTINUED SUCCESS EXPANDS POOL AREA
12
CREATING VALUE IN CUISINIER
Petroleum Lease (PL303) granted, Cuisinier oil processed at Cook facility
Pipeline connectivity eliminates production curtailments due to trucking capacity
3D seismic to high grade areas of better sand development for appraisal drilling
224 km2 3D seismic acquisition north of Cuisinier completed; interpretation underway
Preliminary capex budget for fiscal 2014 in Cuisinier - AUD$11.3 MM to drill an anticipated 8 development / appraisal wells + 1 exploration well
METER
0 3966
COOK TO MERRIMELIAPIPELINE
Cook Production facility
CUISINIER FIELD
Pre-2013 wells
2013 wells
March 2013 – GLJ(1), Best Case 3P Area = 30.1 km2 (7,439 acres), pre-2013 drilling
August 2013 - BNG Best Case (2) - Closure on 3D (within Permit) = 36.7 km2 (9,078 acres)
(1) Based on independent, qualified reserves evaluator GLJ Petroleum Consultants Ltd.’s report dated March 31, 2013 entitled Reserves Assessmentand Evaluation of Oil and Gas Properties – Corporate Summary, prepared in accordance with NI 51-101 and the COGEH. Cuisinier working interest at 25%
(2) Based on management’s internal estimates

7
CARACAL DISCOVERY SUPPORTS ONGOING DEVELOPMENT
13
TOOKOONOOKAPERMIT (ATP 732P)
Amidst some of onshore Australia’s largest producing fields
Average prospect targeting structures of 20+ km2
First well, Caracal 1, cased as future light oil producer (52° API)
Appraisal locations selected
3D seismic will expand prospective appraisal area of Caracal + evaluate other exploration targets nearby
(1) Source: State of Queensland Department of Natural Resources and Mines (DNRM)Production volumes cited are cumulative to June 2012
(2) Source: Operator well completion report
ProspectsMETER
0 17,820Caracal-1 oil well
Pipelines
JACKSON48.2 MMBbls(1)
IPUNDU4.3MMBbls(2)
KENMORE13.6MMBbls(1)
BEACH ENERGY FARM-IN SECURED JUNE 2013
14
CREATING VALUE IN TOOKOONOOKA
Beach (ASX: BPT) - major operator in Cooper Basin; $1.7B market value
BPT will fund drilling 2 wells & 300 km2 of 3D seismic to earn 50% in the permit (up to max of AUD$11.5MM)
Beach Energy …..says the new Tookoonooka oil exploration venture in Queensland has potential as a major revenue earner, building on the rapid growth in oil output the company has seen in the western Cooper Basin”(3)
(1) Source: State of Queensland Department of Natural Resources and Mines (DNRM)Production volumes cited are cumulative to June 2012
(2) Source: Operator well completion report(3) The Australian Financial Review, 28 August 2013, article by Angela Macdonald-Smith
“
JACKSON48.2 MMBbls(1)
IPUNDU4.3MMBbls(2)
KENMORE13.6MMBbls(1)
ProspectsMETER
0 17,820Caracal-1 oil well
Pipelines
NOMINAL 3D AREA ~300km2
(BEACH TO FUND)
8
LONGER TERM POTENTIAL AT TOOKOONOOKA
15
ATP 732, CARACAL –APPRAISAL & DEVELOPMENT
Future appraisal wells targeting thicker Lower Wyandra section
Second well (Caracal-2) to test both Wyandra and deeper Hutton target
New 3D to be acquired by Beach Energy calendar Q4 2013
No capital required during farm-in phase; future capital requirements determined by results
Caracal Wyandra Formation - Max Case Prospective Resource Area ~42.7 km2
Caracal Wyandra Formation - Best case Prospective Pool Area ~16.5 km2
Untested Birkhead/Hutton formation Closure – Best Case Area ~5.2 km2
TRIODIA-1 WYANDRAOIL SHOW
CARACAL-2 WYANDRAAPPRAISAL & HUTTON TEST
CARACAL-1 WYANDRA OIL DISCOVERY SWAB RATE 60-70 BOPD (52° LIGHT OIL)
METER
0 2904
16
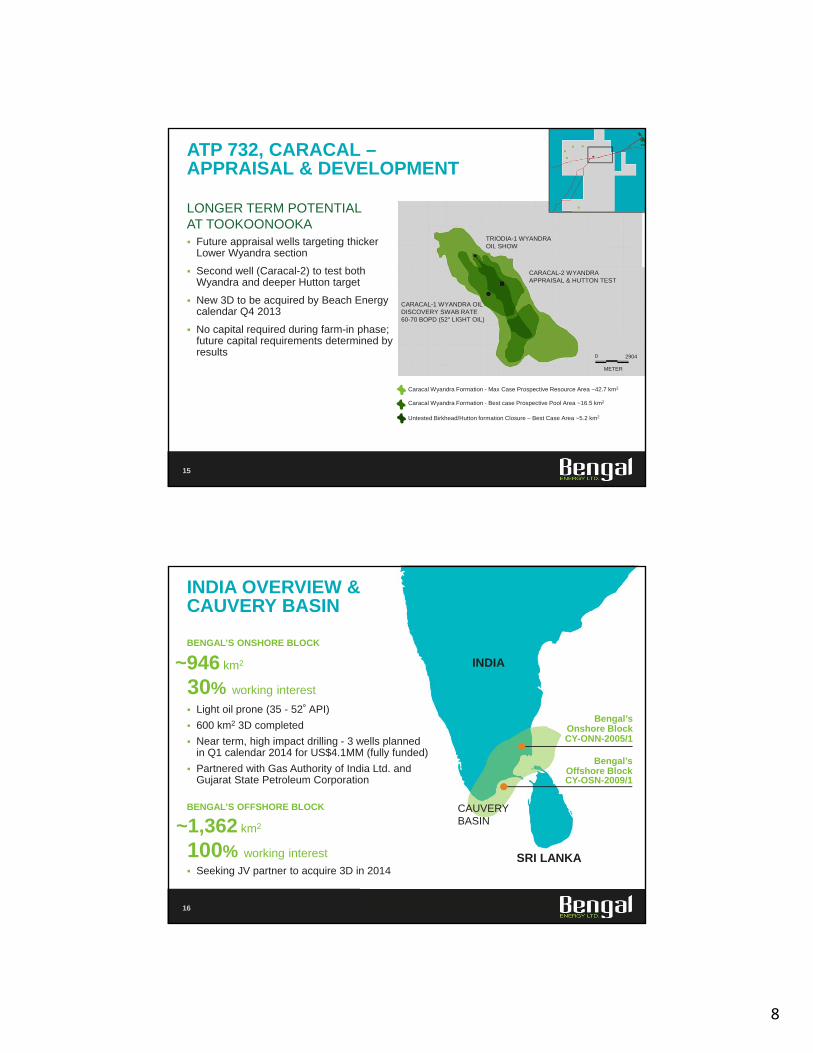
INDIA OVERVIEW & CAUVERY BASIN
Light oil prone (35 - 52˚ API)
600 km2 3D completed
Near term, high impact drilling - 3 wells plannedin Q1 calendar 2014 for US$4.1MM (fully funded)
Partnered with Gas Authority of India Ltd. and Gujarat State Petroleum Corporation
Bengal’s Onshore BlockCY-ONN-2005/1
Bengal’s Offshore BlockCY-OSN-2009/1
INDIA
CAUVERY BASIN
SRI LANKA
BENGAL’S ONSHORE BLOCK
~946 km2
30% working interest
BENGAL’S OFFSHORE BLOCK
~1,362 km2
100% working interest
Seeking JV partner to acquire 3D in 2014

9
17
CAUVERY ONSHORE –COCHISE PROSPECT
3 prospects to be drilled (2014)
Cochise Prospect targets Lower Cretaceous Andimadam Formation which is productive immediately north of the permit
Cochise Prospect is analogous to the North Kovilakalapal Field
The most recent well, North Kovilakalapal –3 tested 500 Bopd(2)
(1) Source: Recoverable reserves data complied from IHS EDIN India general fields database(2) Source - The Oil & Gas Journal, April 26 2012Note: See cautionary statement on Analogous Information at the end of this presentation.
North Kovilakalapal Field~1.6 MMBbls & 6.3 BCF
KovilakalapalField ~9MMbbls & 98 BCF(1)
Cochise Prospect
Syn-rift structure, sequence un-tested on permit
2 Kms.
Cochise Location
BUILDING THE VALUE CHAIN
18
DEVELOP Cuisinier – Current cash flow, near and longer term drilling – proven oil potential across a broad area, represents resource play potential
APPRAISE Tookoonooka – Prospective with substantial partner, discovery / appraisal mode. Future exploration upside
EXPLORE India – Exploration upside with near term drilling and potential production / cash flows
EXPAND
10
19
UPCOMING OPERATIONAL CATALYSTS
DRILLING
SEISMIC
FACILITIES
Cuisinier – Drill 6 wellsOnshore Cauvery – Drill 3 wells
Tookoonooka/Beach Farm-In – Phase 2 – Drill 2 wells
Cuisinier Drill 8 wells:6 development, 2 appraisal
Cuisinier North –Exploration Drill
Onshore Cauvery
Cuisinier – Well Tie-in
Cuisinier – Cook Tie-in Cuisinier Completion & Tie-in 5 wells
Tookoonooka 3D Seismic
Offshore Cauvery
Barta West 3D
(1)Timing, magnitude and scope subject to weather, JV partnership, vessel availability, availability of capital and reprocessing outcomes. Note: See Possible Reserves disclaimer at the end of this presentation.
Jan 2013 Apr 2013 Jul 2013 Oct 2013 Feb 2014 May 2014 Aug 2014 Dec 2014
Firm Contingent/ Planned(1)
Drill 1 Drill 2
Tie-In 6th well
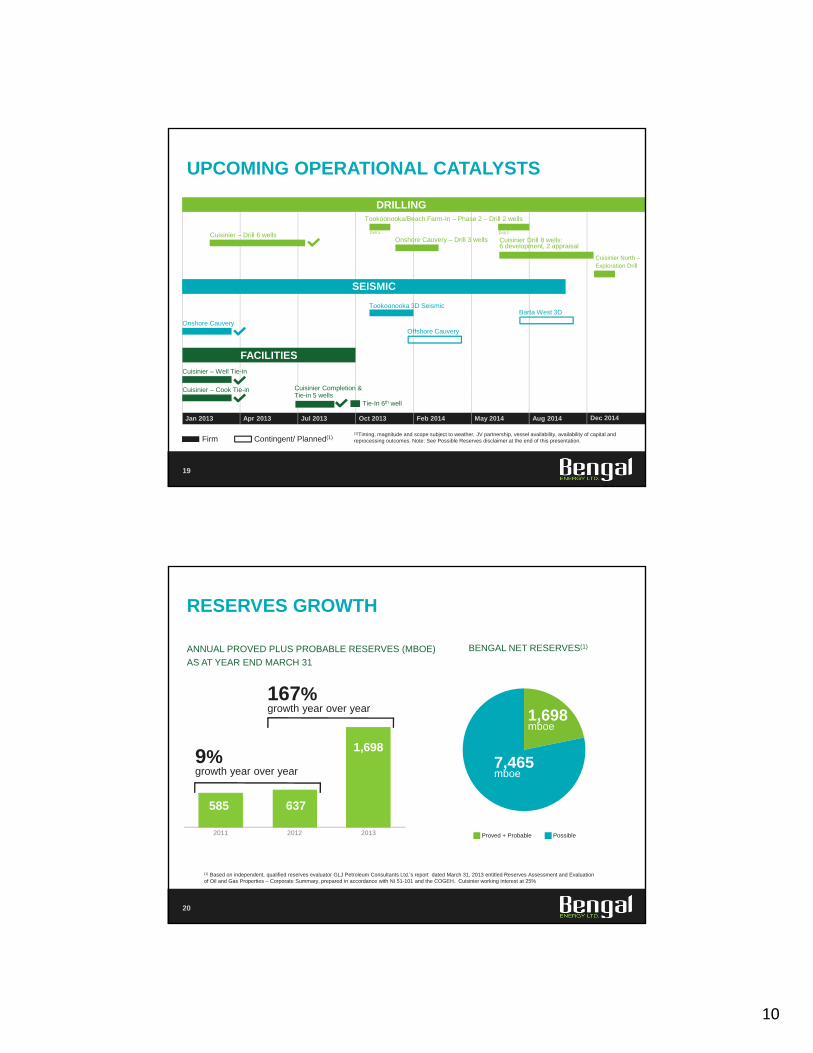
585 637
1,698
2011 2012 2013
ANNUAL PROVED PLUS PROBABLE RESERVES (MBOE)
AS AT YEAR END MARCH 31
20
RESERVES GROWTH
9%growth year over year
167%growth year over year
BENGAL NET RESERVES(1)
1,698mboe
7,465mboe
Proved + Probable Possible
(1) Based on independent, qualified reserves evaluator GLJ Petroleum Consultants Ltd.’s report dated March 31, 2013 entitled Reserves Assessment and Evaluation of Oil and Gas Properties – Corporate Summary, prepared in accordance with NI 51-101 and the COGEH. Cuisinier working interest at 25%
11
38
185
287316
27
18
3840
38
30-Sep-12 31-Dec-12 31-Mar-13 Jun-30-13 30-Sep-13 Est.
NET AVERAGE DAILY PRODUCTION VOLUMES – QUARTERLY ACTUALS + FORECAST(BOE/D)
21
BENGAL PRODUCTION GROWTH
356325
203
89
Production growth directly linked to Cuisinier drilling
(1) Forecast average daily production volumes for the quarter ended September 30, 2013, based on a 25% working interest in Cuisinier
Natural Gas (boe/d)
Crude Oil & Liquids (boe/d)
475-525(1)
437
487
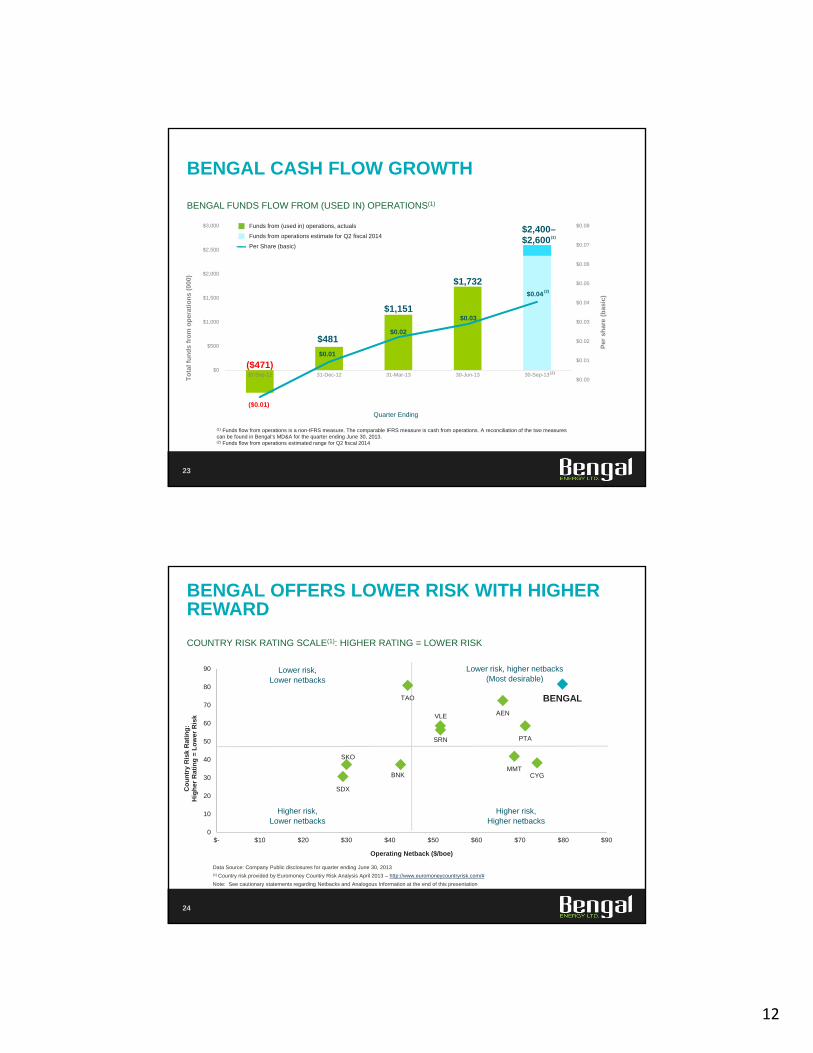
1.2
3.9
6.25.8
7.4 – 8.2(1)
30-Sep-12 31-Dec-12 31-Mar-13 30-Jun-13 30-Sep-13 Est.
PRODUCTION PER SHARE GROWTH (NET)
22
VALUE CREATION FOR SHAREHOLDERS
Average daily production (boe/d) per million basic shares outstanding (not debt adjusted)
(1) Based on forecast average daily production volume range for the quarter ended September 30, 2013. Working interest in Cuisinier assumed at 25% with no additional equity issued
12
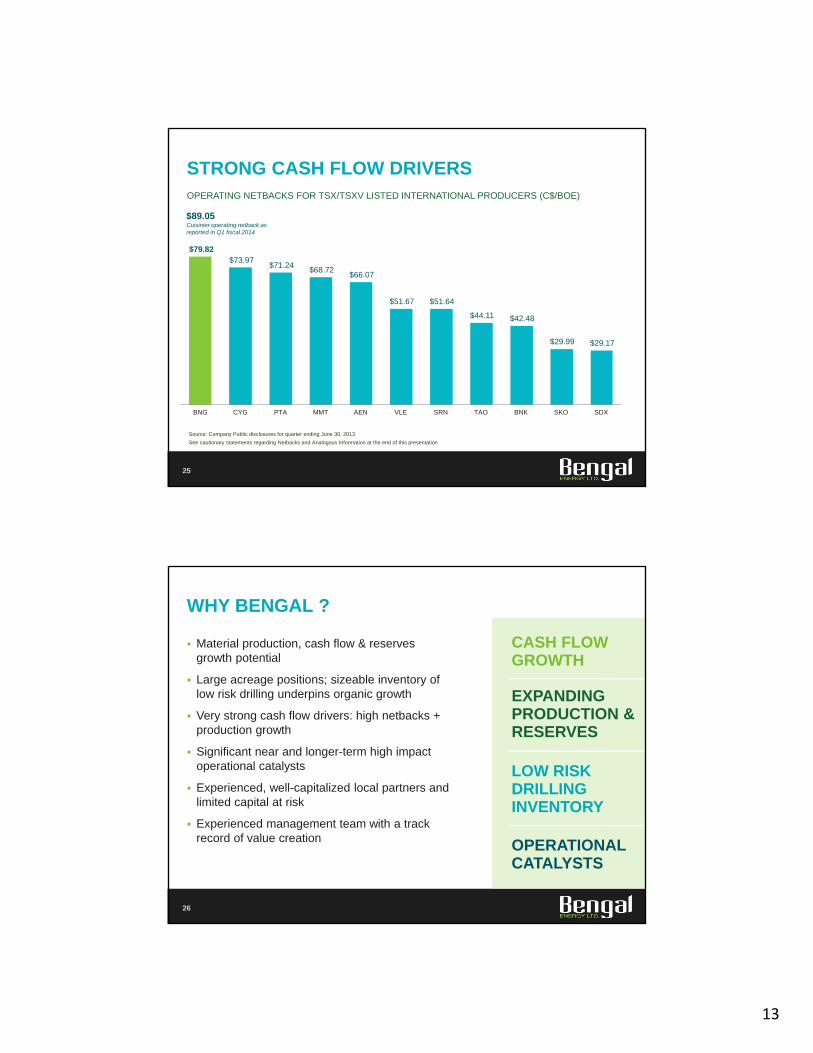
BENGAL FUNDS FLOW FROM (USED IN) OPERATIONS(1)
23
BENGAL CASH FLOW GROWTH
($471)
$481
$1,151
$1,732
$2,400–$2,600
($0.01)
$0.01
$0.02
$0.03
$0.04
-$0.02
-$0.01
$0.00
$0.01
$0.02
$0.03
$0.04
$0.05
$0.06
$0.07
$0.08
($1,000)
($500)
$0
$500
$1,000
$1,500
$2,000
$2,500
$3,000
30-Sep-12 31-Dec-12 31-Mar-13 30-Jun-13 30-Sep-13
Per
sh
are
(bas
ic)
To
tal f
un
ds
fro
m o
per
atio
ns
(000
)
(1) Funds flow from operations is a non-IFRS measure. The comparable IFRS measure is cash from operations. A reconciliation of the two measures can be found in Bengal’s MD&A for the quarter ending June 30, 2013.(2) Funds flow from operations estimated range for Q2 fiscal 2014
Funds from operations estimate for Q2 fiscal 2014
Funds from (used in) operations, actuals
Per Share (basic)
(2)
Quarter Ending
(2)
(2)
BENGALTAO
AEN
PTA
VLE
SRN
MMTCYGBNK
SKO
SDX
0
10
20
30
40
50
60
70
80
90
$- $10 $20 $30 $40 $50 $60 $70 $80 $90
Co
un
try
Ris
k R
atin
g:
Hig
her
Rat
ing
= L
ow
er R
isk
COUNTRY RISK RATING SCALE(1): HIGHER RATING = LOWER RISK
24
BENGAL OFFERS LOWER RISK WITH HIGHER REWARD
Lower risk, higher netbacks (Most desirable)
Lower risk, Lower netbacks
Higher risk, Lower netbacks
Higher risk, Higher netbacks
Operating Netback ($/boe)
Data Source: Company Public disclosures for quarter ending June 30, 2013(1) Country risk provided by Euromoney Country Risk Analysis April 2013 – http://www.euromoneycountryrisk.com/#
Note: See cautionary statements regarding Netbacks and Analogous Information at the end of this presentation
13
OPERATING NETBACKS FOR TSX/TSXV LISTED INTERNATIONAL PRODUCERS (C$/BOE)
25
STRONG CASH FLOW DRIVERS
$79.82 $73.97
$71.24 $68.72
$66.07
$51.67 $51.64
$44.11 $42.48
$29.99 $29.17
BNG CYG PTA MMT AEN VLE SRN TAO BNK SKO SDX
$89.05Cuisinier operating netback as reported in Q1 fiscal 2014
Source: Company Public disclosures for quarter ending June 30, 2013
See cautionary statements regarding Netbacks and Analogous Information at the end of this presentation
LOW RISK DRILLING INVENTORY
EXPANDING PRODUCTION & RESERVES
26
WHY BENGAL ?
Material production, cash flow & reserves growth potential
Large acreage positions; sizeable inventory of low risk drilling underpins organic growth
Very strong cash flow drivers: high netbacks + production growth
Significant near and longer-term high impact operational catalysts
Experienced, well-capitalized local partners and limited capital at risk
Experienced management team with a track record of value creation
CASH FLOW GROWTH
OPERATIONAL CATALYSTS
14
APPENDIX
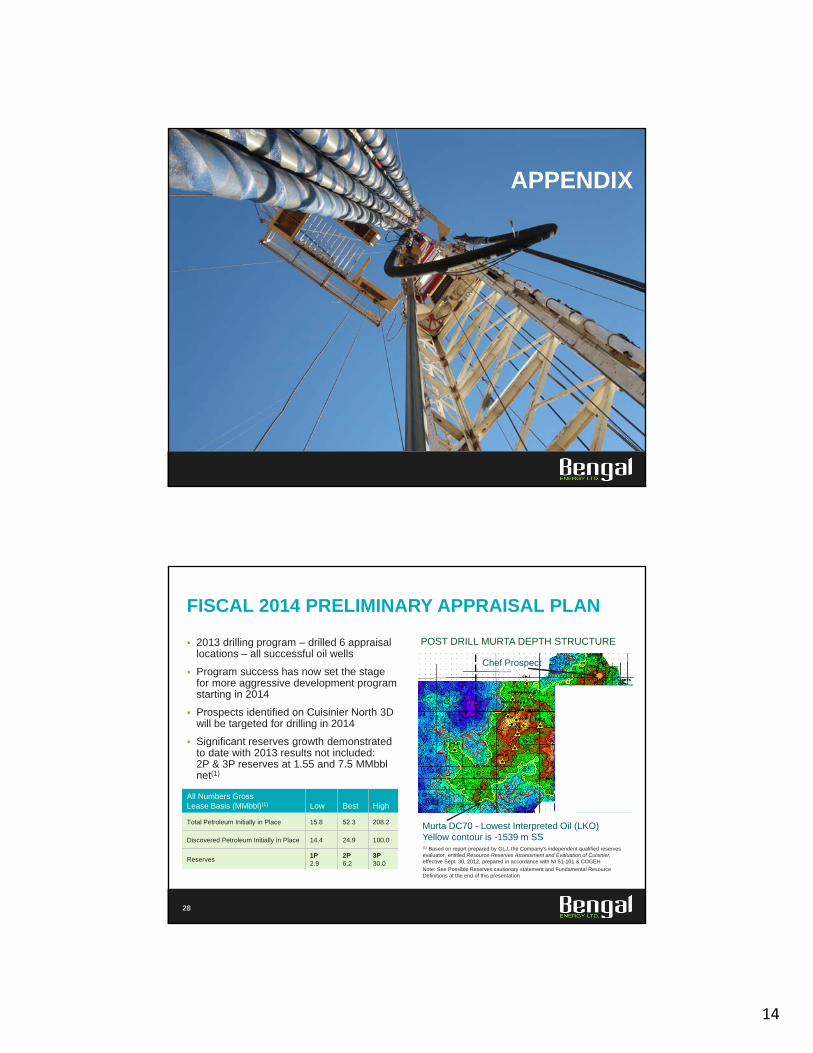
POST DRILL MURTA DEPTH STRUCTURE
28
FISCAL 2014 PRELIMINARY APPRAISAL PLAN
2013 drilling program – drilled 6 appraisal locations – all successful oil wells
Program success has now set the stage for more aggressive development program starting in 2014
Prospects identified on Cuisinier North 3D will be targeted for drilling in 2014
Significant reserves growth demonstrated to date with 2013 results not included:2P & 3P reserves at 1.55 and 7.5 MMbblnet(1)
(1) Based on report prepared by GLJ, the Company's independent qualified reserves evaluator, entitled Resource Reserves Assessment and Evaluation of Cuisinier, effective Sept. 30, 2012, prepared in accordance with NI 51-101 & COGEH
Note: See Possible Reserves cautionary statement and Fundamental Resource Definitions at the end of this presentation
Murta DC70 - Lowest Interpreted Oil (LKO)Yellow contour is -1539 m SS
All Numbers GrossLease Basis (MMbbl)(1) Low Best High
Total Petroleum Initially in Place 15.8 52.3 208.2
Discovered Petroleum Initially in Place 14.4 24.9 100.0
Reserves1P2.9
2P6.2
3P30.0
Chef Prospect
15
29
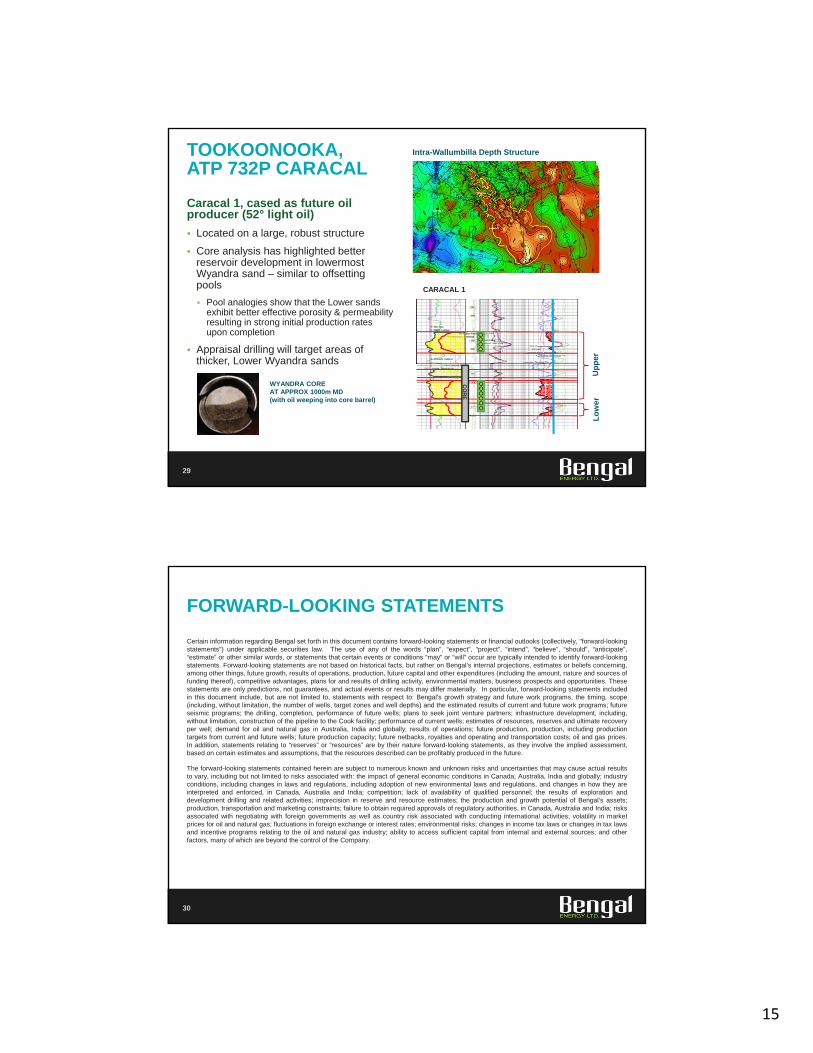
TOOKOONOOKA, ATP 732P CARACAL
Caracal 1, cased as future oil producer (52° light oil)
Located on a large, robust structure
Core analysis has highlighted better reservoir development in lowermost Wyandra sand – similar to offsetting pools
Pool analogies show that the Lower sands exhibit better effective porosity & permeability resulting in strong initial production rates upon completion
Appraisal drilling will target areas of thicker, Lower Wyandra sands
WYANDRA COREAT APPROX 1000m MD(with oil weeping into core barrel)
Intra-Wallumbilla Depth Structure
CARACAL 1
CO
RE
Up
per
Lo
wer
30
Certain information regarding Bengal set forth in this document contains forward-looking statements or financial outlooks (collectively, "forward-lookingstatements") under applicable securities law. The use of any of the words “plan”, “expect”, “project”, “intend”, “believe”, “should”, “anticipate”,“estimate” or other similar words, or statements that certain events or conditions “may” or “will” occur are typically intended to identify forward-lookingstatements. Forward-looking statements are not based on historical facts, but rather on Bengal’s internal projections, estimates or beliefs concerning,among other things, future growth, results of operations, production, future capital and other expenditures (including the amount, nature and sources offunding thereof), competitive advantages, plans for and results of drilling activity, environmental matters, business prospects and opportunities. Thesestatements are only predictions, not guarantees, and actual events or results may differ materially. In particular, forward-looking statements includedin this document include, but are not limited to, statements with respect to: Bengal’s growth strategy and future work programs, the timing, scope(including, without limitation, the number of wells, target zones and well depths) and the estimated results of current and future work programs; futureseismic programs; the drilling, completion, performance of future wells; plans to seek joint venture partners; infrastructure development, including,without limitation, construction of the pipeline to the Cook facility; performance of current wells; estimates of resources, reserves and ultimate recoveryper well; demand for oil and natural gas in Australia, India and globally; results of operations; future production, production, including productiontargets from current and future wells; future production capacity; future netbacks, royalties and operating and transportation costs; oil and gas prices.In addition, statements relating to “reserves” or “resources” are by their nature forward-looking statements, as they involve the implied assessment,based on certain estimates and assumptions, that the resources described can be profitably produced in the future.
The forward-looking statements contained herein are subject to numerous known and unknown risks and uncertainties that may cause actual resultsto vary, including but not limited to risks associated with: the impact of general economic conditions in Canada, Australia, India and globally; industryconditions, including changes in laws and regulations, including adoption of new environmental laws and regulations, and changes in how they areinterpreted and enforced, in Canada, Australia and India; competition; lack of availability of qualified personnel; the results of exploration anddevelopment drilling and related activities; imprecision in reserve and resource estimates; the production and growth potential of Bengal’s assets;production, transportation and marketing constraints; failure to obtain required approvals of regulatory authorities, in Canada, Australia and India; risksassociated with negotiating with foreign governments as well as country risk associated with conducting international activities; volatility in marketprices for oil and natural gas; fluctuations in foreign exchange or interest rates; environmental risks; changes in income tax laws or changes in tax lawsand incentive programs relating to the oil and natural gas industry; ability to access sufficient capital from internal and external sources; and otherfactors, many of which are beyond the control of the Company.
FORWARD-LOOKING STATEMENTS

16
31
Readers are cautioned that the foregoing list of factors is not exhaustive. Additional information on these and other factors that could effect Bengal’soperations and financial results are included in reports on file with Canadian securities regulatory authorities and may be accessed through theSEDAR website (www.sedar.com).
With respect to forward-looking statements contained in this document, Bengal has made assumptions regarding: current and future commodity pricesand royalty regimes; availability of skilled labour; timing and amount of capital expenditures; future exchange rates; the impact of increasingcompetition; conditions in general economic and financial markets; availability of drilling and related equipment; effects of regulation by governmentalagencies; royalty rates; future operating and transportation costs; and other matters. Although the forward-looking statements contained in thisdocument are based upon assumptions which management believes to be reasonable, the Company cannot assure investors that actual results will beconsistent with these forward-looking statements.
Management has included the above summary of assumptions and risks related to forward-looking statements provided in this document in order toprovide shareholders with a more complete perspective on Bengal’s current and future operations and such information may not be appropriate forother purposes. Bengal’s actual results, performance or achievement could differ materially from those expressed in, or implied by, these forward-looking statements and, accordingly, no assurance can be given that any of the events anticipated by the forward-looking statements will transpire oroccur, or if any of them do so, what benefits that Bengal will derive there from. These forward-looking statements are made as of the date of thisdocument and Bengal disclaims any intent or obligation to update publicly any forward-looking statements, whether as a result of new information,future events or results or otherwise, other than as required by applicable securities laws.
The estimates of capital requirements, reserves and net present value of future net revenues ("NPV") contained in such slides are based oninformation for the Corporation's booked locations in respect of which reserves have been assigned as well as analogous public information. Readersare cautioned that there is no certainty that any development on Bengal's unbooked locations will be successful to the same extent as its bookedlocations, or at all, and therefore, the estimates of capital requirements, reserves and NPV should not be relied upon as necessarily indicative of futureresults or values. The information is also based on certain key assumptions including, without limitation, the assumptions set forth above under the"Forward-Looking Statements" advisory statement. Actual results and values may vary, with such variations being material, as a result of a number ofrisks and uncertainties, including, without limitation, the risks and uncertainties noted under the "Forward-Looking Statements" advisory set forthherein.
FORWARD-LOOKING STATEMENTS
32
Total Petroleum Initially-In-Place (TPIIP) is that quantity of petroleum that is estimated to exist originally in naturally occurring accumulations. Itincludes that quantity of petroleum that is estimated, as of a given date, to be contained in known accumulations, prior to production, plus thoseestimated quantities in accumulations yet to be discovered. All TPIIP, other than DPIIP, set forth in this presentation has been classified as"undiscovered petroleum initially in place”.
Discovered Petroleum Initially-In-Place (DPIIP) is that quantity of petroleum that is estimated as of a given date, to be contained in knownaccumulations, prior to production. The recoverable portion of discovered petroleum initially in place includes production , reserves, and contingentresources; the remainder is unrecoverable. All DPIIP set forth in this presentation, other than production and reserves, has been classified asunrecoverable.
Undiscovered Petroleum Initially-In-Place (UPIPP) is that quantity of petroleum that is estimated, on a given date, to be contained in accumulationsyet to be discovered. The recoverable portion of UPIPP is categorized as prospective resources and the remainder is categorized as unrecoverable.There is no certainty that any portion of the UPIPP resources will be discovered. If discovered, there is no certainty that it will be commercially viable toproduce any portion of the resources.
FUNDAMENTAL RESOURCE DEFINITIONS
17
33
Analogous Information: Certain noted drilling, completion, production, reserve and resource data provided in this document may constitute “analogous information” under applicable securities legislation, such as reserve and resource estimates or the reserves and resources present on the Company’s lands, and near by lands, total production and production-rates from wells drilled by the Company or other industry participants located in geographical proximity to lands held by the Company. This information is derived from publicly available information sources (as at the date of this document) that the Company believes are predominantly independent in nature. The Company believes this information is relevant as it helps to define the reservoir characteristics in which the Company may have an interest. The Company is unable to confirm that the analogous information was prepared by a qualified reserves evaluator or auditor or in accordance with the Canadian Oil and Gas Evaluator Handbook and therefore, the reader is cautioned that the data relied upon by the Company may be in error, may not be analogous to the Company’s land holdings and/or may not be representative of actual results of wells anticipated to be drilled or completed by the Company in the future.
Possible Reserves: Possible reserves are those additional reserves that are less certain to be recovered than probable reserves. It is unlikely that the actual remaining quantities recovered will exceed the sum of the estimated proved plus probable plus possible reserves.
Barrels of Oil Equivalent: When converting natural gas to equivalent barrels of oil, Bengal uses the widely recognized standard of 6 thousand cubic feet (mcf) to one barrel of oil (boe). However, a boe may be misleading, particularly if used in isolation. A boe conversion ratio of 6 mcf: 1 bbl is based on an energy equivalency conversion method primarily applicable at the burner tip and does not represent a value equivalency at the wellhead. Given that the value ratio based on the current price of crude oil as compared to natural gas is significantly different from the energy equivalency of 6:1, utilizing a conversion on a 6:1 basis may be misleading as an indication of value.
Netbacks: Netback is a term that is not defined under International Financial Reporting Standards and is used by Bengal as a supplemental measure in evaluating Bengal’s financial position and performance. Bengal calculates netbacks as revenues minus royalties and transportation and operation costs
Net Present Value: Estimates of the net present value of the future net revenue from Bengal's reserves do not represent the fair market value ofBengal's reserves and are based on information for the Company’s booked locations in respect of which reserves have been assigned as well as analogous public information. The estimates of reserves and future net revenue from individual properties or wells may not reflect the same confidence level as estimates of reserves and future net revenue for all properties and wells, due to the effects of aggregation.
CAUTIONARY STATEMENTS