Embed Size (px)
Citation preview
1440 IEEE JOURNAL OF SELECTED TOPICS IN APPLIED EARTH OBSERVATIONS AND REMOTE SENSING, VOL. 6, NO. 3, JUNE 2013
Aerial 3D Building Detection and Modeling FromAirborne LiDAR Point Clouds
Shaohui Sun, Student Member, IEEE, and Carl Salvaggio, Member, IEEE
Abstract—A fast, completely automated method to create 3Dwatertight building models from airborne LiDAR point clouds ispresented. The proposed method analyzes the scene content andproduces multi-layer rooftops with complex boundaries and ver-tical walls that connect rooftops to the ground. A graph cuts basedmethod is used to segment vegetative areas from the rest of scenecontent. The ground terrain and building rooftop patches arethen extracted utilizing our technique, the hierarchical Euclideanclustering. Our method adopts a “divide-and-conquer” strategy.Once potential points on rooftops are segmented from terrain andvegetative areas, the whole scene is divided into individual pendentprocessing units which represent potential building footprints. Foreach individual building region, significant features on the rooftopare further detected using a specifically designed region growingalgorithm with smoothness constraint. Boundaries for all of thesefeatures are refined in order to produce strict description. Afterthis refinement, mesh models could be generated using an existingrobust dual contouring method.
Index Terms—3D, building, LiDAR, vegetation, graph cuts, re-gion growing, modeling.
I. INTRODUCTION
T HREE dimensional building reconstruction has been ahighly active research topic for years. There has been
an increasing demand in various applications such as urbanplanning, virtual tourism, computer gaming, real-time emer-gency response, and robot navigation. Commercial applicationslike Google Earth and Apple Maps have already deployed3D building reconstruction techniques as a vital visualiza-tion component which has gained huge public acceptance.Models are usually created by texture mapping both aerial andground-based images onto 3D geometric models. Traditionally,geometrical models are built up manually. There are somevery capable, free tools like Google Sketch-Up, that allow thelayperson to accomplish this, however, it does require a lot ofhuman effort to create just a single building. It remains a verydifficult and arduous task, especially when a large cityscapeneeds to be created. In the remote sensing community, there areseveral data sources that are suitable as input to the buildingreconstruction process. Imagery is the traditional and most
Manuscript received September 28, 2012; revised February 12, 2013; ac-cepted March 02, 2013. Date of publication May 14, 2013; date of current ver-sion June 17, 2013. This work was supported by the U.S. Department of Energyunder BAA PDP08 Grant Number DE-AR52-07NA28115.S. Sun and C. Salvaggio are with the Digital Imaging and Remote Sensing
Laboratory, Chester F. Carlson Center for Imaging Science, Rochester Insti-tute of Technology, Rochester, NY 14623 USA (e-mail: [email protected]; [email protected]).Color versions of one or more of the figures in this paper are available online
at http://ieeexplore.ieee.org.Digital Object Identifier 10.1109/JSTARS.2013.2251457
available data source. Research on how to extract 3D infor-mation from ground or aerial imagery has been conducted fordecades. Recent advances have enabled techniques to directlycapture 3D information over large scale areas. With the emer-gence of LiDAR (light detection and ranging) technology, apowerful 3D representation in the form of a point cloud canbeen created to assist in the generation of 3D scenes in a moreefficient and cost effective manner. Many modern techniquesare developed relying on the input from LiDAR.When collecting nadir-looking aerial data in an urban set-
ting, the two scene components that dominate this data are thetops of man-made structures (rooftops) and the background ter-rain. The detection and segmentation of these rooftops fromthe terrain is hence a crucial step in building extraction. Oftentimes, the outlines of these building rooftops are not simplegeometric primitives, on the contrary, they can be quite com-plex making the model extraction process a challenging task. Inthis research, the key contribution is the fully automatic workflow that is able to exploit useful information to urban modelingfrom airborne LiDAR data only, effectively and robustly con-ducting the task of scene classification without spectral knowl-edge from optical image data and three dimensional buildingextraction and its geometric modeling. The process removesvegetations through a graph cuts based approach and detectsthe terrain and building footprints by an Euclidean clusteringtechnique and then produces simplified, 3D meshing buildingmodels using solely LiDAR point cloud data for a large urbanscene. One major challenging issue at this stage is how to ef-ficiently and accurately segment building regions from the restof the background regions in the scene, particularly vegetation,without the assistance of multi-spectral optical imagery. Thegraph cuts based approach designed in this research does a finejob on the scene classification. In addition, an effective methodfor the extraction of rooftop features is presented, by utilizingthis method, a great amount of details on the rooftop are wellmaintained.
II. RELATED WORK
There has been a plethora of work conducted for urban mod-eling from airborne LiDAR data, aerial images, or the combi-nation. Hu et al. [1] described a few projects on the topic oflarge scale urban modeling. Musialski et al. [2] recently pro-vided a more comprehensive overview of urban reconstructionfrom different perspectives which are not restricted to aerial datainputs. The complexity and difficulty of this problem has beenapproached in many ways, but the synergistic use of muli-modaldatasets has become a prominent pedagogy in this research area.Sirmacek et al. [3] introduced a novel and robust approach for
1939-1404/$31.00 © 2013 IEEE
SUN AND SALVAGGIO: AERIAL 3D BUILDING DETECTION AND MODELING FROM AIRBORNE LIDAR POINT CLOUDS 1441
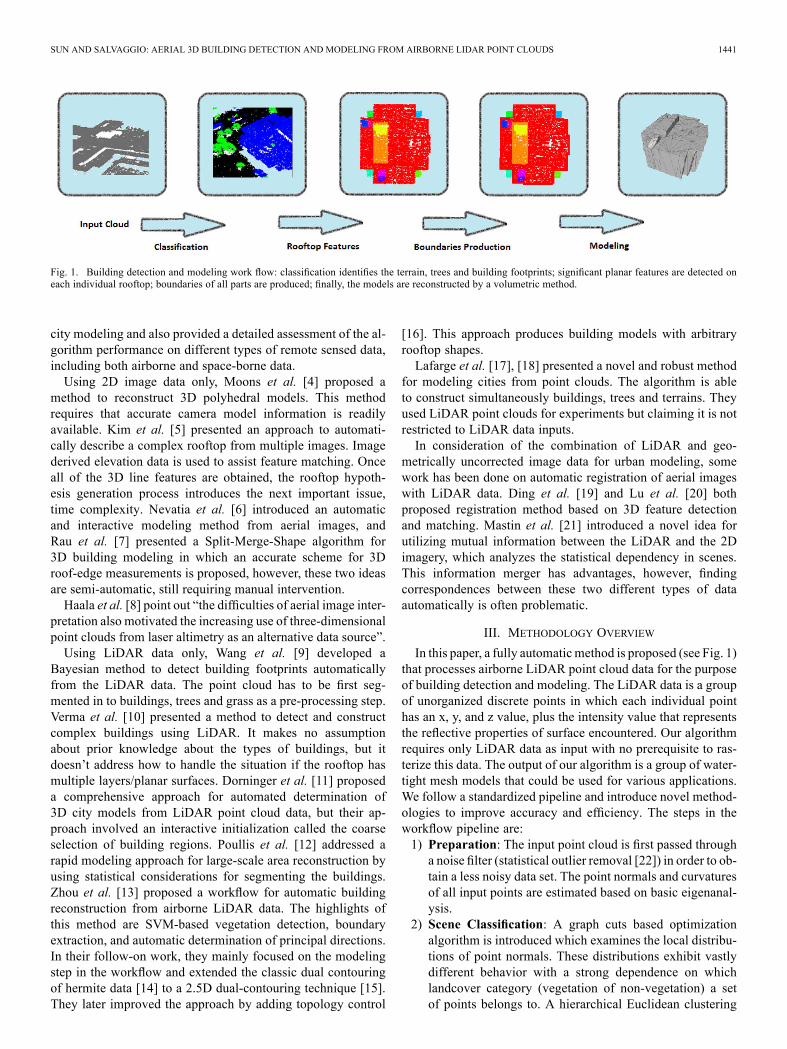
Fig. 1. Building detection and modeling work flow: classification identifies the terrain, trees and building footprints; significant planar features are detected oneach individual rooftop; boundaries of all parts are produced; finally, the models are reconstructed by a volumetric method.
city modeling and also provided a detailed assessment of the al-gorithm performance on different types of remote sensed data,including both airborne and space-borne data.Using 2D image data only, Moons et al. [4] proposed a
method to reconstruct 3D polyhedral models. This methodrequires that accurate camera model information is readilyavailable. Kim et al. [5] presented an approach to automati-cally describe a complex rooftop from multiple images. Imagederived elevation data is used to assist feature matching. Onceall of the 3D line features are obtained, the rooftop hypoth-esis generation process introduces the next important issue,time complexity. Nevatia et al. [6] introduced an automaticand interactive modeling method from aerial images, andRau et al. [7] presented a Split-Merge-Shape algorithm for3D building modeling in which an accurate scheme for 3Droof-edge measurements is proposed, however, these two ideasare semi-automatic, still requiring manual intervention.Haala et al. [8] point out “the difficulties of aerial image inter-
pretation also motivated the increasing use of three-dimensionalpoint clouds from laser altimetry as an alternative data source”.Using LiDAR data only, Wang et al. [9] developed a
Bayesian method to detect building footprints automaticallyfrom the LiDAR data. The point cloud has to be first seg-mented in to buildings, trees and grass as a pre-processing step.Verma et al. [10] presented a method to detect and constructcomplex buildings using LiDAR. It makes no assumptionabout prior knowledge about the types of buildings, but itdoesn’t address how to handle the situation if the rooftop hasmultiple layers/planar surfaces. Dorninger et al. [11] proposeda comprehensive approach for automated determination of3D city models from LiDAR point cloud data, but their ap-proach involved an interactive initialization called the coarseselection of building regions. Poullis et al. [12] addressed arapid modeling approach for large-scale area reconstruction byusing statistical considerations for segmenting the buildings.Zhou et al. [13] proposed a workflow for automatic buildingreconstruction from airborne LiDAR data. The highlights ofthis method are SVM-based vegetation detection, boundaryextraction, and automatic determination of principal directions.In their follow-on work, they mainly focused on the modelingstep in the workflow and extended the classic dual contouringof hermite data [14] to a 2.5D dual-contouring technique [15].They later improved the approach by adding topology control
[16]. This approach produces building models with arbitraryrooftop shapes.Lafarge et al. [17], [18] presented a novel and robust method
for modeling cities from point clouds. The algorithm is ableto construct simultaneously buildings, trees and terrains. Theyused LiDAR point clouds for experiments but claiming it is notrestricted to LiDAR data inputs.In consideration of the combination of LiDAR and geo-
metrically uncorrected image data for urban modeling, somework has been done on automatic registration of aerial imageswith LiDAR data. Ding et al. [19] and Lu et al. [20] bothproposed registration method based on 3D feature detectionand matching. Mastin et al. [21] introduced a novel idea forutilizing mutual information between the LiDAR and the 2Dimagery, which analyzes the statistical dependency in scenes.This information merger has advantages, however, findingcorrespondences between these two different types of dataautomatically is often problematic.
III. METHODOLOGY OVERVIEW
In this paper, a fully automaticmethod is proposed (see Fig. 1)that processes airborne LiDAR point cloud data for the purposeof building detection and modeling. The LiDAR data is a groupof unorganized discrete points in which each individual pointhas an x, y, and z value, plus the intensity value that representsthe reflective properties of surface encountered. Our algorithmrequires only LiDAR data as input with no prerequisite to ras-terize this data. The output of our algorithm is a group of water-tight mesh models that could be used for various applications.We follow a standardized pipeline and introduce novel method-ologies to improve accuracy and efficiency. The steps in theworkflow pipeline are:1) Preparation: The input point cloud is first passed througha noise filter (statistical outlier removal [22]) in order to ob-tain a less noisy data set. The point normals and curvaturesof all input points are estimated based on basic eigenanal-ysis.
2) Scene Classification: A graph cuts based optimizationalgorithm is introduced which examines the local distribu-tions of point normals. These distributions exhibit vastlydifferent behavior with a strong dependence on whichlandcover category (vegetation of non-vegetation) a setof points belongs to. A hierarchical Euclidean clustering
1442 IEEE JOURNAL OF SELECTED TOPICS IN APPLIED EARTH OBSERVATIONS AND REMOTE SENSING, VOL. 6, NO. 3, JUNE 2013
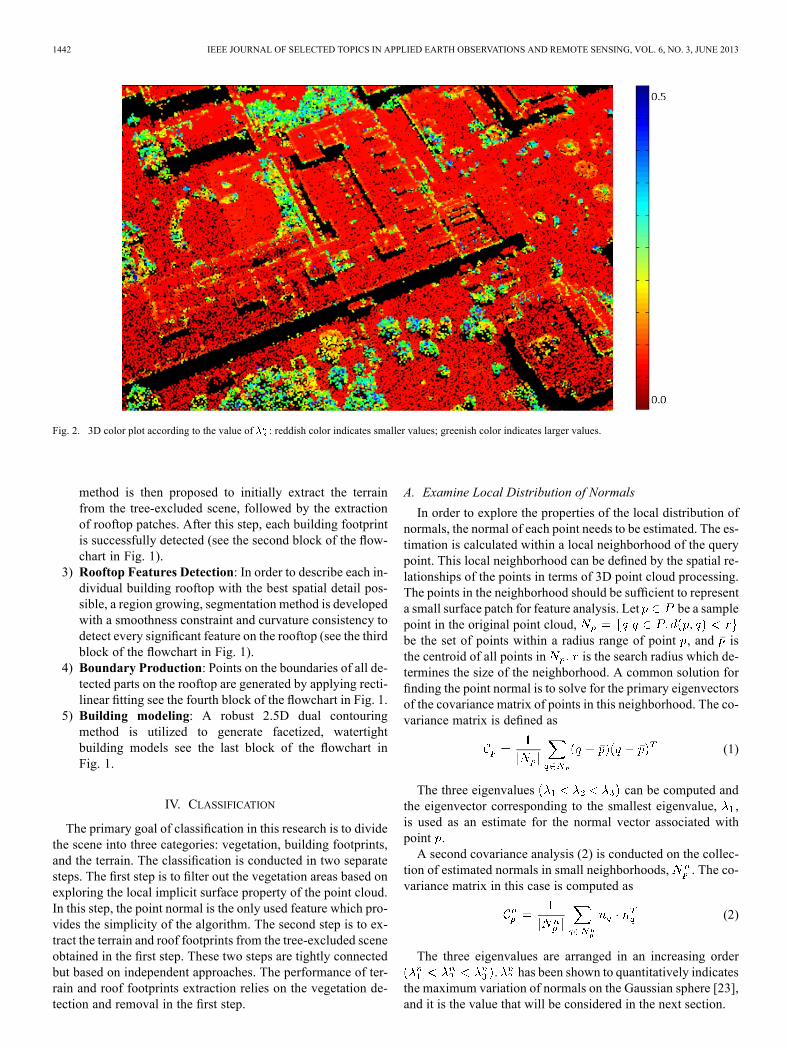
Fig. 2. 3D color plot according to the value of : reddish color indicates smaller values; greenish color indicates larger values.
method is then proposed to initially extract the terrainfrom the tree-excluded scene, followed by the extractionof rooftop patches. After this step, each building footprintis successfully detected (see the second block of the flow-chart in Fig. 1).
3) Rooftop Features Detection: In order to describe each in-dividual building rooftop with the best spatial detail pos-sible, a region growing, segmentation method is developedwith a smoothness constraint and curvature consistency todetect every significant feature on the rooftop (see the thirdblock of the flowchart in Fig. 1).
4) Boundary Production: Points on the boundaries of all de-tected parts on the rooftop are generated by applying recti-linear fitting see the fourth block of the flowchart in Fig. 1.
5) Building modeling: A robust 2.5D dual contouringmethod is utilized to generate facetized, watertightbuilding models see the last block of the flowchart inFig. 1.
IV. CLASSIFICATION
The primary goal of classification in this research is to dividethe scene into three categories: vegetation, building footprints,and the terrain. The classification is conducted in two separatesteps. The first step is to filter out the vegetation areas based onexploring the local implicit surface property of the point cloud.In this step, the point normal is the only used feature which pro-vides the simplicity of the algorithm. The second step is to ex-tract the terrain and roof footprints from the tree-excluded sceneobtained in the first step. These two steps are tightly connectedbut based on independent approaches. The performance of ter-rain and roof footprints extraction relies on the vegetation de-tection and removal in the first step.
A. Examine Local Distribution of Normals
In order to explore the properties of the local distribution ofnormals, the normal of each point needs to be estimated. The es-timation is calculated within a local neighborhood of the querypoint. This local neighborhood can be defined by the spatial re-lationships of the points in terms of 3D point cloud processing.The points in the neighborhood should be sufficient to representa small surface patch for feature analysis. Let be a samplepoint in the original point cloud,be the set of points within a radius range of point , and isthe centroid of all points in is the search radius which de-termines the size of the neighborhood. A common solution forfinding the point normal is to solve for the primary eigenvectorsof the covariance matrix of points in this neighborhood. The co-variance matrix is defined as
(1)
The three eigenvalues can be computed andthe eigenvector corresponding to the smallest eigenvalue, ,is used as an estimate for the normal vector associated withpoint .A second covariance analysis (2) is conducted on the collec-
tion of estimated normals in small neighborhoods, . The co-variance matrix in this case is computed as
(2)
The three eigenvalues are arranged in an increasing order. has been shown to quantitatively indicates
the maximum variation of normals on the Gaussian sphere [23],and it is the value that will be considered in the next section.
SUN AND SALVAGGIO: AERIAL 3D BUILDING DETECTION AND MODELING FROM AIRBORNE LIDAR POINT CLOUDS 1443
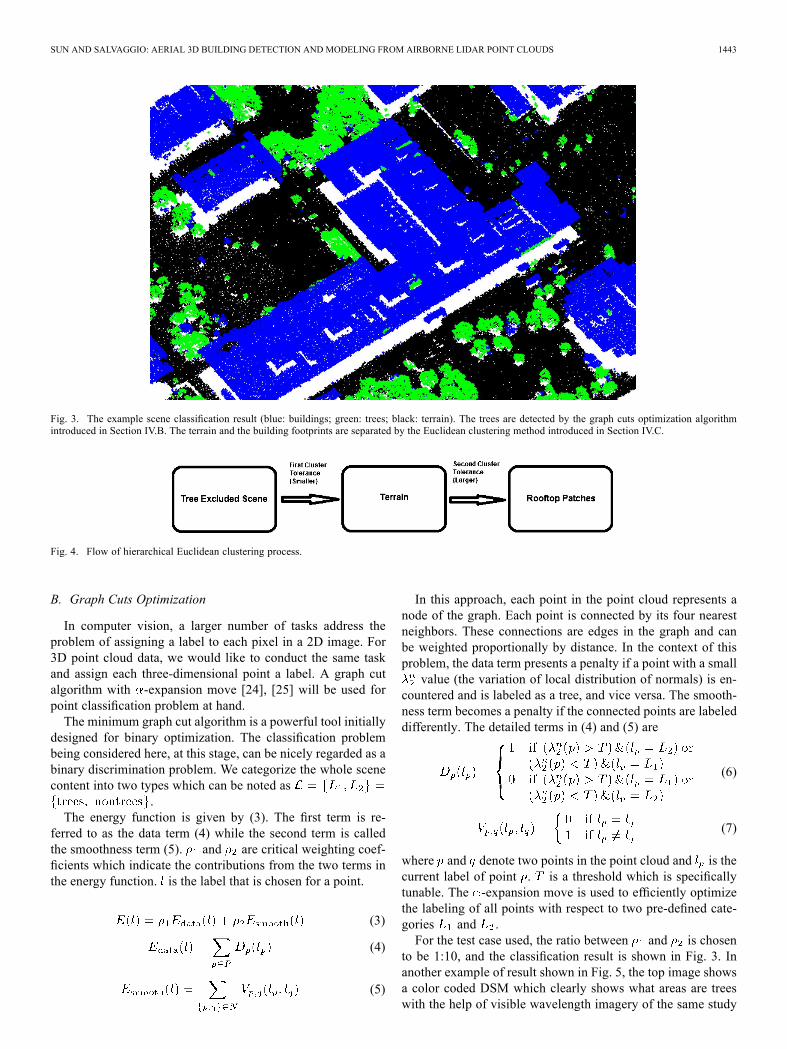
Fig. 3. The example scene classification result (blue: buildings; green: trees; black: terrain). The trees are detected by the graph cuts optimization algorithmintroduced in Section IV.B. The terrain and the building footprints are separated by the Euclidean clustering method introduced in Section IV.C.
Fig. 4. Flow of hierarchical Euclidean clustering process.
B. Graph Cuts Optimization
In computer vision, a larger number of tasks address theproblem of assigning a label to each pixel in a 2D image. For3D point cloud data, we would like to conduct the same taskand assign each three-dimensional point a label. A graph cutalgorithm with -expansion move [24], [25] will be used forpoint classification problem at hand.The minimum graph cut algorithm is a powerful tool initially
designed for binary optimization. The classification problembeing considered here, at this stage, can be nicely regarded as abinary discrimination problem. We categorize the whole scenecontent into two types which can be noted as
.The energy function is given by (3). The first term is re-
ferred to as the data term (4) while the second term is calledthe smoothness term (5). and are critical weighting coef-ficients which indicate the contributions from the two terms inthe energy function. is the label that is chosen for a point.
(3)
(4)
(5)
In this approach, each point in the point cloud represents anode of the graph. Each point is connected by its four nearestneighbors. These connections are edges in the graph and canbe weighted proportionally by distance. In the context of thisproblem, the data term presents a penalty if a point with a smallvalue (the variation of local distribution of normals) is en-
countered and is labeled as a tree, and vice versa. The smooth-ness term becomes a penalty if the connected points are labeleddifferently. The detailed terms in (4) and (5) are
(6)
(7)
where and denote two points in the point cloud and is thecurrent label of point . is a threshold which is specificallytunable. The -expansion move is used to efficiently optimizethe labeling of all points with respect to two pre-defined cate-gories and .For the test case used, the ratio between and is chosen
to be 1:10, and the classification result is shown in Fig. 3. Inanother example of result shown in Fig. 5, the top image showsa color coded DSM which clearly shows what areas are treeswith the help of visible wavelength imagery of the same study
1444 IEEE JOURNAL OF SELECTED TOPICS IN APPLIED EARTH OBSERVATIONS AND REMOTE SENSING, VOL. 6, NO. 3, JUNE 2013
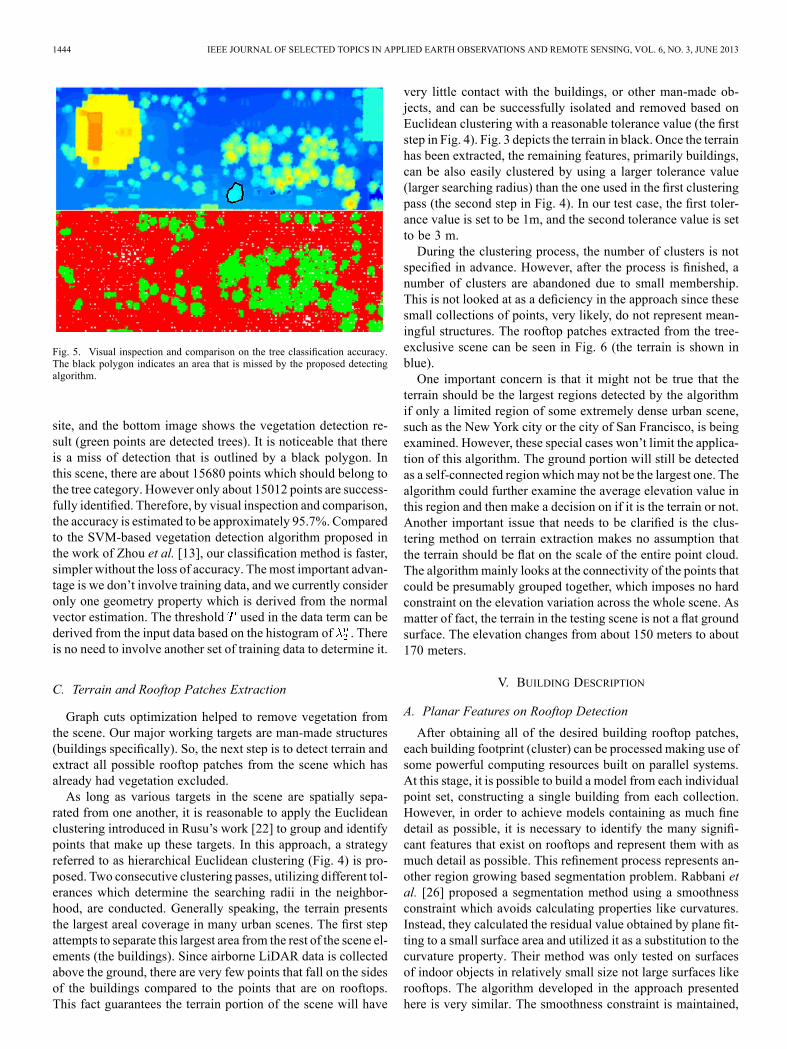
Fig. 5. Visual inspection and comparison on the tree classification accuracy.The black polygon indicates an area that is missed by the proposed detectingalgorithm.
site, and the bottom image shows the vegetation detection re-sult (green points are detected trees). It is noticeable that thereis a miss of detection that is outlined by a black polygon. Inthis scene, there are about 15680 points which should belong tothe tree category. However only about 15012 points are success-fully identified. Therefore, by visual inspection and comparison,the accuracy is estimated to be approximately 95.7%. Comparedto the SVM-based vegetation detection algorithm proposed inthe work of Zhou et al. [13], our classification method is faster,simpler without the loss of accuracy. Themost important advan-tage is we don’t involve training data, and we currently consideronly one geometry property which is derived from the normalvector estimation. The threshold used in the data term can bederived from the input data based on the histogram of . Thereis no need to involve another set of training data to determine it.
C. Terrain and Rooftop Patches Extraction
Graph cuts optimization helped to remove vegetation fromthe scene. Our major working targets are man-made structures(buildings specifically). So, the next step is to detect terrain andextract all possible rooftop patches from the scene which hasalready had vegetation excluded.As long as various targets in the scene are spatially sepa-
rated from one another, it is reasonable to apply the Euclideanclustering introduced in Rusu’s work [22] to group and identifypoints that make up these targets. In this approach, a strategyreferred to as hierarchical Euclidean clustering (Fig. 4) is pro-posed. Two consecutive clustering passes, utilizing different tol-erances which determine the searching radii in the neighbor-hood, are conducted. Generally speaking, the terrain presentsthe largest areal coverage in many urban scenes. The first stepattempts to separate this largest area from the rest of the scene el-ements (the buildings). Since airborne LiDAR data is collectedabove the ground, there are very few points that fall on the sidesof the buildings compared to the points that are on rooftops.This fact guarantees the terrain portion of the scene will have
very little contact with the buildings, or other man-made ob-jects, and can be successfully isolated and removed based onEuclidean clustering with a reasonable tolerance value (the firststep in Fig. 4). Fig. 3 depicts the terrain in black. Once the terrainhas been extracted, the remaining features, primarily buildings,can be also easily clustered by using a larger tolerance value(larger searching radius) than the one used in the first clusteringpass (the second step in Fig. 4). In our test case, the first toler-ance value is set to be 1m, and the second tolerance value is setto be 3 m.During the clustering process, the number of clusters is not
specified in advance. However, after the process is finished, anumber of clusters are abandoned due to small membership.This is not looked at as a deficiency in the approach since thesesmall collections of points, very likely, do not represent mean-ingful structures. The rooftop patches extracted from the tree-exclusive scene can be seen in Fig. 6 (the terrain is shown inblue).One important concern is that it might not be true that the
terrain should be the largest regions detected by the algorithmif only a limited region of some extremely dense urban scene,such as the New York city or the city of San Francisco, is beingexamined. However, these special cases won’t limit the applica-tion of this algorithm. The ground portion will still be detectedas a self-connected region which may not be the largest one. Thealgorithm could further examine the average elevation value inthis region and then make a decision on if it is the terrain or not.Another important issue that needs to be clarified is the clus-tering method on terrain extraction makes no assumption thatthe terrain should be flat on the scale of the entire point cloud.The algorithmmainly looks at the connectivity of the points thatcould be presumably grouped together, which imposes no hardconstraint on the elevation variation across the whole scene. Asmatter of fact, the terrain in the testing scene is not a flat groundsurface. The elevation changes from about 150 meters to about170 meters.
V. BUILDING DESCRIPTION
A. Planar Features on Rooftop Detection
After obtaining all of the desired building rooftop patches,each building footprint (cluster) can be processed making use ofsome powerful computing resources built on parallel systems.At this stage, it is possible to build a model from each individualpoint set, constructing a single building from each collection.However, in order to achieve models containing as much finedetail as possible, it is necessary to identify the many signifi-cant features that exist on rooftops and represent them with asmuch detail as possible. This refinement process represents an-other region growing based segmentation problem. Rabbani etal. [26] proposed a segmentation method using a smoothnessconstraint which avoids calculating properties like curvatures.Instead, they calculated the residual value obtained by plane fit-ting to a small surface area and utilized it as a substitution to thecurvature property. Their method was only tested on surfacesof indoor objects in relatively small size not large surfaces likerooftops. The algorithm developed in the approach presentedhere is very similar. The smoothness constraint is maintained,
SUN AND SALVAGGIO: AERIAL 3D BUILDING DETECTION AND MODELING FROM AIRBORNE LIDAR POINT CLOUDS 1445
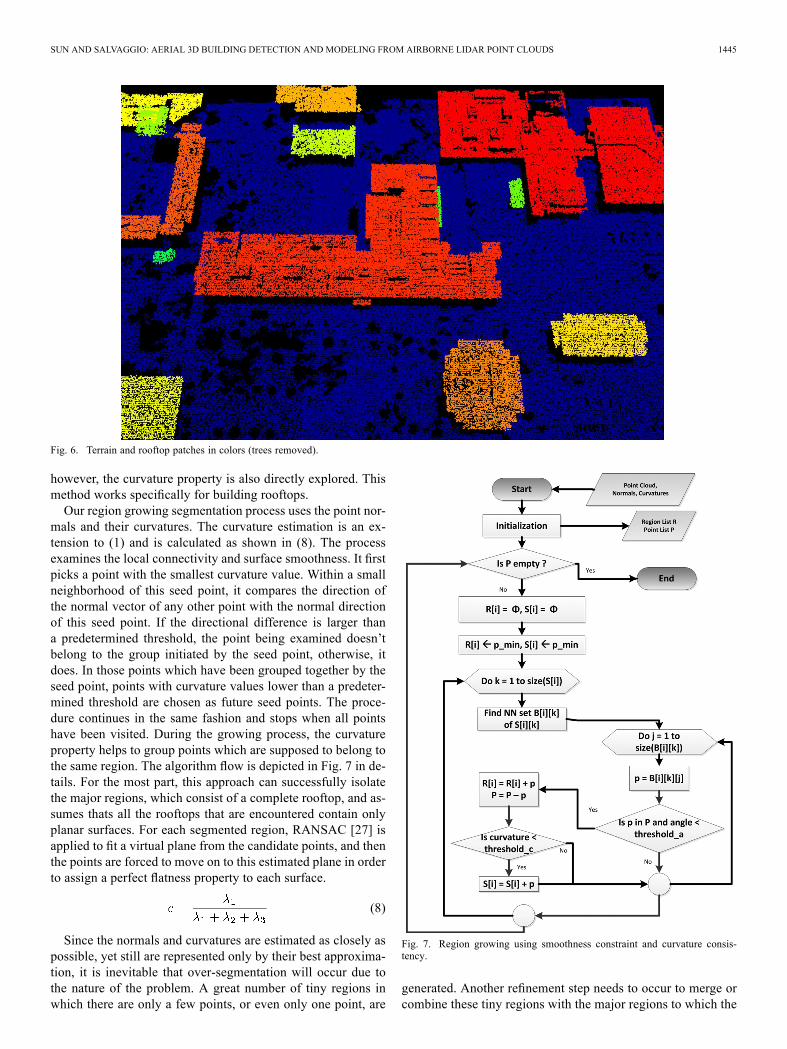
Fig. 6. Terrain and rooftop patches in colors (trees removed).
however, the curvature property is also directly explored. Thismethod works specifically for building rooftops.Our region growing segmentation process uses the point nor-
mals and their curvatures. The curvature estimation is an ex-tension to (1) and is calculated as shown in (8). The processexamines the local connectivity and surface smoothness. It firstpicks a point with the smallest curvature value. Within a smallneighborhood of this seed point, it compares the direction ofthe normal vector of any other point with the normal directionof this seed point. If the directional difference is larger thana predetermined threshold, the point being examined doesn’tbelong to the group initiated by the seed point, otherwise, itdoes. In those points which have been grouped together by theseed point, points with curvature values lower than a predeter-mined threshold are chosen as future seed points. The proce-dure continues in the same fashion and stops when all pointshave been visited. During the growing process, the curvatureproperty helps to group points which are supposed to belong tothe same region. The algorithm flow is depicted in Fig. 7 in de-tails. For the most part, this approach can successfully isolatethe major regions, which consist of a complete rooftop, and as-sumes thats all the rooftops that are encountered contain onlyplanar surfaces. For each segmented region, RANSAC [27] isapplied to fit a virtual plane from the candidate points, and thenthe points are forced to move on to this estimated plane in orderto assign a perfect flatness property to each surface.
(8)
Since the normals and curvatures are estimated as closely aspossible, yet still are represented only by their best approxima-tion, it is inevitable that over-segmentation will occur due tothe nature of the problem. A great number of tiny regions inwhich there are only a few points, or even only one point, are
Fig. 7. Region growing using smoothness constraint and curvature consis-tency.
generated. Another refinement step needs to occur to merge orcombine these tiny regions with the major regions to which the
1446 IEEE JOURNAL OF SELECTED TOPICS IN APPLIED EARTH OBSERVATIONS AND REMOTE SENSING, VOL. 6, NO. 3, JUNE 2013
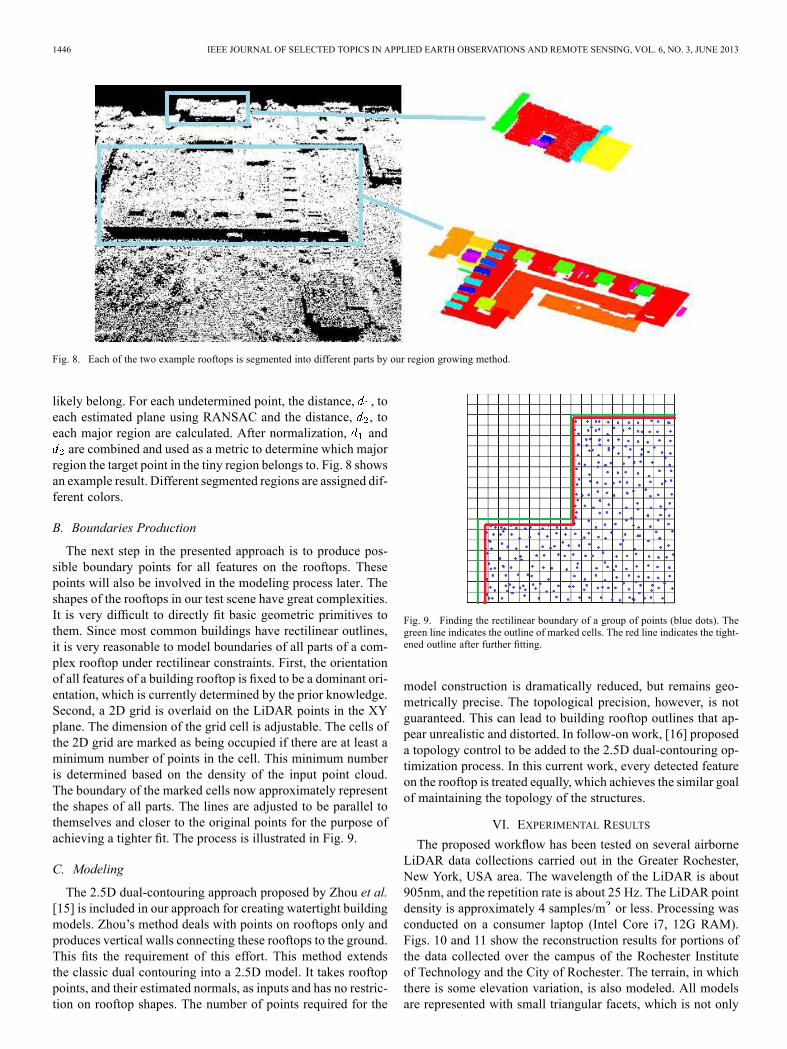
Fig. 8. Each of the two example rooftops is segmented into different parts by our region growing method.
likely belong. For each undetermined point, the distance, , toeach estimated plane using RANSAC and the distance, , toeach major region are calculated. After normalization, andare combined and used as a metric to determine which major
region the target point in the tiny region belongs to. Fig. 8 showsan example result. Different segmented regions are assigned dif-ferent colors.
B. Boundaries Production
The next step in the presented approach is to produce pos-sible boundary points for all features on the rooftops. Thesepoints will also be involved in the modeling process later. Theshapes of the rooftops in our test scene have great complexities.It is very difficult to directly fit basic geometric primitives tothem. Since most common buildings have rectilinear outlines,it is very reasonable to model boundaries of all parts of a com-plex rooftop under rectilinear constraints. First, the orientationof all features of a building rooftop is fixed to be a dominant ori-entation, which is currently determined by the prior knowledge.Second, a 2D grid is overlaid on the LiDAR points in the XYplane. The dimension of the grid cell is adjustable. The cells ofthe 2D grid are marked as being occupied if there are at least aminimum number of points in the cell. This minimum numberis determined based on the density of the input point cloud.The boundary of the marked cells now approximately representthe shapes of all parts. The lines are adjusted to be parallel tothemselves and closer to the original points for the purpose ofachieving a tighter fit. The process is illustrated in Fig. 9.
C. Modeling
The 2.5D dual-contouring approach proposed by Zhou et al.[15] is included in our approach for creating watertight buildingmodels. Zhou’s method deals with points on rooftops only andproduces vertical walls connecting these rooftops to the ground.This fits the requirement of this effort. This method extendsthe classic dual contouring into a 2.5D model. It takes rooftoppoints, and their estimated normals, as inputs and has no restric-tion on rooftop shapes. The number of points required for the
Fig. 9. Finding the rectilinear boundary of a group of points (blue dots). Thegreen line indicates the outline of marked cells. The red line indicates the tight-ened outline after further fitting.
model construction is dramatically reduced, but remains geo-metrically precise. The topological precision, however, is notguaranteed. This can lead to building rooftop outlines that ap-pear unrealistic and distorted. In follow-on work, [16] proposeda topology control to be added to the 2.5D dual-contouring op-timization process. In this current work, every detected featureon the rooftop is treated equally, which achieves the similar goalof maintaining the topology of the structures.
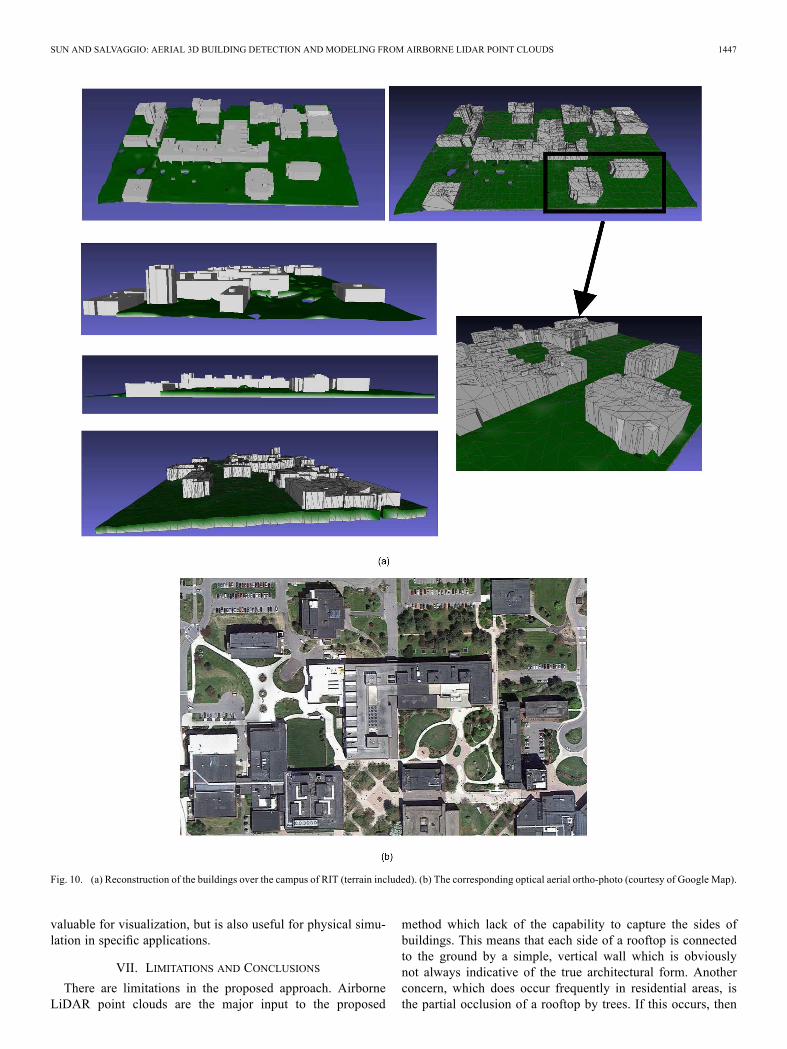
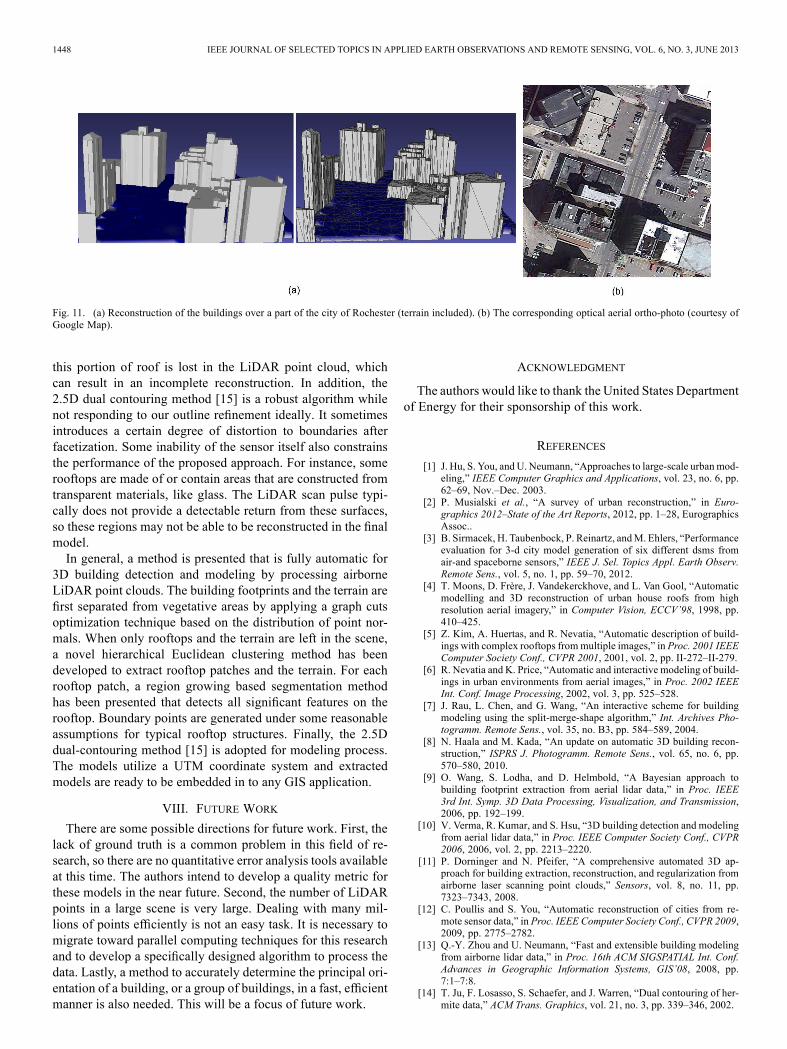
VI. EXPERIMENTAL RESULTS
The proposed workflow has been tested on several airborneLiDAR data collections carried out in the Greater Rochester,New York, USA area. The wavelength of the LiDAR is about905nm, and the repetition rate is about 25 Hz. The LiDAR pointdensity is approximately 4 samples/m or less. Processing wasconducted on a consumer laptop (Intel Core i7, 12G RAM).Figs. 10 and 11 show the reconstruction results for portions ofthe data collected over the campus of the Rochester Instituteof Technology and the City of Rochester. The terrain, in whichthere is some elevation variation, is also modeled. All modelsare represented with small triangular facets, which is not only
SUN AND SALVAGGIO: AERIAL 3D BUILDING DETECTION AND MODELING FROM AIRBORNE LIDAR POINT CLOUDS 1447
Fig. 10. (a) Reconstruction of the buildings over the campus of RIT (terrain included). (b) The corresponding optical aerial ortho-photo (courtesy of Google Map).
valuable for visualization, but is also useful for physical simu-lation in specific applications.
VII. LIMITATIONS AND CONCLUSIONS
There are limitations in the proposed approach. AirborneLiDAR point clouds are the major input to the proposed
method which lack of the capability to capture the sides ofbuildings. This means that each side of a rooftop is connectedto the ground by a simple, vertical wall which is obviouslynot always indicative of the true architectural form. Anotherconcern, which does occur frequently in residential areas, isthe partial occlusion of a rooftop by trees. If this occurs, then
1448 IEEE JOURNAL OF SELECTED TOPICS IN APPLIED EARTH OBSERVATIONS AND REMOTE SENSING, VOL. 6, NO. 3, JUNE 2013
Fig. 11. (a) Reconstruction of the buildings over a part of the city of Rochester (terrain included). (b) The corresponding optical aerial ortho-photo (courtesy ofGoogle Map).
this portion of roof is lost in the LiDAR point cloud, whichcan result in an incomplete reconstruction. In addition, the2.5D dual contouring method [15] is a robust algorithm whilenot responding to our outline refinement ideally. It sometimesintroduces a certain degree of distortion to boundaries afterfacetization. Some inability of the sensor itself also constrainsthe performance of the proposed approach. For instance, somerooftops are made of or contain areas that are constructed fromtransparent materials, like glass. The LiDAR scan pulse typi-cally does not provide a detectable return from these surfaces,so these regions may not be able to be reconstructed in the finalmodel.In general, a method is presented that is fully automatic for
3D building detection and modeling by processing airborneLiDAR point clouds. The building footprints and the terrain arefirst separated from vegetative areas by applying a graph cutsoptimization technique based on the distribution of point nor-mals. When only rooftops and the terrain are left in the scene,a novel hierarchical Euclidean clustering method has beendeveloped to extract rooftop patches and the terrain. For eachrooftop patch, a region growing based segmentation methodhas been presented that detects all significant features on therooftop. Boundary points are generated under some reasonableassumptions for typical rooftop structures. Finally, the 2.5Ddual-contouring method [15] is adopted for modeling process.The models utilize a UTM coordinate system and extractedmodels are ready to be embedded in to any GIS application.
VIII. FUTURE WORK
There are some possible directions for future work. First, thelack of ground truth is a common problem in this field of re-search, so there are no quantitative error analysis tools availableat this time. The authors intend to develop a quality metric forthese models in the near future. Second, the number of LiDARpoints in a large scene is very large. Dealing with many mil-lions of points efficiently is not an easy task. It is necessary tomigrate toward parallel computing techniques for this researchand to develop a specifically designed algorithm to process thedata. Lastly, a method to accurately determine the principal ori-entation of a building, or a group of buildings, in a fast, efficientmanner is also needed. This will be a focus of future work.
ACKNOWLEDGMENT
The authors would like to thank the United States Departmentof Energy for their sponsorship of this work.
REFERENCES
[1] J. Hu, S. You, and U. Neumann, “Approaches to large-scale urban mod-eling,” IEEE Computer Graphics and Applications, vol. 23, no. 6, pp.62–69, Nov.–Dec. 2003.
[2] P. Musialski et al., “A survey of urban reconstruction,” in Euro-graphics 2012–State of the Art Reports, 2012, pp. 1–28, EurographicsAssoc..
[3] B. Sirmacek, H. Taubenbock, P. Reinartz, andM. Ehlers, “Performanceevaluation for 3-d city model generation of six different dsms fromair-and spaceborne sensors,” IEEE J. Sel. Topics Appl. Earth Observ.Remote Sens., vol. 5, no. 1, pp. 59–70, 2012.
[4] T. Moons, D. Frère, J. Vandekerckhove, and L. Van Gool, “Automaticmodelling and 3D reconstruction of urban house roofs from highresolution aerial imagery,” in Computer Vision, ECCV’98, 1998, pp.410–425.
[5] Z. Kim, A. Huertas, and R. Nevatia, “Automatic description of build-ings with complex rooftops frommultiple images,” in Proc. 2001 IEEEComputer Society Conf., CVPR 2001, 2001, vol. 2, pp. II-272–II-279.
[6] R. Nevatia and K. Price, “Automatic and interactive modeling of build-ings in urban environments from aerial images,” in Proc. 2002 IEEEInt. Conf. Image Processing, 2002, vol. 3, pp. 525–528.
[7] J. Rau, L. Chen, and G. Wang, “An interactive scheme for buildingmodeling using the split-merge-shape algorithm,” Int. Archives Pho-togramm. Remote Sens., vol. 35, no. B3, pp. 584–589, 2004.
[8] N. Haala and M. Kada, “An update on automatic 3D building recon-struction,” ISPRS J. Photogramm. Remote Sens., vol. 65, no. 6, pp.570–580, 2010.
[9] O. Wang, S. Lodha, and D. Helmbold, “A Bayesian approach tobuilding footprint extraction from aerial lidar data,” in Proc. IEEE3rd Int. Symp. 3D Data Processing, Visualization, and Transmission,2006, pp. 192–199.
[10] V. Verma, R. Kumar, and S. Hsu, “3D building detection and modelingfrom aerial lidar data,” in Proc. IEEE Computer Society Conf., CVPR2006, 2006, vol. 2, pp. 2213–2220.
[11] P. Dorninger and N. Pfeifer, “A comprehensive automated 3D ap-proach for building extraction, reconstruction, and regularization fromairborne laser scanning point clouds,” Sensors, vol. 8, no. 11, pp.7323–7343, 2008.
[12] C. Poullis and S. You, “Automatic reconstruction of cities from re-mote sensor data,” in Proc. IEEE Computer Society Conf., CVPR 2009,2009, pp. 2775–2782.
[13] Q.-Y. Zhou and U. Neumann, “Fast and extensible building modelingfrom airborne lidar data,” in Proc. 16th ACM SIGSPATIAL Int. Conf.Advances in Geographic Information Systems, GIS’08, 2008, pp.7:1–7:8.
[14] T. Ju, F. Losasso, S. Schaefer, and J. Warren, “Dual contouring of her-mite data,” ACM Trans. Graphics, vol. 21, no. 3, pp. 339–346, 2002.
SUN AND SALVAGGIO: AERIAL 3D BUILDING DETECTION AND MODELING FROM AIRBORNE LIDAR POINT CLOUDS 1449
[15] Q.-Y. Zhou and U. Neumann, “2.5D dual contouring: A robust ap-proach to creating building models from aerial lidar point clouds,” inComputer Vision, ECCV 2010, 2010, pp. 115–128.
[16] Q.-Y. Zhou and U. Neumann, “2.5D building modeling with topologycontrol,” in Proc. 2011 IEEE Computer Society Conf., CVPR 2011,2011, pp. 2489–2496.
[17] F. Lafarge and C. Mallet, “Building large urban environments fromunstructured point data,” in Proc. IEEE Int. Conf. Computer Vision,2011, pp. 1068–1075.
[18] F. Lafarge and C. Mallet, “Creating large-scale city models from3D-point clouds: A robust approach with hybrid representation,” Int.J. Computer Vision, pp. 1–17, 2012.
[19] M. Ding, K. Lyngbaek, and A. Zakhor, “Automatic registration ofaerial imagery with untextured 3D lidar models,” in Proc. IEEEComputer Society Conf., CVPR 2008, 2008, pp. 1–8, IEEE.
[20] L. Wang and U. Neumann, “A robust approach for automatic registra-tion of aerial images with untextured aerial lidar data,” in Proc. 2009IEEE Computer Society Conf., CVPR 2009, 2009, pp. 2623–2630.
[21] A.Mastin, J. Kepner, and J. Fisher, “Automatic registration of lidar andoptical images of urban scenes,” in Proc. 2009 IEEE Computer SocietyConf., CVPR 2009, 2009, pp. 2639–2646.
[22] R. B. Rusu, “Semantic 3D object maps for everyday manipulationin human living environments,” Ph.D. thesis, Technische UniversitätMuenchen, Munich, Germany, 2009.
[23] M. Pauly, Point Primitives for Interactive Modeling and Processing of3D Geometry. Konstanz, Germany: Hartung-Gorre, 2003.
[24] Y. Boykov, O. Veksler, and R. Zabih, “Fast approximate energy min-imization via graph cuts,” IEEE Trans. Pattern Analysis and MachineIntelligence, vol. 23, no. 11, pp. 1222–1239, 2001.
[25] V. Kolmogorov and R. Zabin, “What energy functions can be mini-mized via graph cuts?,” IEEE Trans. Pattern Analysis and MachineIntelligence, vol. 26, no. 2, pp. 147–159, 2004.
[26] T. Rabbani, F. van Den Heuvel, and G. Vosselmann, “Segmentation ofpoint clouds using smoothness constraint,” Int. Archives of Photogram-metry, Remote Sensing and Spatial Information Sciences, vol. 36, no.5, pp. 248–253, 2006.
[27] M. Zuliani, “Ransac for Dummies,With Examples Using the RANSACToolbox for Matlab andMore,” 2009 [Online]. Available: http://vision.ece.ucsb.edu/.../RANSAC/docs/RANSAC4Dummies.pdf
Shaohui Sun received the B.S. degree in biomedicalengineering in 2006 and the M.S. degree in computerscience and technology in 2008 from Sun Yat-senUniversity, Guangzhou, China. During his Masterstudy, he did an internship at Microsoft China asa software development engineer. He then workedfor Tektronix as a software engineer from 2008 to2010. He is currently working towards the Ph.D.degree in imaging science at the Rochester Instituteof Technology, Rochester, NY, USA.He is a graduate research assistant in the Digital
Imaging and Remote Sensing lab. His research interests include remote sensing,photogrammetry, computer vision focusing on three-dimensional urban recon-struction from airborne LiDAR and imagery.
Carl Salvaggio is a Professor of Imaging Science inthe Chester F. Carlson Center for Imaging Scienceat the Rochester Institute of Technology, Rochester,NY, USA. He is a member of the Digital Imaging andRemote Sensing Laboratory teaching and conductingresearch in digital image processing, remote sensing,and computer science. His particular research inter-ests lie in numerous areas including thermal infraredphenomenology, exploitation, and simulation; designand implementation of novel imaging and ground-based measurement systems; three-dimensional ge-
ometry extraction from multi-view imagery and LiDAR data; material opticalproperties measurement and modeling; and still and motion image processingfor various applications.