Embed Size (px)
Citation preview
http://www.continental-ir.com Wolfgang Schaefer – CFO
Ticker: CONADR-Ticker: CTTAY
Frankfurt – November 9, 20159M 2015 Results
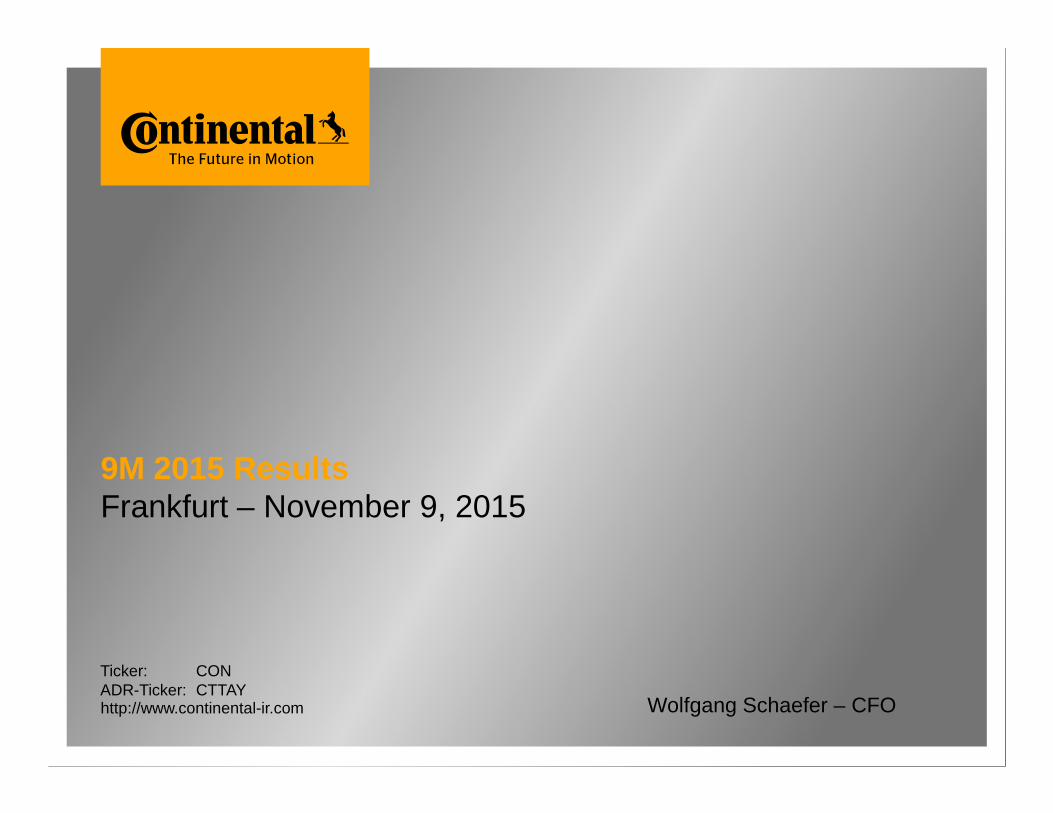
AGENDA
Corporation Highlights1 3
Automotive Group2 10
Rubber Group3 12
Indebtedness and Cash Flow4 16
Outlook 20155 19
28Update ADAS6 22
9M 2015 Results – November 9, 2015EDMR – Equity and Debt Markets Relations 2
Back-up & Fact Sheets 2013 - 20157
28Update ADAS6 22
31
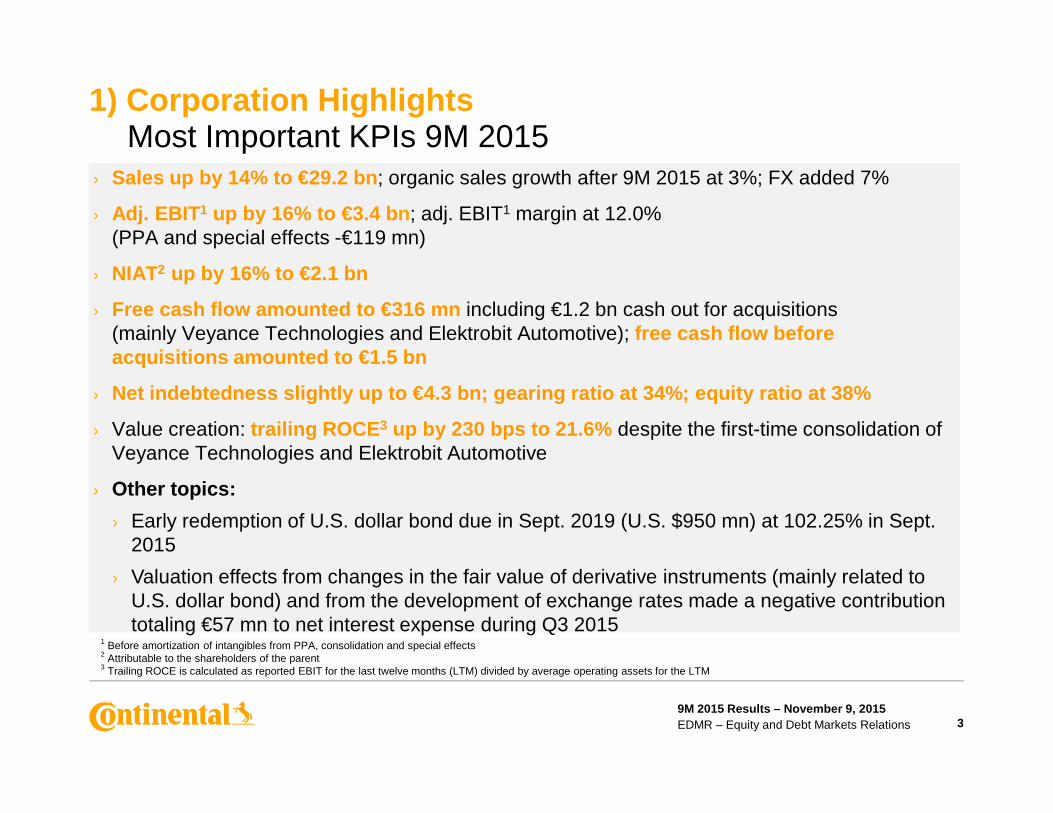
1) Corporation Highlights Most Important KPIs 9M 2015
› Sales up by 14% to €29.2 bn ; organic sales growth after 9M 2015 at 3%; FX added 7%
› Adj. EBIT 1 up by 16% to €3.4 b n; adj. EBIT1 margin at 12.0%(PPA and special effects -€119 mn)
› NIAT2 up by 16% to €2.1 bn
› Free cash flow amounted to €316 mn including €1.2 bn cash out for acquisitions (mainly Veyance Technologies and Elektrobit Automotive); free cash flow before acquisitions amounted to €1.5 bn
› Net indebtedness slightly up to €4.3 bn; gearing ra tio at 34%; equity ratio at 38%
9M 2015 Results – November 9, 2015EDMR – Equity and Debt Markets Relations 3
1 Before amortization of intangibles from PPA, consolidation and special effects2 Attributable to the shareholders of the parent3 Trailing ROCE is calculated as reported EBIT for the last twelve months (LTM) divided by average operating assets for the LTM
› Value creation: trailing ROCE 3 up by 230 bps to 21.6% despite the first-time consolidation of Veyance Technologies and Elektrobit Automotive
› Other topics:
› Early redemption of U.S. dollar bond due in Sept. 2019 (U.S. $950 mn) at 102.25% in Sept. 2015
› Valuation effects from changes in the fair value of derivative instruments (mainly related to U.S. dollar bond) and from the development of exchange rates made a negative contribution totaling €57 mn to net interest expense during Q3 2015
1) Corporation Highlights Divisional Highlights 9M 2015
Aut
omot
ive
Gro
up
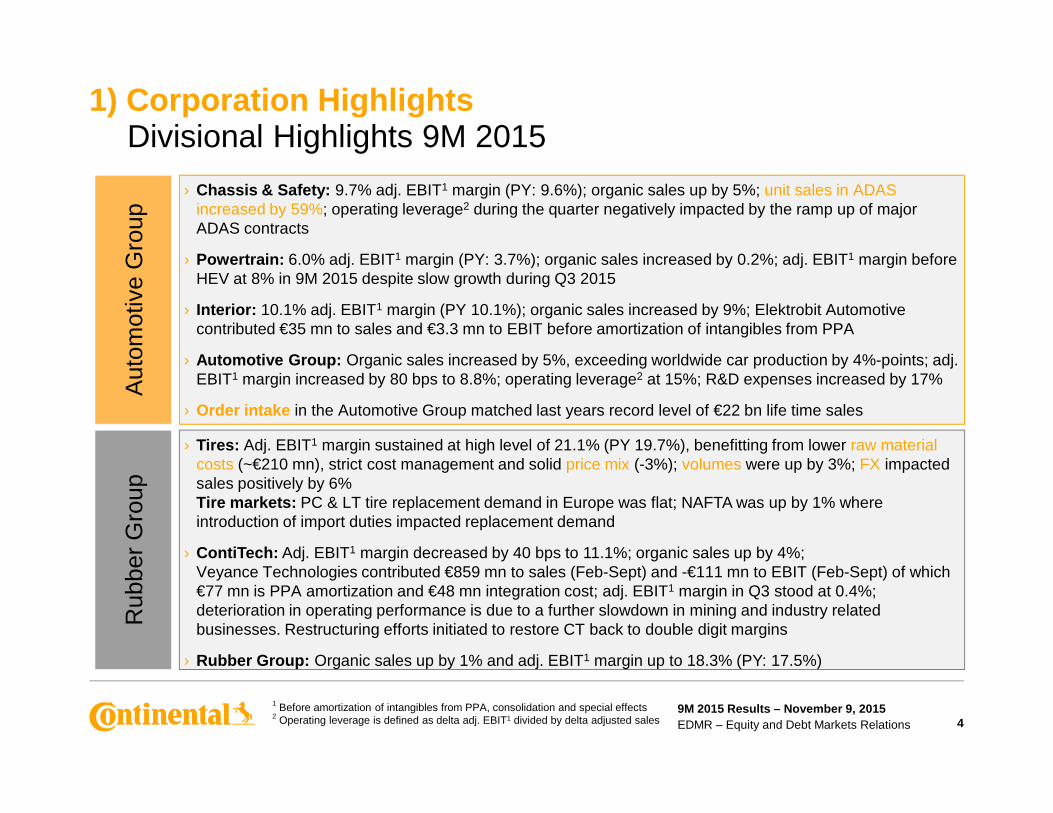
› Chassis & Safety: 9.7% adj. EBIT1 margin (PY: 9.6%); organic sales up by 5%; unit sales in ADAS increased by 59%; operating leverage2 during the quarter negatively impacted by the ramp up of major ADAS contracts
› Powertrain: 6.0% adj. EBIT1 margin (PY: 3.7%); organic sales increased by 0.2%; adj. EBIT1 margin before HEV at 8% in 9M 2015 despite slow growth during Q3 2015
› Interior: 10.1% adj. EBIT1 margin (PY 10.1%); organic sales increased by 9%; Elektrobit Automotive contributed €35 mn to sales and €3.3 mn to EBIT before amortization of intangibles from PPA
› Automotive Group: Organic sales increased by 5%, exceeding worldwide car production by 4%-points; adj. EBIT1 margin increased by 80 bps to 8.8%; operating leverage2 at 15%; R&D expenses increased by 17%
› Order intake in the Automotive Group matched last years record level of €22 bn life time sales
9M 2015 Results – November 9, 2015EDMR – Equity and Debt Markets Relations 4
Rub
ber
Gro
up
› Tires: Adj. EBIT1 margin sustained at high level of 21.1% (PY 19.7%), benefitting from lower raw material costs (~€210 mn), strict cost management and solid price mix (-3%); volumes were up by 3%; FX impacted sales positively by 6%Tire markets: PC & LT tire replacement demand in Europe was flat; NAFTA was up by 1% where introduction of import duties impacted replacement demand
› ContiTech: Adj. EBIT1 margin decreased by 40 bps to 11.1%; organic sales up by 4%; Veyance Technologies contributed €859 mn to sales (Feb-Sept) and -€111 mn to EBIT (Feb-Sept) of which €77 mn is PPA amortization and €48 mn integration cost; adj. EBIT1 margin in Q3 stood at 0.4%; deterioration in operating performance is due to a further slowdown in mining and industry related businesses. Restructuring efforts initiated to restore CT back to double digit margins
› Rubber Group: Organic sales up by 1% and adj. EBIT1 margin up to 18.3% (PY: 17.5%)
› Order intake in the Automotive Group matched last years record level of €22 bn life time sales
1 Before amortization of intangibles from PPA, consolidation and special effects2 Operating leverage is defined as delta adj. EBIT1 divided by delta adjusted sales
8,033
8,5418,350 8,407 8,390 8,528 8,670
8,918
9,56910,030
9,618
1,0041,054
1,2501,076
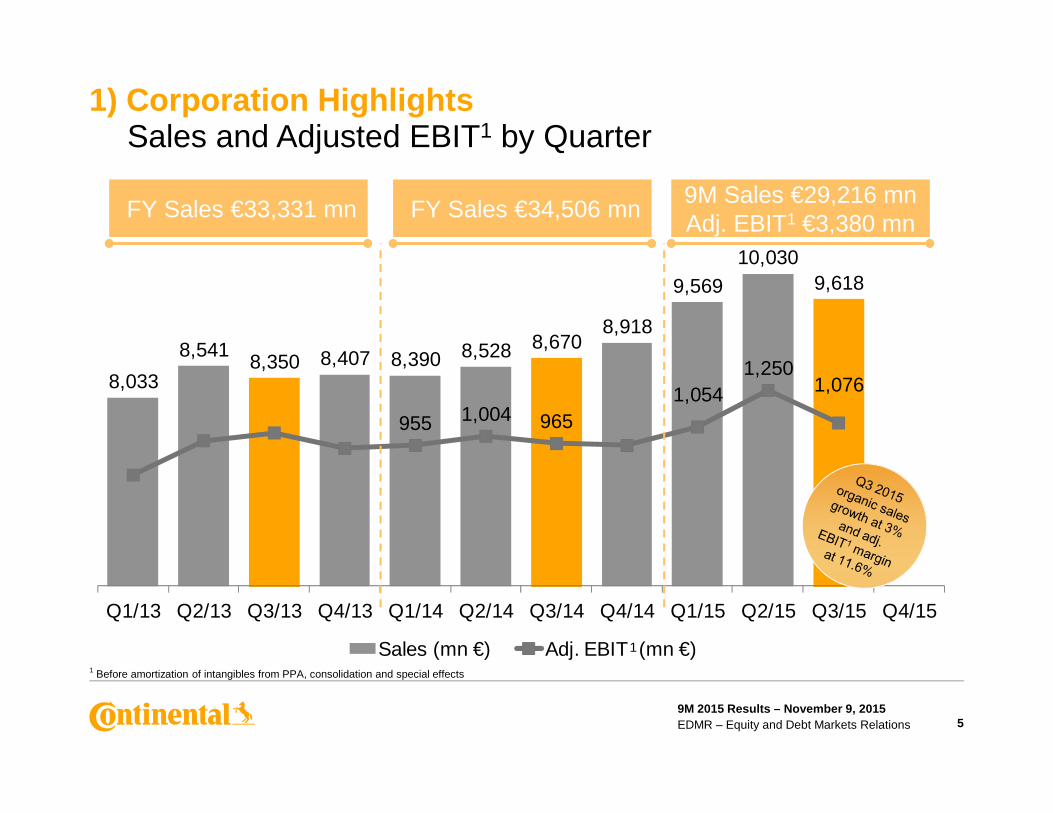
1) Corporation Highlights Sales and Adjusted EBIT1 by Quarter
FY Sales €33,331 mn9M Sales €29,216 mnAdj. EBIT1 €3,380 mn
FY Sales €34,506 mn
9M 2015 Results – November 9, 2015EDMR – Equity and Debt Markets Relations
955 1,004 965
Q1/13 Q2/13 Q3/13 Q4/13 Q1/14 Q2/14 Q3/14 Q4/14 Q1/15 Q2/15 Q3/15 Q4/15
Sales (mn €) Adj. EBIT (mn €)
5
1 Before amortization of intangibles from PPA, consolidation and special effects
1
3,13
2
3,39
2
3,41
5
3,41
7
3,27
1
3,36
2
3,51
8
3,48
7
3,66
9
4,04
5
3,96
8
557 588629
579
733647
Sales (mn €) Adj. EBIT (mn €)
4,91
1
5,16
0
4,94
5
5,00
0
5,12
9
5,17
6
5,16
2
5,44
2
5,91
2
5,99
6
5,66
1
509564
Sales (mn €) Adj. EBIT (mn €)
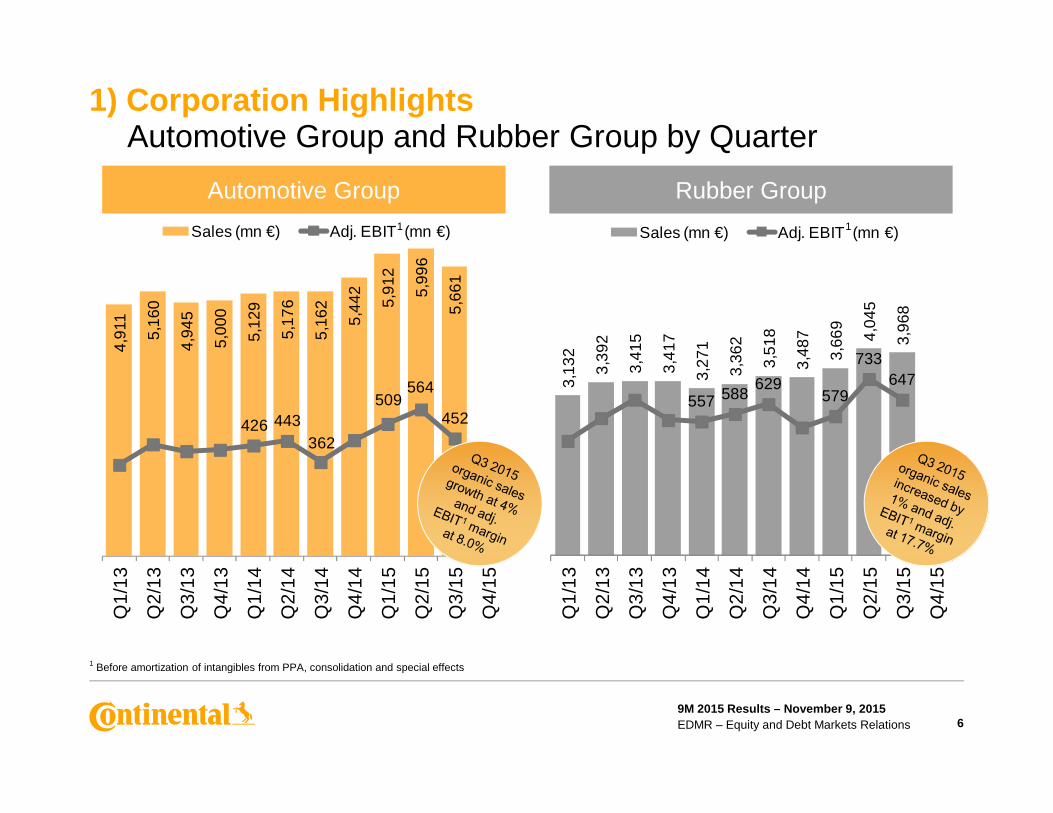
1) Corporation Highlights Automotive Group and Rubber Group by Quarter
1 1
Automotive Group Rubber Group
9M 2015 Results – November 9, 2015EDMR – Equity and Debt Markets Relations
557
Q1
/13
Q2
/13
Q3
/13
Q4
/13
Q1
/14
Q2
/14
Q3
/14
Q4
/14
Q1
/15
Q2
/15
Q3
/15
Q4
/15
426 443362
509452
Q1/
13
Q2/
13
Q3/
13
Q4/
13
Q1/
14
Q2/
14
Q3/
14
Q4/
14
Q1/
15
Q2/
15
Q3/
15
Q4/
15
6
1 Before amortization of intangibles from PPA, consolidation and special effects
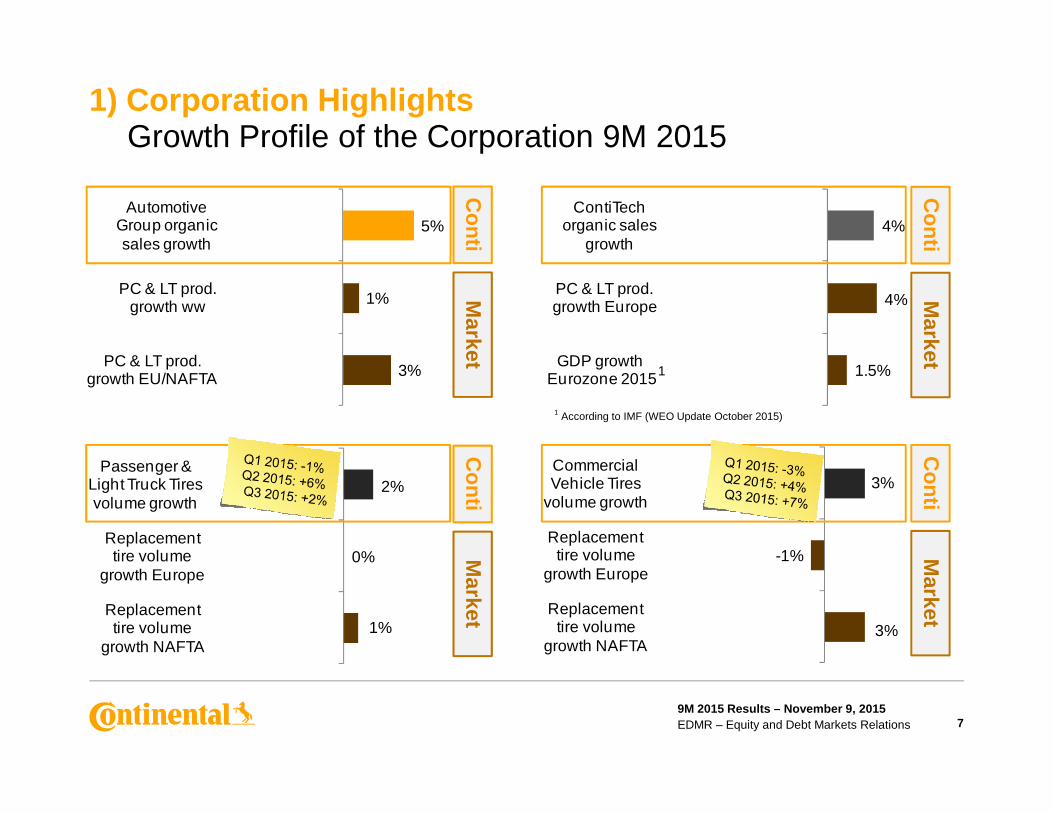
3%
1%
5%
PC & LT prod.growth EU/NAFTA
PC & LT prod. growth ww
AutomotiveGroup organic sales growth
1.5%
4%
4%
GDP growthEurozone 2015
PC & LT prod.growth Europe
ContiTechorganic sales
growth
1) Corporation Highlights Growth Profile of the Corporation 9M 2015
Conti
Market
1
Conti
Market
9M 2015 Results – November 9, 2015EDMR – Equity and Debt Markets Relations
3%
-1%
3%
Replacement tire volume
growth NAFTA
Replacement tire volume
growth Europe
CommercialVehicle Tires
volume growth
1%
0%
2%
Replacement tire volume
growth NAFTA
Replacement tire volume
growth Europe
Passenger & Light Truck Tires volume growth
7
1 According to IMF (WEO Update October 2015)
Conti
Market
Conti
Market
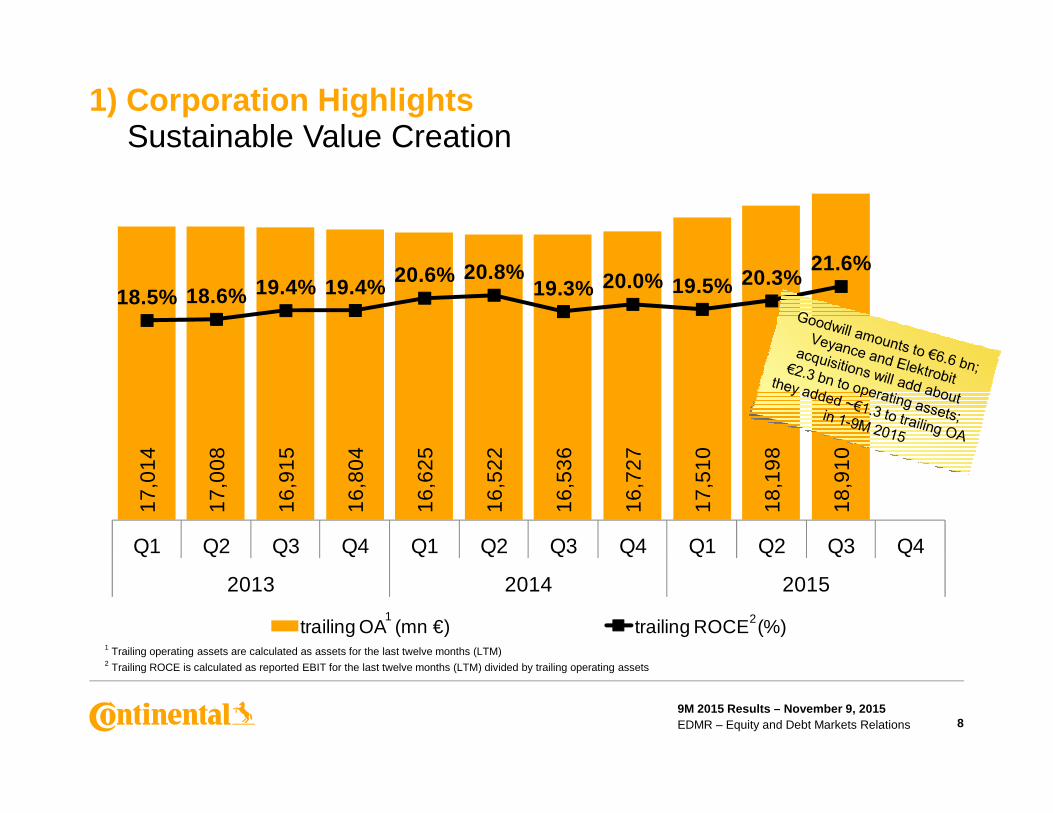
18.5% 18.6% 19.4% 19.4% 20.6% 20.8%19.3% 20.0% 19.5% 20.3%
21.6%
1) Corporation Highlights Sustainable Value Creation
9M 2015 Results – November 9, 2015EDMR – Equity and Debt Markets Relations
17,0
14
17,0
08
16,9
15
16,8
04
16,6
25
16,5
22
16,5
36
16,7
27
17,5
10
18,1
98
18,9
10
Q1 Q2 Q3 Q4 Q1 Q2 Q3 Q4 Q1 Q2 Q3 Q4
2013 2014 2015
trailing OA (mn €) trailing ROCE (%)
8
1 Trailing operating assets are calculated as assets for the last twelve months (LTM)2 Trailing ROCE is calculated as reported EBIT for the last twelve months (LTM) divided by trailing operating assets
1 2
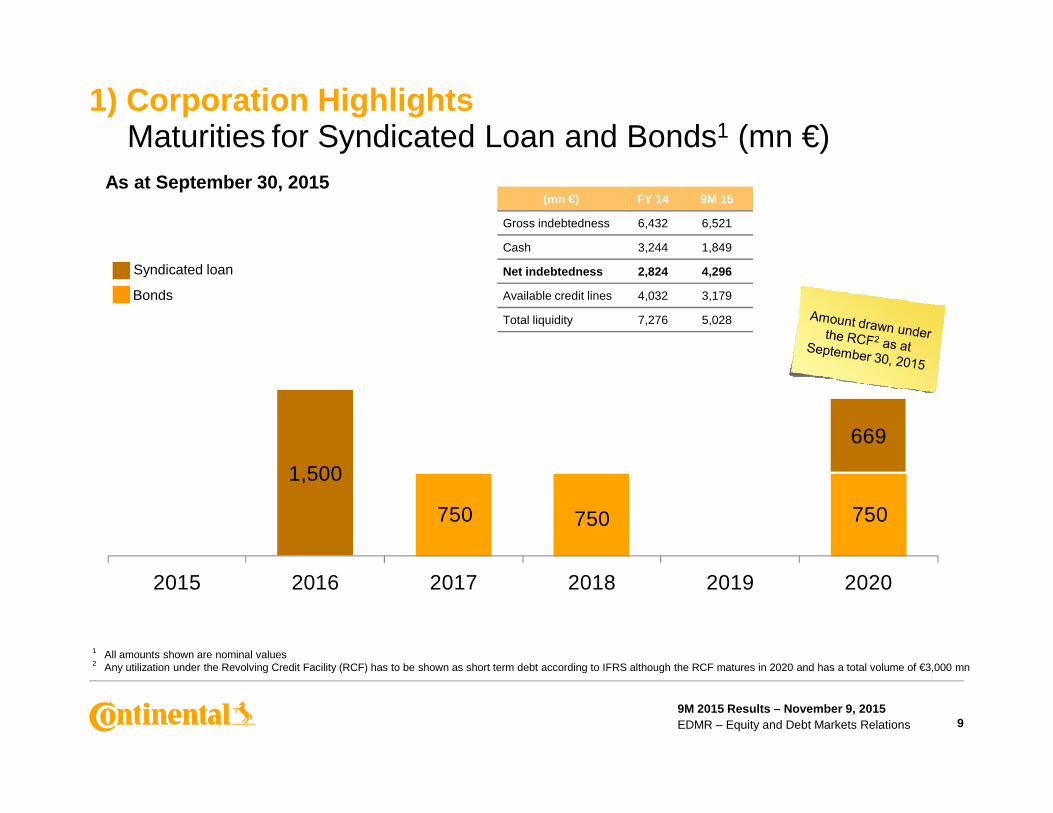
1) Corporation Highlights Maturities for Syndicated Loan and Bonds1 (mn €)
Syndicated loan
Bonds
As at September 30, 2015 (mn €) FY 14 9M 15
Gross indebtedness 6,432 6,521
Cash 3,244 1,849
Net indebtedness 2,824 4,296
Available credit lines 4,032 3,179
Total liquidity 7,276 5,028
9M 2015 Results – November 9, 2015EDMR – Equity and Debt Markets Relations
750 750 750
1,500
669
2015 2016 2017 2018 2019 2020
9
1 All amounts shown are nominal values2 Any utilization under the Revolving Credit Facility (RCF) has to be shown as short term debt according to IFRS although the RCF matures in 2020 and has a total volume of €3,000 mn
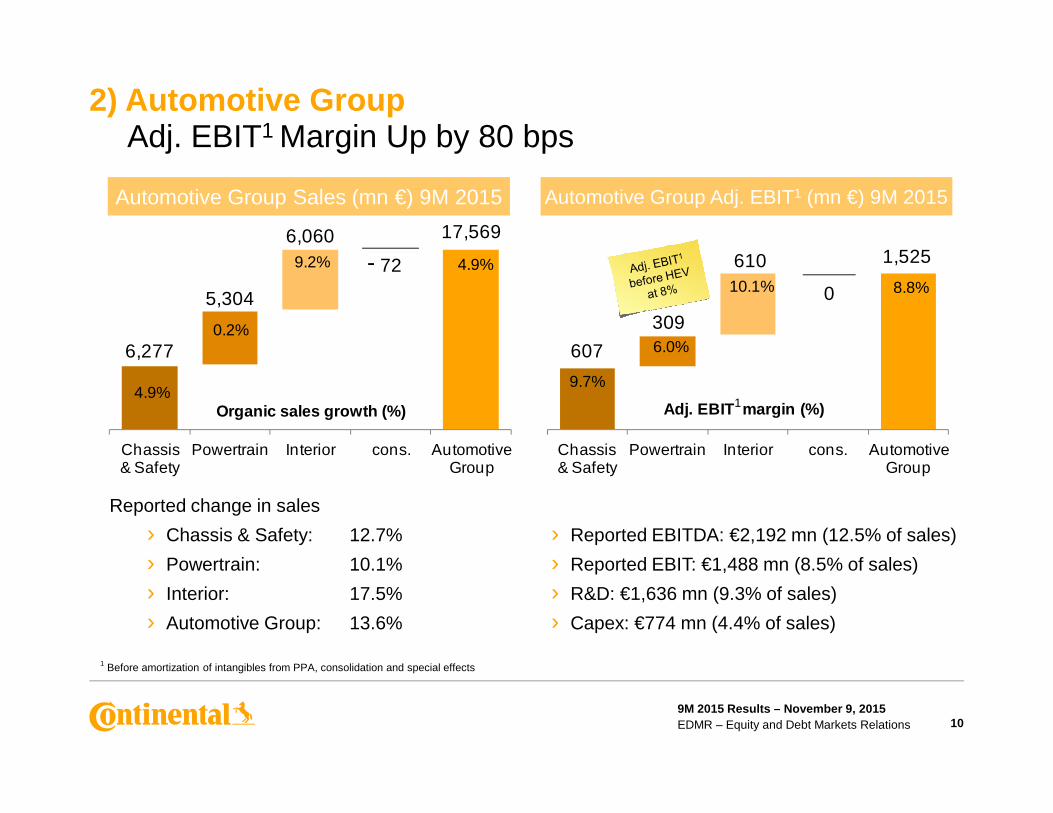
6,277
5,304
6,060
72
17,569
0.2%
9.2% 4.9%
4.9%Organic sales growth (%)
607
309
610
0
1,525
9.7%
6.0%
10.1% 8.8%
Adj. EBIT margin (%)
2) Automotive GroupAdj. EBIT1 Margin Up by 80 bps
Automotive Group Sales (mn €) 9M 2015 Automotive Group Adj. EBIT1 (mn €) 9M 2015
-
1
9M 2015 Results – November 9, 2015EDMR – Equity and Debt Markets Relations
Chassis & Safety
Powertrain Interior cons. AutomotiveGroup
Organic sales growth (%)
Chassis & Safety
Powertrain Interior cons. AutomotiveGroup
Adj. EBIT margin (%)
Reported change in sales
› Chassis & Safety: 12.7%
› Powertrain: 10.1%
› Interior: 17.5%
› Automotive Group: 13.6%
10
1
1 Before amortization of intangibles from PPA, consolidation and special effects
› Reported EBITDA: €2,192 mn (12.5% of sales)
› Reported EBIT: €1,488 mn (8.5% of sales)
› R&D: €1,636 mn (9.3% of sales)
› Capex: €774 mn (4.4% of sales)
5,1625,442 5,912 5,996 5,661
362
452
7.0%
8.0%
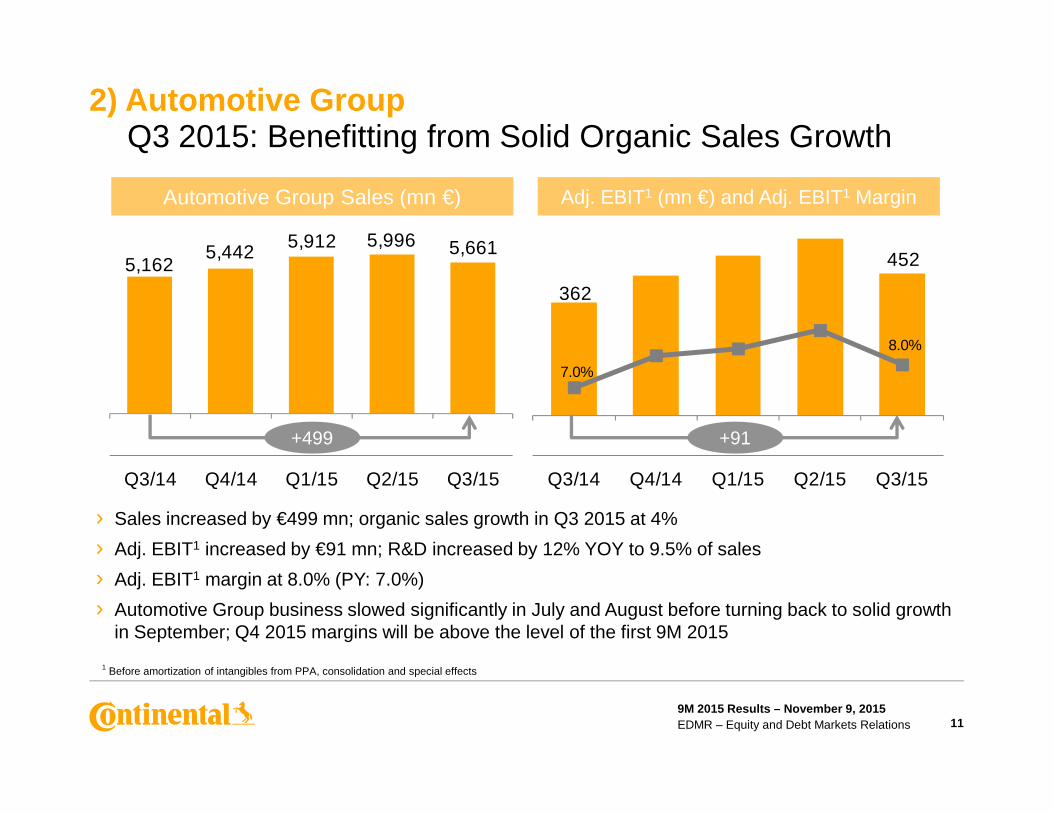
2) Automotive GroupQ3 2015: Benefitting from Solid Organic Sales Growth
Automotive Group Sales (mn €) Adj. EBIT1 (mn €) and Adj. EBIT1 Margin
9M 2015 Results – November 9, 2015EDMR – Equity and Debt Markets Relations
Q3/14 Q4/14 Q1/15 Q2/15 Q3/15 Q3/14 Q4/14 Q1/15 Q2/15 Q3/15
› Sales increased by €499 mn; organic sales growth in Q3 2015 at 4%
› Adj. EBIT1 increased by €91 mn; R&D increased by 12% YOY to 9.5% of sales
› Adj. EBIT1 margin at 8.0% (PY: 7.0%)
› Automotive Group business slowed significantly in July and August before turning back to solid growth in September; Q4 2015 margins will be above the level of the first 9M 2015
11
+499 +91
1 Before amortization of intangibles from PPA, consolidation and special effects
346
1,613
0
1,959
21.1% 18.3%
4,018
7,719
54
11,683
3.6%
-0.3% 0.9%
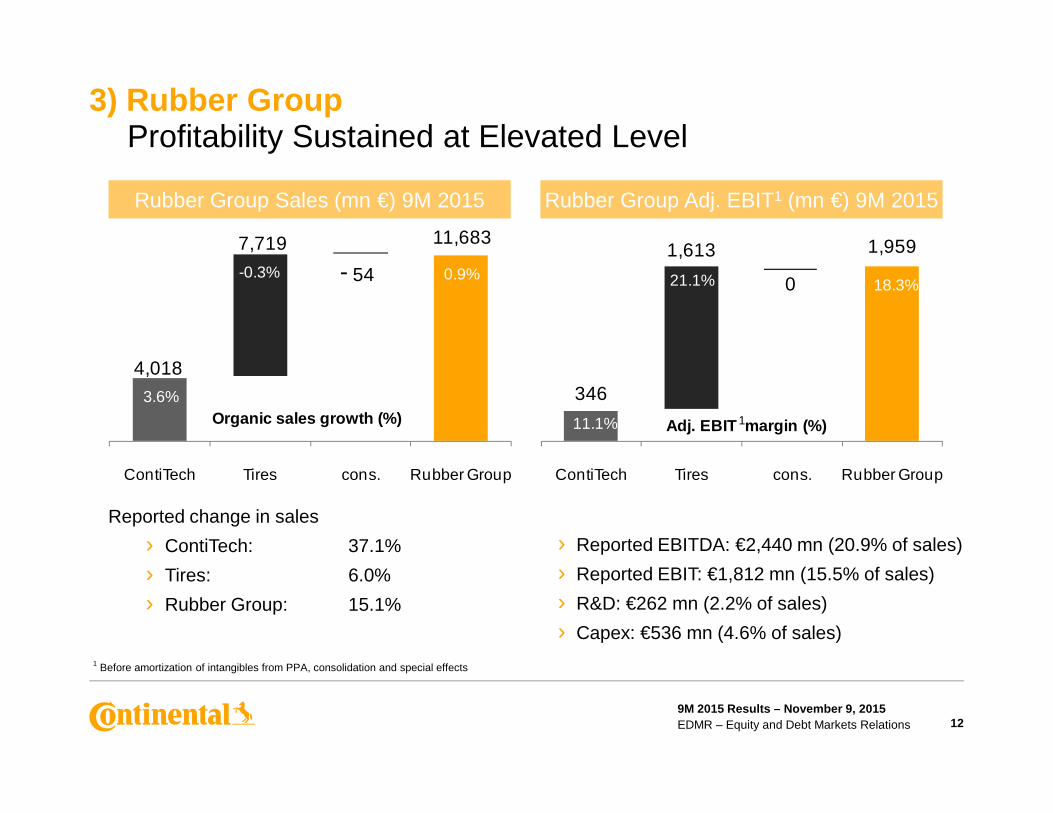
3) Rubber Group Profitability Sustained at Elevated Level
Rubber Group Sales (mn €) 9M 2015 Rubber Group Adj. EBIT1 (mn €) 9M 2015
-
9M 2015 Results – November 9, 2015EDMR – Equity and Debt Markets Relations
ContiTech Tires cons. Rubber Group
11.1% Adj. EBIT margin (%)
ContiTech Tires cons. Rubber Group
Organic sales growth (%)
Reported change in sales
› ContiTech: 37.1%
› Tires: 6.0%
› Rubber Group: 15.1%
12
1 Before amortization of intangibles from PPA, consolidation and special effects
1
› Reported EBITDA: €2,440 mn (20.9% of sales)
› Reported EBIT: €1,812 mn (15.5% of sales)
› R&D: €262 mn (2.2% of sales)
› Capex: €536 mn (4.6% of sales)
3,518 3,487 3,6694,045 3,968
629 647
17.9% 17.7%
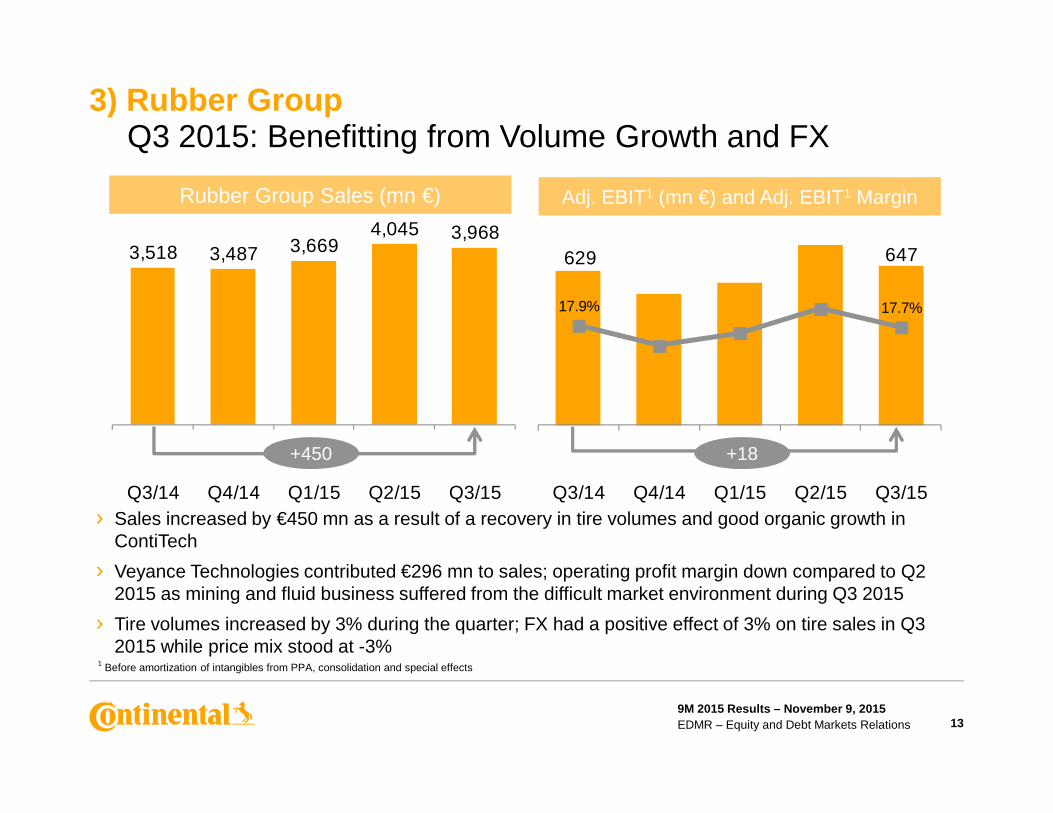
3) Rubber GroupQ3 2015: Benefitting from Volume Growth and FX
Rubber Group Sales (mn €) Adj. EBIT1 (mn €) and Adj. EBIT1 Margin
9M 2015 Results – November 9, 2015EDMR – Equity and Debt Markets Relations
Q3/14 Q4/14 Q1/15 Q2/15 Q3/15 Q3/14 Q4/14 Q1/15 Q2/15 Q3/15› Sales increased by €450 mn as a result of a recovery in tire volumes and good organic growth in
ContiTech
› Veyance Technologies contributed €296 mn to sales; operating profit margin down compared to Q2 2015 as mining and fluid business suffered from the difficult market environment during Q3 2015
› Tire volumes increased by 3% during the quarter; FX had a positive effect of 3% on tire sales in Q3 2015 while price mix stood at -3%
13
+450 +18
1 Before amortization of intangibles from PPA, consolidation and special effects
0%
5%
10%
15%
20%
0%
5%
10%
15%
20%
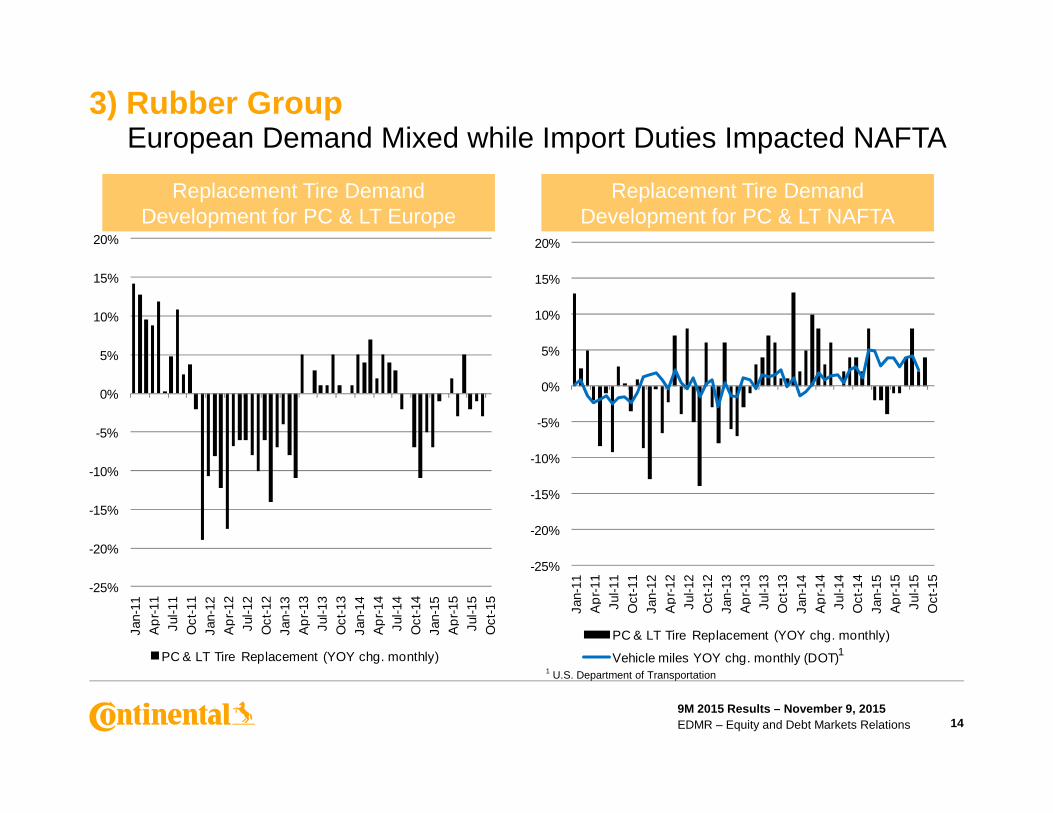
3) Rubber GroupEuropean Demand Mixed while Import Duties Impacted NAFTA
Replacement Tire Demand Development for PC & LT Europe
Replacement Tire Demand Development for PC & LT NAFTA
9M 2015 Results – November 9, 2015EDMR – Equity and Debt Markets Relations
-25%
-20%
-15%
-10%
-5%
Jan-
11A
pr-
11
Jul-1
1O
ct-1
1
Jan-
12A
pr-
12
Jul-1
2O
ct-1
2
Jan-
13A
pr-
13
Jul-1
3O
ct-1
3
Jan-
14A
pr-
14
Jul-1
4O
ct-1
4
Jan-
15A
pr-
15
Jul-1
5O
ct-1
5
PC & LT Tire Replacement (YOY chg. monthly)
Vehicle miles YOY chg. monthly (DOT)
-25%
-20%
-15%
-10%
-5%
Jan-
11A
pr-
11Ju
l-11
Oct
-11
Jan-
12A
pr-
12Ju
l-12
Oct
-12
Jan-
13A
pr-
13Ju
l-13
Oct
-13
Jan-
14A
pr-
14Ju
l-14
Oct
-14
Jan-
15A
pr-
15Ju
l-15
Oct
-15
PC & LT Tire Replacement (YOY chg. monthly)
14
1 U.S. Department of Transportation
1
300
400
500
600
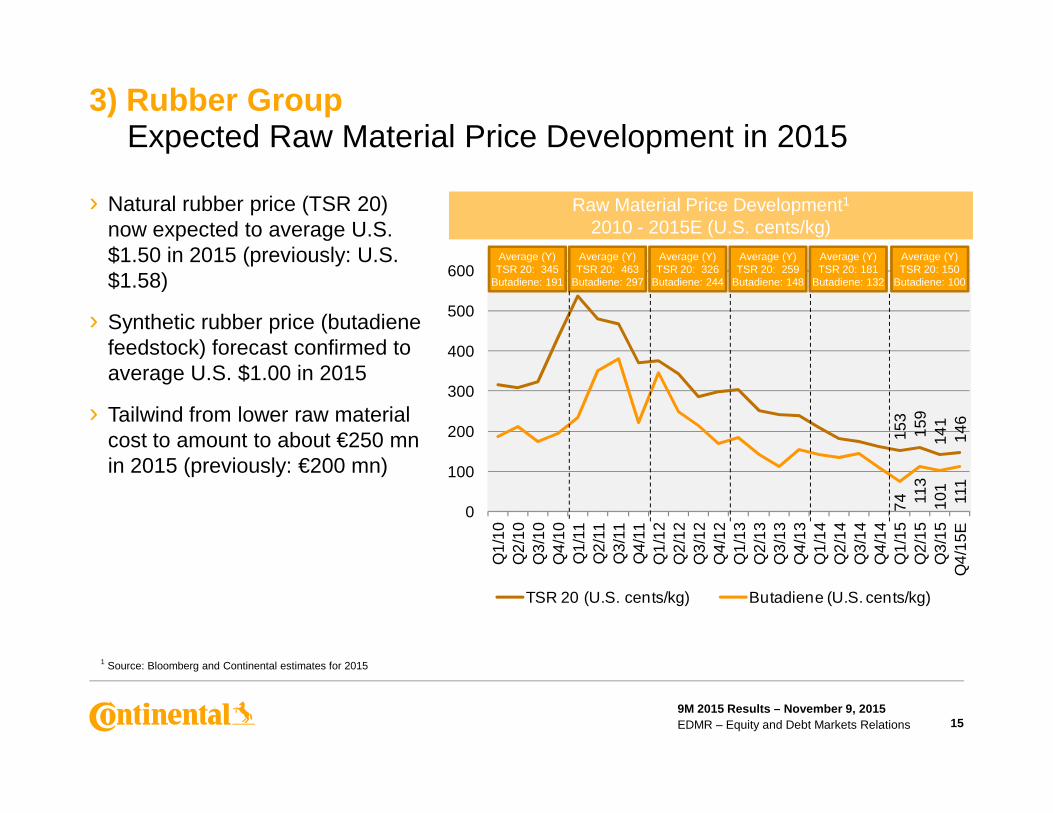
› Natural rubber price (TSR 20) now expected to average U.S. $1.50 in 2015 (previously: U.S. $1.58)
› Synthetic rubber price (butadiene feedstock) forecast confirmed to average U.S. $1.00 in 2015
› Tailwind from lower raw material
3) Rubber GroupExpected Raw Material Price Development in 2015
Raw Material Price Development1
2010 - 2015E (U.S. cents/kg)
1 1 1 1Average (Y)TSR 20: 345
Butadiene: 191
Average (Y)TSR 20: 463
Butadiene: 297
Average (Y)TSR 20: 326
Butadiene: 244
Average (Y)TSR 20: 259
Butadiene: 148
Average (Y)TSR 20: 181
Butadiene: 132
Average (Y)TSR 20: 150
Butadiene: 100
9M 2015 Results – November 9, 2015EDMR – Equity and Debt Markets Relations
153
159
141
146
74 113
101
111
0
100
200
Q1/
10Q
2/10
Q3/
10Q
4/10
Q1/
11Q
2/11
Q3/
11Q
4/11
Q1/
12Q
2/12
Q3/
12Q
4/12
Q1/
13Q
2/13
Q3/
13Q
4/13
Q1/
14Q
2/14
Q3/
14Q
4/14
Q1/
15Q
2/15
Q3/
15Q
4/15
E
TSR 20 (U.S. cents/kg) Butadiene (U.S. cents/kg)
› Tailwind from lower raw material cost to amount to about €250 mn in 2015 (previously: €200 mn)
15
1 Source: Bloomberg and Continental estimates for 2015
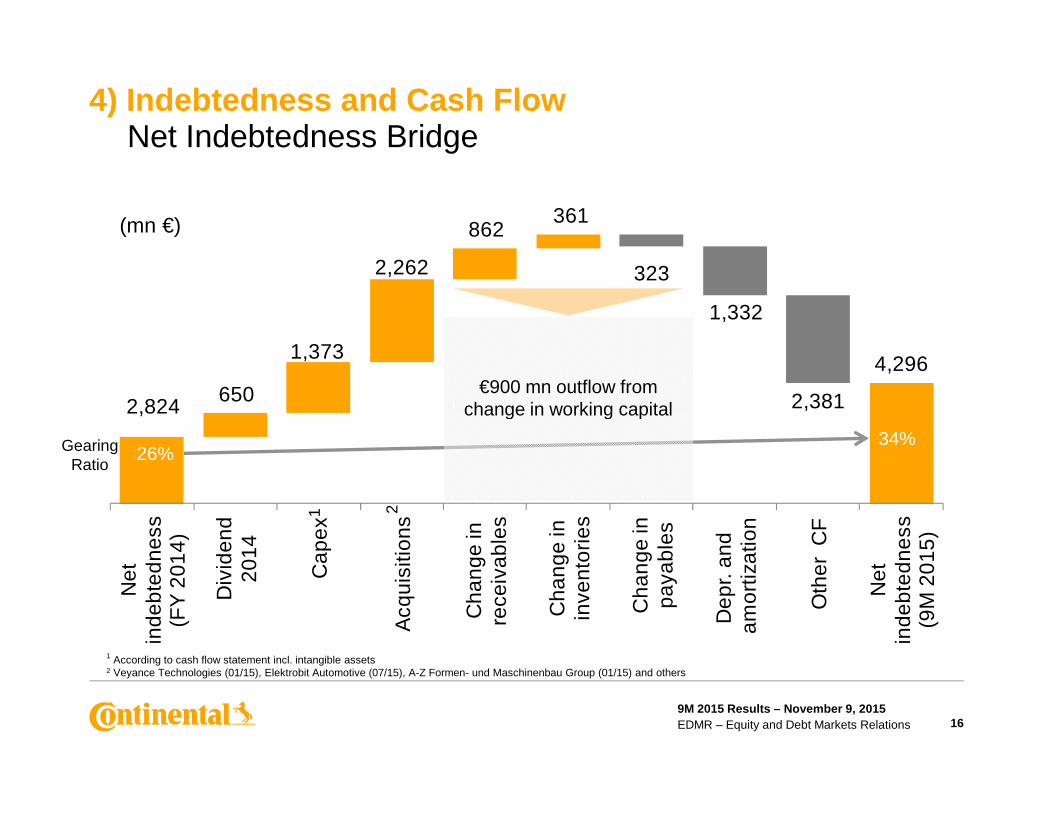
2,824650
1,373
2,262
862361
323
1,332
2,381
4,296
4) Indebtedness and Cash Flow Net Indebtedness Bridge
€900 mn outflow from change in working capital
(mn €)
9M 2015 Results – November 9, 2015EDMR – Equity and Debt Markets Relations
2,824 2,381
Net
in
debt
edne
ss(F
Y 2
014)
Div
iden
d20
14
Cap
ex
Acq
uisi
tions
Cha
nge
in
rece
ivab
les
Cha
nge
inin
vent
orie
s
Cha
nge
inpa
yabl
es
Dep
r. an
dam
ortiz
atio
n
Oth
er C
F
Net
in
debt
edne
ss(9
M 2
015)
16
1 According to cash flow statement incl. intangible assets2 Veyance Technologies (01/15), Elektrobit Automotive (07/15), A-Z Formen- und Maschinenbau Group (01/15) and others
change in working capital
26%34%
1
GearingRatio
2
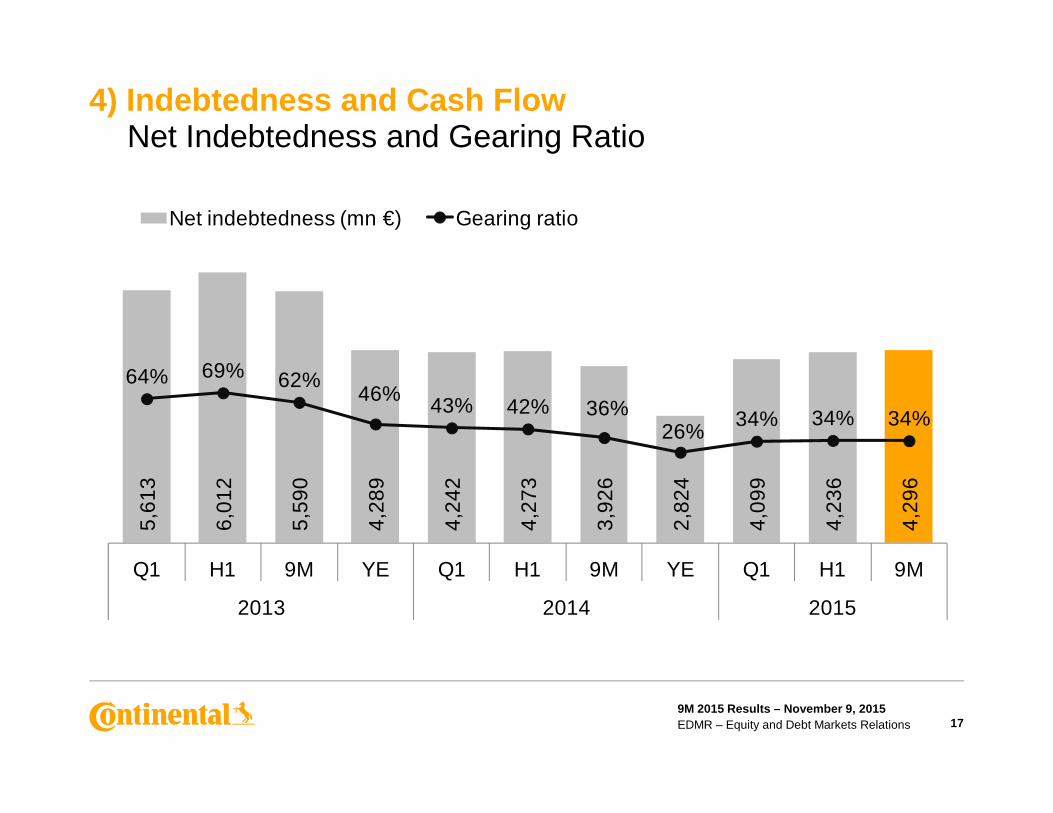
4) Indebtedness and Cash Flow Net Indebtedness and Gearing Ratio
64% 69% 62%46% 43% 42% 36% 34% 34%
Net indebtedness (mn €) Gearing ratio
9M 2015 Results – November 9, 2015EDMR – Equity and Debt Markets Relations 17
5,61
3
6,01
2
5,59
0
4,28
9
4,24
2
4,27
3
3,92
6
2,82
4
4,09
9
4,23
6
4,29
6
43% 42% 36%26%
34% 34% 34%
Q1 H1 9M YE Q1 H1 9M YE Q1 H1 9M
2013 2014 2015
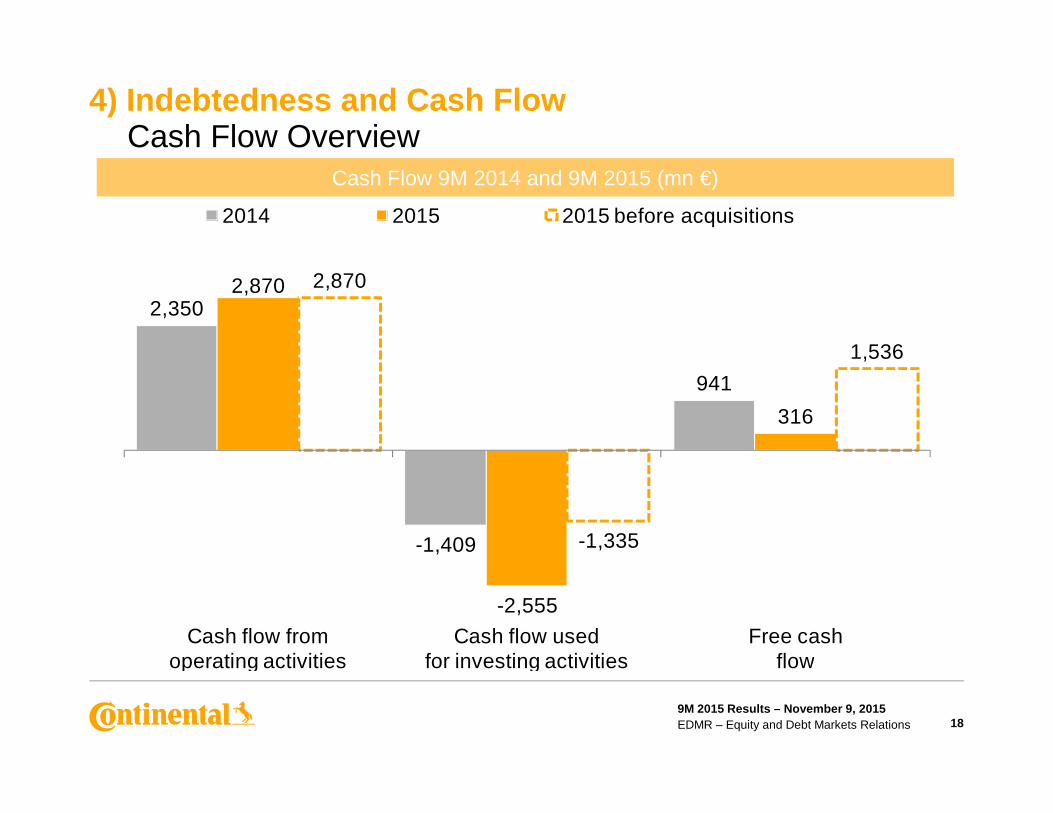
2,350
941
2,870
316
2,870
1,536
2014 2015 2015 before acquisitions
4) Indebtedness and Cash Flow Cash Flow Overview
Cash Flow 9M 2014 and 9M 2015 (mn €)
9M 2015 Results – November 9, 2015EDMR – Equity and Debt Markets Relations
-1,409
-2,555
316
-1,335
Cash flow fromoperating activities
Cash flow used for investing activities
Free cashflow
18
3.9
64
3.9
86
3.6
673
.81
74.
015
4.2
58
3.8
83
4.0
21
4.2
044
.412
4.1
77
4.23
74.
267
4.5
21
4.3
50
4.3
63
17%
28%
15%
5.2
12
4.9
43
4.2
80
4.6
07
4.7
67 5.0
71
4.4
84 4.8
96
5.1
73
5.2
694.
492
4.9
31
5.3
81
5.40
64
.69
05
.02
0
5%6%
9%
4% 4% 4%
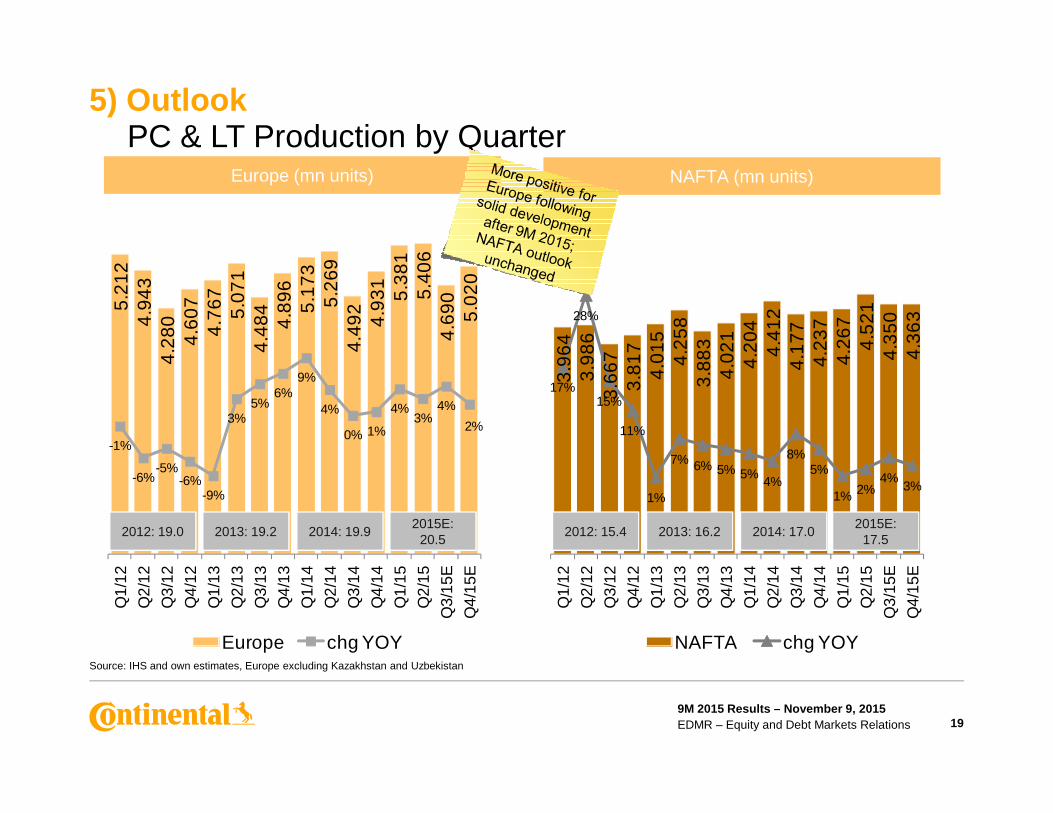
NAFTA (mn units)
5) OutlookPC & LT Production by Quarter
Europe (mn units)
9M 2015 Results – November 9, 2015EDMR – Equity and Debt Markets Relations
15%
11%
1%
7% 6% 5% 5%4%
8%5%
1% 2%4%
3%
Q1/
12
Q2/
12
Q3/
12
Q4/
12
Q1/
13
Q2/
13
Q3/
13
Q4/
13
Q1/
14
Q2/
14
Q3/
14
Q4/
14
Q1/
15
Q2/
15
Q3/
15E
Q4/
15E
NAFTA chg YOY
-1%
-6%-5%
-6%-9%
3%5% 4%
0% 1%
4%3%
4%
2%
Q1/
12
Q2/
12
Q3/
12
Q4/
12
Q1/
13
Q2/
13
Q3/
13
Q4/
13
Q1/
14
Q2/
14
Q3/
14
Q4/
14
Q1/
15
Q2/
15
Q3/
15E
Q4/
15E
Europe chg YOY
19
Source: IHS and own estimates, Europe excluding Kazakhstan and Uzbekistan
2012: 19.0 2013: 19.2 2014: 19.92015E:
20.52012: 15.4 2013: 16.2 2014: 17.0
2015E: 17.5
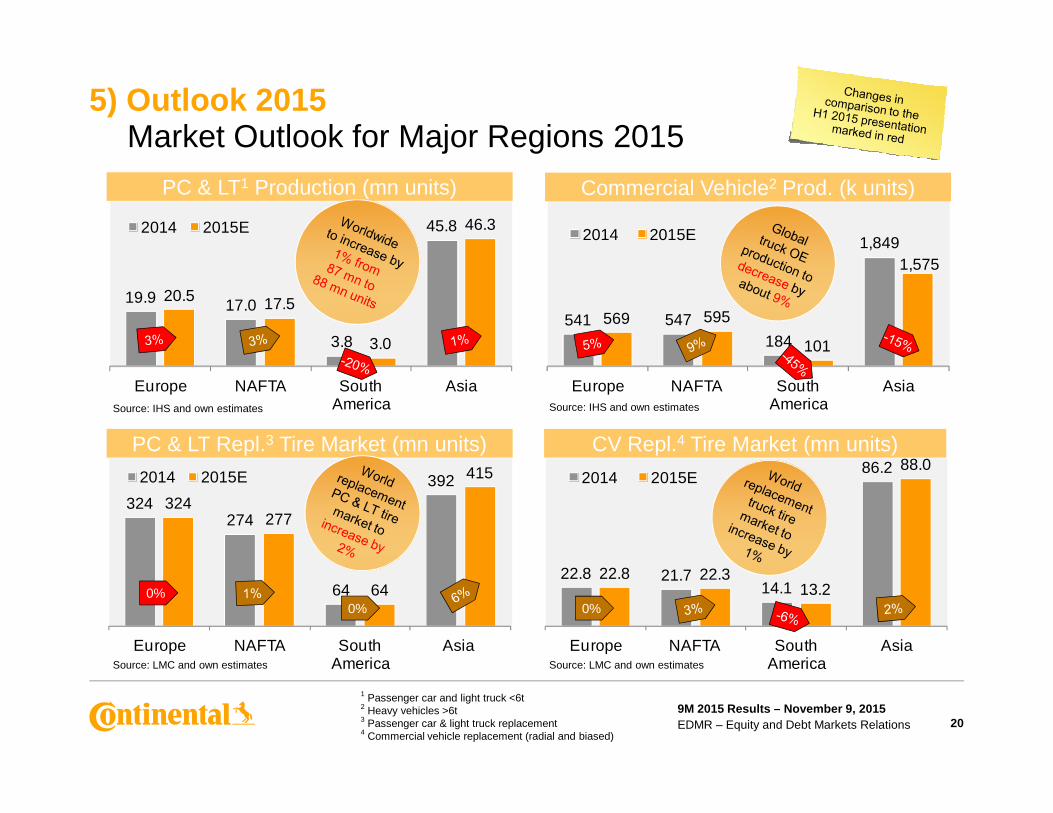
541 547184
1,849
569 595
101
1,575
Europe NAFTA South America
Asia
2014 2015E
19.9 17.0
3.8
45.8
20.5 17.5
3.0
46.3
Europe NAFTA South America
Asia
2014 2015E
5) Outlook 2015Market Outlook for Major Regions 2015
Commercial Vehicle2 Prod. (k units)
Source: IHS and own estimatesSource: IHS and own estimates
PC & LT1 Production (mn units)
9M 2015 Results – November 9, 2015EDMR – Equity and Debt Markets Relations
22.8 21.714.1
86.2
22.8 22.313.2
88.0
Europe NAFTA South America
Asia
2014 2015E
324274
64
392324
277
64
415
Europe NAFTA South America
Asia
2014 2015E
AmericaAmerica
20
CV Repl.4 Tire Market (mn units)
Source: IHS and own estimates
Source: LMC and own estimates
Source: IHS and own estimates
Source: LMC and own estimates
PC & LT Repl.3 Tire Market (mn units)
0% 0%0%
1 Passenger car and light truck <6t2 Heavy vehicles >6t3 Passenger car & light truck replacement 4 Commercial vehicle replacement (radial and biased)
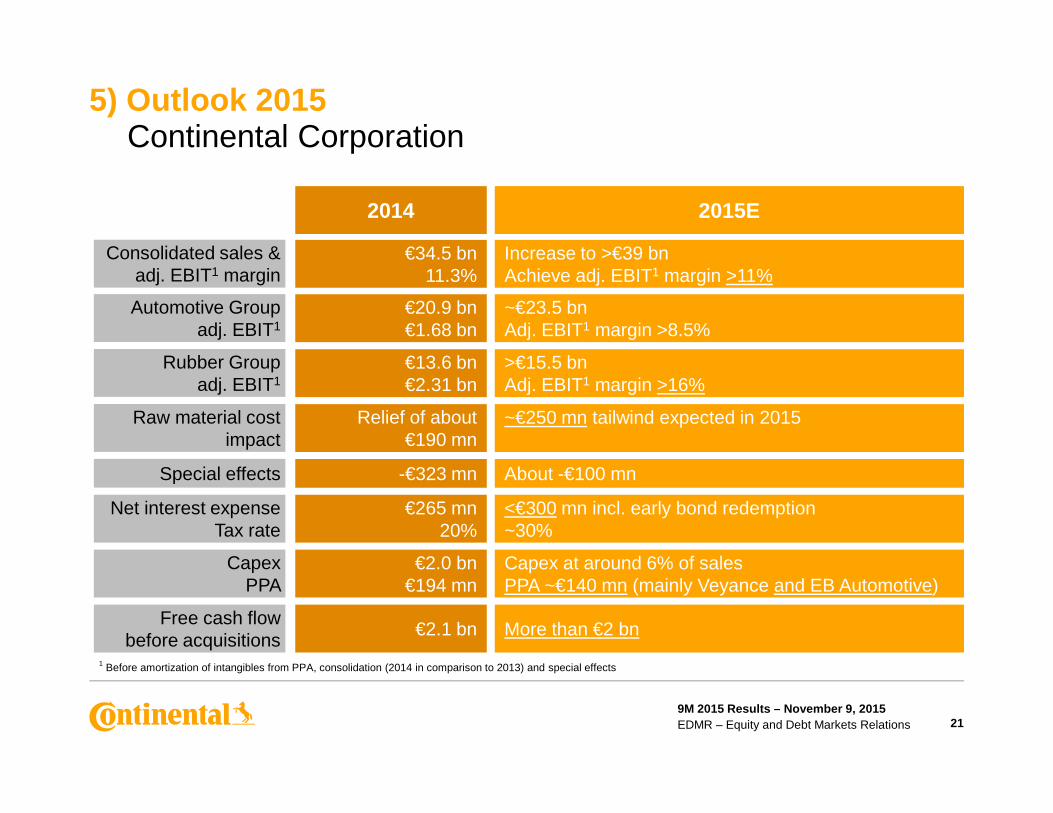
5) Outlook 2015Continental Corporation
Consolidated sales & adj. EBIT1 margin
€34.5 bn11.3%
Automotive Groupadj. EBIT1
€20.9 bn€1.68 bn
Rubber Groupadj. EBIT1
€13.6 bn€2.31 bn
Raw material cost Relief of about
2014
Increase to >€39 bnAchieve adj. EBIT1 margin >11%
~€23.5 bnAdj. EBIT1 margin >8.5%
>€15.5 bnAdj. EBIT1 margin >16%
2015E
9M 2015 Results – November 9, 2015EDMR – Equity and Debt Markets Relations 21
1 Before amortization of intangibles from PPA, consolidation (2014 in comparison to 2013) and special effects
Raw material cost impact
Relief of about €190 mn
Special effects -€323 mn
Net interest expenseTax rate
€265 mn20%
CapexPPA
€2.0 bn€194 mn
Free cash flow before acquisitions
€2.1 bn
~€250 mn tailwind expected in 2015
About -€100 mn
<€300 mn incl. early bond redemption~30%
Capex at around 6% of sales PPA ~€140 mn (mainly Veyance and EB Automotive)
More than €2 bn
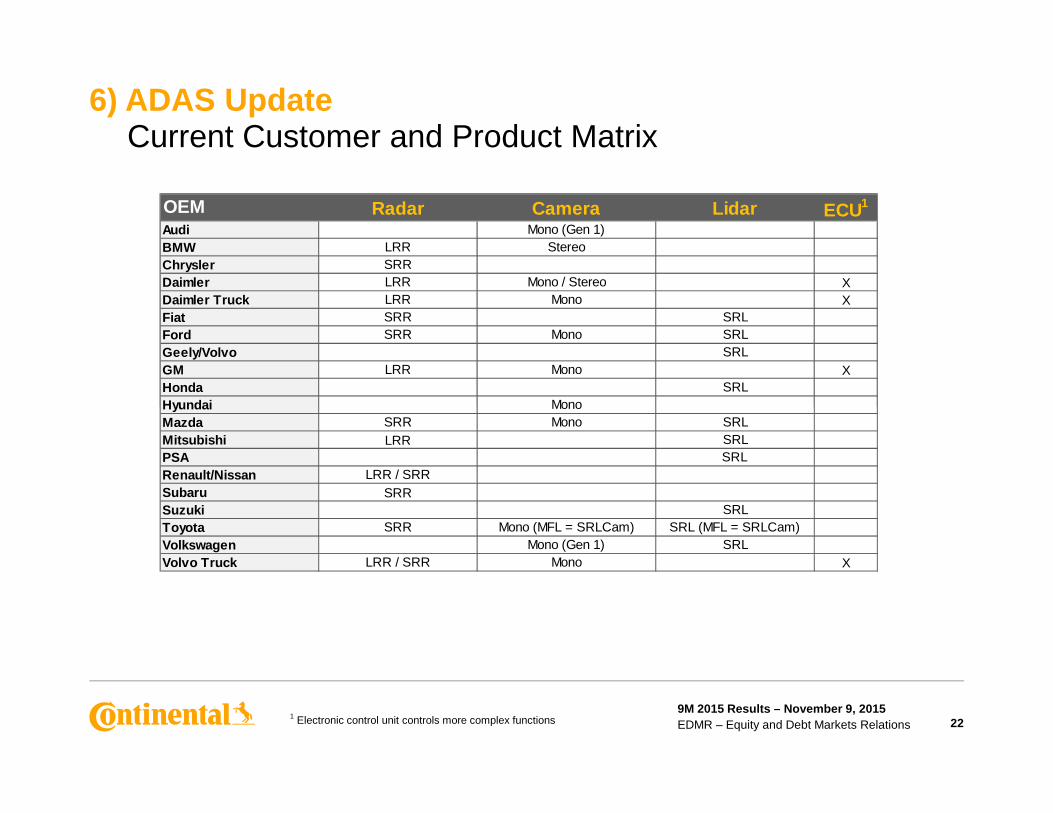
6) ADAS UpdateCurrent Customer and Product Matrix
OEM Radar Camera Lidar ECU1
Audi Mono (Gen 1)BMW LRR StereoChrysler SRRDaimler LRR Mono / Stereo XDaimler Truck LRR Mono XFiat SRR SRLFord SRR Mono SRLGeely/Volvo SRLGM LRR Mono XHonda SRLHyundai Mono
9M 2015 Results – November 9, 2015EDMR – Equity and Debt Markets Relations 22
1 Electronic control unit controls more complex functions
Hyundai MonoMazda SRR Mono SRLMitsubishi LRR SRLPSA SRLRenault/Nissan LRR / SRRSubaru SRRSuzuki SRLToyota SRR Mono (MFL = SRLCam) SRL (MFL = SRLCam) Volkswagen Mono (Gen 1) SRLVolvo Truck LRR / SRR Mono X
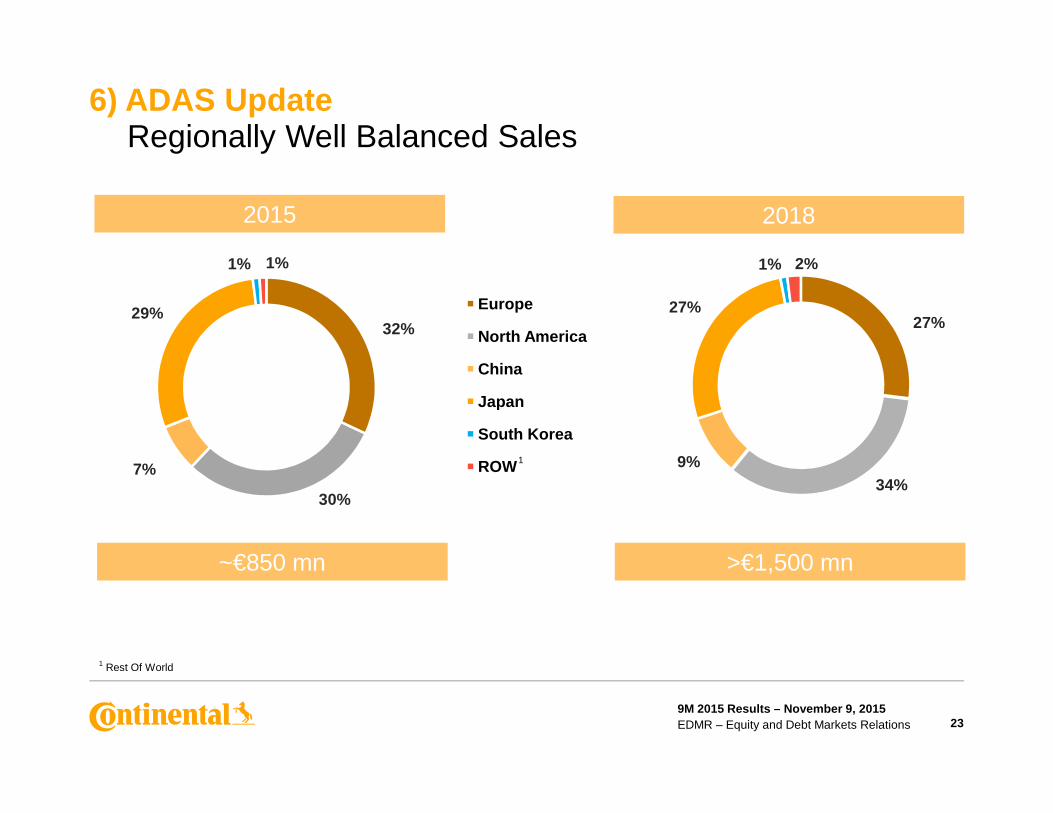
6) ADAS UpdateRegionally Well Balanced Sales
32%29%
1%1%
27%27%
1% 2%
Europe
North America
China
Japan
20182015
9M 2015 Results – November 9, 2015EDMR – Equity and Debt Markets Relations 23
30%
7%34%
9%
Japan
South Korea
ROW
~€850 mn >€1,500 mn
1
1 Rest Of World
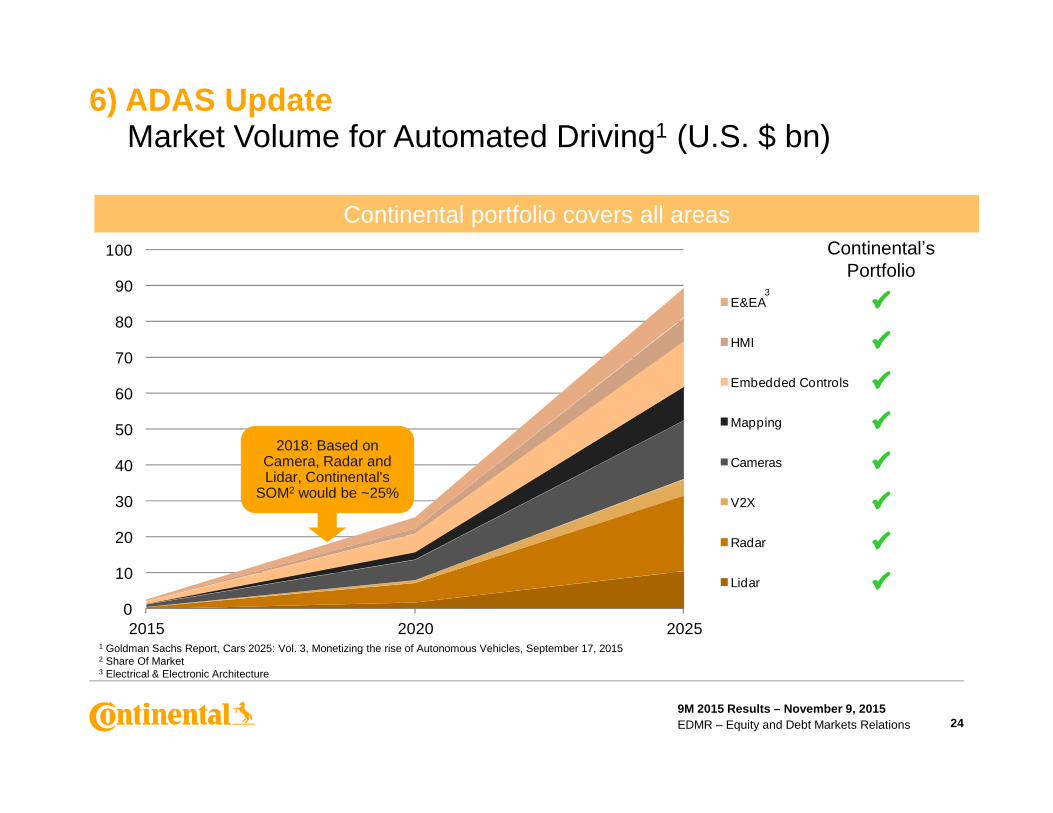
60
70
80
90
100
E&EA
HMI
Embedded Controls
6) ADAS UpdateMarket Volume for Automated Driving1 (U.S. $ bn)
Continental portfolio covers all areasContinentalʼs
Portfolio3
9M 2015 Results – November 9, 2015EDMR – Equity and Debt Markets Relations
0
10
20
30
40
50
2015 2020 2025
Mapping
Cameras
V2X
Radar
Lidar
24
1 Goldman Sachs Report, Cars 2025: Vol. 3, Monetizing the rise of Autonomous Vehicles, September 17, 2015 2 Share Of Market3 Electrical & Electronic Architecture
2018: Based on Camera, Radar and Lidar, Continental's
SOM2 would be ~25%
Thank you!
9M 2015 Results – November 9, 2015EDMR – Equity and Debt Markets Relations 25
Official Sponsor of the UEFA European Football Championship™
Disclaimer
› This presentation has been prepared by Continental Aktiengesellschaft solely in connection with the release of the9M 2015 results on November 9, 2015, in Frankfurt. It has not been independently verified. It does not constitute anoffer, invitation or recommendation to purchase or subscribe for any shares or other securities issued by ContinentalAG or any subsidiary and neither shall any part of it form the basis of, or be relied upon in connection with, anycontract or commitment concerning the purchase or sale of such shares or other securities whatsoever.
› Neither Continental Aktiengesellschaft nor any of its affiliates, advisors or representatives shall have any liabilitywhatsoever (in negligence or otherwise) for any loss that may arise from any use of this presentation or its contentsor otherwise arising in connection with this presentation.
› This presentation includes assumptions, estimates, forecasts and other forward-looking statements, includingstatements about our beliefs and expectations regarding future developments as well as their effect on the results ofContinental. These statements are based on plans, estimates and projections as they are currently available to themanagement of Continental. Therefore, these statements speak only as of the date they are made, and weundertake no obligation to update publicly any of them in light of new information or future events. Furthermore,although the management is of the opinion that these statements, and their underlying beliefs and expectations, are
9M 2015 Results – November 9, 2015EDMR – Equity and Debt Markets Relations 26
although the management is of the opinion that these statements, and their underlying beliefs and expectations, arerealistic or of the date they are made, no guarantee can be given that the expected developments and effects willactually occur. Many factors may cause the actual development to be materially different from the expectationsexpressed here. Such factors include, for example and without limitation, changes in general economic and businessconditions, fluctuations in currency exchange rates or interest rates, the introduction of competing products, the lackof acceptance for new products or services and changes in business strategy.
› All statements with regard to markets or market position(s) of Continental or any of its competitors are estimates ofContinental based on data available to Continental. Such data are neither comprehensive nor independently verified.Consequently, the data used are not adequate for and the statements based on such data are not meant to be, anaccurate or proper definition of regional and/or product markets or market shares of Continental and any of theparticipants in any market.
› Unless otherwise stated, all amounts are shown in millions of euro. Please note that differences may arise as a resultof the use of rounded amounts and percentages.
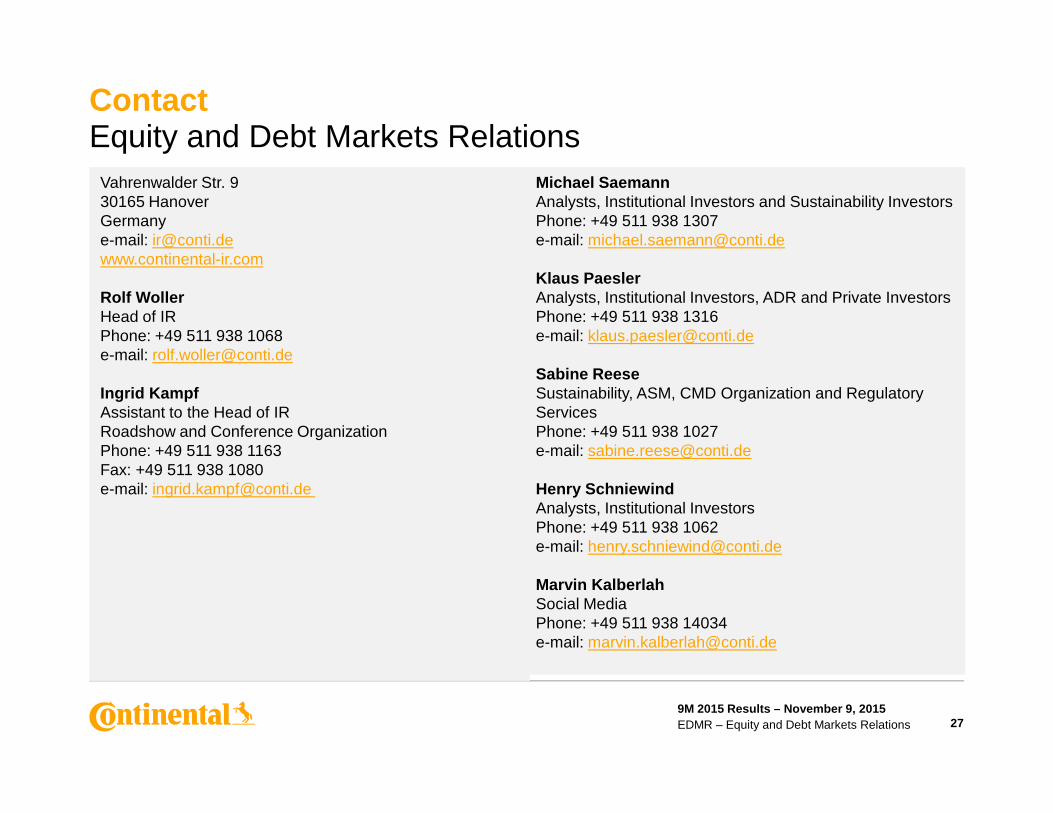
ContactEquity and Debt Markets Relations
Vahrenwalder Str. 930165 HanoverGermanye-mail: [email protected]
Rolf WollerHead of IRPhone: +49 511 938 1068e-mail: [email protected]
Ingrid KampfAssistant to the Head of IR
Michael SaemannAnalysts, Institutional Investors and Sustainability InvestorsPhone: +49 511 938 1307e-mail: [email protected]
Klaus PaeslerAnalysts, Institutional Investors, ADR and Private Investors Phone: +49 511 938 1316 e-mail: [email protected]
Sabine ReeseSustainability, ASM, CMD Organization and Regulatory Services
9M 2015 Results – November 9, 2015EDMR – Equity and Debt Markets Relations 27
Assistant to the Head of IRRoadshow and Conference OrganizationPhone: +49 511 938 1163Fax: +49 511 938 1080e-mail: [email protected]
ServicesPhone: +49 511 938 1027 e-mail: [email protected]
Henry SchniewindAnalysts, Institutional InvestorsPhone: +49 511 938 1062e-mail: [email protected]
Marvin KalberlahSocial MediaPhone: +49 511 938 14034e-mail: [email protected]
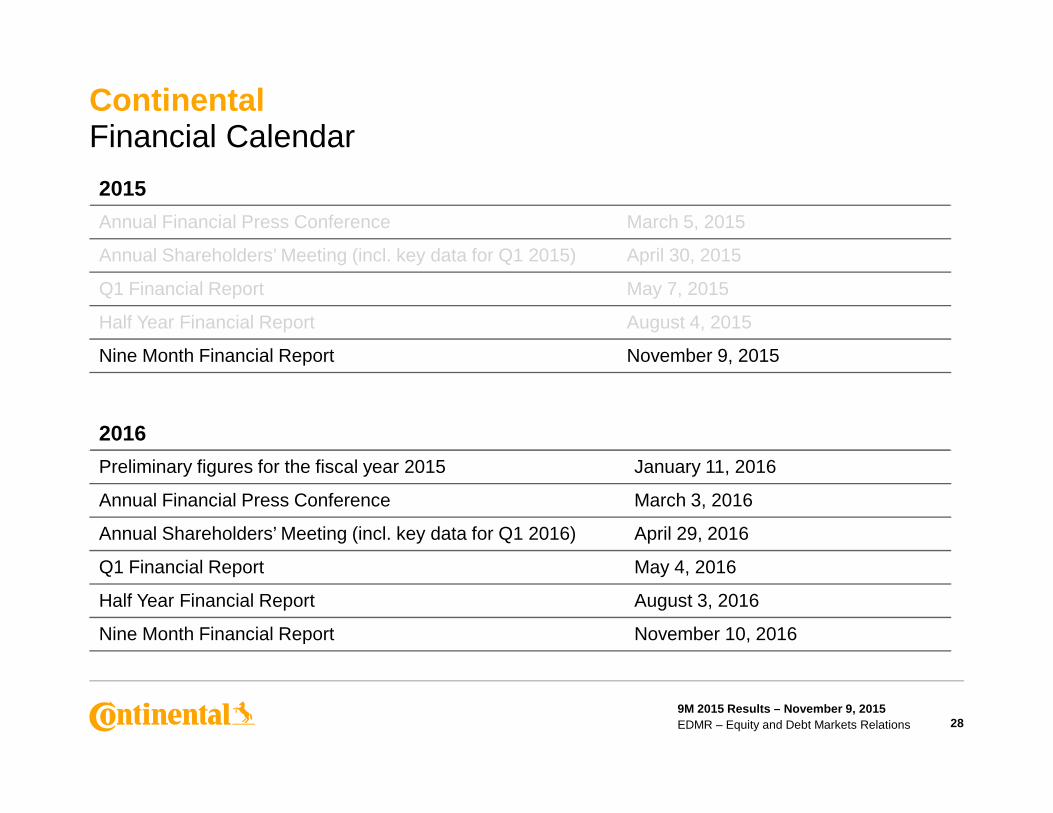
ContinentalFinancial Calendar
2015
Annual Financial Press Conference March 5, 2015
Annual Shareholders’ Meeting (incl. key data for Q1 2015) April 30, 2015
Q1 Financial Report May 7, 2015
Half Year Financial Report August 4, 2015
Nine Month Financial Report November 9, 2015
9M 2015 Results – November 9, 2015EDMR – Equity and Debt Markets Relations 28
2016
Preliminary figures for the fiscal year 2015 January 11, 2016
Annual Financial Press Conference March 3, 2016
Annual Shareholders’ Meeting (incl. key data for Q1 2016) April 29, 2016
Q1 Financial Report May 4, 2016
Half Year Financial Report August 3, 2016
Nine Month Financial Report November 10, 2016
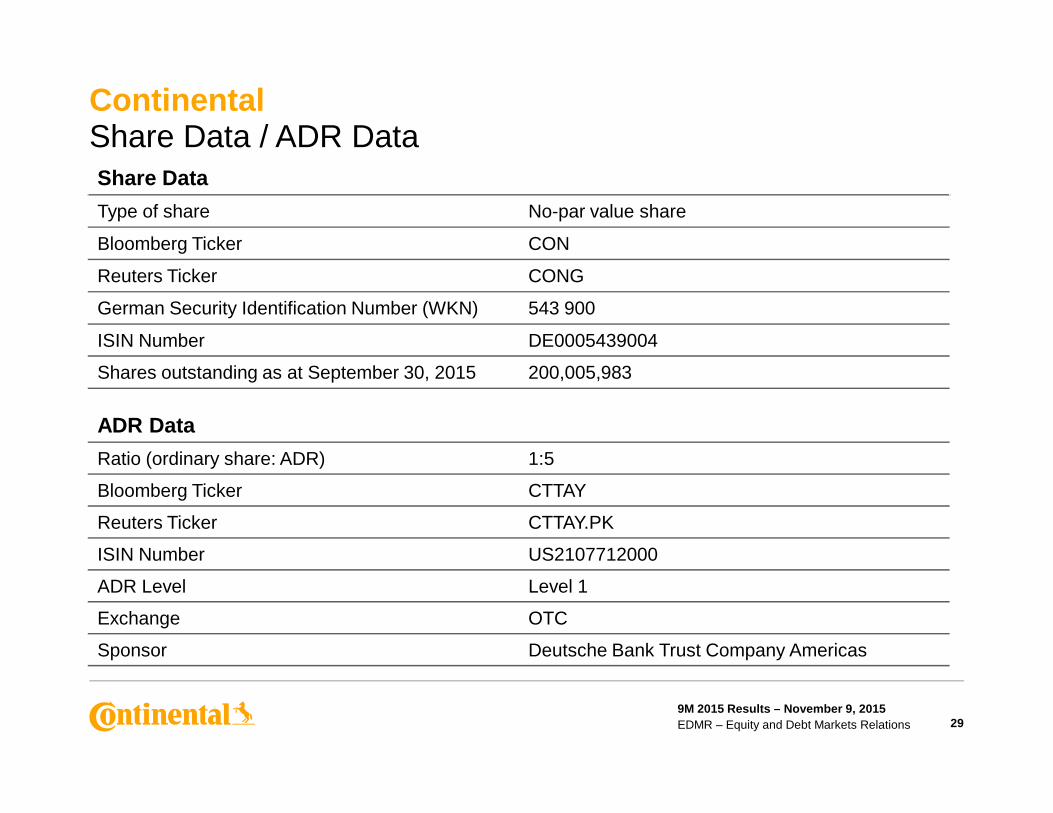
ContinentalShare Data / ADR DataShare Data
Type of share No-par value share
Bloomberg Ticker CON
Reuters Ticker CONG
German Security Identification Number (WKN) 543 900
ISIN Number DE0005439004
Shares outstanding as at September 30, 2015 200,005,983
9M 2015 Results – November 9, 2015EDMR – Equity and Debt Markets Relations 29
ADR Data
Ratio (ordinary share: ADR) 1:5
Bloomberg Ticker CTTAY
Reuters Ticker CTTAY.PK
ISIN Number US2107712000
ADR Level Level 1
Exchange OTC
Sponsor Deutsche Bank Trust Company Americas
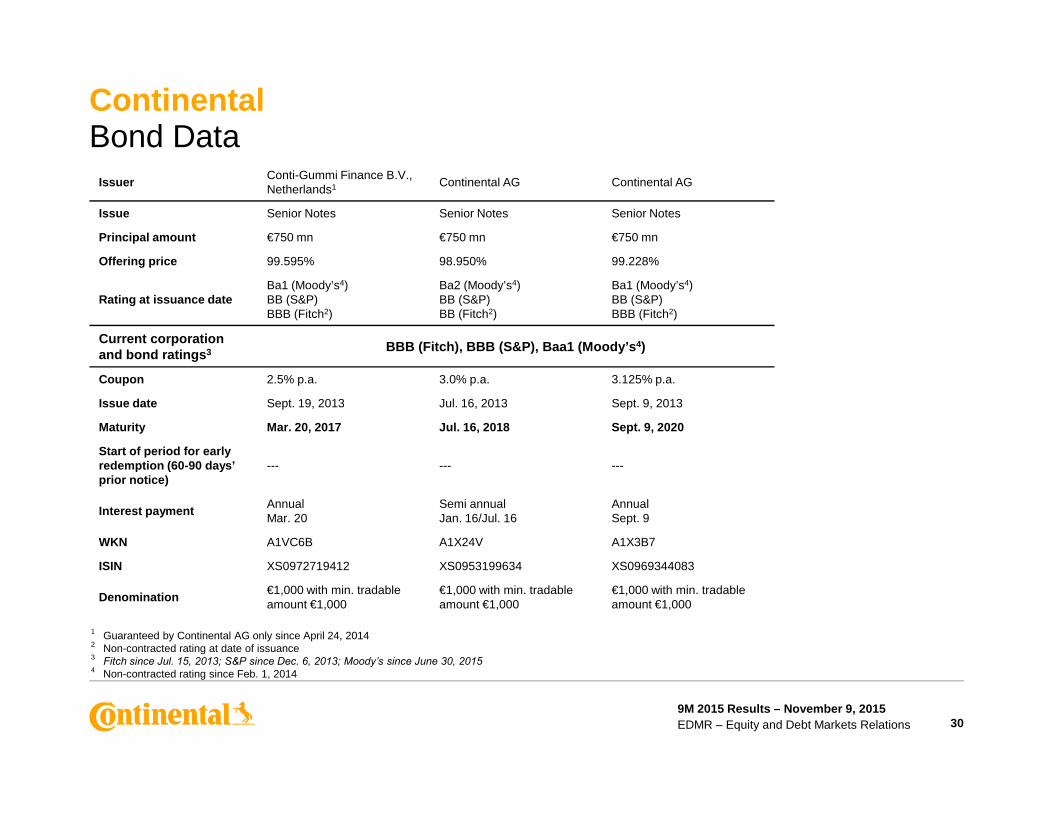
ContinentalBond Data
Issuer Conti-Gummi Finance B.V., Netherlands1 Continental AG Continental AG
Issue Senior Notes Senior Notes Senior Notes
Principal amount €750 mn €750 mn €750 mn
Offering price 99.595% 98.950% 99.228%
Rating at issuance dateBa1 (Moody’s4)BB (S&P)BBB (Fitch2)
Ba2 (Moody’s4)BB (S&P)BB (Fitch2)
Ba1 (Moody’s4)BB (S&P)BBB (Fitch2)
Current corporationand bond ratings 3 BBB (Fitch), BBB (S&P), Baa1 (Moody’s 4)
Coupon 2.5% p.a. 3.0% p.a. 3.125% p.a.
Issue date Sept. 19, 2013 Jul. 16, 2013 Sept. 9, 2013
9M 2015 Results – November 9, 2015EDMR – Equity and Debt Markets Relations 30
Issue date Sept. 19, 2013 Jul. 16, 2013 Sept. 9, 2013
Maturity Mar. 20, 2017 Jul. 16, 2018 Sept. 9, 2020
Start of period for early redemption (60-90 days’ prior notice)
--- --- ---
Interest paymentAnnual Mar. 20
Semi annualJan. 16/Jul. 16
AnnualSept. 9
WKN A1VC6B A1X24V A1X3B7
ISIN XS0972719412 XS0953199634 XS0969344083
Denomination€1,000 with min. tradable amount €1,000
€1,000 with min. tradable amount €1,000
€1,000 with min. tradable amount €1,000
1 Guaranteed by Continental AG only since April 24, 20142 Non-contracted rating at date of issuance3
Fitch since Jul. 15, 2013; S&P since Dec. 6, 2013; Moodyʼs since June 30, 20154 Non-contracted rating since Feb. 1, 2014
Back-up
9M 2015 Results – November 9, 2015EDMR – Equity and Debt Markets Relations
Back-up
31
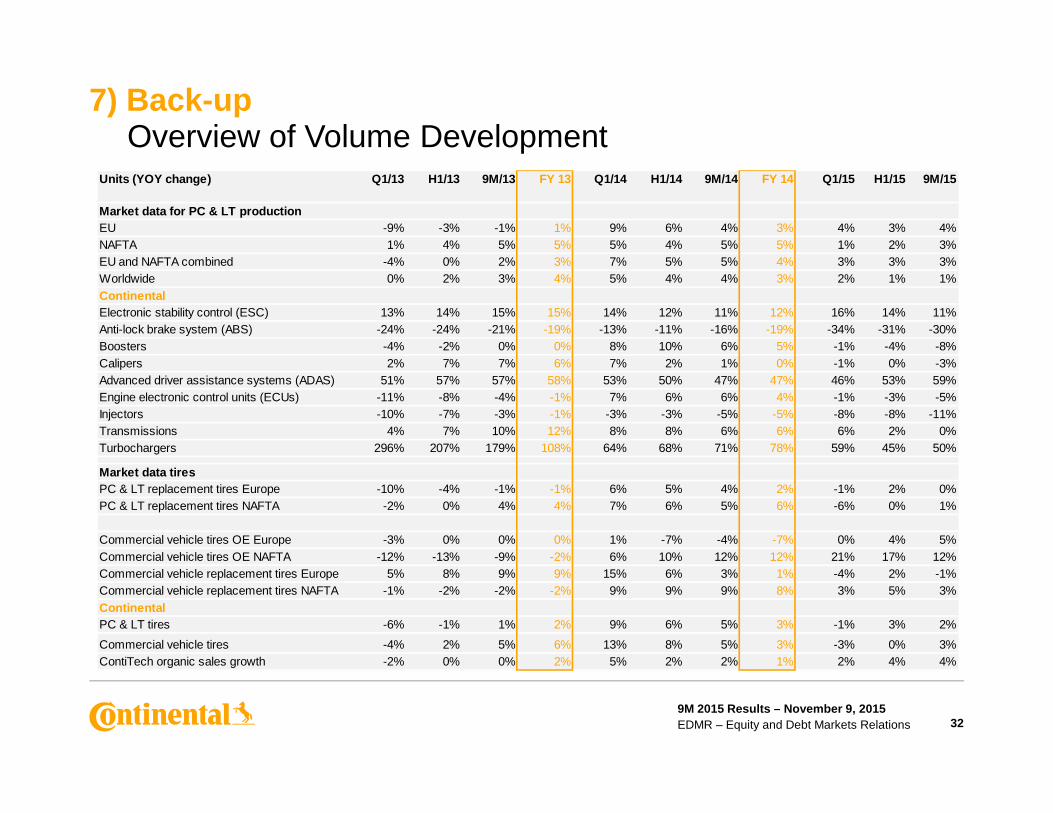
7) Back-upOverview of Volume Development
Units (YOY change) Q1/13 H1/13 9M/13 FY 13 Q1/14 H1/14 9M/14 FY 14 Q1/15 H1/15 9M/15
Market data for PC & LT productionEU -9% -3% -1% 1% 9% 6% 4% 3% 4% 3% 4%NAFTA 1% 4% 5% 5% 5% 4% 5% 5% 1% 2% 3%EU and NAFTA combined -4% 0% 2% 3% 7% 5% 5% 4% 3% 3% 3%Worldwide 0% 2% 3% 4% 5% 4% 4% 3% 2% 1% 1%Continental Electronic stability control (ESC) 13% 14% 15% 15% 14% 12% 11% 12% 16% 14% 11%Anti-lock brake system (ABS) -24% -24% -21% -19% -13% -11% -16% -19% -34% -31% -30%Boosters -4% -2% 0% 0% 8% 10% 6% 5% -1% -4% -8%Calipers 2% 7% 7% 6% 7% 2% 1% 0% -1% 0% -3%Advanced driver assistance systems (ADAS) 51% 57% 57% 58% 53% 50% 47% 47% 46% 53% 59%Engine electronic control units (ECUs) -11% -8% -4% -1% 7% 6% 6% 4% -1% -3% -5%
9M 2015 Results – November 9, 2015EDMR – Equity and Debt Markets Relations 32
Injectors -10% -7% -3% -1% -3% -3% -5% -5% -8% -8% -11%Transmissions 4% 7% 10% 12% 8% 8% 6% 6% 6% 2% 0%Turbochargers 296% 207% 179% 108% 64% 68% 71% 78% 59% 45% 50%
Market data tiresPC & LT replacement tires Europe -10% -4% -1% -1% 6% 5% 4% 2% -1% 2% 0%PC & LT replacement tires NAFTA -2% 0% 4% 4% 7% 6% 5% 6% -6% 0% 1%
Commercial vehicle tires OE Europe -3% 0% 0% 0% 1% -7% -4% -7% 0% 4% 5%Commercial vehicle tires OE NAFTA -12% -13% -9% -2% 6% 10% 12% 12% 21% 17% 12%Commercial vehicle replacement tires Europe 5% 8% 9% 9% 15% 6% 3% 1% -4% 2% -1%Commercial vehicle replacement tires NAFTA -1% -2% -2% -2% 9% 9% 9% 8% 3% 5% 3%ContinentalPC & LT tires -6% -1% 1% 2% 9% 6% 5% 3% -1% 3% 2%
Commercial vehicle tires -4% 2% 5% 6% 13% 8% 5% 3% -3% 0% 3%ContiTech organic sales growth -2% 0% 0% 2% 5% 2% 2% 1% 2% 4% 4%
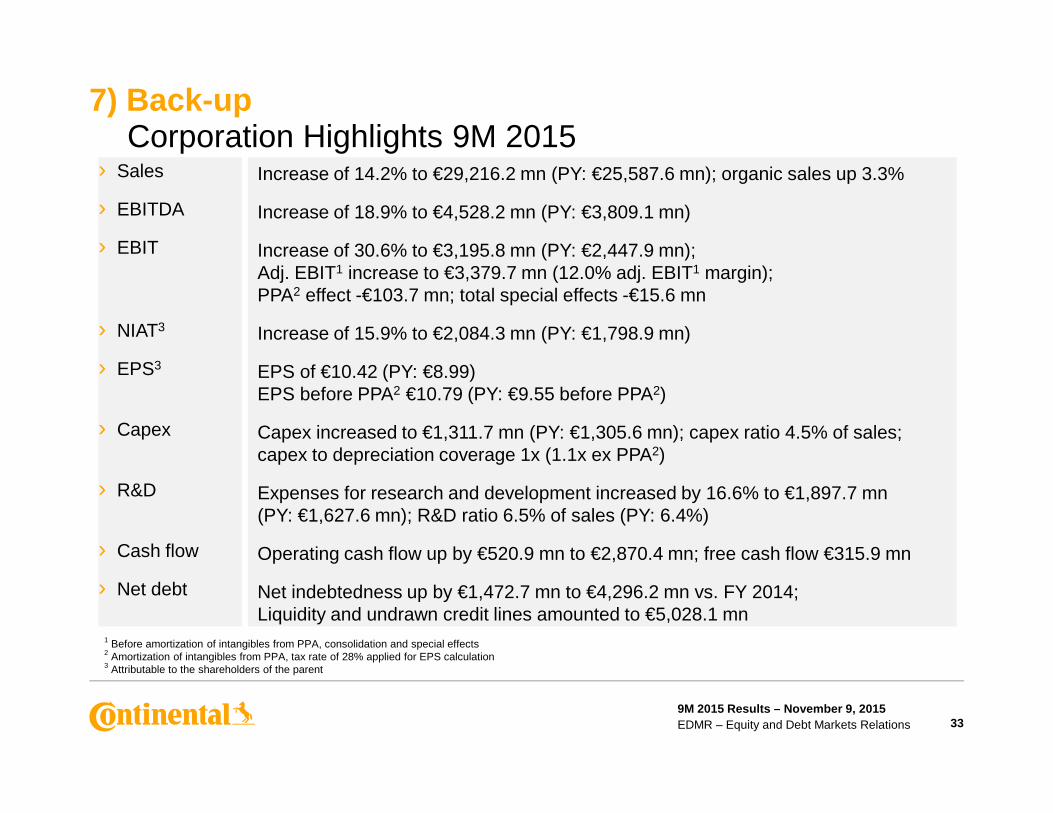
7) Back-upCorporation Highlights 9M 2015
› Sales
› EBITDA
› EBIT
› NIAT3
› EPS3
Increase of 14.2% to €29,216.2 mn (PY: €25,587.6 mn); organic sales up 3.3%
Increase of 18.9% to €4,528.2 mn (PY: €3,809.1 mn)
Increase of 30.6% to €3,195.8 mn (PY: €2,447.9 mn);Adj. EBIT1 increase to €3,379.7 mn (12.0% adj. EBIT1 margin);PPA2 effect -€103.7 mn; total special effects -€15.6 mn
Increase of 15.9% to €2,084.3 mn (PY: €1,798.9 mn)
EPS of €10.42 (PY: €8.99)EPS before PPA2 €10.79 (PY: €9.55 before PPA2)
9M 2015 Results – November 9, 2015EDMR – Equity and Debt Markets Relations 33
› Capex
› R&D
› Cash flow
› Net debt
Capex increased to €1,311.7 mn (PY: €1,305.6 mn); capex ratio 4.5% of sales; capex to depreciation coverage 1x (1.1x ex PPA2)
Expenses for research and development increased by 16.6% to €1,897.7 mn (PY: €1,627.6 mn); R&D ratio 6.5% of sales (PY: 6.4%)
Operating cash flow up by €520.9 mn to €2,870.4 mn; free cash flow €315.9 mn
Net indebtedness up by €1,472.7 mn to €4,296.2 mn vs. FY 2014;Liquidity and undrawn credit lines amounted to €5,028.1 mn
1 Before amortization of intangibles from PPA, consolidation and special effects2 Amortization of intangibles from PPA, tax rate of 28% applied for EPS calculation3 Attributable to the shareholders of the parent
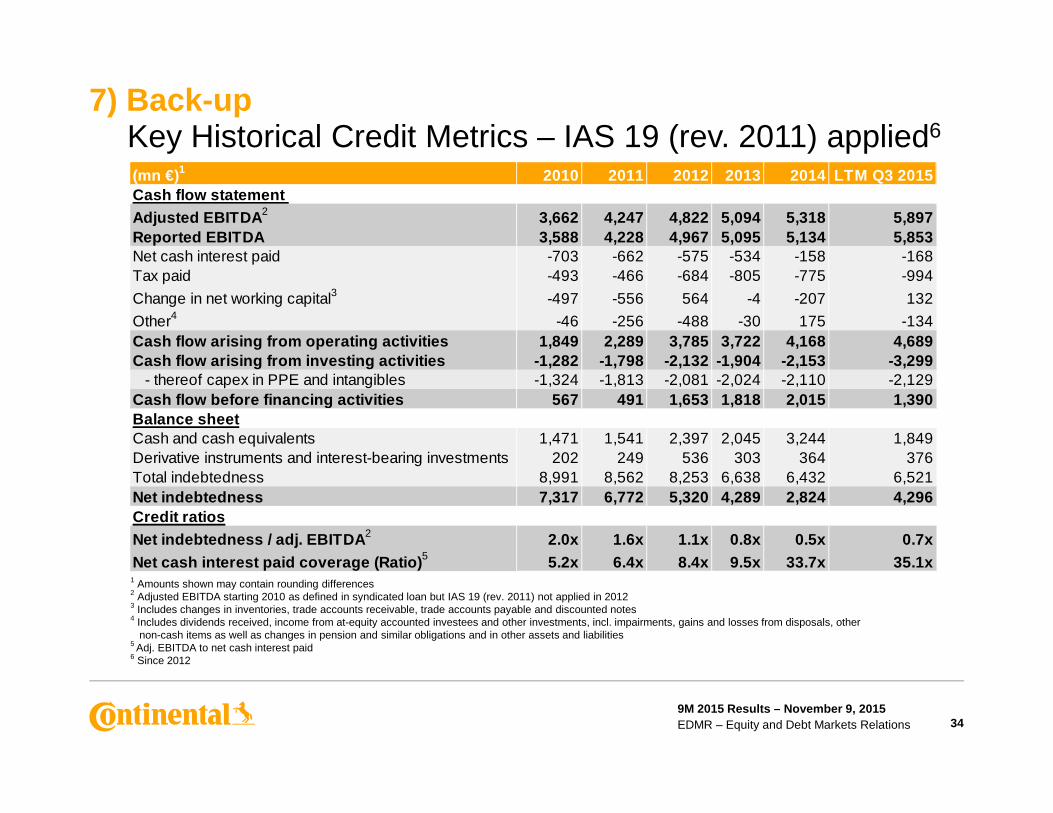
(mn €)1 2010 2011 2012 2013 2014 LTM Q3 2015Cash flow statement Adjusted EBITDA 2 3,662 4,247 4,822 5,094 5,318 5,897Reported EBITDA 3,588 4,228 4,967 5,095 5,134 5,853Net cash interest paid -703 -662 -575 -534 -158 -168Tax paid -493 -466 -684 -805 -775 -994
Change in net working capital3 -497 -556 564 -4 -207 132
Other4 -46 -256 -488 -30 175 -134Cash flow arising from operating activities 1,849 2,2 89 3,785 3,722 4,168 4,689Cash flow arising from investing activities -1,282 -1 ,798 -2,132 -1,904 -2,153 -3,299 - thereof capex in PPE and intangibles -1,324 -1,813 -2,081 -2,024 -2,110 -2,129Cash flow before financing activities 567 491 1,653 1,818 2,015 1,390
7) Back-upKey Historical Credit Metrics – IAS 19 (rev. 2011) applied6
9M 2015 Results – November 9, 2015EDMR – Equity and Debt Markets Relations
Cash flow before financing activities 567 491 1,653 1,818 2,015 1,390Balance sheetCash and cash equivalents 1,471 1,541 2,397 2,045 3,244 1,849Derivative instruments and interest-bearing investments 202 249 536 303 364 376Total indebtedness 8,991 8,562 8,253 6,638 6,432 6,521Net indebtedness 7,317 6,772 5,320 4,289 2,824 4,296Credit ratiosNet indebtedness / adj. EBITDA 2 2.0x 1.6x 1.1x 0.8x 0.5x 0.7xNet cash interest paid coverage (Ratio) 5 5.2x 6.4x 8.4x 9.5x 33.7x 35.1x
34
1 Amounts shown may contain rounding differences2 Adjusted EBITDA starting 2010 as defined in syndicated loan but IAS 19 (rev. 2011) not applied in 20123 Includes changes in inventories, trade accounts receivable, trade accounts payable and discounted notes4 Includes dividends received, income from at-equity accounted investees and other investments, incl. impairments, gains and losses from disposals, other
non-cash items as well as changes in pension and similar obligations and in other assets and liabilities 5 Adj. EBITDA to net cash interest paid6 Since 2012
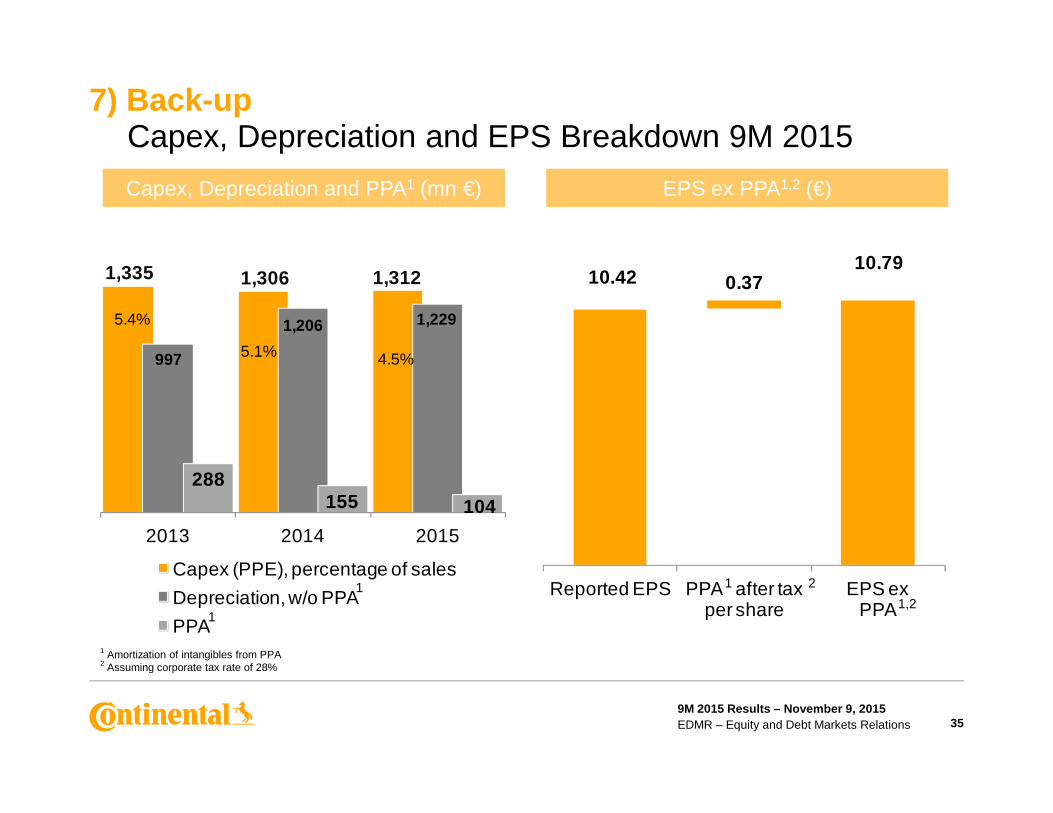
10.42 0.3710.791,335 1,306 1,312
997
1,206 1,2295.4%
5.1% 4.5%
7) Back-upCapex, Depreciation and EPS Breakdown 9M 2015
Capex, Depreciation and PPA1 (mn €) EPS ex PPA1,2 (€)
9M 2015 Results – November 9, 2015EDMR – Equity and Debt Markets Relations
Reported EPS PPA after tax per share
EPS ex PPA
288155 104
2013 2014 2015
Capex (PPE), percentage of sales
Depreciation, w/o PPA
PPA
35
1 Amortization of intangibles from PPA2 Assuming corporate tax rate of 28%
1
1 1
1,2
2
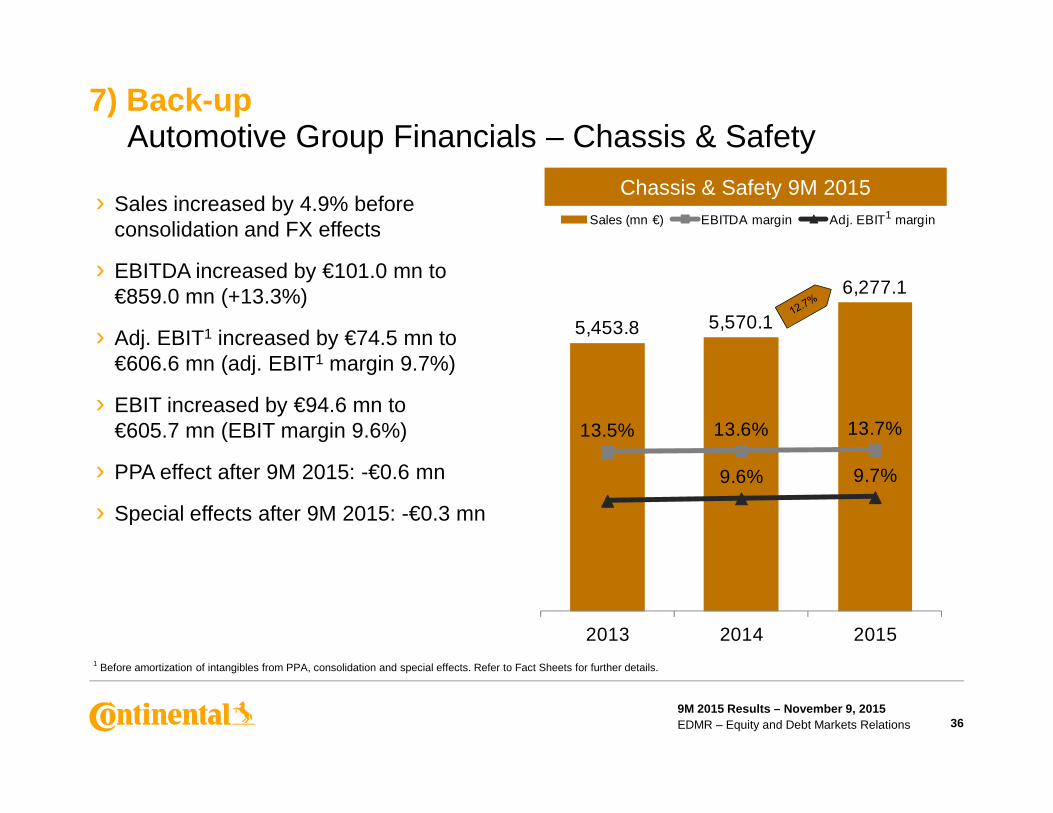
5,453.8 5,570.1
6,277.1
Sales (mn €) EBITDA margin Adj. EBIT margin› Sales increased by 4.9% before
consolidation and FX effects
› EBITDA increased by €101.0 mn to €859.0 mn (+13.3%)
› Adj. EBIT1 increased by €74.5 mn to €606.6 mn (adj. EBIT1 margin 9.7%)
› EBIT increased by €94.6 mn to
7) Back-upAutomotive Group Financials – Chassis & Safety
Chassis & Safety 9M 20151
9M 2015 Results – November 9, 2015EDMR – Equity and Debt Markets Relations
13.5% 13.6% 13.7%
9.6% 9.7%
2013 2014 2015
› EBIT increased by €94.6 mn to €605.7 mn (EBIT margin 9.6%)
› PPA effect after 9M 2015: -€0.6 mn
› Special effects after 9M 2015: -€0.3 mn
36
1 Before amortization of intangibles from PPA, consolidation and special effects. Refer to Fact Sheets for further details.
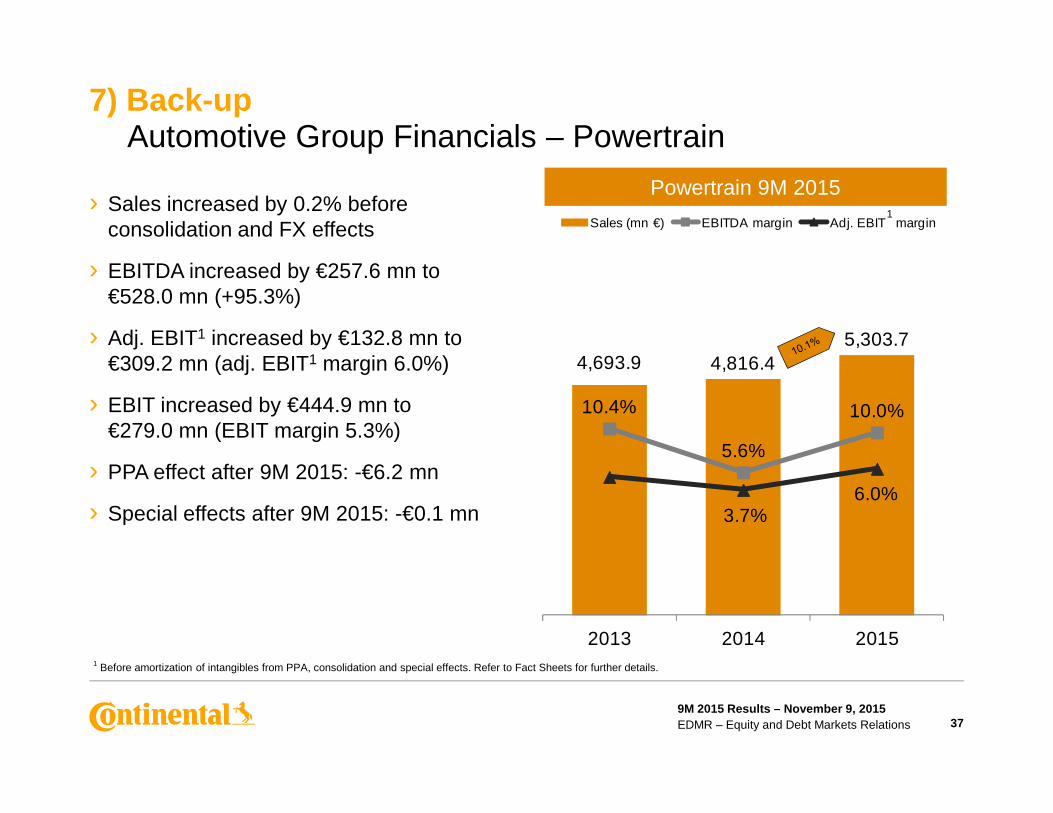
4,693.9 4,816.45,303.7
10.4% 10.0%
Sales (mn €) EBITDA margin Adj. EBIT margin
7) Back-upAutomotive Group Financials – Powertrain
Powertrain 9M 20151
› Sales increased by 0.2% before consolidation and FX effects
› EBITDA increased by €257.6 mn to €528.0 mn (+95.3%)
› Adj. EBIT1 increased by €132.8 mn to €309.2 mn (adj. EBIT1 margin 6.0%)
› EBIT increased by €444.9 mn to
9M 2015 Results – November 9, 2015EDMR – Equity and Debt Markets Relations
10.4%
5.6%
10.0%
3.7%6.0%
2013 2014 2015
37
1 Before amortization of intangibles from PPA, consolidation and special effects. Refer to Fact Sheets for further details.
› EBIT increased by €444.9 mn to €279.0 mn (EBIT margin 5.3%)
› PPA effect after 9M 2015: -€6.2 mn
› Special effects after 9M 2015: -€0.1 mn
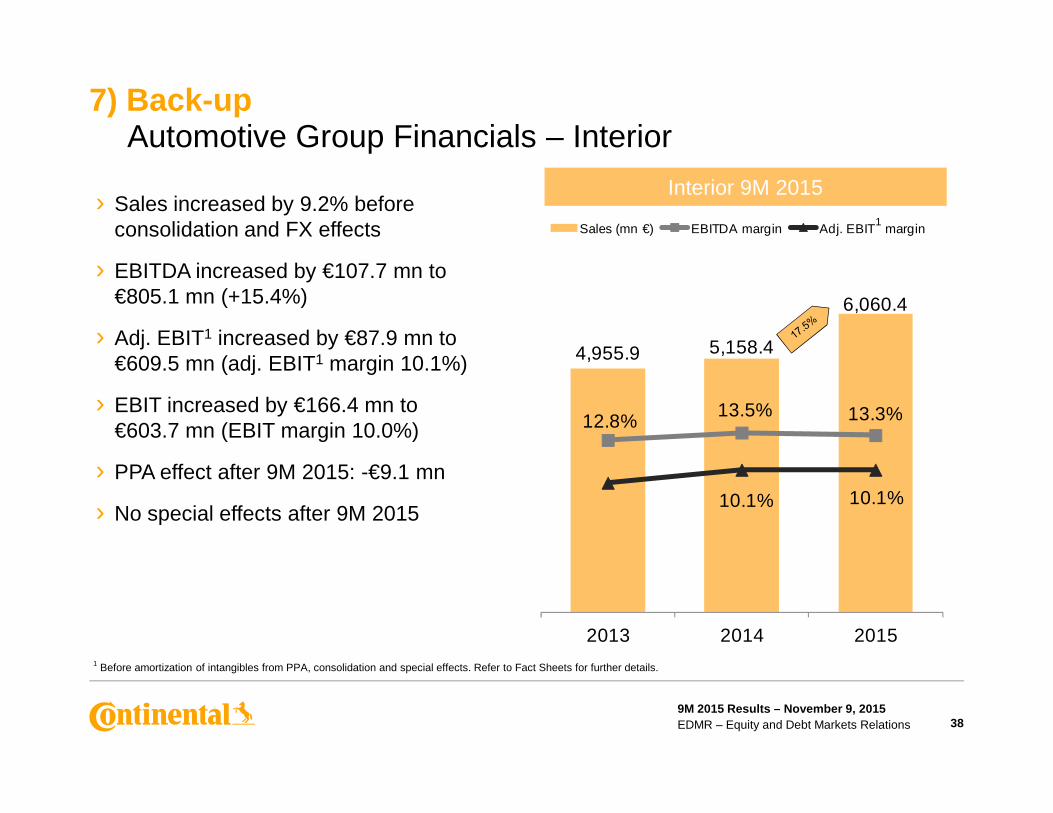
4,955.9 5,158.4
6,060.4
13.5% 13.3%
Sales (mn €) EBITDA margin Adj. EBIT margin
› Sales increased by 9.2% before consolidation and FX effects
› EBITDA increased by €107.7 mn to €805.1 mn (+15.4%)
› Adj. EBIT1 increased by €87.9 mn to €609.5 mn (adj. EBIT1 margin 10.1%)
› EBIT increased by €166.4 mn to
7) Back-upAutomotive Group Financials – Interior
Interior 9M 20151
9M 2015 Results – November 9, 2015EDMR – Equity and Debt Markets Relations
12.8%13.5% 13.3%
10.1% 10.1%
2013 2014 2015
› EBIT increased by €166.4 mn to €603.7 mn (EBIT margin 10.0%)
› PPA effect after 9M 2015: -€9.1 mn
› No special effects after 9M 2015
38
1 Before amortization of intangibles from PPA, consolidation and special effects. Refer to Fact Sheets for further details.
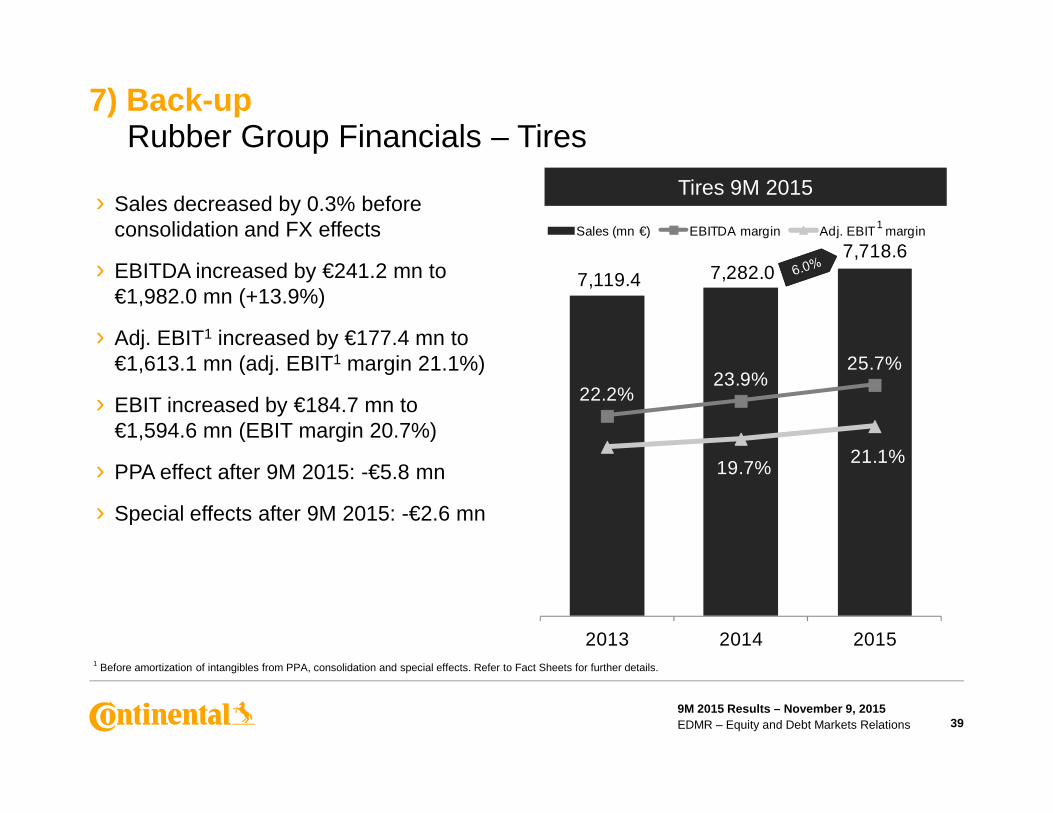
7,119.4 7,282.0 7,718.6
22.2%23.9%
25.7%
Sales (mn €) EBITDA margin Adj. EBIT margin
› Sales decreased by 0.3% before consolidation and FX effects
› EBITDA increased by €241.2 mn to €1,982.0 mn (+13.9%)
› Adj. EBIT1 increased by €177.4 mn to €1,613.1 mn (adj. EBIT1 margin 21.1%)
› EBIT increased by €184.7 mn to
7) Back-upRubber Group Financials – Tires
Tires 9M 2015
1
9M 2015 Results – November 9, 2015EDMR – Equity and Debt Markets Relations
19.7%21.1%
2013 2014 2015
› EBIT increased by €184.7 mn to €1,594.6 mn (EBIT margin 20.7%)
› PPA effect after 9M 2015: -€5.8 mn
› Special effects after 9M 2015: -€2.6 mn
39
1 Before amortization of intangibles from PPA, consolidation and special effects. Refer to Fact Sheets for further details.
0%
10%
20%
30%
0%
10%
20%
30%
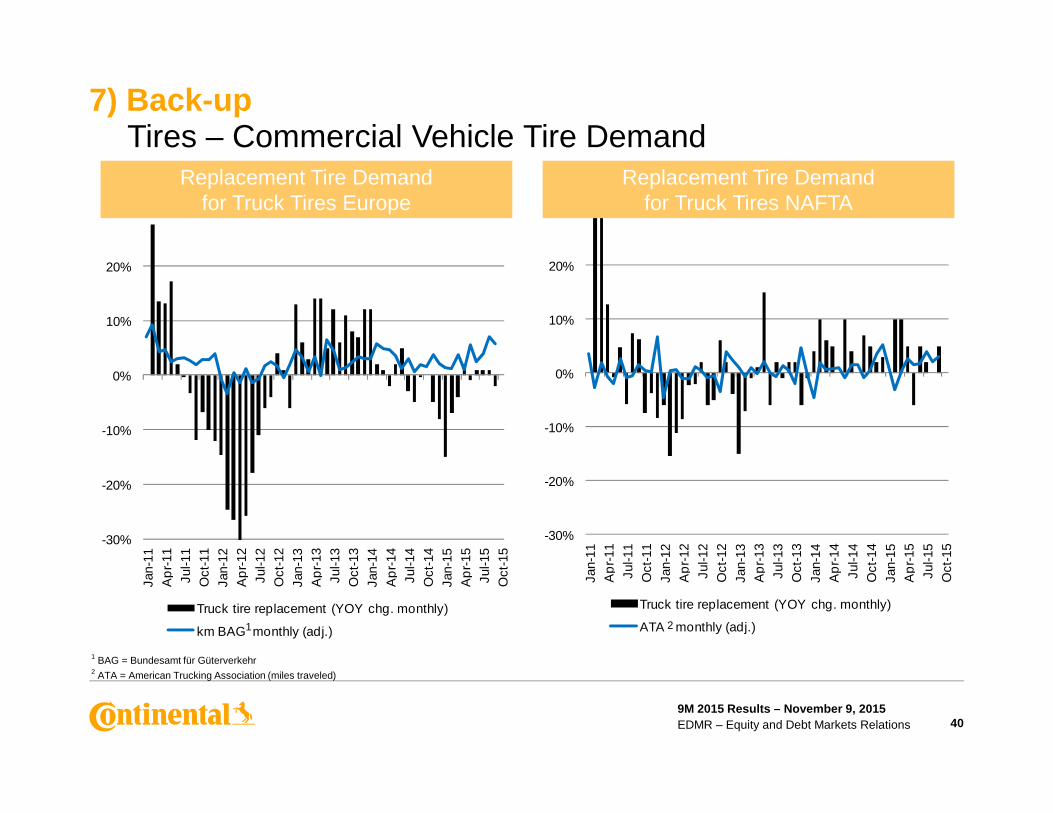
7) Back-upTires – Commercial Vehicle Tire Demand
Replacement Tire Demand for Truck Tires Europe
Replacement Tire Demand for Truck Tires NAFTA
9M 2015 Results – November 9, 2015EDMR – Equity and Debt Markets Relations
-30%
-20%
-10%
Jan-
11A
pr-
11
Jul-1
1O
ct-1
1
Jan-
12A
pr-
12
Jul-1
2O
ct-1
2
Jan-
13A
pr-
13
Jul-1
3O
ct-1
3
Jan-
14A
pr-
14
Jul-1
4O
ct-1
4
Jan-
15A
pr-
15
Jul-1
5O
ct-1
5
Truck tire replacement (YOY chg. monthly)
ATA monthly (adj.)
-30%
-20%
-10%
Jan-
11A
pr-
11Ju
l-11
Oct
-11
Jan-
12A
pr-
12Ju
l-12
Oct
-12
Jan-
13A
pr-
13Ju
l-13
Oct
-13
Jan-
14
Ap
r-14
Jul-1
4O
ct-1
4Ja
n-15
Ap
r-15
Jul-1
5O
ct-1
5
Truck tire replacement (YOY chg. monthly)
km BAG monthly (adj.)
40
1 BAG = Bundesamt für Güterverkehr2 ATA = American Trucking Association (miles traveled)
21
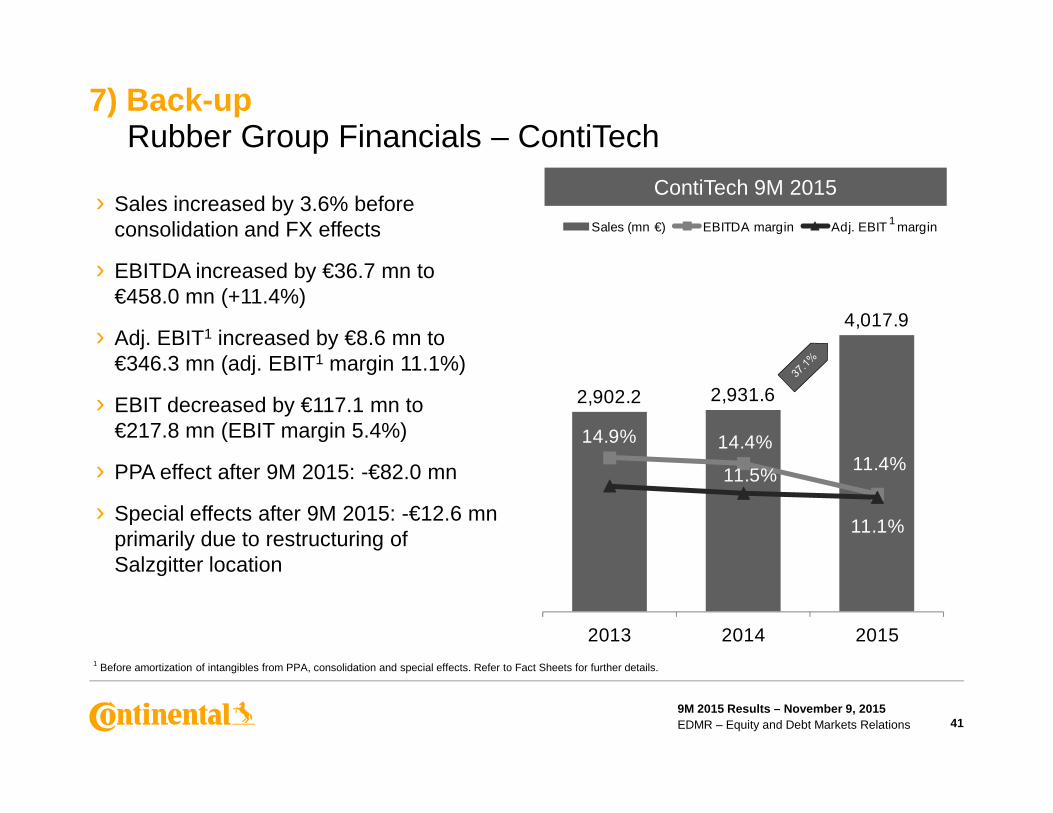
2,902.2 2,931.6
4,017.9
Sales (mn €) EBITDA margin Adj. EBIT margin
› Sales increased by 3.6% before consolidation and FX effects
› EBITDA increased by €36.7 mn to €458.0 mn (+11.4%)
› Adj. EBIT1 increased by €8.6 mn to €346.3 mn (adj. EBIT1 margin 11.1%)
› EBIT decreased by €117.1 mn to
7) Back-upRubber Group Financials – ContiTech
ContiTech 9M 20151
9M 2015 Results – November 9, 2015EDMR – Equity and Debt Markets Relations
2,902.2
14.9% 14.4%11.4%
11.5%
11.1%
2013 2014 2015
› EBIT decreased by €117.1 mn to €217.8 mn (EBIT margin 5.4%)
› PPA effect after 9M 2015: -€82.0 mn
› Special effects after 9M 2015: -€12.6 mn primarily due to restructuring of Salzgitter location
41
1 Before amortization of intangibles from PPA, consolidation and special effects. Refer to Fact Sheets for further details.
Fact Sheets 2013 – 2015
9M 2015 Results – November 9, 2015EDMR – Equity and Debt Markets Relations 42
Fact Sheets 2013 – 2015
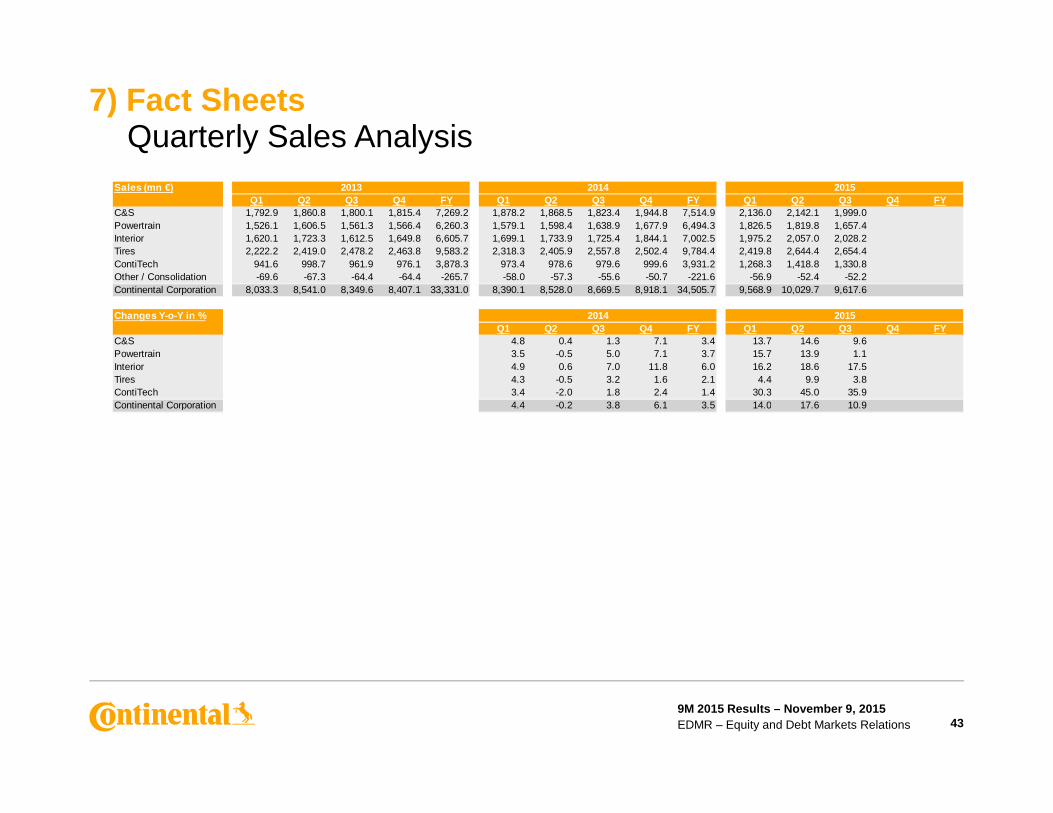
7) Fact SheetsQuarterly Sales Analysis
Sales (mn €)Q1 Q2 Q3 Q4 FY Q1 Q2 Q3 Q4 FY Q1 Q2 Q3 Q4 FY
C&S 1,792.9 1,860.8 1,800.1 1,815.4 7,269.2 1,878.2 1,868.5 1,823.4 1,944.8 7,514.9 2,136.0 2,142.1 1,999.0Powertrain 1,526.1 1,606.5 1,561.3 1,566.4 6,260.3 1,579.1 1,598.4 1,638.9 1,677.9 6,494.3 1,826.5 1,819.8 1,657.4Interior 1,620.1 1,723.3 1,612.5 1,649.8 6,605.7 1,699.1 1,733.9 1,725.4 1,844.1 7,002.5 1,975.2 2,057.0 2,028.2Tires 2,222.2 2,419.0 2,478.2 2,463.8 9,583.2 2,318.3 2,405.9 2,557.8 2,502.4 9,784.4 2,419.8 2,644.4 2,654.4ContiTech 941.6 998.7 961.9 976.1 3,878.3 973.4 978.6 979.6 999.6 3,931.2 1,268.3 1,418.8 1,330.8Other / Consolidation -69.6 -67.3 -64.4 -64.4 -265.7 -58.0 -57.3 -55.6 -50.7 -221.6 -56.9 -52.4 -52.2Continental Corporation 8,033.3 8,541.0 8,349.6 8,407.1 33,331.0 8,390.1 8,528.0 8,669.5 8,918.1 34,505.7 9,568.9 10,029.7 9,617.6
Changes Y-o-Y in %Q1 Q2 Q3 Q4 FY Q1 Q2 Q3 Q4 FY
C&S 4.8 0.4 1.3 7.1 3.4 13.7 14.6 9.6Powertrain 3.5 -0.5 5.0 7.1 3.7 15.7 13.9 1.1Interior 4.9 0.6 7.0 11.8 6.0 16.2 18.6 17.5Tires 4.3 -0.5 3.2 1.6 2.1 4.4 9.9 3.8ContiTech 3.4 -2.0 1.8 2.4 1.4 30.3 45.0 35.9Continental Corporation 4.4 -0.2 3.8 6.1 3.5 14.0 17.6 10.9
2015
2015
2013 2014
2014
9M 2015 Results – November 9, 2015EDMR – Equity and Debt Markets Relations 43
Continental Corporation 4.4 -0.2 3.8 6.1 3.5 14.0 17.6 10.9
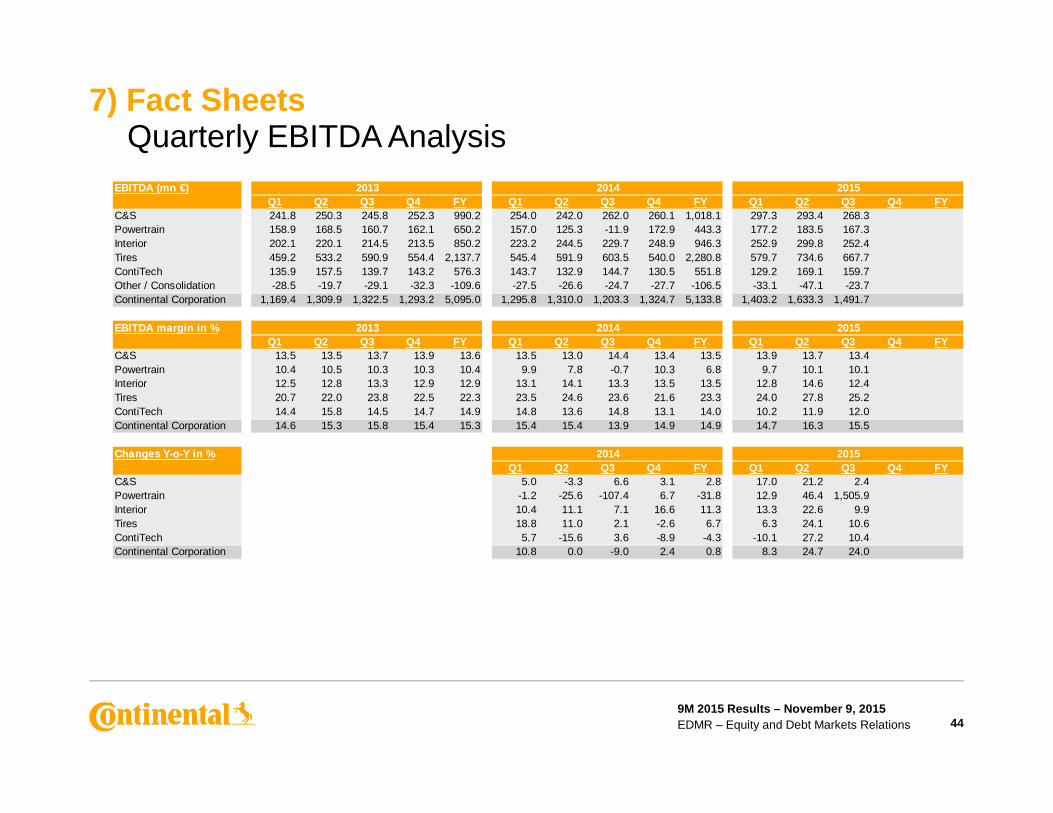
7) Fact SheetsQuarterly EBITDA Analysis
EBITDA (mn €)Q1 Q2 Q3 Q4 FY Q1 Q2 Q3 Q4 FY Q1 Q2 Q3 Q4 FY
C&S 241.8 250.3 245.8 252.3 990.2 254.0 242.0 262.0 260.1 1,018.1 297.3 293.4 268.3Powertrain 158.9 168.5 160.7 162.1 650.2 157.0 125.3 -11.9 172.9 443.3 177.2 183.5 167.3Interior 202.1 220.1 214.5 213.5 850.2 223.2 244.5 229.7 248.9 946.3 252.9 299.8 252.4Tires 459.2 533.2 590.9 554.4 2,137.7 545.4 591.9 603.5 540.0 2,280.8 579.7 734.6 667.7ContiTech 135.9 157.5 139.7 143.2 576.3 143.7 132.9 144.7 130.5 551.8 129.2 169.1 159.7Other / Consolidation -28.5 -19.7 -29.1 -32.3 -109.6 -27.5 -26.6 -24.7 -27.7 -106.5 -33.1 -47.1 -23.7Continental Corporation 1,169.4 1,309.9 1,322.5 1,293.2 5,095.0 1,295.8 1,310.0 1,203.3 1,324.7 5,133.8 1,403.2 1,633.3 1,491.7
EBITDA margin in %Q1 Q2 Q3 Q4 FY Q1 Q2 Q3 Q4 FY Q1 Q2 Q3 Q4 FY
C&S 13.5 13.5 13.7 13.9 13.6 13.5 13.0 14.4 13.4 13.5 13.9 13.7 13.4Powertrain 10.4 10.5 10.3 10.3 10.4 9.9 7.8 -0.7 10.3 6.8 9.7 10.1 10.1Interior 12.5 12.8 13.3 12.9 12.9 13.1 14.1 13.3 13.5 13.5 12.8 14.6 12.4Tires 20.7 22.0 23.8 22.5 22.3 23.5 24.6 23.6 21.6 23.3 24.0 27.8 25.2ContiTech 14.4 15.8 14.5 14.7 14.9 14.8 13.6 14.8 13.1 14.0 10.2 11.9 12.0
2015
2015
2013 2014
2013 2014
9M 2015 Results – November 9, 2015EDMR – Equity and Debt Markets Relations 44
ContiTech 14.4 15.8 14.5 14.7 14.9 14.8 13.6 14.8 13.1 14.0 10.2 11.9 12.0Continental Corporation 14.6 15.3 15.8 15.4 15.3 15.4 15.4 13.9 14.9 14.9 14.7 16.3 15.5
Changes Y-o-Y in %Q1 Q2 Q3 Q4 FY Q1 Q2 Q3 Q4 FY
C&S 5.0 -3.3 6.6 3.1 2.8 17.0 21.2 2.4Powertrain -1.2 -25.6 -107.4 6.7 -31.8 12.9 46.4 1,505.9Interior 10.4 11.1 7.1 16.6 11.3 13.3 22.6 9.9Tires 18.8 11.0 2.1 -2.6 6.7 6.3 24.1 10.6ContiTech 5.7 -15.6 3.6 -8.9 -4.3 -10.1 27.2 10.4Continental Corporation 10.8 0.0 -9.0 2.4 0.8 8.3 24.7 24.0
20152014
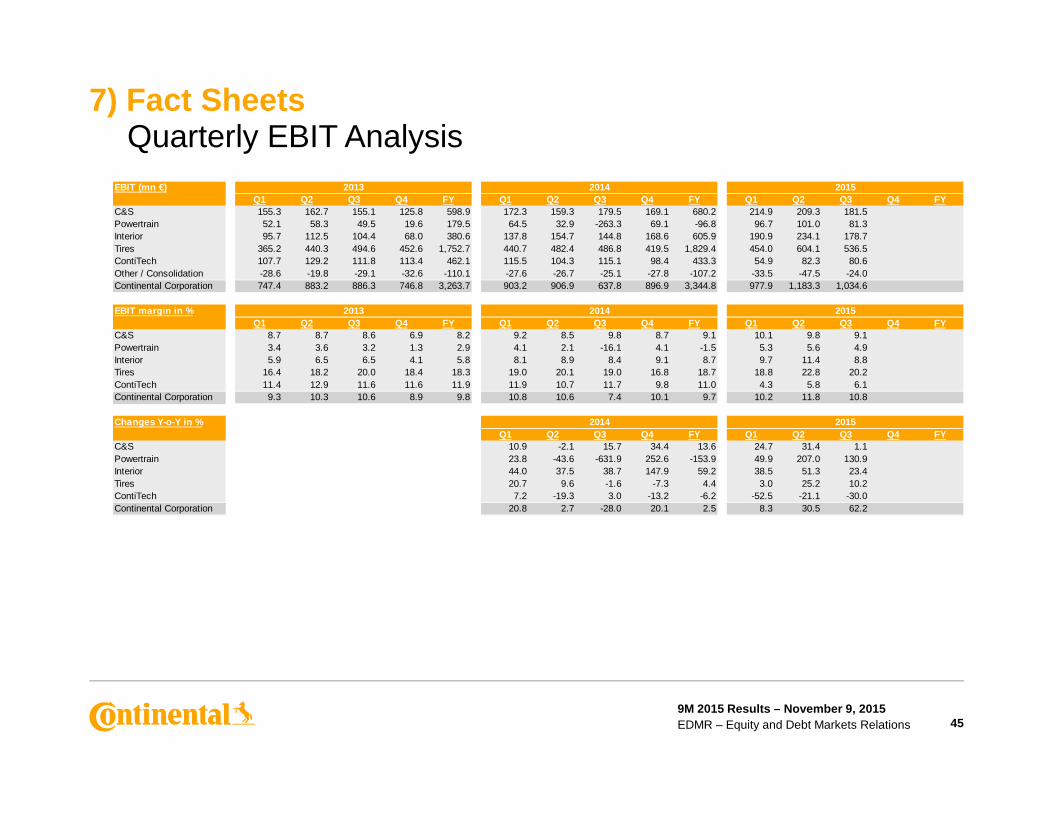
7) Fact SheetsQuarterly EBIT Analysis
EBIT (mn €)Q1 Q2 Q3 Q4 FY Q1 Q2 Q3 Q4 FY Q1 Q2 Q3 Q4 FY
C&S 155.3 162.7 155.1 125.8 598.9 172.3 159.3 179.5 169.1 680.2 214.9 209.3 181.5Powertrain 52.1 58.3 49.5 19.6 179.5 64.5 32.9 -263.3 69.1 -96.8 96.7 101.0 81.3Interior 95.7 112.5 104.4 68.0 380.6 137.8 154.7 144.8 168.6 605.9 190.9 234.1 178.7Tires 365.2 440.3 494.6 452.6 1,752.7 440.7 482.4 486.8 419.5 1,829.4 454.0 604.1 536.5ContiTech 107.7 129.2 111.8 113.4 462.1 115.5 104.3 115.1 98.4 433.3 54.9 82.3 80.6Other / Consolidation -28.6 -19.8 -29.1 -32.6 -110.1 -27.6 -26.7 -25.1 -27.8 -107.2 -33.5 -47.5 -24.0Continental Corporation 747.4 883.2 886.3 746.8 3,263.7 903.2 906.9 637.8 896.9 3,344.8 977.9 1,183.3 1,034.6
EBIT margin in %Q1 Q2 Q3 Q4 FY Q1 Q2 Q3 Q4 FY Q1 Q2 Q3 Q4 FY
C&S 8.7 8.7 8.6 6.9 8.2 9.2 8.5 9.8 8.7 9.1 10.1 9.8 9.1Powertrain 3.4 3.6 3.2 1.3 2.9 4.1 2.1 -16.1 4.1 -1.5 5.3 5.6 4.9Interior 5.9 6.5 6.5 4.1 5.8 8.1 8.9 8.4 9.1 8.7 9.7 11.4 8.8Tires 16.4 18.2 20.0 18.4 18.3 19.0 20.1 19.0 16.8 18.7 18.8 22.8 20.2ContiTech 11.4 12.9 11.6 11.6 11.9 11.9 10.7 11.7 9.8 11.0 4.3 5.8 6.1Continental Corporation 9.3 10.3 10.6 8.9 9.8 10.8 10.6 7.4 10.1 9.7 10.2 11.8 10.8
2015
2015
2013 2014
2013 2014
9M 2015 Results – November 9, 2015EDMR – Equity and Debt Markets Relations 45
Changes Y-o-Y in %Q1 Q2 Q3 Q4 FY Q1 Q2 Q3 Q4 FY
C&S 10.9 -2.1 15.7 34.4 13.6 24.7 31.4 1.1Powertrain 23.8 -43.6 -631.9 252.6 -153.9 49.9 207.0 130.9Interior 44.0 37.5 38.7 147.9 59.2 38.5 51.3 23.4Tires 20.7 9.6 -1.6 -7.3 4.4 3.0 25.2 10.2ContiTech 7.2 -19.3 3.0 -13.2 -6.2 -52.5 -21.1 -30.0Continental Corporation 20.8 2.7 -28.0 20.1 2.5 8.3 30.5 62.2
20152014
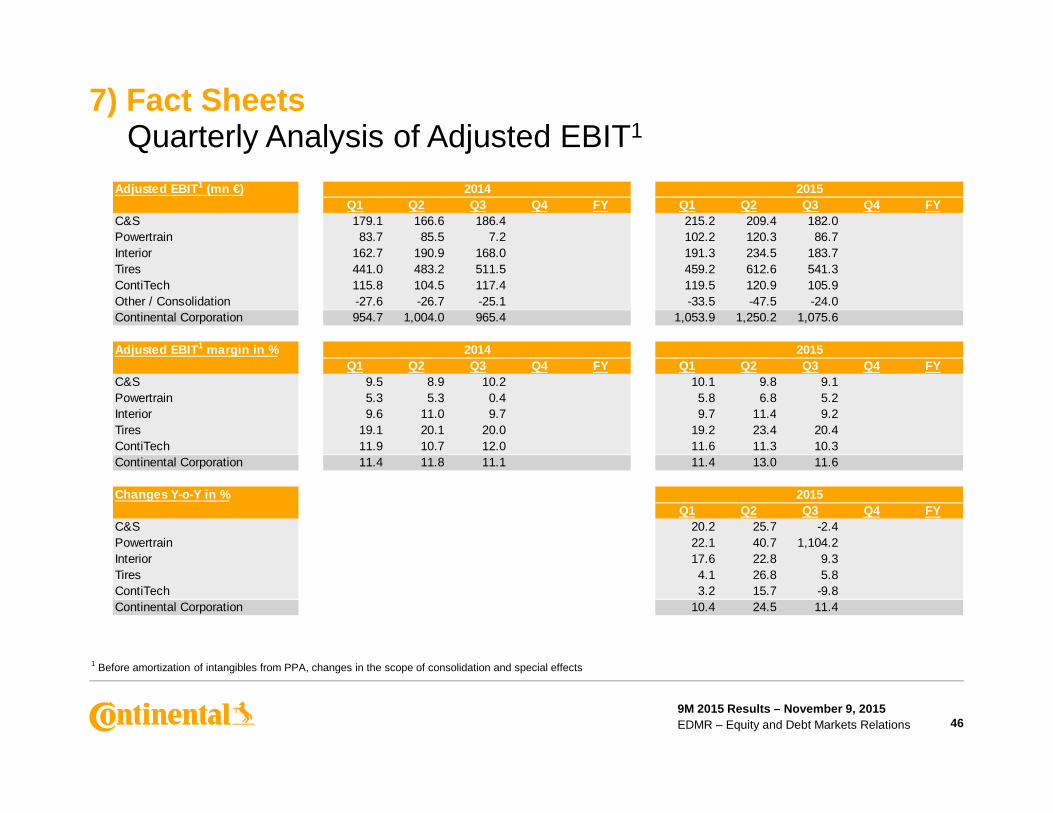
7) Fact SheetsQuarterly Analysis of Adjusted EBIT1
Adjusted EBIT 1 (mn €)Q1 Q2 Q3 Q4 FY Q1 Q2 Q3 Q4 FY
C&S 179.1 166.6 186.4 215.2 209.4 182.0Powertrain 83.7 85.5 7.2 102.2 120.3 86.7Interior 162.7 190.9 168.0 191.3 234.5 183.7Tires 441.0 483.2 511.5 459.2 612.6 541.3ContiTech 115.8 104.5 117.4 119.5 120.9 105.9Other / Consolidation -27.6 -26.7 -25.1 -33.5 -47.5 -24.0Continental Corporation 954.7 1,004.0 965.4 1,053.9 1,250.2 1,075.6
Adjusted EBIT 1 margin in %Q1 Q2 Q3 Q4 FY Q1 Q2 Q3 Q4 FY
C&S 9.5 8.9 10.2 10.1 9.8 9.1Powertrain 5.3 5.3 0.4 5.8 6.8 5.2Interior 9.6 11.0 9.7 9.7 11.4 9.2
2014
2014 2015
2015
9M 2015 Results – November 9, 2015EDMR – Equity and Debt Markets Relations 46
1 Before amortization of intangibles from PPA, changes in the scope of consolidation and special effects
Interior 9.6 11.0 9.7 9.7 11.4 9.2Tires 19.1 20.1 20.0 19.2 23.4 20.4ContiTech 11.9 10.7 12.0 11.6 11.3 10.3Continental Corporation 11.4 11.8 11.1 11.4 13.0 11.6
Changes Y-o-Y in %Q1 Q2 Q3 Q4 FY
C&S 20.2 25.7 -2.4Powertrain 22.1 40.7 1,104.2Interior 17.6 22.8 9.3Tires 4.1 26.8 5.8ContiTech 3.2 15.7 -9.8Continental Corporation 10.4 24.5 11.4
2015
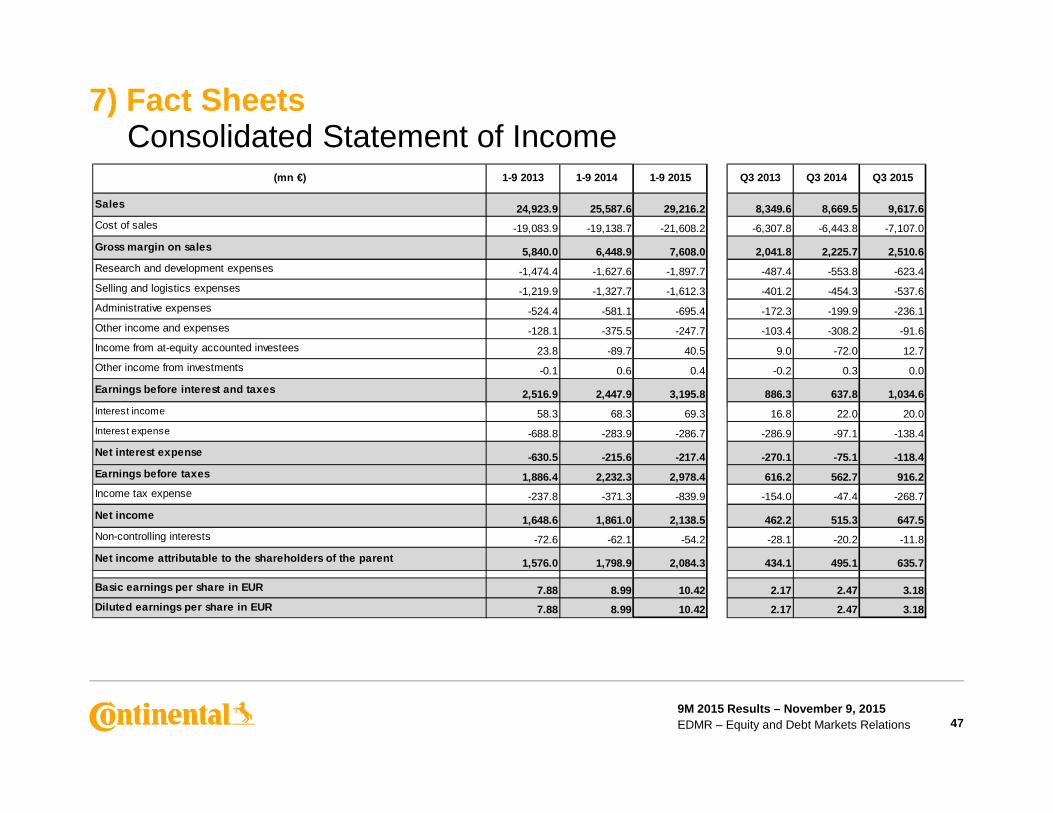
7) Fact SheetsConsolidated Statement of Income
Sales 24,923.9 25,587.6 29,216.2 8,349.6 8,669.5 9,617.6
Cost of sales -19,083.9 -19,138.7 -21,608.2 -6,307.8 -6,443.8 -7,107.0
Gross margin on sales 5,840.0 6,448.9 7,608.0 2,041.8 2,225.7 2,510.6
Research and development expenses -1,474.4 -1,627.6 -1,897.7 -487.4 -553.8 -623.4
Selling and logistics expenses -1,219.9 -1,327.7 -1,612.3 -401.2 -454.3 -537.6
Administrative expenses -524.4 -581.1 -695.4 -172.3 -199.9 -236.1
Other income and expenses -128.1 -375.5 -247.7 -103.4 -308.2 -91.6
Income from at-equity accounted investees 23.8 -89.7 40.5 9.0 -72.0 12.7
Other income from investments -0.1 0.6 0.4 -0.2 0.3 0.0
Earnings before interest and taxes 2,516.9 2,447.9 3,195.8 886.3 637.8 1,034.6
Interest income
Q3 2013 Q3 2014 Q3 2015(mn €) 1-9 20151-9 20141-9 2013
9M 2015 Results – November 9, 2015EDMR – Equity and Debt Markets Relations 47
Interest income 58.3 68.3 69.3 16.8 22.0 20.0
Interest expense -688.8 -283.9 -286.7 -286.9 -97.1 -138.4
Net interest expense -630.5 -215.6 -217.4 -270.1 -75.1 -118.4
Earnings before taxes 1,886.4 2,232.3 2,978.4 616.2 562.7 916.2
Income tax expense -237.8 -371.3 -839.9 -154.0 -47.4 -268.7
Net income 1,648.6 1,861.0 2,138.5 462.2 515.3 647.5
Non-controlling interests -72.6 -62.1 -54.2 -28.1 -20.2 -11.8
Net income attributable to the shareholders of the parent 1,576.0 1,798.9 2,084.3 434.1 495.1 635.7
Basic earnings per share in EUR 7.88 8.99 10.42 2.17 2.47 3.18
Diluted earnings per share in EUR 7.88 8.99 10.42 2.17 2.47 3.18
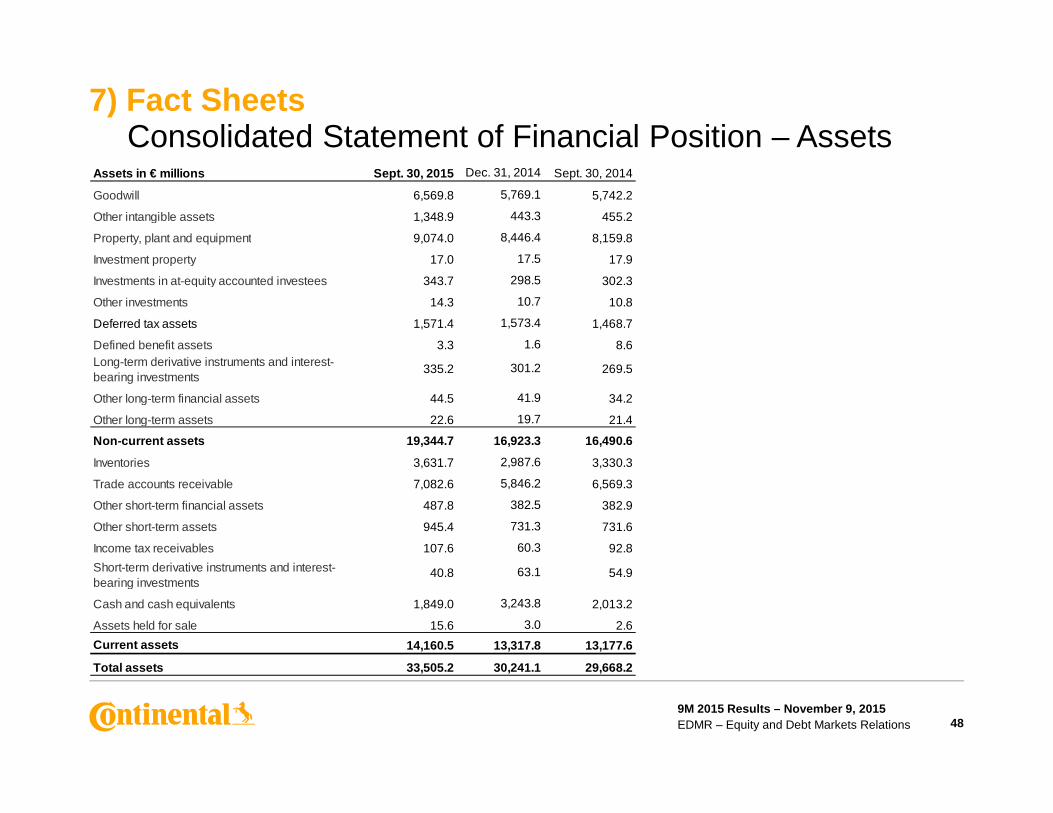
7) Fact SheetsConsolidated Statement of Financial Position – Assets
Assets in € millions Sept. 30, 2015 Dec. 31, 2014 Sept. 30, 2014
Goodwill 6,569.8 5,769.1 5,742.2
Other intangible assets 1,348.9 443.3 455.2
Property, plant and equipment 9,074.0 8,446.4 8,159.8
Investment property 17.0 17.5 17.9
Investments in at-equity accounted investees 343.7 298.5 302.3
Other investments 14.3 10.7 10.8
Deferred tax assets 1,571.4 1,573.4 1,468.7
Defined benefit assets 3.3 1.6 8.6Long-term derivative instruments and interest-bearing investments
335.2 301.2 269.5
Other long-term financial assets 44.5 41.9 34.2
9M 2015 Results – November 9, 2015EDMR – Equity and Debt Markets Relations 48
Other long-term assets 22.6 19.7 21.4
Non-current assets 19,344.7 16,923.3 16,490.6
Inventories 3,631.7 2,987.6 3,330.3
Trade accounts receivable 7,082.6 5,846.2 6,569.3
Other short-term financial assets 487.8 382.5 382.9
Other short-term assets 945.4 731.3 731.6
Income tax receivables 107.6 60.3 92.8
Short-term derivative instruments and interest-bearing investments
40.8 63.1 54.9
Cash and cash equivalents 1,849.0 3,243.8 2,013.2
Assets held for sale 15.6 3.0 2.6
Current assets 14,160.5 13,317.8 13,177.6
Total assets 33,505.2 30,241.1 29,668.2
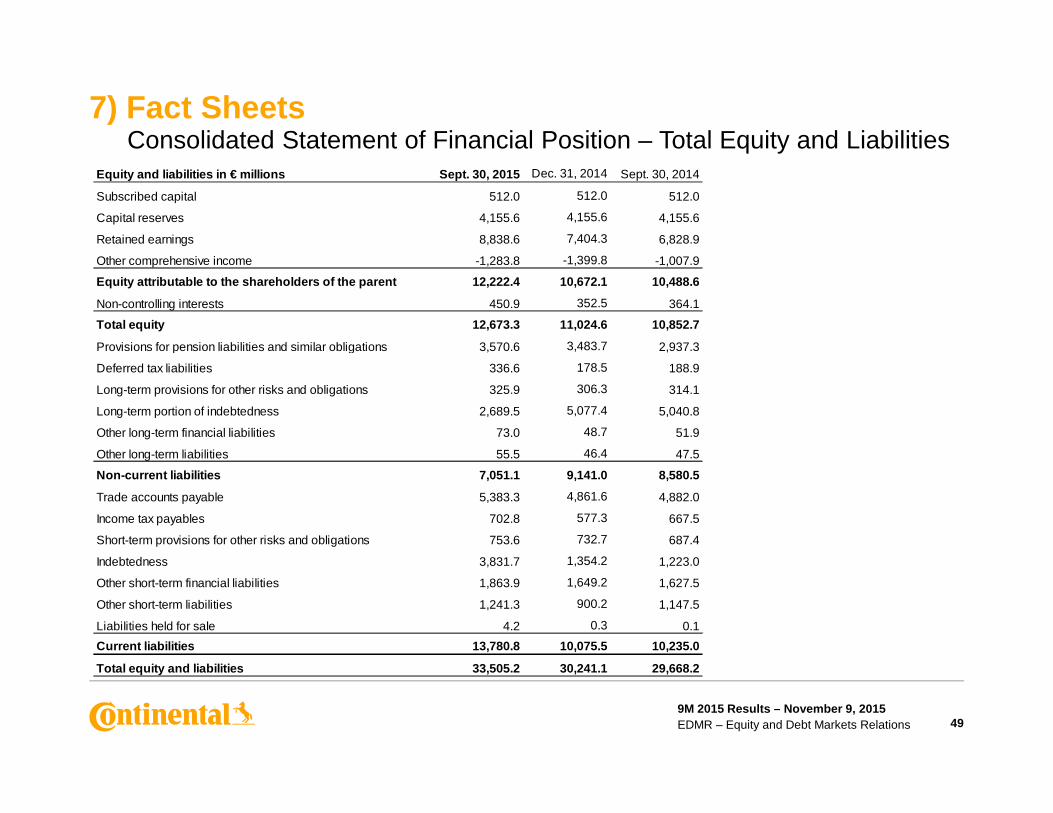
7) Fact SheetsConsolidated Statement of Financial Position – Total Equity and Liabilities
Equity and liabilities in € millions Sept. 30, 2015 Dec. 31, 2014 Sept. 30, 2014
Subscribed capital 512.0 512.0 512.0
Capital reserves 4,155.6 4,155.6 4,155.6
Retained earnings 8,838.6 7,404.3 6,828.9
Other comprehensive income -1,283.8 -1,399.8 -1,007.9
Equity attributable to the shareholders of the pare nt 12,222.4 10,672.1 10,488.6
Non-controlling interests 450.9 352.5 364.1
Total equity 12,673.3 11,024.6 10,852.7
Provisions for pension liabilities and similar obligations 3,570.6 3,483.7 2,937.3
Deferred tax liabilities 336.6 178.5 188.9
Long-term provisions for other risks and obligations 325.9 306.3 314.1
Long-term portion of indebtedness 2,689.5 5,077.4 5,040.8
9M 2015 Results – November 9, 2015EDMR – Equity and Debt Markets Relations 49
Long-term portion of indebtedness 2,689.5 5,077.4 5,040.8
Other long-term financial liabilities 73.0 48.7 51.9
Other long-term liabilities 55.5 46.4 47.5
Non-current liabilities 7,051.1 9,141.0 8,580.5
Trade accounts payable 5,383.3 4,861.6 4,882.0
Income tax payables 702.8 577.3 667.5
Short-term provisions for other risks and obligations 753.6 732.7 687.4
Indebtedness 3,831.7 1,354.2 1,223.0
Other short-term financial liabilities 1,863.9 1,649.2 1,627.5
Other short-term liabilities 1,241.3 900.2 1,147.5
Liabilities held for sale 4.2 0.3 0.1
Current liabilities 13,780.8 10,075.5 10,235.0
Total equity and liabilities 33,505.2 30,241.1 29,668.2
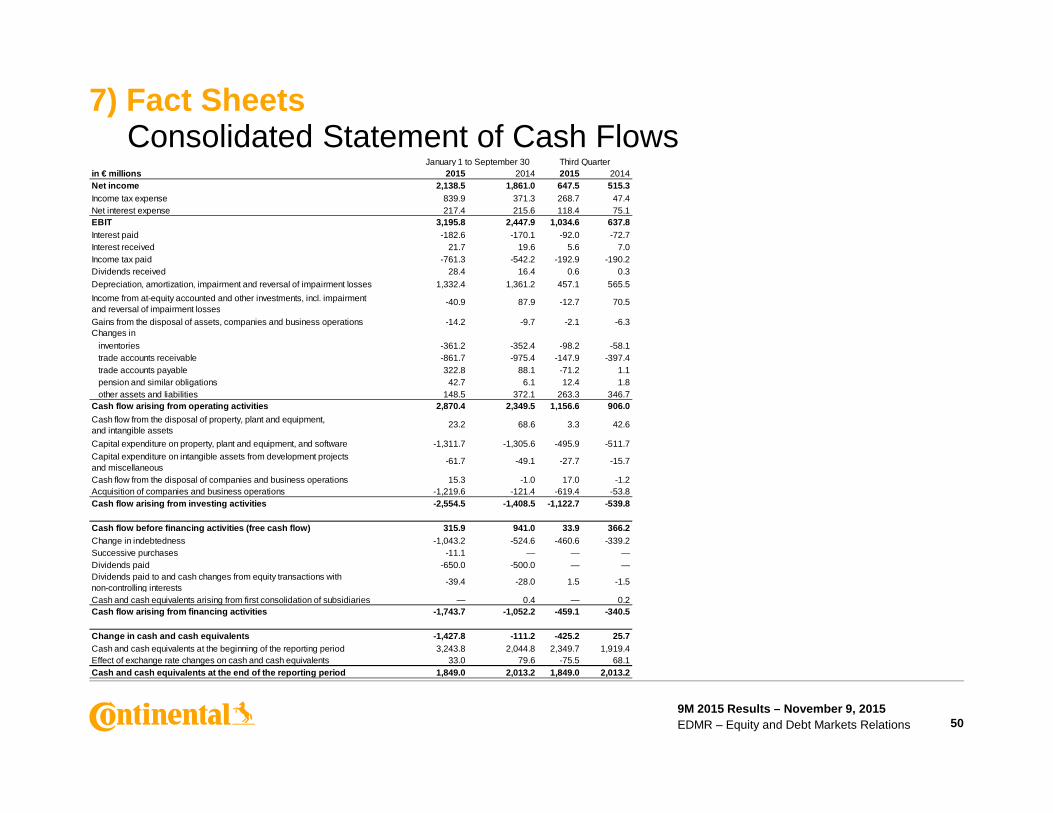
7) Fact SheetsConsolidated Statement of Cash Flows
in € millions 2015 2014 2015 2014Net income 2,138.5 1,861.0 647.5 515.3Income tax expense 839.9 371.3 268.7 47.4Net interest expense 217.4 215.6 118.4 75.1EBIT 3,195.8 2,447.9 1,034.6 637.8Interest paid -182.6 -170.1 -92.0 -72.7Interest received 21.7 19.6 5.6 7.0Income tax paid -761.3 -542.2 -192.9 -190.2Dividends received 28.4 16.4 0.6 0.3Depreciation, amortization, impairment and reversal of impairment losses 1,332.4 1,361.2 457.1 565.5
Income from at-equity accounted and other investments, incl. impairment and reversal of impairment losses
-40.9 87.9 -12.7 70.5
Gains from the disposal of assets, companies and business operations -14.2 -9.7 -2.1 -6.3Changes in
inventories -361.2 -352.4 -98.2 -58.1trade accounts receivable -861.7 -975.4 -147.9 -397.4trade accounts payable 322.8 88.1 -71.2 1.1pension and similar obligations 42.7 6.1 12.4 1.8other assets and liabilities 148.5 372.1 263.3 346.7
Cash flow arising from operating activities 2,870.4 2,349.5 1,156.6 906.0
January 1 to September 30 Third Quarter
9M 2015 Results – November 9, 2015EDMR – Equity and Debt Markets Relations 50
Cash flow arising from operating activities 2,870.4 2,349.5 1,156.6 906.0
Cash flow from the disposal of property, plant and equipment, and intangible assets
23.2 68.6 3.3 42.6
Capital expenditure on property, plant and equipment, and software -1,311.7 -1,305.6 -495.9 -511.7Capital expenditure on intangible assets from development projects and miscellaneous
-61.7 -49.1 -27.7 -15.7
Cash flow from the disposal of companies and business operations 15.3 -1.0 17.0 -1.2Acquisition of companies and business operations -1,219.6 -121.4 -619.4 -53.8Cash flow arising from investing activities -2,554.5 -1,408.5 -1,122.7 -539.8
Cash flow before financing activities (free cash fl ow) 315.9 941.0 33.9 366.2Change in indebtedness -1,043.2 -524.6 -460.6 -339.2Successive purchases -11.1 — — —Dividends paid -650.0 -500.0 — —Dividends paid to and cash changes from equity transactions with non-controlling interests
-39.4 -28.0 1.5 -1.5
Cash and cash equivalents arising from first consolidation of subsidiaries — 0.4 — 0.2Cash flow arising from financing activities -1,743.7 -1,052.2 -459.1 -340.5
Change in cash and cash equivalents -1,427.8 -111.2 -425.2 25.7Cash and cash equivalents at the beginning of the reporting period 3,243.8 2,044.8 2,349.7 1,919.4Effect of exchange rate changes on cash and cash equivalents 33.0 79.6 -75.5 68.1Cash and cash equivalents at the end of the reporti ng period 1,849.0 2,013.2 1,849.0 2,013.2
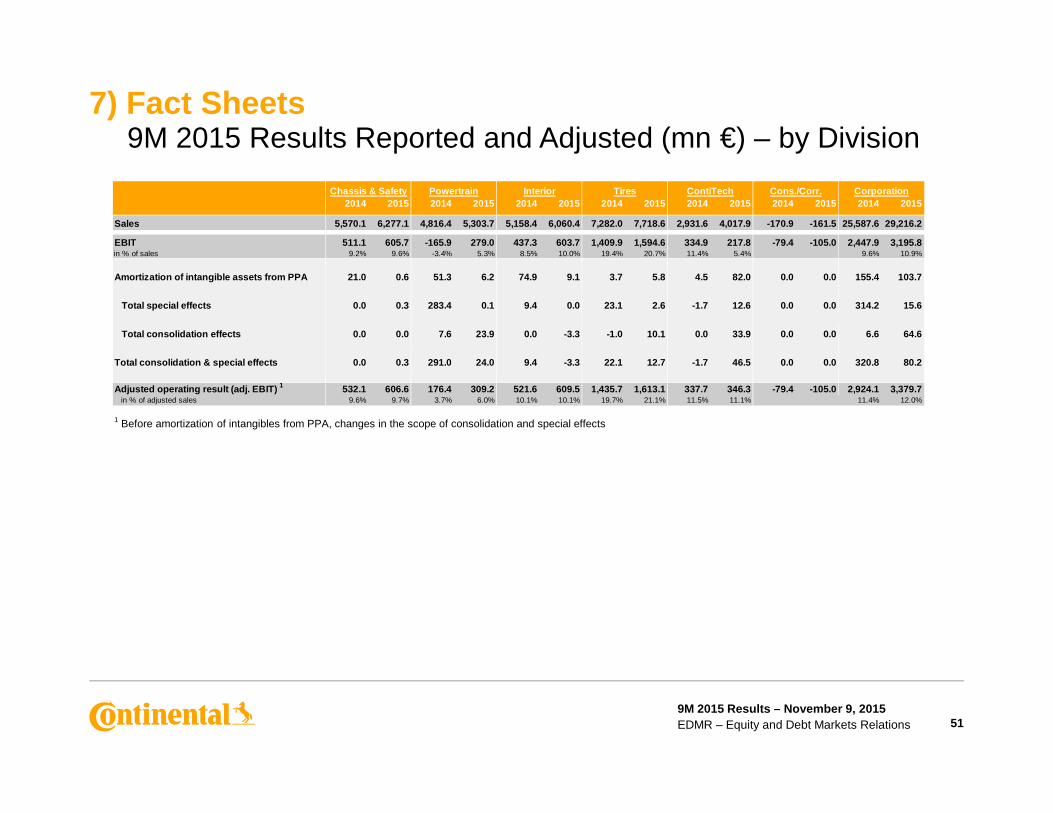
7) Fact Sheets9M 2015 Results Reported and Adjusted (mn €) – by Division
2014 2015 2014 2015 2014 2015 2014 2015 2014 2015 2014 2015 2014 2015
Sales 5,570.1 6,277.1 4,816.4 5,303.7 5,158.4 6,060.4 7,282.0 7,718.6 2,931.6 4,017.9 -170.9 -161.5 25,587.6 29,216.2
EBIT 511.1 605.7 -165.9 279.0 437.3 603.7 1,409.9 1,594.6 334.9 217.8 -79.4 -105.0 2,447.9 3,195.8in % of sales 9.2% 9.6% -3.4% 5.3% 8.5% 10.0% 19.4% 20.7% 11.4% 5.4% 9.6% 10.9%
Amortization of intangible assets from PPA 21.0 0.6 51 .3 6.2 74.9 9.1 3.7 5.8 4.5 82.0 0.0 0.0 155.4 103.7
Total special effects 0.0 0.3 283.4 0.1 9.4 0.0 23.1 2.6 -1. 7 12.6 0.0 0.0 314.2 15.6
Total consolidation effects 0.0 0.0 7.6 23.9 0.0 -3.3 -1. 0 10.1 0.0 33.9 0.0 0.0 6.6 64.6
Total consolidation & special effects 0.0 0.3 291.0 24. 0 9.4 -3.3 22.1 12.7 -1.7 46.5 0.0 0.0 320.8 80.2
Adjusted operating result (adj. EBIT) 1 532.1 606.6 176.4 309.2 521.6 609.5 1,435.7 1,613.1 337.7 346.3 -79.4 -105.0 2,924.1 3,379.7in % of adjusted sales 9.6% 9.7% 3.7% 6.0% 10.1% 10.1% 19.7% 21.1% 11.5% 11.1% 11.4% 12.0%
CorporationInteriorChassis & Safety Powertrain Tires ContiTech Cons./Corr.
9M 2015 Results – November 9, 2015EDMR – Equity and Debt Markets Relations 51
1 Before amortization of intangibles from PPA, changes in the scope of consolidation and special effects
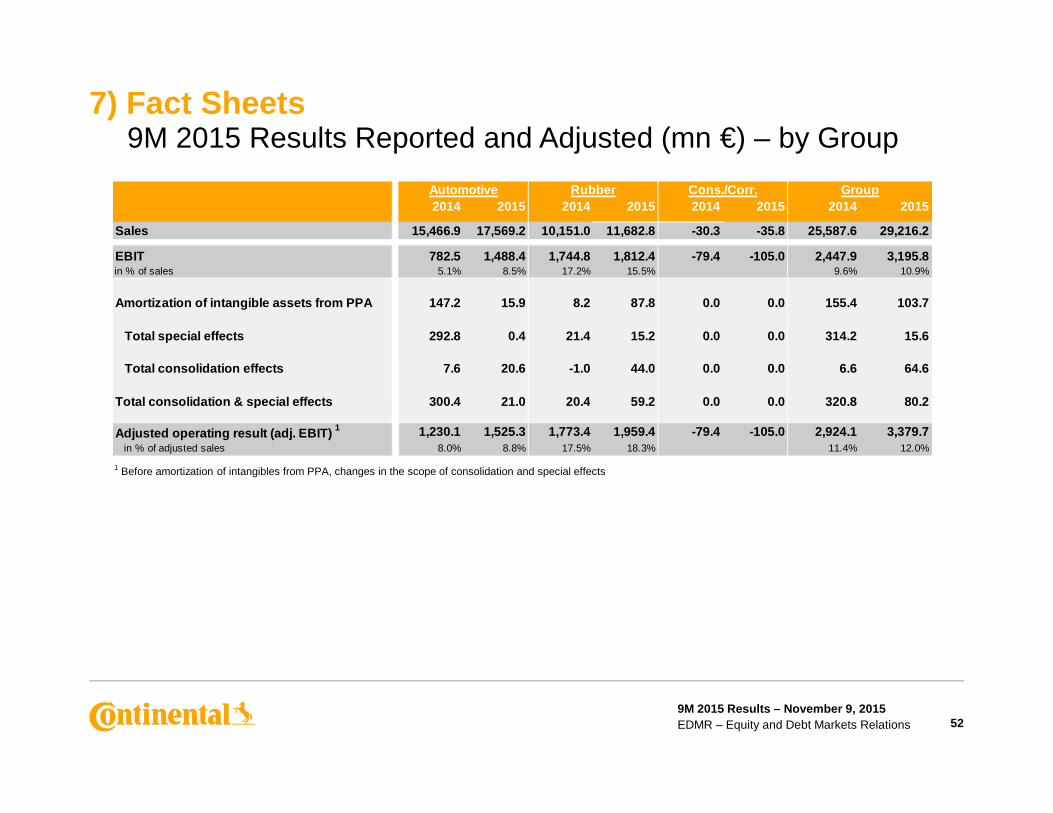
7) Fact Sheets9M 2015 Results Reported and Adjusted (mn €) – by Group
2014 2015 2014 2015 2014 2015 2014 2015
Sales 15,466.9 17,569.2 10,151.0 11,682.8 -30.3 -35.8 25,587.6 29,216.2
EBIT 782.5 1,488.4 1,744.8 1,812.4 -79.4 -105.0 2,447.9 3,195.8in % of sales 5.1% 8.5% 17.2% 15.5% 9.6% 10.9%
Amortization of intangible assets from PPA 147.2 15.9 8.2 87.8 0.0 0.0 155.4 103.7
Total special effects 292.8 0.4 21.4 15.2 0.0 0.0 314.2 15.6
Total consolidation effects 7.6 20.6 -1.0 44.0 0.0 0.0 6.6 64.6
Total consolidation & special effects 300.4 21.0 20.4 59.2 0.0 0.0 320.8 80.2
Automotive Cons./Corr. GroupRubber
9M 2015 Results – November 9, 2015EDMR – Equity and Debt Markets Relations 52
1 Before amortization of intangibles from PPA, changes in the scope of consolidation and special effects
Total consolidation & special effects 300.4 21.0 20.4 59.2 0.0 0.0 320.8 80.2
Adjusted operating result (adj. EBIT) 1 1,230.1 1,525.3 1,773.4 1,959.4 -79.4 -105.0 2,924.1 3,379.7in % of adjusted sales 8.0% 8.8% 17.5% 18.3% 11.4% 12.0%
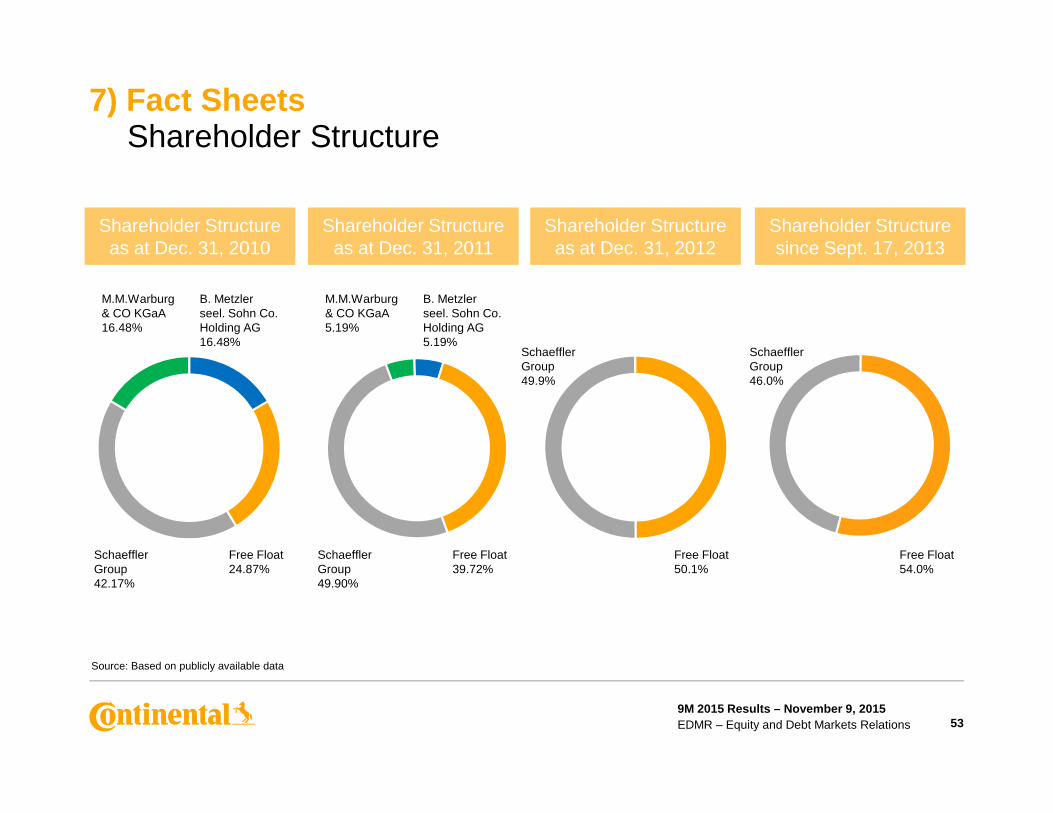
7) Fact SheetsShareholder Structure
Shareholder Structure as at Dec. 31, 2010
Shareholder Structure as at Dec. 31, 2011
Shareholder Structure as at Dec. 31, 2012
Shareholder Structure since Sept. 17, 2013
M.M.Warburg & CO KGaA16.48%
M.M.Warburg & CO KGaA5.19%
B. Metzler seel. Sohn Co. Holding AG16.48%
B. Metzler seel. Sohn Co. Holding AG5.19%
Schaeffler Group49.9%
Schaeffler Group46.0%
9M 2015 Results – November 9, 2015EDMR – Equity and Debt Markets Relations 53
Source: Based on publicly available data
Schaeffler Group42.17%
Schaeffler Group49.90%
Free Float39.72%
Free Float50.1%
Free Float54.0%
Free Float24.87%
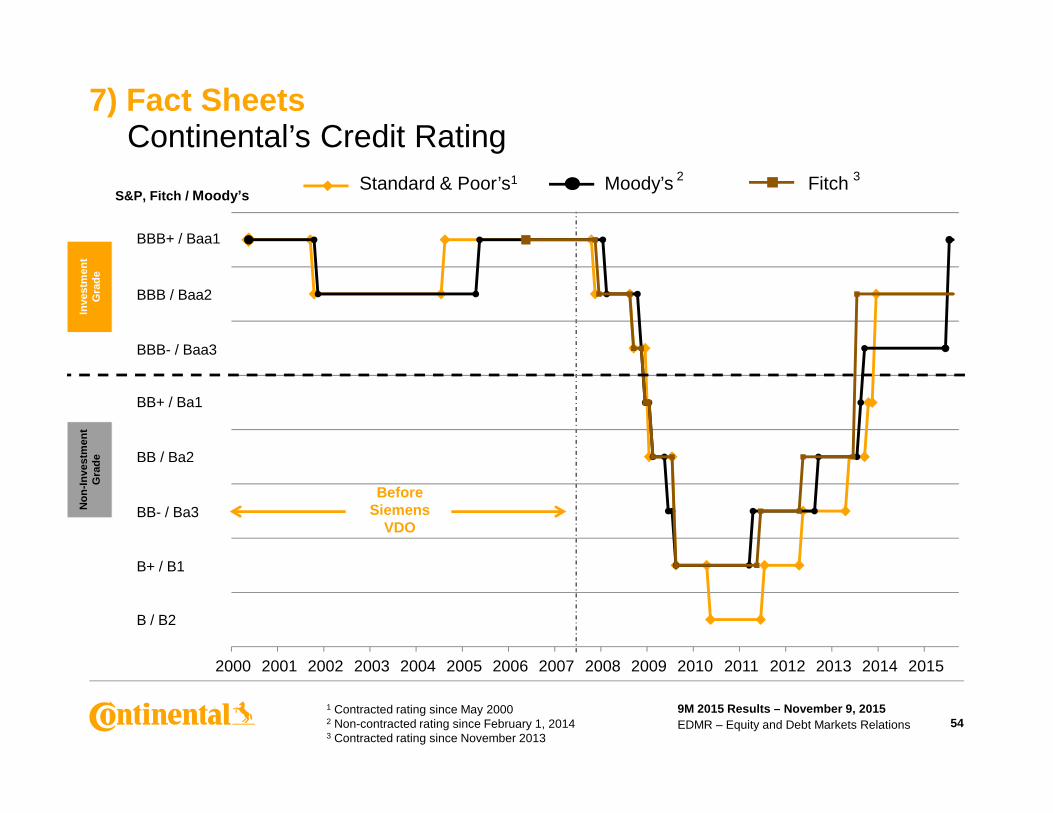
7) Fact SheetsContinental’s Credit Rating
BBB+ / Baa1
BBB / Baa2
BBB- / Baa3
BB+ / Ba1
S&P, Fitch / Moody’sStandard & Poor’s1 Moody’s 2 Fitch 3
Inve
stm
ent
Gra
de
9M 2015 Results – November 9, 2015EDMR – Equity and Debt Markets Relations 54
2000 2001 2002 2003 2004 2005 2006 2007 2008 2009 2010 2011 2012 2013 2014 2015
BB+ / Ba1
BB / Ba2
BB- / Ba3
B+ / B1
B / B2
Before Siemens
VDO
Non
-Inv
estm
ent
Gra
de
1 Contracted rating since May 20002 Non-contracted rating since February 1, 20143 Contracted rating since November 2013
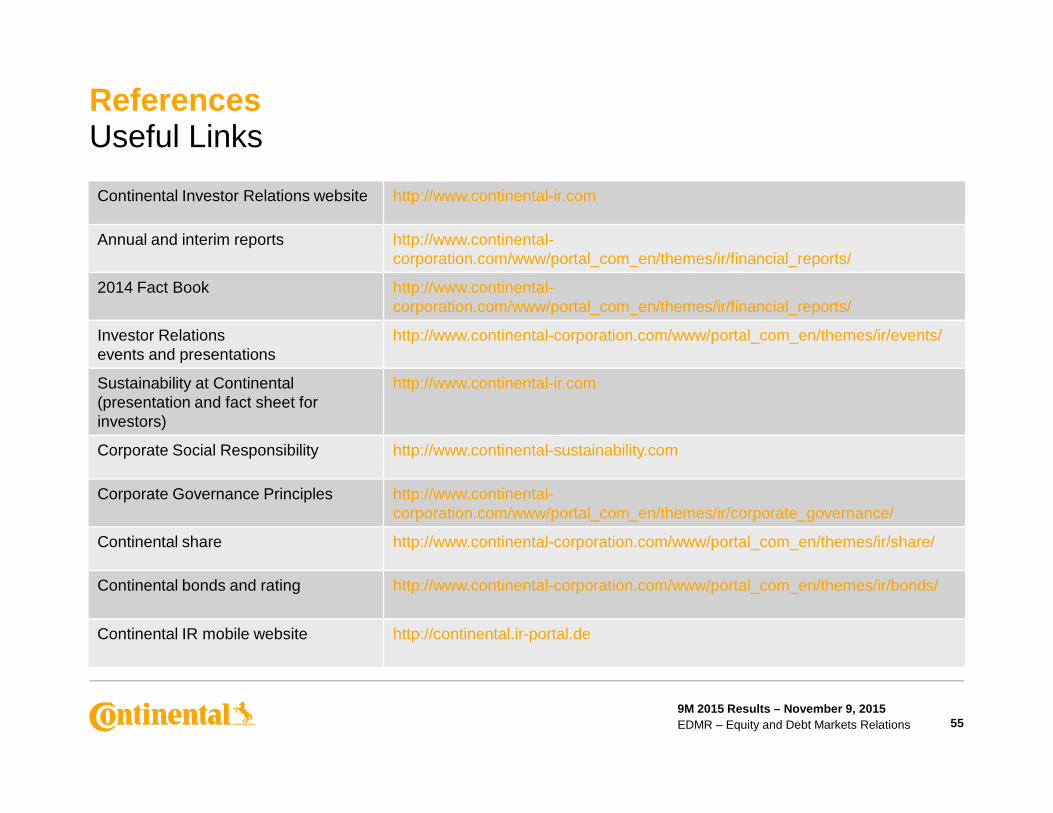
ReferencesUseful Links
Continental Investor Relations website http://www.continental-ir.com
Annual and interim reports http://www.continental-corporation.com/www/portal_com_en/themes/ir/financial_reports/
2014 Fact Book http://www.continental-corporation.com/www/portal_com_en/themes/ir/financial_reports/
Investor Relationsevents and presentations
http://www.continental-corporation.com/www/portal_com_en/themes/ir/events/
Sustainability at Continental (presentation and fact sheet for
http://www.continental-ir.com
9M 2015 Results – November 9, 2015EDMR – Equity and Debt Markets Relations 55
(presentation and fact sheet for investors)
Corporate Social Responsibility http://www.continental-sustainability.com
Corporate Governance Principles http://www.continental-corporation.com/www/portal_com_en/themes/ir/corporate_governance/
Continental share http://www.continental-corporation.com/www/portal_com_en/themes/ir/share/
Continental bonds and rating http://www.continental-corporation.com/www/portal_com_en/themes/ir/bonds/
Continental IR mobile website http://continental.ir-portal.de