Embed Size (px)
Citation preview
15. FLUCTUATION IN EOLIAN SEDIMENTATION DURING THE PAST FIVEGLACIAL-INTERGLACIAL CYCLES: A PRELIMINARY EXAMINATION OF DATA FROM
DEEP SEA DRILLING PROJECT HOLE 503B, EASTERN EQUATORIAL PACIFIC1
David K. Rea, Department of Atmospheric and Oceanic Science, University of Michigan, Ann Arbor, Michigan
ABSTRACT
Pelagic sediments from DSDP Hole 5O3B contain, in their carbonate abundance data, a clear record of glacial-interglacial cycles. The eolian component of those sediments was analyzed over the past four carbonate cycles, and themass accumulation rate (MAR) and grain size of the eolian component was determined. Eolian MARs range from 24 to169 mg/cm2/103y. and commonly are higher by a factor of three to five during times of glacial retreat. Reduced con-tribution during periods of glaciation most likely reflects glacial-age humidity in the American source. Grain-size values(Φ50) range from 8.25 to a minimum of 8.790—a variation in grain mass by a factor of 3.1. Larger grains reflect morevigorous atmospheric circulation, but sizes do not covary with the carbonate or eolian accumulation curves. These datasuggest that the intensity of atmospheric circulation in the tropics may reflect the 42,000 y.-tilt cycle rather than the100,000 y.-cycle of glacial advance.
EOLIAN SEDIMENTATION
Eolian debris is the only component of deep-sea sedi-ment providing direct information about the atmosphericcirculation patterns and changes in wind intensity thatinfluenced past oceanic surface-water circulation. Todate, most estimates of atmospheric circulation havebeen indirect and based on inferred changes of upwell-ing intensity as recorded by the preservation in biogenicopal (Pisias, 1976; Molina-Cruz, 1977; Leinen, 1979).Sophisticated models of atmospheric circulation duringa glaciation (Gates, 1976; Manabe and Hahn, 1977)have been constructed from sea-surface temperaturesand other climatic indicators for the last major ice ad-vance, 18,000 y. ago (CLIMAP, 1976).
In the simplest case, the vigor of the global wind sys-tems should depend directly on the pole-to-equator tem-perature gradient. As this gradient becomes more or lessintense, the wind intensity should wax or wane. The ac-cumulation of eolian sediment is also controlled by theclimate (actually, vegetative cover) of the source; morearid regions provide larger quantities of dust.
More than a decade ago, Windom (1969) suggestedthat as much as 75% of the nonbiogenic component ofdeep-sea sediment was atmospheric dust fallout. Recentestimates of this contribution of continental dust to theworld's oceans are in the range of 0.5 to 1.0 × I015 g/y.(Savoie and Prospero, 1980), corresponding to an aver-age mass flux to the ocean floor of about 150 to 300 mg/cm2/103 y. Particulate accumulation in snowfields is ofa similar order of magnitude, although generally lessthan 100 mg/cmVlO3 y. (Windom, 1969). Eolian contri-butions to surface sediment commonly have been esti-mated by the concentration of quartz (Rex and Gold-berg, 1958). Patterns of prevailing winds are reflected indecreasing quartz concentrations away from the conti-
Prell, W. L., Gardner, J. V., et al., Init. Repts. DSDP, 68: Washington (U.S. Govt.Printing Office).
nental source (Lisitzin, 1972; Windom, 1975; Molina-Cruz and Price, 1977; Thiede, 1979; Johnson, 1979;Leinen and Heath, 1981). In some cases, illite and kao-linite concentrations in surface sediment also reflect eo-lian transport (Windom, 1975).
There have been relatively few downcore studies ofeolian materials. Parkin and his coworkers (Parkin,1974; Parkin and Shackleton, 1973; Parkin and Padg-ham, 1975) studied two cores from the northwest Afri-can continental margin and found that both the abun-dance and size of quartz grains larger than 7 µm in-creased during glacial times, implying stronger north-east tradewinds. Thiede (1979) has shown that the re-gion of high quartz concentration east of Australia andNew Zealand was much more extensive during the lastglaciation than it is now, implying either that the South-ern Hemisphere westerlies were stronger during glacialtimes, or that Australia was more arid.
Molina-Cruz (1975, 1977) analyzed quartz contentand other data from two cores recovered near the SouthAmerican continent (3.6°S and 16.4°S). Both coresshowed fluctuations in the quartz accumulation rate ofa factor of two; larger values usually coincided withhigher CaCO3 accumulation rates. Both cores, however,have total mineral mass accumulation rates (MAR) of500 to 2000 mg/cm2/103 y. (Molina-Cruz, 1975)—ratesnormally indicating hemipelagic deposition. It is, there-fore, not clear that the nonbiogenic component of thosecores records a predominantly eolian signal. Multivari-ate statistical analysis of all data from the core at 3.6°S,83.9°W, V19-29, led Molina-Cruz (1977) to suggest thatthe speed of the southeast tradewinds increased by 30 to50% from interglacial to glacial times. The pattern ofopal productivity is not as clear: Preservation of opal inthe eastern equatorial Pacific may have been greater dur-ing interglacials (Molina-Cruz, 1977; Mikkelsen, 1978).
I have studied longer-term changes, which range backto the Middle Cretaceous, in the wind-borne componentof North Pacific pelagic sediment (Rea and Janecek,
409
D. K. REA
1980; Janecek et al., 1980; Rea and Janecek, in press a;Rea and Harrsch, in press; Rea and Janecek, in press b).Our data include eolian MAR, which we interpret interms of source-area climate or supply, and eolian grainsize, which we interpret in terms of wind intensity.These studies indicate that a large change in the grainsize of eolian sediment occurred about 3 Ma in con-junction with the onset of Northern Hemispheric gla-ciation; it is recorded as a 5- to 10-fold increase in theaccumulation of eolian sediments and a doubling of themass of the average wind-borne grain. In this study Ihave examined the eolian fraction of Pleistocene sedi-ment to determine and quantify changes in atmosphericcirculation during the glacial-inter glacial cycles.
METHODS
The basic datum is the weight percentage of the total eolian loadrather than only the weight percentage of quartz, which may be only20 to 30%—or even less (Windom, 1969; Prospero and Bonatti, 1969;Johnson, 1979; Prospero and others, 1981) of the wind-transportedsediment and the grain size of the total eolian component. I isolatedthe eolian fraction by a series of extractions to remove CaCO3, opal-ine silica, Fe and Mn oxides and hydroxides, and zeolites. Authigenicclays and feldspars would survive this procedure, but photographstaken with a scanning electron microscope during various stages of theextraction and the general coherency of the data suggest that they donot present a major problem, especially in these geologically youngsediments. If the sample site is far from land, on a topographic eleva-tion, or otherwise protected from downslope hemipelagic transport,the nonauthigenic, inorganic sedimentary component isolated by ourtechnique presumably represents eolian material. The grain size of the> 1.0-µm fraction of the eolian component was determined by Coultercounter at 0.5Φ intervals, and the median grain size was determined(Folk, 1974). Resulting data have a precision of ± 5 % for the weight-percentage values and ±0.05 to Q.10Φ for grain size. A detailed de-scription of the laboratory procedures has been given by Rea andJanecek (in press a).
OCEANOGRAPHIC ANDPALEOCLIMATIC SETTING
Hydraulic Piston Cores 503B-1 and 503B-2 containPleistocene to Holocene siliceous carbonate ooze, alter-nating from white to light tan (see site chapter, this vol-ume). The site lies north of the Galapagos spreadingcenter and east of the East Pacific Rise at 4°03.0' N; 95 °38.3' W, in 3672 meters of water. It is between the zonesof maximum influence of the northeast and southeasttradewinds (Molina-Cruz, 1977). Eolian materials shouldtherefore have a Central American or perhaps northernSouth American source, depending on the position of thetradewinds.
During the last glacial maximum, sea-surface temper-atures in the area were similar to modern temperatures(CLIMAP, 1976; Moore et al., 1980). Climatic model-ing suggests that the intensity of the tradewinds wasabout 20% greater during glacial times (Gates, 1976).Molina-Cruz's (1977) estimate of tradewind strength,based on quartz content of sediments, suggests that windintensities may have increased by 30 to 50%. Climaticconditions in the eolian source area during glacial timesare somewhat more problematical. Most of the temper-ate and tropical world was more arid during the heightof the last glaciation, 18,000 y. ago (Williams, 1975;Gates, 1976; Manabe and Hahn, 1977; Sarnthein, 1978;
Peterson et al., 1979). It is unclear, however, whetherthat relative aridity persisted throughout the entire gla-cial cycle. Pollen from a bog suggests that the last gla-cial was more arid than present in tropical Australia(Kershaw, 1978), but temperate Australia may have beenmore moist (Bowler et al., 1976; Webster and Streten,1978). The record of the African lakes is one of late gla-cial aridity, but moister conditions occurred throughoutmuch of early and middle Wisconsinan time (Butzer etal., 1972; Frenzel, 1973; Lamb, 1977; Street and Grove,1979). Northwest Africa may have been wetter duringglacial time (Diester-Haass, 1976). In the southwesternUnited States, there may also have been increased soilmoisture and vegetative cover during glacial times (Bra-kenridge, 1978). The climatic record of northwesternSouth America is ambiguous, but the Chilean Andeswere apparently wetter during glaciations (Peterson etal., 1979).
None of the studies of the Wisconsinian climate ad-dress Central America specifically. If that region weremore humid during glaciations, then one would expect areduced contribution of eolian materials during glacialtimes. Alternatively, a more arid climate should resultin an increased eolian component in marine sedimentsdownwind from the source. Stronger winds during theglacial ages should bring larger grains to the site of de-position—indeed, the history of wind velocity should berecorded in the grain-size curves of the eolian materials.
Sediments from Hole 5O3B may provide an unequiv-ocal record of atmospheric activity during the late Pleis-tocene glacial-interglacial intervals. The apparently eo-lian records in the cores studied by Parkin (1974) and byMolina-Cruz (1975, 1977) seem almost certainly compli-cated by the downslope or hemipelagic transport of ter-rigenous materials (ParkhVs cores were raised from thelower continental slope off Northwest Africa). The ex-cellent record of carbonate fluctuations (Fig. 1 andGardner, this volume), will allow comparison of thedata and an estimation of synchroneity or lags betweenthe CáCO3 and eolian maxima and minima. When oxy-gen isotope stratigraphy for this core is complete, theeolian record will be directly correctable with the gla-cial ice-volume record.
DATA
Calcium CarbonateFluctuations in the carbonate content of Pacific sedi-
ments were first recognized by Arrhenius (1952), whocorrelated the carbonate-rich intervals with glacial stages.He considered higher carbonate values to be the resultof increased surface-water productivity. Arrhenius (1952)assigned successive even numbers to the carbonatepeaks. Hays and others (1969) further defined the equa-torial Pacific carbonate cycles and assigned successiveodd numbers to the minima, with a B (for Bruhnes) pre-fix. The Hole 5O3B sediments, then, contain GlacialCarbonate Maxima 2, 4, 6, and 8 and Interglacial Min-ima B-3, B-5, B-7, and B-9. The record at this site ap-pears to be of unusually high quality (Fig. 1 and Gard-ner, this volume). Fluctuations in CaCO3 percentages
410
FLUCTUATION IN EOLIAN SEDIMENTATION
DBD (g/cm3) CaCOg (%)
0.25 0.45 0.65 40 60 800
Eolian (%) CaCOg-Free Eolian (%) Eolian MAR (mg/cm2/103y.) Eolian Size (0 5 Q )
10 20 30 15 25 35 45 55 20 100 180 8.8 8.6 8.4 8.2
5.0 -
6.0 L
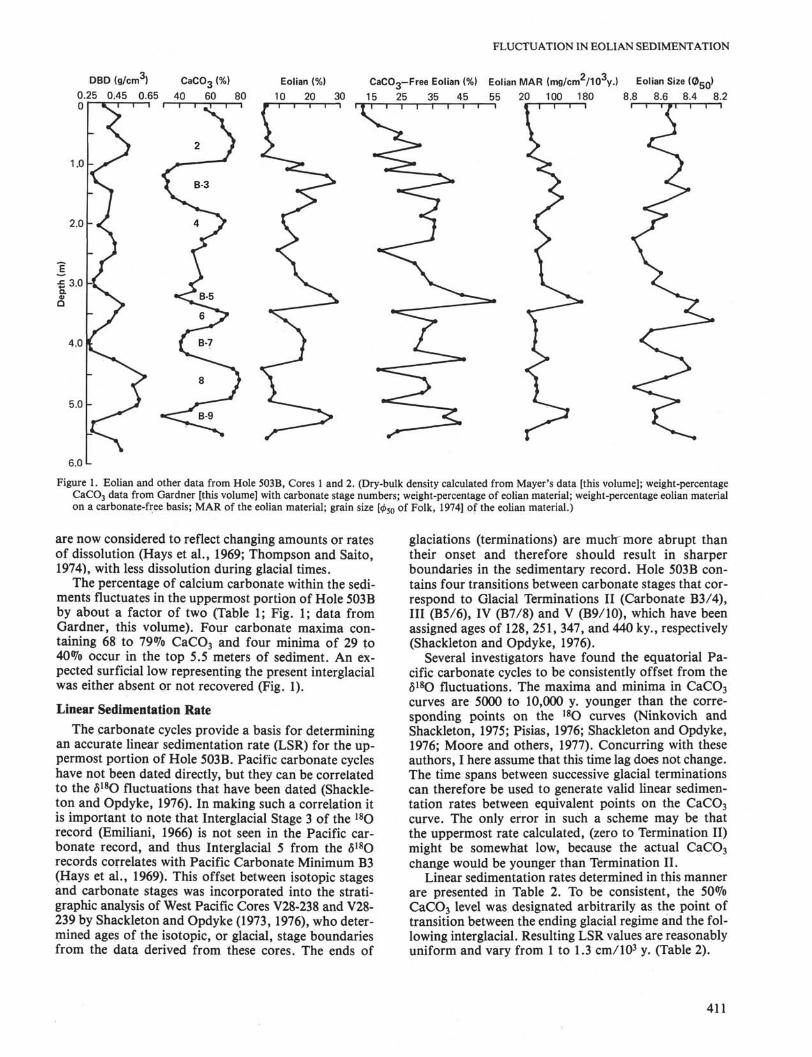
Figure 1. Eolian and other data from Hole 503B, Cores 1 and 2. (Dry-bulk density calculated from Mayer's data [this volume]; weight-percentageCaCO3 data from Gardner [this volume] with carbonate stage numbers; weight-percentage of eolian material; weight-percentage eolian materialon a carbonate-free basis; MAR of the eolian material; grain size [Φso of Folk, 1974] of the eolian material.)
are now considered to reflect changing amounts or ratesof dissolution (Hays et al., 1969; Thompson and Saito,1974), with less dissolution during glacial times.
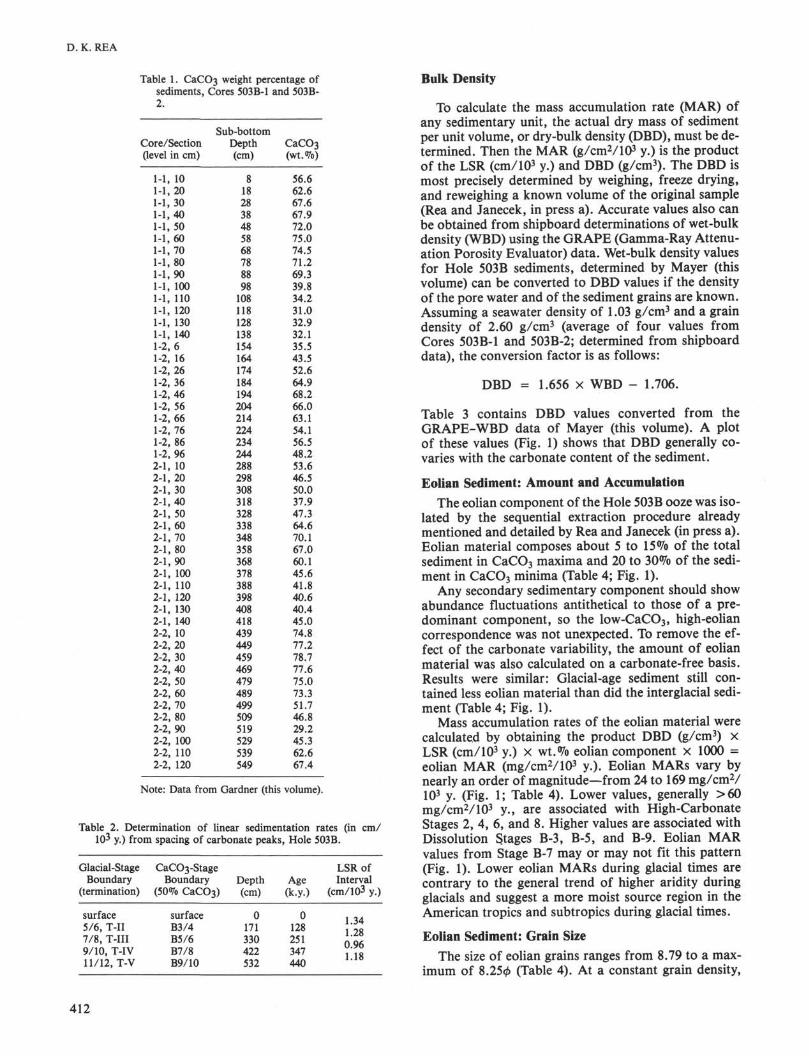
The percentage of calcium carbonate within the sedi-ments fluctuates in the uppermost portion of Hole 5O3Bby about a factor of two (Table 1; Fig. 1; data fromGardner, this volume). Four carbonate maxima con-taining 68 to 79% CaCO3 and four minima of 29 to40% occur in the top 5.5 meters of sediment. An ex-pected surficial low representing the present interglacialwas either absent or not recovered (Fig. 1).
Linear Sedimentation Rate
The carbonate cycles provide a basis for determiningan accurate linear sedimentation rate (LSR) for the up-permost portion of Hole 5O3B. Pacific carbonate cycleshave not been dated directly, but they can be correlatedto the δ 1 8 θ fluctuations that have been dated (Shackle-ton and Opdyke, 1976). In making such a correlation itis important to note that Interglacial Stage 3 of the 18Orecord (Emiliani, 1966) is not seen in the Pacific car-bonate record, and thus Interglacial 5 from the δ 1 8 θrecords correlates with Pacific Carbonate Minimum B3(Hays et al., 1969). This offset between isotopic stagesand carbonate stages was incorporated into the strati-graphic analysis of West Pacific Cores V28-238 and V28-239 by Shackleton and Opdyke (1973,1976), who deter-mined ages of the isotopic, or glacial, stage boundariesfrom the data derived from these cores. The ends of
glaciations (terminations) are muchrmore abrupt thantheir onset and therefore should result in sharperboundaries in the sedimentary record. Hole 5O3B con-tains four transitions between carbonate stages that cor-respond to Glacial Terminations II (Carbonate B3/4),III (B5/6), IV (B7/8) and V (B9/10), which have beenassigned ages of 128, 251, 347, and 440 ky., respectively(Shackleton and Opdyke, 1976).
Several investigators have found the equatorial Pa-cific carbonate cycles to be consistently offset from theδ 1 8 θ fluctuations. The maxima and minima in CaCO3
curves are 5000 to 10,000 y. younger than the corre-sponding points on the 18O curves (Ninkovich andShackleton, 1975; Pisias, 1976; Shackleton and Opdyke,1976; Moore and others, 1977). Concurring with theseauthors, I here assume that this time lag does not change.The time spans between successive glacial terminationscan therefore be used to generate valid linear sedimen-tation rates between equivalent points on the CaCO3
curve. The only error in such a scheme may be thatthe uppermost rate calculated, (zero to Termination II)might be somewhat low, because the actual CaCO3
change would be younger than Termination II.Linear sedimentation rates determined in this manner
are presented in Table 2. To be consistent, the 50%CaCO3 level was designated arbitrarily as the point oftransition between the ending glacial regime and the fol-lowing interglacial. Resulting LSR values are reasonablyuniform and vary from 1 to 1.3 cm/103 y. (Table 2).
411
D. K. REA
Table 1. CaCC>3 weight percentage ofsediments, Cores 5O3B-1 and 5O3B-2.
Core/Section(level in cm)
1-1, 101-1, 201-1, 301-1,401-1, 501-1,601-1, 701-1, 801-1,901-1, 1001-1, 1101-1, 1201-1, 1301-1, 1401-2,61-2, 161-2, 26-2, 36-2,46-2, 56-2,66-2,76-2, 86-2,96
2-1, 102-1, 202-1, 302-1,402-1, 502-1,602-1, 702-1, 802-1,902-1, 1002-1, 1102-1, 1202-1, 1302-1, 1402-2, 102-2, 202-2, 302-2,402-2, 502-2, 602-2, 702-2, 802-2,902-2, 1002-2, 1102-2, 120
Sub-bottomDepth(cm)
8182838485868788898108118128138154164174184194204214224234244288298308318328338348358368378388398408418439449459469479489499509519529539549
CaCO3
(wt.%)
56.662.667.667.972.075.074.571.269.339.834.231.032.932.135.543.552.664.968.266.063.154.156.548.253.646.550.037.947.364.670.167.060.145.641.840.640.445.074.877.278.777.675.073.351.746.829.245.362.667.4
Note: Data from Gardner (this volume).
Table 2. Determination of linear sedimentation rates (in cm/Iθ3 y.) from spacing of carbonate peaks, Hole 5O3B.
Glacial-StageBoundary
(termination)
CaCθ3-StageBoundary
(50% CaCθ3)Depth(cm)
Age(k.y.)
LSRofInterval
(cm/lθ3 y.)
surface5/6, T-II7/8, T-III9/10, T-IV11/12, T-V
surfaceB3/4B5/6B7/8B9/10
0171330422532
0128251347440
1.341.280.961.18
Bulk Density
To calculate the mass accumulation rate (MAR) ofany sedimentary unit, the actual dry mass of sedimentper unit volume, or dry-bulk density (DBD), must be de-termined. Then the MAR (g/cm2/103 y.) is the productof the LSR (cm/103 y.) and DBD (g/cm3). The DBD ismost precisely determined by weighing, freeze drying,and reweighing a known volume of the original sample(Rea and Janecek, in press a). Accurate values also canbe obtained from shipboard determinations of wet-bulkdensity (WBD) using the GRAPE (Gamma-Ray Attenu-ation Porosity Evaluator) data. Wet-bulk density valuesfor Hole 5O3B sediments, determined by Mayer (thisvolume) can be converted to DBD values if the densityof the pore water and of the sediment grains are known.Assuming a seawater density of 1.03 g/cm3 and a graindensity of 2.60 g/cm3 (average of four values fromCores 5O3B-1 and 503B-2; determined from shipboarddata), the conversion factor is as follows:
DBD = 1.656 × WBD - 1.706.
Table 3 contains DBD values converted from theGRAPE-WBD data of Mayer (this volume). A plotof these values (Fig. 1) shows that DBD generally co-varies with the carbonate content of the sediment.
Eolian Sediment: Amount and AccumulationThe eolian component of the Hole 503 B ooze was iso-
lated by the sequential extraction procedure alreadymentioned and detailed by Rea and Janecek (in press a).Eolian material composes about 5 to 15% of the totalsediment in CaCO3 maxima and 20 to 30% of the sedi-ment in CaCO3 minima (Table 4; Fig. 1).
Any secondary sedimentary component should showabundance fluctuations antithetical to those of a pre-dominant component, so the low-CaCO3, high-eoliancorrespondence was not unexpected. To remove the ef-fect of the carbonate variability, the amount of eolianmaterial was also calculated on a carbonate-free basis.Results were similar: Glacial-age sediment still con-tained less eolian material than did the interglacial sedi-ment (Table 4; Fig. 1).
Mass accumulation rates of the eolian material werecalculated by obtaining the product DBD (g/cm3) ×LSR (cm/103 y.) × wt.% eolian component × 1000 =eolian MAR (mg/cmVIO3 y.). Eolian MARs vary bynearly an order of magnitude—from 24 to 169 mg/cm2/I03 y. (Fig. 1; Table 4). Lower values, generally >60mg/cm2/103 y., are associated with High-CarbonateStages 2, 4, 6, and 8. Higher values are associated withDissolution Stages B-3, B-5, and B-9. Eolian MARvalues from Stage B-7 may or may not fit this pattern(Fig. 1). Lower eolian MARs during glacial times arecontrary to the general trend of higher aridity duringglacials and suggest a more moist source region in theAmerican tropics and subtropics during glacial times.
Eolian Sediment: Grain SizeThe size of eolian grains ranges from 8.79 to a max-
imum of 8.250 (Table 4). At a constant grain density,
412
FLUCTUATION IN EOLIAN SEDIMENTATION
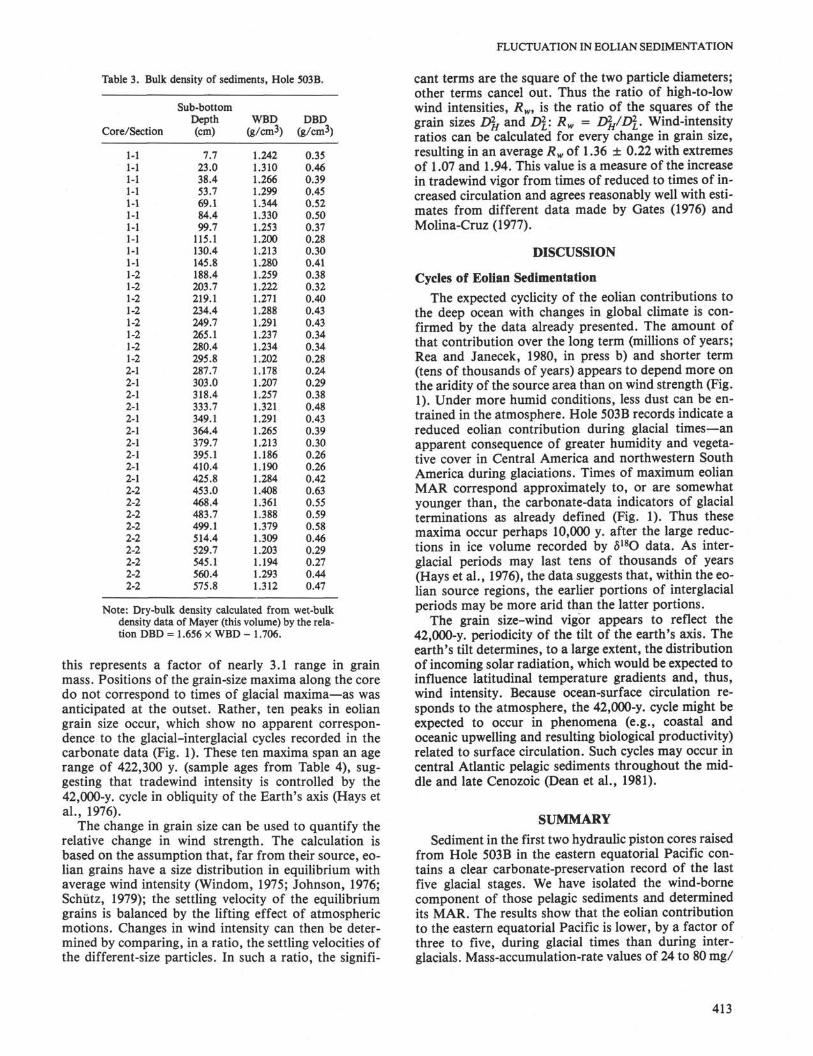
Table 3. Bulk density of sediments, Hole 5O3B.
Core/Section
1-11-11-]1-]1-]1-]1-11-11-11-1-21-21-21-21-21-21-21-22-12-12-12-12-12-12-12-12-12-12-22-22-22-22-22-22-22-22-2
Sub-bottomDepth(cm)
7.723.038.453.769.184.499.7
115.1130.4145.8188.4203.7219.1234.4249.7265.1280.4295.8287.7303.0318.4333.7349.1364.4379.7395.1410.4425.8453.0468.4483.7499.1514.4529.7545.1560.4575.8
WBD(g/cm3)
1.2421.3101.2661.299
.344
.330
.253
.200
.213
.280
.259
.222
.2711.2881.2911.237.234.202.178.207.257.321.291.265
1.2131.1861.1901.2841.4081.3611.3881.3791.3091.2031.1941.2931.312
DBD(g/cm3)
0.350.460.390.450.520.500.370.280.300.410.380.320.400.430.430.340.340.280.240.290.380.480.430.390.300.260.260.420.630.550.590.580.460.290.270.440.47
Note: Dry-bulk density calculated from wet-bulkdensity data of Mayer (this volume) by the rela-tion DBD = 1.656 × WBD - 1.706.
this represents a factor of nearly 3.1 range in grainmass. Positions of the grain-size maxima along the coredo not correspond to times of glacial maxima—as wasanticipated at the outset. Rather, ten peaks in eoliangrain size occur, which show no apparent correspon-dence to the glacial-interglacial cycles recorded in thecarbonate data (Fig. 1). These ten maxima span an agerange of 422,300 y. (sample ages from Table 4), sug-gesting that tradewind intensity is controlled by the42,000-y. cycle in obliquity of the Earth's axis (Hays etal., 1976).
The change in grain size can be used to quantify therelative change in wind strength. The calculation isbased on the assumption that, far from their source, eo-lian grains have a size distribution in equilibrium withaverage wind intensity (Windom, 1975; Johnson, 1976;Schütz, 1979); the settling velocity of the equilibriumgrains is balanced by the lifting effect of atmosphericmotions. Changes in wind intensity can then be deter-mined by comparing, in a ratio, the settling velocities ofthe different-size particles. In such a ratio, the signifi-
cant terms are the square of the two particle diameters;other terms cancel out. Thus the ratio of high-to-lowwind intensities, Rw, is the ratio of the squares of thegrain sizes Djj and E(\\ Rw = LPH/DL Wind-intensityratios can be calculated for every change in grain size,resulting in an average Rw of 1.36 ± 0.22 with extremesof 1.07 and 1.94. This value is a measure of the increasein tradewind vigor from times of reduced to times of in-creased circulation and agrees reasonably well with esti-mates from different data made by Gates (1976) andMolina-Cruz (1977).
DISCUSSION
Cycles of Eolian SedimentationThe expected cyclicity of the eolian contributions to
the deep ocean with changes in global climate is con-firmed by the data already presented. The amount ofthat contribution over the long term (millions of years;Rea and Janecek, 1980, in press b) and shorter term(tens of thousands of years) appears to depend more onthe aridity of the source area than on wind strength (Fig.1). Under more humid conditions, less dust can be en-trained in the atmosphere. Hole 5O3B records indicate areduced eolian contribution during glacial times—anapparent consequence of greater humidity and vegeta-tive cover in Central America and northwestern SouthAmerica during glaciations. Times of maximum eolianMAR correspond approximately to, or are somewhatyounger than, the carbonate-data indicators of glacialterminations as already defined (Fig. 1). Thus thesemaxima occur perhaps 10,000 y. after the large reduc-tions in ice volume recorded by δ 1 8θ data. As inter-glacial periods may last tens of thousands of years(Hays et al., 1976), the data suggests that, within the eo-lian source regions, the earlier portions of interglacialperiods may be more arid than the latter portions.
The grain size-wind vigor appears to reflect the42,000-y. periodicity of the tilt of the earth's axis. Theearth's tilt determines, to a large extent, the distributionof incoming solar radiation, which would be expected toinfluence latitudinal temperature gradients and, thus,wind intensity. Because ocean-surface circulation re-sponds to the atmosphere, the 42,000-y. cycle might beexpected to occur in phenomena (e.g., coastal andoceanic upwelling and resulting biological productivity)related to surface circulation. Such cycles may occur incentral Atlantic pelagic sediments throughout the mid-dle and late Cenozoic (Dean et al., 1981).
SUMMARY
Sediment in the first two hydraulic piston cores raisedfrom Hole 503 B in the eastern equatorial Pacific con-tains a clear carbonate-preservation record of the lastfive glacial stages. We have isolated the wind-bornecomponent of those pelagic sediments and determinedits MAR. The results show that the eolian contributionto the eastern equatorial Pacific is lower, by a factor ofthree to five, during glacial times than during inter-glacials. Mass-accumulation-rate values of 24 to 80 mg/
413
D K.REA
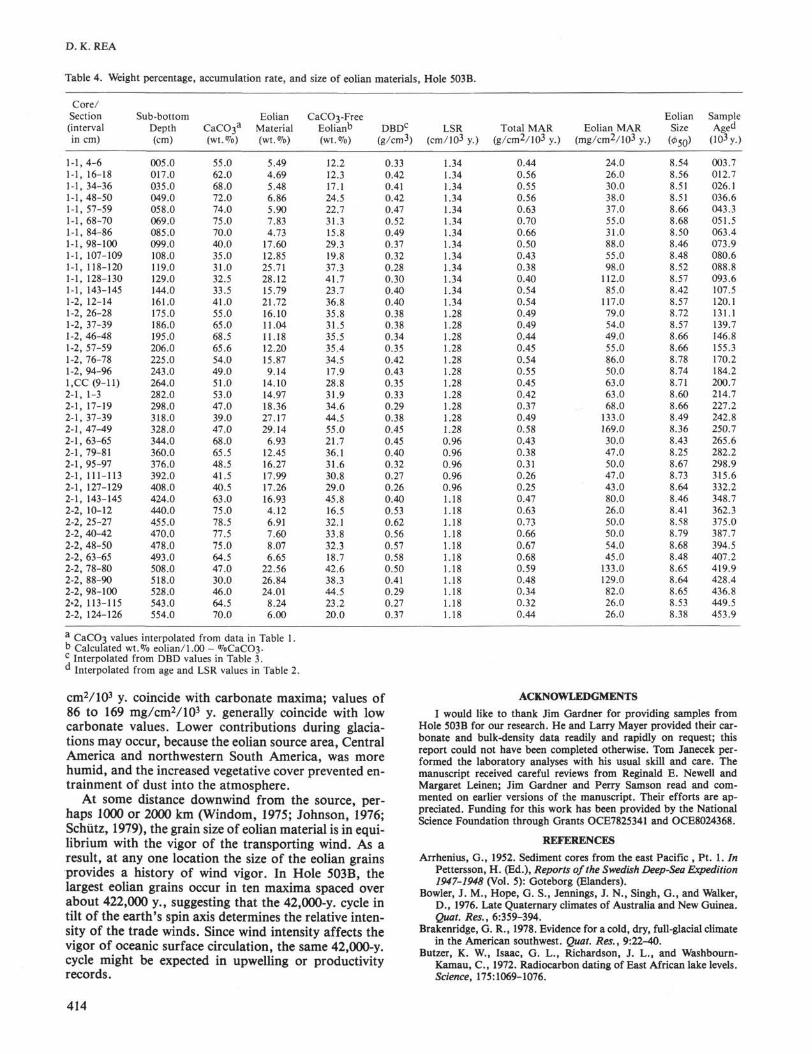
Table 4. Weight percentage,
Core/Section(intervalin cm)
1-1,4-61-1, 16-181-1, 34-361-1,48-501-1, 57-591-1, 68-701-1, 84-861-1, 98-1001-1, 107-1091-1, 118-1201-1, 128-1301-1, 143-1451-2, 12-141-2, 26-281-2, 37-391-2, 46-481-2, 57-591-2, 76-781-2, 94-961,CC(9-11)2-2-2-2-2-2-2-2-2-
, 1-3, 17-19
I, 37-39, 47-49, 63-65, 79-81, 95-97, 111-113, 127-129
2-1, 143-1452-2, 10-122-2, 25-272-2, 40-422-2, 48-502-2, 63-652-2, 78-802-2, 88-902-2, 98-1002'2, 113-1152-2, 124-126
Sub-bottomDepth(cm)
005.0017.0035.0049.0058.0069.0085.0099.0108.0119.0129.0144.0161.0175.0186.0195.0206.0225.0243.0264.0282.0298.0318.0328.0344.0360.0376.0392.0408.0424.0440.0455.0470.0478.0493.0508.0518.0528.0543.0554.0
accumulation rate, and size of eolian materials,
CaCO 3
a
(wt.%)
55.062.068.072.074.075.070.040.035.031.032.533.541.055.065.068.565.654.049.051.053.047.039.047.068.065.548.541.540.563.075.078.577.575.064.547.030.046.064.570.0
EolianMaterial(wt.%)
5.494.695.486.865.907.834.73
17.6012.8525.7128.1215.7921.7216.1011.0411.1812.2015.879.14
14.1014.9718.3627.1729.14
6.9312.4516.2717.9917.2616.934.126.917.608.076.65
22.5626.8424.01
8.246.00
CaCC^-FreeEolianb(wt.%)
12.212.317.124.522.731.315.829.319.837.341.723.736.835.831.535.535.434.517.928.831.934.644.555.021.736.131.630.829.045.816.532.133.832.318.742.638.344.523.220.0
DBDC
(g/cm3)
0.330.420.410.420.470.520.490.370.320.280.300.400.400.380.380.340.350.420.430.350.330.290.380.450.450.400.320.270.260.400.530.620.560.570.580.500.410.290.270.37
Hole 5O3B.
LSR(cm/103 y.)
1.341.341.341.34
.34
.34
.34
.34
.34
.34
.34
.34
.34
.28
.28
.28
.28
.28
.28
.28
.28
.28
.28
.280.960.960.960.960.961.181.181.181.181.181.181.181.181.181.181.18
Total MAR(g/cm2/103 y.)
0.440.560.550.560.630.700.660.500.430.380.400.540.540.490.490.440.450.540.550.450.420.370.490.580.430.380.310.260.250.470.630.730.660.670.680.590.480.340.320.44
Eolian MAR(mg/cm2/103 y.)
24.026.030.038.037.055.031.088.055.098.0
112.085.0
117.079.054.049.055.086.050.063.063.068.0
133.0169.030.047.050.047.043.080.026.050.050.054.045.0
133.0129.082.026.026.0
EolianSize
«>5θ)
8.548.568.518.518.668.688.508.468.488.528.578.428.578.728.578.668.668.788.748.718.608.668.498.368.438.258.678.738.648.468.418.588.798.688.488.658.648.658.538.38
SampleAged
(103y.)
003.7012.7026.1036.6043.3051.5063.4073.9080.6088.8093.6107.5120.1131.1139.7146.8155.3170.2184.2200.7214.7227.2242.8250.7265.6282.2298.9315.6332.2348.7362.3375.0387.7394.5407.2419.9428.4436.8449.5453.9
a CaCC>3 values interpolated from data in Table 1.b Calculated wt.% eolian/1.00 - %CaCθ3c Interpolated from DBD values in Table 3." Interpolated from age and LSR values in Table 2.
cmVIO3 y. coincide with carbonate maxima; values of86 to 169 mg/cm2/103 y. generally coincide with lowcarbonate values. Lower contributions during glacia-tions may occur, because the eolian source area, CentralAmerica and northwestern South America, was morehumid, and the increased vegetative cover prevented en-trainment of dust into the atmosphere.
At some distance downwind from the source, per-haps 1000 or 2000 km (Windom, 1975; Johnson, 1976;Schütz, 1979), the grain size of eolian material is in equi-librium with the vigor of the transporting wind. As aresult, at any one location the size of the eolian grainsprovides a history of wind vigor. In Hole 5O3B, thelargest eolian grains occur in ten maxima spaced overabout 422,000 y., suggesting that the 42,000-y. cycle intilt of the earth's spin axis determines the relative inten-sity of the trade winds. Since wind intensity affects thevigor of oceanic surface circulation, the same 42,000-y.cycle might be expected in upwelling or productivityrecords.
ACKNOWLEDGMENTS
I would like to thank Jim Gardner for providing samples fromHole 503B for our research. He and Larry Mayer provided their car-bonate and bulk-density data readily and rapidly on request; thisreport could not have been completed otherwise. Tom Janecek per-formed the laboratory analyses with his usual skill and care. Themanuscript received careful reviews from Reginald E. Newell andMargaret Leinen; Jim Gardner and Perry Samson read and com-mented on earlier versions of the manuscript. Their efforts are ap-preciated. Funding for this work has been provided by the NationalScience Foundation through Grants OCE7825341 and OCE8024368.
REFERENCES
Arrhenius, G., 1952. Sediment cores from the east Pacific , Pt. 1. InPettersson, H. (Ed.), Reports of the Swedish Deep-Sea Expedition1947-1948 (Vol. 5): Goteborg (Elanders).
Bowler, J. M., Hope, G. S., Jennings, J. N., Singh, G., and Walker,D., 1976. Late Quaternary climates of Australia and New Guinea.Quat. Res., 6:359-394.
Brakenridge, G. R., 1978. Evidence for a cold, dry, full-glacial climatein the American southwest. Quat. Res., 9:22-40.
Butzer, K. W., Isaac, G. L., Richardson, J. L., and Washbourn-Kamau, C , 1972. Radiocarbon dating of East African lake levels.Science, 175:1069-1076.
414
FLUCTUATION IN EOLIAN SEDIMENTATION
CLIMAP Project Members, 1976. The surface of the ice-age earth.Science, 191:123-137.
Dean, W. E., Gardner, J. V., and Cepek, P., 1981. Tertiary carbonate-dissolution cycles on the Sierra Leone Rise, eastern EquatorialAtlantic Ocean. Mar. Geol., 39:81-101.
Diester-Haass, L., 1976. Late Quaternary climatic variations in North-west Africa deduced from East Atlantic sediment cores. Quat.Res., 6:299-314.
Folk, R. L., 1974. Petrology of Sedimentary Rocks: Austin, Tex.(Hempthill).
Frenzel, B., 1973. Climatic Fluctuations of the Ice Age: Cleveland(Case Western Reserve Press).
Gates, W. L., 1976. Modeling the ice-age climate. Science, 191:1138-1144.
Hays, J. D., Imbrie, J., and Shackleton, N. J., 1976. Variations inthe earth's orbit: Pacemaker of the Ice Ages. Science, 194:1121-1132.
Hays, J. D., Saito, T., Opdyke, N. D., and Burckle, L. H., 1969.Pleistocene-Pliocene sediments of the Equatorial Pacific: Theirpaleomagnetic, biostratigraphic, and climatic record. Geol. Soc.Am. Bull., 80:1481-1514.
Janecek, T. R., Rea, D. K., Pisias, N. G., and Leinen, M., 1980. Ceno-zoic eolian input to the Northeastern Pacific Ocean, data fromcore LL-44-GPC-3. Geol. Soc. Am. Abstract with Programs,12:455. (Abstract)
Johnson, L. R., 1976. Particle-size fractionation of eolian dusts dur-ing transport and sampling. Mar. Geol., 21:M17-M21.
, 1979. Mineralogical dispersal patterns of North Atlanticdeep-sea sediments with particular reference to eolian dusts. Mar.Geol., 29:334-345.
Kershaw, A. P., 1978. Record of last interglacial-glacial cycle fromnortheastern Queensland. Nature, 272:159-161.
Lamb, H. H., 1977. Climate Past, Present, and Future, Volume 2,Climatic History and the Future: London (Methuen).
Leinen, M., 1979. Biogenic silica sedimentation in the equatorial Pa-cific during the Cenozoic and its implications for paleoceanog-raphy. Geol. Soc. Am. Bull., 90:1310-1376.
Leinen, M., and Heath, G. R., in press. Sedimentary indicators ofatmospheric circulation in the Northern Hemisphere during theCenozoic. Palaeogeog. Palaeoclimatol. Palaeoecol.
Lisitzin, A. P., 1972. Sedimentation in the World Ocean. Society ofEconomic Paleontologists and Mineralogists, Special Publication17: Tulsa (Society of Economic Paleontologists and Mineralo-gists).
Manabe, S., and Hahn, D. G., 1977. Simulation of the tropical climateof an ice age. J. Geophys. Res., 82:3889-3911.
Mikkelsen, N., 1978. Preservation of diatoms in glacial to Holocenedeep-sea sediments of the equatorial Pacific. Geology, 6:553-555.
Molina-Cruz, A., 1975. Paleo-oceanography of the subtropical south-eastern Pacific during late Quaternary: A study of Radiolaria, opaland quartz contents of deep-sea sediments [M.S. thesis]. OregonState University.
, 1977. The relation of the southern trade winds to upwellingprocesses during the last 75,000 years. Quat. Res., 8:324-339.
Molina-Cruz, A., and Price, P., 1977. Distribution of opal and quartzon the ocean floor of the subtropical southeastern Pacific. Geol-ogy, 5:81-84.
Moore, T. C , Jr., Burckle, L. H., Geitzenauer, K., Luz, B., Molina-Cruz, A., Robertson, J. H., Sachs, H., Sancetta, C , Thiede, J.,Thompson, P., and Wenkam, C , 1980. The reconstruction of sea-surface temperatures in the Pacific Ocean of 18,000 B.P. Mar.Micropaleontol., 5:215-247.
Moore, T. C , Jr., Pisias, N. G., and Heath, G. R., 1977. Climatechanges and lags in Pacific carbonate preservation, sea-surfacetemperature, and global ice volume. In Anderson, N. R., and Ma-lahoff, A. (Eds.), The Fate of Fossil Fuel CO2 in the Oceans: NewYork (Plenum), pp. 145-165.
Ninkovich, D., and Shackleton, N. J., 1975. Distribution, strati-graphic position, and age of ash layer "L" in the Panama Basinregion. Earth Planet. Sci. Lett., 27:20-34.
Parkin, D. W., 1974. Trade winds during the glacial cycles. Proc. R.Soc. London Ser. A, 337:73-100.
Parkin, D. W., and Padgham, R. C , 1975. Further studies on tradewinds during the glacial cycles. Proc. R. Soc. London Ser. A, 346:345-360.
Parkin, D. W., and Shackleton, N. J., 1973. Trade winds and temper-ature correlations down a deep sea core off the Saharan coast. Na-ture, 245:455-457.
Peterson, G. M., Webb, T., Ill, Kutzbach, J. E., van der Hammen,T., Wijmstra, T. A., and Street, F. A., 1979. The continental rec-ord of environmental conditions at 18,000 yr B.P.: An initial eval-uation. Quat. Res., 12:47-82.
Pisias, N. G., 1976. Late Quaternary variations in sedimentation ratein the Panama Basin and the identification of orbital frequenciesin carbonate and opal deposition rates. In Cline, R. M., and Hays,J. D. (Eds.), Investigation of Late Quaternary Paleoceanographyand Paleoclimatology: Geological Society of America Memoir145: Boulder (Geological Society of America). 375-391.
Prospero, J. M., and Bonatti, E., 1969. Continental dust in the atmos-phere of the eastern equatorial Pacific. / . Geophys. Res., 74:3362-3371.
Prospero, J. M., Glaccum, R. A., and Nees, R. T., 1981. Atmospherictransport of soil dust from Africa to South America. Nature, 289:570-572.
Rea, D. K., and Harrsch, E. C , in press. Mass accumulation rates ofthe non-authigenic, inorganic, crystalline (eolian) component ofdeep-sea sediments from the Hess Rise, DSDP Sites 464, 465, and466. In Thiede, J., T. L. Valuer, et al., Init. Repts. DSDP, 62:Washington (U.S. Govt. Printing Office).
Rea, D. K., and Janecek, T. R., 1980. Grain size and accumulationrate of the eolian component of some North Pacific sediments.Trans. Am. Geophys. Union, 61:257. (Abstract)
, in press a. Mass accumulation rates of the non-authigenic,inorganic, crystalline (eolian) component of deep-sea sedimentsfrom the western mid-Pacific mountains, DSDP Site 463. InThiede, J., T. L. Valuer, et al., Init. Repts. DSDP, 62: Washington(U.S. Govt. Printing Office).
., in press b. Late Cretaceous history of eolian deposition inthe Mid-Pacific Mountains, central North Pacific Ocean. Palaeo-geog. Palaeoclimatol. Palaeoecol.
Rex, R. W., and Goldberg, E. D., 1958. Quartz contents of pelagicsediments of the Pacific Ocean. Tellus, 10:153-159.
Sarnthein, 1978. Sand deserts during glacial maximum and climaticoptimum. Nature, 272:43-46.
Savoie, D. L., and Prospero, J. M., 1980. Water-soluble potassium,calcium, and magnesium in aerosols over the tropical North At-lantic. /. Geophys. Res., 85:385-392.
Schütz, L., 1979. Sahara dust transport over the North Atlantic Ocean—model calculations and measurements. In Morales, C. (Ed.), Sa-haran Dust Mobilization Transport Deposition: New York (JohnWiley), pp. 267-277.
Shackleton, N. J., and Opdyke, N. D., 1973. Oxygen isotope and pa-leomagnetic stratigraphy of equatorial Pacific core V28-238: Oxy-gen isotope temperatures and ice volumes on a I05 and I06 yearscale. Quat. Res., 3:39-55.
, 1976. Oxygen isotope and paleomagnetic stratigraphy ofPacific core V28-239, Late Pliocene to latest Pleistocene. In Cline,R. M., and Hays, J. D. (Eds.), Investigations of Late QuaternaryPaleoceanography and Paleoclimatology. Geological Society ofAmerican Memoir 145: Boulder (Geological Society of America),449-464.
Street, F. A., and Grove, A. T., 1979. Global maps of lake-level fluc-tuations since 30,000 yr B.P. Quat. Res., 12:83-118.
Thiede, J., 1979. Wind regimes over the Late Quaternary southwestPacific Ocean. Geology, 7:259-262.
Thompson, P. R., and Saito, T., 1974. Pacific Pleistocene sediments:Planktonic foraminifera dissolution cycles and geochronology.Geology, 2:333-335.
Webster, P. J.', and Streten, N. A., 1978. Late Quaternary ice age cli-mates of tropical Australasia: Interpretations and reconstructions.Quat. Res., 10:279-309.
Williams, M. A. J., 1975. Late Pleistocene tropical aridity syn-chronous in both hemispheres? Nature, 253:617-618.
Windom, H. L., 1969. Atmospheric dust records in permanent snowfields: Implications to marine sedimentation. Geol. Soc. Am.Bull., 80:761-782.
, 1975. Eolian contributions to marine sediments. J. Sedi-ment. Petrol., 45:520-529.
415