Embed Size (px)
Citation preview

McKenzie, J.A., Davies, PJ., Palmer-Julson, A., et al., 1993Proceedings of the Ocean Drilling Program, Scientific Results, Vol. 133
15. SEDIMENTARY RHYTHMS AND CLIMATIC FORCING OF PLEISTOCENE-HOLOCENEMIXED CARBONATE/SILICICLASTIC SEDIMENTS OFF THE GREAT BARRIER REEF1
Craig R. Glenn,2 Dick Kroon,3 and Wuchang Wei4
ABSTRACT
Sediments recovered from the upper-slope and outer-shelf Great Barrier Reef transect (Ocean Drilling Program Leg 133, Sites819 through 821) contain a high-resolution, 1.5-m.y. record of mixed siliciclastic and carbonate sedimentation. More than 30multimeter-scale couplets of fining- and coarsening-upward sediments having varying proportions of carbonate and authigenicglauconite are present. These couplets stack into cyclic bundles observed in carbonate and magnetic susceptibility data that, in turn,vary systematically with respect to systems tract development deduced from sequence-stratigraphic analysis. At Site 821, thesebundles and their variations clearly track relative changes in sea level for the past ~ 1.48 m.y. The data presented suggest that thesevarious levels of cyclicity are expressed as the result of high sedimentation rates along the margin and that the dominant control ontheir development has been climate variations that modulated variations in sea level and terrigenous influx. The average durationof many of these cycles is in the Milankovitch waveband and is related to both fourth- (102-443 ka) and fifth-order (34-88 ka)cycles of sea-level change. These cycles are examined with respect to their lithology (color, percentage of total foraminifers, bioclasts,siliciclastics, authigenic glauconite, nannofossils, and tunicates), sequence stratigraphy, downhole log characteristics, magneticsusceptibility, and percentage of carbonate. Time series and Fourier transform results from high-resolution magnetic susceptibilityand sonic velocity data suggest strong orbital forcing of the sedimentary cycles, although with differing intensities for differentdepositional packages and time frames. Magnetic susceptibility/carbonate cycles are interpreted as pulses of deposition offine-grained siliciclastics during times of maximum flooding (along downlapped surfaces) and subsequent highstand progradation.These pulses dilute carbonate and contain fine-grained magnetically susceptible detrital minerals.
INTRODUCTION
Throughout the past 2 m.y. (cf. Hays et al., 1976), and probablyduring much of the Phanerozoic record at least (e.g., Berger et al.,1984; Einsele et al., 1991; Fischer and Bottjer, 1992), the majormechanism for changing global climate on time scales between10,000 and 500,000 yr appears to have been changes in the distribu-tion of solar energy by latitude and by season, as dictated by threemaster orbital variables. These are 41-k.y. obliquity cycles of changesin the inclination (tilt) of the EartiYs rotational axis, 100- and 413-k.y.eccentricity cycles of the changing shape of the Earth's orbit aroundthe sun (from circular to more elliptical), and 19- and 23-k.y. preces-sion cycles. The last-mentioned are related to changing distancebetween the Earth and the sun at any given season and are modulatedby the waxing and waning of the cycles of eccentricity. The effects ofall orders of orbital forcing now have been well documented in thedeep-marine record (cf. Imbrie et al., 1984, 1989) and in terrestrialrecords as well (cf. Glenn and Kelts, 1991, for summary).
This study analyzes the nature of cyclic marine sedimentationrecovered from the Great Barrier Reef (GBR) transect of OceanDrilling Program (ODP) Leg 133 (Sites 819 through 821). For ourpurposes, the cycles and rhythms discussed here have been groupedinto packages representing particular orders of duration (Table 1). Ourapproach is similar to that of Roof et al. (1991) for the Gulf of Mexico(Site 625) in that we attempt to analyze data collected not from thedeep sea but, rather, from a relatively shallow-water, mixed carbon-ate/siliciclastic depositional setting lying adjacent to a passive conti-nental margin. Our data set differs significantly from Roof et al.'s andother data sets, however, in that we are analyzing sedimentary cyclic-
McKenzie, J.A., Davies, PJ., Palmer-Julson, A., et al., 1993. Proc. ODP, Sci. Results,133: College Station, TX (Ocean Drilling Program).
2 Department of Geology and Geophysics, School of Ocean and Earth Science andTechnology, University of Hawaii, Honolulu, HI 96822, U.S.A.
3 Department of Geology and Geophysics, University of Edinburgh, Edinburgh, EH93JW, United Kingdom.
4 Scripps Institution of Oceanography, La Jolla, CA, 92093, U.S.A.
ity from a section that was deposited at very high rates (>IOOO m/m.y.)and contains a complicated, mixed assemblage of both open-marineand shallow-water-dwelling organisms, sand- to clay-sized siliciclas-tic materials, fining- and coarsening-upward cycles, and authigenicmineral phases.
Here, we document and interpret the cyclicity present in seismic,sedimentologic, geochemical, magnetic, and downhole-logging datain terms of their causal mechanisms. These cycles are examined withrespect to their lithology (color, percentage of total foraminifers,bioclasts, siliciclastics, authigenic glauconite, nannofossils, and tuni-cates), sequence stratigraphy, downhole log characteristics, magneticsusceptibility, and carbonate content. We first describe the generalnature of the cycles and then apply statistical approaches to thehigh-resolution portions of the data set to examine their underlyingperiodicities. Variations of climate at low latitudes, such as off thenorthern GBR, are thought to be dominated by eccentricity andprecessional cycles. This is due to both the diminished effect ofobliquity changes and the increased importance of monsoons at lowlatitudes. Through regulation of the heating intensity of continentalmasses, orbital precession influences rates of precipitation on 19- and23-k.y. periods by altering the intensity of low-pressure cells thatdrive monsoonal winds (Rossignol-Strict, 1983; Pokras and Mix,1985; Prell and Van Campo, 1986; Prell and Kutzbach, 1987). Thisprecessional control on low-latitude precipitation is modulated by theeccentricity cycle. As outlined below, however, our data suggest thatevidence for eccentricity, precession, and obliquity cycles is presentin the GBR cores and that forcing by all of these orbital rhythmsimpacts sedimentation primarily by influencing rates and magnitudeof sea-level change and, secondarily, by modulating relative rates ofterrigenous influx.
METHODS
Sedimentary cycles in cores from Sites 819 and 821 were definedby the following parameters: variations in core color; percentage totalcarbonate; percentage >63-µm fraction of glauconite, siliciclastics,and nonforaminifer bioclasts; percentage total foraminifers; percent-
189

C.R. GLENN, D. KROON, W. WEI
Table 1. Duration of sequence stratigraphic cycles (after Vail et al.,1991; Wornardt and Vail, 1991), orbital cycles, and seismic sequencespresent along the Great Barrier Reef, Sites 819-821.
Table 2. Summary of mean depths (mbsf) of biostratigraphic ho-rizons from Sites 819,820, and 821.
Order
Duration ofseq. strat.
cycle
Orbitalcycle
(period)
819-821GBR seismic
sequences
50+Ma3-50 Ma500 ka-3 Ma80 ka-500 ka30 ka-80 ka10ka-30ka
Eccentricity (413 ka, 100 ka)Obliquity (41 ka)
Precession (19 ka, 23 ka)
1,2,3,5,6,7,84, 6A, 6B, 6C
age total nannofossils; percentage total tunicates; magnetic suscepti-bility; and downhole variations in velocity, resistivity, and gamma-rayproduction (also see Glenn et al., this volume). Total carbonate andcarbon contents were determined by acidification and furnace-tiedcoulometric titration, respectively (cf. Huffman, 1977; Engleman etal., 1985). Total carbonate concentrations reported here represent acombined data set of shipboard and shore-based results. Preliminaryshipboard nannofossil determinations were augmented with exami-nation of samples spaced approximately every 1.5 m in the recoveredcores. Nannofossil smear slides were made from unprocessed sedi-ments. Magnetic susceptibility (core-log) and downhole wirelinesonic velocity and gamma-ray log data discussed here were collectedduring shipboard operations. Magnetic susceptibility and downholelogging measurements were taken about every 10 to 15 cm downcore,respectively. Most logging tools have a vertical resolution of about50 cm. Combined with the high sedimentation rates encountered atSites 819 through 821 (see below), these measurements thus providefor a near-continuous record of variations in these properties, with avertical resolution of slightly better than 1000 yr. Magnetic suscepti-bility is the ratio of induced magnetization to an applied weak mag-netic field and is proportional to magnetic mineral concentration,which is usually a trace component of the terrigenous fraction.Because of the high sample density obtained in its measurement,magnetic susceptibility measurement can thus provide a sensitive,high-resolution record of variations in terrigenous sedimentation inpelagic or carbonate-dominated settings (e.g., Kent, 1982; Mead etal., 1986; Robinson, 1986; Bloemendal et al., 1988; Doh et al., 1988;Bloemendal and deMenocal, 1989). Interpretations of the sequencestratigraphy between Sites 819 and 821 are discussed in detail inGlenn et al. (this volume).
Statistical Methods
The data obtained from Sites 819 through 821 represent a com-pound signal of cyclic sedimentation. To examine the periodicity ofthis sedimentation, a Fourier analysis was completed for variations inmagnetic susceptibility from whole-round core segments and forsonic velocity from downhole wireline data. These data sets were usedbecause they were found to show a strong correlation to other cyclicvariations observed in the cores and because they contain an essen-tially uninterrupted, very high-resolution record of these cycles. Thespectral analysis procedures (e.g., Jenkins and Watts, 1968; Davis,1986) were incorporated into a personal computer program (IGOR)that first converts the depth scale to a time scale using a linearinterpolation between the biostratigraphic control points and remov-ing larger-scale "background" trends (such as the progressive increasein velocity with depth) by fitting and then removing a third-orderpolynomial regression estimate from the data. The program thencomputes the raw spectral density estimates using a discrete Fouriertransform. When the results of these analyses are plotted, each spec-tral density plot is normalized relative to the highest power obtainedfor each window. In this way, within each plot, ratios of spectral
Datum
LO Emiliania huxleyi acmeLO Emiliania huxleyiHO Psuedoemiliania lacunosaHO Gephyrocapsa spp. C-DHO Gephyrocapsa spp. A-BHO Helicosphaera selliiHO Calcidiscus macintyrei
Age(Ma)
0.080.2750.4650.921.101.271.48
Site819
8.429.432.456.0
116.87189.2
>400
Site820
12.135.8
107.1163.6260.3271.7
>400
Site821
39.3123.1176.8270.1279.2
>400
Notes: Biostratigraphic age assignments updated from Berggren et al. (1985).The age scales calculated for these cores assume a constant sedimentationrate between each age datum. LO = lowest occurrence, HO = highestoccurrence. For more information, see Wei (this volume).
density peak heights can be compared. The program was initially runfor overlapping time windows (~200-k.y. windows with 50-k.y. over-lap) and later modified for smaller windows designed to samplespecific portions of the data set or for windows that improved theremoval of low-amplitude noise. We have restricted these analyses toSite 821 because of the large number of hiatuses and unconformitiesencountered at Site 819 (cf. Glenn et al., this volume).
RESULTS
Biostratigraphy and Sedimentation Rates
Our biostratigraphic results are presented in Table 2. Mean depthsof nannofossil datums represent the mean between the position of thehighest or lowest occurrence of the indicator species and the positionof the next highest or lowest sample in the core not containing thespecies. Because the highest occurrence of Calcidiscus macintyrei(1.48 Ma) was not found in the base of the recovered cores from Sites819, 820, or 821, we have assumed (probably wrongly) that the baseof the cores dates to 1.47 Ma for the purposes of interpolating agedata through the base of the cores. This assumes that Calcidiscusmacintyrei should be present at these sites, likely underestimates theages at the bottom of the cores, and, thus, underestimates sedimenta-tion rates below the 1.27 Ma datum. This assumption does, however,allow us to attempt to extract data on the periodicity of the cyclicityfor the intervals of the cores greater than 1.27 Ma. The significanceof this assumption is discussed more fully below.
In Hole 819A, sedimentation rates are high and variable (Fig. 1)and range from a low value of 15.8 Bubnoffs (millimeters/thousandyears = meters/million years) associated with an unconformity (at thesequence boundary separating seismic Sequences 2 and 5; Fig. 2) to>1054 Bubnoffs below 189 mbsf. These sedimentation rates are highrelative to most hemipelagic depositional settings but are comparableto those typical of many highly productive reef and carbonate periplat-form environments (cf. Enos, 1991). In Hole 821A, sedimentationrates vary from a low of 53 Bubnoffs, associated with an uncon-formity at the sequence boundary separating seismic Sequences 7 and8, to a high of >575 Bubnoffs for Sequences 8 and 9 at the base of thecore (Figs. 1 and 3).
Upward-Coarsening and -Fining Cycles
Subtle rhythmic couplets of strata are identifiable throughout therecovered GBR section, but with decreasing resolution with increasingage. At Site 819 more than 30 rhythmic couplets are identified by ageneral coarsening upward from clay-rich, dark greenish-gray oozesthrough relatively carbonate-rich, commonly bioclastic greenish-grayoozes to wackestones (Figs. 2 and 4). Carbonate concentrations, mag-netic susceptibilities, and wireline logs generally track the rhythmicityof these sedimentation couplets, and all were used as aids for refining
190

SEDIMENTARY RHYTHMS AND CLIMATIC FORCING OF SEDIMENTS
the positions and transitions of these cycles downhole. ThroughoutSite 819, the upward-coarsening sequences of these cycles are char-acterized by dark green oozes subtly passing upward into lighter greenoozes/wackestones, which reflect upward-decreasing proportions ofsiliciclastic muds and increasing proportions of relatively shallow-water, bioclastic detritus. The basal clay, quartz, and feldspar-richhalf-couplets of each cycle may relate to enhanced terrigenous influxduring relative decreases in sea level. The coarser upper portion ofeach cycle corresponds to relative increases in sea level when neriticcarbonate production was a maximum and its detritus was shedtoward the basin. This interpretation is in keeping with recent studiesthat relate increases in carbonate production and basin filling duringinterglacial episodes (cf. Droxler and Schlager, 1985; Boardman etal., 1986) but is unlike that for coarsening-upward sequences typify-ing many shoaling terrigenous-dominated settings (e.g., progradingwave-dominated clastic shorelines or interregional fluviodeltaic sys-tems). In contrast, the sedimentary rhythms developed in the moreproximal setting of Site 821 are dominated by a mixture of fining-and coarsening-upward units (Fig. 3). Units that fine upward tend todominate the upper half of the hole (-0-0.92 Ma), while coarsening-upward cycles are more common in the recovered interval below this.This upsection change from packages of coarsening-upward to fin-ing-upward cyclic sedimentation corresponds to (1) a major changein the overall seismic architecture of the margin, from a lowerprogradational bias to an upper aggradational bias (cf. Glenn et al.,and Davies et al., both this volume), (2) a change from a fully marineto a mixed terrigenous/marine source of sedimentary organic matter(Shipboard Scientific Party, 1991), (3) a marked increase in percent-age of bioclasts in the upper portion of the hole (Fig. 3), and (4) amarked decrease in the persistence and frequency of nannofossils(Fig. 3). Interestingly, percentages of shallow-water tunicates (cf.Wei, this volume) and total foraminifers transcend this boundary withlittle variation (Fig. 3).
Cyclic Bundling of Magnetic Susceptibilityand Calcium Carbonate
At both Sites 819 and 821, calcium carbonate and magneticsusceptibility variations mirror each other in that decreases in calciumcarbonate precisely correlate with increases in magnetic susceptibility(Figs. 2 and 3). This covariance results in a rhythmic bundling of thesetwo components when plotted vs. each other downcore or in crossplots. Figure 5 illustrates that, with few exceptions, the covariancebetween calcium carbonate and magnetic susceptibility is linear andnegative and, further, that reduction diagenesis has not affected thesedata. Figure 6 depicts this relationship and illustrates how the twosites relate to each other with respect to nannofossil datums, majorhiatuses and unconformities, and sequence-stratigraphic architectureat each site. The bundling record at the more distal slope Site 819 ismore jagged than at Site 821 and has been punctuated with a numberof unconformities and slump surfaces (see Glenn et al., this volume).At Site 821, where the record is most complete, the bundles oftenoccur as rhythmic alternations between large bundles (relatively highmagnetic susceptibility, low carbonate) and smaller bundles (rela-tively low magnetic susceptibility, high carbonate). In many cases,these large and small bundles tend to form couplets roughly corre-sponding to the transgressive and highstand systems tracts identifiedfrom sequence-stratigraphic analysis (Figs. 4 and 6; Glenn et al., thisvolume). There is also an upsection trend for increasing carbonatemaxima and decreasing magnetic susceptibility minima from 400 to123 mbsf, and decreasing carbonate maxima and slightly increasingmagnetic susceptibility minima from 123 to 0 mbsf. This changeoverat 123 mbsf corresponds to a remarkable maximum pinching of thebundles in seismic Sequence 5 and approximately corresponds to arapid mid-Pleistocene climate mode change toward more severe
, f \ 142.9 m/m.y.
Age of nannofossil datum (Ma)
Age of nannofossil datum (Ma)
Figure 1. Plot of depth vs. age and sedimentation rates for Holes 819A and821A from the data of Table 1. The highest accumulation rates occur in thebasal sections at both sites.
glacial climate at about 0.5 Ma (Williams et al, 1988; Ruddiman etal., 1989; Joyce et al., 1990).
Figures 2 and 3 show the relationship between the bundling ofcalcium carbonate and magnetic susceptibility variations and otherimportant sedimentologic and geochemical parameters recorded atSites 819 and 821. In most cases, these low carbonate/high suscepti-bility bundles may be interpreted as pulses of fine-grained siliciclasticinflux, predominantly in the form of silts and clays, that dilute thepercentage of calcium carbonate and at the same time contain fine-grained, magnetically susceptible detrital minerals. A typical sand-line/clayline plot of wireline gamma-ray intensity (such as routinelyemployed in siliciclastic settings) is shown in Figure 2. There, thebundling of increasing magnetic susceptibility and decreasing cal-cium carbonate covaries with increases in the percentage of finefraction (percentage "mud") and increases in downhole gamma-rayactivity. This covariation is especially true for the lower portion of thehole. In the upper portion of the hole, the bundles also appear to varyin a general way with increasing proportions of siliciclastic sands. Atthe more proximal Site 821, decreasing calcium carbonate/increasingmagnetic susceptibility bundles clearly correlate with pulses of sedi-mentation marked by increases in glauconite (and minor siderite andiron oxyhydroxides), sand-sized detrital siliciclastics, and sand-sized(nonforaminiferal) bioclasts (Fig. 3). There, iron-bearing glauconiteappears to be providing another important source of magnetization tothe sediments. Thus, surprisingly, the source of the variations inmagnetic susceptibility at these closely related sites appears to stemfrom two principal sources that tend to dominate each: detrital claysand iron compounds at Site 819, and detrital clays and (iron-bearing)glauconite at Site 821. In addition, the relationship of these bundlesto sequence-stratigraphic architectures is especially clear at Site 821(Fig. 3; also see Glenn et al., this volume); the carbonate/magneticsusceptibility bundles correlate with two discrete phases during thedevelopment of each transgressive systems tract/highstand systemstract couplet, one in association with downlapped maximum floodingsurfaces when clays reach a maxima, and the other with late highstand
191
úD oh
Mud
(%)80 100
CaCOMagnetic
susceptibility
(I0"6 CGS Units)20 40 60 80 10 20 0 10
400 J<1.48Ma
>63µmBioclasts
(non-foraminifer)
20 30 40 0
>63µmSiliclastics
10 20 30
• ^ • • • • ^ —
40
C.R
. GL
EN
N, D
. KR
OO
N
Shipboardinterpretations:
Figure 2. Sedimentary, geochemical, gamma-ray, and sequence-stratigraphic data for Hole 819A. Coarsening- and fining-upward cycles are indicated from sequence-stratigraphicinterpretations from Glenn et al. (this volume). SB = sequence boundary, MFS = maximum flooding surface, TS = transgressive surface, LST = lowstand systems tract, TST =transgressive systems tract, HST = highstand systems tract. Nannofossil datums of Table 2 also are shown.
Shipboardlithostratigraphy
,UnitNo.
Seismicsequencestratigraphy
>63µmSiliclastics
IA; FU Bioclastic/siliciclastic sant to clay M P S
IB: Two FU units of sand-sized bioclasts
fining up to calcareous clay and silt
IC: Two FU units of bioclastic sands
fining up to silty clay with nannofossils
ID: Rhythmic silty clay and clayey silt
IE: CU bioclst sand; silty mud in middle
IF: Three repeated couplets of bioclastic
sand/wackestone and nanno-bioclst ooze
IG: FU Halimeda rdstn to pkstn
IIA: Pkstn capped bv elauc. chalk " ~
HB: FU Bioclastic pkstn to mdstn
IIIA: Bioclst wkstn w/ pkstn in middle
πiB: Bioclastic and Nannofossil
wackestones
IVA: Chalk w/ bioclasts & siliciclastic*
overlain by pkstn to wkstn. FU at base.
IV B: Chalk containing coarse
bioclast layer
IVC: Micritic to bioclastic chalk with
glauconitic pkstn at top
VA: CU Dark chalk w/ bioclasts and
siliclastics
VB: CU Dark bioclastic pkstn to chalk
w/ siliciclastic mud
VC: Dark calcareous silt; wispy laminae
VD: CU Pkstn to chalk; wispy laminae
VE: Calc. silt to mixed sediment Clay
& silty mud in center of unit
*FU = Fining -upward•CU = Coarsening-upward
*Not seismically
resolvable
25 45 65 85 10 20
Magneticsusceptibility( I 0 6 CGS Units)
60 40 20 0>63 µm Glauconite (%)
P = pristine glauconiteR = reworked glauconite
Biostrat.datums
Figure 3. Sedimentary, geochemical, gamma-ray, and sequence-stratigraphic data for Hole 821 A. The shipboard lithostratigraphy includes lithostratigraphic unit numbers and the positions of fining- andcoarsening-upward cycles. The sequence boundary at about 170 mbsf (-0.92 Ma) separates a largely progradational seismic package that is characterized by an abundance of coarsening-upward cycles belowfrom a largely aggradational seismic package characterized by multiple fining-upward cycles above. Sequence-stratigraphic inteΦretations are from Glenn et al. (this volume). Nannofossil datums of Table2 also are shown. See Figure 2 for key to abbreviations.

C.R. GLENN, D. KROON, W. WEI
IICOoü
::
-45%CaCO3
"75%CaCOj
• 65%CaCQj
Silt-filled burrows
UPPER HALF-COUPLETLight greenish gray
clayey nannofossil ooze withassorted shallowwater bioclasts
Contact gradational
LOWER HALF-COUPLETDark greenish gray
clayey nannofossil ooze withnumerous silt intercalations;
scattered bioclasts
72%CaCO3
Figure 4. Detail of the two half couplets composing one upward-coarseningcycle (cycle E-l at about 140 mbsf) at Hole 819A (See Fig. 2).
systems tract progradation. At Site 821, therefore, these bundles andtheir variations clearly track relative changes in sea level for the past-1.48 Ma.
Fourier Analyses
To investigate further the periodicity of the sedimentary cyclesrecovered in the Great Barrier Reef Transect, we computed a Fourieranalysis of magnetic susceptibility and downhole sonic velocity datacollected at Hole 821 A. Plots of the raw data sets vs. interpolated ageare shown in Figures 7 and 9, and Fourier analysis results are shownin Figures 8 and 9. The time scale used for the Fourier analyses wasinterpolated from the nannofossil datums presented in Table 2 andFigure 1. The time scale has not been "tuned" in any way (e.g.,Shackleton et al., 1990). Intervals initially chosen for these analyseswere based on overlapping windows of equal duration. However, ininstances where the overlapping windows crossed large steplikevariations in the data, the analysis program employed showed diffi-culty in removing low-amplitude background trends. In these cases,no significant cyclicity could be recovered from the data set. Thus,for example, following the top three overlapping windows of equalduration shown in Figure 7 (i.e., 0-200 ka, 150-350 ka, and 300-500ka), the size of the window analyzed had to be adjusted to match thoseportions of the record displaying a relatively uniform backgroundtrend to which a third-order polynomial expression could be fit andsubsequently removed. The windows selected for the fast Fourieranalyses of downhole sonic velocity variations were similarly se-lected (Fig. 9). In the following we discuss any semblance the resultsportrayed in Figures 8 and 9 have to the Milankovitch periods, as wellas to other causal mechanisms.
Fourier Transforms of Magnetic Susceptibility Data
The top three windows shown in Figure 8 are the results of fastFourier transforms for magnetic susceptibility data computed forthree equally spaced, overlapping time slices of equal duration. Thefirst two of these analyses indicate cyclicity in the data, which closelymatches the dominant periods of Milankovitch orbital variables at 100k.y./cycle (period of eccentricity), about 41 k.y./cycle (obliquity), andat 25 and 20 k.y./cycle (precession). The dominant spectral peaks in
Percent CaCO3
Figure 5. Cross plot of magnetic susceptibility and calcium carbonate for Hole821A illustrating the negative covariance between these parameters and thelack of reduction diagenetic overprinting.
these data are those of the eccentricity cycle and suggest slightly lessthan four 100-k.y. carbonate/magnetic susceptibility bundles span-ning seismic Sequences 1 through 3. The results from the other, oldertime windows analyzed, however, only show suggestions for theeccentricity cycle. The obliquity cycle is also present in these win-dows. The longest and most condensed interval analyzed covers mostof the data from seismic Sequence 5. Fourier analysis of this sequenceilluminates both the 400- and 100-k.y. eccentricity cycles, and thebroad peak at 45 k.y. also suggests the presence of the obliquity beat.The cycles of precession appear to be loosely represented by spectralpeaks that range between about 16 and 25 cycles/k, y. throughout mostof the intervals analyzed. The 41-k.y. obliquity cycle also appearsfairly well represented throughout and appears to increase in magni-tude downcore. Differences between observed and predicted peaksmay be caused by errors in sedimentation rate calculations, a likelypossibility in light of the spread of nannofossil datums that separatesthe numerous seismic sequence tracts.
The Fourier results for magnetic susceptibility also reveal a com-mon spectral peak at about 30 k.y./cycle in the intervals spanningseismic Sequences 3,4, and 6, as well as a peak at about 50 k.y./cyclein the intervals spanning seismic Sequences 3 and 6. These peaks maybe artifacts because of aliasing of the data from higher frequency"noise" in the data set (cf. Pisias and Mix, 1988), from variations insedimentation rates occurring below the resolution of our age control(cf. Pisias and Mix, 1988), or from resonance, interference, or smear-ing from neighboring frequency bands (e.g., Martinson et al., 1982,1987). However, it is also possible that some of these periods are beingproduced by depositional cyclicity operating at a cadence other thanat the unit-value Milankovitch periods. Close inspection of Figure 3shows multiple, covarying pulses in magnetic susceptibility, percent-age of carbonate, and percentage of glauconite within individual seis-mic sequences. On average, these pulses subdivide the duration ofseismic Sequences 3, 4, and 6A into periods of duration that roughlycorrespond to the -30- and 50-k.y. periods seen in the FFT results(Table 3). Also note that, within the relatively condensed interval ofseismic Sequence 5, there is one major carbonate/magnetic suscepti-bility bundle having a duration of 443 k.y. that contains four majorpulses in glauconite. These subdivide the bundle, on average, into four
194

Basinward
Sequencestratigraphy
Hole 819A
Landward
Holes 821A and 821B
CaCOj Magnetic susceptibility( % ) (10"6CGS units)
CaCO,
(%)Sequence
stratigraphy
Magnetic susceptibility
(I0" 6 CGS units)
LST-1
LST-2
LST-S
HST-&A
TST-4A
HST-6B
TSTΛBT•7
HST-I
TST-»
LST«
HST-9
TST-9
Bundle No.
Bundle No.
Figure 6. Bundles of decreasing calcium carbonate and increasing magnetic susceptibility at Holes 819A, 821A, and 821B. Also shown are the correlation of nannofossil datums from Table 2 and thecorrelation of sequence-stratigraphic interpretations (data from Glenn et al., this volume). Most of the sequences indicated are fourth-order (-100-500 k.y.) in duration, but fifth-order sequences subdividingSequence 6 also are observed. Note that Sequences 3 and 4 and the fourth-order TST-6 are missing at Site 819 and that a major unconformity can be seen between about 1.10 and 1.27 Ma at both sites.See Figure 2 for key to abbreviations.
C.R. GLENN, D. KROON, W. WEI
5 0 -
4 0 -
l 5 30-
| O 20-
4 §- 10-
"5.1
0 -
200 400 600
IntθΦolated age (Ka)
i800 1000 1200 1400
Figure 7. Plot of magnetic susceptibility vs. age for Hole 821A. Age data are those interpolated between nannofossil datums. The hemispherical curves adjacent
to the plot show the positions of age windows for fast Fourier transforms.
periods of 110 k.y. (Table 3). These durations and periods closelymatch the 400- and 11 l-k.y./cycle spectral peaks calculated for theseintervals from Fourier transforms (Fig. 8). Similarly subdivided onan average basis (Table 3), seismic Sequence 6, spanning a total dura-tion of 173 k.y., shows a variety of durations at 17, 21, and 25 k.y.,which appears to match the mean periods of orbital precession. Inlight of these potential matches, we suggest that these latter periodsmay be produced by the stacking of parasequence sets within systemstracts (see Van Wagoner et al, 1990), although further study is clearlyneeded to test this hypothesis.
Fourier Transforms of Sonic Velocity Data
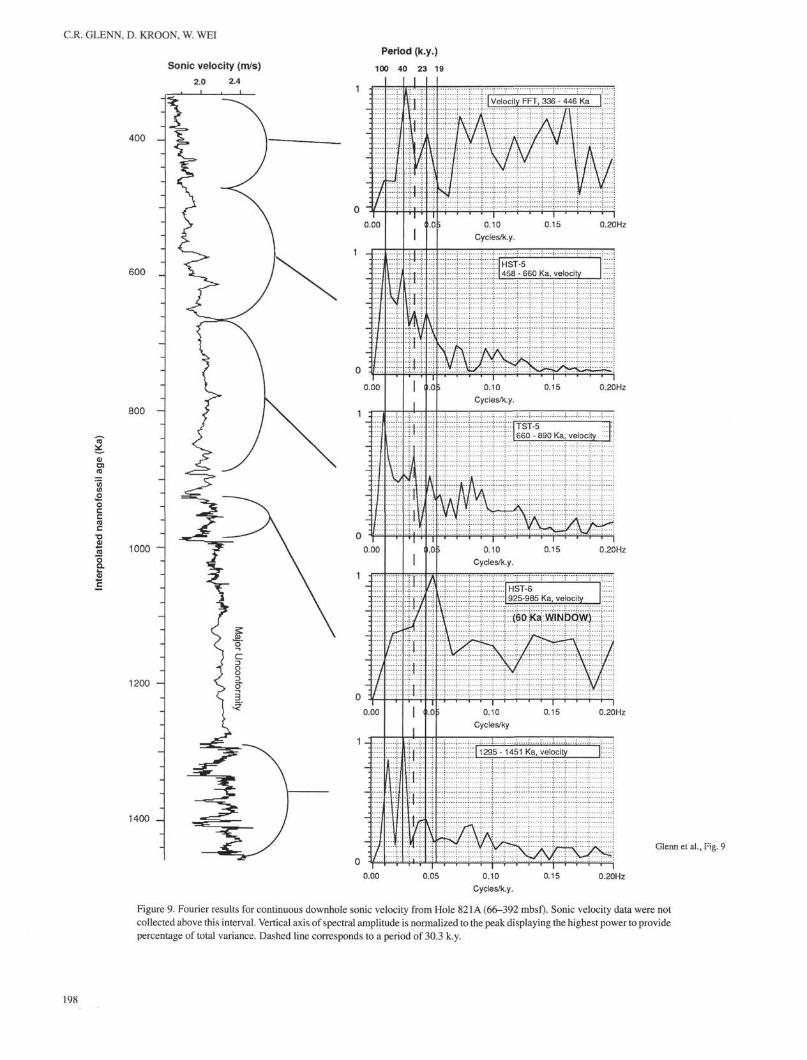
Fast Fourier transform results for available downhole sonic veloc-ity data collected at Hole 821A are presented in Figure 9. In this case,the raw data are limited to the portion of the hole below the drill string.As for the FFT spectra of the magnetic susceptibility data, the resultsshow a fair correspondence to the master periods of orbital eccentric-ity, obliquity, and precession, but with differing spectral densities fordifferent portions of the core.
The 336- to 446-ka window shows strong spectral density near theperiods of obliquity and precession. The result also shows a largeamount of low-frequency noise. This noise may be the result of com-plications due to a mixture of elevated sedimentation rates, interbed-ded rhythmic silty clays and clayey silts, and coarsening- and fining-upward units, all within this interval (-66-115 mbsf; Fig. 3). Thenarrowness of the window also appears to preclude the detection ofeccentricity cycles. The two subsequent windows (459-660 ka and660-890 ka) are from the stratigraphically condensed (-130 m/m.y.)seismic Sequence 5 highstand and transgressive systems tracts, re-spectively. These units encompass a number of 4- to 14-m-thick,fining-upward depositional cycles and show progressively decreasingspectral densities for eccentricity, obliquity, and precession withineach time window. As for several of the magnetic susceptibility resultsdiscussed above, the sonic velocity signal also appears to contain thesignature of a -30 k.y./cycle within this portion of the record. The925- to 985-ka window is for highstand systems tract 6 and shows astrong precessional peak; this window is too small to resolve obliquityor eccentricity forcing. The oldest window (1295-1451 ka) encom-passes seismic Sequence 8, which contains upward-coarsening depo-sitional units. The Fourier transform for this window shows spectralpeaks at 80, 40, and about 23 k.y./cycle; the 80-k.y. peak is likely anartifact resonance tone.
Comparisons with Orbital-Parameter Time Series
Figure 10 illustrates the time series variations in magnetic suscep-tibility, carbonate content, and sequence stratigraphy, as compared tocalculated orbital parameters (Berger, 1978). From this figure (and theresults above) several points appear that link the development ofsequence-stratigraphic units with sea-level variations associated withorbital climate forcing. The last 350 k.y. of the record at Site 821 showsa well-developed cyclicity of fining-upward marine sedimentary cy-cles that bundle into six seismically resolvable systems tracts (seismicSequences 1 through 3) that, in turn, bundle into the most recent long-term cycle of eccentricity (Fig. 10). The average duration of theseseismic sequences is 127 k.y. Cycles of eccentricity, obliquity, andprecession are all recorded within this interval in magnetic susceptibil-ity data (Fig. 8). Fourier analysis data encompassing seismic Sequence4 (300-500 ka and 375-575 ka magnetic susceptibility FFTs; 336-446ka sonic velocity FFTs), however, show a lack or strong diminishmentof the eccentricity spectra within this interval (Figs. 8 and 9). Thisdiminishment correlates with eccentricity minima at about 400 kacalculated from orbital mechanics (Fig. 10). Seismic Sequence 5represents one long-term, ~400-k.y. cycle of eccentricity (Fig. 9). Thesequence spans four 100-k.y. cycles of eccentricity (Figs. 8,9, and 10)and is marked by a major maximum flooding surface at its midpoint(0.66 Ma). The four eccentricity cycles appear to correlate with threeprogressive flooding events in the Sequence 5 transgressive systemstract and one progradational event in the Sequence 5 highstand systemstract (Figs. 3 and 10). Seismic Sequence 6 centers on a maximumflooding surface at about 1 Ma and lacks evidence for obliquity forcingin both the magnetic susceptibility and sonic velocity Fourier results.This flooding surface temporally correlates with a major change in themode of Pleistocene climate, as indicated from global oxygen isotoperecords; these records globally switch at this point from the high-fre-quency/low-amplitude signals of the Pliocene-early Pleistocene to thelow-frequency/high-amplitude signals of the late Pleistocene (e.g.,Shackleton and Opdyke, 1976; Prell, 1982; Williams et al., 1988;Ruddiman et al., 1989). In addition, the work of Joyce et al. (1990,Gulf of Mexico) suggests that orbital climate modulation switchedfollowing this point from obliquity-dominated to eccentricity-domi-nated and that 1 Ma marks distinct nodes of eccentricity and obliquityand precession minima. This change at about 1 Ma also closely cor-responds to a major change from prograding to aggrading seismicarchitectures in this region (Symonds et al., 1983, and other papers inthis volume). Unfortunately, however, the narrowness of our FFT
196
SequenceStratigraphy
Magnetic Susceptibility(iσ6CGS units)
10 20
l.lOMa —1.27 Ma —(-Unconformity
a300-
b
Magnetic susceptibilityFFT 0-200Ka
1.0
- 0.5
0.00 0.05 0.10 0.15•o
0.20Hz
100 K Magnetic susceptibilityFFT 150-350 Ka
0.00 0.05 0.10 0.15
Magnetic susceptibilityFFT 300-500 Ka
0.00 0.05
Magnetic susceptibilityFFT 375-575 Ka
0.00 0.05 0.10 0.15
Magnetic susceptibilityFFT 937 -1090 Ka
0.00
0.00 0.05 0.10
Cycles/k.y.
0.15
30
1.0
.0.5
0.20HZ1.0
:.0.5
.0.5
1.0
0.5
Magnetic susceptibilityFFT 1272-1434 Ka
0.20Hz
10 20Cycles/m.y.
Figure 8. Power spectra from Fourier results for magnetic susceptibility data from Hole 821A. Vertical axis of spectral amplitude is normalized to the peak displaying the highest power to providepercentage of total variance. Periods for peaks are shown in k.y./cycle. See Figure 2 for key to abbreviations.
Glenn et al., Fig. 8
C.R. GLENN, D. KROON, W. WEI
Sonic velocity (m/s)2.0 2.4
400 -
600 _
800 -
1000 -
1200 -
1400 _
Period (k.y.)
100 40 23 19
0.20Hz
0.20Hz
0.20Hz
0.20Hz
0.20Hz
Glenn et al., Fig. 9
Figure 9. Fourier results for continuous downhole sonic velocity from Hole 821A (66-392 mbsf) Sonic velocity data were notcollected above this interval. Vertical axis of spectral amplitude is normalized to the peak displaying the highest power to providepercentage of total variance. Dashed line corresponds to a period of 30.3 k.y.
198

SEDIMENTARY RHYTHMS AND CLIMATIC FORCING OF SEDIMENTS
Table 3. Temporal subdivision of seismic sequences on the basisof carbonate/magnetic susceptibility bundling and/or pulsationsin glauconite sedimentation at Holes 821A and 821B.
Average Magnet GlauconiteSeismic duration bundles pulses Average durationsequence (k.y.) (No.) (No.) per pulse (k.y.)
1
6A
6B
6C
133
146
102
51 2 or 3
6(4°-order) 173 7 or:
7 128 2
8 249
13366.5
73.0
73.0
3451
3232
443110
29.3
25, 1717
1717
21,25
6464
62
windows (e.g., 937-1090 ka for magnetic susceptibility and 925-985ka for velocity) prohibits accurate discrimination for eccentricity inthis portion of the GBR record.
DISCUSSION
How are the Milankovitch periods transferred from the top of theatmosphere to the magnetic and sonic velocity data recorded in Hole821 A? Both of these parameters are linked in that they may reflectproportions of fine-grained siliciclastics contained in these sediments,the first as a direct measurement of fine-grained magnetic minerals,insoluble residues, and glauconite, and the second as an indirect meas-ure of porosity (e.g., Bloemendal and deMenocal, 1989; Jarrard andArthur, 1989). These physical properties of the sediments varied incadence with changes in sea level deduced from sequence analysis andalso recorded the beat of glacial/interglacial change suggested inFourier spectra. However, what remains unknown is how the variationsin siliciclastic influx were regulated by Milankovitch forcing and howthis forcing explicitly impacts and modulates the sequence-strati-graphic record. Such modulation undoubtedly involved many variables,including lags in the climate and oceanic response to orbitally producedsolar radiation changes (e.g., Aharon, 1984; Short and Mengel, 1986),and independent variations in sediment supply and tectonic subsidence.Together, these variables regulate available accommodation space and,therefore, control the type of sequence and systems tracts that developat different locales even during global eustatic events (Fulthrope, 1991;Reynolds et al, 1991). Also complicating the record at Site 821 is thegeneral lack of lowstand systems tracts and, thus, the likely expandedhiatuses associated with most sequence boundaries. Furthermore, weare still unsure how the waxing and waning of siliciclastic detritus inthese sediments relate to aridity/rainfall cycles, if at all. Peaks in mag-netic susceptibility (clay and glauconite), bioclasts, and quartz clearlyrelate to maximum flooding and highstand progradational events atSite 821, yet we do not know if these peaks are reflecting increases in
siliciclastic transport due to increases in rainfall and runoff or if theyrepresent an eolian component that becomes more predominant dur-ing times of sequence condensation. In siliciclastic-dominated depo-sitional sequences, peaks in clay abundances along downlappedsurfaces are commonly interpreted as representing sequence conden-sation as a result of nearshore trapping of detrital elastics duringmaximum flooding. At Site 821, however, the increases in clays alongdownlapped surfaces are also associated with relative increases inquartz and seem to necessitate relative increases in terrigenous influx,either by wind or water, during these times.
The Great Barrier Reef Province lies almost entirely within thetropics and forms a meridional mass between the Australian continentand the vast oceanic region of the South Pacific Ocean. Stronglyinfluenced by both of these regions, the province is subjected to allthe influences of intertropical oceanic weather patterns (Maxwell,1968). Summer southeast tradewinds release heavy rains as theymove into the unstable air masses of the equatorial zone and thecontinent. In addition, high summer rainfall is maintained by contri-butions from northwest summer monsoons, which result from wintercooling in Asia and southeast Coriolis deflection on crossing theequator. The monsoons bring moist air from the warm equatorial seasto the northern continent and its marginal seas. Global climate mod-eling and Fourier spectral results indicate that the intensity of thesemonsoons, at least in Asia where they were born, was regulated byglacial/interglacial cycles and is coherent and in phase with a 23-k.y.precessional beat (Prell and Van Campo, 1986; Prell and Kutzbach,1987). However, it is not clear from these results whether monsoonsmay have penetrated to the northeastern Australian margin. In addi-tion, tropical cyclones strongly affected the margin by bringing heavyrainfall in summer months and early autumn (Maxwell, 1968). Eventoday, infrequent cyclones and extremely heavy cyclonic rainfalltransport large volumes of terrigenous elastics across the shelf andout through the outer reefs (Davies et al., 1985). In that such seasonalweather patterns have been shown to have a strong tie to orbitalclimate forcing, it remains a tantalizing objective to determine thepossibility of their linkage to the Milankovitch cyclicity observed inthe GBR margin sediments.
SUMMARY AND CONCLUSIONS
The results discussed above strongly suggest that the sedimentarycyclicity observed at Site 821 has in some way been controlled or atleast modulated by climatic and oceanic forcing in the Milankovitchwaveband. All the dominant periodicities of eccentricity, obliquity,and precession are present within the record at this site, although withdiffering intensities for different depositional packages and timeframes. From the results presented above, the following conclusionscan be drawn:
1. Variations in carbonate content and magnetic susceptibility inthe GBR slope sediments bundle into rhythmic alternations betweenhigh-magnetic-susceptibility/low-carbonate bundles and low-mag-netic-susceptibility/high-carbonate bundles. These bundle pairs tendto form couplets that correspond to the transgressive and highstandsystems tracts identified from sequence-stratigraphic analysis.
2. Magnetic susceptibility/carbonate cycles have been interpretedas pulses of fine-grained siliciclastics that dilute percentages of car-bonate and at the same time contain fine-grained, magnetically sus-ceptible detrital minerals. At Site 821, these pulses occurred duringtimes of maximum flooding (along downlapped surfaces) and sub-sequent highstand progradation. During maximum flooding events,these pulses were marked by dramatic increases in quartz, bioclasts,and unreworked authigenic mineral phases (glauconite and siderite).During highstand progradational events, the pulses were marked byincreases in silt, bioclasts, and reworked glauconite. The magneticsusceptibility/carbonate bundles observed at Site 821 thus mimicrelative changes in sea level.
199

CaCOOrbital parameters
Magnetic susceptibility . . . Precession(10•6CGS units) Eccentricity Obliquity ^ c e s s i o nindex
0.04 -0.08
200 -
400 -
Λ 600 -
800 -
1000
1200 -
1400 -
Maximum flooding surfaceSequence boundary
S2 3 .
Figure 10. Time series of carbonate and magnetic susceptibility data for Hole 821 compared with orbital eccentricity, obliquity, and precession (using the precessional index, e sin w) over the
last 1.65 Ma (from Berger, 1978). Seismic sequences of Glenn et al. (this volume) also are shown.
SEDIMENTARY RHYTHMS AND CLIMATIC FORCING OF SEDIMENTS
3. The most recent 350 k.y. of the record at Site 821 shows awell-developed cyclicity of fining-upward marine sedimentary cyclesthat bundle into six seismically resolvable systems tracts (seismicSequences 1 through 3) that, in turn, bundle into the most recentlong-term cycle of eccentricity (Fig. 10). The average duration ofthese seismic sequences was 127 ka. Recorded within this interval inmagnetic susceptibility data (Fig. 8) are 100-, ~41-, and 20- to 25-k.y.cycles of eccentricity, obliquity, and precession. Eccentricity domi-nates cyclicity in this interval.
4. Seismic Sequence 4 is marked by relatively high sedimentationrates (averaging 436 Bubnoffs) that occurred over a relatively shorttime span (64 k.y.). Fourier analysis data encompassing this interval(300-500 ka and 375-575 ka magnetic susceptibility FFTs; 336^46ka sonic velocity FFTs) show a diminishment of the 100-ka spectralpeak within this interval (Figs. 8 and 9), which may correlate with theeccentricity minima at about 400 ka calculated from orbital mechanics(Berger, 1978; Fig. 10). This minima in eccentricity was directlypreceded by a long-term change at Site 821 from upward-increasingcarbonate/decreasing magnetic susceptibility (decreasing bundlewidths) to upward-decreasing carbonate/increasing magnetic suscep-tibility (increasing bundle widths) at about 0.465 Ma. This changealso may have marked the late Pleistocene switch to a strong eccen-tricity-dominated climatic mode, described from North AtlanticOcean records.
5. Seismic Sequence 5, the most stratigraphically condensed in-terval, is marked by relatively low sedimentation rates (averaging 133Bubnoffs) that occurred over a relatively long time span (443 k.y.)and represents one long-term cycle of eccentricity (Fig. 10). The se-quence, spanning four 100-k.y. cycles of eccentricity (Figs. 8, 9, and10), is marked by a major maximum flooding surface at its midpoint(0.66 Ma). The four eccentricity cycles appear to correlate with threeprogressive flooding events in the Sequence 5 transgressive systemstract and one progradational event in the Sequence 5 highstandsystems tract.
6. Seismic Sequence 6 is marked by high sedimentation rates (446Bubnoffs). These high rates provide for increased resolution withinthis unit and its subdivision into three fifth-order, sequence-strati-graphic cycles of sea-level change (Sequences 6A, 6B, and 6C).Covering approximately one and a half 100-k.y. eccentricity cycles(Fig. 10), the Fourier spectra for this interval show no evidence forobliquity climate forcing; spectral power in the precessional band-width is, however, present. The width of the windows analyzed pre-cludes detection of eccentricity signals within this interval. This unitcenters at about 1 Ma and marks the change from long-term, third-order progradational to aggradational stratigraphic architectures anda dramatic increase in shallow-water bioclast production and decreasein nannofossil abundances. It also temporally correlates with a dra-matic shift in the mode of Pleistocene climates, as deduced fromdeep-sea oxygen isotope records, and appears to have been depositedduring an initial change from obliquity-dominated to eccentricity-dominated climate modulation.
7. On average, pulses in magnetic susceptibility, percentage car-bonate, and percentage glauconite subdivide the duration of many ofthe seismic sequences into periodicities that roughly correspond toeither the periods of eccentricity or precession or to -30- and 50-k.y.periods. Also detected in our Fourier results are -30- and 50-yr peri-odicities. These periods may be due to tonal resonance and interfer-ence, spectral aliasing, or perhaps to depositional cyclicity associatedwith the stratigraphic development of parasequence sets.
8. Although this margin has long been dominated by the develop-ment of shallow-water carbonates, the orbital forcing frequenciesdetected in these data likely stem from variations in terrigenous influx.
9. We conclude that from this high-resolution data set we are justbeginning to resolve the link between sea-level changes deduced fromsequence-stratigraphic analyses and those recognized from the oxygenisotope record. Better seismic resolution and temporal controls will beneeded to refine these observations further.
ACKNOWLEDGMENTS
Financial support for this project was provided by a grant from theU.S. Scientific Advisory Committee (USSAC). We are grateful to RoyWilkens for numerous discussions about Milankovitch rhythms andfor his patience and help in analyzing the data via FFTs, and to JackKronen for fruitful discussions about depositional mechanisms andthe response of seismic systems tracts. We also thank Kerry Kelts,John King, and Michael Arthur for reviews of the manuscript. To ourcolleagues and the ship and drilling crews of JOIDES Resolution weexpress our gratitude for their helpfulness and cooperation. This isUH SOEST Contribution No. 3158.
REFERENCES*
Aharon, P., 1984. Implications of the coral-reef record from New Guineaconcerning the astronomical theory of the ice ages. In Berger, A., Imbrie,J., Hays, J., Kukla, G., and Saltzman (Eds.), Milankovitch and Climate:Understanding the Response to Astronomical Forcing: Dordrecht (D.Reidel), 379-389.
Berger, A., Imbrie, J., Hays, J., Kukla, G., and Saltzman (Eds.), 1984. Milank-ovitch and Climate: Understanding the Response to Astronomical Forc-ing: Dordrecht (D. Reidel).
Berger, A.L., 1978. Long-term variations of caloric insolation resulting fromearth's orbital variations. Quat. Res. (N.Y.), 9:139-167.
Berggren, W.A., Kent, D.V., and Van Couvering, J.A., 1985. The Neogene:Part 2. Neogene geochronology and chronostratigraphy. In Snelling, NJ.(Ed.), The Chronology of the Geological Record. Geol. Soc. LondonMem., 10:211-260.
Bloemendal, J., and deMenocal, P., 1989. Evidence for a change in theperiodicity of tropical climate cycles at 2.4 Myr from whole-core magneticsusceptibility measurements. Nature, 342:897-900.
Bloemendal, J., Lamb, B., and King, J., 1988. Paleoenvironmental implica-tions of rock-magnetic properties of late Quaternary sedi-ment cores fromthe eastern equatorial Atlantic. Paleoceanography, 3:61-87.
Boardman, M.R., Neumann, A.C., Baker, RA., Dulin, L.A., Kenter, R.J.,Hunter, G.E., and Keifer, K.B., 1986. Banktop response to Quaternaryfluctuations in sea level recorded in periplatform sediments. Geology,14:28-31.
Davies, PJ., Marshall, J.F., and Hopley, D., 1985. Relationships between reefgrowth and sea level rise in the Great Barrier Reef. Proc. 5th Int. CoralReefCongr., Tahiti, 3:95-104.
Davis, J.C., 1986. Statistics and Data Analysis in Geology (2nd ed.): NewYork (Wiley).
Doh, S.-J., King, J.W., and Leinen, M., 1988. A rock-magnetic study of giantpiston core LL44-GPC3 from the central North Pacific and its paleoceano-graphic implications. Paleoceanography, 3:89-111.
Droxler, A.W., and Schlager, W., 1985. Glacial versus interglacial sedimenta-tion rates and turbidite frequency in the Bahamas. Geology, 13:799-802.
Einsele, G., Ricken, W., and Seilacher, A. (Eds.), 1991. Cycles and Events inStratigraphy: Berlin (Springer-Verlag).
Engleman, E.E., Jackson, L.L., and Norton, D.R., 1985. Determination ofcarbonate carbon in geologic materials by coulometric titration. Chem.Geol, 53:125-128.
Enos, P., 1991. Sedimentary parameters for computer modeling. In Franseen,E.K., Watney, W.L., Kendall, C.G.St.C, and Ross, W. (Eds.), SedimentaryModeling: Computer Simulations and Methods for Improved ParameterDefinition. Kansas Geol. Surv. Bull., 233:63-99.
Fischer, A.G., and Bottjer, D.J., 1992. Orbital forcing and sedimentary se-quences. J. Sediment. Petrol, 61:1063-1268.
Fulthrope, CS., 1991. Geological controls on seismic sequence resolution.Geology, 19:61-65.
Glenn, C.R., and Kelts, K, 1991. Sedimentary rhythms in lake deposits. InEinsele, G., Ricken, W., and Seilacher, A. (Eds.), Cycles and Events inStratigraphy: Berlin (Springer-Verlag), 188-221.
Hays, J.D., Imbrie, J., and Shackleton, NJ., 1976. Variations in the earth'sorbit: pacemaker of the ice ages. Science, 194:1121-1132.
* Abbreviations for names of organizations and publications in ODP reference lists followthe style given in Chemical Abstracts Service Source Index (published by AmericanChemical Society).
201

C.R. GLENN, D. KROON, W. WEI
Huffman, E.W.D., 1977. Performance of a new automatic carbon dioxidecoulometer. Microchem. J., 22:567-573.
Imbrie, J., Hays, J.D., Martinson, D.G., Mclntyre, A., Mix, A.C., Morley, J.J.,Pisias, N.G., Prell, W.L., and Shackleton, NJ., 1984. The orbital theory ofPleistocene climate: support from a revised chronology of the marine deltaδ 1 8 θ record. In Berger, A., Imbrie, J., Hays, J., Kukla, G., and Saltzman, B.(Eds.), Milankovitch and Climate (Pt. 1): Dordrecht (D. Reidel), 269 -305.
Imbrie, J., Mclntyre, A., and Mix, A., 1989. Oceanic response to orbital forcingin the late Quaternary: observational and experimental strategies. In Ber-ger, A., Schneider, S., and Duplessy, J.C. (Eds.), Climate and Geo-Sci-ences: Dordrecht (Kluwer Academic), 121-164.
Jarrard, R.D., and Arthur, M.A., 1989. Milankovitch paleoceanographic cyclesin geophysical logs from ODP Leg 105, Labrador Sea and Baffin Bay. InSrivastava, S.P., Arthur, M.A., Clement, B., et al., Proc. ODP, Sci. Results,105: College Station, TX (Ocean Drilling Program), 757-772.
Jenkins, G.M., and Watts, D.G., 1968. Spectral Analysis and Its Applications:San Francisco (Holden Day).
Joyce, J.E., Tjalsma, L.R.C., and Prutzman, J.M., 1990. High-resolutionplanktic stable isotope record and spectral analysis for the last 5.35 M.Y.:Ocean Drilling Program Site 625 Northeast Gulf of Mexico. Paleoceanog-raphy, 5:507-529.
Kent, D.V., 1982. Apparent correlation of paleomagnetic intensity and climaticrecords in deep-sea sediments. Nature, 299:538-539.
Martinson, D.G., Menke, W., and Stoffa, RL., 1982. An inverse approach tosignal correlation. J. Geophys. Res., 87:4807^4818.
Martinson, D.G., Pisias, N.G., Hays, J.D., Imbrie, I., Moore, T C , Jr., andShackleton, NJ., 1987. Age dating and the orbital theory of the ice ages:development of a high-resolution 0 to 300,000-year chronostratigraphy.Quat. Res. (N.Y.), 27:1-29.
Maxwell, W.G.H., 1968. Atlas of the Great Barrier Reef: London (Elsevier).Mead, G.A., Tauxe, L., and LaBrecque, J.L., 1986. Oligocene paleoceanogra-
phy of the South Atlantic: paleoclimatic implications of sediment accumu-lation rates and magnetic susceptibility. Paleoceanography, 1:273-284.
Pisias, N.G., and Mix, A.C., 1988. Aliasing of the geologic record and the searchfor long-period Milankovitch cycles. Paleoceanography, 3:613-619.
Pokras, E.M., and Mix, A.C., 1985. Eolian evidence for spacial variability oflate Quaternary climates in tropical Africa. Quat. Res. (N.Y.), 24:137-149.
Prell, W.L., 1982. Oxygen and carbon isotope stratigraphy for the Quaternaryof Hole 502B: evidence for two modes of isotopic variability. In Prell,W.L., Gardner, J.V., et al., Init. Repts. DSDP, 68: Washington (U.S. Govt.Printing Office), 455^64.
Prell, W.L., and Kutzbach, J.E., 1987. Monsoon variability over the past150,000 years. J. Geophys. Res., 92:8411-8425.
Prell, W.L., and Van Campo, E., 1986. Coherent response of Arabian Seaupwelling and pollen transport to late Quaternary monsoonal winds. Na-ture, 323:526-528.
Reynolds, D.J., Steckler, M.S., and Coakley, B.J., 1991. The role of sedimentload in sequence stratigraphy: the influence of flexural isostasy and com-paction. /. Geophys. Res., 96:6931-6949.
Robinson, S.G., 1986. The late Pleistocene paleoclimatic record of NorthAtlantic deep-sea sediments revealed by mineral-magnetic measurements.Phys. Earth Planet. Inter, 42:22-47.
Roof, S.R., Mullins, H.T., Gartner, S., Huang, T.C., Joyce, E., Prutzman, J.,and Tjalsma, L., 1991. Climatic forcing of cyclic carbonate sedimentationduring the last 5.4 million years along the west Florida continental margin.J. Sediment. Petrol, 61:1070-1088.
Rossignol-Strick, M., 1983. African monsoons: an immediate climate responseto orbital insolation. Nature, 303:46-49.
Ruddiman, W.F., Raymo, M.E., Martinson, D.G., Clement, B.M., and Back-man, J., 1989. Pleistocene evolution: Northern Hemisphere ice sheets andNorth Atlantic Ocean. Paleoceanography, 4:353^412.
Shackleton, NJ., Berger, A., and Peltier, W.R., 1990. An alternative astronomi-cal calibration of the lower Pleistocene timescale based on ODP Site 677.Trans. R. Soc. Edinburgh, Earth Sci., 81:251-261.
Shackleton, NJ., and Opdyke, N.D., 1976. Oxygen-isotope and paleomagneticstratigraphy of Pacific Core V28-239: late Pliocene to latest Pleistocene. InCline, R.M., and Hays, J.D. (Eds.), Investigations of Late Quaternary Paleo-ceanography and Paleoclimatology. Mem.—Geol. Soc. Am., 145:449-464.
Shipboard Scientific Party, 1991. Site 821. In Davies, PJ., McKenzie, J.A.,Palmer-Julson, A., et al., Proc. ODP, Init. Repts., 133 (Pt. 1): CollegeStation, TX (Ocean Drilling Program), 569-614.
Short, D.A., and Mengel, J.G., 1986. Tropical climatic phase lags and theEarth's precessional system. Nature, 323:48-50.
Symonds, P.A., Davies, PJ., and Parisi, A., 1983. Structure and stratigraphyof the central Great Barrier Reef. BMR J.Aust. Geol. Geophys., 8:277-291.
Vail, P.R., Audemard, F., Bowman, S.A., Eisner, P.N., and Perez-Cruz, C, 1991.The stratigraphic signatures of tectonics, eustasy and sedimentology—anoverview. In Einsele, G., Ricken, W., and Seilacher, A. (Eds.), Cycles andEvents in Stratigraphy: Berlin (Springer-Verlag), 617-659.
Van Wagoner, J.C, Mitchum, R.M., Campion, K.M., and Rahmanian, V.D.,1990. Siliciclastic Sequence Stratigraphy in Well Logs, Cores, and Out-crops: Concepts for High-Resolution Correlation of Time and Fades.AAPG, Methods Explor. Ser., 7.
Williams, D.F., Thunell, R.C., Tappa, E., Rio, D., and Raffi, I., 1988. Chronol-ogy of the Pleistocene oxygen-isotope record: 0-1.88 m.y.B.P. Palaeo-geogr, Palaeoclimatol, Palaeoecol, 64:221-240.
Wornardt, W.W., and Vail, PR., 1991. Tentative revision of the global Plio-cene-Pleistocene Sequences based on sequence stratigraphy in the Gulf ofMexico. AAPG Bull, 75:1425
Date of initial receipt: 24 April 1992Date of acceptance: 17 December 1992Ms 133SR-240
202