Embed Size (px)
DESCRIPTION
THE SOUTH AFRICAN NATIONAL ROADS AGENCY LIMITED (SANRAL) BUDGET 2006 /2007 AND STRATEGIC PLAN 2006 – 2009 Portfolio Committee on Transport. 16 March 2006. #191459v2. NATIONAL ROAD NETWORK. FOCUS AREAS 0N NATIONAL ROADS Pavement Condition. PAVEMENT DESIGN PHILOSOPY. Maintenance Actions. - PowerPoint PPT Presentation
Citation preview
THE SOUTH AFRICAN NATIONAL ROADS THE SOUTH AFRICAN NATIONAL ROADS AGENCY LIMITED (SANRAL)AGENCY LIMITED (SANRAL)
BUDGETBUDGET 2006 2006/2007 AND STRATEGIC /2007 AND STRATEGIC PLAN 2006 – 2009PLAN 2006 – 2009
Portfolio Committee on TransportPortfolio Committee on Transport
16 March 2006
#191459v2
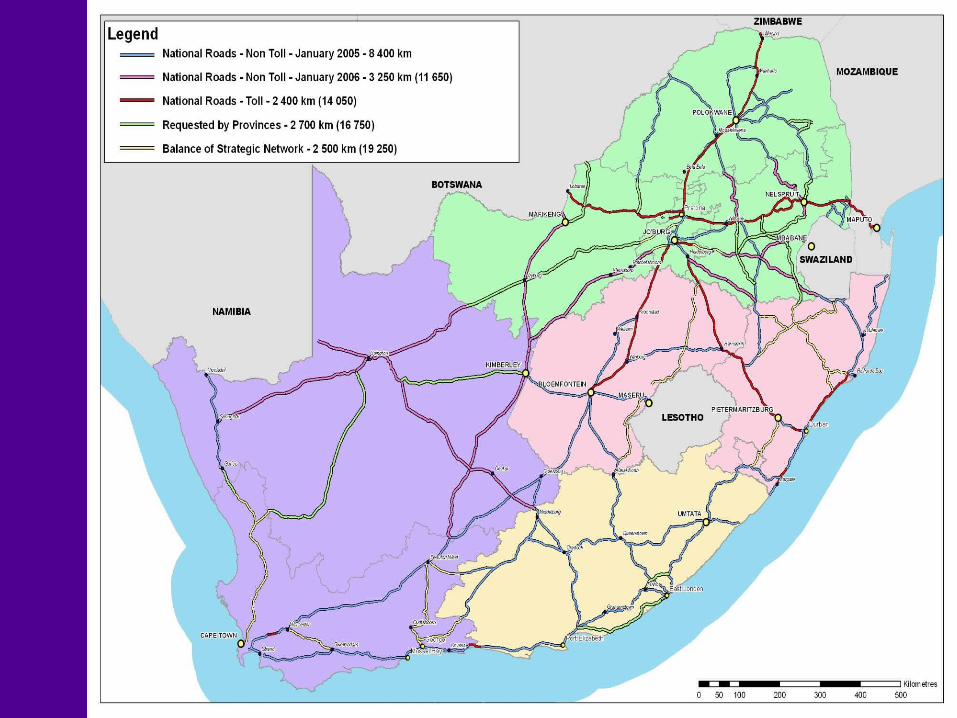
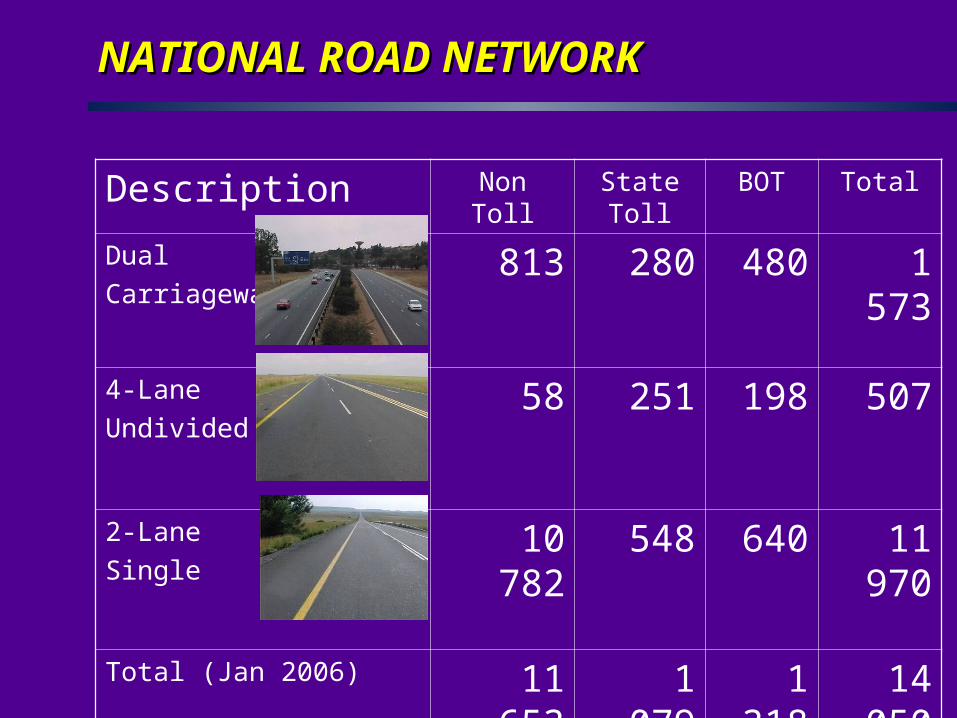
NATIONAL ROAD NETWORKNATIONAL ROAD NETWORK
Description Non Toll State Toll BOT Total
DualCarriageway
813 280 480 1 573
4-LaneUndivided
58 251 198 507
2-LaneSingle
10 782 548 640 11 970
Total (Jan 2006) 11 653 1 079 1 318 14 050
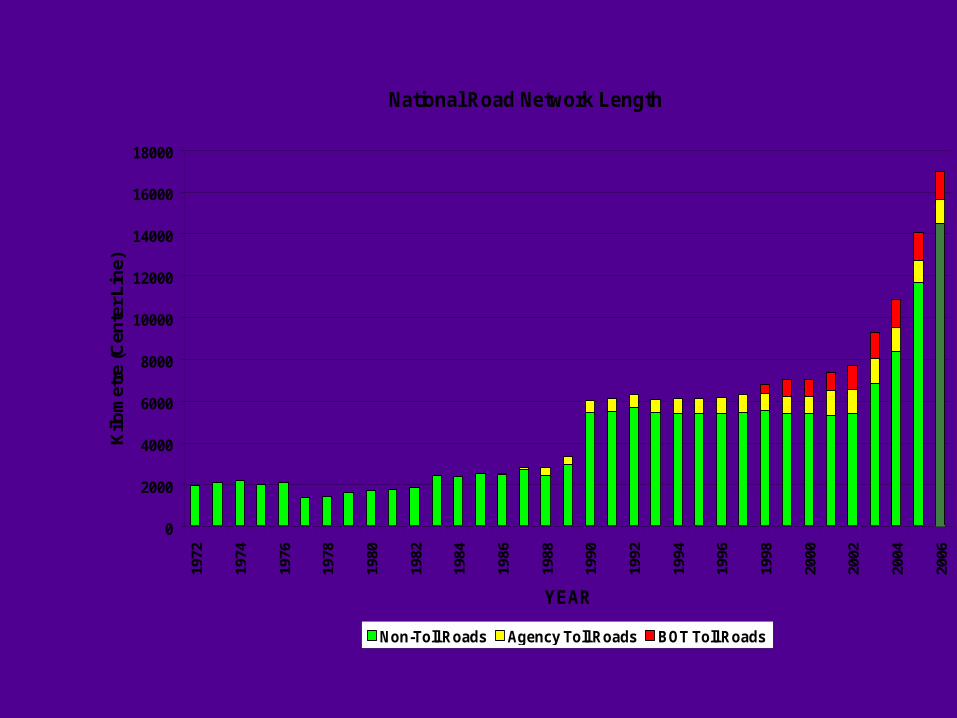
National Road Network Length
0
2000
4000
6000
8000
10000
12000
14000
16000
18000
1972
1974
1976
1978
1980
1982
1984
1986
1988
1990
1992
1994
1996
1998
2000
2002
2004
2006
YEAR
Kilo
met
re (C
ente
r Lin
e)
Non-Toll Roads Agency Toll Roads BOT Toll Roads
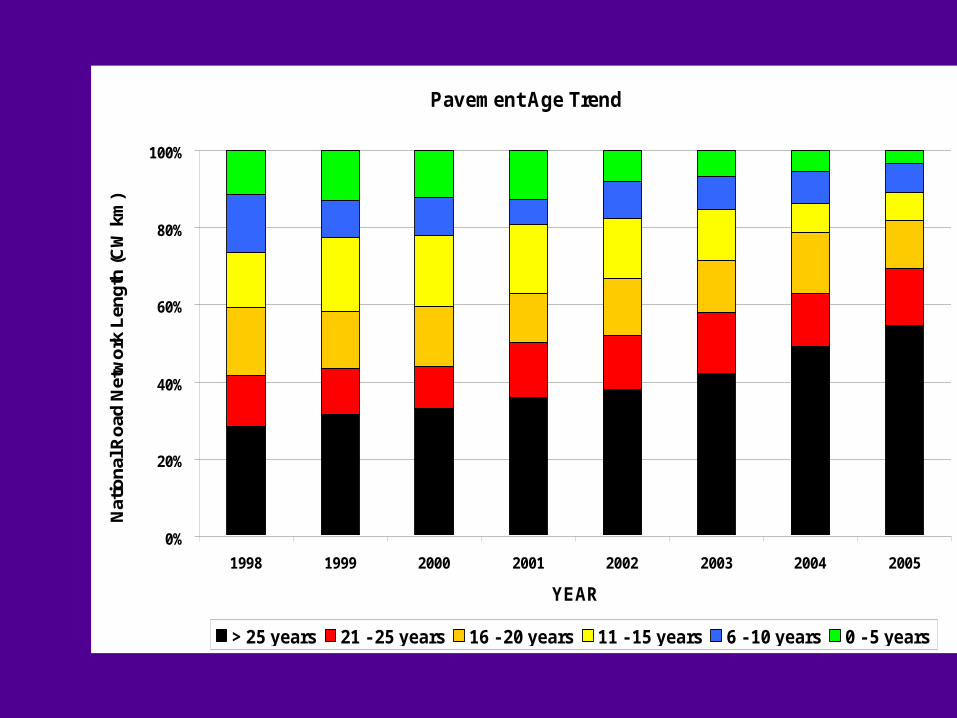
Pavement Age Trend
0%
20%
40%
60%
80%
100%
1998 1999 2000 2001 2002 2003 2004 2005
YEAR
Nat
iona
l Roa
d N
etw
ork
Leng
th (C
W k
m)
> 25 years 21 - 25 years 16 - 20 years 11 - 15 years 6 - 10 years 0 - 5 years
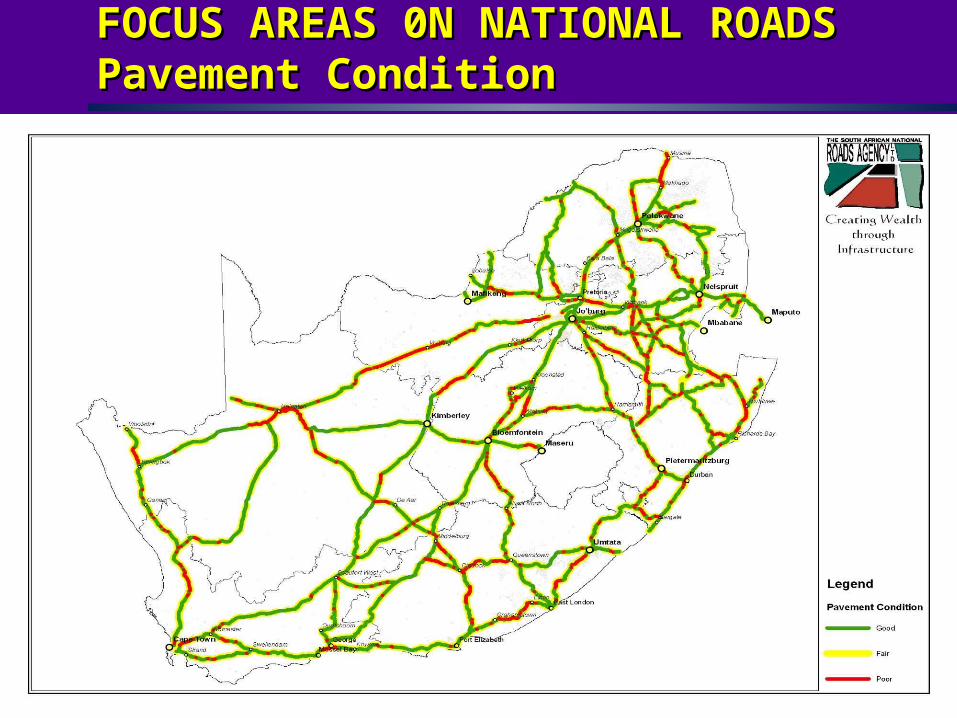
FOCUS AREAS 0N NATIONAL ROADSFOCUS AREAS 0N NATIONAL ROADSPavement ConditionPavement Condition
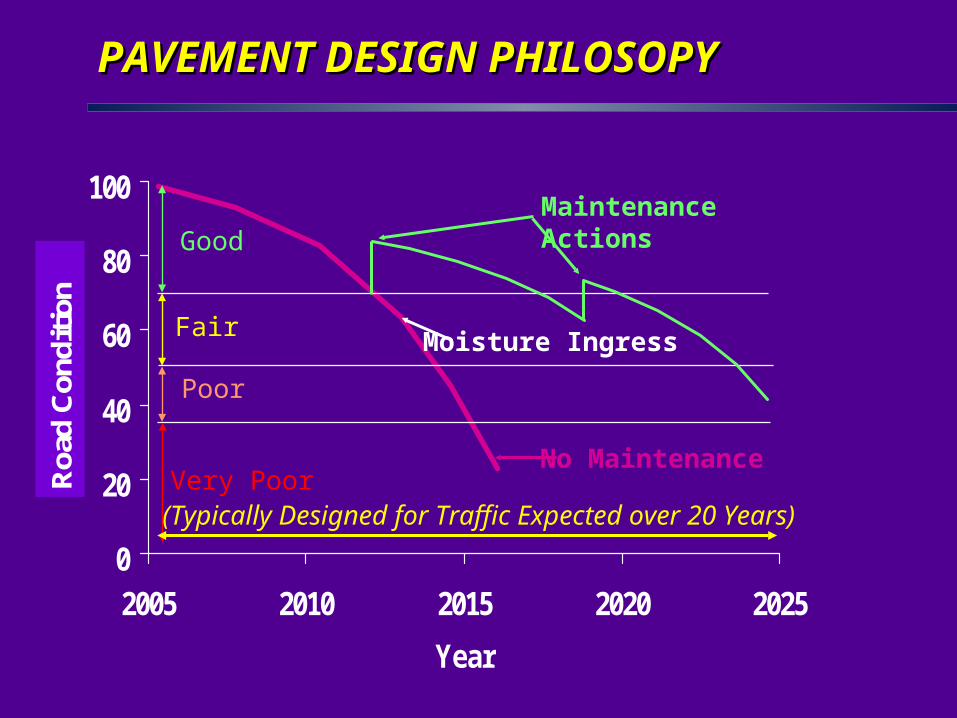
PAVEMENT DESIGN PHILOSOPYPAVEMENT DESIGN PHILOSOPY
0
20
40
60
80
100
2005 2010 2015 2020 2025
Year
Roa
d C
ondi
tion
Good
Fair
Poor
Very Poor
Maintenance Actions
No Maintenance
Moisture Ingress
(Typically Designed for Traffic Expected over 20 Years)
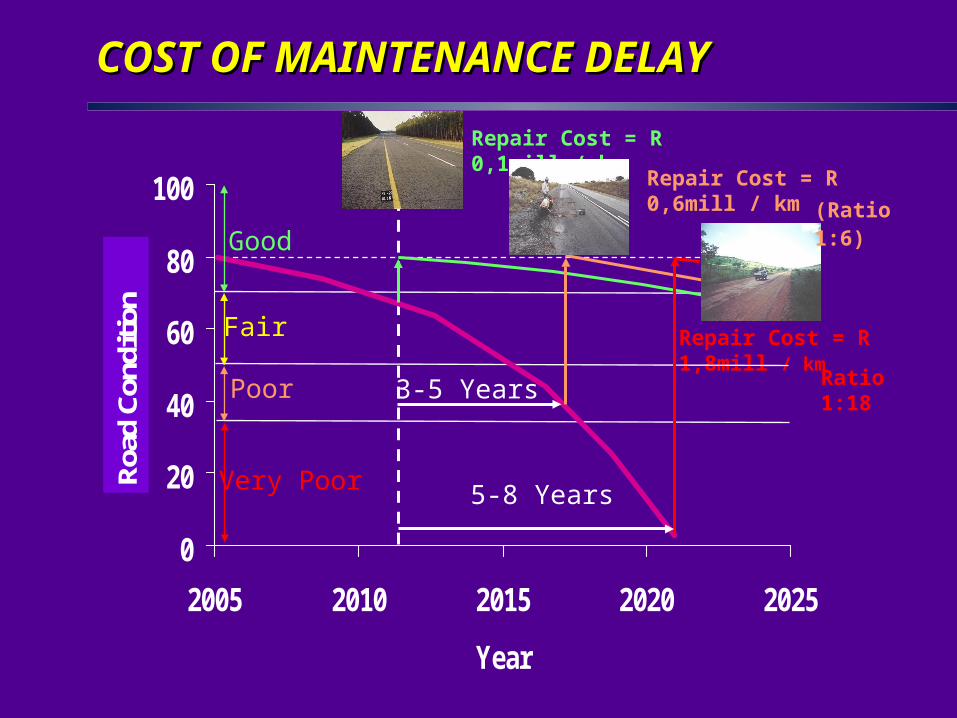
COSTCOST OF MAIN OF MAINTENANCE DELAYTENANCE DELAY
0
20
40
60
80
100
2005 2010 2015 2020 2025
Year
Roa
d C
ondi
tion
Repair Cost = R 1,8mill / km
Repair Cost = R 0,1mill / km
Good
Fair
Poor
Very Poor
3-5 Years
Repair Cost = R 0,6mill / km
5-8 Years
(Ratio 1:6)
Ratio 1:18
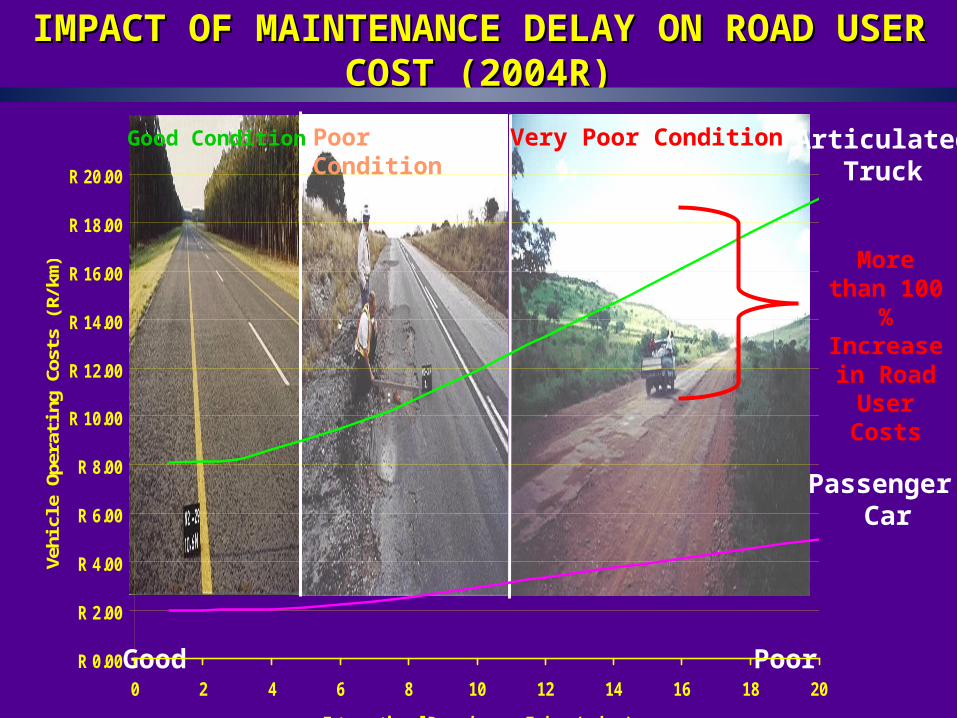
IMPACT OF MAINTENANCE DELAY ON ROAD USER IMPACT OF MAINTENANCE DELAY ON ROAD USER COST (2004R)COST (2004R)
Good Poor
ArticulatedTruck
Passenger Car
R 0.00
R 2.00
R 4.00
R 6.00
R 8.00
R 10.00
R 12.00
R 14.00
R 16.00
R 18.00
R 20.00
0 2 4 6 8 10 12 14 16 18 20
International Roughness Index (m/km)
Vehi
cle
Ope
ratin
g C
osts
(R/k
m)
Very Poor ConditionPoor Condition
Good Condition
More than 100
% Increase in Road
User Costs
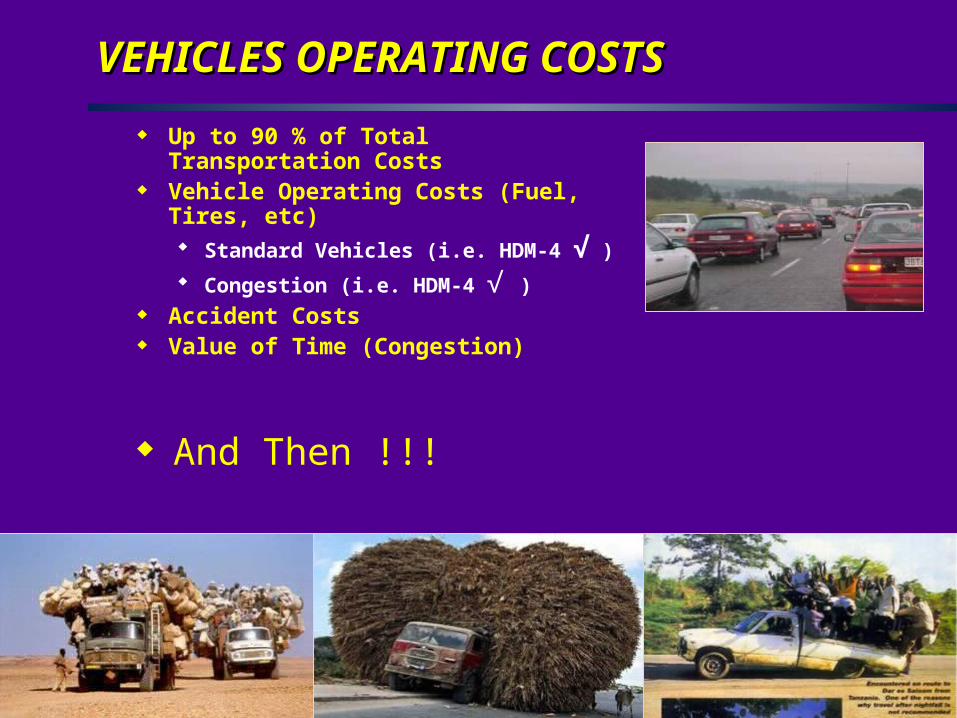
VEHICLES OPERATING COSTSVEHICLES OPERATING COSTS Up to 90 % of Total Transportation Costs Vehicle Operating Costs (Fuel, Tires, etc)
Standard Vehicles (i.e. HDM-4 √ ) Congestion (i.e. HDM-4 √ )
Accident Costs Value of Time (Congestion)
And Then !!!
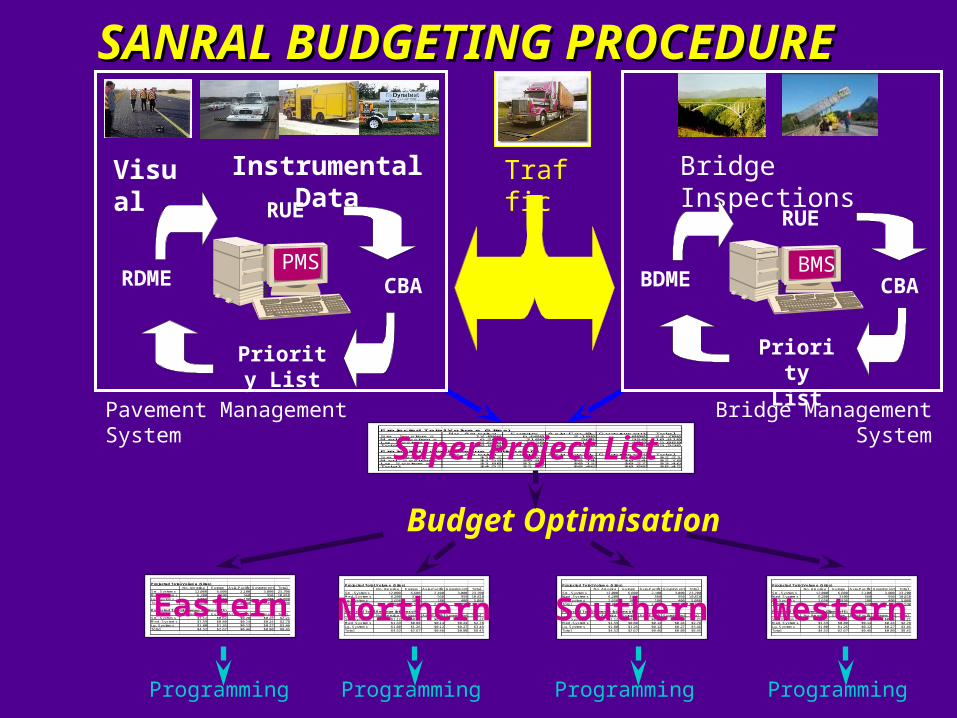
Visual Instrumental Data
CBA
Priority List
PMSRDME
RUE
Bridge Inspections
BMSBDME
RUE
CBA
Priority List
Traffic
Projected Total Volume (Sites)No. America Europe Asia-Pacific Government Total
Sm. Systems 12,000 6,600 2,100 3,000 23,700Med. Systems 6,200 3100 560 950 10,810Lg. Systems 2,650 1850 180 400 5,080Total 20,850 11,550 2,840 4,350 39,590
Projected Total Revenue (billions of $)No. America Europe Asia-Pacific Government Total
Sm. Systems $1.12 $0.62 $0.20 $0.28 $2.21Med. Systems $1.59 $0.80 $0.14 $0.24 $2.78Lg. Systems $1.80 $1.26 $0.12 $0.27 $3.46Total $4.52 $2.67 $0.46 $0.80 $8.45
Super Project List
Budget OptimisationProjected Total Volume (Sites)
No. America Europe Asia-Pacific Government TotalSm. Systems 12,000 6,600 2,100 3,000 23,700Med. Systems 6,200 3100 560 950 10,810Lg. Systems 2,650 1850 180 400 5,080Total 20,850 11,550 2,840 4,350 39,590
Projected Total Revenue (billions of $)No. America Europe Asia-Pacific Government Total
Sm. Systems $1.12 $0.62 $0.20 $0.28 $2.21Med. Systems $1.59 $0.80 $0.14 $0.24 $2.78Lg. Systems $1.80 $1.26 $0.12 $0.27 $3.46Total $4.52 $2.67 $0.46 $0.80 $8.45
EasternProjected Total Volume (Sites)
No. America Europe Asia-Pacific Government TotalSm. Systems 12,000 6,600 2,100 3,000 23,700Med. Systems 6,200 3100 560 950 10,810Lg. Systems 2,650 1850 180 400 5,080Total 20,850 11,550 2,840 4,350 39,590
Projected Total Revenue (billions of $)No. America Europe Asia-Pacific Government Total
Sm. Systems $1.12 $0.62 $0.20 $0.28 $2.21Med. Systems $1.59 $0.80 $0.14 $0.24 $2.78Lg. Systems $1.80 $1.26 $0.12 $0.27 $3.46Total $4.52 $2.67 $0.46 $0.80 $8.45
SouthernProjected Total Volume (Sites)
No. America Europe Asia-Pacific Government TotalSm. Systems 12,000 6,600 2,100 3,000 23,700Med. Systems 6,200 3100 560 950 10,810Lg. Systems 2,650 1850 180 400 5,080Total 20,850 11,550 2,840 4,350 39,590
Projected Total Revenue (billions of $)No. America Europe Asia-Pacific Government Total
Sm. Systems $1.12 $0.62 $0.20 $0.28 $2.21Med. Systems $1.59 $0.80 $0.14 $0.24 $2.78Lg. Systems $1.80 $1.26 $0.12 $0.27 $3.46Total $4.52 $2.67 $0.46 $0.80 $8.45
NorthernProjected Total Volume (Sites)
No. America Europe Asia-Pacific Government TotalSm. Systems 12,000 6,600 2,100 3,000 23,700Med. Systems 6,200 3100 560 950 10,810Lg. Systems 2,650 1850 180 400 5,080Total 20,850 11,550 2,840 4,350 39,590
Projected Total Revenue (billions of $)No. America Europe Asia-Pacific Government Total
Sm. Systems $1.12 $0.62 $0.20 $0.28 $2.21Med. Systems $1.59 $0.80 $0.14 $0.24 $2.78Lg. Systems $1.80 $1.26 $0.12 $0.27 $3.46Total $4.52 $2.67 $0.46 $0.80 $8.45
Western
Programming Programming Programming Programming
Pavement Management System Bridge Management System
SANRAL BUDGETING PROCEDURESANRAL BUDGETING PROCEDURE
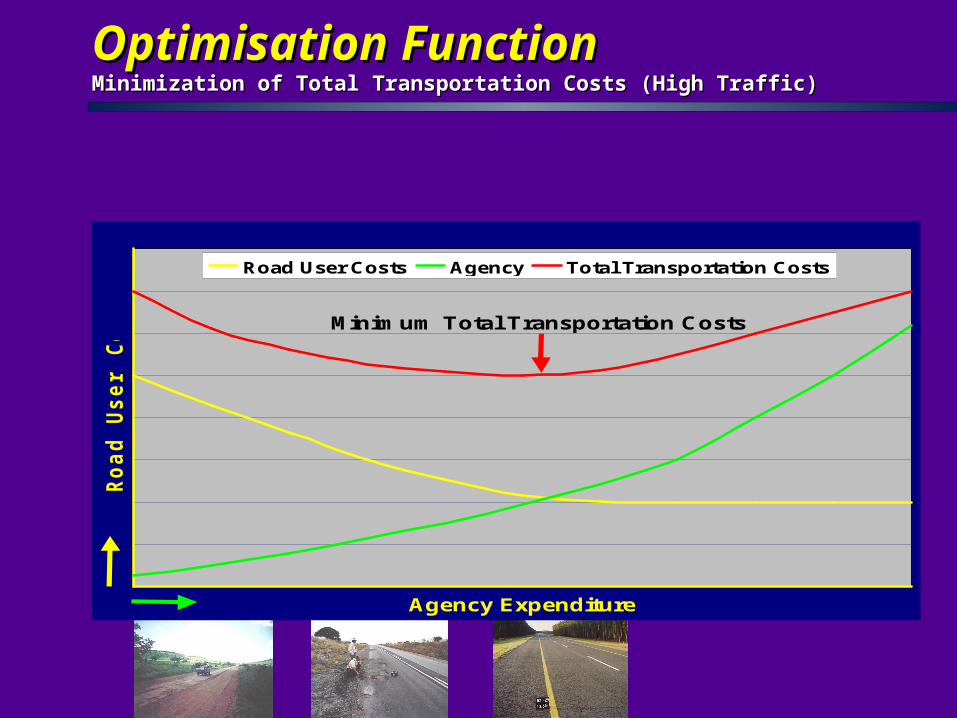
OptimisationOptimisation Function Function Minimization of Total Transportation Costs (High Traffic)Minimization of Total Transportation Costs (High Traffic)
Agency Expenditure
Road
Use
r Cos
ts
Road User Costs Agency Total Transportation Costs
Minimum Total Transportation Costs
PRINCIPLE KEY OBJECTIVESPRINCIPLE KEY OBJECTIVES
The management of a primary road network ensuring best value for money.
Continuously improving the efficiency of business practices.
Maintain market confidence. Carry out Governments targeted programmes to better
the life of all citizens. Safe roads for all. To work in partnership with road users, transport
providers relevant authorities and the private sector.
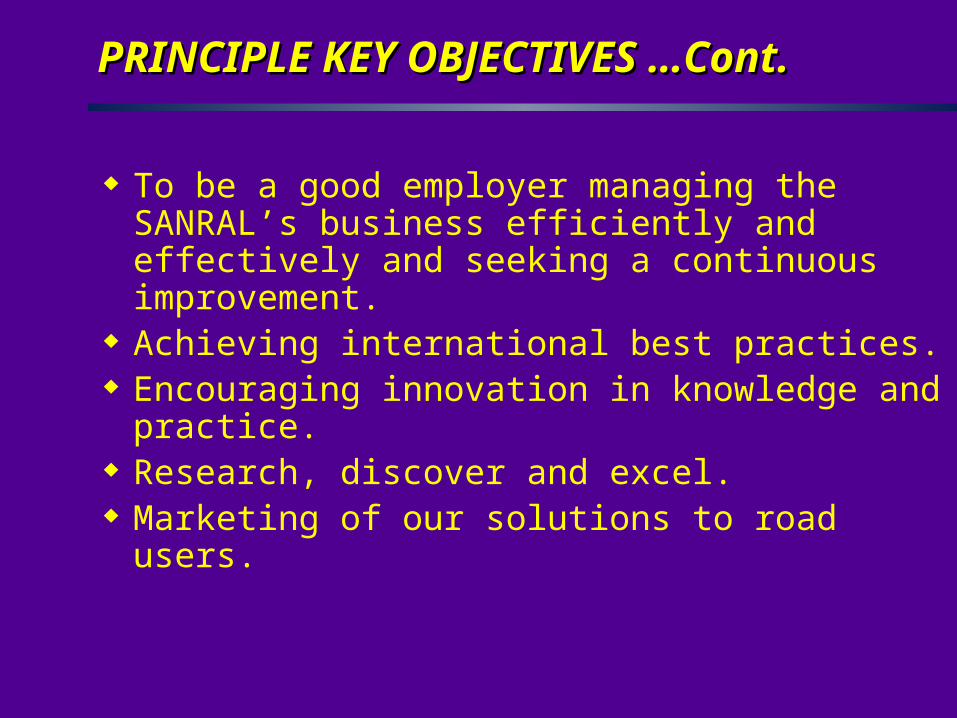
PRINCIPLE KEY OBJECTIVES …Cont.PRINCIPLE KEY OBJECTIVES …Cont.
To be a good employer managing the SANRAL’s business efficiently and effectively and seeking a continuous improvement.
Achieving international best practices. Encouraging innovation in knowledge and
practice. Research, discover and excel. Marketing of our solutions to road users.
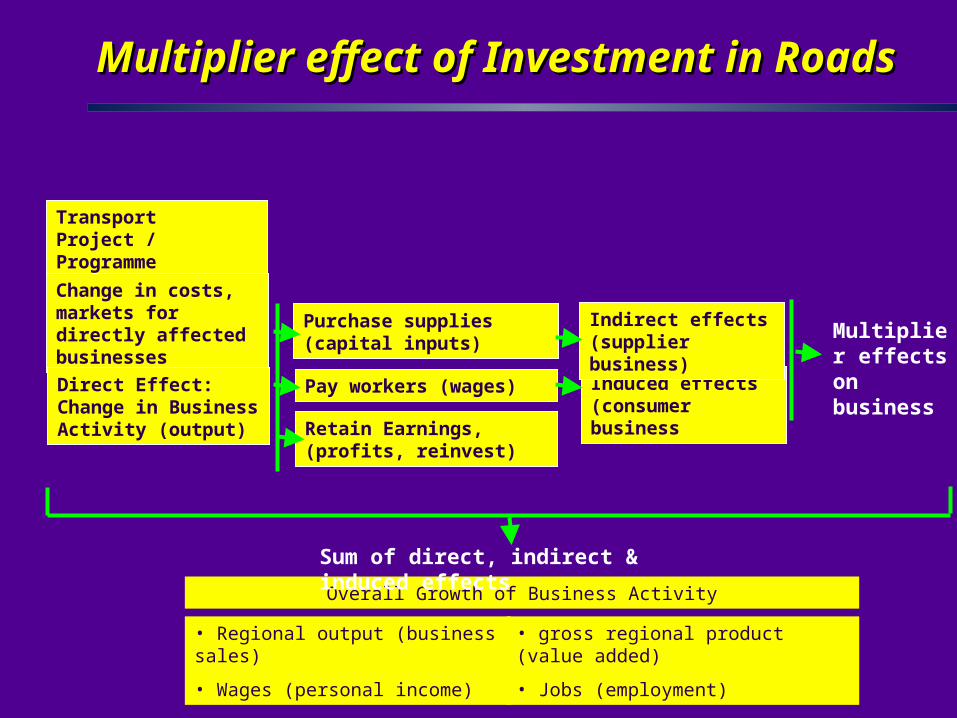
Multiplier effect of Investment in RoadsMultiplier effect of Investment in Roads
Transport Project / Programme
Change in costs, markets for directly affected businesses
Direct Effect: Change in Business Activity (output)
Induced effects (consumer business
Indirect effects (supplier business)
Retain Earnings, (profits, reinvest)
Pay workers (wages)
Purchase supplies (capital inputs) Multiplier
effects on business
• Regional output (business sales)
• Wages (personal income)
• gross regional product (value added)
• Jobs (employment)
Overall Growth of Business Activity
Sum of direct, indirect & induced effects
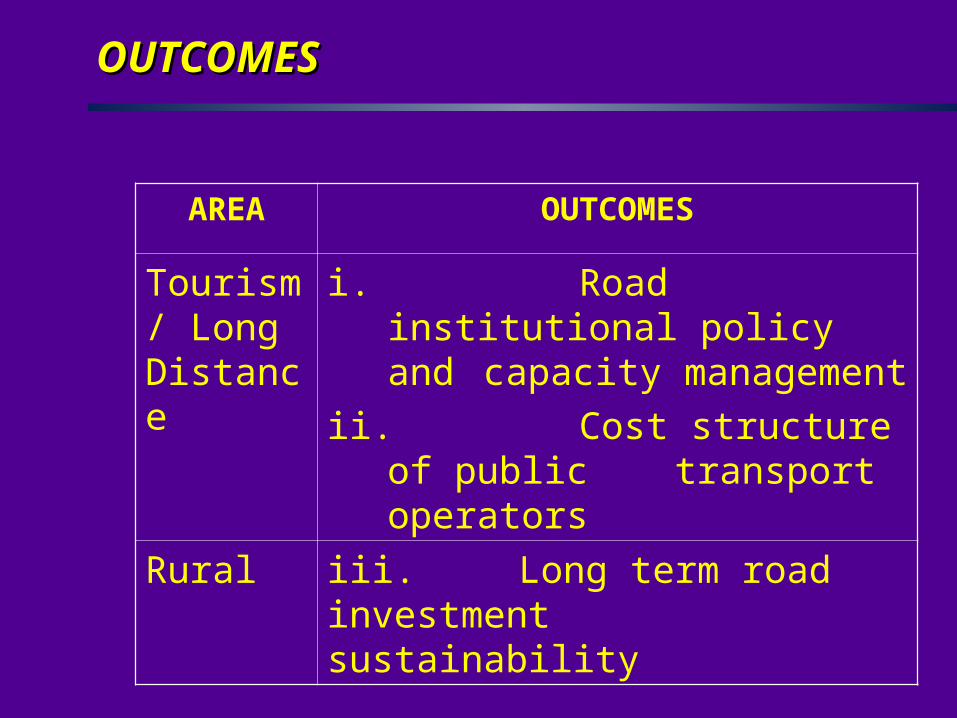
OUTCOMESOUTCOMES
AREA OUTCOMES
Tourism/ Long Distance
i. Road institutional policy and capacity management
ii. Cost structure of public transport operators
Rural iii. Long term road investment sustainability
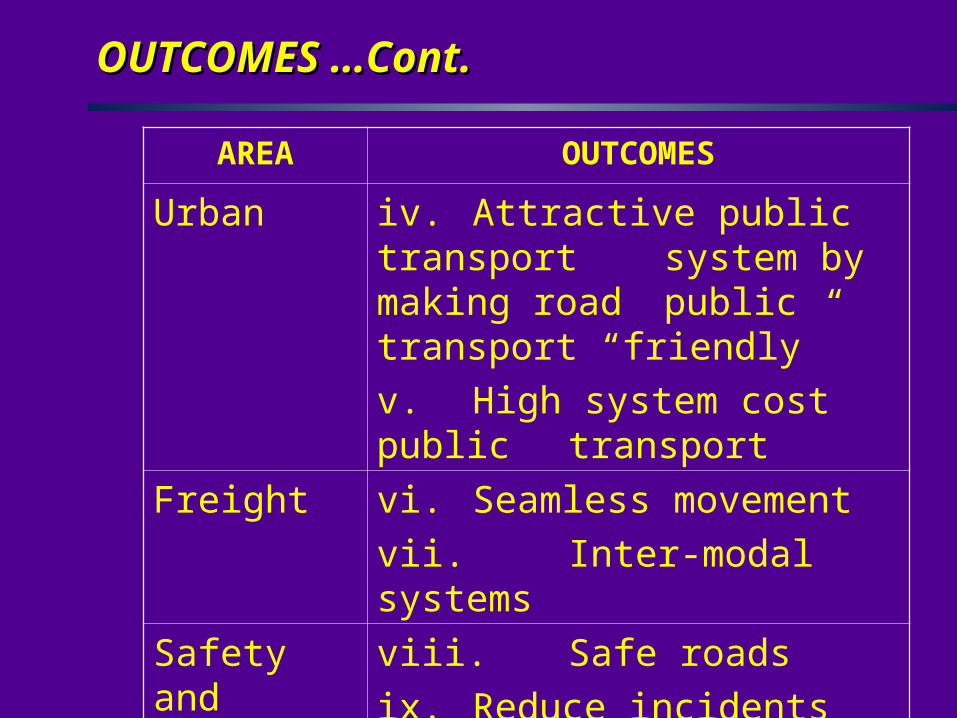
OUTCOMES …Cont.OUTCOMES …Cont.
AREA OUTCOMES
Urban iv. Attractive public transport system by making road
public transport “friendly”v. High system cost public transport
Freight vi. Seamless movementvii. Inter-modal systems
Safety and Environment
viii. Safe roadsix. Reduce incidents
Capacity x. Address basic skills gap
PERFORMANCE INDICATORSPERFORMANCE INDICATORSRoad NetworkRoad Network
SMOOTH TRAVEL EXPOSURE (STE)
Purpose: To monitor whether roads are providing acceptable travel conditions.
Target: 95% of travel on less than 4,2m/km roughness.
PERFORMANCE INDICATORSPERFORMANCE INDICATORSRoad Network …Cont.Road Network …Cont.
LOW RUT EXPOSURE (LRE)
Purpose: To monitor whether roads are providing acceptable travel conditions.
Target: 95% of travel on less than 20mm rut depth.
PERFORMANCE INDICATORSPERFORMANCE INDICATORSRoad Network …Cont.Road Network …Cont.
HIGH TEXTURE EXPOSURE (HTE)
Purpose: To monitor whether roads are providing acceptable travel conditions.
Target: 95% of travel on higher than 0,4 mm texture.
PERFORMANCE INDICATORSPERFORMANCE INDICATORSRoad Network …Cont.Road Network …Cont.
BRIDGE CONDITION EXPOSURE (BCE)
Purpose: To monitor whether bridges are providing acceptable travel conditions.
Target: 90% of travel over and under bridges with OCI higher than 80.
PERFORMANCE INDICATORSPERFORMANCE INDICATORSFinancial …Cont.Financial …Cont.
EXPENDITURE EFFICIENCY INDEX (EEI)
Purpose: To monitor the efficiency of the SANRAL.
Target: ≤ 5%
PERFORMANCE INDICATORSPERFORMANCE INDICATORSFinancial …Cont.Financial …Cont.
PRIVATE SECTOR INVESTMENT INDEX (PSII)
Purpose: To monitor the attraction of private sector investment.
Target: 0,85
How do we go to the next level? Develop a SANRAL Culture of Emphasis on Road
Safety in all we do. Efficient co-ordination and management of
resources to focus on road safety Results driven
It is with this in mind that a Road Safety Management System is proposed for SANRAL.
Proposed SANRAL road safety strategyProposed SANRAL road safety strategy
Although SANRAL does a lot of good road safety work, there is a need for a more co-ordinated approach towards road safety.
A Road Safety Management System is proposed. What is a Safety Management System?
Approach to road safety followed by road authorities internationally. Widely supported method of managing the road network to improve
safety. Is an integral part of the overall management system for the road
network.
Proposed SANRAL road safety strategyProposed SANRAL road safety strategy
Safety Management SystemSafety Management System
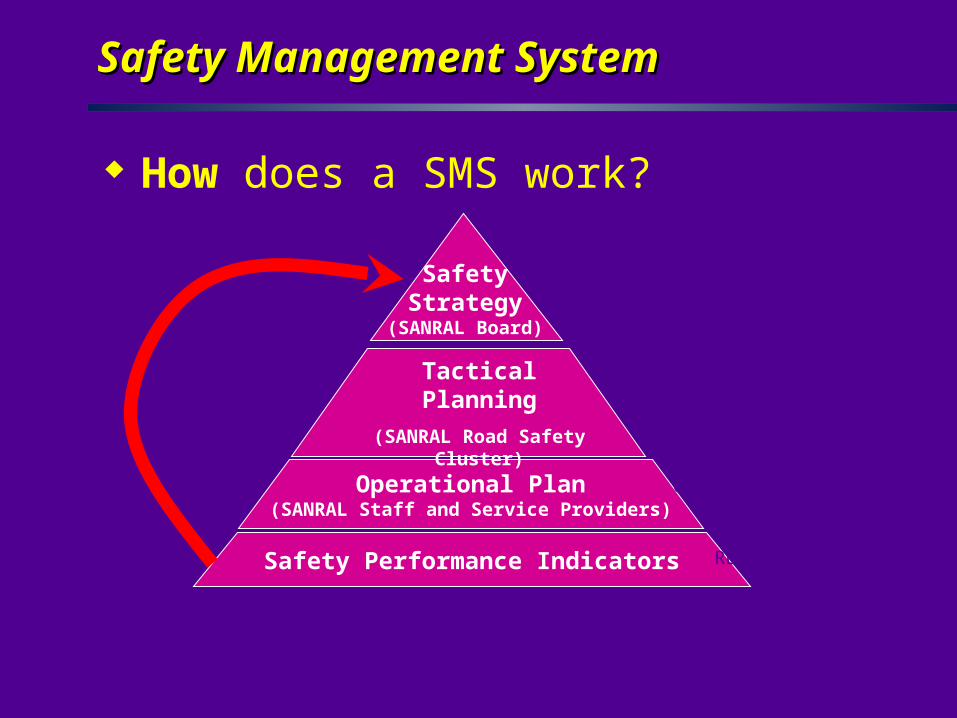
How does a SMS work?
SafetyStrategy
(SANRAL Board)
Operational Plan(SANRAL Staff and Service Providers)
Safety Performance Indicators
Tactical Planning(SANRAL Road Safety
Cluster)
DIRECTION
MEANS OF DELIVERY
CONTROL
REVIEW
Current SANRAL road safety initiatives: Current SANRAL road safety initiatives: EngineeringEngineering
Routine road maintenance Collation of accident statistics Safety maintenance (potholes, fencing, guardrails,
road marking etc.) Safety improvements on periodic maintenance
projects Special road safety projects
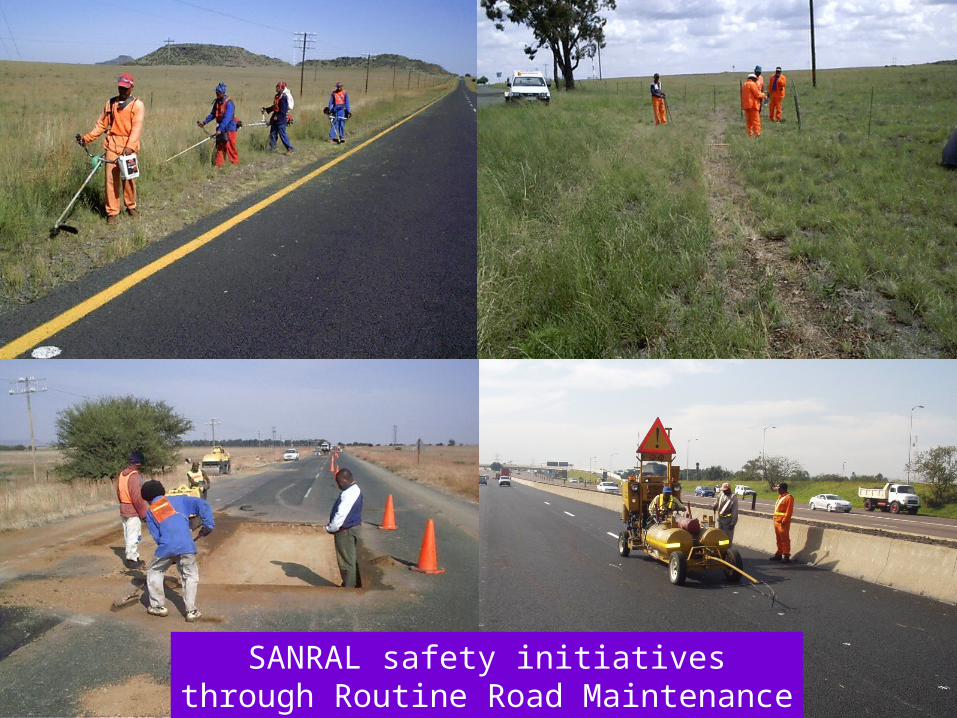
SANRAL safety initiatives through Routine Road Maintenance contracts
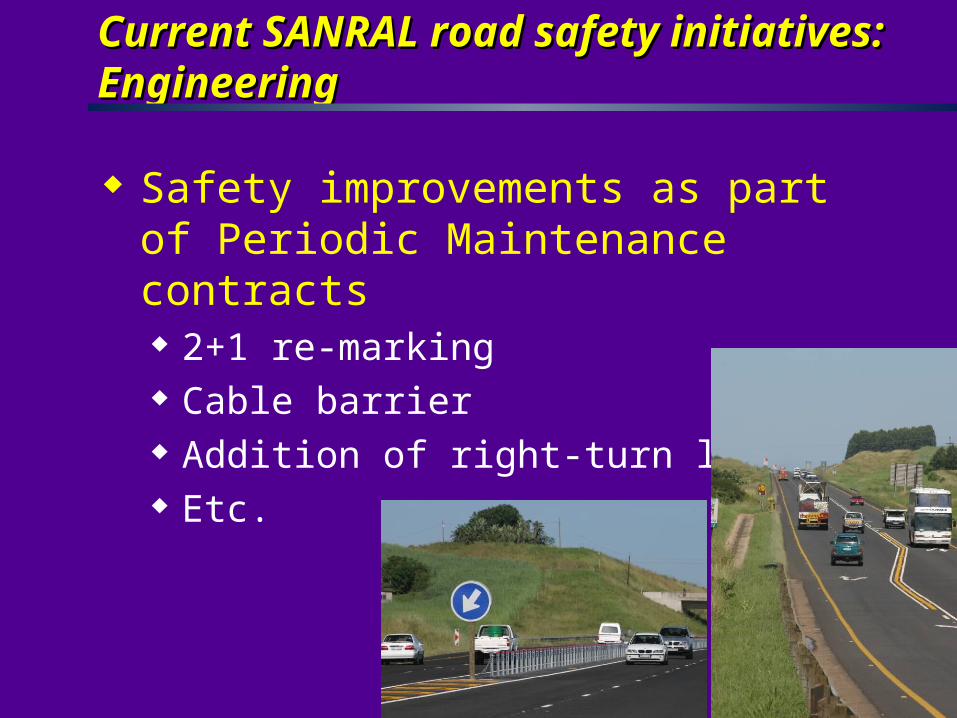
Safety improvements as part of Periodic Maintenance contracts 2+1 re-marking Cable barrier Addition of right-turn lanes Etc.
Current SANRAL road safety initiatives: Current SANRAL road safety initiatives: EngineeringEngineering
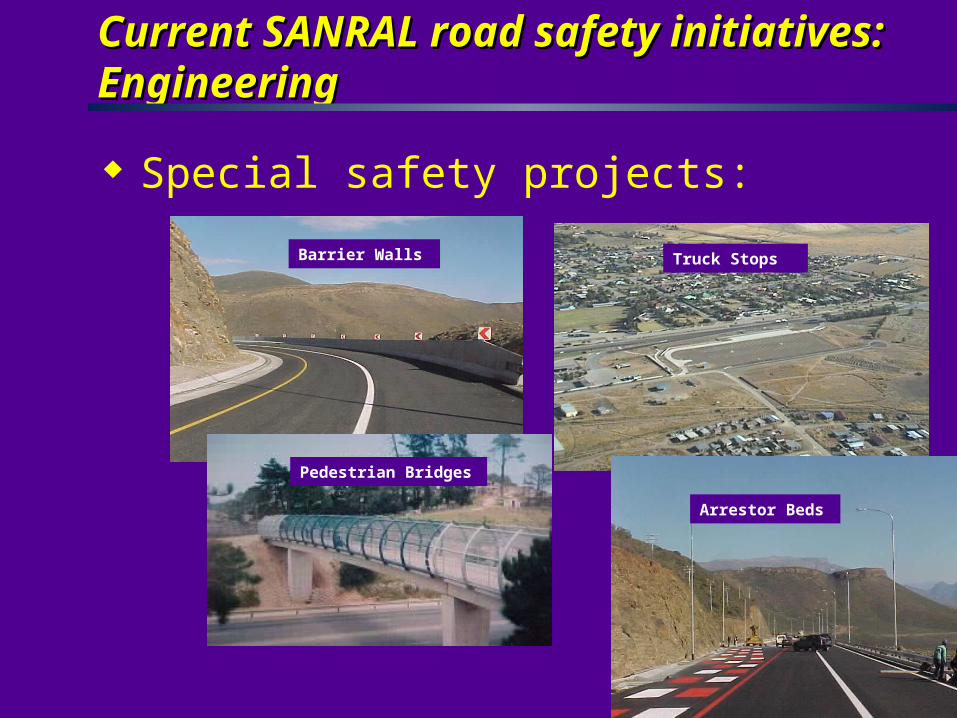
Special safety projects:
Current SANRAL road safety initiatives: Current SANRAL road safety initiatives: EngineeringEngineering
Barrier Walls Truck Stops
Arrestor Beds
Pedestrian Bridges
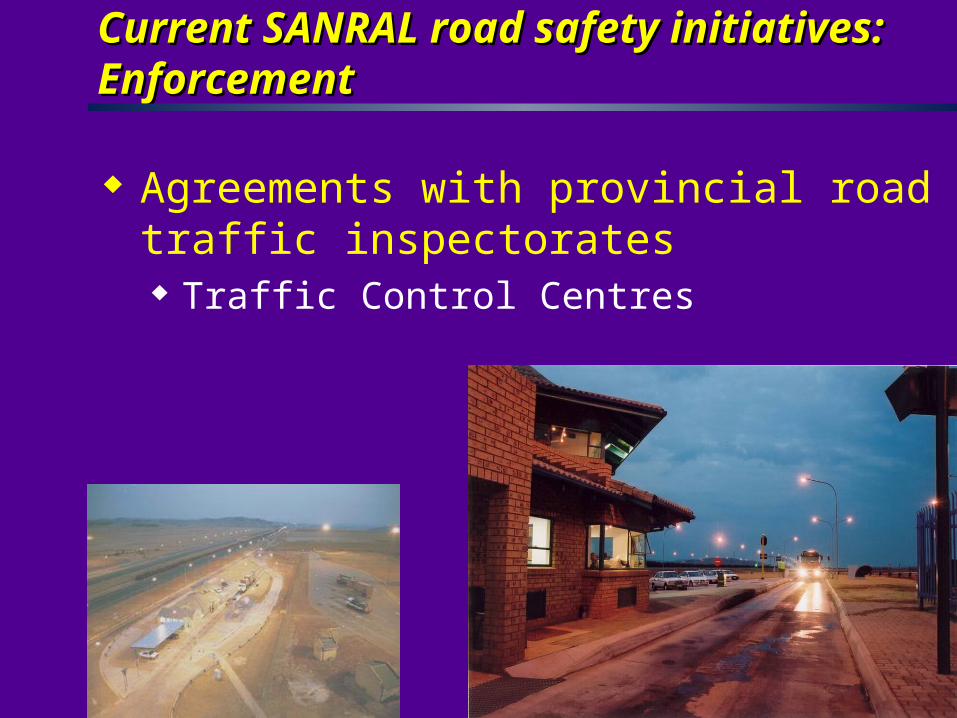
Current SANRAL road safety initiatives: Current SANRAL road safety initiatives: EnforcementEnforcement
Agreements with provincial road traffic inspectorates Traffic Control Centres
THE NEED FOR IMSTHE NEED FOR IMS
The trend for commercial transportation on South African roads, has steadily increased over the years.
The same can also be said for non-commercial vehicles.
Unfortunately the above can be linked to standard of safety on roads.
Every year our roads have their fair share of incidents which result with road closure, loss of lives, damage to property, at huge costs to all involved
Where incidents cannot be prevented at least they should be efficiently managed
THE OBJECTIVES THE OBJECTIVES OF IMSOF IMS
Enable Managers to secure agreements among emergency services
Allow for facilitation of on-scene co-ordination and co-operation between emergency services
Streamlining of communication Ensure that incidents are cleared as quickly as
possible.
THE ACHIEVEMENT OF IMS THE ACHIEVEMENT OF IMS
Programming and Pre-planning (Guidelines and Protocols)
Resources allocation and management Communication/Communication Technology
improvements Capacity building, skills development and
training System maintenance, monitoring, reporting
and evaluation