Embed Size (px)
Citation preview
DECK DRAINAGE DESIGN
BRIDGE DESIGN AIDS • OCTOBER 2006
17-1
17-1 DECK DRAINAGE DESIGN
1. Run-Off AnalysisWhen disposal of storm water from a major structure is to be made into facilities belonging to or underthe control of a local agency, it may be necessary to furnish anticipated maximum run-offs to the agencyconcerned.
Any recognized method of computing the quantity of run-off may be employed. A simple and easyanalysis is obtained by the Rational Method, which converts rainfall intensity for the design frequencystorm to run-off by the formula:
Q = CiA (1)
where
Q = Design Discharge, in cubic feet per second;
C = Coefficient of Runoff = 1.0 for bridge decks;
i = Average rainfall intensity, in inches per hour, for a given frequency and for the durationequal to the time of concentration. (Districts may or may not indicate the intensity for agiven area);
A = Drainage area, in acres, tributary to the point under design.
Barring information to the contrary from the District, reasonable criteria for this computation is a five-minute concentration time and a precipitation rate of 5 inches per hour. This results in a total gutter flow:
Q = 0.000115 A (1a)
where
A = Tributary Area in square feet
BRIDGE DESIGN AIDS • OCTOBER 2006
DECK DRAINAGE DESIGN17-2
2. Capacity of Grate Inlets in a SagA grate inlet in a sag operates first as a weir having a crest length roughly equal to the outside perimeter(P) along which the flow enters. Bars are disregarded and the side against the curb is not included incomputing P. Weir operation continues to a depth (d) of about 0.4 feet above the top of grate and thedischarge intercepted by the grate is:
Qi = 3.0 Pd 1.5 (2)
where
Qi = rate of discharge into the grate opening in cubic feet per second;
P = perimeter of grate opening, in feet, disregarding bars and neglecting the sideagainst the curb;
d = depth of water at grate, in feet. Use average d.
When the depth at the grate exceeds about 1.4 feet. the grate begins to operate as an orifice andthe discharge intercepted by the grate is:
Qi = 0.67 A (2gd) 0.5 = 5.37 Ad 0.5 (3)
where
Qi = rate of discharge into the grate opening, in cubic feet per second;
A = clear opening of the grate, in square feet;
g = acceleration of gravity, 32.2 feet per second2;
d = depth of ponded water above top of grate, in feet. Use average d.
Between depths over the grate of about 0.4 and about 1.4 feet the operation of the grate inlet isindefinite due to vortices and other disturbances. The capacity of the grate lies between that given byequations (2) and (3).
Type of Drain Clear Area (A) Clear Perimeter (P)
A 0.127 ft 2 1.50 ft
B 0.179 ft 2 0.75 ft
C 3.72 ft 2 9.42 ft
D 1.24 ft 2 4.12 ft
DECK DRAINAGE DESIGN
BRIDGE DESIGN AIDS • OCTOBER 2006
17-3
Because of the vortices and the tendency of trash to collect on the grate, the clear opening orperimeter of a grate inlet should be at least twice that required by equations (2) and (3) in orderto remain below the design depth over the grate. Where danger of clogging is slight, a factor ofsafety less than two may be used.
Capacity of the drain outlet pipe should be checked using equation (3) with d equal to the depthof water above the center of outlet pipe and A equal to the outlet pipe area.
3. Sheet FlowConcentration of sheet flow across bridge decks is to be avoided. As a general rule, no more than 0.1cfs should be allowed to concentrate and flow across a bridge deck. Refer to Section 831.4(1) SheetFlow of the Highway Design Manual.
4. Flow in GuttersA gutter is defined, for purposes of this discussion, as the section of bridge deck next to the barrier whichconveys water during a storm runoff event. It may include a portion or all of the shoulder. Gutter crosssections usually have a triangular shape with the barrier forming the near-vertical leg of the triangle. Thegutter may have a straight cross slope or a cross slope composed of two straight lines.
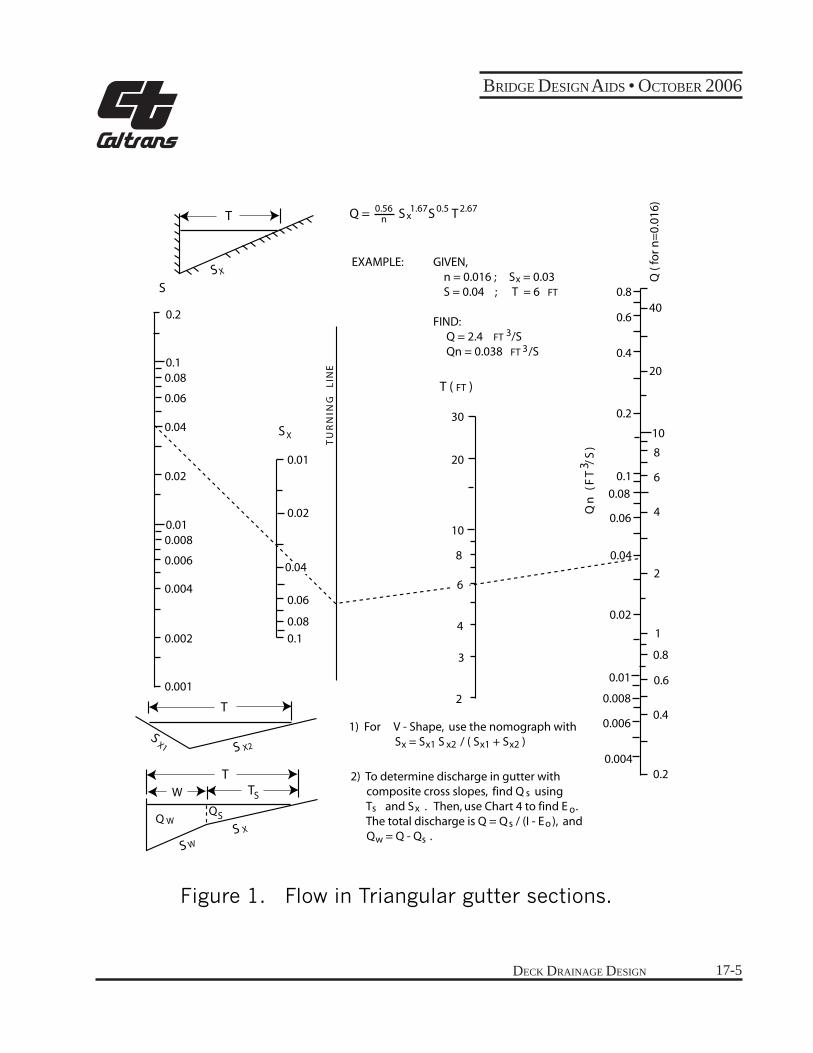
Modification of the Manning equation is necessary for use in computing flow in triangular channelsbecause the hydraulic radius in the equation does not adequately describe the gutter cross section,particularly where the top width of the water surface may be more than 40 times the depth at the curb.To compute gutter flow, the Manning equation is integrated for an increment of width across the section.The resulting equation in terms of cross slope and spread on the pavement is:
Q = (K/n) Sx5/3 S1/2 T8/3
where
K = 0.56;
Q = flow rate, ft3/s;
T = width of flow (spread), ft;
Sx = cross slope, ft/ft;
S = longitudinal slope, ft/ft;
n = Manning’s coefficient
BRIDGE DESIGN AIDS • OCTOBER 2006
DECK DRAINAGE DESIGN17-4
The equation neglects the resistance of the curb face because this resistance is negligible from a practicalpoint of view if the cross slope is 10 percent or less.
Spread on the pavement and flow depth at the curb are often used as criteria for spacing drainage inlets.Generally, design water spread should not exceed the shoulder width. Refer to Section 831.3 of theHighway Design Manual. Figure 1 is a nomograph for solving the equation. The nomograph can beused for either criterion with the relationship:
d = TSx
The nomograph can be used for direct solution of gutter flow where the Manning n value is 0.016. Forother values of n, divide the value of Qn by n. Instructions for use and an example problem solution areprovided on the nomograph.
5. Capacity of Grate Inlets on GradeThe inlet grate must be of adequate length in the longitudinal direction to intercept the flow approachingit without excessive splash over. An estimate of the required drain length is given by the followingequation.
Lb = V/2 (d+db)1/2 (4)
Lb = length of clear opening of grate in feet (1.375 ft for grate in drain type C, D-1, and D-2)
V = flow velocity in feet per second
d = depth of flow at curb in feet
db = depth of the grate bar in feet (0.1875 ft for drain type C, D-1, and D-2)
Test on grates similar to those used on standard drains type C and D have shown that splash over willbegin at a flow velocity of approximately 3.6 feet per second. At velocities above 3.6 f/s the grate willnot intercept all of the flow within the grate width. The grate efficiency can be estimated for higher flowvelocities using the following equation which approximates test results.
E = 100-30 (V-3.6) 100%
Flow not intercepted continues to the next inlet.
The capacity of inlets can also be controlled by the orifice capacity of the drain outlet pipe. Use equation(3) with d equal to the depth of water above the center of the outlet pipe and A equal to the area of thepipe opening.
Q = 0.67A (2gd)1/2 = 5.37 A (d)1/2 (3)
≤
DECK DRAINAGE DESIGN
BRIDGE DESIGN AIDS • OCTOBER 2006
17-5
T
TT
T ( FT )
T
S
S
S
S
SS
S X
X
X
S X2S
X1
W
WQQ
W
30
20
20
40
10
10
8
8
6
4
4
3
2
2
10.1
0.1
0.08
0.06
0.04
0.02
0.01
0.01
0.01
0.02
0.02
0.04
0.06
0.06
0.08
0.08
0.008
0.008
0.006
0.006
0.004
0.004
0.002
0.001
0.1
0.2
0.2
0.2
0.4
0.4
0.6
0.6
0.8
0.8
TU
RN
ING
L
INE
Qn
(F
T /
S)
3
Q (
for n
=0.
016)
1) For V - Shape, use the nomograph with S = S S / ( S + S )
2) To determine discharge in gutter with composite cross slopes, find Q using T and S . Then, use Chart 4 to find E . The total discharge is Q = Q / (I - E ), and Q = Q - Q .
EXAMPLE: GIVEN, n = 0.016 ; S = 0.03 S = 0.04 ; T = 6 FT
FIND: Q = 2.4 FT /S Qn = 0.038 FT /S
Q = S S T0.56 1.67 0.5 2.67x
x
n
3
3
x x1 x2 x1 x2
s x
s o
w s
0.04
6
s
o
Figure 1. Flow in Triangular gutter sections.
BRIDGE DESIGN AIDS • OCTOBER 2006
DECK DRAINAGE DESIGN17-6
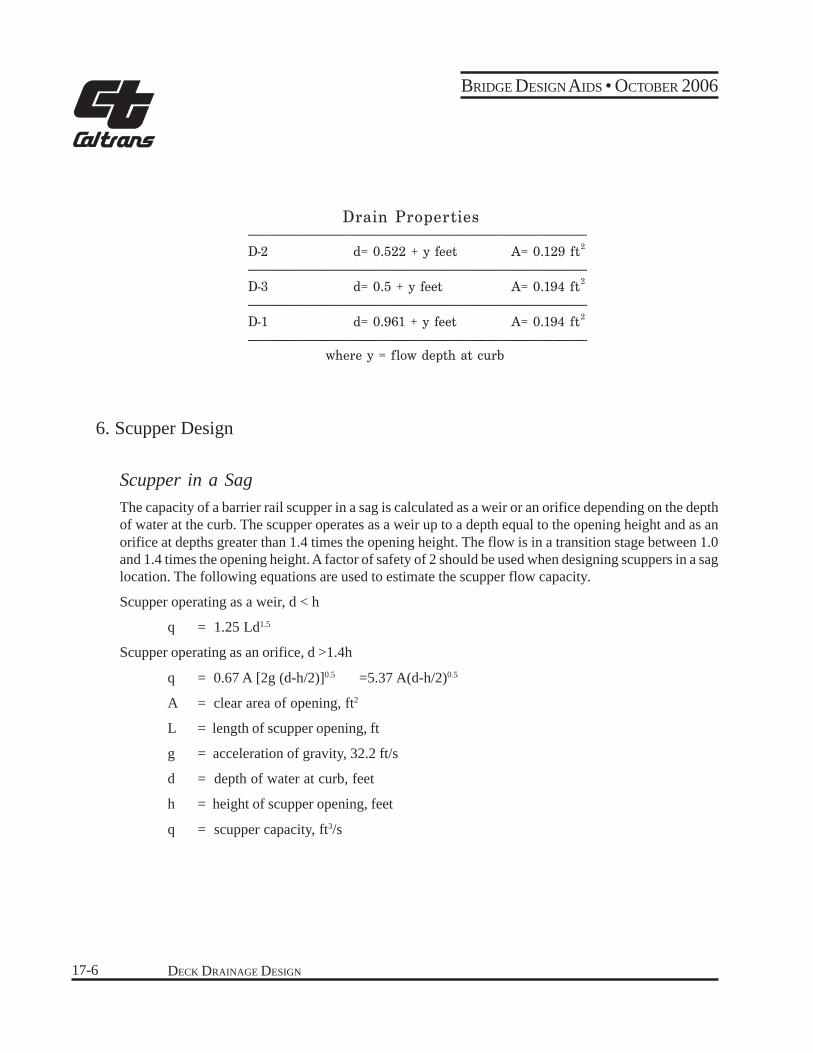
--------------------------------------------------------------------------------------------------------------------D-2 d= 0.522 + y feet A= 0.129 ft--------------------------------------------------------------------------------------------------------------------D-3 d= 0.5 + y feet A= 0.194 ft--------------------------------------------------------------------------------------------------------------------D-1 d= 0.961 + y feet A= 0.194 ft--------------------------------------------------------------------------------------------------------------------
2
2
2
where y = flow depth at curb
Drain Properties
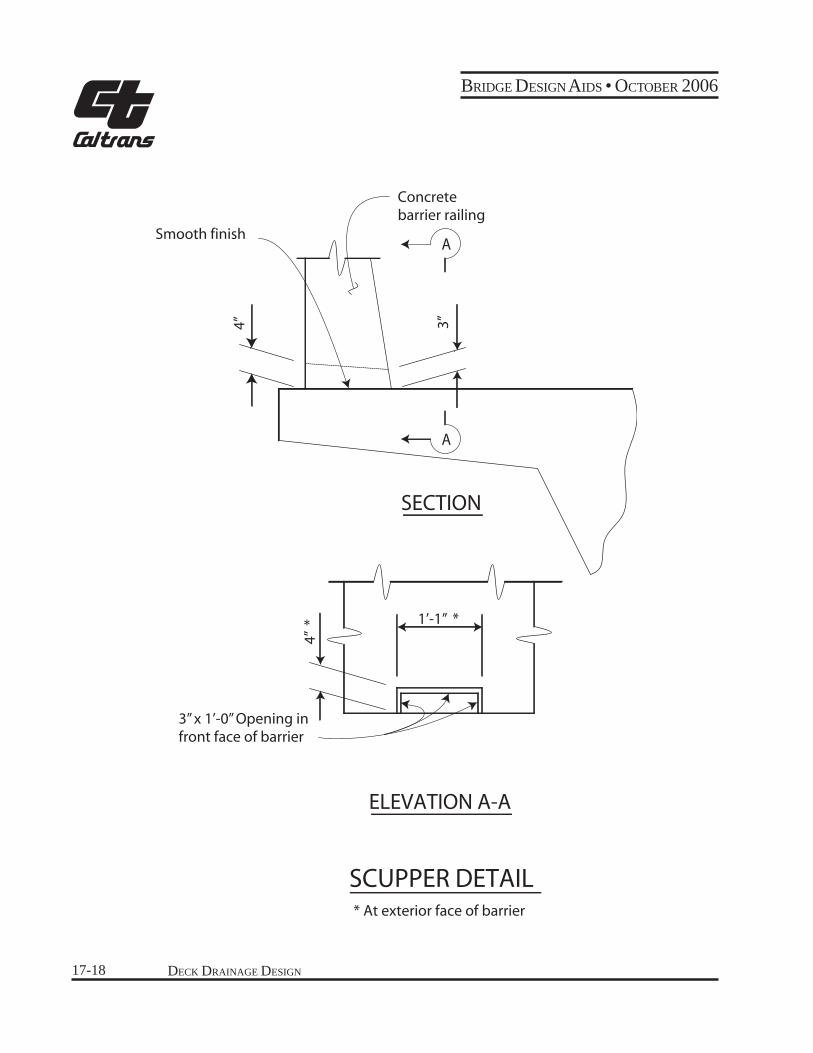
6. Scupper Design
Scupper in a SagThe capacity of a barrier rail scupper in a sag is calculated as a weir or an orifice depending on the depthof water at the curb. The scupper operates as a weir up to a depth equal to the opening height and as anorifice at depths greater than 1.4 times the opening height. The flow is in a transition stage between 1.0and 1.4 times the opening height. A factor of safety of 2 should be used when designing scuppers in a saglocation. The following equations are used to estimate the scupper flow capacity.
Scupper operating as a weir, d < h
q = 1.25 Ld1.5
Scupper operating as an orifice, d >1.4h
q = 0.67 A [2g (d-h/2)]0.5 =5.37 A(d-h/2)0.5
A = clear area of opening, ft2
L = length of scupper opening, ft
g = acceleration of gravity, 32.2 ft/s
d = depth of water at curb, feet
h = height of scupper opening, feet
q = scupper capacity, ft3/s
DECK DRAINAGE DESIGN
BRIDGE DESIGN AIDS • OCTOBER 2006
17-7
Scupper on GradeDeck drainage scuppers in bridge barrier railings on grade are designed as curb-opening inlets. To determinethe capacity of a scupper, the length of curb-opening inlet required for total interception of the gutter flowis first calculated. Then, the efficiency of the actual scupper opening is calculated to determine itscapacity.
LT = K Q0.42 S0.3 (1/nSx)0.6
E = 1-(1-L/LT)1.8
q = E Q
LT = length of curb opening to intercept 100% of gutter flow, feet
E = efficiency of curb-opening inlet shorter than LT
L = curb-opening length, feet
K = constant, 0.6 for english units
n = friction coefficient
S = longitudinal slope of deck, feet per foot
Sx = cross slope of deck, feet per foot
Q = gutter flow rate, ft3/s
q = scupper capacity, ft3/s
If the depth of flow at the curb exceeds the height of the scupper opening then the above method ofcalculating flow capacity is not applicable. The capacity can be roughly estimated using the orificeequation for a scupper in a sag.
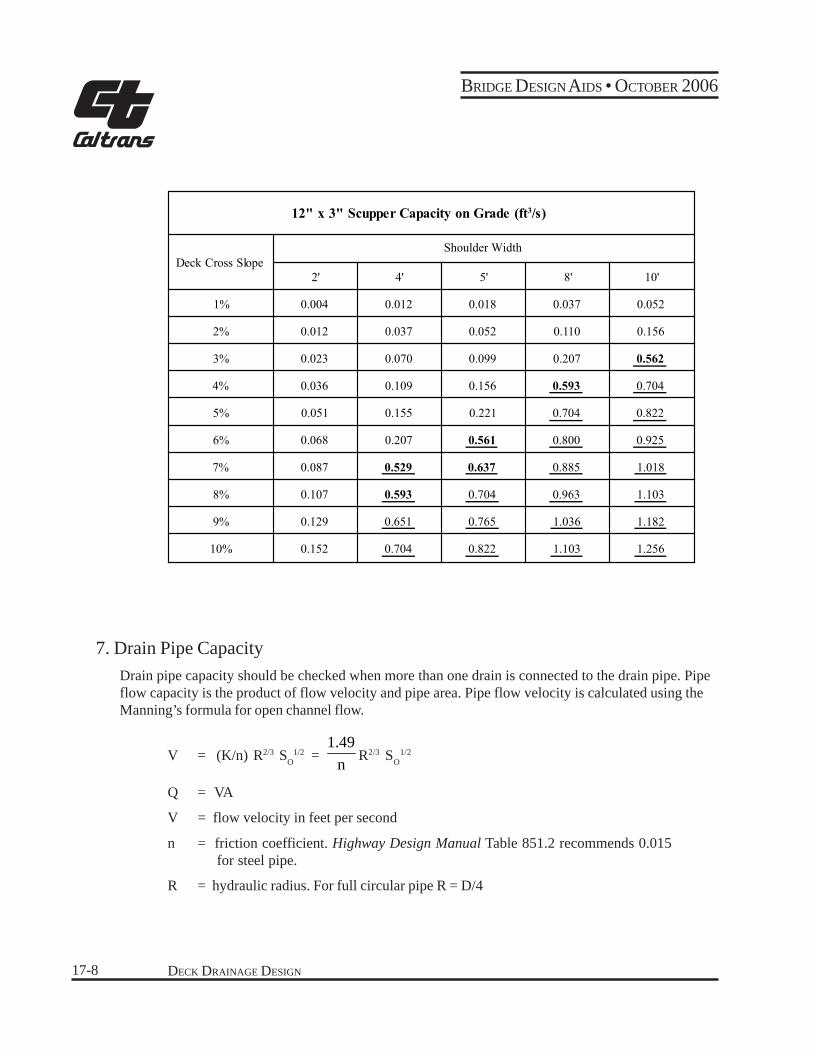
Capacity of a standard 12" x 3" scupper on grade with the shoulder flowing full and n = 0.016 are givenin the following table. When the depth of flow at the curb exceeds the height of the scupper opening theorifice capacity is given and is underlined. When the depth of flow is greater than the scupper height butless than 1.4h, the flow is in the transition stage between operation as a weir and an orifice. When this isthe case, the orifice equation gives a somewhat high estimate of capacity. These values are shown inbold and should be used with judgment.
BRIDGE DESIGN AIDS • OCTOBER 2006
DECK DRAINAGE DESIGN17-8
12" x 3" Scupper Capacity on Grade (ft3/s)
Deck Cross SlopeShoulder Width
2' 4' 5' 8' 10'
1% 0.004 0.012 0.018 0.037 0.052
2% 0.012 0.037 0.052 0.110 0.156
3% 0.023 0.070 0.099 0.207 0.562
4% 0.036 0.109 0.156 0.593 0.704
5% 0.051 0.155 0.221 0.704 0.822
6% 0.068 0.207 0.561 0.800 0.925
7% 0.087 0.529 0.637 0.885 1.018
8% 0.107 0.593 0.704 0.963 1.103
9% 0.129 0.651 0.765 1.036 1.182
10% 0.152 0.704 0.822 1.103 1.256
7. Drain Pipe CapacityDrain pipe capacity should be checked when more than one drain is connected to the drain pipe. Pipeflow capacity is the product of flow velocity and pipe area. Pipe flow velocity is calculated using theManning’s formula for open channel flow.
V = (K/n) R2/3 SO1/2 =
1.49n R2/3 SO
1/2
Q = VA
V = flow velocity in feet per second
n = friction coefficient. Highway Design Manual Table 851.2 recommends 0.015 for steel pipe.
R = hydraulic radius. For full circular pipe R = D/4
DECK DRAINAGE DESIGN
BRIDGE DESIGN AIDS • OCTOBER 2006
17-9
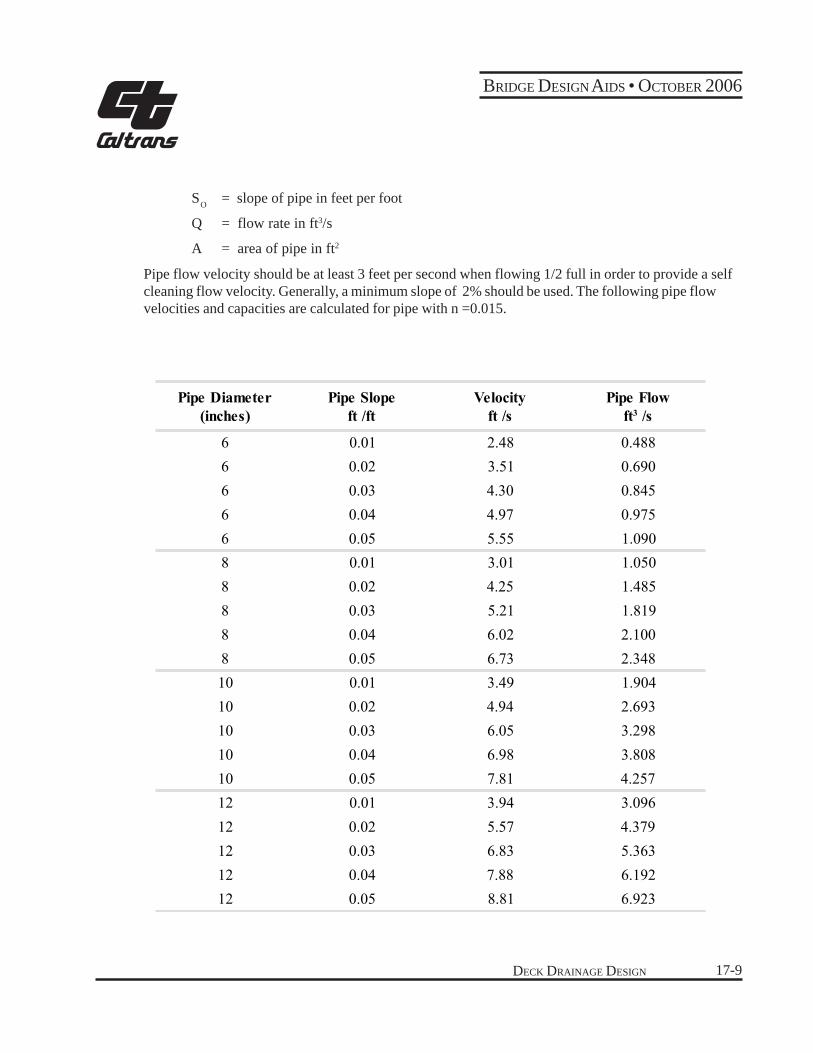
SO = slope of pipe in feet per foot
Q = flow rate in ft3/s
A = area of pipe in ft2
Pipe flow velocity should be at least 3 feet per second when flowing 1/2 full in order to provide a selfcleaning flow velocity. Generally, a minimum slope of 2% should be used. The following pipe flowvelocities and capacities are calculated for pipe with n =0.015.
Pipe Diameter(inches)
Pipe Slopeft /ft
Velocityft /s
Pipe Flowft3 /s
6 0.01 2.48 0.4886 0.02 3.51 0.6906 0.03 4.30 0.8456 0.04 4.97 0.9756 0.05 5.55 1.0908 0.01 3.01 1.0508 0.02 4.25 1.4858 0.03 5.21 1.8198 0.04 6.02 2.1008 0.05 6.73 2.34810 0.01 3.49 1.90410 0.02 4.94 2.69310 0.03 6.05 3.29810 0.04 6.98 3.80810 0.05 7.81 4.25712 0.01 3.94 3.09612 0.02 5.57 4.37912 0.03 6.83 5.36312 0.04 7.88 6.19212 0.05 8.81 6.923
BRIDGE DESIGN AIDS • OCTOBER 2006
DECK DRAINAGE DESIGN17-10
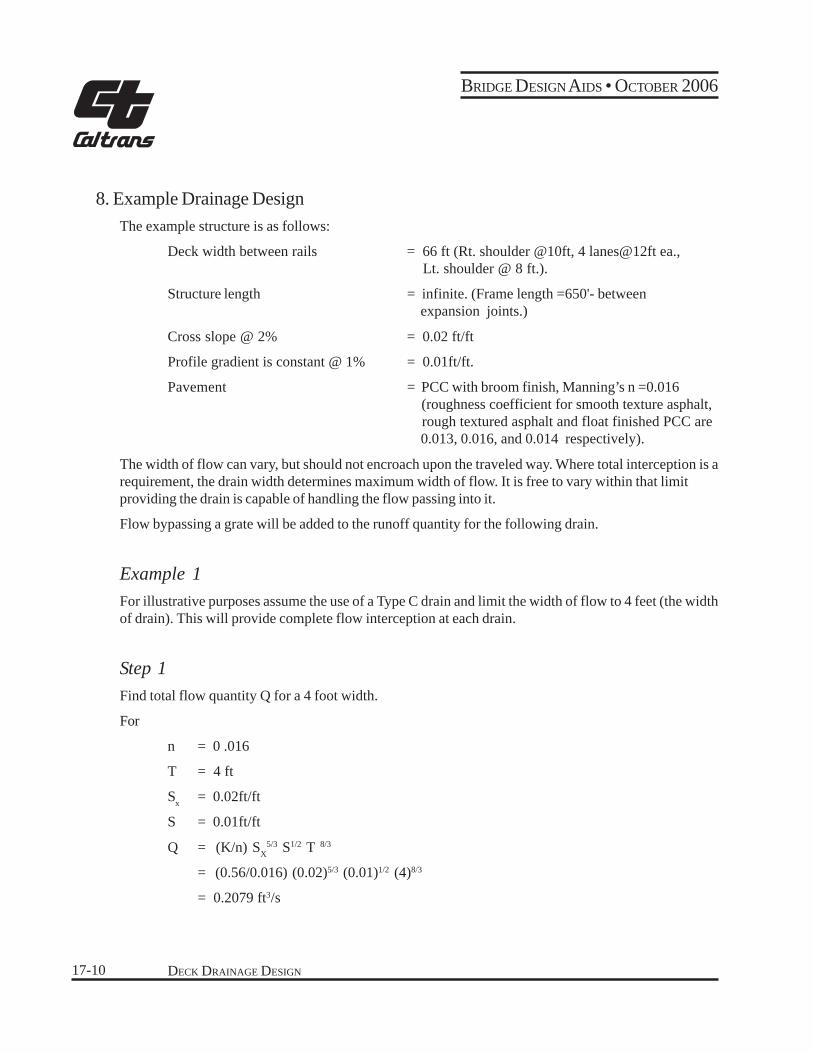
8. Example Drainage DesignThe example structure is as follows:
Deck width between rails = 66 ft (Rt. shoulder @10ft, 4 lanes@12ft ea., Lt. shoulder @ 8 ft.).
Structure length = infinite. (Frame length =650'- between expansion joints.)
Cross slope @ 2% = 0.02 ft/ft
Profile gradient is constant @ 1% = 0.01ft/ft.
Pavement = PCC with broom finish, Manning’s n =0.016 (roughness coefficient for smooth texture asphalt, rough textured asphalt and float finished PCC are 0.013, 0.016, and 0.014 respectively).
The width of flow can vary, but should not encroach upon the traveled way. Where total interception is arequirement, the drain width determines maximum width of flow. It is free to vary within that limitproviding the drain is capable of handling the flow passing into it.
Flow bypassing a grate will be added to the runoff quantity for the following drain.
Example 1For illustrative purposes assume the use of a Type C drain and limit the width of flow to 4 feet (the widthof drain). This will provide complete flow interception at each drain.
Step 1Find total flow quantity Q for a 4 foot width.
For
n = 0 .016
T = 4 ft
Sx = 0.02ft/ft
S = 0.01ft/ft
Q = (K/n) SX5/3 S1/2 T 8/3
= (0.56/0.016) (0.02)5/3 (0.01)1/2 (4)8/3
= 0.2079 ft3/s
DECK DRAINAGE DESIGN 17-11
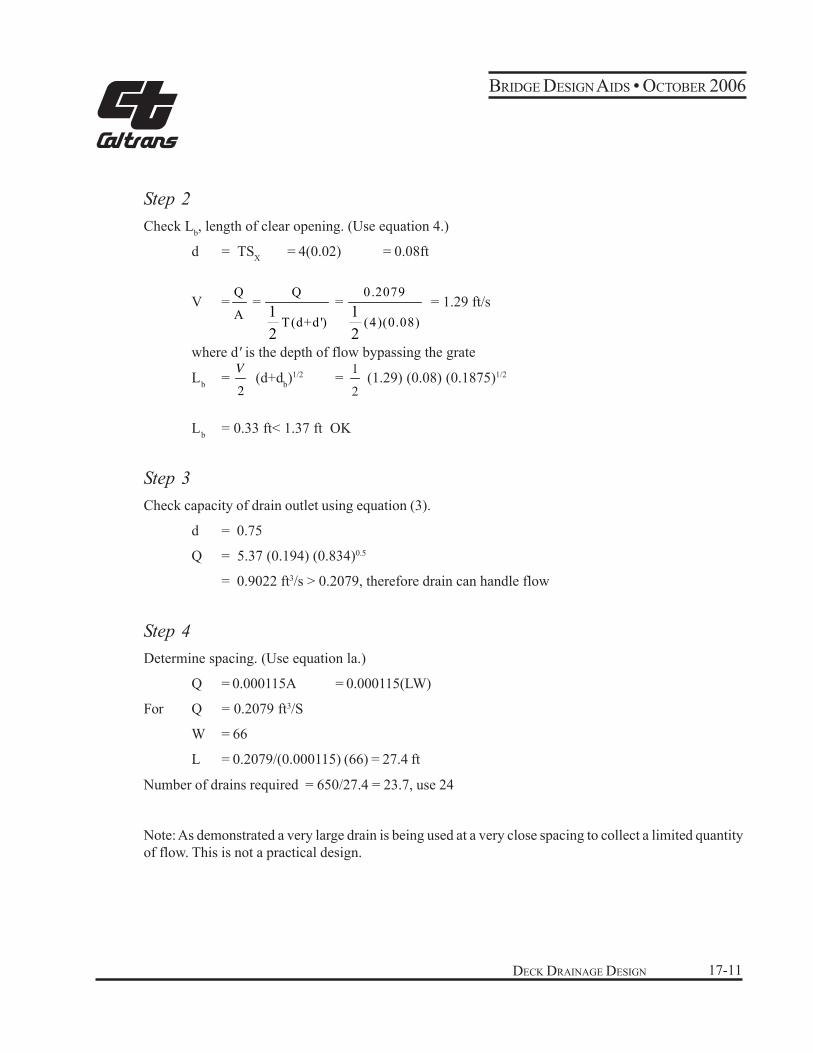
Step 2Check Lb, length of clear opening. (Use equation 4.)
d = TSX = 4(0.02) = 0.08ft
s/tf92.1== = =V
where d' is the depth of flow bypassing the grate
Lb = (d+db)1/2 = (1.29) (0.08) (0.1875)1/2
Lb = 0.33 ft< 1.37 ft OK
Step 3Check capacity of drain outlet using equation (3).
d = 0.75
Q = 5.37 (0.194) (0.834)0.5
= 0.9022 ft3/s > 0.2079, therefore drain can handle flow
Step 4Determine spacing. (Use equation la.)
Q = 0.000115A = 0.000115(LW)
For Q = 0.2079 ft3/S
W = 66
L = 0.2079/(0.000115) (66) = 27.4 ft
Number of drains required = 650/27.4 = 23.7, use 24
Note:As demonstrated a very large drain is being used at a very close spacing to collect a limited quantityof flow. This is not a practical design.
Q Q 0.2079
A T(d+d ') (4)(0.08)1 12 2
2
V 1
2
BRIDGE DESIGNAIDS • OCTOBER 2006
DECK DRAINAGE DESIGN17-12
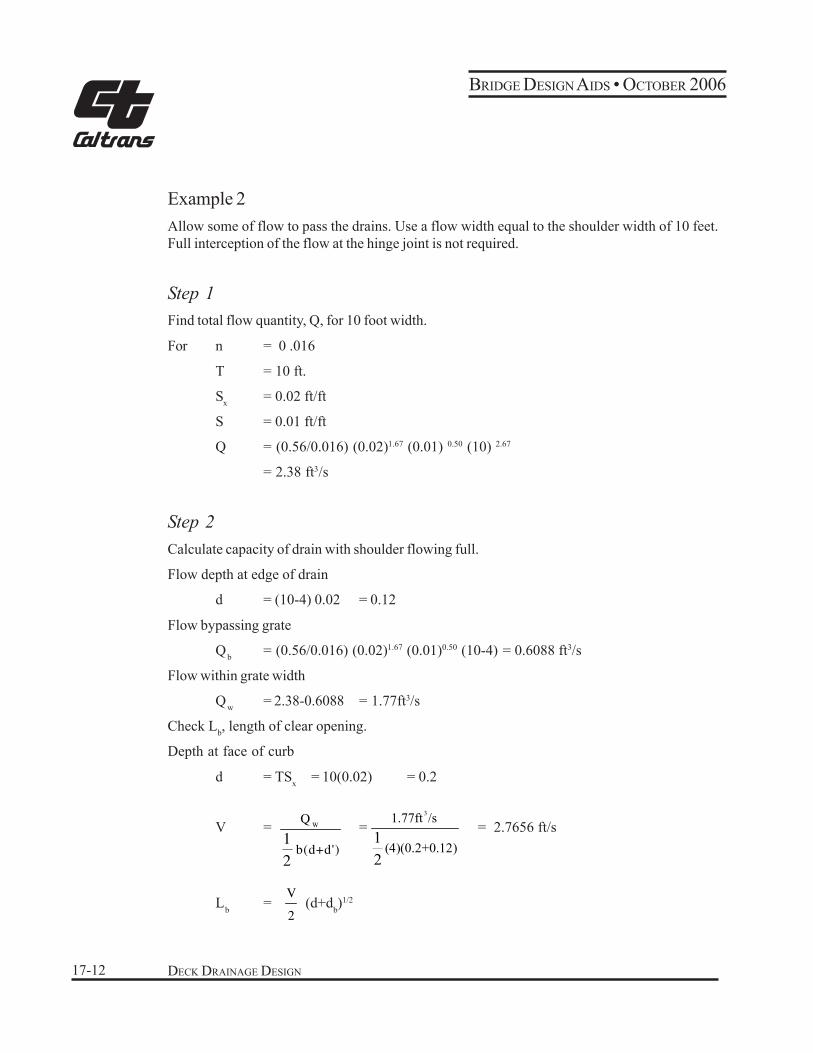
Example 2Allow some of flow to pass the drains. Use a flow width equal to the shoulder width of 10 feet.Full interception of the flow at the hinge joint is not required.
Step 1Find total flow quantity, Q, for 10 foot width.
For n = 0 .016
T = 10 ft.
Sx = 0.02 ft/ft
S = 0.01 ft/ft
Q = (0.56/0.016) (0.02)1.67 (0.01) 0.50 (10) 2.67
= 2.38 ft3/s
Step 2Calculate capacity of drain with shoulder flowing full.
Flow depth at edge of drain
d = (10-4) 0.02 = 0.12
Flow bypassing grate
Qb = (0.56/0.016) (0.02)1.67 (0.01)0.50 (10-4) = 0.6088 ft3/s
Flow within grate width
Qw = 2.38-0.6088 = 1.77ft3/s
Check Lb, length of clear opening.
Depth at face of curb
d = TSx = 10(0.02) = 0.2
V = = = 2.7656 ft/s
Lb = (d+db)1/2
31.77ft /s
(4)(0.2+0.12)12
V
2
WQ
b(d+d')12
BRIDGE DESIGNAIDS • OCTOBER 2006
DECK DRAINAGE DESIGN 17-13
= (0.2+0.19)1/2
= 0.8636 ft <1.37 ft OK
Check capacity of drain outlet using equation (3).
d = = 0.91
Qo = 5.37(0.20)(0.91)0.5
= 1.0245 ft3/s <1.77
Therefore drain capacity is controlled by outlet.
Bypass flow Qb = 2.38-1.0245 =1.355
Step 3Determine maximum distance to first drain from begin bridge.
First drain must be located before the point at which the flow width equals the shoulder width.
Q = 0.000115 LW
for
Q = shoulder flow capacity
W = bridge width
L =
L =
L = 313.57
2.7656
2
Q
0.000115 W
2.38
0.000115 (66)
0.2+0.120.75+
2
BRIDGE DESIGNAIDS • OCTOBER 2006
DECK DRAINAGE DESIGN17-14
Step 4Determine maximum spacing between intermediate drains.
Q = 0.000115 LW
for
Q = drain capacity with shoulder flowing full
W = bridge width
L =
L =
L = 134.98
say 135'
Step 5Determine drain layout
First drain at 313 ft from beginning of bridge
Intermediate drain at 135' max.
Last drain in frame adjacent to hinge joint.
Number of drain in first frame = +1= 3.5 Use 4 drains
Number of drains in intermediate frames = = 4.8 Use 5 drains
Actual layout would be adjusted to best fit the available down drain locations and minimize thelength of longitudinal drain pipes. In this example fewer drains are required because the draincapacity is much greater due to increasing the depth of flow at the drain and some flow isallowed to cross the hinge joint.
If full interception was required prior to the hinge joint or a superelevation reversal, additionaldrains would be required at a reduced spacing upstream of the joint. The required drain spacingwould be determined by a trial and correction process to limit the width of flow at the last drainto less than the drain width.
1.0245
0.000115 (66)
Q
0.000115 W
650
135
650 313
135
−
BRIDGE DESIGNAIDS • OCTOBER 2006
DECK DRAINAGE DESIGN
BRIDGE DESIGN AIDS • OCTOBER 2006
17-15
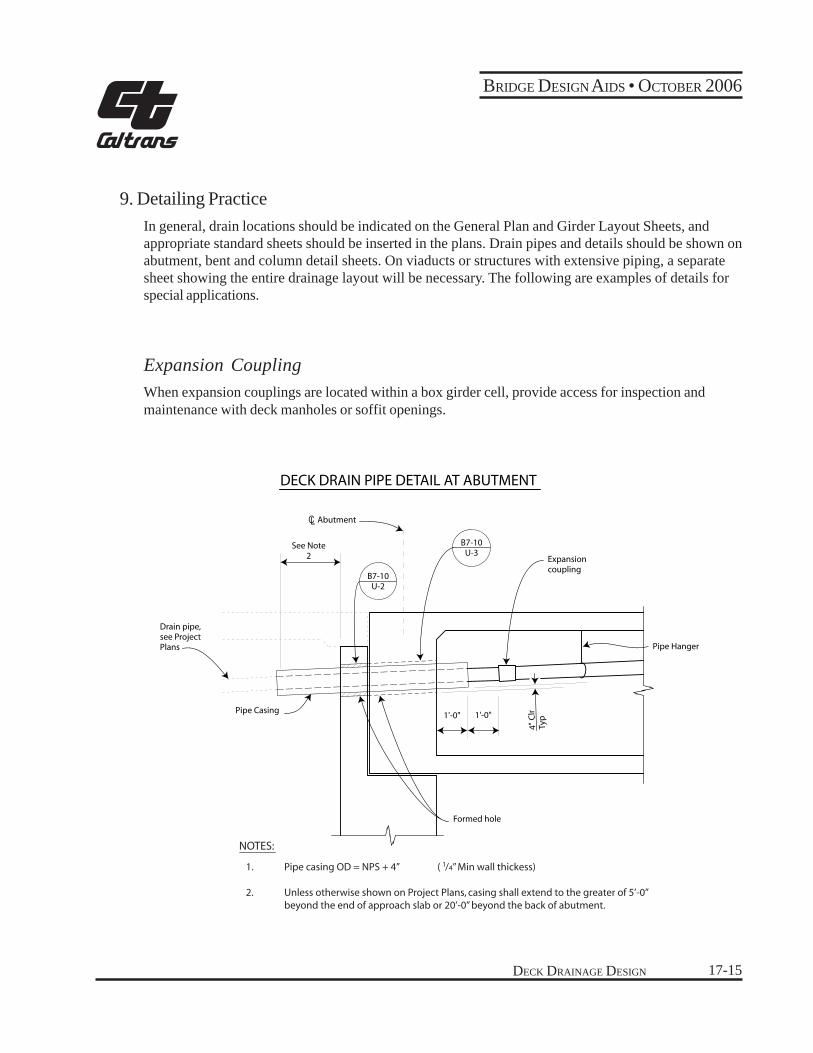
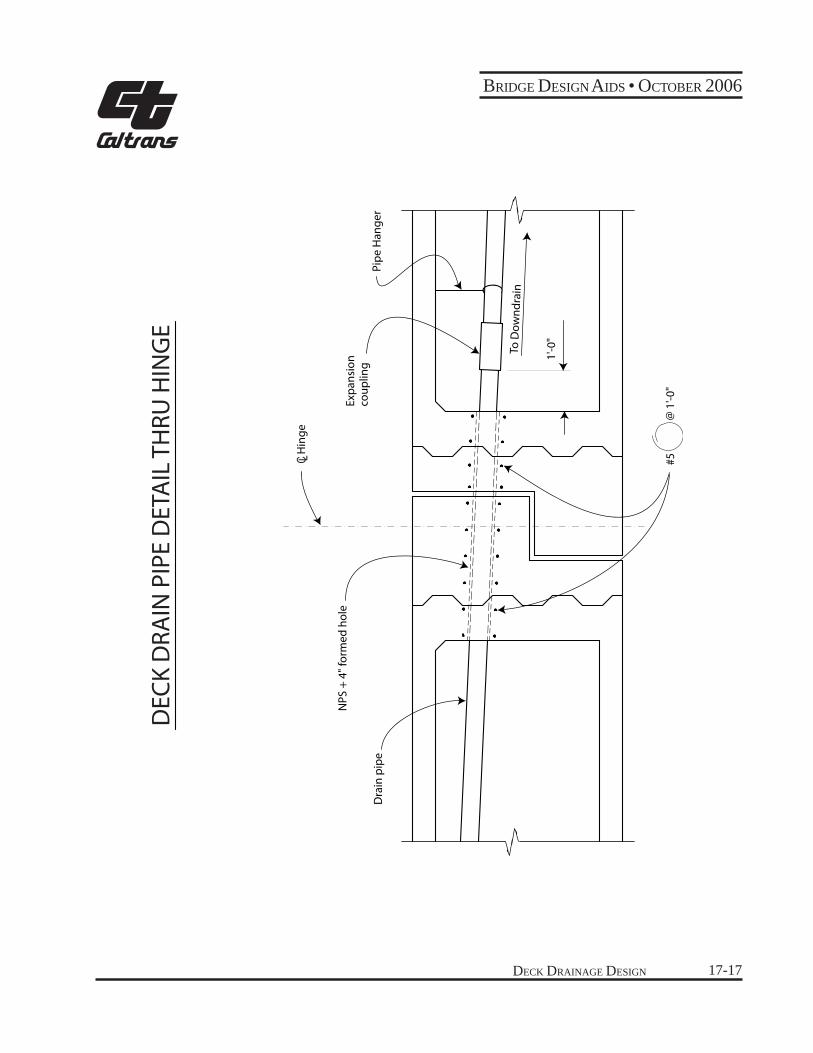
9. Detailing PracticeIn general, drain locations should be indicated on the General Plan and Girder Layout Sheets, andappropriate standard sheets should be inserted in the plans. Drain pipes and details should be shown onabutment, bent and column detail sheets. On viaducts or structures with extensive piping, a separatesheet showing the entire drainage layout will be necessary. The following are examples of details forspecial applications.
Expansion CouplingWhen expansion couplings are located within a box girder cell, provide access for inspection andmaintenance with deck manholes or soffit openings.
Abutment
Pipe Hanger
See Note2
Drain pipe,see ProjectPlans
DECK DRAIN PIPE DETAIL AT ABUTMENT
Formed hole
Expansioncoupling
Pipe Casing
B7-10U-3
B7-10U-2
1'-0"
1'-0" 4"
Clr
Typ
CL
NOTES:
1. Pipe casing OD = NPS + 4” ( /4” Min wall thickess)
2. Unless otherwise shown on Project Plans, casing shall extend to the greater of 5’-0” beyond the end of approach slab or 20’-0” beyond the back of abutment.
1
BRIDGE DESIGN AIDS • OCTOBER 2006
DECK DRAINAGE DESIGN17-16
1/4
1/4
End ring GasketSleeve body thicknessand length 1/4” x 1’-4”
L 3” x 3” x 0.875” x 2”
See Notes 2
2”
2 13
/16”
2” 2”
2”
"a"
3’-0”
1.
2.
3.
4.
NOTES:
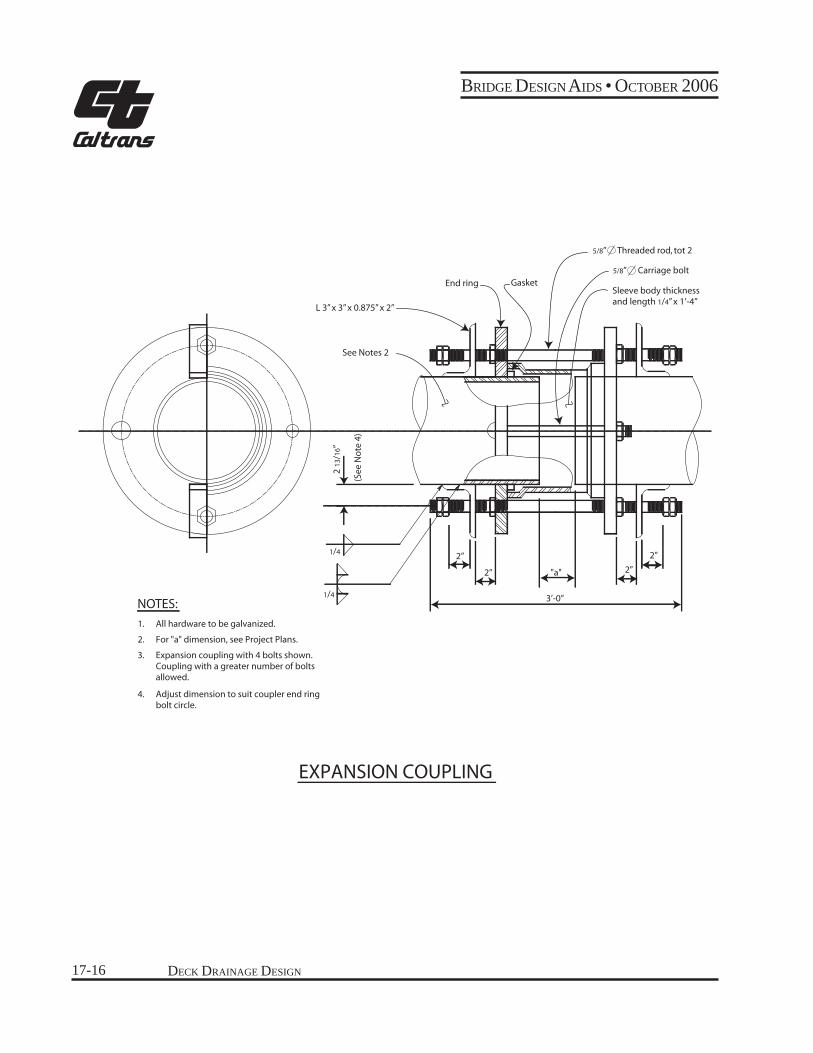
EXPANSION COUPLING
All hardware to be galvanized.
For "a" dimension, see Project Plans.
Expansion coupling with 4 bolts shown. Coupling with a greater number of boltsallowed.
Adjust dimension to suit coupler end ringbolt circle.
5/8” Threaded rod, tot 2
5/8” Carriage bolt
(See
No
te 4
)
DECK DRAINAGE DESIGN
BRIDGE DESIGN AIDS • OCTOBER 2006
17-17
Pip
e H
ang
er
Hin
ge
Dra
in p
ipe
To D
ow
nd
rain
DEC
K D
RAIN
PIP
E D
ETA
IL T
HRU
HIN
GE
Exp
ansi
on
cou
plin
g
#5
@
1'-0
"
1'-0
"
NPS
+ 4
" fo
rmed
ho
le
C L
BRIDGE DESIGN AIDS • OCTOBER 2006
DECK DRAINAGE DESIGN17-18
Concretebarrier railing
Smooth finish4” 3”
4” *
A
A
1’-1” *
3” x 1’-0” Opening infront face of barrier
SECTION
ELEVATION A-A
SCUPPER DETAIL* At exterior face of barrier
DECK DRAINAGE DESIGN
BRIDGE DESIGN AIDS • OCTOBER 2006
17-19
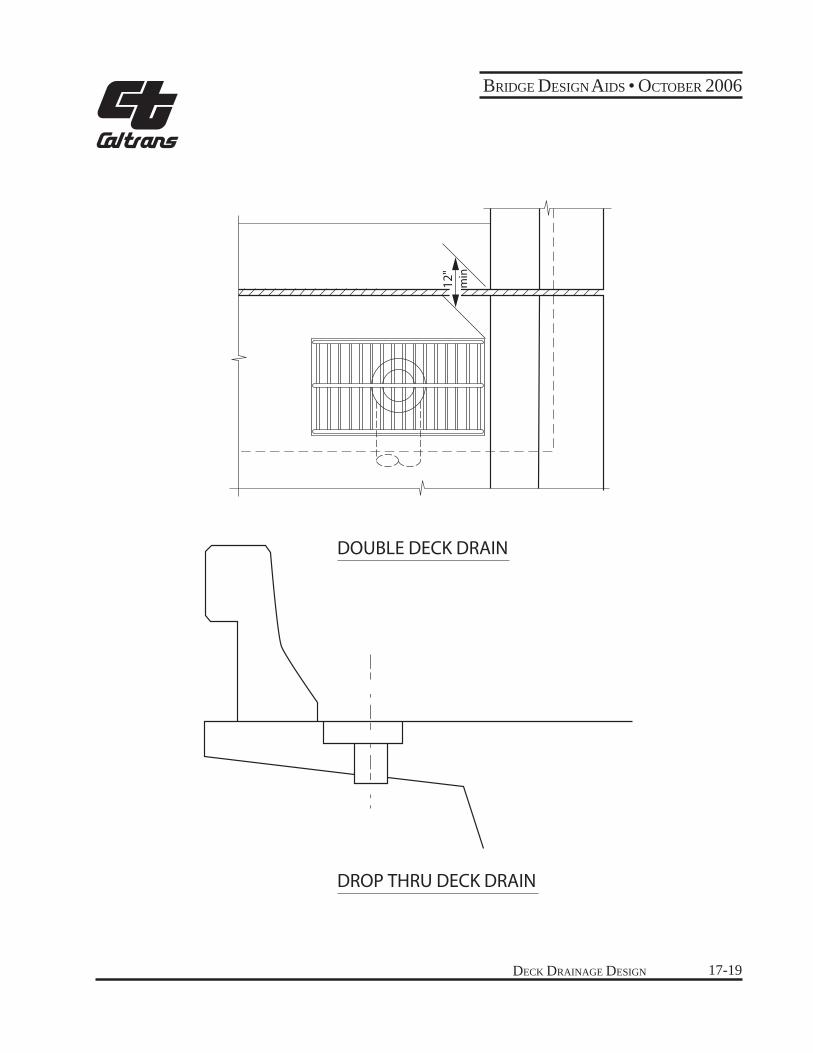
12"
min
DOUBLE DECK DRAIN
DROP THRU DECK DRAIN
BRIDGE DESIGN AIDS • OCTOBER 2006
DECK DRAINAGE DESIGN17-20
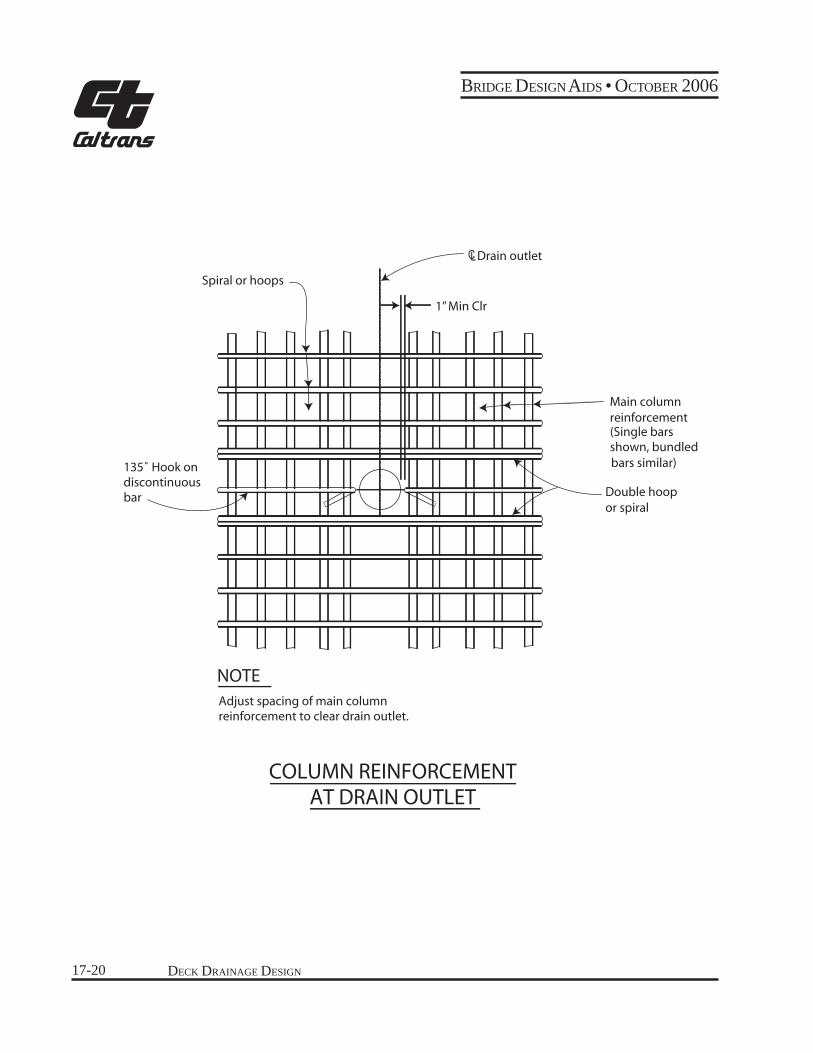
Main column reinforcement(Single bars shown, bundledbars similar)
Drain outlet
Spiral or hoops
135˚ Hook ondiscontinuousbar Double hoop
or spiral
1” Min Clr
Adjust spacing of main columnreinforcement to clear drain outlet.
NOTE
COLUMN REINFORCEMENTAT DRAIN OUTLET
CL