Embed Size (px)
Citation preview
Evidence-Based Review of Moderate to Severe Acquired Brain Injury 2013
1 Module 17-Assessment of Outcomes Following Acquired/Traumatic Brain Injury-V9-2013 www.abiebr.com Updated August 2013
17. Assessment of Outcomes Following Acquired/Traumatic Brain Injury
Katherine Salter BA, Robert Teasell MD, Jeff Jutai PhD.

Evidence-Based Review of Moderate to Severe Acquired Brain Injury 2013
2 Module 17-Assessment of Outcomes Following Acquired/Traumatic Brain Injury-V9-2013 www.abiebr.com Updated August 2013
Table of Contents
17.1 Introduction ...................................................................................... 6
17.1.1 Evaluation Criteria for Outcome Measures.......................................... 6
17.2 Agitated Behavior Scale (ABS) ........................................................... 9
17.3 Berg Balance Scale (BBS) ................................................................. 12
17.4 Community Balance and Mobility Scale (CBMS) .............................. 15
17.5 Community Integration Questionnaire (CIQ) ................................... 16
17.6 Disability Rating Scale (DRS) ............................................................ 22
17.7 Fatigue Severity Scale (FSS) ............................................................. 25
17.8 Functional Independence Measure .................................................. 28
17.9 Functional Assessment Measure (FIM+FAM) ................................... 33
17.10 Galveston Orientation and Amnesia Test (GOAT) .......................... 36
17.11 Glasgow Coma Scale (GCS) ............................................................ 39
17.12 Glasgow Outcome Scale (GOS)/Extended Glasgow Coma Scale (GOSE) .................................................................................................... 43
17.13 Hospital Anxiety and Depression Scale (HADS) .............................. 47
17.14 Mayo-Portland Adaptability Inventory (MPAI-4) ........................... 50
17.15 Medical Outcomes Study Short Form 36 (SF-36) ............................ 55
17.16 Mini Mental Status Examination (MMSE) ...................................... 62
17.17 Neurobehavioral Functioning Inventory (NFI) ................................ 66
17.18 Rancho Los Amigos Levels of Cognitive Functioning Scale (LCFS) ... 70
17.19 Satisfaction with Life Scale (SWLS) ................................................. 72
17.20 Quality of Life after Traumatic Brain Injury (QOLIBRI) .................... 76
17.21 Reference List ................................................................................ 80

Evidence-Based Review of Moderate to Severe Acquired Brain Injury 2013
3 Module 17-Assessment of Outcomes Following Acquired/Traumatic Brain Injury-V9-2013 www.abiebr.com Updated August 2013
Table Directory Table 17.1 Selected Tools for Assessment of Outcome in ABI/TBI Table 17.2 Evaluation Criteria and Standards Table 17.3 Evaluation Standards – Rigor Table 17.4 Evaluation Summary Table 17.5 Agitated Behavior Scale Table 17.6 Characteristics of the Agitated Behavior Scale Table 17.7 ABS Evaluation Summary Table 17.8 Characteristics of the Berg Balance Scale Table 17.9 BBS Evaluation Summary Table 17.10 Characteristics of the Community Balance and Mobility Scale Table 17.11 Community Balance and Mobility Scale Evaluation Summary Table 17.12 Characteristics of the Community Integration Questionnaire Table 17.13 CIQ Evaluation Summary Table 17.14 Characteristics of the Disability Rating Scale Table 17.15 Disability Rating Scale Evaluation Summary Table 17.16 Fatigue Severity Scale Table 17.17 Characteristics of the Fatigue Severity Scale Table 17.18 FSS Evaluation Summary Table 17.19 Characteristics of Functional Independence Measure Table 17.20 FIM Evaluation Summary Table 17.21 Characteristics of the FIM+FAM

Evidence-Based Review of Moderate to Severe Acquired Brain Injury 2013
4 Module 17-Assessment of Outcomes Following Acquired/Traumatic Brain Injury-V9-2013 www.abiebr.com Updated August 2013
Table 17.22 FIM+FAM Evaluation Summary Table 17.23 Characteristics of the Galveston Orientation and Amnesia Test Table 17.24 GOAT Evaluation Summary Table 17.25 Glasgow Coma Scale Table 17.26 Characteristics of the Glasgow Coma Scale Table 17.27 GCS Evaluation Summary Table 17.28 Glasgow Outcome Scale Table 17.29 Characteristics of the GOS and GOSE Table 17.30 GOS/GOSE Evaluation Summary Table 17.31 The Hospital Anxiety and Depression Scale Table 17.32 Characteristics of the HADS Table 17.33 HADS Evaluation Summary Table 17.34 Characteristics of the Mayo-Portland Adaptability Inventory Table 17.35 MPAI-4 Evaluation Summary Table 17.36 Characteristics of the Medical Outcomes Study Short Form 36 Table 17.37 SF-36 Evaluation Summary Table 17.38 Characteristics of the Mini Mental State Examination Table 17.39 MMSE Evaluation Summary Table 17.40 Characteristics of the Neurobehavioral Functioning Inventory Table 17.41 NFI Evaluation Summary Table 17.42 Rancho Los Amigos Levels of Cognitive Functioning

Evidence-Based Review of Moderate to Severe Acquired Brain Injury 2013
5 Module 17-Assessment of Outcomes Following Acquired/Traumatic Brain Injury-V9-2013 www.abiebr.com Updated August 2013
Table 17.43 Characteristics of the Rancho Los Amigos Scale Table 17.44 LCFS Evaluation Summary Table 17.45 Satisfaction with Life Scale Table 17.46 Characteristics of the Satisfaction with Life Scale Table 17.47 SWLS Evaluation Summary Table 17.48 The QOLIBRI Scale Table 17.49 Characteristics of the QOLIBRI Table 17.50 QOLIBRI Evaluation Summary

Evidence-Based Review of Moderate to Severe Acquired Brain Injury 2013
6 Module 17-Assessment of Outcomes Following Acquired/Traumatic Brain Injury-V9-2013 www.abiebr.com Updated August 2013
17. Assessment of Outcomes Following Acquired and or Traumatic Brain Injury
17.1 Introduction The following is a review of measurement tools used in the assessment of individuals following brain injury. The list of tools appearing here was derived by a consensus of experts working on the Evidence-Based Review of Acquired Brain Injury (ABI) literature. The tools were chosen based upon a 3-step process. The first was the development of an inventory of current outcome measures based upon both the literature and discussions held with the rehabilitation team members who actually used the tools. The second was a consensus agreement among a panel of experts as to which was most important. Finally, there had to be sufficient research on the outcome measure in ABI populations to allow a meaningful analysis of the psychometric qualities of the tools. Those outcome measures that made it through this process were selected for review. Table 17.1 Selected Tools for Assessment of Outcome in ABI/TBI Agitated Behavior Scale Glasgow Outcome Scale
Berg Balance Scale Hamilton Anxiety and Depression Scale
Community Balance & Mobility Scale Mayo-Portland Adaptability Inventory
Community Integration Questionnaire Medical Outcomes Study SF-36
Disability Rating Scale Mini Mental State Evaluation
Fatigue Severity Scale Neurobehavioural Functioning Inventory
Functional Independence Measure Rancho Los Amigos Level of Cognitive Functioning Scale
Functional Assessment Measure Satisfaction with Life Scale
Galveston Orientation and Amnesia Test Quality of Life after TBI
Glasgow Coma Scale
17.1.1 Evaluation Criteria for Outcome Measures It is necessary to have a set of criteria to guide the selection of outcomes measures. Reliability, validity and responsiveness have widespread usage and are discussed as being essential to the evaluation of outcome measures (Duncan et al. 2000; van der Putten et al. 1999; Roberts & Counsell, 1998; Law, 2002). Finch et al. (2002) provide a good tutorial on issues for outcome measure selection. The Health Technology Assessment (HTA) programme (Fitzpatrick et al. University of Southampton, UK, 1998) examined 413 articles focusing on methodological aspects of the use and development of patient-based outcome measures. In their report, they recommend the use of 8 evaluation criteria. Table 1 lists the criteria and gives a definition for each one. It also identifies a recommended standard for quantifying (rating) each criterion, where applicable, and how the ratings should be interpreted. The

Evidence-Based Review of Moderate to Severe Acquired Brain Injury 2013
7 Module 17-Assessment of Outcomes Following Acquired/Traumatic Brain Injury-V9-2013 www.abiebr.com Updated August 2013
table, including some additional considerations described below, was applied to each of the outcome measures reviewed. Table 17.2 - Evaluation Criteria and Standards
Criterion Definition Standard
1. Appropriateness The match of the instrument to the purpose/question under study. One must determine what information is required and what use will be made of the information gathered (Wade 1992)
Depends upon the specific purpose for which the measurement is intended.
2. Reliability - Refers to the reproducibility and internal consistency of the instrument. - Reproducibility addresses the degree to which the score is free from random error. Test re-test & inter-observer reliability both focus on this aspect of reliability and are commonly evaluated using correlation statistics including ICC, Pearson’s or Spearman’s coefficients and kappa coefficients (weighted or unweighted). - Internal consistency assesses the homogeneity of the scale items. It is generally examined using split-half reliability or Cronbach’s alpha statistics. Item-to-item and item-to scale correlations are also accepted methods.
Test-retest or interobserver reliability (ICC; kappa statistics):
1
Excellent: 0.75; Adequate: 0.4 – 0.74;
Poor: 0.40 Note: Fitzpatrick et al. (1998) recommend a minimum test-retest reliability of 0.90 if the measure is to be used to evaluate the ongoing progress of an individual in a treatment situation. Internal consistency (split-half or
Cronbach’s statistics):
Excellent: 0.80; Adequate: 0.70 – 0.79; Poor < 0.70
2
Note: Fitzpatrick et al. (1998) caution
values in excess of 0.90 may indicate redundancy. Inter-item & item-to-scale correlation coefficients: -Adequate levels -- inter-item: between 0.3 and 0.9; item-to-scale: between 0.2 and 0.9
3
3. Validity Does the instrument measure what it purports to measure? Forms of validity include face, content, construct, and criterion. Concurrent, convergent or discriminative, and predictive validity are all considered to be forms of criterion validity. However, concurrent, convergent and discriminative validity all depend on the existence of a “gold standard” to provide a basis for comparison. If no gold standard exists, they represent a form of construct validity in which the relationship to another measure is hypothesized (Finch et al. 2002).
Construct/convergent and concurrent correlations:
Excellent: 0.60, Adequate: 0.31 -
0.59, Poor: 0.304
ROC analysis – AUC: Excellent:
0.90, Adequate: 0.70 – 0.89, Poor: <0.70
5
There are no agreed on standards by which to judge sensitivity and specificity as a validity index (Riddle & Stratford, 1999) Predictive Validity: According to Shukla et al., (2011) when using many of these instruments there is no “defined threshold score beyond which an accurate prediction can be

Evidence-Based Review of Moderate to Severe Acquired Brain Injury 2013
8 Module 17-Assessment of Outcomes Following Acquired/Traumatic Brain Injury-V9-2013 www.abiebr.com Updated August 2013
Criterion Definition Standard
made”.
4. Responsiveness Sensitivity to changes within patients over time (which might be indicative of therapeutic effects). Responsiveness is most commonly evaluated through correlation with other change scores, effect sizes, standardized response means, relative efficiency, sensitivity & specificity of change scores and ROC analysis. Assessment of possible floor and ceiling effects is included as they indicate limits to the range of detectable change beyond which no further improvement or deterioration can be noted.
Sensitivity to change: Excellent: Evidence of change in expected direction using methods such as standardized effect sizes: <0.5 = small; 0.5 – 0.8 = moderate
0.8 = large) Also, by way of standardized response means, ROC analysis of change scores (area under the curve – see above) or relative efficiency. Adequate: Evidence of moderate/less change than expected; conflicting evidence. Poor: Weak evidence based solely on p-values (statistical significance)
6
Floor/Ceiling Effects: Excellent: No floor or ceiling effects Adequate: floor and ceiling effects
20% of patients who attain either the minimum (floor) or maximum (ceiling) score. Poor: >20%.
7
5. Precision Number of gradations or distinctions within the measurement. E.g. Yes/no response vs. a 7-point Likert response set
Depends on the precision required for the purpose of the measurement (e.g., classification, evaluation, prediction).
6. Interpretability How meaningful are the scores? Are there consistent definitions and classifications for results? Are there norms available for comparison?
Jutai & Teasell (2003) point out these practical issues should not be separated from consideration of the values that underscore the selection of outcome measures. A brief assessment of practicality will accompany each summary evaluation.
7. Acceptability How acceptable the scale is in terms of completion by the patient – does it represent a burden? Can the assessment be completed by proxy, if necessary?
8. Feasibility Extent of effort, burden, expense & disruption to staff/clinical care arising from the administration of the instrument.
Unless otherwise noted within the table, criteria and definitions: Fitzpatrick et al. (1998); McDowell & Newell (1996). Sources for evaluation standards:
1Andresen (2000); Hseuh et al. (2001); Wolfe et al.
(1991); 2Andresen (2000);
3Hobart et al. (2001); Fitzpatrick et al. (1998);
4,6Andresen (2000); McDowell &
Newell (1996); Fitzpatrick et al. (1998); Cohen et al. 2000; 5McDowell & Newell (1996);
7Hobart et al.
(2001).

Evidence-Based Review of Moderate to Severe Acquired Brain Injury 2013
9 Module 17-Assessment of Outcomes Following Acquired/Traumatic Brain Injury-V9-2013 www.abiebr.com Updated August 2013
Each measure reviewed was also assessed for the thoroughness with which its reliability, validity and responsiveness have been reported in the literature. Standards for evaluation of rigor were adapted from McDowell & Newell (1996) and Andresen (2000).
Table 17.3 Evaluation Standards – Rigor
Thoroughness or Rigor of testing
Excellent – most major forms of evaluation reported. Adequate – several studies and/or several types of testing reported Poor – minimal information is reported and/or few studies (other than author’s) N/A– no information available
Assessments of rigor using the above standards are given along with evaluation ratings for reliability, validity and responsiveness for each measure (see below).
Table 17.4 Evaluation Summary
Reliability Validity Responsiveness
Rigor Results Rigor Results Rigor Results Floor/ ceiling
NOTE: +++=Excellent; ++=Adequate; +=Poor; N/A = insufficient information; TR=Test re-test; IC= internal consistency; IO = Interobserver; varied (re. floor/ceiling effects; mixed results)
Ratings of +++(excellent), ++ (adequate) and + (poor) results are assigned based on the criteria and evidence presented in the standards column of Table 1. For example, If a rating of “+++” or excellent is given for validity, it means that evidence has been presented demonstrating excellent construct validity based on the standards provided and in various forms including convergent and discriminant validity as well as predictive validity. In addition to the criteria outlined above, the following additional issues were considered:
Has the measure been used in an ABI/TBI population? Has the measure been tested for use with proxy assessment?
17.2 Agitated Behavior Scale (ABS) The ABS was designed to assess agitation in patients who had sustained a TBI by Allied Health Professionals (AHP) working with them (Corrigan, 1989). According to Levi et al. (2005), despite the availability of the scale, agitation remains unmeasured by most who work with the TBI population. The scale, which began as a 39 item scale, was reduced to 14 items, with each item scoring 1 to 4, (from absent to present to an extreme degree). The scale which was originally tested by nurses, occupational therapists (OT), physiotherapists (PT) and other hospital staff, was designed to be used by allied health professionals

Evidence-Based Review of Moderate to Severe Acquired Brain Injury 2013
10 Module 17-Assessment of Outcomes Following Acquired/Traumatic Brain Injury-V9-2013 www.abiebr.com Updated August 2013
(Corrigan 1989). The total score, which is considered the best overall measure of agitation, is calculated by adding the ratings (from one to four) on each of the 14 items (see table 17.5). The scale can also be divided into 3 subscales. Disinhibition subscale includes items 1, 2, 3, 6, 7, 8, 9, &10; the Aggression subscale includes itesm 3, 4, 5 &14; and the Lability subscale includes items 11, 12, &13 (Corrigan and Bogner 1994) Individual scores of >/22 on the ABS indicate high agitation, conversely scores of 21 or lower indicate low agitation (Corrigan and Mysiw, 1988).
Table 17.5 Agitated Behavior Scale (Corrigan 1989)
1. Short Attention span, easy distractibility, inability to concentrate _______
2. Impulsive, impatient, low tolerance for pain or frustration _______
3. Uncooperative, resistant to care, demanding _______
4. Violent and or threatening violence toward people or property _______
5. Explosive and or unpredictable anger _______
6. Rocking, rubbing, moaning or other self-stimulating behaviour _______
7. Pulling at tubes, restraints etc _______
8. Wandering from treatment areas _______
9. Restlessness, pacing, excessive movement _______
10. Repetitive behaviors, motor and or verbal _______
11. Rapid, loud or excessive talking _______
12. Sudden changes of mood _______
13. Easily initiated or excessive crying and or laughter _______
14. Self-abusiveness, physical and or verbal _______
1= absent: the behaviour is not present; 2= present to a slight degree; 3= present to a moderate degree; 4= present to an extreme degree (Corrigan, 1989).
Table 17.6 Characteristics of the Agitated Behavior Scale
Reliability Interobserver reliability: Inter-rater correlation of the total score has been found to exceed 0.70 (Corrigan and Bogner, 1995). CC of .920 for the total score and for the subscale: Disinhibition CC of .902; Aggression CC of .090; Lability CC of .726 (Bogner et al., 1999) Results from a long term care facility also indicae good inter-rater reliability with a CC of .906 for the total score, .870 for Disinhibition, .886 for Aggression and .860 for Lability. Internal Consistency: Cronbach’s scores have been consistently above .838 to .914 (Corrigan, 1989; Corrigan et al., 1995; Bogner et al., 1999). Theta scores ranged from .845-.920 indicating adequate internal consistency (Corrigan, 1989). When test the scale to determine it internal consistency with individuals living in a long term care facility, Cronbach were.808 and .740 (Bogner et al., 1999).
Validity Concurrent validity: The correlations between the ABS and the Braintree Agitation Scale GCOP and GCOD were consistently high (p<0.001) (Corrigan, 1989). Construct Validity: Agitation was also found to be correlated with the

Evidence-Based Review of Moderate to Severe Acquired Brain Injury 2013
11 Module 17-Assessment of Outcomes Following Acquired/Traumatic Brain Injury-V9-2013 www.abiebr.com Updated August 2013
OGMS (r=-.529, p<0.001) and the MMS (r=-.526, p<0.001) (Corrigan and Mysiw, 1988). Predictive validity: Improvement on various cognition scales (MMS and the FIM Cognition) have been found to predict a decrease in ABS scores (Bogner et al., 2000; Corrigan and Bogner 1995).
Responsiveness Corrigan and Mysiw (1988) found that as scores on the Orientation Group Monitoring System (OGMS) and the Mini-Mental State (MMS) improved, scores on the ABS decreased. Again, as PTA was resolved and cognition scores improved, agitation scores decreased. Corrigan et al. (1996) found scores from the ABS when used to assess agitation in both an Alzheimer’s disease group and an ABI group (both young and older) there were no significant difference between the means for each group: Alzheimer’s group (23.97 3.93; older BI group (23.76 4.00) and young BI group (24.05 4.05). Further investigation found the scores on the subscale aggression differed significantly between the Alzheimer’s group and the young BI group (p<0.036); however there was no significant difference on the scores between the young and old BI group (p>0.05).
Tested for ABI/TBI patients?* Yes designed for and tested with a TBI population
Other Formats No
Use by Proxy? To be administered by hospital or community staff
Advantages The scale was designed to be used specially with those who had sustained a TBI (Corrigan 1989) The ABS has also been tested with a group of individual living in a long term care facility and again showed strong internal consistency and inter-rater reliability (Bogner et al., 1999). Bogner et al. 2001 found there was a strong relationship between cognition and agitation. Higher scores on the MMS and the FIM cognitive subscales were significantly related to lower scores on the ABS (Bogner et al., 2001; Corrigan and Bogner, 1994). Administering the scale requires little time and can be completed in less than 30 minutes. Agitation is considered to be present if the score is >21 (Corrigan and Bogner, 1995). The scale is readily availability and there is no cost to use it. Limitations The ABS has yet to be validated within a wider range of rehabilitation facilities (Corrigan and Bogner, 1995). As well, one of the more significant limitations of the ABI is the risk of over diagnosis of agitation (Corrigan and Mysiw, 1988). Summary – ABS Interpretability: Scores on the ABS are easy to interpret: Severely agitated->/=36; moderately agitated – 29 to 35; mildly agitated – 22 to 28 and no agitation <22 (Bogner et al., 2000) Acceptability: The scale is available free of charge and requires little time for training and administration. Feasibility: The ABS requires little time to complete and can be completed by all AHP working with the patient.
Evidence-Based Review of Moderate to Severe Acquired Brain Injury 2013
12 Module 17-Assessment of Outcomes Following Acquired/Traumatic Brain Injury-V9-2013 www.abiebr.com Updated August 2013
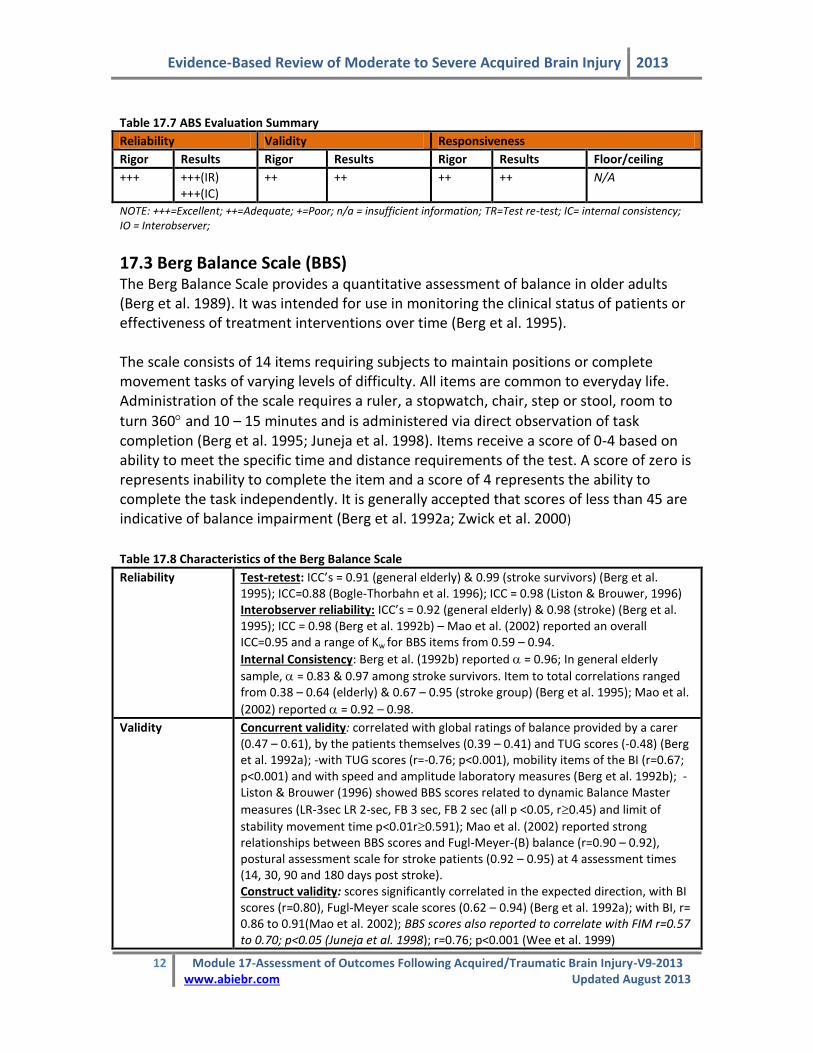
Table 17.7 ABS Evaluation Summary
Reliability Validity Responsiveness
Rigor Results Rigor Results Rigor Results Floor/ceiling
+++
+++(IR) +++(IC)
++ ++ ++ ++ N/A
NOTE: +++=Excellent; ++=Adequate; +=Poor; n/a = insufficient information; TR=Test re-test; IC= internal consistency; IO = Interobserver;
17.3 Berg Balance Scale (BBS) The Berg Balance Scale provides a quantitative assessment of balance in older adults (Berg et al. 1989). It was intended for use in monitoring the clinical status of patients or effectiveness of treatment interventions over time (Berg et al. 1995). The scale consists of 14 items requiring subjects to maintain positions or complete movement tasks of varying levels of difficulty. All items are common to everyday life. Administration of the scale requires a ruler, a stopwatch, chair, step or stool, room to
turn 360 and 10 – 15 minutes and is administered via direct observation of task completion (Berg et al. 1995; Juneja et al. 1998). Items receive a score of 0-4 based on ability to meet the specific time and distance requirements of the test. A score of zero is represents inability to complete the item and a score of 4 represents the ability to complete the task independently. It is generally accepted that scores of less than 45 are indicative of balance impairment (Berg et al. 1992a; Zwick et al. 2000)
Table 17.8 Characteristics of the Berg Balance Scale
Reliability Test-retest: ICC’s = 0.91 (general elderly) & 0.99 (stroke survivors) (Berg et al. 1995); ICC=0.88 (Bogle-Thorbahn et al. 1996); ICC = 0.98 (Liston & Brouwer, 1996) Interobserver reliability: ICC’s = 0.92 (general elderly) & 0.98 (stroke) (Berg et al. 1995); ICC = 0.98 (Berg et al. 1992b) – Mao et al. (2002) reported an overall ICC=0.95 and a range of Kw for BBS items from 0.59 – 0.94.
Internal Consistency: Berg et al. (1992b) reported = 0.96; In general elderly
sample, = 0.83 & 0.97 among stroke survivors. Item to total correlations ranged from 0.38 – 0.64 (elderly) & 0.67 – 0.95 (stroke group) (Berg et al. 1995); Mao et al.
(2002) reported = 0.92 – 0.98.
Validity Concurrent validity: correlated with global ratings of balance provided by a carer (0.47 – 0.61), by the patients themselves (0.39 – 0.41) and TUG scores (-0.48) (Berg et al. 1992a); -with TUG scores (r=-0.76; p<0.001), mobility items of the BI (r=0.67; p<0.001) and with speed and amplitude laboratory measures (Berg et al. 1992b); - Liston & Brouwer (1996) showed BBS scores related to dynamic Balance Master
measures (LR-3sec LR 2-sec, FB 3 sec, FB 2 sec (all p <0.05, r0.45) and limit of
stability movement time p<0.01r0.591); Mao et al. (2002) reported strong relationships between BBS scores and Fugl-Meyer-(B) balance (r=0.90 – 0.92), postural assessment scale for stroke patients (0.92 – 0.95) at 4 assessment times (14, 30, 90 and 180 days post stroke). Construct validity: scores significantly correlated in the expected direction, with BI scores (r=0.80), Fugl-Meyer scale scores (0.62 – 0.94) (Berg et al. 1992a); with BI, r= 0.86 to 0.91(Mao et al. 2002); BBS scores also reported to correlate with FIM r=0.57 to 0.70; p<0.05 (Juneja et al. 1998); r=0.76; p<0.001 (Wee et al. 1999)

Evidence-Based Review of Moderate to Severe Acquired Brain Injury 2013
13 Module 17-Assessment of Outcomes Following Acquired/Traumatic Brain Injury-V9-2013 www.abiebr.com Updated August 2013
Construct validity (known groups): Berg et al. (1992a, 1992b) found BBS scores differentiated groups based on use of mobility aides (p<0.0001) and location of evaluation (home, rehabilitation program, acute hospital) at the end of study follow-up (p<0.0001) (Berg et al. 1992a); Wee et al. (1999, 2003) also showed admission BBS able to discriminate groups based on discharge destination of home vs. institution (p<0.0001); BBS scores discriminative of functional subgroups,
p<0.001 (Stevenson, 2001); and of groups based on ambulatory status p0.005 (Au-Yeung et al. 2003). Predictive validity: handicap situation in stroke survivors 6 months post discharge (multiple regression r
2=0.66; p=0.002; Desrosiers et al. 2002); admission BBS
moderately predictive of length of stay (LOS) in rehabilitation unit, r=-0.39, p<0.05; r
2 = 0.362 (Juneja et al. 1998); r=-0.36; p<0.001when controlling for age (Wee et al.
1999); r=-0.53 controlling for age and r=-0.64 when patients were admitted to rehabilitation within 14 days of stroke (Wee et al. 2003); Wee et al. (1999) demonstrated admission BBS, age and presence of social support to be predictors of discharge destination. Admission BBS score + presence/absence of family support increased prediction accuracy re: discharge destination (Wee et al. 2003); BBS scores at 14, 30 and 90 days post stroke were predictive of motor assessment scale scores at 180 days post stroke event (Mao et al. 2002); BBS scores at admission correlated with FIM scores at discharge (r=0.56; p<0.000) and with LOS (p=-0.55, p<0.000), but on regression analysis BBS score was not found to be a significant independent predictor of LOS or of total discharge FIM score (Feld et al. 2001) high specificity (96%) for predicting non-fallers in the elderly population, but 53% sensitivity in positive prediction of falls (Bogle-Thorbahn et al. 1996) Shumway-Cook et al. (1997) found BBS related to fall status, p<0.01 and best predictor thereof (specificity – 86%; sensitivity –77%).
Responsiveness At 14 days post stroke event, Mao et al. (2002) report a 35% floor effect. A 28.8% ceiling effect was present at 90 days post stroke; greater relative efficiency reported for the BBS vs. BI (1.0 vs. 0.68) and larger effect size at 6 – 12 weeks post-stroke evaluation suggest less ceiling effect for BBS than BI (Wood-Dauphinee et al. 1997); Bogle Thorbahn et al. 1996 reported 11% ceiling effect. Wood-Dauphinee et al. (1997) reported an effect size of 0.66 for initial 6-week, evaluation period, 0.25 for 6 – 12 weeks and overall effect size of 0.97. Mao et al.
(2002) reported significant change (p 0.006) between times of assessment (14, 30, 90, 180 days post stroke). Effect sizes were greatest in the interval between 14 and 30 days (0.80) and diminished the further one moved through time from the stroke event (90 – 100 days – effect size = 0.40) (Mao et al. 2002); Significant change reported from pre to post intervention testing (p<0.001) (Stevenson, 2001). Minimum discernible amount of change calculated as 5.8 (90% CI) or 6.9 (95% CI); Salbach et al. (2001) demonstrated SRM = 1.04 from 8 – 38 days post stroke – there was a significant ceiling effect (26%) noted at the 2
nd evaluation.
Tested for ABI/ TBI patients?*
Juneja et al. 1998 (construct validity); Feld et al. 2001 (predictive validity)
Other Formats N/A
Use by Proxy? N/A
* results from studies within the population of individuals with ABI/TBI appear in italics

Evidence-Based Review of Moderate to Severe Acquired Brain Injury 2013
14 Module 17-Assessment of Outcomes Following Acquired/Traumatic Brain Injury-V9-2013 www.abiebr.com Updated August 2013
Advantages. The Berg Balance Scale measures a number of different aspects of balance, both static and dynamic, and does so with relatively little equipment or space required (Whitney et al. 1998; Nakamura, 1998; Zwick et al. 2000). No specialized training is required to be able to administer the BBS (Nakamura et al. 1998). The high levels of reliability reported by Berg et al. (1995) were achieved when the individuals administering the test had no specific training in the administration of the scale. Limitations. The Berg Balance scale has been thoroughly evaluated for use among populations of individuals who have experienced stroke. At present, information regarding the reliability and validity of the BBS when used among patients with TBI/ABI is limited. No common interpretation exists for BBS scores, their relationship to mobility status and the use of mobility aides (Wee et al. 2003). The rating scales associated with each item, while numerically identical, have different operational definitions for each number or score; a score of 2, for example, is defined differently and has a different associated level of difficulty from item to item (Kornetti et al. 2004). There is also no common score associated with successful item completion (Kornetti et al. 2004). Use of an overall score that adds together ratings with different meanings having no common reference point may not be appropriate as interpretation is difficult and very little functional information is provided about the individual patient (Kornetti et al. 2004). A recent Rasch analysis of the Berg Balance Scale revealed that some item ratings were not used at all or were underutilized, and others were unable to distinguish between individuals with different levels of ability (Kornetti et al. 2004). Collapsing rating scales to eliminate infrequently endorsed categories and creating a common pass/fail point for each item resulted in changes to the ordering of item difficulty, reduced tendencies for ceiling effects and an improved functional definition of the 45/56 cut-off point (Kornetti et al. 2004). Summary – Berg Balance Scale Interpretability: There are no common standards for the interpretation of BBS scores, though there is an accepted cutoff point for the presence of balance impairment. Acceptability: This direct observation test would not be suited for severely affected patients as it assesses only one item relative to balance while sitting. Active individuals would find it too simple. The scale is not suited for use by proxy. Feasibility: The BBS requires no specialized training to administer and relatively little equipment or space

Evidence-Based Review of Moderate to Severe Acquired Brain Injury 2013
15 Module 17-Assessment of Outcomes Following Acquired/Traumatic Brain Injury-V9-2013 www.abiebr.com Updated August 2013
Table 17.9 BBS Evaluation Summary
Reliability Validity Responsiveness
Rigor Results Rigor Results Rigor Results Floor/ceiling
++
+++ (TR) +++(IO) +++ (IC)
+++ +++ +++ +++ Varied
NOTE: +++=Excellent; ++=Adequate; +=Poor; n/a = insufficient information; TR=Test re-test; IC= internal consistency; IO = Interobserver; varied (re. floor/ceiling effects; mixed results)
17.4 Community Balance and Mobility Scale (CBMS) The Community Balance and Mobility Scale (CBMS) is a performance-based measure intended to evaluate balance and mobility skills in individuals who have experienced mild to moderate traumatic brain injury (TBI) (Inness et al. 1999). The scale is comprised of 13 items each of which are rated on a 6-point scale from 0 through 5 where 5 represent the most successful completion of the scale item (Inness et al. 1999, Butcher et al. 2004).
Table 17.10 Characteristics of the Community Balance and Mobility Scale
Reliability Test-retest: ICC=0.975 (Inness et al., 1999)
Internal consistency: =0.96 (Inness et al. 1999)
Validity Face validity: items rated as relevant to the assessment of balance by PT’s (Inness et al., 1999) Construct validity: - correlated with gait variables; walking velocity (r=0.69), step length (r=0.75) and step time variability (r=-0.49); however, CB&M scores did not correlate significantly with measures of postural sway or with a measure of balance confidence (ABC)
Responsiveness -SRM = 1.26 (for CB&M change scores) (Inness et al. 2004)
Tested for ABI/TBI patients?
Developed for use in TBI population.
Other Formats N/A
Use by proxy? N/A
Advantages. The CBMS is a measure developed specifically for use in assessment of individuals who have sustained mild to moderate TBI. It may have increased sensitivity to change when used within this population when compared to more established measures such as the Berg Balance Scale (Inness et al. 2004). Limitations. The scale may be assessing a construct more similar to “dynamic mobility” rather than balance per se (Inness et al. 2004). The information available in the literature with regard to the reliability, validity or practical application of this scale is extremely limited and comes from the scale authors only. Further (and broader) evaluation of the CBMS’ measurement properties is required.

Evidence-Based Review of Moderate to Severe Acquired Brain Injury 2013
16 Module 17-Assessment of Outcomes Following Acquired/Traumatic Brain Injury-V9-2013 www.abiebr.com Updated August 2013
Summary – CBMS Interpretability: Not enough information available Acceptability: Not enough information available Feasibility: Not enough information available
Table 17.11 Community Balance and Mobility Scale Evaluation Summary
Reliability Validity Responsiveness
Rigor Results Rigor Results Rigor Results Floor/ceiling
+
+++ (TR) +++ (IC)
+ + + +++ N/A
NOTE: +++=Excellent; ++=Adequate; +=Poor; N/A = insufficient information; TR=Test re-test; IC= internal consistency; IO = Interobserver.
17.5 Community Integration Questionnaire (CIQ) The Community Integration Questionnaire (CIQ) (Willer et al. 1993) was intended as a brief assessment of community integration or the degree to which an individual post- traumatic brain injury is able to perform appropriate roles within the home and community. In order to achieve higher levels of reliability, the CIQ uses behavioural indicators of integration and does not include items focused on feelings or emotional status (Willer et al. 1994; Dijkers, 1997). The CIQ was developed for inclusion in the National Institute on Disability and Rehabilitation Research (NIDRR) TBI model systems National Data Base in the United States (Dijkers 1997). The CIQ assesses handicap, which is viewed by the scale authors as the opposite of integration (Willer et al. 1993) in three domains: Home Integration (active participation in the operation of the home or household), Social Integration (participation in social activities outside the home) and Productivity (regular performance of work, school and/or volunteer activities). The scale is comprised of 15 items in 3 corresponding subscales each of which has a different number of items and subscores (Willer et al. 1994, Sander et al. 1999). The Home Integration subscale consists of 5 items each scored on a scale from 0 – 2, where 2 represents the greatest degree of integration. The Social Integration subscale is comprised of 6 items rated in the same manner as Home Integration whereas the Productivity subscale consists of 4 questions with responses weighted to provide a total of 7 points. Scores from each of the subscales are summed to provide an overall CIQ score. The maximum possible score is 29, which reflects complete community integration (Hall et al. 1996). The CIQ may be administered via self-completion, face-to-face or telephone interviews (Hall et al. 1996). If the individual with TBI is unable to complete the assessment, the questionnaire may be completed by proxy (Willer et al. 1994). There are two versions of the questionnaire available, one for completion by the person with TBI and one for completion by a suitable proxy (family member, close friend, significant other) (Sander

Evidence-Based Review of Moderate to Severe Acquired Brain Injury 2013
17 Module 17-Assessment of Outcomes Following Acquired/Traumatic Brain Injury-V9-2013 www.abiebr.com Updated August 2013
et al. 1999). The CIQ requires approximately 15 minutes to complete (Hall et al. 1996, Zhang et al. 2002).
Table 17.12 Characteristics of the Community Integration Questionnaire
Reliability
Test-retest: ICC=0.86 for CIQ total, 0.88 for home integration, 0.66 for social integration and 0.80 for productivity (Cusick et al. 2000); Willer et al. (1993) reported r=0.93 for home integration, 0.86 for social integration, 0.83 for productivity and 0.91 for CIQ total; r=0.63 for productive activity, 0.70 for social integration, 0.71 for home integration and 0.81 for CIQ total scores (Seale et al. 2002); r=0.91 for patients’ and 0.97 for family members/caregivers assessment (Willer et al. 1994) Interobserver reliability: Willer et al. (1993) reported interrater reliability between patients with TBI and their family members of r=0.81 (home integration), 0.74 (social integration), 0.96 (productivity) and 0.89 for the total CIQ score;
Internal consistency: = 0.76 (Willer et al. 1993); Willer et al. (1994a) reported item-to-total correlations ranging from 0.32 (socialization, with whom) to 0.67
(housework, leisure activities); = 0.76 for total CIQ, 0.84, 0.83, & 0.35 for home integration, social integration and productivity, respectively (Willer et al. 1994,
cited in Dijkers, 1997); post severe TBI = 0.26 (productivity), 0.65 (social integration), 0.95 (home integration) and 0.84 (total CIQ) – subtotal to total correlations were reported to be 0.54, 0.0.74, 0.79 for productivity, social integration and home integration, respectively (Corrigan & Deming, 1995).
Validity Construct validity: 3 components with eigenvalues >1 were identified and maintained for orthogonal rotation – these 3 factors, labeled Home Competency, Social Integration and Productive Activity, accounted for 51% of variance in the set of variables – all items loaded significantly – finance item moved to home competency and traveling was included on social integration – shopping was excluded since it loaded significantly and equivalently on 2 factors (Sander et al. 1999); Dijkers (1997) reviewed 4 articles providing correlations between subscale scores and found moderate to weak correlations – suggesting that there are three dimensions which are related to each other and may be assessing different aspects of the same concept; Kuipers et al. (2004) reported a more stable 2 dimensional structure on multi-dimensional scaling (productivity vs. personal life & independence vs. dependence), although they also were able to identify a 3 dimensional structure in keeping with factors of home competency, social interactions and productive activities; Construct validity (known groups): Willer et al. (1993) reported that a group of individuals with TBI vs. a nondisabled group demonstrated significantly less integration on CIQ (total scores and all subscores) except for women who were equally integrated in the home, regardless of group membership; Differences in CIQ subscores and total CIQ scores were significant (p<0.0001) when a group of individuals with TBI and a group of non-TBI control participants were compared – Groups of patients differentiated by independent living, supported living and institutional living setting could also be distinguished by differences in CIQ scores (p<0.001, Willer et al. 1994); Corrigan & Deming (1995) reported CIQ scores did not differ significantly between groups of persons with various disabilities (2 TBI samples vs. “other disabilities”; p>0.01) Concurrent validity: Total CIQ scores correlated with total CHART scores (r=0.62, p<0.05) – 2 CHART subscales appear comparable to CIQ subscales (occupation & social integration) – CHART occupation correlated with all CIQ subscales and most strongly with CIQ productivity (r=0.55), CHART social integration correlated with

Evidence-Based Review of Moderate to Severe Acquired Brain Injury 2013
18 Module 17-Assessment of Outcomes Following Acquired/Traumatic Brain Injury-V9-2013 www.abiebr.com Updated August 2013
CIQ (r=0.35), however, this was not sufficient to reach significance (p>0.05) (Willer et al. 1993); CIQ subscale and overall scores correlated significantly and in the expected direction with DRS items and FIM+FAM items; DRS Level of functioning scores correlated most strongly with home competency (-0.46) and total CIQ scores (-0.47), DRS Employability with CIQ productive activity (-0.58) and CIQ total scores (-0.58), FAM community access with home competency (0.46) and CIQ total (0.47), FIM social interaction with all CIQ subscales (0.24 – 0.27) and CIQ total (0.34) and FAM Employability with CIQ productive activity (0.57)and CIQ total (0.60) (Sander et al. 1999); CIQ total scores correlated significantly with DRS total scores (r=-0.43, p<0.01), CIQ home integration correlated with DRS cognitive ability, level of function and employability subscales, CIQ social interaction and productivity scales did not correlate significantly with any of the DRS subscales. CIQ total correlated significantly with CHART totals (r=0.68, p<0.01), CHART physical correlated significantly with CIQ home integration (r=0.53, p<0.01) and social integration (r=0.25; p<0.05), CHART social interaction correlated with CIQ social integration (r=0.38; p<0.01), CHART motor correlated significantly with all CIQ subscales (r=0.40 – 0.47, p<0.01), as did CHART occupation subscale (r=0.33 – 0.42, p<0.01; Zhang et al. 2002); CIQ subscores correlated with ratings of ADL’s (r=0.37, 0.37 and 0.40 for home integration, social integration and productivity, respectively; Heinemann & Whiteneck, 1995) Predictive validity: Heinemann & Whiteneck (1995) reported that Social Integration and Productivity subscale scores were the two most powerful
predictors of life satisfaction on multiple regression (=-0.25 and –0.22, respectively) such that greater satisfaction was associated with less social and productive handicap.
Responsiveness Willer et al. (1993) reported that only 1 individual obtained a maximum CIQ score on social integration, while 10/16 obtained maximum scores on the CHART social integration subscale; -To examine possible ceiling effects, CIQ scores were compared to average scores on each subscale obtained by nondisabled individuals approximately ½ of individuals with TBI reached this level 2 years post injury on the home and social interaction subscales of the CIQ while only 19% reached the average level of non TBI individuals on the productivity subscale (Hall et al. 1996); Gurkha et al. (1999) report scores at 6 months and 24 months post rehabilitation discharge to be normally distributed – CIQ sensitive to a range of levels of community integration; 20.8% of subjects obtained maximum scores on social integration, while 39.1% obtained minimum scores on productive activity one year following injury (Sander et al. 1999); Corrigan & Deming (1995) reported relatively normal distributions for CIQ totals as well as for the home integration and social integration subscales; however, the productivity subscale appeared to be positively skewed with highly restricted variability in TBI and “other disability” samples; Seale et al. (2002) reported patients receiving post-acute rehabilitation improved significantly from admission to follow-up on all CIQ indicators; patients receiving rehabilitation less than 1 year post-injury improved more than patients receiving rehabilitation more than 1 year post injury (F=35.82, p<0.0001, over time r
2=0.57
vs. F=12.95, p<0.001, over time r2 = 0.25); Willer et al. (1999) reported significant
improvement of CIQ scores in treatment vs. control groups from time 1 to time 2 assessments (p<0.001) – similar improvements compared to the control group were reported for home integration, social integration and productivity; Corrigan & Deming (1995) reported significant differences(p<0.01) in CIQ scores from premorbid/retrospective ratings to follow-up/current ratings with follow-up ratings being lower than premorbid for CIQ total, social integration and

Evidence-Based Review of Moderate to Severe Acquired Brain Injury 2013
19 Module 17-Assessment of Outcomes Following Acquired/Traumatic Brain Injury-V9-2013 www.abiebr.com Updated August 2013
productivity scores – only home integration did not differ significantly from premorbid to follow-up ratings.
Tested for ABI/TBI patients?
Developed specifically for individuals with TBI.
Other Formats Revised subscale & scoring: Sander et al. (1999) repeated factor analysis resulting in a slightly modified subscale structure. Recommendations for a revised scale and scoring are provided. Using the revised scoring proposed by Sander et al. (1999), CIQ total scores were significantly related to CIPI social activity and inactivity subscales (r=-0.43 & -0.68 respectively; p<0.05) as were CIQ Home Integration (r=-0.36 & -0.38; p<0.05) and CIQ Social Integration (r=-0.46 & -0.38, p<0.05; Kaplan, 2001) Mail Administration: Using a mail questionnaire based on the modifications of Sander et al. (1999), Kuipers et al. (2004) reported a 80.2% completion rate for CIQ questionnaires by patients and 77.7% among proxy recipients. Home competency subscales had the highest completion rtes in both groups, while social interaction had the lowest. Proxy scores on the home integration scale were significantly lower than patient scores (p=0.019). Item-to-total correlations ranged from 0.19 to 0.63 and subscale-to-total correlations were reported to be 0.73(home integration), 0.64 (social interaction) and 0.54 (productive activities). CIQ scores correlated with scores on the Sydney Psychosocial Re-integration Scale (SPRS) (0.56 & 0.60 for patient & proxy scores, respectively) – SPRS Independent Living correlated with CIQ home competency (0.42 & 0.57 for patient & proxy respectively), CIQ Social Interaction with SPRS Interpersonal Relationships (0.45 & 0.49 for patient & proxy), CIQ Productive Activity and SPRS Occupational Activity (0.42 & 0.41 for patient & proxy scores)
Use by proxy? Agreement between scores derived from patient vs. significant other telephone interviews was reported to be ICC=0.43 for home integration, 0.65 for social integration and 0.81 for productivity subscales of the CIQ (Tepper et al. 1996). Agreement between patient and proxy scores obtained via telephone interview was reported to by 0.78 for CIQ total, 0.79 for home integration, 0.52 for social integration and 0.84 for productivity subscales -- poorest agreements were noted for items that were most subjective and required opinion/judgement. In cognitive areas, proxies tended to score patients lower than the patients did themselves, while in activity areas, proxies tended to score patients higher than the patients themselves (Cusick et al. 2000).
Agreement between patient and proxy ranged from =0.43 – 0.70 on CIQ home integration subscale, 0.42 – 0.60 on the social integration subscale and 0.69 – 0.94 on the productivity subscale. Significant differences were reported between patient and family member ratings on the home integration subscale (p<0.01) and total CIQ scores (p<0.05). In both cases, patient scores indicated higher levels of integration than scores derived from family member interviews; however, 80% of variance in total CIQ scores could be attributed to home integration subscores (Sander et al. 1997). When informants were interviewed, Willer et al. (1993) reported test retest reliability of 0.97 for CIQ total scores, and r=0.90 (social integration), 0.96 (home integration) and 0.97 for productivity subscales. Correlations between ratings provided by individuals with brain injury and family members were reported to be 0.81 for home integration, 0.74 for social integration and 0.96 for productivity –

Evidence-Based Review of Moderate to Severe Acquired Brain Injury 2013
20 Module 17-Assessment of Outcomes Following Acquired/Traumatic Brain Injury-V9-2013 www.abiebr.com Updated August 2013
total CIQ scores were also strongly correlated (r=0.89) Family member and patient assessments were reported to be correlated – r=0.81 for home integration, 0.74 for social integration and 0.96 for productive activity (Willer et al. 1994)
Advantages. The CIQ has become one of the most widely used tools in the assessment of community integration for people who have experienced traumatic brain injury. The scale was originally developed via an expert panel that included individuals with TBI suggesting that items have face validity (Willier et al. 1993, 1994). The scale can be completed quickly and easily by most individuals with TBI or by an appropriate proxy. The scale focuses more on behaviour than emotional states, which promotes better agreement between patient and proxy ratings (Dijkers 1997; Cusick et al. 2000). Limitations. While the CIQ was developed to assess handicap as defined under the ICIDH, the CIQ does not appear to assess all of the domains included in the WHO definition of handicap (Dijkers, 1997). Indeed, under the current definitions provided by the International Classification of Functioning, Disability and Health (WHO, 2001), CIQ items may reflect activities more than participation (Kuipers et al. 2004). The reduction of items from 47 to 15 based on factor analysis excluded items not loading onto one of the three predetermined factors that might have provided a more comprehensive assessment of handicap and/or participation. It should be noted that the factor analysis used to eliminate scale items was based on scale scores from an extremely small sample (n=49) of individuals with severe TBI (Willer et al. 1993, Dijkers, 1997). The CIQ does not measure integration skills, the success of integration activities from the point of view of the individual with TBI or the feelings or meaning association with integration activities (Willer et al. 1993; Zhang et al. 2002). What the CIQ does measure appears to somewhat inconsistent. Some items measure the frequency with which activities are performed, while others measure, in a limited way, the assistance or supervision required in order to perform an activity (Dijkers 1997, Zhang et al. 2002). In addition, the CIQ social integration subscale does not relate to other measures of social integration in the expected way. The CIQ social integration subscale appears inconsistently related to the CHART social interaction subscale (Willer et al. 1993, Zhang et al. 2002) and only weakly related to FIM social interaction item (Sanders et al. 1999). It has been suggested that all three may be measuring slightly difference constructs. The FIM examines appropriateness of interaction while CHART assesses the size and composition of social networks. The CIQ does not assess either of these aspects of social integration (Sanders et al. 1999). Age, gender and level of education have all been reported to have an effect on CIQ scores. Dijkers (1997) reviewed 4 studies that reported the effects of age and, in general, it appeared as though scores for women indicated greater integration into the home, while male scores typically suggested more integration into the productivity

Evidence-Based Review of Moderate to Severe Acquired Brain Injury 2013
21 Module 17-Assessment of Outcomes Following Acquired/Traumatic Brain Injury-V9-2013 www.abiebr.com Updated August 2013
domain. A more recent study (Kaplan, 2001) demonstrated similar effects of gender around home integration in a sample of individuals with malignant brain tumours. It has been suggested that a lack of more traditional, male household tasks may account for some of the reported differences in home integration (Dijkers 1997). The CIQ separates the activities of running a household from productive activity and, therefore, may penalize individuals who were and continue to be homemakers as well as those individuals with family members who have always shared in home-making activities (Kaplan, 2001). It has been suggested that this bias could be ameliorated by conducting a retrospective, pre-morbid assessment to provide a basis for comparison (Sander et al. 1999). In his 1997 review, Dijkers reported a tendency for younger age to be associated with greater integration on the CIQ. Kaplan (2001) reported that older age was significantly related to poorer community integration both for the total CIQ and for each subscale. In addition to age and gender, amount of education appears to have an effect on community integration as assessed by the CIQ such that more education is associated with better integration in all three dimensions (Heinemann & Whiteneck 1995; Kaplan, 2001). The roles of men and women, people of different ages and varying levels of education are all different and these differences need to be reflected in the scale through the development of age-appropriate norms stratified by education, gender and marital status (Dijkers 1997; Sander et al. 1999, Kaplan 2001). In a 1999 assessment of the factor structure and validity of the CIQ, Sander et al. identified 2 items that appeared problematic. It was recommended that the childcare item and the frequency of shopping item both be removed. The childcare item is frequently not applicable and appears to penalize people who have no children in the home while the shopping item loaded significantly on 2 of the 3 identified factors and did not contribute any unique information to the sale (Sander et al. 1999) Summary – CIQ Interpretability: The CIQ is widely used. However, no norms are currently available. There is no basis for determining that an individual’s level of integration on the CIQ is or is not normal (Dijkers 1997). Acceptability: The scale is short and simple and represents little patient burden. It has been used successfully with proxy respondents. Feasibility: No special training is required to administer the CIQ. The scale is free, but should be requested from the scale author. It has been used in longitudinal studies to show change over time.

Evidence-Based Review of Moderate to Severe Acquired Brain Injury 2013
22 Module 17-Assessment of Outcomes Following Acquired/Traumatic Brain Injury-V9-2013 www.abiebr.com Updated August 2013
Table 17.13 CIQ Evaluation Summary
Reliability Validity Responsiveness
Rigor Results Rigor Results Rigor Results Floor/ceiling
++
++(TR) ++(IO) ++(IC)
++ ++ ++ + (p-values only) + (ceiling)
NOTE: +++=Excellent; ++=Adequate; +=Poor; n/a = insufficient information; TR=Test re-test; IC= internal consistency; IO = Interobserver.
17.6 Disability Rating Scale (DRS) The Disability Rating Scale was developed to provide quantitative information regarding the progress of individuals with severe head injury from “coma to community” (Rappaport et al. 1982). The DRS was designed to reflect changes in the following areas: arousal and awareness, cognitive ability to deal with problems around self care, degree of physical dependence and psychosocial adaptability as reflected in the ability to do useful work (Rappaport et al. 1982). The DRS was developed and tested in a rehabilitation setting among individuals who had experienced moderate to severe traumatic brain injury (Hall, 1997). The DRS is comprised of eight items in four categories; arousal, awareness and responsitivity, cognitive ability for self-care activities, dependence on others and psychosocial adaptability (Rappaport et al. 1982). Each item has its own rating scale ranging from 0 – 3 to 0 – 5 and are either in ½ or 1-point increments. (Rating forms are available for download at http://tbims.org/combi/drs/drsrat.htm) The total or composite score is calculated by summing the ratings for all 8 items. Lower scores are associated with less disability. The overall score can be used to assign the individual to one of 10 disability outcome categories ranging from no disability (DRS score = 0) to extreme vegetative state (DRS score = 29) and death (DRS = 30) (Hall et al. 1996, Fleming and Maas,1994). The DRS is available at no cost and is free to copy. It may be downloaded in *.pdf format from http://tbims.org/combi. Training materials are also provided on the same website and a training video is available for a modest fee. Administration of the scale may be via direct observation or interview (Hall et al. 1993). When necessary, collateral sources of information may be used to complete the ratings (Rappaport et al. 1982). The DRS is simple to administer and requires approximately 5 minutes to complete (Hall, 1997, Hall et al. 1993). Table 17.14 Characteristics of the Disability Rating Scale
Reliability
Test-retest: r=0.95 (Gouvier et al., 1987) Interobserver reliability: - inter-rater correlations ranged from 0.97 – 0.98 (p<0.01; Rappaport et al. 1982); average r=0.98 (Gouvier et al., 1987); correlations between observer ratings ranged from 0.75 – 0.89 (Fleming & Maas 1994) Internal consistency: item to item correlations ranged from 0.23 to 0.95, item-to-total correlations ranged from 0.54 (eye opening) to 0.96 (feeding) (Rappaport et
Evidence-Based Review of Moderate to Severe Acquired Brain Injury 2013
23 Module 17-Assessment of Outcomes Following Acquired/Traumatic Brain Injury-V9-2013 www.abiebr.com Updated August 2013
al. 1982)
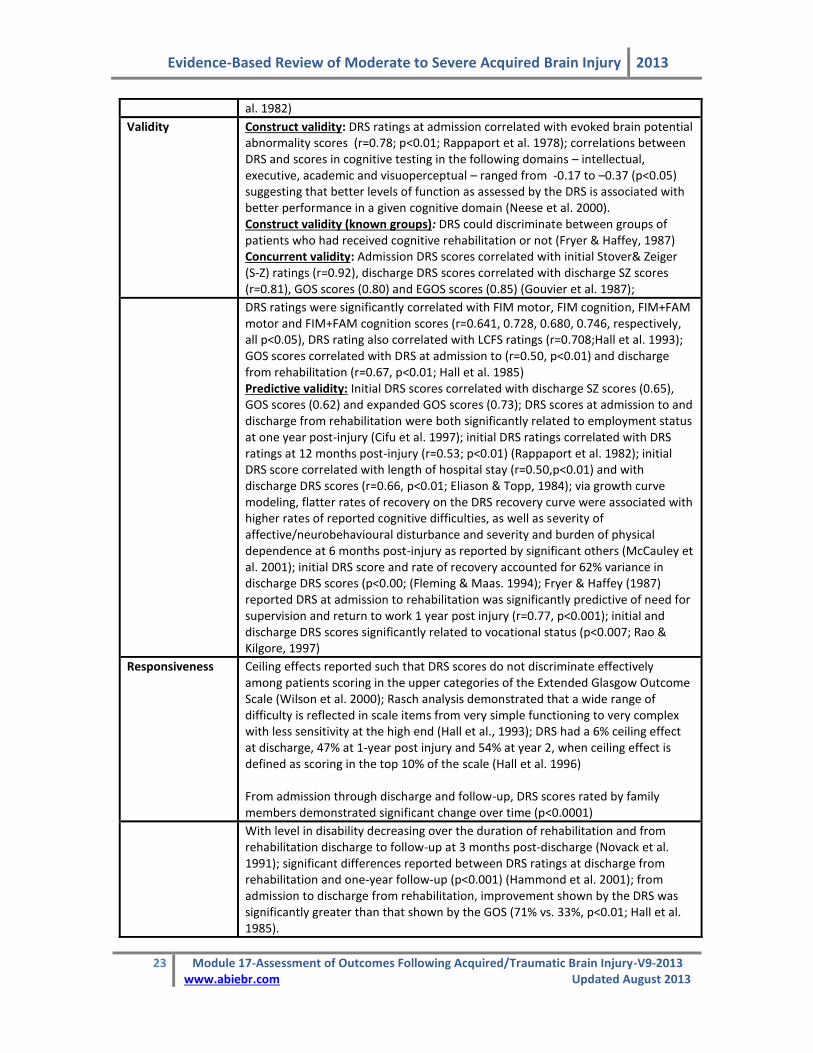
Validity Construct validity: DRS ratings at admission correlated with evoked brain potential abnormality scores (r=0.78; p<0.01; Rappaport et al. 1978); correlations between DRS and scores in cognitive testing in the following domains – intellectual, executive, academic and visuoperceptual – ranged from -0.17 to –0.37 (p<0.05) suggesting that better levels of function as assessed by the DRS is associated with better performance in a given cognitive domain (Neese et al. 2000). Construct validity (known groups): DRS could discriminate between groups of patients who had received cognitive rehabilitation or not (Fryer & Haffey, 1987) Concurrent validity: Admission DRS scores correlated with initial Stover& Zeiger (S-Z) ratings (r=0.92), discharge DRS scores correlated with discharge SZ scores (r=0.81), GOS scores (0.80) and EGOS scores (0.85) (Gouvier et al. 1987);
DRS ratings were significantly correlated with FIM motor, FIM cognition, FIM+FAM motor and FIM+FAM cognition scores (r=0.641, 0.728, 0.680, 0.746, respectively, all p<0.05), DRS rating also correlated with LCFS ratings (r=0.708;Hall et al. 1993); GOS scores correlated with DRS at admission to (r=0.50, p<0.01) and discharge from rehabilitation (r=0.67, p<0.01; Hall et al. 1985) Predictive validity: Initial DRS scores correlated with discharge SZ scores (0.65), GOS scores (0.62) and expanded GOS scores (0.73); DRS scores at admission to and discharge from rehabilitation were both significantly related to employment status at one year post-injury (Cifu et al. 1997); initial DRS ratings correlated with DRS ratings at 12 months post-injury (r=0.53; p<0.01) (Rappaport et al. 1982); initial DRS score correlated with length of hospital stay (r=0.50,p<0.01) and with discharge DRS scores (r=0.66, p<0.01; Eliason & Topp, 1984); via growth curve modeling, flatter rates of recovery on the DRS recovery curve were associated with higher rates of reported cognitive difficulties, as well as severity of affective/neurobehavioural disturbance and severity and burden of physical dependence at 6 months post-injury as reported by significant others (McCauley et al. 2001); initial DRS score and rate of recovery accounted for 62% variance in discharge DRS scores (p<0.00; (Fleming & Maas. 1994); Fryer & Haffey (1987) reported DRS at admission to rehabilitation was significantly predictive of need for supervision and return to work 1 year post injury (r=0.77, p<0.001); initial and discharge DRS scores significantly related to vocational status (p<0.007; Rao & Kilgore, 1997)
Responsiveness Ceiling effects reported such that DRS scores do not discriminate effectively among patients scoring in the upper categories of the Extended Glasgow Outcome Scale (Wilson et al. 2000); Rasch analysis demonstrated that a wide range of difficulty is reflected in scale items from very simple functioning to very complex with less sensitivity at the high end (Hall et al., 1993); DRS had a 6% ceiling effect at discharge, 47% at 1-year post injury and 54% at year 2, when ceiling effect is defined as scoring in the top 10% of the scale (Hall et al. 1996) From admission through discharge and follow-up, DRS scores rated by family members demonstrated significant change over time (p<0.0001)
With level in disability decreasing over the duration of rehabilitation and from rehabilitation discharge to follow-up at 3 months post-discharge (Novack et al. 1991); significant differences reported between DRS ratings at discharge from rehabilitation and one-year follow-up (p<0.001) (Hammond et al. 2001); from admission to discharge from rehabilitation, improvement shown by the DRS was significantly greater than that shown by the GOS (71% vs. 33%, p<0.01; Hall et al. 1985).

Evidence-Based Review of Moderate to Severe Acquired Brain Injury 2013
24 Module 17-Assessment of Outcomes Following Acquired/Traumatic Brain Injury-V9-2013 www.abiebr.com Updated August 2013
Tested for ABI/ TBI patients?
Developed for assessment of patients with head injury.
Other Formats N/A
Use by proxy? Novack et al. (1991) reported rehabilitation admission & discharge DRS ratings completed by a family member correlated significantly with those completed by a head injury team member (r=0.95 & r=0.93 respectively, p<0.01)
Advantages The DRS is a single assessment comprised of items spanning all major dimensions of the ICIDH (impairment, disability and handicap) (Rappaport et al. 1982, Hall et al. 1996). It is a brief and simple tool that allows for the ongoing assessment of recovery from injury to community re-integration. In addition, the ability to assign scores to outcome category with relatively little loss of information (Gouvier et al. 1987) provides a quick snapshot of the individual’s overall disability status (Hall et al. 1993). The DRS appears to be more reliable and valid than the Level of Cognitive Functioning Scale (LCFS) and may be more sensitive to change than categorical rankings such as the Glasgow Outcome Scale (Hall et al. 1985). In addition, Glasgow Coma scores can be obtained from the DRS (Hall, 1997). Limitations Descriptions of what corresponds to successful item performance at each rating level are not precise and subscales do not clearly identify areas for intervention (Brazil, 1992). The sequellae of head injury that are included for assessment are limited and do not include cognition (Brazil, 1992). The DRS assesses only general rather than specific function or functional change (Hall and Johnston 1994). It may be most useful as a means to characterize sample severity and provide the means for comparison to other groups, but it is not particularly sensitive to the effects of treatments designed to ameliorate specific functional limitations or social participation (Hall et al. 1991). In inpatient rehabilitation settings, the FIM is a more sensitive instrument with which to monitor change (Hall and Johnston, 1994). The DRS is not well suited to patients with mild TBI or very severe impairments (Hall et al. 1993, Hall et al. 1996, Wilson et al. 2000). It has been recommended that ½ point scoring increments rather than whole points should be employed in order to increase the precision and sensitivity of the instrument when assessing higher functioning individuals (Hall et al. 1993). When subjects do not fit whole-point definitions for cognitive ability for self-care items, dependence on others and employability, ½ points can be awarded; total scores with ½ points are rounded down for the purposes of assignment to outcome category (Hammond et al. 2001). The rating form available for download has included the ½ point scoring option. When using the ½ point scoring option, the DRS does appear to be sensitive to change between discharge and one-year and even 5-year follow-ups; however, year by year change is not captured by DRS ratings more than one year post-injury (Hammond et al. 2001).

Evidence-Based Review of Moderate to Severe Acquired Brain Injury 2013
25 Module 17-Assessment of Outcomes Following Acquired/Traumatic Brain Injury-V9-2013 www.abiebr.com Updated August 2013
Summary – DRS Interpretability: The DRS is widely used and is part of the TBI Model Systems Database. It provides a quick, accessible snapshot of outcome of disability in terms of general function. Acceptability: The simplicity and brevity associated with the DRS would suggest little to no patient burden associated with its administration. Ratings provided by family members are strongly correlated with those completed by healthcare team members. Feasibility: The DRS is free to use and copy. Training materials are also provided free of charge and a training video is available for a modest fee. The DRS seems to be able to detect significant change over time and may be well suited for group comparisons
Table 17.15 Disability Rating Scale Evaluation Summary
Reliability Validity Responsiveness
Rigor Results Rigor Results Rigor Results Floor/ceiling
+
+++(TR) +++(IO) ++(IC)
+++ +++ ++ + (p-values only) + (ceiling)
NOTE: +++=Excellent; ++=Adequate; +=Poor; n/a = insufficient information; TR=Test re-test; IC= internal consistency; IO = Interobserver
17.7 Fatigue Severity Scale (FSS) Fatigue is essentially a subjective experience and often hard to measure even though it can be a major source of disablement (Dittner et al., 2004; Belmont et al., 2006). Individuals who sustain a TBI, regardless of the level of injury, often report fatigue as a constant or recurrent problem post injury (Borgaro et al., 2005; Belmont et al., 2006). Zinno and Ponsford (2006) found activities that required mental or physical effort often resulted in increased levels of fatigue. Fatigue Severity Scale (FSS), is a self-report questionnaire designed to assess disabling fatigue in all individuals (Krupp et al., 1989). The scale was designed to look fatigue/function measures; that is the connection between fatigue intensity and functional disability Dittner et al., 2004; Taylor et al., 2000).The FSS, which consists of 9 questions, uses a 7 point likert scale ranging from strongly disagrees to strongly agree (see below). The scores from each question are totalled with lower scores indicating less fatigue in everyday life. The total score for the FSS is calculated as the average of the individual item responses. Although the FSS was originally designed to assess fatigue in individuals with multiple sclerosis (MS), it has been found to be sensitive to fatigue in those with a TBI (Ziino and Ponsford, 2005).

Evidence-Based Review of Moderate to Severe Acquired Brain Injury 2013
26 Module 17-Assessment of Outcomes Following Acquired/Traumatic Brain Injury-V9-2013 www.abiebr.com Updated August 2013
Table 17.16 Fatigue Severity Scale (FSS) (Krupp et al., 1989).
Completely Completely Disagree Agree
1. My motivation is lower when I am fatigued
1 2 3 4 5 6 7
2. Exercise brings on my fatigued 1 2 3 4 5 6 7
3. I am easily fatigued 1 2 3 4 5 6 7
4. Fatigue interferes with my physical functioning
1 2 3 4 5 6 7
5. Fatigue causes frequent problems for me 1 2 3 4 5 6 7
6. My fatigue prevents sustained physical functioning
1 2 3 4 5 6 7
7. Fatigue interferes with carrying out certain duties and responsibilities
1 2 3 4 5 6 7
8. Fatigue is among my 3 disabling symptoms
1 2 3 4 5 6 7
9. Fatigue interferes with my work, family or social life
1 2 3 4 5 6 7
Individuals are instructed to choose a number from 1 to 7 that indicates their degree of agreement with each statement where 1 indicated strongly disagree and 7 strongly agree
Table 17.17 Characteristics of the FSS
Reliability Test-Retest: Test retest reliability of the scale found no significant differences on the FSS scores from time one to time two. Patients were tested at 2 time periods separated by 5 to 33 weeks (Krupp et al., 1989). When tested with a group of patients who had been diagnosed with Hep C the ICC scores were 0.82 I (Taylor et al., 2000). ICC values for Turkish study were found to be 0.81 (Armutlu et al. 2007). The scale has been found to hve good test-retest reliability (Dittner et al., 2004). Internal Consistency: Cronbach apha scores for the FSS were .81 for an MS population, .88 for a normal healthy population. (Krupp et al., 1989). Cronbach scores for those with Hep C was 0.94 and the CC were 0.82 (Taylor et al., 2000). Paired t-tests were completed looking at the scored from the screening test and the baseline tests, but no difference were found (mean difference -0.03, t=0.95, p=0.34) (Taylor et al., 2000). Armutlu et al.2007 found Cronbach scores ranged between 0.8899 and 0.9401. Ziino and Ponsford (2005) found good internal consistency when the scale was used with a group of TBI patients (Cronbach score .90 with item total correlation ranging from .37 to .84). Overall the scale has been found to have high internal consistency (Dittner et al., 2004). It has been suggested that the scale could be shortened as there appear to be a high level of redundancy with in the scale (Amtmann et al., 2012). In a study with polio patients, Cronbach score was greater than .95, with item to total correlation ranging from .68 to .88 (Burger et al., 2010)
Validity Concurrent validity: FSS scores have been found to be highly correlated with both VAS scores (r=-0.76 and the SF-36 (r=-0.76) (Taylor et al., 2000). Ziino and Ponsford (2005) have found the FSS,

Evidence-Based Review of Moderate to Severe Acquired Brain Injury 2013
27 Module 17-Assessment of Outcomes Following Acquired/Traumatic Brain Injury-V9-2013 www.abiebr.com Updated August 2013
VAS-f subscales and COF subscales were all significantly correlated. Between the COF–ME and the COF-PE a strong positive correlation was found (r=.56 for each measure). For the VAS-F (Vigour and Fatigue) lower vigor scores were associated with higher fatigue scores (Ziino and Ponsford, 2005). Construct validity: LaChapelle et al. (1998) noted negative correlations between time since injury and the FSS (r=-0.42, P<0.001), the impact of fatigue on cognitive and physical functioning (r=-0.41, p<0.001; r=-0.48, p<0.48 respectively). Amtmann et al (2012), in a study that included only MS patients, found a high correlation with both the subscales of the MFIS and the MFIS total score. The FSS had the highest correlation with the MFIS-physical subscale (p=0.77) and the lowest correlation was with the MFIS Cognitive (p=0.55) Predictive validity: The scale has been shown to discriminate between fatigued and non fatigued patients (Friedman et al., 2010; LaChapelle et al., 1998; Krupp et al., 1989; Taylor et al., 2000). Burger et al. (2010) found only a moderate correlation between the 3 VAS scores (daily life, self care, and household and occupation) and the FSS scores possible due to the FSS measuring only physical symptoms of fatigue compared to the VAS.
Responsiveness The FSS has been found to be sensitive to change with time and treatment (Dittner et al., 2004). When compared to the Modified Fatigue Impact Scale (MFIS) the FSS had floor to ceiling responses ranging from 0.9 to 6.8, while the MFIS had a range of 1.1 to 0.7 (Amtmann et al., 2012).
Tested for ABI/TBI patients?* Yes
Other Formats Currently there are two more versions of the FSS: FSS-7, FSS-5. The scale has been translated into: Australian English, Canadian English, French, Canadian French, German, Swill, New Zealand English, UK English, Mexican Spanish, Spanish and Taiwanese (Kleinman et al., 2000).
Use by Proxy? No
Advantages The FSS scale is a self-report scale that is easy to administer and can be completed quickly with minimal effort (LaChapelle et al., 1998; Burger et al., 2010). Limitations Although the overall score of the FSS is beneficial in determining between groups, the individual questions are not able to do so (LaChapelle et al., 1998). Because no two fatigue scales measure the same thing it is strongly recommended that the user know: what aspect of fatigue they want to assess and why; whether or not a unidimensional or multidimensional scale should be used; and final is this scale beneficial to the population being assessed (Dittner et al., 2004). Another major concern with the scale is the use of a 7 point likert scale (completely disagree to completely agree). It is believed that 6 or more categories on any rating scale obscure the distinction between the categories. The collapsing of the options to three (disagree, neutral, agree) may improve

Evidence-Based Review of Moderate to Severe Acquired Brain Injury 2013
28 Module 17-Assessment of Outcomes Following Acquired/Traumatic Brain Injury-V9-2013 www.abiebr.com Updated August 2013
the measure (Burger et al., 2010). The FSS has not been found to be a good instrument for measuring cognitive levels of fatigue (Amtmann et al., 2012). Summary – FSS Interpretability: The FSS has been shown to be a valid and reliable scale for several populations including the ABI population (Ziino and Ponsford, 2005). Never the less the scores on the FSS are easy to interpret and are used to assess patients for fatigue post injury. Items on the scale can be open to interpretation as the word fatigue may mean something different to each individual (Burger et al., 2010) Acceptability: The scale has been shown to be both valid and reliable with a variety of populations. It has been shown to have good internal consistency and is sensitive to change in fatigue levels over time. Feasibility: The FSS is a self-administered scale that does not require any training to use and is available in several languages.
Table 17.18 FSS Evaluation Summary
Reliability Validity Responsiveness
Rigor Results Rigor Results Rigor Results Floor/ceiling
+++
++ TR ++ IC
+++ ++ + + +
NOTE: +++=Excellent; ++=Adequate; +=Poor; n/a = insufficient information; TR=Test re-test; IC= internal consistency; IO = Interobserver;
17.8 Functional Independence Measure Developed in 1987, in part as a response to criticism of the Barthel Index, the FIM was intended to address issues of sensitivity and comprehensiveness as well as provide a uniform measurement system for disability for use in the medical remuneration system in the United States (McDowell & Newell, 1996). Rather than independence or dependence, the FIM assesses physical and cognitive disability in terms of burden of care – that is, the FIM score is intended to represent the burden of caring for that individual. The FIM is a composite measure consisting of 18 items assessing 6 areas of function (self-care, sphincter control, mobility, locomotion, communication and social cognition). These fall into 2 basic domains; physical (13 items) and cognitive (5 items). The 13 physical items are based on those found on the Barthel Index, while the cognitive items are intended to assess social interaction, problem-solving and memory. The physical items are collectively referred to as the motor-FIM while the remaining 5 items are referred to as the cognitive-FIM. Further the scale has not been found to fit with the Rasch model with MS patients (Mills et al., 2009)
Each item is scored on a 7-point Likert scale indicative of the amount of assistance required to perform each item (1=total assistance, 7 = total independence). A simple summed score of 18 – 126 is obtained where 18 represents complete dependence/total

Evidence-Based Review of Moderate to Severe Acquired Brain Injury 2013
29 Module 17-Assessment of Outcomes Following Acquired/Traumatic Brain Injury-V9-2013 www.abiebr.com Updated August 2013
assistance and 126 represents complete independence. Subscale scores for the physical and cognitive domains may also be used and may yield more useful information than combining them into a single FIM score (Linacre et al. 1994).
Administration of the FIM requires training and certification. The most common approach to administration is direct observation. The FIM takes approximately 30 minutes to administer and score. The developers of the FIM further recommend that the rating be derived by consensus opinion of a multi-disciplinary team after a period of observation.
Table 17.19 Characteristics of Functional Independence Measure
Reliability Inter rater Reliability: In a review of 11 studies, Ottenbacher et al., 1996 reported a mean inter-observer reliability value of 0.95; a median test-retest reliability of 0.95 and a median equivalence reliability (across versions) of 0.92. Reliability was higher for items in the motor domain than for those in the social/cognitive domain; ICC = 0.98 for total FIM, 0.95 and 0.89 for motor FIM and cognitive FIM, respectively (Hobart et al. 2001); ICC = 0.85 for total FIM, 0.92 for motor FIM and 0.69 for cognitive FIM (Donaghy & Wass, 1998)
Internal consistency: - of 0.93 – 0.95 reported at admission vs. discharge
(Dodds et al. 1993); = 0.88 to 0.91(Hsueh et al. 2002); Hobart et al. (2001) reported item-to-total correlations ranging from 0.53 to 0.87 for FIM total, 0.60 for FIM motor and 0.63 cognitive FIM – mean inter-item correlations were 0.51 for
FIM, 0.56 – 0.91 for motor FIM and 0.72 – 0.80 for cognitive FIM, = 0.95, 0.95 and 0.89 for FIM, motor FIM and cognitive FIM respectively.
Validity Construct validity: Linacre et al (1994) reported 2 distinct aspects of disability within the FIM – motor & cognitive function; Cavanagh et al. (2000) suggested simple 2-factor model of the FIM not be sufficient to describe disability following stroke (66% of variance)- may not adequately measure within patient change whereas a 3-factor model (self-care, cognition and elimination) accounted for more variance (74.2%); use of Rasch transformed scores for comparison of level of ability at the end of treatment show the motor FIM to be a discriminative, ordinal, outcome measure of disability (Brock et al. 2002; Linacre et al. 1994) Construct validity (known groups): FIM scores discriminated between groups based on spinal cord injury severity (p<0.05) and presence of comorbid illness (p<0.005) and right or left –sided involvement in stroke patients both at admission (p<0.005) and discharge (p< 0.05) – most of this score difference occurred on the communication domain (Dodds et al. 1993); on admission and discharge, FIM scores discriminated groups with and without neglect (p<0.001; p<0.02) and with or without aphasia (p<0.01; p<0.09) (Ring et al. 1997) Concurrent validity: motor-FIM showed strong concurrent validity in association with BI -- Spearman’s correlation coefficient ranging from 0.74 (admission) to 0.92 (discharge) (Hsueh et al., 2002); Kwon et al. (2004) reported r=0.95 between motor-FIM and BI scores and –0.89 between motor-FIM and MRS scores; FIM motor scores and cognition scores were significantly correlated with DRS ratings (r=0.641 and 0.728 respectively, p<0.05) and FIM cognition scores correlated with LCFS scores (r=0.645, p<0.05; Hall et al. 1993) Convergent/Discriminant validity: FIM total and motor FIM scores correlated more strongly with OPCS disability scores, LHS scores, SF-36 physical component scores and WAIS – verbal IQ, than with measures of mental health status or

Evidence-Based Review of Moderate to Severe Acquired Brain Injury 2013
30 Module 17-Assessment of Outcomes Following Acquired/Traumatic Brain Injury-V9-2013 www.abiebr.com Updated August 2013
psychological distress (SF36 mental component, General Health Questionnaire), however, cognitive FIM correlated most strongly with OPCS Disability scores and WAIS-verbal IQ scores and weakly with LHS, SF36 physical and mental components, and the General Health Questionnaire (Hobart et al. 2001) Predictive validity: FIM admission score predictive of placement after discharge (Oczkowski et al. 1993; Dodd et al. 1993); FIM scores + length of stay predictive of functional gain, p<0.0002 (Ring et al. 1997); Granger et al (1993) reported FIM predictive of burden of care assessed in help in minutes/day (p=0.01); Singh et al. (2000) reported FIM scores at 1 month post stroke predictive of depression at 3 months post stroke as part of predictive model that also included “living at home” and “damage to inferior frontal region”; FIM scores at admission to rehabilitation significantly associated with employment status one year post head injury (Cifu et al. 1997); admission motor FIM accounted for 52% of variance in discharge motor function among TBI patients, admission cognitive FIM scores accounted for 46% of variance in discharge cognitive function – admission motor FIM was the most significant predictor of length of stay (Heinemann et al. 1994)
Responsiveness Changes in FIM scores from admission to discharge in the expected direction (p<0.0005) (Dodds et al. 1993); significant differences in FIM total, FIM motor and FIM cognition scores were reported between rehab discharge and follow-up one year post injury (p<0.0001 for all) – change between 1 & 2 years and 1 and 5 years was reported to be distributed across all items with most change in cognitive function (Hammond et al. 2001)
When ceiling effect is defined as the top 29% of the scale (scoring 108), 49% of TBI patients scored in this range at rehabilitation discharge, and 84% by year one post injury (Hall et al. 1996); 4% of patients obtained maximum FIM scores (McPherson & Pentland, 1997); Neither floor nor ceiling effects were reported at admission to or discharge from rehabilitation post stroke (Dromerick et al. 2003); 16% ceiling effect reported for motor FIM (Brock et al. 2002); van der Putten et. al.(1999)- no significant floor or ceiling effects when administering the FIM to stroke patients - effect sizes of 0.30, 0.34 and 0 were reported for the total-FIM, motor-FIM and cognitive-FIM respectively.; Wallace et al. (2002) reported ES = 0.28 (0.46 in known changers), SRM = 0.62 (0.94 among known changers) and AUC ROC curve = 0.675; Dromerick et al. (2003) reported SRM=2.18 from admission to discharge from rehabilitation – the FIM detected change in 91/95 individuals including change in 18 patients in whom the BI detected no change (p<0.001); FIM motor predictive of direct assistance required while FIM cognition scores predictive of amount of supervision required (Corrigan et al. 1997); SRM = 0.48 reported for FIM total and 0.54 and 0.17 for motor and cognitive FIM respectively – no significant floor/ceiling effects were reported although there was a 16.1% ceiling effect noted for cognitive FIM (Hobart et al. 2001)
Tested for ABI/TBI patients?*
The FIM has been tested with TBI populations and with a mixed population (ABI/TBI and surgical patients) (Dodds et al. 1993; Linacre et al. 1994; Cifu et al. 1997; Hall et al. 1996; Hall et al. 1993; Heinemann et al. 1994; Hammond et al. 2001; Corrigan et al. 1997; McPherson & Pentland, 1997; Donaghy & Wass, 1998; Hobart et al. 2001)
Other Formats Standardized Interview: Daving et al. (2001) examined the FIM home interview for intrarater stability - kappa values > 0.40 on 17/18 items; motor FIM reliability reported higher than social/cognitive items (K= 0.46 to 0.61). On sequentially separate interviews, self-care items showed K values of 0.4 – 0.6; transfers, locomotion & social/cognitive items were below 0.4 (poor).

Evidence-Based Review of Moderate to Severe Acquired Brain Injury 2013
31 Module 17-Assessment of Outcomes Following Acquired/Traumatic Brain Injury-V9-2013 www.abiebr.com Updated August 2013
Telephone Interview: Smith et al. (1996) reported total-FIM ICC = 0.97, motor-FIM ICC= 0.98, and cognitive-FIM ICC = 0.57 comparing telephone interview with direct observation in the home. Item level agreement was superior for items in the motor domain (Kappa values exceeded 0.45). Petrella et al. (2002) reported good predictive validity (discharge FIM vs phone FIM at 8 weeks; r=0.436; p=0.02) though not as good as observed FIM scores (r=0.699, p<0.0001). Phone FIM showed good concurrent validity with the observed FIM (r=0.741, p<0.0001) and was sensitive to change over time (t=-3.603, p=0.001). Duncan et al. (2002) reported a 46% ceiling effect on the motor FIM when administered by telephone at 6-month follow-up of stroke patients.
Use by Proxy? Segal et al. (1996) - ICC’s for patient assessment vs. proxy assessment for both in-person and telephone interviews of 0.90 & 0.91, respectively - agreement was much higher for motor-FIM than for cognitive-FIM. The authors speculate that, due to the more subjective nature of the cognitive dimension of the FIM, this portion of the scale may not be appropriate for proxy assessment. Agreement between FONE-FIM scores provided by the patient vs. a significant other was stronger for motor items (ICC=0.79) than for cognitive items (ICC=0.61) (Tepper et al. 1996) Agreement between patient and proxy FIM scores was reported to be ICC = 0.88 for the motor FIM and 0.38 for cognitive FIM --poorest agreements were noted for items that were most subjective and required opinion/judgement. In cognitive areas, proxies tended to score patients lower than the patients did themselves, while in activity areas, proxies tended to score patients higher than the patients themselves. When patients were grouped according to severity, it was noted that among patients with severe TBI, proxies rated patients as less disabled that the patients themselves, while for less severely injured patients, the opposite was true (Cusick et al. 2000).
* results from studies within the population of individuals with ABI/TBI appear in italics
Advantages. The Functional Independence Measure is a widely used, well-accepted, generic measure of burden of care used in inpatient rehabilitation settings. In clinical assessment, the greater number of items and wider choice of responses per item may yield more detailed information on an individual basis than assessments, such as the Barthel Index, with fewer items and response options (Hobart et al. 2001). Limitations. The reliability of the FIM is dependent upon the individual conducting the assessment. Training and education in administration of the test is a pre-requisite for good levels of inter-rater reliability (Cavanagh et al. 2000). Length of time and amount of training required to arrive at a consensus score, as recommended by the developers of the FIM, may have significant implications for the practical application of the FIM in clinical practice.

Evidence-Based Review of Moderate to Severe Acquired Brain Injury 2013
32 Module 17-Assessment of Outcomes Following Acquired/Traumatic Brain Injury-V9-2013 www.abiebr.com Updated August 2013
The use of a single summed raw score may be misleading as it gives the appearance of a continuous scale. Steps between scores, however, are not equal in terms of level of difficulty and cannot provide more than ordinal level information (Linacre et al. 1994). Kidd et al. (1995) suggested that one use the summed scores as though on an interval level scale while the individual items remain ordinal. Kidd et al. (1995) suggest that the inclusion of items related to communication and cognition as well as the ranking of 7 levels of severity for each item make the FIM more sensitive and inclusive. However, the contribution of the cognitive subscale to the scale as a whole is questionable. It has been shown to have less reliability and responsiveness than either the motor FIM or the total FIM (Ottenbacher et al. 1996; van der Putten et al. 1999; Hobart et al. 2001). In an evaluation of responsiveness, FIM, motor FIM and the BI were all found to have similar effect sizes. The total-FIM was reported to exhibit no ceiling effect - 0% as compared to the BI’s 7% (van der Putten et al. 1999). This would suggest that the FIM might have no real advantage in terms of responsiveness to change despite having more items and a more precise scoring range for each item. The FIM includes only 5 items to assess cognition. This limited cognitive assessment may be inadequate for the assessment of individuals who have experienced traumatic brain injury (Hall, 1994). In addition, the FIM is intended for use in assessed during inpatient rehabilitation and is not well suited to ongoing, long-term assessment in community-based settings (Gurkha et al. 1999). Summary – Functional Independence Measure Interpretability: The FIM has been well studied for its validity and reliability. It is widely used and has one scoring system increasing the opportunity for comparison. It is important to remember, when interpreting FIM scores, that it is an ordinal not continuous level scale. Acceptability: Multiple modes of administration have been assessed including telephone interview. The FIM has been studied for use by proxy respondents. Feasibility: Training and education of persons to administer the FIM, in addition to the price of the scale itself, may represent significant cost. Use of interview formats may make the FIM more feasible for longitudinal assessment.
Table 17.20 FIM Evaluation Summary
Reliability Validity Responsiveness
Rigor Results Rigor Results Rigor Results Floor/ceiling
+++
+++ (TR) +++ (IO) +++ (IC)
+++ ++ +++ ++ ++
NOTE: +++=Excellent; ++=Adequate; +=Poor; n/a = insufficient information; TR=Test re-test; IC= internal consistency; IO = Interobserver; varied (re. floor/ceiling effects; mixed results)

Evidence-Based Review of Moderate to Severe Acquired Brain Injury 2013
33 Module 17-Assessment of Outcomes Following Acquired/Traumatic Brain Injury-V9-2013 www.abiebr.com Updated August 2013
17.9 Functional Assessment Measure (FIM+FAM) The Functional Assessment Measure was created specifically for use with brain-injured patients in an attempt to enhance the appropriateness of the FIM for this specific population (Hall et al. 1993, Alcott et al. 1997, Hobart et al. 2001). The FIM contains only 5 cognitive items, which may limit its content validity in TBI populations (Hall, 1994). The FAM does not stand alone as an assessment tool, but rather consists of 12 items that are added to the 18 FIM items. The 12 additional items were developed by a team of clinicians representing each of the disciplines in a rehabilitation model (Hall et al. 1993) and are intended to emphasize cognitive, communicative and psychosocial function (McPherson et al. 1996). The twelve FAM items are swallowing, car transfer, community access, reading, writing, speech intelligibility, emotional status, adjustment to limitations, employability, orientation, attention and safety judgement. Each item is rated using the same 7-point scale used on the FIM. Like the FIM, the FIM+FAM also consists of two subscales, one representing physical or motor functioning and one representing cognitive/psychosocial function. The total score for the FIM+FAM is 210, 112 for the motor FIM+FAM and 98 for the cognitive subscale (Gurka et al. 1999). Higher scores signify greater independence. The FIM must be purchased from UDS and use of the FIM requires training and certification. The FAM items are in the public domain and can be downloaded from http://tbims.org/combi. A FIM+FAM rating form is available along with decision trees, training and testing vignettes specific to the FAM items from the website. The FIM+FAM requires approximately 35 minutes to administer (Hall, 1994).
Table 17.21 Characteristics of the FIM+FAM
Reliability
Test-retest: ICC= 0.98 (Hobart et al. 2001) Interobserver reliability: Interrater (untrained raters) agreement reported to be 67% for FAM items and 55% for patients at admission to rehabilitation (Hall et al.
1993); agreement between raters was less than 70% for 7 items -- values for FIM+FAM items ranged from 0.35 – 0.95, FAM items ranged from 0.35 (adjustment to limits) to 0.92 (swallowing) – possible observer bias was identified for 4 items; employability, writing, comprehension and problem-solving (McPherson et al. 1996); at the item level, interrater reliability ranged from ICC= 0.36 (social interaction) to 0.97 (transfer – toilet, transfer – bed/chair/wheelchair & stairs) – the average ICC for motor FIM+FAM = 0.91 and cognitive FIM+FAM = 0.74 – ICC values for total FIM+FAM = 0.83 (Donaghy & Wass, 1998)
Internal consistency: = 0.96 for FIM+FAM total, 0.96 for FIM+FAM motor and
0.91 for FIM+FAM cognitive/social items – item-to-total correlations ranged from 0.40 – 0.81 for FIM + FAM & mean inter-item correlation = 0.46 (Hobart et al.
2001); = 0.99 for motor scale, 0.98 for cognitive scale and 0.99 for total FIM+FAM (Hawley et al. 1999)
Validity Construct validity: FIM+FAM not unidimensional -- factor analysis demonstrated 2

Evidence-Based Review of Moderate to Severe Acquired Brain Injury 2013
34 Module 17-Assessment of Outcomes Following Acquired/Traumatic Brain Injury-V9-2013 www.abiebr.com Updated August 2013
principal components with eigenvalues >1 – 16 items reflect physical functioning and 14 items reflect cognition, language and psychosocial functioning (Hawley et al. 1999); linear regression analysis revealed FIM+FAM cognition scores at 6 months explained 33% of variance in CIQ scores at 6 months post-discharge while FIM+FAM motor scores accounted for 22% of variance (this was compared to FIM cognition & motor scores that accounted for 31% & 21% of the variance, respectively) (Gurka et al. 1999) Concurrent validity: Hall et al. (1993) reported FIM+FAM motor scores correlated with FIM motor (r=0.992) and FIM cognition scores (r=0.645) as well as with DRS ratings (r=0.680) – FIM+FAM cognition scores correlated with FIM motor (r=0.652), FIM cognition (r=0.952), DRS ratings (r=0.746), and LCFS scores (r=0.626); FIM+FAM correlated with BI (r=0.525, p<0.001), OPCS Index (r=0.824, p<0.001) and with the original FIM (r=0.962, p<0.001; McPherson & Pentland, 1997); Concurrent validity (Convergent/Discriminant); FIM+FAM total and motor FIM+FAM scores correlated more strongly with OPCS disability scores, LHS scores, SF-36 physical component scores and WAIS-verbal IQ than with measures of mental health or psychological distress (SF36 mental component, General Health Questionnaire); however, cognitive FIM+FAM correlated most strongly with OPCS Disability scores and WAIS-verbal IQ scores and weakly with LHS, SF36 physical and mental components, and the General Health Questionnaire (Hobart et al. 2001)
Responsiveness When ceiling effect is defined at scoring 180 on the FIM + FAM, 34% of patients scored in the ceiling range at discharge from rehabilitation and 79% at one year post discharge – this represented an improvement over the FIM (49%, 84%) – there was no advantage in terms of ceiling effect seen with regard to cog-FIM and the cognitive items of the FIM+FAM (Hall et al. 1996); Rasch analysis revealed FAM items cover a wider range of difficulty than the FIM items and, therefore, expand the range of scale difficulty beyond the FIM alone – however, both FIM and FAM items tend to cluster in the mid-range (Hall et al. 1993); 2% of patients were reported to obtain maximum score on FIM+FAM (McPherson & Pentland 1997); 80 – 90% of patients obtained “near maximum” scores on the FAM (Gurka et al. 1999) SRM means for FIM+FAM total, motor FIM+FAM and cognitive FIM+FAM were reported to be 0.42, 0.52 and 0.19 respectively – there were no significant floor or ceiling effects reported for FIM+FAM (Hobart et al. 2001)
Tested for ABI/ TBI patients?
Developed specifically for ABI/TBI population.
Other Formats UK FIM+FAM – version of the FIM+FAM adapted for use in the United Kingdom resulting in a revised manual and decision trees for items identified as particularly difficult to score. Accuracy of scoring by individuals (when compared to a vignette with previously determined “correct” scores) was reported to be 77.1%. Accuracy of team scoring was reported to be 86.5% for the total score. Revision of the manual & decision trees increased accuracy of scoring for items perceived as difficult to score (Turner-Stokes et al. 1999).
Use by proxy? N/a
Advantages. The FIM was intended specifically for assessment during inpatient rehabilitation. The FAM items are better suited to evaluation post discharge from inpatient rehabilitation and may extend the applicability of the scale beyond the timeframe of the original FIM (Gurka et al. 1999). Addition of the FAM items to the FIM appeared to expand the range of abilities assessed (Hall et al. 1993).

Evidence-Based Review of Moderate to Severe Acquired Brain Injury 2013
35 Module 17-Assessment of Outcomes Following Acquired/Traumatic Brain Injury-V9-2013 www.abiebr.com Updated August 2013
Limitations. Use of the FIM+FAM still requires the use of trained raters who, ideally complete ratings after a period of observation and contribute to a team consensus process, as for the FIM (Hobart et al. 2001). The use of untrained raters may result in lower scale reliability (Hall et al. 1993). Many of the FAM items have been identified as difficult to score (adjustment to limitations, emotion, employability, community mobility, safety judgement, attention and speech intelligibility (Turner-Stokes et al. 1999). Items in the expanded psychosocial/cognitive subscale seem to include more abstract concepts requiring raters to make more subjective assessments than was necessary for the more objective and observable behavioural items included on the original FIM (Hall et al. 1993, McPherson et al. 1996). Abstractness of items could have a deleterious effect on the reliability of those items (Alcott et al. 1997). Additional training together with more explicit definitions and/or content modification of the most abstract items could assist raters in the provision of reliable evaluations (Allcott et al. 1997, McPherson et al. 1996). While the FAM items were intended to provide additional assessment of the psychosocial aspects of disability following brain injury (Hall et al. 1993), the validity of the assessment has not been clearly established (Hobart et al. 2001). The psychosocial/cognitive FIM+FAM does not correlate well with measures of handicap, such as the London Handicap Scale or as strongly as one might expect with the mental component summary of the SF36 (Hobart et al. 2001). Overall, the added length and increased training requirements associated with the FIM+FAM do not seem to offer any substantial advantage over the FIM (McPherson & Pentland 1997, Hobart et al. 2001). While the FIM+FAM appears to evaluate a somewhat broader range of abilities (Hall et al. 1993), reports of ceiling effects associated with the FIM+FAM are varied and reported effect sizes are approximately the same as those reported for the FIM (Hobart et al. 2001). Summary –FIM+FAM Interpretability: The 18-FIM items are widely used and recognized. However, the FAM items are more difficult to rate reliably and the validity of FAM is not well established. Acceptability: Alternate modes of administration have not been examined and FAM items have not been evaluated for use in assessment by proxy. Feasibility: The addition of FAM items to the FIM creates a longer assessment requiring the involvement of addition raters in team consensus and more training for these raters. While the FAM items are freely available use of the FIM items requires purchase of the scale, training and certification.

Evidence-Based Review of Moderate to Severe Acquired Brain Injury 2013
36 Module 17-Assessment of Outcomes Following Acquired/Traumatic Brain Injury-V9-2013 www.abiebr.com Updated August 2013
Table 17.22 FIM+FAM Evaluation Summary
Reliability Validity Responsiveness
Rigor Results Rigor Results Rigor Results Floor/ceiling
++
+++ (TR) ++(IO) +++(IC)
+ ++ ++ ++ varied
NOTE: +++=Excellent; ++=Adequate; +=Poor; n/a = insufficient information; TR=Test re-test; IC= internal consistency; IO = Interobserver.
17.10 Galveston Orientation and Amnesia Test (GOAT) The Galveston Orientation and Amnesia test (GOAT) was intended to evaluate orientation to time, place and person and to provide an estimation of the intervals prior to and following the injury for which there is no recall (Levin et al. 1979). Assessment consists of 10 items regarding orientation to person (name, address & birthdate), place (city/town and building they are in) and time (current time, date, month, year & date of hospital admission) as well as memory of events both after and prior to the injury (Bode et al. 2000). Oral questions are posed directly to the patient who may respond either orally or in writing (Levin et al. 1979, Jain et al. 2000). Error points are awarded for each incorrect response, summed and deducted from 100 to arrive at the total score. Both the scale and instructions for assigning error points are available in Levin et al. (1979). The duration of PTA is defined as the period following coma in which the GOAT score is less than 75 (Levin et al. 1979). PTA is considered to have ended if a score of 75 or more is achieved on 3 consecutive administrations (Wade 1992, Novack et al. 2000, Zafonte et al. 1997). In the initial standardization study of Levin et al. (1979) using patients with mild head injury as a reference group, it was determined that a score of 75 represented a level achieved by 92% of the standardization group. No patients with mild head injury scored less than 65 on the GOAT. Scores between 66 and 75 are considered borderline-abnormal while scores above 75 fall into the range considered normal within the reference group (Levin et al. 1979; van Baalen et al. 2003).
The GOAT is a brief and simple mental status examination developed for use by health professionals at the bedside or in the Emergency Department (Levin et al. 1979; van Baalen et al. 2003).
Table 17.23 Characteristics of the Galveston Orientation and Amnesia Test
Reliability
Interobserver reliability: Kendall tau = 0.99 (p<0.001) and 0.99 for individual items (Levin et al. 1979) Internal consistency: - on Rasch analysis, person separation reliability = 2.46 and item separation reliability = 8.68 and all items adhered to a single construct (Bode
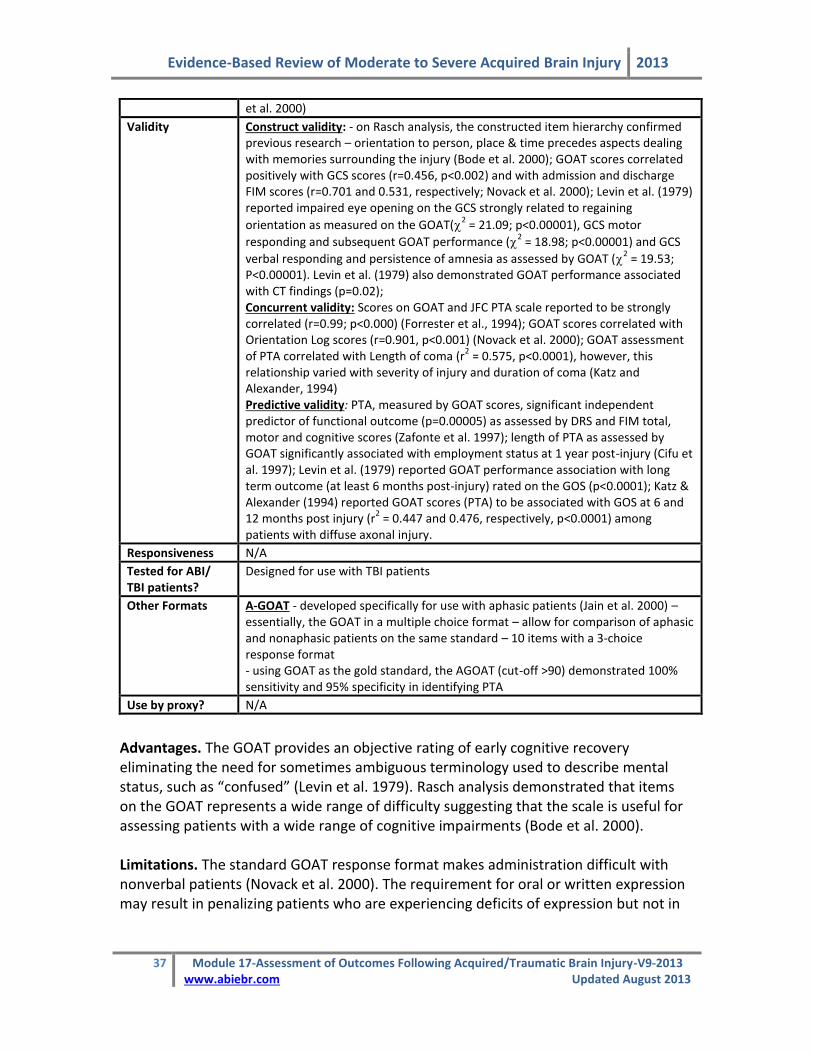
Evidence-Based Review of Moderate to Severe Acquired Brain Injury 2013
37 Module 17-Assessment of Outcomes Following Acquired/Traumatic Brain Injury-V9-2013 www.abiebr.com Updated August 2013
et al. 2000)
Validity Construct validity: - on Rasch analysis, the constructed item hierarchy confirmed previous research – orientation to person, place & time precedes aspects dealing with memories surrounding the injury (Bode et al. 2000); GOAT scores correlated positively with GCS scores (r=0.456, p<0.002) and with admission and discharge FIM scores (r=0.701 and 0.531, respectively; Novack et al. 2000); Levin et al. (1979) reported impaired eye opening on the GCS strongly related to regaining
orientation as measured on the GOAT(2 = 21.09; p<0.00001), GCS motor
responding and subsequent GOAT performance (2 = 18.98; p<0.00001) and GCS
verbal responding and persistence of amnesia as assessed by GOAT (2 = 19.53;
P<0.00001). Levin et al. (1979) also demonstrated GOAT performance associated with CT findings (p=0.02); Concurrent validity: Scores on GOAT and JFC PTA scale reported to be strongly correlated (r=0.99; p<0.000) (Forrester et al., 1994); GOAT scores correlated with Orientation Log scores (r=0.901, p<0.001) (Novack et al. 2000); GOAT assessment of PTA correlated with Length of coma (r
2 = 0.575, p<0.0001), however, this
relationship varied with severity of injury and duration of coma (Katz and Alexander, 1994) Predictive validity: PTA, measured by GOAT scores, significant independent predictor of functional outcome (p=0.00005) as assessed by DRS and FIM total, motor and cognitive scores (Zafonte et al. 1997); length of PTA as assessed by GOAT significantly associated with employment status at 1 year post-injury (Cifu et al. 1997); Levin et al. (1979) reported GOAT performance association with long term outcome (at least 6 months post-injury) rated on the GOS (p<0.0001); Katz & Alexander (1994) reported GOAT scores (PTA) to be associated with GOS at 6 and 12 months post injury (r
2 = 0.447 and 0.476, respectively, p<0.0001) among
patients with diffuse axonal injury.
Responsiveness N/A
Tested for ABI/ TBI patients?
Designed for use with TBI patients
Other Formats A-GOAT - developed specifically for use with aphasic patients (Jain et al. 2000) – essentially, the GOAT in a multiple choice format – allow for comparison of aphasic and nonaphasic patients on the same standard – 10 items with a 3-choice response format - using GOAT as the gold standard, the AGOAT (cut-off >90) demonstrated 100% sensitivity and 95% specificity in identifying PTA
Use by proxy? N/A
Advantages. The GOAT provides an objective rating of early cognitive recovery eliminating the need for sometimes ambiguous terminology used to describe mental status, such as “confused” (Levin et al. 1979). Rasch analysis demonstrated that items on the GOAT represents a wide range of difficulty suggesting that the scale is useful for assessing patients with a wide range of cognitive impairments (Bode et al. 2000). Limitations. The standard GOAT response format makes administration difficult with nonverbal patients (Novack et al. 2000). The requirement for oral or written expression may result in penalizing patients who are experiencing deficits of expression but not in

Evidence-Based Review of Moderate to Severe Acquired Brain Injury 2013
38 Module 17-Assessment of Outcomes Following Acquired/Traumatic Brain Injury-V9-2013 www.abiebr.com Updated August 2013
orientation or in the retrieval or consolidation of memory (Jain et al. 2000). An aphasia-specific version of the GOAT has been created, however, it requires further evaluation. For items in which partial credit is used, Rasch analysis revealed step disorder (Bode et al. 2000). Collapsing these response categories to a simple dichotomy (right vs. wrong) eliminated the disorder and allowed the construction of an equal interval measure from the GOAT (Bode et al. 2000). While the GOAT does contain items intended to provide an assessment of memory, it is primarily a measure of disorientation. Eight of the 10 GOAT items evaluate orientation while only two examine memory (Forrester et al. 1994). Summary – GOAT Interpretability: The GOAT provides an objective assessment with a standardized cut-off for the presence of PTA. Acceptability: In its original form, the GOAT is not well suited to assessment of patients with aphasia. Feasibility: The GOAT may be too lengthy for a simple, repeated bedside assessment of mental status. However, it is freely available and can be used by any healthcare professional.
Table 17.24 GOAT Evaluation Summary
Reliability Validity Responsiveness
Rigor Results Rigor Results Rigor Results Floor/ceiling
+
+++(IO) ++ (IC)
++ +++ N/A N/A N/A
NOTE: +++=Excellent; ++=Adequate; +=Poor; N/A = insufficient information; TR=Test re-test; IC= internal consistency; IO = Interobserver;

Evidence-Based Review of Moderate to Severe Acquired Brain Injury 2013
39 Module 17-Assessment of Outcomes Following Acquired/Traumatic Brain Injury-V9-2013 www.abiebr.com Updated August 2013
17.11 Glasgow Coma Scale (GCS) The Glasgow Coma Scale (GCS) was developed as a simple, objective assessment of impaired consciousness and coma based on eye opening, verbal and motor responsiveness (Teasdale & Jennett 1974, Teasdale & Jennett 1976, Teasdale et al. 1978). It has become the most widely known and widely used scale in the assessment of level of consciousness (Wade 1992, Hall 1997, Brain trauma foundation, 2000). The GCS is an observer rating scale consisting of 15 items in three basic categories: motor response (6 items), verbal response (5 items) and eye opening (4 items). Points are awarded for the best response in each category and category scores are summed to provide a global GCS score (Wade1992, Sternbach 2000).
Summed scores range from a minimum of 3 (total un-responsiveness) to a maximum of 15 (alert, fully responsive). A total of 8 or less is used to separate coma from non-coma (Wade 1992). Additional categorical divisions are used to differentiate patients in terms of initial severity of head injury such that GCS scores of 13–15 represent mild injury, scores of 9–12 represent moderate injury and scores of </=8 represent severe injury (Sternbach 2000). The GCS is freely available, takes approximately 1 minute to administer and can be performed by all medical personnel (Oppenheim & Camins 1992).
Table 17.26 Characteristics of the Glasgow Coma Scale
Reliability
Interobserver reliability: ranged from 0.39 – 0.79 (p=0.000; Juarez & Lyons, 1995); overall agreement = 90% -- for each component, % agreement ranged from 83.8% (eye opening-right) to 98.7% (best motor response-left) – agreement was lowest for the eye opening component; correlations between observers ranged from 0.855 (motor response-right) to 0.974 (best verbal response) (Fielding & Rowley, 1990); low rates of disagreement (disagreement rating = 0.089 – 0.187), motor responses elicited by supraorbital stimulus had higher rates of disagreement than fingertip stimulation (p<0.01; Teasdale et al. 1978); % agreement ranged from 55% (verbal) - 74% (eye opening), Spearman’s rho = 0.587
(verbal) – 0.742 (motor) and w = 0.48 (verbal) to 0.72 (eye opening) (Gill et al. 2004); Rowley & Fielding (1991) reported reliability of 98.6 – 100% among experienced nurses, 94.3% - 96.2% among new graduates and 77.3% - 100% among groups of student nurses.
Table 17.25 Glasgow Coma Scale (Teasdale and Jennett, 1974)
Response/Item Points
Eye Opening:
Spontaneous To speech To pain None
4 3 2 1
Motor Response
Obeys commands Localizes pain Withdrawal (from painful stimulus) Abnormal flexion Extension None
6 5 4 3 2 1
Verbal Response
Oriented Confused Inappropriate Incomprehensible None
5 4 3 2 1

Evidence-Based Review of Moderate to Severe Acquired Brain Injury 2013
40 Module 17-Assessment of Outcomes Following Acquired/Traumatic Brain Injury-V9-2013 www.abiebr.com Updated August 2013
Validity Construct validity: GCS 13 – 14 associated with greater proportion of abnormality on CT and longer duration PTA than GCS 15 (McCullagh et al 2001); Depth of coma as assessed by GCS is considered to reflect extent of brain damage, in 1996 review, Prasad cited the following studies -- good correlation between GCS and cerebral metabolic rate (Langfitt et al. 1982), correlation with CSF enzymes (0.82 – 0.99; Bakay et al., 1983) and good correlation with evoked potential abnormalities (no stat given; Lindsay et al. 1981); mean values of serum enzymes LDH1 and CPK1
correlated with GCS scores within 72 hours of injury (r=0.89 for both), incidence of multiple trauma also correlated with GCS scores (p<0.01; Bakay et al. 1983); Concurrent validity: GCS scores correlated with length of coma (r
2 = 0.233,
p<0.0001; Katz and Alexander, 1994) Predictive validity: GCS 13-14 and GCS 15 (mild head injury) not predictive of neuropsychiatric outcome 6 months post-injury (McCullagh et al. 2001); On multiple regression, GCS was identified as a significant independent predictor of death (p<0.0001), however, the prognostic value of the GCS was noted to be affected by mechanism of injury and age of the patient (Demetriades et al. 2004); based on 10 years of head injury data (1992 – 2001), the GCS was significantly correlated with the GOS at 6 months post injury for each year of data from 1992 – 1996, but from 1997 – 2001, no significant association was reported (Balestreri et al. 2004); GCS was predictive of survival (AUC=0.891) but only slightly more than the motor component score on its own (AUC=0.873), the eye opening score did not add to the predictive accuracy of the GCS (Healey et al., 2003); In predicting mortality, there was a significant association between total GCS scores and outcome – on multivariate analysis, the motor & verbal components were associated with mortality while eye-opening was not – additionally, among patients with total GCS > 9, only the verbal component was significant on multi-
variate analysis, whereas for patients with GCS9, Motor and Verbal component scores were significantly associated with mortality and verbal score was a better predictor than motor score in this group (Teoh et al. 2000); initial GCS scores significantly associated with employment status at one year post-injury(p<0.05)(Cifu et al. 1997); initial GCS significantly associated with DRS scores, LCFS scores, FIM-motor and FIM-cognitive at admission to and discharge from rehabilitation, though correlations were low to moderate (r = 0.16 to 0.37; all p<0.0005; Zafonte et al. 1996); Waxman et al. (1991)reported that, when taken immediately on arrival at hospital, reported correlations between GCS scores and GOS scores (r
2 =0.16) as well as length of hospital stay (r
2 = 0.08), length of
intensive care stay(r2 = 0.05) and duration of ventilatory support (r
2 =0.03) were
low, however, correlations between GCS taken at 6 hours after hospital arrival and GOS scores were much stronger (r
2 = 0.55) – GCS assessed at 6 hours and change
in GCS contributed significantly to the prediction of GOS (r2 = 0.71 – model
included GCS 6 hours, Initial severity score, number of abnormal CT findings & change in GCS score); GCS was predictive of GOS at 6 months (r
2 = 0.135, p<0.001)
but much less so at 12 months (r2 = 0.81, p<0.005; Katz and Alexander, 1994); 95%
of patients scoring higher than 7 on initial GCS had favourable GOS outcome, 95% with GCS lower than 5 had unfavorable outcome – prediction of outcome for patients with initial GCS of 5,6,7 was more difficult – 24 hours GCS scores were preferable among these middle band patients when patients had either improved or deteriorated into the range in which predictions were more accurate (Young et al. 1981); best day 1 GCS was a significant predictor of 6 month outcome on the DRS (p<0.05; Pastorek et al. 2004); initial Glasgow Outcome Score reported as a significant predictor of GOS score 6 months post injury (p<0.001; Satz et al. 1998); preresuscitation GCS score correlated with survival for head injury patients

Evidence-Based Review of Moderate to Severe Acquired Brain Injury 2013
41 Module 17-Assessment of Outcomes Following Acquired/Traumatic Brain Injury-V9-2013 www.abiebr.com Updated August 2013
(r=0.978; p<0.0001) and with functional outcome as assessed by the FIM at discharge (r=0.973, p<0.0001; (Udekwu et al. 2004).
Responsiveness N/A
Tested for ABI/ TBI patients?
Created specifically to monitor head-injured patients
Other Formats N/A
Use by proxy? N/A
Advantages. The Glasgow Coma Scale is a simple, straightforward and very brief bedside assessment. It is the most widely used instrument in the assessment of level of consciousness. GCS scores are a significant predictor of outcome following head injury; however, the prognostic value of the GCS is increased by taking other variables into account as well, such as mechanism of injury, age, CT findings, papillary abnormalities and episodes of hypoxia and hypotension (Demetriades et al. 2004, Balestreri et al. 2004, Zafonte et al. 1996). Limitations. The GCS is based on the assumption that evaluation of eye opening sufficient to represent brainstem arousal systems activity. While other assessments have been developed to provide a more comprehensive evaluation of brainstem responses, the resulting tools are substantially more complex than the GCS (Sternbach 2000). The GCS has been reported to be reliable when used by various groups of healthcare professionals regardless of level of education or ICU experience (Juarez and Lyons 1995). Nurses and general surgeons have been reported to be as consistent in their ratings as neurosurgeons (Teasdale et al. 1987). However, it has also been demonstrated that consistent ratings may also be inaccurate. Rowley and Fielding (1991) reported that the percentage agreement between inexperienced individuals and expert raters ranged from 58.3% to 83.3%. Lower levels of accuracy were most notable in the middle ranges of the scale. Training and the implementation of standard assessment procedures are important to maintain both high levels of reliability and accuracy of evaluation. The administration of a painful stimulus appears to be somewhat controversial and there is a great deal of variability in the means and location of its application (Edwards 2001, Lowry 1999). The GCS is most often reported as a single, overall score although the scale authors did not recommend the summary score for use in clinical practice. While the single, global score may be a convenient way to summarize data, the use of a global score may result in a loss of information that adversely affects the predictive accuracy of the GCS (Teasdale et al. 1983, Teoh et al. 2000, Healey et al. 2003). The use of a global summary score assumes that each category is equally weighted (Teasdale et al. 1983). However, it has been reported that motor response has the greatest influence on the summary score and results are skewed toward this component (Bhatty and Kapoor 1993). Healey et al. (2003) demonstrated that the ability of the GCS score to predict survival was
Evidence-Based Review of Moderate to Severe Acquired Brain Injury 2013
42 Module 17-Assessment of Outcomes Following Acquired/Traumatic Brain Injury-V9-2013 www.abiebr.com Updated August 2013
derived mostly from the motor response category. In addition, the summary score represents a potential 120 combinations of scores from the three GCS components collapsed into only 13 possibilities. Different combinations of motor responsiveness, verbal responsiveness and eye-opening may have different associated outcomes. Teoh et al. (2000) reported significant differences in mortality outcomes between 4 of 11 scores with multiple permutations demonstrating that individuals with the same GCS scores in varying permutations can have significantly different risks for mortality. Perhaps the most frequently encountered limitation of the GCS is untestable components in various patient groups. Pastorek et al. (2004) reported that the ability of the patient to be evaluated on the entire GCS contributed to the prediction of global outcome measures at 6 months (Pastorek et al. 2004) Unfortunately, patients who have been intubated or sedated, those with paralysis or facial swelling, patients with hypotension, hypoxia, alcohol or illicit drug intoxication all may not be able to provide responses to all categories of GCS items for reasons unrelated to head trauma (Oppenheim and Camins 1992, Rutledge et al. 1996, Demetriades et al. 2004). Murray et al. (1999 as cited in Teasdale and Murray 2000) reported that in a study of head injury patients in European centres, total assessment was possible in 61% of patients before hospital, in 77% on arrival at hospital and in 56% of patients arriving at a neurosurgical unit. It has been suggested that inability to assess using the GCS may reflect the increased and more aggressive use of intubation, ventilation and sedation (Teasdale and Murray 2000, Balestreri et al. 2004). When the GCS was developed, the initial assessment was to be undertaken approximately 6 hours after injury to allow time for stabilization of systemic problems, but prior to the initiation of interventions such as neuromuscular paralyzing agents or sedatives (Bakay et al. 1983, Marion and Carlier, 1994). Increasingly, GCS assessment is performed upon arrival at the Emergency Department and many patients are already intubated and/or sedated by that time (Marion and Carlier, 1994, Waxman et al. 1991). Summary – GCS Interpretability: The GCS is the most familiar, most widely-used early assessment of level of consciousness. It has established categories related to the presence of coma and severity of injury. Acceptability: A very brief, simple observer rater scale. The application of painful stimulus is controversial. Assessment of all components is compromised by aggressive, early interventions such as intubation and sedation. Feasibility: The scale is simple to administer and designed for use by any health profession. Lack of experience and variability in assessment may result in inaccurate assessment. Training and standardized procedures are recommended.

Evidence-Based Review of Moderate to Severe Acquired Brain Injury 2013
43 Module 17-Assessment of Outcomes Following Acquired/Traumatic Brain Injury-V9-2013 www.abiebr.com Updated August 2013
Table 17.27 GCS Evaluation Summary
Reliability Validity Responsiveness
Rigor Results Rigor Results Rigor Results Floor/ceiling
+ ++ (IO) ++ ++ N/A N/A N/A
NOTE: +++=Excellent; ++=Adequate; +=Poor; N/A = insufficient information; TR=Test re-test; IC= internal consistency; IO = Interobserver.
17.12 Glasgow Outcome Scale (GOS)/Extended Glasgow Coma Scale (GOSE) The Glasgow Outcome Scale (see below) is a practical index of social outcome following head injury designed to complement the Glasgow Coma Scale as the basis of a predictive system (Jennett and Bond, 1975, Jennett et al. 1981). It is a simple, hierarchical rating scale with a limited number of broad categories. The scale focuses on how head injury had affected function in major life areas and is not intended to provide detailed information on specific deficits (Wilson et al. 1998). Individuals within any single outcome category represent a range of abilities (Jennett and Bond, 1975). Patients are assigned to one of 5 possible outcome categories: death, persistent vegetative state, severe disability, moderate disability, and good recovery (Jennett and Bond, 1975). The GOS is described in the following table In 1981, a revision to the scale was proposed to better classify patients who had regained consciousness (Jennett et al. 1981). In the Extended Glasgow Outcome Scale (GOSE), each of the 3 categories applicable to conscious patients are subdivided into an upper and lower band resulting in 8 possible categories. GOS ratings can be derived from the GOSE by collapsing these subdivisions (Wilson et al. 2000). The assignment of an individual to an outcome category should be based on the results of a structured interview focused on social and personal functional ability (Jennett et al. 1981). The final rating is based on the lowest category of outcome indication in the interview (Wilson et al. 2000).
Table 17.29 Characteristics of the GOS and GOSE
Reliability
Test-retest: ranged from 0.40 – 0.92 for the GOS and 0.40 – 0.87 for the GOSE; however, the retest period was lengthy ranging from 3 – 6 months (Maas et al. 1983) Interobserver reliability: Jennett et al. (1981) reported 95% agreement between observers using the original GOS; agreement between assessment based on a mail-administered research questionnaire and assessment via interview by a
Table 17.28 Glasgow Outcome Scale Category Summary Dead Persistent Vegetative State Sleep/awake, nonsentient Severely Disabled* Conscious but dependent Moderately Disabled* Independent but disabled Good Recovery* May have mild residual effects Teasdale et al. 1998. **Note: The categories of severely disabled, moderately disabled and good recovery were subdivided into upper and lower bands to form the Extended GOS (Jennett et. al. 1981)

Evidence-Based Review of Moderate to Severe Acquired Brain Injury 2013
44 Module 17-Assessment of Outcomes Following Acquired/Traumatic Brain Injury-V9-2013 www.abiebr.com Updated August 2013
psychologist was reported to be r=0.79 while agreement between a GP’s assessment and the psychologist interview was r=0.49 (Anderson et al. 1993);
based on live interviews =0.77 for GOS and 0.48 for GOSE – when ratings were
based on previously recorded data, =0.58 for GOS and 0.49 for GOSE –
agreement between live and recorded data ratings, =0.77 for GOS and 0.53 for the GOSE(Maas et al. 1983); 70% of GOS ratings were in perfect agreement while none differed by more than one category – for the GOSE none differed by more than one category –most discrepancy seen in the middle categories (Brooks et al. 1986)
Validity Construct validity: GOS ratings reported to be associated with results neurological testing of motor tasks (p<0.001), psychomotor tests (p<0.05), assessments of memory variables (p<0.05), attention variables (p<0.05) such that neuropsychological test performance decreased as a function of increased severity on the GOS rating scale (Satz et al. 1998); performance on cognitive tests 3 months post injury differed significantly (p<0.05) between outcome subgroups corresponding to GOS ratings demonstrating a clear gradation in cognitive scoring between groups in the expected direction – this relationship was not as clear when the GOSE was used (Brooks et al., 1986) Construct validity (known groups): GOS scores could discriminate between groups based on categories of vocational recommendations (return to work, vocational training, supported work and continued remedial therapy; p<0.0001), GOS scores accounted for 76% variance between cell means (Mysiw et al. 1989) Concurrent validity: Admission DRS scores correlated with initial Stover& Zeiger (S-Z) ratings (r=0.92), discharge DRS scores correlated with discharge SZ scores (r=0.81), GOS scores (0.80) and EGOS scores (0.85) (Gouvier et al. 1987); GOS ratings correlated with SF-36 subscale scores (r=0.51 – 0.68, p<0.01; Jenkinson et al. 1993 cited in Teasdale et al. 1998); GOS scores correlated with DRS ratings at admission to (r=0.50, p<0.01) and discharge from rehabilitation (r=0.67, p<0.01; Hall et al. 1985) Predictive validity: GOS at discharge from rehabilitation significantly correlated with GOS 5 – 7 years after head injury (r=0.60, p<0.001) and with discharge destination (p<0.0001; Massagli et al. 1996)
Responsiveness From assessment 3 months post injury to 6 month assessment 36% of patients demonstrated change in GOSE ratings while only 11% demonstrated change in category based on GOS ratings (p<0.05) (Levin et al. 2001); from admission to discharge from rehabilitation, improvement shown by the DRS was significantly greater than that shown by the GOS (71% vs. 33%, p<0.01; Hall et al. 1985)
Tested for ABI/TBIpatients?
Specific to head injury populations.
Other Formats Structured interview for the GOS/GOSE (Wilson et al. 1998)– improves reliability and removes limitations associated with scale ambiguity and lack of guidelines for administration. – specifies criteria for separating the upper and lower bands of the upper 3 categories of the GOS. The structured interview consists of a series of questions regarding consciousness, independence (both at and away from home), social roles (work, social activities, leisure, relationships) and return to normal life(Wilson et al. 2000). The questionnaire focuses on aspects of social disability (effects on social & leisure activities and disruption to family and friendships) as originally described by Jennett et al. (1981). The structured interview format also allows for the inclusion of pre-injury disability status (Wilson et al. 1998) and provides specific guidance regarding assignment to outcome category (Teasdale et al. 1998).

Evidence-Based Review of Moderate to Severe Acquired Brain Injury 2013
45 Module 17-Assessment of Outcomes Following Acquired/Traumatic Brain Injury-V9-2013 www.abiebr.com Updated August 2013
Reliability: - agreement between raters was reported to be 92% for the GOS and
78% for the GOSE when administered via structured interview, w = 0.89 and 0.85 for the GOS & GOSE respectively. (Wilson et al. 1998) Validity: - significant correlation reported between BI and GOS (rho=0.61, p<0.001) and between DRS scores and GOS ratings (rho=0.89, p<0.001; Pettigrew et al. 1998); when using the structured interview, Wilson et al. (2000) reported correlations with BI scores of 0.47 & 0.46 for the GOS and GOSE, respectively – GOS and GOSE ratings also correlated with DRS ratings (r=0.89 for both), in addition, GOS & GOSE ratings correlated with Beck Depression inventory scores (r=0.61 & 0.64), GHQ scores (0.57 & 0.59), SF-36 subscores (ranging from 0.41 – 0.67 and 0.47 – 0.71) and NFI scale scores, ranging from 0.33 – 0.57 and 0.37 – 0.63 for patient NFI ratings and 0.47 – 0.68 and 0.47 – 0.69 for NFI ratings obtained from friends or relatives; Levin et al. (2001) reported that at 3 months
post injury, GOS ratings were significantly associated (p0.05) with results on the CES-D, CIQ, Social support questionnaire,and the paced auditory serial audition test (trial 1) – GOSE ratings were significantly associated with results from the CIQ & the Paced auditory serial audition test (trial 1) – in cases where both demonstrated linear association with scale scores (i.e. CIQ and the paced auditory serial audition test) GOSE ratings accounted for more of the variance in scale scores than GOS ratings (r
2 = 0.35 vs. 0.26 and 0.37 vs. 0.19, respectively)
Telephone administration (structured interview): --agreement between face-to-
face-interview and telephone interview was reported to be w= 0.92 for the GOSE
– when GOSE scores were collapsed to GOS ratings, w = 0.92 – interobserver
agreement was reported to be w = 0.84 and 0.85 when GOSE scores were collapsed to GOS ratings (Pettigrew et al. 2003) Simple Postal Assessment (Hellawell et al. 2000): - using a simple, 4 question survey, inter-observer (GP’s, family informants, experienced GOS raters) reliability
was reported to range from = 0.17 (between GP and experienced rater) to 0.61 (between GP’s and family informants). Postal Questionnaires – based on the structured interviews for GOS and GOSE of Wilson et al. (1998) (Wilson et al. 2002): - designed to be completed by the patient or a relative or caregiver of the patient or by the patient with the assistance of a significant other/caregiver. Questions are intended to discriminate between the categories of severe disability, moderate disability and good recovery (for the GOSE questionnaire, these are further subdivided into upper and lower bands). Return rates were reported to be 76% for the GOS questionnaire and 83% for the GOSE questionnaire. Test retest reliability for the GOS was reported to be
w = 0.94 and w = 0.98 for the GOSE. Agreement between GOS ratings assigned via postal questionnaire and telephone interview (using the structured interview)
was reported as w = 0.67 while agreement using the GOSE questionnaire was
higher (w = 0.92) Edinburgh Extended Glasgow Outcome Scale (EEGOS) (Hellawell & Signorini, 1997): - based on the GOS, but requires scoring for behavioural/emotional, cognitive, and physical functioning – each patient is assigned a rating on each of these types of function. Descriptions are provided for each of the function types.
Using retrospective data, interobserver agreement was reported as = 0.20 – 0.55
for behavioural ratings, = 0.56 – 0.63 for cognitive ratings, and 0.57 – 0.75 for physical ratings. Using current data, interobserver agreement for behavioural,
cognitive and physical ratings was reported as =0.61, 0.62 and 0.73, respectively (Hellawell & Signorini, 1997)
Use by proxy? - recommended that the best source of information be used – whenever

Evidence-Based Review of Moderate to Severe Acquired Brain Injury 2013
46 Module 17-Assessment of Outcomes Following Acquired/Traumatic Brain Injury-V9-2013 www.abiebr.com Updated August 2013
possible include information gained by interviewing close friend or family member (Wilson et al. (1998); using a simple postal survey, GP’s and informants tended to rate patient outcome more positively than experienced GOS raters (Hellawell et al. 2000)
Advantages. The GOS is the most widely used and accepted measure of outcome following head injury (Wade 1992). It has been adopted widely for use in clinical trials (Wade 1992, Wilson et al. 2000, Hellawell et al. 2000). It is a simple, reliable means of describing recovery (Jennett et al. 1981) that is quick to administer, broadly applicable and has clinically relevant categories (Wilson et al. 2000). Structured interviews and guidelines for their administration are available for the GOS and GOSE (Wilson et al. 1998. Each interview incorporates a means for including information regarding pre-injury status, thereby providing a means for determining the effect of the sequelae of head injury on outcome separate from the effects of pre-existing conditions or circumstances (Wilson et al. 1998, Pettigrew et al. 1998). While use of the structured interview has increased the reliability of postal and telephone administration, face-to face interview remain the preferred method to determine a GOS rating (Wilson et al. 2002). Limitations The GOS provides an overall assessment of outcome and does not provide detailed information with regard to specific disabilities or handicaps. Categories are broad and the scale does not reflect subtle improvements in functional status of an individual (Pettigrew et al. 1998). Individuals may achieve considerable improvement in ability, but not change outcome category (Brooks et al. 1986). The GOS rating was intended primarily to provide an overall summary of outcome and facilitate comparison not to describe specific areas of dysfunction (Pettigrew et al. 1998). In addition, GOS outcome categories are often expressed as a dichotomy; poor or unfavourable outcome versus independence or favourable outcome. This results in a loss of information and decreased sensitivity (Teasdale et al. 1998). Originally, GOS categories were described according to a range of features, but specific criteria were not defined for each of the different outcomes. This lack of clarity may have had a negative impact on scale reliability by introducing an element of subjectivity on the part of the rater (Teasdale et al. 1998, Maas et al. 1983). In addition, attempts to increase the sensitivity of the GOS by subdividing the upper 3 categories in an upper and lower band was associated with decreased consistency in category assignments (Maas et al. 1983). However, the structured interview and guidelines created by Wilson et al. (1998) have alleviated much of the difficulty surrounding ambiguous assignment criteria.

Evidence-Based Review of Moderate to Severe Acquired Brain Injury 2013
47 Module 17-Assessment of Outcomes Following Acquired/Traumatic Brain Injury-V9-2013 www.abiebr.com Updated August 2013
Summary – GOS Interpretability: The GOS is widely used and accepted. The GOS provides an overall assessment suitable for the comparison of outcomes at the group level. Acceptability: The brevity and simplicity of the GOS facilitate patient compliance. The GOS has been studied for use by telephone and mail administration. Structured interviews improve the reliability of administration by these methods. Feasibility: The GOS can be used by professionals from various backgrounds and does not require any physical, psychiatric or neurologic examination. It is well-suited to busy clinical settings and large scale research trials.
Table 17.30 GOS/GOSE Evaluation Summary
Reliability Validity Responsiveness
Rigor Results Rigor Results Rigor Results Floor/ceiling
+
++(TR) ++(IO)
++ +++ + +(p-values only) N/A
NOTE: +++=Excellent; ++=Adequate; +=Poor; N/A = insufficient information; TR=Test re-test; IC= internal consistency; IO = Interobserver.
17.13 Hospital Anxiety and Depression Scale (HADS) The Hospital Anxiety and Depression Scale (HADS), a self-assessment scale, was developed to detect states of depression, anxiety and emotional distress amongst patients who were being treated for a variety of clinical problems (Zigmond and Snaith 1983). The scale was not designed to be a clinically diagnostic tool (Whelan-Goodinson et al., 2009). Originally the scale consisted of 8 questions relating to depression and 8 relating to anxiety. Initial findings indicated one of the items on the depressions scale was weak (r=.11) thus it was removed. Remaining items on the scale had correlations ranging from +.60 to +.30, with a significance of (p<0.02). Anxiety items had correlations ranging from +.76 to +.41 (p<0.01); however, to keep the items in each scale equal, the weakest item on the anxiety portion of the scale was removed. Thus the final scale has a total of 14 items, with responses being scored on a scale of 0-3, with 3 indicating higher symptom frequencies (Whelan-Goodinson et al., 2009). Score for each subscale (anxiety and depression) can range from 0-21 with scores categorized as follows: normal (0-7), mild (8-10), moderate (11-14), severe (15-21). Scores for the entire scale (emotional distress) range from 0-42, with higher scores indicating more distress. Prior to completing the scale patients are asked to “fill it complete in order to reflect how they have been feeling during the past week” (Zigmond and Snaith, 1983; p. 366). Unfortunately within in the TBI population, many measures are used to assess depression and anxiety post injury, but none of these measures have been evaluated for use with this population (Whelan-Goodinson et al., 2009; Schonberger and Ponsford, 2010). Recently the HADS has been tested with those who have sustained an ABI; however due to the mixed aetiology problems were found with some of the questions which could be related to the injury itself, the level of cognitive impairment or the
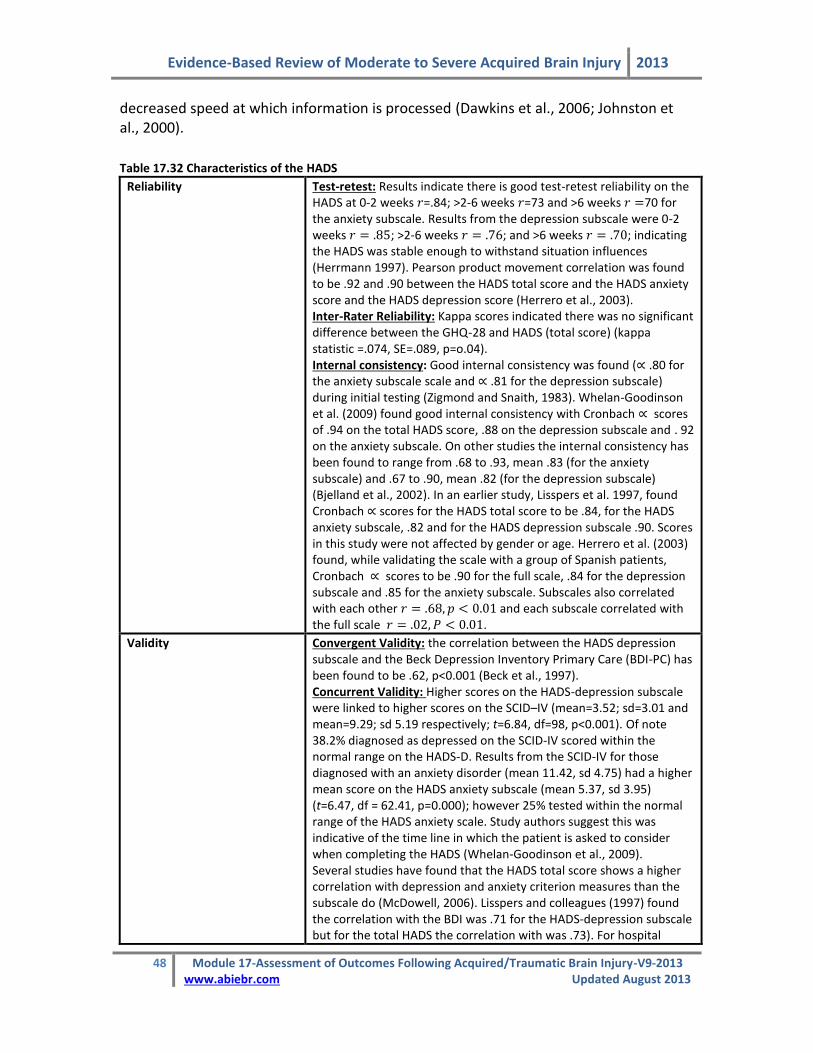
Evidence-Based Review of Moderate to Severe Acquired Brain Injury 2013
48 Module 17-Assessment of Outcomes Following Acquired/Traumatic Brain Injury-V9-2013 www.abiebr.com Updated August 2013
decreased speed at which information is processed (Dawkins et al., 2006; Johnston et al., 2000).
Table 17.32 Characteristics of the HADS
Reliability Test-retest: Results indicate there is good test-retest reliability on the HADS at 0-2 weeks =.84; >2-6 weeks =73 and >6 weeks 70 for the anxiety subscale. Results from the depression subscale were 0-2 weeks ; >2-6 weeks ; and >6 weeks ; indicating the HADS was stable enough to withstand situation influences (Herrmann 1997). Pearson product movement correlation was found to be .92 and .90 between the HADS total score and the HADS anxiety score and the HADS depression score (Herrero et al., 2003). Inter-Rater Reliability: Kappa scores indicated there was no significant difference between the GHQ-28 and HADS (total score) (kappa statistic =.074, SE=.089, p=o.04). Internal consistency: Good internal consistency was found ( .80 for the anxiety subscale scale and .81 for the depression subscale) during initial testing (Zigmond and Snaith, 1983). Whelan-Goodinson et al. (2009) found good internal consistency with Cronbach scores of .94 on the total HADS score, .88 on the depression subscale and . 92 on the anxiety subscale. On other studies the internal consistency has been found to range from .68 to .93, mean .83 (for the anxiety subscale) and .67 to .90, mean .82 (for the depression subscale) (Bjelland et al., 2002). In an earlier study, Lisspers et al. 1997, found Cronbach scores for the HADS total score to be .84, for the HADS anxiety subscale, .82 and for the HADS depression subscale .90. Scores in this study were not affected by gender or age. Herrero et al. (2003) found, while validating the scale with a group of Spanish patients, Cronbach scores to be .90 for the full scale, .84 for the depression subscale and .85 for the anxiety subscale. Subscales also correlated with each other and each subscale correlated with the full scale .
Validity Convergent Validity: the correlation between the HADS depression subscale and the Beck Depression Inventory Primary Care (BDI-PC) has been found to be .62, p<0.001 (Beck et al., 1997). Concurrent Validity: Higher scores on the HADS-depression subscale were linked to higher scores on the SCID–IV (mean=3.52; sd=3.01 and mean=9.29; sd 5.19 respectively; t=6.84, df=98, p<0.001). Of note 38.2% diagnosed as depressed on the SCID-IV scored within the normal range on the HADS-D. Results from the SCID-IV for those diagnosed with an anxiety disorder (mean 11.42, sd 4.75) had a higher mean score on the HADS anxiety subscale (mean 5.37, sd 3.95) (t=6.47, df = 62.41, p=0.000); however 25% tested within the normal range of the HADS anxiety scale. Study authors suggest this was indicative of the time line in which the patient is asked to consider when completing the HADS (Whelan-Goodinson et al., 2009). Several studies have found that the HADS total score shows a higher correlation with depression and anxiety criterion measures than the subscale do (McDowell, 2006). Lisspers and colleagues (1997) found the correlation with the BDI was .71 for the HADS-depression subscale but for the total HADS the correlation with was .73). For hospital

Evidence-Based Review of Moderate to Severe Acquired Brain Injury 2013
49 Module 17-Assessment of Outcomes Following Acquired/Traumatic Brain Injury-V9-2013 www.abiebr.com Updated August 2013
outpatients the HADS-depression subscale correlated .77 with the Montgomery-Asberg Depression Rating (MADR) scale with a group of psychiatric patients (.70). Again with a group of elderly depressed patients the HADS and the MADR correlated .54 and .79. Overall, Mykletun and colleagues (2001) have reported the correlation between the sub-scores and the over all score as reliable. Discriminant Validity: Correlation between the subscales of the HADS and the correlation between the HADS total score and other scales (the General Health Questionnaire (GHQ-28)) and the MADR scale can vary considerably. Aylard et al (1987) found the correlation of the two subscales of the HADs was compared to the subscale on the GHQ-28 . Lewis and Wessely (1990) found the correlation between the HAD total score and the GHQ-28 was .75. Predictive validity: The HAD-depression and anxiety subscales and were found to account for 52.6% and 60% (respectively) of variance when looking at patients who were diagnosed with a mood disorders and those with no psychiatric disorder (Herrero et al., 2003).
Responsiveness In studies of primary care population, the HADS was successful in detecting DSM-III defined psychiatric morbidity, with the ROC curve showing a score of 8+ being optimal (Bjelland et al., 2006). When using the DSM III clinical interview schedule as the gold standard, ROC curves indicated >/=9 on the HADS anxiety subscale (sensitivity .66 and specificity .93) were indicative of caseness and scores of >/=7 on the HADS depression subscale (sensitivity .66 and specificity .97) were indicative of caseness. (Bjelland et al., 2006). Beck et al., (1997) found the HADS depression subscale had a AUR of .74 (SE =.09) with a cut off score of >/=5 yielding the highest efficiency at 72% with a sensitivity of 85%, but the specificity of only 47%. According to Herrero et al (2003), the curve ROC shows the model discriminates between cases and non cases: HAD-D (area-0.887; 95%CI: 0.84 to 0.91), HAD-A (area-.917; 95%CI: 0.88.to 0.95). For each of these two subcales the predicative power is 80% (HAD-D) and 83% (HAD-A). For the full scale the predicative power is 81%. Herrmann (1997) found the HADS correlated well with other quality of life indicators used in a variety of studies looking at patients with HIV, renal insufficiency, etc. the HADS anxiety subscale correlated well with chest pain, tachycardia, dizziness, etc. The HADS depression subscale correlated well with dyspnea, low exercise tolerance etc.
Tested for ABI/TBI patients?* Yes the scale has been tested with an ABI population.
Other Formats The scale has been translated into Arabic (Malasi et al., 1991), Dutch, French, German, Hebrew, Swedish, Italian and Spanish. All are available at no cost (Zigmond and Snaith, 1983). Recently a computer administered version using a touch screen has been developed and has been found to be as valid as the paper and pencil version (McDowell 2006).
Use by Proxy? The scale is designed to be completed by the individual.
Advantages: The HADS is brief and simple to use and although it was originally designed to be used with hospital populations it has been found to perform well with non-hospital groups (McDowell, 2006). It has been found to take on average 2-5 minutes to
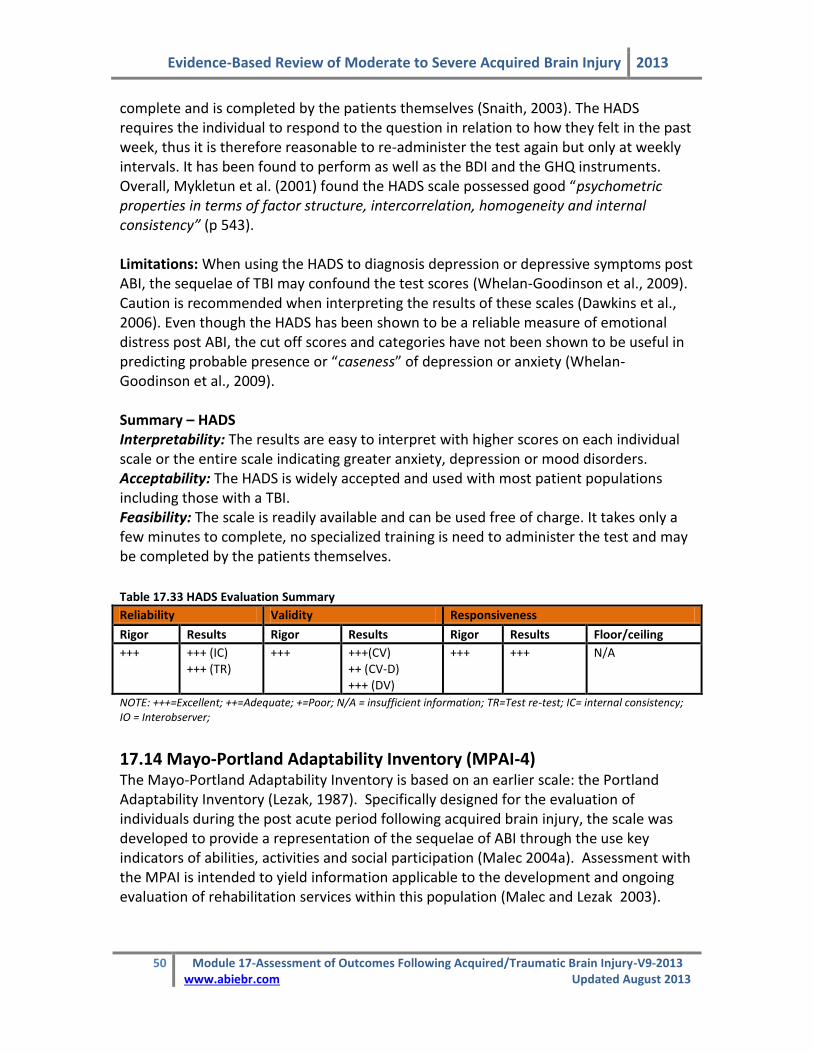
Evidence-Based Review of Moderate to Severe Acquired Brain Injury 2013
50 Module 17-Assessment of Outcomes Following Acquired/Traumatic Brain Injury-V9-2013 www.abiebr.com Updated August 2013
complete and is completed by the patients themselves (Snaith, 2003). The HADS requires the individual to respond to the question in relation to how they felt in the past week, thus it is therefore reasonable to re-administer the test again but only at weekly intervals. It has been found to perform as well as the BDI and the GHQ instruments. Overall, Mykletun et al. (2001) found the HADS scale possessed good “psychometric properties in terms of factor structure, intercorrelation, homogeneity and internal consistency” (p 543). Limitations: When using the HADS to diagnosis depression or depressive symptoms post ABI, the sequelae of TBI may confound the test scores (Whelan-Goodinson et al., 2009). Caution is recommended when interpreting the results of these scales (Dawkins et al., 2006). Even though the HADS has been shown to be a reliable measure of emotional distress post ABI, the cut off scores and categories have not been shown to be useful in predicting probable presence or “caseness” of depression or anxiety (Whelan-Goodinson et al., 2009). Summary – HADS Interpretability: The results are easy to interpret with higher scores on each individual scale or the entire scale indicating greater anxiety, depression or mood disorders. Acceptability: The HADS is widely accepted and used with most patient populations including those with a TBI. Feasibility: The scale is readily available and can be used free of charge. It takes only a few minutes to complete, no specialized training is need to administer the test and may be completed by the patients themselves.
Table 17.33 HADS Evaluation Summary
Reliability Validity Responsiveness
Rigor Results Rigor Results Rigor Results Floor/ceiling
+++ +++ (IC) +++ (TR)
+++ +++(CV) ++ (CV-D) +++ (DV)
+++ +++ N/A
NOTE: +++=Excellent; ++=Adequate; +=Poor; N/A = insufficient information; TR=Test re-test; IC= internal consistency; IO = Interobserver;
17.14 Mayo-Portland Adaptability Inventory (MPAI-4) The Mayo-Portland Adaptability Inventory is based on an earlier scale: the Portland Adaptability Inventory (Lezak, 1987). Specifically designed for the evaluation of individuals during the post acute period following acquired brain injury, the scale was developed to provide a representation of the sequelae of ABI through the use key indicators of abilities, activities and social participation (Malec 2004a). Assessment with the MPAI is intended to yield information applicable to the development and ongoing evaluation of rehabilitation services within this population (Malec and Lezak 2003).

Evidence-Based Review of Moderate to Severe Acquired Brain Injury 2013
51 Module 17-Assessment of Outcomes Following Acquired/Traumatic Brain Injury-V9-2013 www.abiebr.com Updated August 2013
The original version of the MPAI consisted of six subscales: physical/medical, cognition, emotion, everyday activities, social behaviours and behaviours (Bohac et al. 1997). Items were rated to reflect distinctions between impairment, disability and handicap as defined by the World Health Organization’s ICIDH (Malec et al. 2000, Malec and Lezak 2003). The MPAI has undergone successive revisions based on ongoing Rasch and multivariate analyses. The most current version is the MPAI-4, which evaluates the general dimension of sequelae of ABI in 3 sub-dimensions: ability, adjustment and participation (Malec 2004). The MPAI-4 consists of 29 items in 3 subscales (the Ability Index, the Adjustment Index and the Participation Index) plus an additional 6 items that are not included in the MPAI-4 score. The first 29 scale items are intended to reflect the current status of the individual with brain injury without attempting to determine whether their status might be influenced factors other than ABI. The additional six, unscored items are intended to identify the presence of other factors that may be contributing to the individual’s current status (Malec and Lezak, 2003). In general, items are rated on a 5-point scale from 0–4, where 0 represents the most favourable outcome, no problem or independence and 4 represents the presence of severe problems. A worksheet is provided that guides the user through the scoring and re-scoring of items. Following any necessary re-scoring, item scores are summed for each subscale to provide a raw score for that index. After making adjustment for items appearing in more than one index, subscale raw scores are summed to provide an overall adaptability index score. Raw scores for the indices and total scale may be converted to T-scores with a mean of 50 and a standard deviation of 10 using the tables provided in the manual (Malec and Lezak, 2003). T-scores provided are based on data sets from two populations of individuals with ABI. They have not been referenced to non-ABI samples. In general, when compared to the reference populations with ABI, total T-scores less than 30 are indicative of good outcome, 30 – 40 of mild limitations, 40 – 50 of mild to moderate limitations, 50 – 60 of moderate to severe difficulties and above 60 of severe limitations (Malec and Lezak, 2003). The MPAI-4 was designed to be completed by professional staff, individuals who have experienced brain injury and their significant others. Ratings provided by any 2 or more of these groups can be combined to provide a more comprehensive composite score (Malec and Lezak 2003). When administered by professional staff, the ratings should be completed by team consensus. The MPAI-4 is free of charge. The manual and rating forms may be downloaded from the COMBI website (http://tbims.org/combi/mpai). A French translation of the rating form is also available from the website.
Table 17.34 Characteristics of the Mayo-Portland Adaptability Inventory
Reliability
Internal consistency: Inter-item correlations were <0.30 for items Audition, Law Violations, Alcohol Use and Illegal Drug Use – the latter 3 items were significantly correlated only to each other (Bohac et al. 1997); on Rasch analysis, person

Evidence-Based Review of Moderate to Severe Acquired Brain Injury 2013
52 Module 17-Assessment of Outcomes Following Acquired/Traumatic Brain Injury-V9-2013 www.abiebr.com Updated August 2013
separation =1.90 and person reliability = 0.78 and item separation = 9.54 and item reliability = 0.99 for the 30-item MPAI – for the 22-item MPAI, person separation = 2.12 and person reliability = 0.82, item separation = 9.33 and item reliability = 0.99 (Malec et al. 2000); Person reliability = 0.87, person separation = 2.64, item reliability = 0.99, item separation = 10.67 for the MPAI-3 while for the MPAI-4 person reliability = 0.88, person separation = 2.68, item reliability = 0.99 – reliability and separation are also reported for each of the 3 MPAI-4 subscales – person reliability ranges from 0.78 – 0.79 and item reliability from 0.98 – 0.99, person separation was reported to be <2.0 for all subscales while item separation
ranged from 7.59 – 11.94 -- = 0.89 for the entire 29-item MPAI-4 and range from 0.80 – 0.83 for the subscales – subscale to total scale correlations range from 0.82 to 0.86 (Malec et al. 2003); person reliability & separation of 0.86 & 2.94, respectively and item reliability & item separation of 0.98 and 6.81 were reported for the full scale MPAI-4 ratings obtained by staff consensus – subscale person reliability ranged from 0.76 to 0.85 and item reliability ranged from 0.97 – 0.99 (Malec 2004a)
Validity Construct validity: Principal components analysis of MPAI after Varimax rotation revealed 8 orthogonal factors, each with few items – factors corresponded to variables labeled Activities of Daily Living, Social Initiation, Cognition, Impaired Self-Awareness/Distress, Social skills/Support, Independence, Visuoperceptual, Psychiatric – several items loaded significantly on more than one factor (Bohac et al. 1997); principal component analysis of 22-item MPAI revealed five factors – one 8-item set was identified with acceptable levels of person separation and reliability -- correlation between MPAI-30 item and MPAI – 22 item = 0.98 (Malec et al. 2000); item cluster analysis provided a 3-cluster solution that was substantially similar to the item groupings derived rationally by the scale authors – the cluster analysis solution was not statistically superior to the rational item groupings – factor analysis revealed 7 factors with eigenvalues > 1 though each factor contained few items -- moderate correlations between subscales (0.49 to 0.65) suggested that subscales/dimensions may be assessing different aspects of a single underlying construct (Malec et al. 2003) Construct validity (known groups): - significant differences (p<0.001) in MPAI scores were identified in groups differentiated by Rancho Levels of Cognitive Functioning Scale (Malec & Thompson, 1994); staff-completed MPAI-22 ratings distinguished between patients receiving specialized vocational services (SVS), those receiving community reintegration services + SVS and those receiving comprehensive day treatment + SVS (p=0.0001; Malec et al. 2002) Concurrent validity: - original MPAI consensus ratings correlated with DRS scores (r=0.81), with Rivermead Behavioral Memory Test (r=-0.47) and with various neuropsychometric/cognitive measures (correlations ranged from 0.04 with WJRead to 0.56 with Stroop Color-Word test; Malec & Thompson, 1994); Predictive validity: Pre-treatment MPAI-30 score was reported to be predictive of outcome post-treatment as assessed by the MPAI 30 (0.52), MPAI-22 (0.51), Goal Attainment Scaling (-0.49), the Independent Living Status (-0.32) and the Vocational Independence Scale (-0.26) – the pre-treatment MPAI-22 was similarly predictive of outcome, although the association with VIS scores was weak (-0.17) – at one year follow-up, the pre-treatment MPAI-30 and MPAI-22 scores were predictive of ILS and VIS scores (-0.25 & -0.34 vs. –0.26 & -0.32, for the 30 item and 22 item version, respectively) (Malec et al. 2000); pre-admission MPAI-22 score predicted independent living scale scores (concordance = 70.2%, p<0.01) and vocational independence scale scores (concordance = 66.9%, p<0.05) at 1 year follow-up following comprehensive day treatment (Malec, 2001); time since injury

Evidence-Based Review of Moderate to Severe Acquired Brain Injury 2013
53 Module 17-Assessment of Outcomes Following Acquired/Traumatic Brain Injury-V9-2013 www.abiebr.com Updated August 2013
and staff rated MPAI-22 were identified as significant predictors of Vocational Independence scale scores at job placement in the medical/vocational case coordination system (p<0.01), staff-rated MPAI-22 was also predictive of time to placement (p<0.001) (Malec et al. 2000b); staff MPAI-22 ratings contributed significantly to the prediction of community-based employment at one year follow-up (p<0.01; Malec et al. 2002)
Responsiveness MPAI provides a broader assessment at lower levels of disability than DRS (Malec & Thompson, 1994) Change in MPAI-22 score from pre-admission to end of comprehensive day treatment program was significant (paired t= 8.35, p<0.0001; Malec 2001)
Tested for ABI/TBI patients?
Specific to persons with acquired brain injury.
Other Formats Mayo-Portland Participation Index (M2PI)– the Participation Index from the MPAI-4, which may be used as a brief measure focused on participation based on indicators of community integration. Lower scores are indicative of greater community integration (Malec, 2004). Person reliability and separation were reported to be 0.78 & 1.89, respectively (Malec et al. 2003). In the same study,
item separation = 7.59, item reliability = 0.98, and = 0.83. Reported person reliability & separation = 0.85 & 2.41 respectively and item reliability & separation = 0.99 & 8.17 respectively for staff-rated M2PI – person reliability for significant other and patient ratings as well as various composite ratings ranged from 0.74 (individual with ABI) to 0.89 (staff+ SO+ person with ABI) while item reliability ranged from 0.97 – 0.99 (Malec, 2004). When comparing ratings obtained from persons with ABI, significant others and staff, it was reported that persons with ABI tended to rate themselves as having greater independence and involvement in the community than raters from either of the other 2 groups. Overall agreement was greater for more concrete, functional items than for social indicators. No substantial floor or ceiling effects were reported – very high scores and very low scores were not common (<5% and <7% respectively) (Malec, 2004)
Use by proxy? Total MPAI scores derived by staff and significant others were correlated (r=0.47, p<0.005) as were scores derived by significant others and the patients themselves (r=0.37, p<0.025), but MPAI scores derived by staff and patients were not significantly correlated (r=0.09). Differences between staff and patient ratings are attributed to impaired self awareness (Malec et al. 1997). The authors speculated that differences between ratings may, in part, have been due to differing interpretations of terminology used in the test and differences in personal value assigned to various items. Similar levels of reliability were obtained for ratings completed by staff, significant others and persons with ABI (Malec, 2004a). On the full MPAI-4, 42% of ratings made by staff, persons with ABI and their significant others (SO) were in complete agreement, however, a reliable difference in ratings was reported (rater reliability = 0.95). SO and staff raters tended to rate the person with ABI as more impaired than the person with ABI themselves did – this trend was observed for the adjustment and participation subscales, however, on the ability subscale individuals with ABI rated themselves as being more impaired than the staff members did. Exact agreement on subscale ratings were 41% for the Ability Index, 38% for the Adjustment Index and 46% for the Participation Index. More concrete items demonstrated greater agreement between rater groups. using techniques available via Facets analysis, ratings obtained from the profession care team, the individual with ABI and a significant other may be combined to provide a single composite score thereby providing a partial remedy to biases

Evidence-Based Review of Moderate to Severe Acquired Brain Injury 2013
54 Module 17-Assessment of Outcomes Following Acquired/Traumatic Brain Injury-V9-2013 www.abiebr.com Updated August 2013
associated with each rating group (Malec, 2004a; Malec, 2004)
Advantages The MPAI is a readily available assessment of the post-acute sequelae of ABI. The Participation Index may be administered independently to provide a quick evaluation of participation outcomes. Differences in ratings between staff member consensus and individual with ABI or between SO and individual with ABI may provide a measure of impaired self-awareness (Malec et al. 1997; Malec & Degiorgio, 2002). Limitations The authors do not recommended for the MPAI-4 for use in the assessment of individuals with very severe ABI (Malec & Lezak, 2003). The authors reported that the placement of items in the 3 scale indices is based on a rational process in keeping with clinical observation and the results of ongoing analyses (Malec et al. 2003). However, the placement of some items appears odd. Self-care, for instance, is part of the participation index. In an earlier analysis, it was stated that it was more conceptually sound to place the self-care items with other basic skills such as use of hands, mobility and speech (Bohac et al. 1997). These basic items are currently part of the MPAI-4 abilities index. Other items, such as initiation, social contact and leisure skills/recreation were assigned to more than one index suggesting significant overlap between the subscales of adjustment and participation. There are no published validation or reliability studies of the Mayo-Portland Adaptability that did not originate from the group responsible for the development of the scale. Summary – MPAI Interpretability: Tables are provided -- raw scores converted to standardized T-scores based on a national sample (n=386) or regional sample (n=134) – no truly normative data is available for the purpose of comparison. Acceptability: May be completed by patients and significant others with trained professionals available to provide assistance. Feasibility: The MPAI-4 is free to download and copy. Administration, scoring and interpretation should be undertaken by trained professionals. The manual also contains a recommendation that a person capable in advanced psychometrics should be available. To maintain high levels of reliability, assessment should be completed by team consensus.
Table 17.35 MPAI-4 Evaluation Summary
Reliability Validity Responsiveness
Rigor Results Rigor Results Rigor Results Floor/ceiling
+
+++ (IC) + ++ + + (p-value only) N/A
NOTE: +++=Excellent; ++=Adequate; +=Poor; N/A = insufficient information; TR=Test re-test; IC= internal consistency; IO = Interobserver.

Evidence-Based Review of Moderate to Severe Acquired Brain Injury 2013
55 Module 17-Assessment of Outcomes Following Acquired/Traumatic Brain Injury-V9-2013 www.abiebr.com Updated August 2013
17.15 Medical Outcomes Study Short Form 36 (SF-36) The Medical Outcomes Study Short Form 36 (SF-36) is a generic health survey created to assess health status in the general population as part of the Medical Outcomes Study (Ware & Sherbourne 1992). It is comprised of 36 items drawn from the original 245 items generated by that study (Ware & Sherbourne 1992; McHorney et al. 1993). Items are organized into 8 dimensions or subscales; physical functioning, role limitations- physical, bodily pain, social functioning, general mental health, role limitations – emotional, vitality, and general health perceptions. It also includes 2 questions intended to estimate change in health status over the past year. These 2 questions remain separate from the 8 subscales and are not scored. With the exception of the general change in health status questions, subjects are asked to respond with reference to the past 4 weeks. An acute version of the SF-36 refers to problems in the past week only (McDowell & Newell 1996). The recommended scoring system uses a weighted Likert system for each item. Items within subscales are summed to provide a summed score for each subscale or dimension. Each of the 8 summed scores is linearly transformed onto a scale from 0 – 100 to provide a score for each scale. In addition, a physical component (PCS) and mental component score (MCS) can be derived from the scale items. Standardized population data for several countries are available for the SF-36 (McDowell & Newell 1996). The component scores have also been standardized with a mean of 50 and standard deviation of 10 (Finch et al. 2002). The SF-36 questionnaire can be self-completed or administered in person or over the telephone by a trained interviewer. It is considered simple to administer and takes less than 10 minutes to complete (Andreson & Meyers 2000). Permission to use the instrument should be obtained from the Medical Outcomes Trust who oversee the standardized administration of the SF-36 and will provide updates on administration and scoring (McDowell & Newell 1996). Various computer applications are available to assist in scoring the SF-36 including free Excel templates that can be downloaded from the internet (Callahan et al. 2005).
Table 17.36 Characteristics of the Medical Outcomes Study Short Form 36
Reliability Test-retest reliability: Brazier et al. (1992) calculated correlation coefficients ranging from 0.6 (social functioning) to 0.81 (physical functioning). Mean differences ranged from 0.15 (social functioning) to 0.71 (mental health) with 91 – 98% cases falling into the 95% CI (constructed as per Bland & Altman); lower values reported in stroke population of 0.28 (mental health) to 0.80 (social functioning) – reported substantial variability in individual responses, particularly for role limitations – emotional (Dorman et al. 1998); Brazier et al. (1996) reported r=0.28 (social functioning) to 0.70 (vitality) over a retest period of 6 months; Andresen et al (1999) reported ICC ranging from .052 (social functioning) to 0.80 (mental

Evidence-Based Review of Moderate to Severe Acquired Brain Injury 2013
56 Module 17-Assessment of Outcomes Following Acquired/Traumatic Brain Injury-V9-2013 www.abiebr.com Updated August 2013
health), ICC for physical summary scores = 0.82 and ICC = 0.79 for mental summary scores; r=0.79 and 0.78 (p<0.001) for the MCS and PCS respectively with the test taken at 6 months post-injury and 2-3 weeks later (Dikmen et al. 2001)
Internal Consistency: Brazier et al. (1992) 0.80 for all subscales but social
functioning (=0.73). Reliability coefficients = 0.74(social functioning) – 0.93
(physical functioning); Anderson et al. (1996) reported of 0.6 (vitality) to 0.9 (physical functioning, bodily pain and role limitations – emotional). Four scales fell
below 0.80; Brazier et al. (1996) reported 0.80 for all subscales but social
functioning (0.56) and general health (0.66) – inter-item correlations 0.73 with the exception of social functioning (0.56) and general health (0.66); Essink-Bot et
al. (1997) reported = 0.76 (general health) – 0.91 (physical functioning); Hobart
et al. (2002) found of 0.68 (general health) & 0.70 (social functioning) to 0.90 (physical functioning) -- Correlations between 8 scales were lower than the reported alpha coefficients; Hobart et al. (2002) found item-own exceeded item-other correlations by >2.5 SE for 6 of 8 scales - social functioning scale & general health scale did not (i.e. limited ability to distinguish constructs); Walters et al.
(2001) reported 0.80 for all scales but social functioning (=0.79); Doninger et al. (2003) reported person separation estimates of 2.27 and 2.35 for physical health and emotional health respectively; calibration of the physical functioning items generated a reliability of 0.84 with no misfits; calibration of the mental health and vitality scales yielded a reliability of 0.85 with one misfit; for all
subscales ranged from 0.68-0.87 for controls, 0.83-0.91 for mild TBI and from 0.79-0.92 for moderate/severe TBI (Findler et al. 2001)
Validity Construct validity: Walters et al. (2001) reported significant relationships in expected directions to support construct validity among older adults -- scores in all scales were reported to decrease as age increased (p<0.001) – women reported worse health than men on all scales even after adjusting for age(p<0.001)—respondents who had recently visited their physician reported poorer health on all scales (p<0.001) and people living alone had lower scores (p<0.001) except on general health (p=0.02); Doninger et al. (2003) reported item separation estimates of 12.03 and 7.95 for physical health and emotional health respectively; in a trauma population, principal components analysis revealed physical function, role physical and bodily pain had the strongest loadings on physical health and the lowest loadings on mental health whereas role emotional and mental health did the opposite – the general health, vitality, and social function scales had substantial loadings on both components – these results were comparable correlations found for the general US population (MacKenzie et al. 2002). SF-36 scales correlated significantly with the Symptom Checklist (SCL), the Beck Depression Inventory (BDI-II) and the Health Problems List (HPL) – in the mild TBI group, scales related to physical functioning were strongly correlated with the HPL (-0.6 to -0.75) and the physical symptoms scale of the SCL (-0.5 to -0.63) – scales related to mental health were most strongly correlated with psychological factors on the SCL – strong correlations were found between BDI-II scores and all of the SF-36 scales, the highest with the mental health scale (-0.77) – in the moderate/severe group, correlations were weaker and more consistent but the strongest correlations were found where expected (Findler et al. 2001).
Construct validity (known groups): Patients diagnosed with 1chronic physical problems, had lower scores on all dimensions of the SF-36 except mental health, than healthy age-matched controls(p<0.001). SF-36 scores distributed as expected for sex, age, social class and use of health services (Brazier et al. 1992); SF-36

Evidence-Based Review of Moderate to Severe Acquired Brain Injury 2013
57 Module 17-Assessment of Outcomes Following Acquired/Traumatic Brain Injury-V9-2013 www.abiebr.com Updated August 2013
distinguished between groups based on functional dependence vs. independence based on BI scores (p<0.05 on all scales) and between groups based on mental health vs. ill-health defined by GHQ-28 scores (p<0.05 on all scales) (Anderson et al, 1996); Mayo et al. (2002) reported SF-36 scores discriminated stroke survivors from age and gender-matched controls; Williams et al. (1999) found the SF36 unable to discriminate between groups based on patient self-report ratings of overall HRQOL (same, a little worse or a lot worse than prestroke). SF-36 discriminated between age groups (< 75 yrs vs 75+) on physical functioning, vitality
and change in health subscales (p 0.006) & between groups based on setting (general practice vs. hospital outpatients) on the physical function and role functioning – physical subscales (p=0.16) (Hayes et al. 1995); Essink-Bot et al. (1997) reported SF-36 able to discriminate between migraine sufferers and controls on all subscales (p<0.01; ROC/AUC = 0.54 – 0.67) and between groups of
migraine sufferers based on absence from work (0 vs. 0.5 days; p<0.01, ROC/AUC = 0.61 – 0.79); Brazier et al. (1996) reported SF-36 scores distinguished groups based on recent visits to GP, hospital inpatient stays & longstanding illness (p<0.05); at 3 months and 1 year post-injury, mild TBI patients scored significantly lower than the matched normative group on all subscales and there was a significant negative correlation between number of post-concussion symptoms and SF-36 scores (Emanuelson et al. 2003); there were significant differences in scores between the control/nondisabled group, mild TBI group, and moderate/severe TBI – both TBI groups scored significantly lower than the control group on all scales and the mild TBI group scored significantly lower than the moderate/severe group on all scales except for the physical function subscore, which did not differ between TBI severity levels – after controlling for depression, many of the differences between the 2 TBI groups became insignificant (Findler et al. 2001); the self-ratings of matched-normal controls were found to be significantly higher than those of TBI patients on all scales except for the general health scale – the PCS and MCS also differed significantly between controls and TBI patients (Paniak et al. 1999) Construct validity (convergent/divergent): Correlations of –0.41(social functioning vs. social isolation) to –0.68 (vitality vs. energy) between similar scales on the SF-36 and the Nottingham Health Profile were reported. Correlations between dimensions less clearly related ranged from –0.18 (physical functioning vs. emotional reaction) to –0.53 (social functioning vs. emotional reactions) (Brazier et al. 1992); Anderson et al. (1996) reported BI scores (in stroke survivors) strongly associated (p<0.001) with physical functioning & general health -Mental health on the GHQ28 most strongly associated (p<0.001) with the social functioning, role limitations – emotional and mental health scales of the SF-36; Dorman et al. (1999) reported SF-36 physical functioning subscale correlated most closely with mobility, self-care and activities domains of EuroQol (r=0.57, 0.65 & 0.63) and less strongly with the EuroQol psychological domain (0.34) – SF-36 bodily pain correlated with EuroQol pain domain (r=0.66) and moderately with all EuroQol domains – role functioning, emotional correlated most closely with EuroQol psychological domain (r= 0.43) and least with EuroQol self care (r=0.24)- SF-36 mental health was not closely related to the psychological domain (r=0.21) or to physical EuroQol domains (r=0.06 – 0.10). – SF-36 general health correlated with EuroQol overall HRQOL rating) r=0.66; Lai et al. (2003) reported r=0.55 between SF-36 physical functioning scale and BI; Andresen et al. (1999) reported physical health scores correlated more strongly with ADL scores than with GDS (-0.38 vs. –0.28) and mental health summary scores correlated more strongly with GDS scores than ADL scores (-0.63 vs. 0.01) – however, role- physical correlated more strongly

Evidence-Based Review of Moderate to Severe Acquired Brain Injury 2013
58 Module 17-Assessment of Outcomes Following Acquired/Traumatic Brain Injury-V9-2013 www.abiebr.com Updated August 2013
with GDS scores than ADL scores, contrary to a prior hypothesis – social functioning, role-emotional, vitality and mental health all correlated more strongly with GDS scores than ADL scores; Dikmen et al. (2001) found significant correlations between the PCS and the Functional Status Examination (FSE) regardless of whether the patient (-0.68) or a significant other (-0.64) assessed patient function – the correlations between the MCS and the FSE were weak and nonsignificant; McNaughton et al. (2005) reported high correlations (0.32-0.97) across the PCS, FIM, Barthel Index and the London Handicap Score – correlations of these measures with the MCS were less strong (0.17-0.32) Predictive validity: McHorney (1996) examined data from Medical Outcomes Study – reported general health perceptions scale to be most predictive of death (death rate of patients in lowest quartile for SF-36 general health scale was 3 times greater than for patients with SF-36 scores in the highest quartile), followed by scores in physical functioning. Baseline physical functioning, role functioning-physical and pain scales were most predictive of hospitalizations and pain, general health and vitality were most predictive of physician visits.
Responsiveness Via item mapping -- social functioning subscale limited assessment of number & difficulty of activities – demonstrated marked ceiling effects – up to 60% for MRS grade 0) SF36 physical function scale reported to have floor effects of 37% & 100% for patients with MRS grades 4 & 5 (Lai et al. 2003); Large ceiling effects reported for the role limitations – physical (53%), bodily pain (43%), social functioning (67%) and role limitations – emotional scales (72%) – no floor effects over 7% were reported -- scores for SF-36 physical functioning scale more uniformly distributed than BI scores suggesting lower floor & ceiling effects than the BI. (Anderson et al. 1996); Brazier et al. (1996) reported floor effects in excess of 25% for role limitations physical and emotional and ceiling effects >25% for social functioning and role limitations emotional & physical. Notable floor effects (role limitations – physical 59.1%; role limitations – emotional 19.9%) and ceiling effects (role limitations – emotional 63.1%; social functioning 29.9%; bodily pain 25.6%) reported among ischemic stroke survivors (Hobart et al. 2002); Substantial floor and ceiling effects reported by O’Mahoney et al. (1998); For face-to-face, telephone and self-administration, Weinberger et al. (1996) reported substantial floor effects for role-physical (> 40%) and role –emotional (>25%) subscales & ceiling effects for role-emotional (>36%) and social functioning subscales (>27% - for face-to-face and self administration only); Walters et al. (2001) reported substantial floor (30.9 – 61%) & ceiling effects across all age groupings (65-69, 70–74, 75-79, 80 – 84 & 85+) in the role functioning physical (30.9% – 61% & 11.7% – 38.6%) and role functioning – emotional (25.6% - 50.4% & 32.2% - 53.2%) as well as substantial ceiling effects in social functioning and bodily pain (15% – 46.7% & 14.1% - 21.1%, respectively); Andresen et al. (1999) reported substantial floor effects of 26.8% and 29.5% for physical functioning and role-physical, respectively, in a sample of nursing home residents as well as ceiling effects of 36.1%, 49.5% and 21.6% in social functioning, role-emotional, and bodily pain respectively. Mossberg & McFarland (2001) found SF36 effect sizes (admission to outpatient rehabilitation to discharge) = 0.48 (role limitations – emotional) to 1.38 (bodily pain) - PCS (physical component) & MCS (mental component) effect sizes = 0.80 and 0.45 respectively. Effect sizes for the PCS and MCS were 2.48 and 0.93 respectively (Paniak et al.
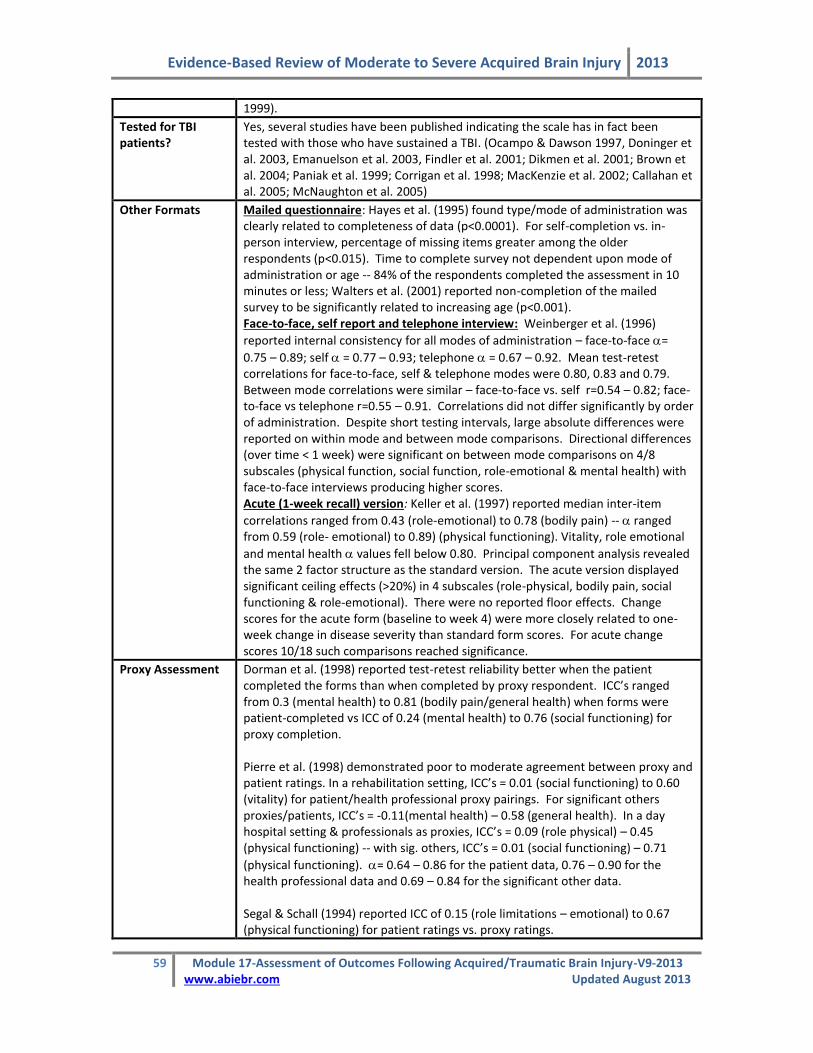
Evidence-Based Review of Moderate to Severe Acquired Brain Injury 2013
59 Module 17-Assessment of Outcomes Following Acquired/Traumatic Brain Injury-V9-2013 www.abiebr.com Updated August 2013
1999).
Tested for TBI patients?
Yes, several studies have been published indicating the scale has in fact been tested with those who have sustained a TBI. (Ocampo & Dawson 1997, Doninger et al. 2003, Emanuelson et al. 2003, Findler et al. 2001; Dikmen et al. 2001; Brown et al. 2004; Paniak et al. 1999; Corrigan et al. 1998; MacKenzie et al. 2002; Callahan et al. 2005; McNaughton et al. 2005)
Other Formats Mailed questionnaire: Hayes et al. (1995) found type/mode of administration was clearly related to completeness of data (p<0.0001). For self-completion vs. in-person interview, percentage of missing items greater among the older respondents (p<0.015). Time to complete survey not dependent upon mode of administration or age -- 84% of the respondents completed the assessment in 10 minutes or less; Walters et al. (2001) reported non-completion of the mailed survey to be significantly related to increasing age (p<0.001). Face-to-face, self report and telephone interview: Weinberger et al. (1996)
reported internal consistency for all modes of administration – face-to-face =
0.75 – 0.89; self = 0.77 – 0.93; telephone = 0.67 – 0.92. Mean test-retest correlations for face-to-face, self & telephone modes were 0.80, 0.83 and 0.79. Between mode correlations were similar – face-to-face vs. self r=0.54 – 0.82; face-to-face vs telephone r=0.55 – 0.91. Correlations did not differ significantly by order of administration. Despite short testing intervals, large absolute differences were reported on within mode and between mode comparisons. Directional differences (over time < 1 week) were significant on between mode comparisons on 4/8 subscales (physical function, social function, role-emotional & mental health) with face-to-face interviews producing higher scores. Acute (1-week recall) version: Keller et al. (1997) reported median inter-item
correlations ranged from 0.43 (role-emotional) to 0.78 (bodily pain) -- ranged from 0.59 (role- emotional) to 0.89) (physical functioning). Vitality, role emotional
and mental health values fell below 0.80. Principal component analysis revealed the same 2 factor structure as the standard version. The acute version displayed significant ceiling effects (>20%) in 4 subscales (role-physical, bodily pain, social functioning & role-emotional). There were no reported floor effects. Change scores for the acute form (baseline to week 4) were more closely related to one-week change in disease severity than standard form scores. For acute change scores 10/18 such comparisons reached significance.
Proxy Assessment Dorman et al. (1998) reported test-retest reliability better when the patient completed the forms than when completed by proxy respondent. ICC’s ranged from 0.3 (mental health) to 0.81 (bodily pain/general health) when forms were patient-completed vs ICC of 0.24 (mental health) to 0.76 (social functioning) for proxy completion. Pierre et al. (1998) demonstrated poor to moderate agreement between proxy and patient ratings. In a rehabilitation setting, ICC’s = 0.01 (social functioning) to 0.60 (vitality) for patient/health professional proxy pairings. For significant others proxies/patients, ICC’s = -0.11(mental health) – 0.58 (general health). In a day hospital setting & professionals as proxies, ICC’s = 0.09 (role physical) – 0.45 (physical functioning) -- with sig. others, ICC’s = 0.01 (social functioning) – 0.71
(physical functioning). = 0.64 – 0.86 for the patient data, 0.76 – 0.90 for the health professional data and 0.69 – 0.84 for the significant other data. Segal & Schall (1994) reported ICC of 0.15 (role limitations – emotional) to 0.67 (physical functioning) for patient ratings vs. proxy ratings.

Evidence-Based Review of Moderate to Severe Acquired Brain Injury 2013
60 Module 17-Assessment of Outcomes Following Acquired/Traumatic Brain Injury-V9-2013 www.abiebr.com Updated August 2013
Ocampo and Dawson (1997) found the highest level of agreement between TBI patients and their informants was for physical functioning (ICC=0.58) and general health (ICC=0.51); agreement for role-physical and role-emotional were high for the moderate and severe groups; agreement was generally poor on the other subscales. Dikmen et al. (2001) reported a correlation of 0.53 (p<0.001) between the assessments of patients and their significant other on the PCS, but this correlation on the MCS was weak and non-significant.
Advantages. The SF-36 is simple to administer. Either of the forms, the self-completed or the interview form, takes less than 10 minutes to complete (Hayes 1995). As a self-completed, mailed questionnaire, it has been shown to have reasonably high response rates: 83% has been reported by Brazier et al. 1992 and O’Mahoney et al. 1998; 75% - 83% reported by Dorman et al. 1998; in 1999 Dorman and colleagues reported a response rate of 85% and in 2001 and Walters et al. (2001) reported 82% overall & 69% for those over age 85.
Callahan et al. (2005) found that the SF-36 was appropriate for longitudinal serial assessment of recovery in a mixed group of patients suffering from one of cerebrovascular accident, traumatic brain injury, or spinal cord dysfunction. The instrument has been shown to be valid and reliable in the adult TBI population and appears to be sensitive to the wide spectrum of health issues faced by this group (Emanuelson et al. 2003; Findler et al. 2001).
Limitations. Higher rates of missing data have been reported among older patients when using a self-completed form of administration (Brazier et al. 1992; Hayes et al. 1995; Brazier et al. 1996). O’Mahoney et al. (1998) found item completion rates to range from 66% to 96%. At the scale level, complete data collection (amount required to compute a scale score) ranged from 67% (role limitations – emotional) to 97% (social functioning). Walters et al. (2001) reported scale completion rates among community dwelling older adults ranging from 86.4% to 97.7% with all eight scales being calculable for 72% of respondents. Dorman et al. (1999) reported proportion of missing data on the scale level ranging from 2% (social functioning) to 16% (role functioning – emotional). Given the lack of data completeness found, postal administration of the SF-36 may not be appropriate for use among older adults. However, low completion rates may not be limited to self-completion or postal administration. Andresen et al (1999) administered the SF-36 to nursing home residents by face-to-face interview and reported that only 1 in 5 residents were able to complete it. It has been suggested that data completeness may be indicative of respondent acceptance and understanding of the survey as relevant to them (O’Mahoney et al. 1998; Andresen et al. 1999). Hayes et al. (1995) noted that the most common items missing on the self-completed questionnaire referred to work or to vigorous activity.

Evidence-Based Review of Moderate to Severe Acquired Brain Injury 2013
61 Module 17-Assessment of Outcomes Following Acquired/Traumatic Brain Injury-V9-2013 www.abiebr.com Updated August 2013
Older respondents identified these questions as pertinent for much younger people and not relevant to their own situation. The authors suggested modifications to some of the questions, which may increase acceptability to older populations. In a qualitative assessment of the physical functioning and general health perceptions dimensions of the SF-36, Mallinson (2002) noted that the participants, who were all over the age of 65, tended to display signs of disengagement from the interview process and some participants expressed concern relating to the relevance of the questions. There was also considerable variation noted in subjective interpretation of items and most subjects used qualifying, contextual information to clarify their responses to the interviewer. As Mallinson pointed out, individual issues of subjective meaning and context are lost when the questionnaire is scored. The SF-36 does not lend itself to the generation of an overall summary score. In scales using summed Likert scales, information contained within individual responses is lost in the total scale score (ie. any given total score can be achieved in a variety of ways from individual item responses) (Dorman et al. 1999). Hobart et al. (2002) examined the use of the 2-dimensional model, which consists of a mental health component (MCS) and physical health component (PCS). These two scales can account for only 60% of the variance in SF-36 scores suggesting a significant loss of information when the 2-component model is used. It has been suggested that the SF-36 may be more sensitive to the health difficulties of mild TBI than of moderate/severe TBI patients as it was unable to differentiate between the severity levels (Emanuelson et al. 2003). One study found initial differences between these groups, however once depression was controlled for these differences were less visible, suggesting that depression may account for the differences between TBI groups on the SF-36 (Findler et al. 2001). MacKenzie et al. (2002) suggest that adding a cognitive component to the SF-36 would make the instrument a more useful outcome measure in a head trauma population, as the tool is likely to underestimate the extent of disability in this group. The level of test re-test reliability reported in stroke populations indicate that the SF-36 may not be adequate for serial comparisons of individual patients, but rather should be used for large group comparisons only (Dorman et al. 1998). Weinberger et al. (1996) also questioned the usefulness of the SF-36 in serial evaluation of individuals given large reported absolute differences in SF-36 scores obtained via common modes of administration (face-to-face interview, self administration and telephone interview) over short testing intervals. Dikmen et al. (2001) emphasized that the SF-36 was designed to be self-administered, thus its disadvantage is the inability to use the SF-36 to assess patients who are too impaired to complete the questionnaire on their own. While the use of a proxy may be the only means by which to include data from more severely affected TBI patients,

Evidence-Based Review of Moderate to Severe Acquired Brain Injury 2013
62 Module 17-Assessment of Outcomes Following Acquired/Traumatic Brain Injury-V9-2013 www.abiebr.com Updated August 2013
reported disagreement between patient and proxy assessments has been considerable. In an adolescent TBI population, moderate rates of agreement were reported between proxy and patient respondent ratings for items related to physical health; however, on more subjective items, agreement was very low (Ocampo & Dawson 1997). It has been suggested that clinicians do not substitute proxy data for patient responses due to the subjective nature of many SF-36 items (Ocampo & Dawson 1997). Summary – MOS-SF36 Interpretability: Use of scale scores and summary component scores represents a loss of information and decreases potential clinical interpretability. Standardized norms for several countries are available for the SF-36. Acceptability: Completion times are approximately 10 minutes for either self-completed or interview administered questionnaires. Some items have been questioned for their relevance to elderly populations. The SF-36 has been studied for use by proxy, however, agreement rates are low and reliability of the test decreased when proxy respondents completed assessments. Feasibility: The SF-36 questionnaire can be administered by self-completion questionnaire or by interview (either on the telephone or in-person). It has been used as a mail survey with reasonably high completion rates reported, however, data obtained are more complete when interview administration is used. Permission to use the instrument and additional information regarding its administration and scoring should be obtained from the Medical Outcomes Trust.
Table 17.37 SF-36 Evaluation Summary
Reliability Validity Responsiveness
Rigor Results Rigor Results Rigor Results Floor/ceiling
+++
++ (TR) ++ (IC)
+++ +++ ++ +++ +
NOTE: +++=Excellent; ++=Adequate; +=Poor; n/a = insufficient information; TR=Test re-test; IC= internal consistency; IO = Interobserver; varied (re. floor/ceiling effects; mixed results)
17.16 Mini Mental Status Examination (MMSE) The Mini-Mental State Examination was developed as a brief screening tool to provide a quantitative assessment of cognitive impairment and to record cognitive changes over time (Folstein et al. 1975). While the tool’s original application was the detection of dementia within a psychiatric setting, its use has become widespread. The MMSE consists of 11 simple questions or tasks. Typically, these are grouped into 7 cognitive domains; orientation to time, orientation to place, registration of three words, attention and calculation, recall of 3 words, language, and visual construction. Administration by a trained interviewer takes approximately 10 minutes. The test yields a total score of 30 and provides a picture of the subjects present cognitive performance based on direct observation of completion of test items/tasks. A score of 23/24 is the

Evidence-Based Review of Moderate to Severe Acquired Brain Injury 2013
63 Module 17-Assessment of Outcomes Following Acquired/Traumatic Brain Injury-V9-2013 www.abiebr.com Updated August 2013
generally accepted cutoff point indicating the presence of cognitive impairment (Dick et al. 1984). Levels of impairment have also been classified as none (24-30); mild (18-24) and severe (0-17) (Tombaugh & McIntyre 1992). An expanded version of the MMSE, the modified mini-mental state examination (3MS) was developed by Teng & Chui (1987) increasing the content, number and difficulty of items included in the assessment. The score of the 3MS ranges from 0 – 100 with a standardized cut-off point of 79/80 for the presence of cognitive impairment. This expanded assessment takes approximately 5 minutes more to administer than the original MMSE. Table 17.38 Characteristics of the Mini Mental State Examination
Reliability In an extensive review, Tombaugh & McIntyre (1992) reported moderate to high test-retest reliability citing correlations of 0.38 to 0.99 in studies having a retest interval of < 2 months (24/30 studies r >0.75). Interobserver reliability: Molloy and Standish (1997) reported an ICC of 0.69 for the traditional MMSE; Dick et al. (1984) K = 0.63; concordance correlation coefficient = 0.87 between evaluations performed by GPs & those performed by psychologists (Fabrigoule et al. 2003)
Internal consistency: Cronbach’s coefficient of 0.54 – 0.96 have been reported by Tombaugh & McIntyre (1992)
Validity Concurrent Validity: Tombaugh & McIntyre (1992) reported correlations of 0.70 to 0.90 between MMSE scores and other measures of cognitive impairment Construct validity - correlations between ADL scores and the MMSE of 0.40 – 0.75. (Tombaugh & McIntyre, 1992) support importance of cognitive status to functional outcome. Grace et al. (1995) reported significant association between FIM scores and MMSE scores (p<0.05); Agrell & Dehlin (2000) reported significant correlations between MMSE scores and BI, MADRS and Zung Depression Scale (p<0.05); demonstrated expected lower MMSE scores, stroke patients vs. controls (p<0.001) – factor analysis revealed 3 factors explaining 53% variance; the MMSE showed strong correlations with the WAIS – verbal (r=0.78) and performance- IQ (r=0.66) scores (Folstein et al. 1975); Dick et al (1984) reported r=0.55 and r=0.56 for verbal & performance IQ, respectively. Construct validity (known groups): MMSE scores could discriminate between groups based on categories of vocational recommendations (return to work, vocational training, supported work and continued remedial therapy; p<0.0001), MMSE scores accounted for 36% variance between cell means (Mysiw et al. 1989); DePaolo and Folstein (1978) reported the MMSE able to distinguish between patients with cerebral abnormalities and those with peripheral disorders only (p<0.0005) Predictive validity:. Ozdemir et al. (2001) reported relationships between baseline MMSE scores & change in motor-FIM from admission to discharge among stroke rehabilitation patients (r=0.31; p<0.04), suggesting MMSE baseline scores are somewhat predictive of functional improvement. Sensitivity & Specificity: Tombaugh & McIntyre (1992) reported an average sensitivity of 75% among dementia patients. Among general neurology and psychiatry patients, sensitivity was lower; ranging from 21 – 76%. - major variable

Evidence-Based Review of Moderate to Severe Acquired Brain Injury 2013
64 Module 17-Assessment of Outcomes Following Acquired/Traumatic Brain Injury-V9-2013 www.abiebr.com Updated August 2013
in sensitivity was level of impairment; sensitivity of the MMSE increased with level of impairment. Low level of sensitivity is supported (Dick et al. 1984 – not sensitive to changes in patients with right-sided disease – not useful in discriminating focal vs. diffuse disease) particularly among stroke patients (Grace et al. 1995 – sensitivity 44%, area under curve = 0.7097; Agrell & Dehlin, 2000 – 56%). Agrell & Dehlin (2000) reported MMSE could discriminate between patients with left-sided and infratentorial lesions (p<0.05) though not between right-sided and left-sided lesion groups. Tombaugh & McIntyre (1992) reported specificity of 62% - 100%; 80% (Agrell & Dehlin, 2000); 84% (Grace et al. 1995). Blake et al., 2002 reported sensitivity = 62% and specificity = 88% in group of stroke patients no suitable cut-off point could be identified if MMSE is used as a screening measure for verbal or visual memory deficits
Responsiveness N/a
Tested for ABI patients?
Mysiw et al. (1989) reported that the MMSE was able to distinguish between TBI patients classified by vocational recommendations. Keith et al. (1998) have used the MMSE as the tool against which the Cognitive Drug Research system was validated for use among brain injured patients, however, the MMSE itself has not, apparently, undergone a similar evaluation in this specific population.
Other Formats Modified Mini-mental State Examination (3MS): Grace et al. (1995) compared the MMSE directly to 3MS. The test-retest stability of the 3MS was reported as r=0.80; p<0.001). Concurrent/Construct Validity - the 3MS correlated strongly with the MMSE at admission and discharge (r=0.84 & 0.85, respectively; p<0.001); correlated with a battery of neuropsychological assessments (COWA, BNT, HVOT, LM, VR – immediate and delayed, WMS-R, LM immediate & delayed); association with functional outcome (FIM) -- stronger for the 3MS than for the MMSE (t=3.28; p<0.05). Using the standardized cut-off points for cognitive impairment & ROC analysis, the 3MS showed greater sensitivity than the MMSE (69% vs. 44%) and similar specificity (80% vs. 79%) – area under the curve – 0.7977 for 3MS. 3MS + Clock-drawing: To increase 3MS sensitivity among patients with right hemisphere stroke, Suhr & Grace (1999) advocate the addition of the Wilson clock-drawing test. A clock-drawing task added < 2 min. to administration; increased sensitivity among stroke patients with right hemisphere lesions (87%). This testing format maintained a strong association with FIM scores (p<0.005). Standardized MMSE (SMMSE): Molloy & Standish(1997) developed detailed instructions for administration and scoring of each item. Test retest variance was reduced by 86% and interobserver variance by 76% when the standardized MMSE was used. (SSMSE - ICC = 0.90; MMSE- ICC = 0.69). Telephone Version – ALFI-MMSE: Includes 22/30 of the original MMSE items, the majority of which were removed from the last section (language and motor skills). Correlations between phone and face-to-face versions = 0.85 (p<0.0001). Patients tended to do slightly better on in-person testing than on the telephone. Sensitivity (using a brief neurological screening test as the criterion) of 67% and specificity of 100% were reported in a population of elderly, community-dwelling individuals. This was similar to the sensitivity/specificity reported for screening with the traditional MMSE (68%; 100%). (Roccaforte et al. 1992) T-MMSE (26 item version of the ALFI-MMSE, Roccaforte et al. cited in Newkirk et al., 2004): T-MMSE correlated with the MMSE (r = 0.88; p<0.001), neither hearing impairment nor years of education were associated with T-MMSE scores. On the

Evidence-Based Review of Moderate to Severe Acquired Brain Injury 2013
65 Module 17-Assessment of Outcomes Following Acquired/Traumatic Brain Injury-V9-2013 www.abiebr.com Updated August 2013
22 points in common between the 2 scales, scores were correlated (r=0.88 p<0.001), however, telephone scores tended to be higher than in-face scores (p<0.01) (Newkirk et al, 2004). The authors provide tables for the conversion of T-MMSE scores to MMSE scores.
Use by Proxy? N/A
Advantages. The Mini-mental State Examination is brief, inexpensive and simple to administer. Its widespread use and accepted cutoff scores increase its interpretability. Limitations. It has been suggested that the MMSE may attempt to assess too many functions in one brief test. An individual’s performance on individual items or within a single domain may be more useful than interpretation of a single score. (Wade 1992;Tombaugh & McIntyre 1992). However, an acceptable cut-off for the identification of the presence of an impairment may be possible only when the test is used as a measure of “cognitive impairment” (Blake et al. 2002). Blake et al. (2002) reported that when the test is used to screen for problems of visual or verbal memory, orientation or attention acceptable cut-off scores could not be identified. MMSE scores have been shown to be affected by age, level of education and sociocultural background (Tombaugh & McIntyre, 1992; Bleeker et al. 1988; Lorentz et al. 2002). These variables may introduce bias leading to the misclassification of individuals. Though perhaps the prevalent view, such biases have not always been reported. For instance, Agrell & Dehlin (2000) found neither age nor education to influence scores. Lorentz et al. (2002) expressed concern that adjustments made for these biases may limit the general utility of the MMSE. Perhaps the greatest limitation of the MMSE is its low reported levels of sensitivity particularly among individuals with mild cognitive impairment (Tombaugh & McIntyre, 1992; de Koning et al. 1998), in patients with focal lesions, particularly those in the right hemisphere (Tombaugh et al. 1992), within a general neurological patient population (Dick et al. 1984) and within a stroke population (Suhr & Grace 1999; Blake et al., 2002). It has been suggested that its low level of sensitivity derives from the emphasis placed on language items and a paucity of visual-spatial items (Tombaugh et al. 1992; Grace et al. 1995; de Koning et al. 1998; Suhr & Grace, 1999; de Koning et al. 2000). Various solutions have been proposed to the problem of the MMSE’s poor sensitivity including the use of age-specific norms (Bleecker et al. 1988) and the addition of a clock-drawing task to the test (Suhr & Grace, 1999). Clock-drawing tests themselves have been assessed as acceptable to patients, easily scored and less affected by education, age and other non-dementia variables than other very brief measures of cognitive impairment (Lorentz et al. 2002) and would have little effect on the simplicity and accessibility of the test. The MMSE has been thoroughly evaluated for use among a variety of neurological populations. Unfortunately, at present, information regarding the reliability and validity of the MMSE when used among patients with TBI/ABI is extremely limited.

Evidence-Based Review of Moderate to Severe Acquired Brain Injury 2013
66 Module 17-Assessment of Outcomes Following Acquired/Traumatic Brain Injury-V9-2013 www.abiebr.com Updated August 2013
Summary – MMSE Interpretability: The MMSE is widely used and has generally accepted cut-offs scores indicative of the presence of cognitive impairment. Documented age and education effects have led to the development of stratified norms (Ruchinskas & Curyto 2003). Acceptability: The test is brief requiring approximately 10 minutes to complete. It may be affected by such patient variables as age, level of education and sociocultural background. As it is administered via direct observation of task completion, it is not suitable for use with a proxy respondent. Feasibility: The test requires no specialized equipment and little time, making it inexpensive and portable. A survey conducted by Lorentz et al. (2002) revealed participant physicians found the MMSE too lengthy and unable to contribute much useful information. Table 17.39 MMSE Evaluation Summary
Reliability Validity Responsiveness
Rigor Results Rigor Results Rigor Results Floor/ceiling
+++
+++ (TR) ++ (IO) ++ (IC)
+++ ++ N/A N/A N/A
NOTE: +++=Excellent; ++=Adequate; +=Poor; N/A = insufficient information; TR=Test re-test; IC= internal consistency; IO = Interobserver; varied (re. floor/ceiling effects; mixed results)
17.17 Neurobehavioral Functioning Inventory (NFI) The Neurobehavioral Functioning Inventory (NFI) was originally developed as part of the General Health and History Questionnaire, which was used to collect a variety of information on individuals who had experienced a traumatic brain injury (Kreutzer et al. 1987). The NFI is intended to assess a wide spectrum of behaviours and symptoms encountered in everyday life in order to evaluate the neurological, behavioural and psychological effects of head injury (Kreutzer et al. 1996, Weinfurt et al. 1999, Seel et al. 1997). The NFI consists of 70 items representing behaviours or symptoms. These are grouped into 6 functional domains or subscales derived from principal components and factor analytic methodologies (Seel et al. 1997, Hart et al. 2003). The 6 domains are depression (13 items), somatic (11 items), memory/attention (19 items), communication (10 items), aggression (9 items) and motor (8 items)(Kreutzer et al. 1996, Hart et al. 2003). Six additional, critical items relating to patient safety and community integration have been added to the scale (Kreutzer et al. 1999) to be used in the identification of areas requiring immediate attention (Awad, 2002). Items are rated for frequency of occurrence on a 5-point Likert scale from 1 (never) to 5 (always). While the NFI is a self-rating inventory, it provides for the inclusion of information obtained from suitable proxy sources. The test contains forms for ratings by

Evidence-Based Review of Moderate to Severe Acquired Brain Injury 2013
67 Module 17-Assessment of Outcomes Following Acquired/Traumatic Brain Injury-V9-2013 www.abiebr.com Updated August 2013
self and by a significant other. The test takes approximately 20 minutes to complete (Awad 2002) The NFI is a proprietary scale that must be purchased from The Psychological Corporation (Harcourt Assessment, Inc.).
Table 17.40 Characteristics of the Neurobehavioral Functioning Inventory
Reliability
Internal consistency: values for each scale were reported to be 0.93 (depression), 0.86 (somatic), 0.95 (memory/attention), 0.88 (communication),
0.89 (aggression), and 0.87 (motor impairment) – for the entire scale, - 0.97
(Kreutzer et al. 1996); Awad (2002) reported coefficients for each NFI subscale – depression = 0.93, somatic = 0.83, memory/attention = 0.95, communication = 0.88, aggression = 0.87 and motor = 0.88
Validity Construct validity: - factorial analysis of the original 105 scale items revealed a 70-item, 6 factor model with a comparative fit index of 0.89 that was superior to other models tested - intercorrelations between total subscale scores ranged from 0.44 to 0.67; Awad (2002) reported a Goodness-of-Fit index of 0.71 and Comparative Fit Index of 0.71 for the six factor, 70-item NFI – in general, fit indices for each subscale were higher than for the total scale -- 20 items had squared multiple correlations < 0.40 (1-depression, 9-somatic, 4-memory, 3-communication, 2-aggression and 1-motor item) – intercorrelations between subscales ranged from 0.56 – 0.58 and were all significant (p<0.001), suggesting that the NFI may be measuring a single, large underlying construct. Construct validity (known groups): - scores on depression (p<0.002), memory/attention (p<0.002), communication (p<0.001), aggression (p<0.002) and motor (p<0.002) subscales could distinguish between groups based on employed vs. unemployed persons who had sustained traumatic brain injury (Sander et al. 1997); comparison of subscale scores for individuals with TBI vs. non-clinical controls via ANCOVA revealed no significant differences between groups on the depression, memory/attention, communication and motors subscales when controlling for the effects of age and sex – the only significant differences appeared on the somatic subscale (p<0.01) on which non-clinical controls achieved higher scores than the TBI group (Awad, 2002) Concurrent validity: Scores on NFI subscales were correlated with the following scales from the MMPI – hypochondriasis, depression, hysteria, psychasthenia, schizophrenia. Correlations between NFI subscales and MMPI scales were all significant (p<0.001) – correlations between MMPI hypochondriasis and NFI subscales ranged from 0.24 (aggression) and 0.65 (somatic), for MMPI depression correlations ranged from 0.21 (aggression) and 0.47 (depression, motor and somatic), for MMPI hysteria from 0.25 (communication) to 0.50 (somatic), for MMPI psychasthenia from 0.26 (communication) to 0.43 (depression) and for MMP schizophrenia from 0.25(aggression) to 0.40 (depression) (Kreutzer et al. 1996) NFI Communication subscale correlated significantly with scores on neuropsychological measures of attention, memory and learning, communication and visual and motor functioning (p<0.001) – no other subscale correlated significantly with any of the neuropsychological tests administered with the exception of Memory/Attention which correlated with scores on the Symbol Digits Modalities Test Oral (Kreutzer et al. 1996). NFI Memory/attention correlated significantly with WMS-Logical Memory raw

Evidence-Based Review of Moderate to Severe Acquired Brain Injury 2013
68 Module 17-Assessment of Outcomes Following Acquired/Traumatic Brain Injury-V9-2013 www.abiebr.com Updated August 2013
scores (r=-0.26, p<0.001) and with the WMS-R Logical Memory recall scores (r=-0.26, p<0.001), NFI motor scores correlated with Trailmaking tests A (r=0.27, p<0.001) and B (r=0.25, p<0.001) and Grooved Pegboard scores (r=-0.28, p<0.001), NFI communication correlated with Controlled Word Association Test adjusted scores (r=-0.18, p<0.001) (Awad, 2002)
Responsiveness N/A
Tested for ABI/TBI patients?
Head injury specific.
Other Formats NFI-66 – developed by Kreutzer & Devany (unpublished). Weinfurt et al. (1999) performed factor analysis revealing 4 components with eigenvalues > 2.0; cognitive deficits, depression, aggression and somatization. Internal reliability of the 4 scale NFI-66 ranged from 0.79 (aggression) to 0.92 (cognitive deficits and depression). Significant correlations were reported between NFI-66 scale scores and the GOS ranging from 0.21 (depression) – 0.26 (somatization). Aggression subscale scores did not correlate with GOS scores. Scores on the Euroqol VAS were significantly and inversely correlated with NFI subscale scores ranging from 0.17 (aggression) to 0.50 (depression) NFI-D (13-item Depression subscale of the NFI); Seel & Kreutzer (2003) reported
high internal consistency (=0.93). Convergent and discriminant validity was supported as scores on the NFI-D correlated with both Beck Depression Inventory scores (r=0.765) and MMPI-2 Depression scale T-scores (r=0.752) but not significantly with MMPI-2 hypomania scale scores (r=0.159). Normal and clinically depressed BDI scores were accurately predicted by NFI-D scores 81% & 87% of the time, respectively. Patients who were classified with mild or borderline depression on the BDI were less likely to be correctly classified as such by the NFI-D. Using the MMPI-2 Depression score classifications – normal vs. depressed classifications could be accurately predicted by NFI-D scores 75% & 83% of the time, respectively. Via mapping to the BDI, the following score
ranges were proposed for the identification and classification of depression:
28 (minimal depression), 43 (clinical depression – moderate to severe), 29 – 42 (mood disturbance, however, classification in this borderline region contained many false positives and false negatives).
Use by proxy? Test contains forms for ratings by self and by significant other (proxy) . Correlations between self and SO ratings were moderate for communication and memory/attention and weaker/nonsignificant for motor, depression, somatic and aggression scales. Self ratings were significantly higher than SO ratings form somatic, memory/attention and communication scales (Rush et al. 2004) Concordance coefficients (between patient and significant other) ranged from 0.63 (aggression) to 0.76 (somatic). Significant others rated symptoms in the aggression scale as being significantly more frequent than the patients. There was a trend identified for ratings of symptoms on the depression subscale to differ in the same manner. Such discrepancies were noted more for cognitive or behavioural symptoms not for physical or somatic ones (Hart et al. 2003). Seel et al. (1997) reported agreement between family and patient ratings ranged from 48% to 84% and, for the most part, family members and patients tend to rate problems as occurring at the same frequency. On an item by item analysis, there were no statistical differences for ratings on 57 of 70 items. On

Evidence-Based Review of Moderate to Severe Acquired Brain Injury 2013
69 Module 17-Assessment of Outcomes Following Acquired/Traumatic Brain Injury-V9-2013 www.abiebr.com Updated August 2013
the 13 statistically different items, patients rated problems as more frequent than family members. The only scale score that demonstrated statistically different ratings (family vs. patient) was the communication scale (p<0.01).
Advantages. The reliability of information obtained by self-report from individuals with TBI may be compromised by impaired self-awareness. Incorporating information gathered from collateral sources may compensate for this problem (Hart et al. 2003). The NFI provides for the collection of information from collateral sources allowing for a more comprehensive picture of both the difficulties experienced by the patient and the impact of problems on the home environment (Witol et al.1999). Limitations. Awad (2002) was unable to establish construct validity for the NFI. The author cited poor fit indices, a large number of items with poor/weak relation to their latent construct (20 items with squared multiple correlations <0.40), strong correlations between subscales and an inability to distinguish a group of individuals with TBI from non-clinical controls as the basis for this assertion. It is suggested that the NFI may be measuring aspects of a single large construct rather than six discrete constructs. Weingert et al. (1999) reported very low endorsement rates for many of the items resulting in skewed distributions. Low rates of endorsement might indicate that these items are not meaningful discriminators for the head injury population. While the authors do provide data for comparison, it is not truly normative. The data set used for standardization was derived from a population of individuals with TBI. There is no normative data available based on non-clinical populations (Awad, 2002, Witol et al. 1999). Although the NFI is widely used, there is relatively little information available in the literature with regard to its reliability, validity and responsiveness. The information that is available pertains to older versions of the NFI and, at present, there are no validity or reliability data available for the 76-item version (Awad, 2002) Summary – NFI Interpretability: Comparative data are provided in the manual stratified by patient age and injury severity. The NFI has been translated into Spanish, German and French. Acceptability: The NFI is a lengthy self-report inventory requiring approximately 20 minutes to complete. Forms are provided for assessment by self or by proxy. Feasibility: The NFI is a proprietary scale and must be purchased.
Table 17.41 NFI Evaluation Summary
Reliability Validity Responsiveness
Rigor Results Rigor Results Rigor Results Floor/ceiling

Evidence-Based Review of Moderate to Severe Acquired Brain Injury 2013
70 Module 17-Assessment of Outcomes Following Acquired/Traumatic Brain Injury-V9-2013 www.abiebr.com Updated August 2013
+
+++ (IC) + + N/A N/A N/A
NOTE: +++=Excellent; ++=Adequate; +=Poor; N/A = insufficient information; TR=Test re-test; IC= internal consistency; IO = Interobserver.
17.18 Rancho Los Amigos Levels of Cognitive Functioning Scale (LCFS) The Rancho Los Amigos Levels of Cognitive Functioning Scale (LCFS) was intended to provide a description of 8 stages of cognitive function through which brain injured patients typically progress during their stay in hospital and acute rehabilitative care (Hagen et al., 1972, Hagen 1982). It was not developed as a scale and is not considered to be an outcome measure. Rather, it is a global index used to describe awareness, environmental interaction and behavioural competence (Timmons et al. 1987, Zafonte et al. 1996). It is used to monitor recovery and classify outcome in patients with brain injury (Gouvier et al. 1987). LCFS rating forms for the original 8-level LCFS are available for download from http://tbims.org/combi. Detailed item descriptions are also available from the website. Table 17.43 Characteristics of the Rancho Los Amigos Scale
Reliability
Test-retest: r=0.82 (Gouvier et al. 1987) Interobserver reliability: average r=0.89 (Gouvier et al. 1987); r=0.84, overall
reliability index = 0.91, =0.31 (Beauchamp et al., 2001)
Validity Concurrent validity: -LCFS ratings correlated with Stover & Zeiger ratings at admission (r=0.92) and discharge from rehabilitation (r=0.73), discharge LCFS ratings also correlated significantly with discharge Glasgow Outcome Scale (GOS) scores (0.76) and expanded GOS scores (0.79) (Gouvier et al. 1987); LCFS ratings and scores on the functional cognition index (FCI) correlated at admission (r=0.79) and discharge (r=0.77) from inpatient rehabilitation (Labi et al. 1998); GCS and LCFS ratings significantly correlated (r=0.329; p<0.05; Hall et al. 1993) Construct validity (known groups): LCFS ratings could discriminate between groups based on categories of vocational recommendations (return to work, vocational training, supported work and continued remedial therapy; p<0.0001), LCFS ratings accounted for 51% variance between cell means (Mysiw et al. 1989) Predictive validity: -initial LCFS ratings correlated with Stover & Zeiger ratings (0.65), GOS (r=0.57) and E-GOS (0.73) scores collected at the time of discharge from rehabilitation (Gouvier et al., 1987); LCFS at admission to and discharge from rehabilitation as well as LCFS change scores were significantly associated with
Table 17.42 Rancho Los Amigos Levels of Cognitive Functioning
I No response: Total assistance
II Generalized response: Total assistance
III Localized response: Total assistance
IV Confused-agitated: Maximal assistance
V Confused-inappropriate, non-agitated: Maximal assistance
VI Confused-appropriate: Moderate assistance
VII Automatic-appropriate: Minimal assistance for daily living skills
VIII Purposeful-appropriate: Stand-by assistance
IX Purposeful-appropriate: Stand-by assistance on request
X Purposeful-appropriate: Modified independent
Hagen et al. 1972. Items in italics are included in the revised Rancho Scale (Hagen, 1997)
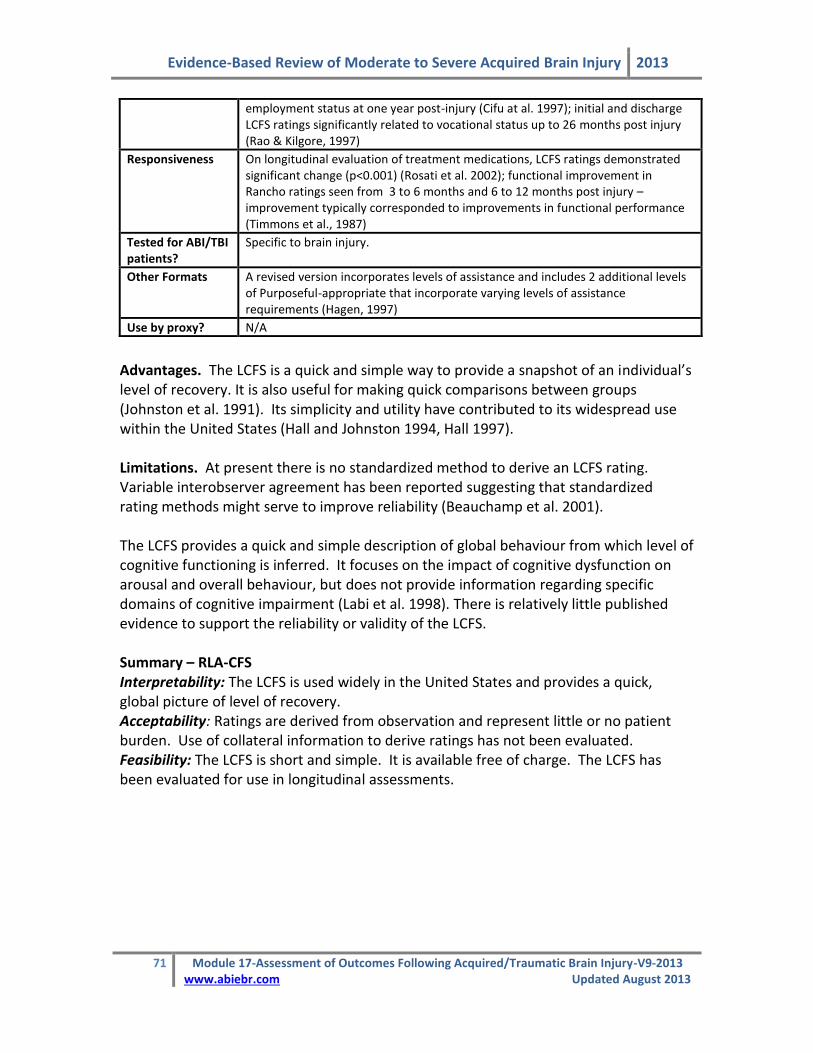
Evidence-Based Review of Moderate to Severe Acquired Brain Injury 2013
71 Module 17-Assessment of Outcomes Following Acquired/Traumatic Brain Injury-V9-2013 www.abiebr.com Updated August 2013
employment status at one year post-injury (Cifu at al. 1997); initial and discharge LCFS ratings significantly related to vocational status up to 26 months post injury (Rao & Kilgore, 1997)
Responsiveness On longitudinal evaluation of treatment medications, LCFS ratings demonstrated significant change (p<0.001) (Rosati et al. 2002); functional improvement in Rancho ratings seen from 3 to 6 months and 6 to 12 months post injury – improvement typically corresponded to improvements in functional performance (Timmons et al., 1987)
Tested for ABI/TBI patients?
Specific to brain injury.
Other Formats A revised version incorporates levels of assistance and includes 2 additional levels of Purposeful-appropriate that incorporate varying levels of assistance requirements (Hagen, 1997)
Use by proxy? N/A
Advantages. The LCFS is a quick and simple way to provide a snapshot of an individual’s level of recovery. It is also useful for making quick comparisons between groups (Johnston et al. 1991). Its simplicity and utility have contributed to its widespread use within the United States (Hall and Johnston 1994, Hall 1997). Limitations. At present there is no standardized method to derive an LCFS rating. Variable interobserver agreement has been reported suggesting that standardized rating methods might serve to improve reliability (Beauchamp et al. 2001). The LCFS provides a quick and simple description of global behaviour from which level of cognitive functioning is inferred. It focuses on the impact of cognitive dysfunction on arousal and overall behaviour, but does not provide information regarding specific domains of cognitive impairment (Labi et al. 1998). There is relatively little published evidence to support the reliability or validity of the LCFS. Summary – RLA-CFS Interpretability: The LCFS is used widely in the United States and provides a quick, global picture of level of recovery. Acceptability: Ratings are derived from observation and represent little or no patient burden. Use of collateral information to derive ratings has not been evaluated. Feasibility: The LCFS is short and simple. It is available free of charge. The LCFS has been evaluated for use in longitudinal assessments.

Evidence-Based Review of Moderate to Severe Acquired Brain Injury 2013
72 Module 17-Assessment of Outcomes Following Acquired/Traumatic Brain Injury-V9-2013 www.abiebr.com Updated August 2013
Table 17.44 LCFS Evaluation Summary
Reliability Validity Responsiveness
Rigor Results Rigor Results Rigor Results Floor/ceiling
+
+++(TR) +++(IO)
+ +++ + + (p-values) N/A
NOTE: +++=Excellent; ++=Adequate; +=Poor; N/A = insufficient information; TR=Test re-test; IC= internal consistency; IO = Interobserver.
17.19 Satisfaction with Life Scale (SWLS) Life satisfaction may be defined as a conscious, cognitive, global judgement of one’s own life. It is not an assessment based on externally imposed objective standards, but rather depends upon a comparison of one’s life circumstances to one’s own internal standards or criteria (Diener et al. 1985, Pavot et al. 1991, Pavot and Diener 1993). The Satisfaction with Life Scale was created to assess a person’s global judgment of life satisfaction (Diener et al. 1985). Diener et al. (1985) generated 48 self-report items related to satisfaction with life, including items assessing positive and negative affect. Factor analyses were used to identify 3 factors; life satisfaction, negative affect and positive affect. All affect items were eliminated as were items with factor loadings of less than 0.60. The remaining 10 items were reduced to 5 on the basis of “semantic similarity” (Diener et al. 1985). Respondents are instructed to rate each item using a 7-point scale ranging from 1 (strongly disagree) to 7 (strongly agree). Item ratings are summed to provide a total score ranging from 5 – 35 where higher scores are indicative of greater life satisfaction. The SWLS takes a global approach to assessment. Because no specific domains are named within the scale and items are not specific in nature, the respondent remains free to consider the life domains or affective components he or she feels make the most important contribution to their subjective experience of happiness (Diener et al. 1985, Pavot and Diener 1993, Arrindell et al. 1999). The scale is short and simple to administer and score. It can easily be added to assessments using multiple measures with no significant increase in time (Pavot et al. 1991).
Table 17.45 Satisfaction with Life Scale* *(Diener et al. 1985)
1. In most ways my life is close to my ideal 2. The conditions of my life are excellent. 3. I am satisfied with my life. 4. So far I have gotten the important things I want in life. 5. If I could live my life over, I would change almost nothing.

Evidence-Based Review of Moderate to Severe Acquired Brain Injury 2013
73 Module 17-Assessment of Outcomes Following Acquired/Traumatic Brain Injury-V9-2013 www.abiebr.com Updated August 2013
Table 17.46 Characteristics of the Satisfaction with Life Scale
Reliability
Test-retest: 0.82 for a 2-month interval (Diener et al. 1985); 0.84 for a 2-week interval and 0.84 for a one-month interval (student sample - Pavot et al. 1991); In their 1993 review, Pavot & Diener (1993) reported test retest reliability ranging 0.83 – 0.50 – intervals ranged from 2 weeks to 4 years and, in general, higher reliabilities were associated with shorter retest intervals. Internal consistency: Item to total correlations ranged from 0.57 – 0.75 (α=0.87) in a sample of undergraduate university students and from 0.63 – 0.81 in a sample of elderly persons (Diener et al. 1985); In a sample of older individuals (mean age = 74), α = 0.83 and 0.85 in a sample of university students (Pavot et al. 1991); Item to total correlations ranged from 0.55 – 0.80 among older individuals and 0.63 – 0.77 among the students; α=0.91(time 1) and 0.82(time 2) – points separated by a few weeks (Suh & Diener 1996); reliability according to Fleishman & Benson formula (1987) was 0.921 (Shevlin et al. 1998); Arrindell et al. (1999) reported α = 0.82 and item-total correlations ranging from 0.5 to 0.7; α=0.78 for the Portuguese version in an adolescent sample (Neto et al. 1993); In a review, Pavot & Diener identified 6 articles evaluating internal consistency – α ranged from 0.79 – 0.89; item-to-total correlations ranged from 0.71 to 0.86—mean interitem
correlation = 0.70 = 0.92 (Westaway et al. 2003); Lucas et al. (1996) reported =
0.84, 0.84 and 0.88 over three studies; = 0.78, mean inter item correlation =
0.41, item total correlations ranging from 0.52 – 0.65 (Neto 1993); =0.86 (Meyer et al. 2004).
Validity Construct validity: Principal components factor analysis (PCA) revealed a single factor accounting for 66% of the variance – factor loadings ranged from 0.61(Item 5) to 0.84 (Item 1) (Diener et al. 1985); PCA revealed a single factor accounting for 65% and 74% of variance in elderly and student subject samples respectively – loadings ranged from 0.78 – 0.93 (Pavot et al. 1991); PCA revealed a single factor accounting for 60.1% of variance – items 1-4 factor loadings > 70%, item 5 = 0.64 (Arrindell et al. 1999); factor analysis revealed a single factor accounting for 76% of the variance – factor loadings ranged from 0.81 to 0.92 (Westaway et al. 2003); a one-factor measurement model was found for both male and female Spanish adolescents suggesting no factor invariance across the sexes (Atienza et al. 2003); Shevlin et al. (1998) reported a single factor with factor loadings ranging from 0.92 to 0.96; PCA analysis revealed a single factor accounting for 53.3% of variance (Neto 1993); Construct validity (known groups): SWLS scores differentiated between groups of young adults defined by marital status (p<0.001) (Arrindell et al. 1999); significant differences in life satisfaction were identified between all groups of patients based on analyzed disorder (substance use, affective disorder, anxiety disorder, somatoform disorder) and those with no disorder (Meyer et al. 2004). Construct validity (convergent/divergent): SWLS scores correlated with selected personality measures: 0.54 with self-esteem, -0.41 with symptom checklist, -0.48 with neuroticism, -0.25 with emotionality, 0.20 with sociability and very low correlations with activity and impulsivity (Diener et al. 1985); r=0.86 with rated self-esteem (Westaway et al. 2003); r=0.52 (time 1), 0.43 (time 2) with positive affect and r=-0.36 (time 1), -0.30 (time 2) with negative affect (Lucas et al. 1996); r=0.60 (time 1) and 0.52 (time 2) with optimism and r=0.59 (time 1) and 0.55 (time 2) (Lucas et al. 1996); SWLS scores correlated with global happiness (Fordyce Scale r=0.68) as well as with affect balance (r=0.76; Pavot et al. 1991); multi-method multi-trait analyses demonstrated that assessment via the SWLA is able to discriminate between life satisfaction and both affective aspects of SWB, optimism and self-esteem (Lucas et al. 1996); significant positive correlations were

Evidence-Based Review of Moderate to Severe Acquired Brain Injury 2013
74 Module 17-Assessment of Outcomes Following Acquired/Traumatic Brain Injury-V9-2013 www.abiebr.com Updated August 2013
demonstrated with social acceptance, self-efficacy, psychological maturity, impulsivity/activity, self-concept, physical attractiveness and happiness while significant negative correlations between SWLS and loneliness, self-assessed loneliness, social anxiety and shyness were reported (Neto 1999); SWLS scores correlated with recent (within 3 months) positive and negative life events (r=0.25 and –0.28, respectively, p<0.01) (Suh et al. 1996). Concurrent validity: Moderately strong correlations (r=0.47-0.68) with other measures of subjective well-being, including: Fordyce’s % of time happy question and single-item measure of happiness, Differential Personality Questionnaire, Cantril’s Self-Anchoring Ladder, Gurin, Andrews and Withey’s D-T scale, Campbell, Bradburn’s Affect Balance Scale, and Summed Domain Satisfaction – in addition, SWLS scores correlated with interviewer rating of life satisfaction (r=0.43) (Diener et al. 1985); Pavot et al. (1991) reported moderate to strong correlations (r=0.42 – 0.81) with both self and peer reported assessments of life satisfaction (LSI-A, Philadelphia Geriatric Morale Scale, Daily satisfaction, memory difference, peer-rated SWLS & peer-rated LSI-A); In a review of studies evaluating SWLS, Pavot & Diener (1993) reported convergence with related measures (Andrews/Withey Scale, Fordyce Global Scale) as well as negative correlations with measures of distress (Beck Depression Inventory, negative affect and anxiety, depression & distress on the Symptom Checklist-90); r=0.56 with Oxford Happiness Inventory, r=0.61 with the Depression-Happiness scale and neuroticism and conscientiousness were the most significant predictors of SWLS scores (Hayes et al. 2003).
Responsiveness From beginning of therapy to one month into the therapy process, SWLS scores changed significantly for clients (p<0.01, n=7)(Friedman, 1991 in Pavot & Diener 1991); elderly caregivers of patients with dementia demonstrated significant decline in satisfaction with life scores over time (p<0.05) (Vitaliano et al.1991).
Tested for TBI patients?
No
Other Formats The Extended Satisfaction with Life Scale (ESWLS)(Alfonso et al. 1996, Gregg and Salisbury 2001) The Temporal Satisfaction with Life Scale (TSWLS) (Pavot et al. 1998, McIntosh 2000)
Use by proxy? Pavot et al. (1991) reported correlations between self and peer rated SWLS scores (r=0.54) when used to assess elderly individuals (mean age = 74). Among a student population, correlation between peer reports and family reports = 0.54, between self report and peer report = 0.55 and between self and family report = 0.57.
Advantages. The scale is available freely and is simple to administer and score. With only 5 items, it takes very little time to complete. The scale has been evaluated for use in populations of varying ages (adolescent, young adult and senior). Scale items appear to be at the 6th – 10th grade reading level, making it comprehensible to a wide range of adults. Original scale was tested in both college student and geriatric populations (Diener et al. 1985). Scale items are at the 6th to 10th grade reading level, which makes it comprehensible to most adults (Pavot and Diener 1993). The scale has been evaluated in several cultures and has been translated into several languages including Dutch, Taiwanese, Spanish, French, Russian, Korean, Hebrew, Mandarin Chinese, Spanish, Spanish and Portuguese.
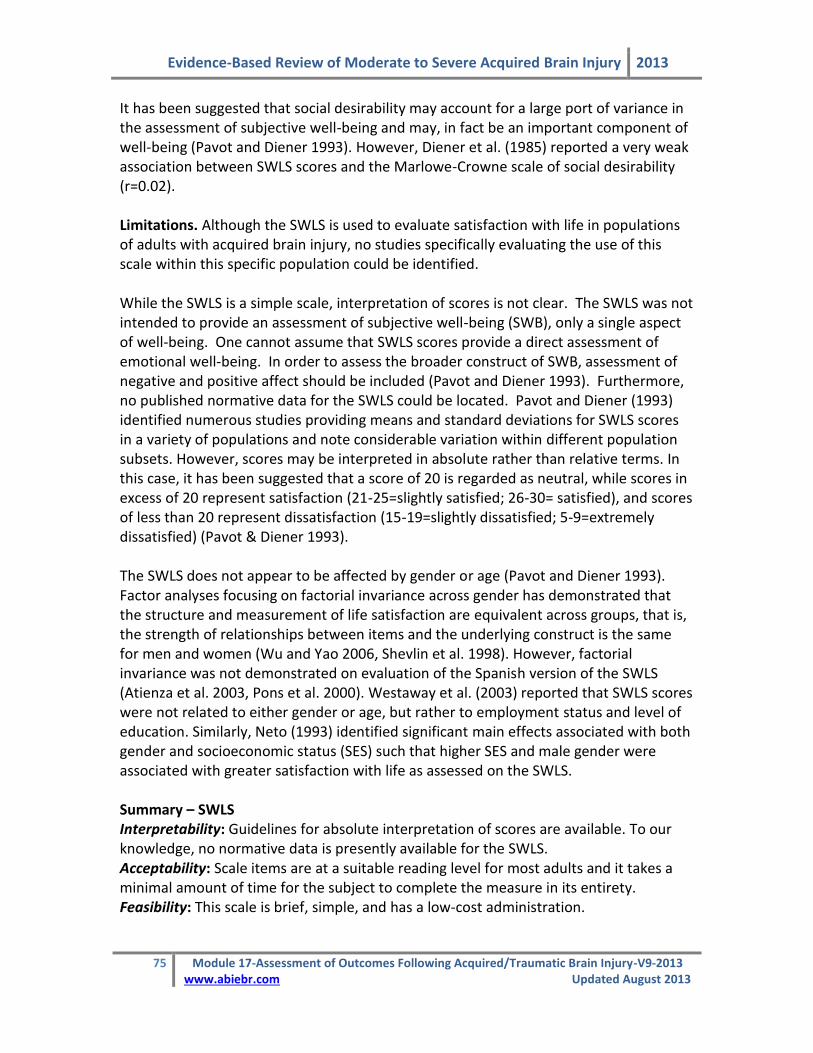
Evidence-Based Review of Moderate to Severe Acquired Brain Injury 2013
75 Module 17-Assessment of Outcomes Following Acquired/Traumatic Brain Injury-V9-2013 www.abiebr.com Updated August 2013
It has been suggested that social desirability may account for a large port of variance in the assessment of subjective well-being and may, in fact be an important component of well-being (Pavot and Diener 1993). However, Diener et al. (1985) reported a very weak association between SWLS scores and the Marlowe-Crowne scale of social desirability (r=0.02). Limitations. Although the SWLS is used to evaluate satisfaction with life in populations of adults with acquired brain injury, no studies specifically evaluating the use of this scale within this specific population could be identified. While the SWLS is a simple scale, interpretation of scores is not clear. The SWLS was not intended to provide an assessment of subjective well-being (SWB), only a single aspect of well-being. One cannot assume that SWLS scores provide a direct assessment of emotional well-being. In order to assess the broader construct of SWB, assessment of negative and positive affect should be included (Pavot and Diener 1993). Furthermore, no published normative data for the SWLS could be located. Pavot and Diener (1993) identified numerous studies providing means and standard deviations for SWLS scores in a variety of populations and note considerable variation within different population subsets. However, scores may be interpreted in absolute rather than relative terms. In this case, it has been suggested that a score of 20 is regarded as neutral, while scores in excess of 20 represent satisfaction (21-25=slightly satisfied; 26-30= satisfied), and scores of less than 20 represent dissatisfaction (15-19=slightly dissatisfied; 5-9=extremely dissatisfied) (Pavot & Diener 1993). The SWLS does not appear to be affected by gender or age (Pavot and Diener 1993). Factor analyses focusing on factorial invariance across gender has demonstrated that the structure and measurement of life satisfaction are equivalent across groups, that is, the strength of relationships between items and the underlying construct is the same for men and women (Wu and Yao 2006, Shevlin et al. 1998). However, factorial invariance was not demonstrated on evaluation of the Spanish version of the SWLS (Atienza et al. 2003, Pons et al. 2000). Westaway et al. (2003) reported that SWLS scores were not related to either gender or age, but rather to employment status and level of education. Similarly, Neto (1993) identified significant main effects associated with both gender and socioeconomic status (SES) such that higher SES and male gender were associated with greater satisfaction with life as assessed on the SWLS. Summary – SWLS Interpretability: Guidelines for absolute interpretation of scores are available. To our knowledge, no normative data is presently available for the SWLS. Acceptability: Scale items are at a suitable reading level for most adults and it takes a minimal amount of time for the subject to complete the measure in its entirety. Feasibility: This scale is brief, simple, and has a low-cost administration.

Evidence-Based Review of Moderate to Severe Acquired Brain Injury 2013
76 Module 17-Assessment of Outcomes Following Acquired/Traumatic Brain Injury-V9-2013 www.abiebr.com Updated August 2013
Table 17.47 SWLS Evaluation Summary
Reliability Validity Responsiveness
Rigor Results Rigor Results Rigor Results Floor/ceiling
+++
++ (TR) +++ (IC)
++ +++ + + n/a
NOTE: +++=Excellent; ++=Adequate; +=Poor; n/a = insufficient information; TR=Test re-test; IC= internal consistency; IO = Interobserver.
17.20 Quality of Life after Traumatic Brain Injury (QOLIBRI) The quality of life after traumatic brain injury (QOLIBRI) questionnaire was designed to specifically measure the quality of life of those who have sustained a TBI (Truelle et al., 2010). Prior to the scale being created the following items were reviewed: Quality of Life of the Traumatic Brain Injured; the Profile de la Qualite de la View Subjective, The Brain Injury Community Rehabilitation Outcome scale and the European Brain Injury Questionnaire. All items from each of the questionnaires were reviewed. Following a review of the items and an assessment of their psychometric properties a preliminary QOLIBRI was developed which consisted of 49 items (von Steinbuchel et al., 2010). These 49 items were arranged into 8 subscales. The final QOLIBRI consists of 37 items in 6 subscales: cognition (7 items), self (7 items), daily life and autonomy (7 items) and social relationships (6 items), emotions (5items) and physical problems (5 items). The first 4 subscales are coded on a 1 to 5 scale where 1- not at all satisfied and 5= very satisfied. The responses to the last two subscales (emotion and physical problems) are reverse scored to correspond with the satisfaction items. Here 1- very bothered, and 5= not at all bothered. Responses for each subscale are summed to give a total, then divided by the number of responses to give a scale a mean score. The scale means have a maximum possible range of 1 to 5. The mean can be computed when there are some missing responses, but should not be calculated if more than one third of responses on the scale are missing. In a similar manner the QOLIBRI total score is calculated by summing all the responses, and then dividing by the actual number of responses. Again, a total score should not be calculated if more than one third of responses are missing (http://www.qolibrinet.com/). The scales have also been translated into 7 languages and have been tested with each language cohort.
Table 17.48 The QOLIBRI scale
Section Section Questions
A Your thinking abilities? (self) Your ability to concentrated (for example when reading or keeping track of a conversation) Your ability to express yourself and understand other in a conversation Your ability to remember everyday things (for example where you have put things) Your ability to plan and work out solutions to everyday practical problems (for example what to do when you lose your keys)

Evidence-Based Review of Moderate to Severe Acquired Brain Injury 2013
77 Module 17-Assessment of Outcomes Following Acquired/Traumatic Brain Injury-V9-2013 www.abiebr.com Updated August 2013
Your ability to make decisions Your ability to find your way around Your speed of thinking
B Your view of your self? (self) Your level of energy Your level of motivation to do things Your self-esteem, how valuable you feel The way you look What you have achieved since your brain injury The way your perceive yourself The way you see your future
C Your independence and how your function in daily life (daily life and autonomy)
The extend of your independence from others Your ability to get out and about Your ability to carry out domestic activates, (for example cooking or repairing things) Your ability to run your personal finances Your participation in work or education Your participation in social and leisure activities (for example sports, hobbies and parties) The extent to which you are in charge of your own life
D Your social relationships? (social relationships
Your ability to feel affection towards others, (for example your partner, family, friends) Your relationship with members of your family Your relationships with your friends Your relationship with your partner or with not having a partner Your sex life The attitudes of other people towards you
E Your emotions? Feeling lonely, even if you are with other people Feeling bored Feeling anxious Sad or depressed Feeling angry or aggressive
F Your Physical Problems? Slowness and or clumsiness or movement Any other injuries you sustained at the same time as your brain injury Pain, including headaches Problems with seeing or hearing The effects of your brain injury.
Table 17.49 Characteristics of the QOLIBRI
Reliability Test-Retest: Intra class correlations (ICC) from a subsample of 381 participants ranged from 0.78 (emotions) to 0.85 (physical problems) indicating good test-retest reliability. The overall score was 0.91 (CI-0.89 to 0.92) (van Steinbuchel et al., 2010) Internal Consistency: Internal consistency was assessed for each of the subscales in each language. Cronbach’s scores ranged from 0.75 (physical problems subscale) to 0.89 (cognition and self subscales). Internal consistency was also found when looking at scores of those with MMSE scores of <28 and comparing them to those with an MMSE score of >27. ( was 081 for the physical problems subscale for the group with low cognitive performance, and 0.76 for those with

Evidence-Based Review of Moderate to Severe Acquired Brain Injury 2013
78 Module 17-Assessment of Outcomes Following Acquired/Traumatic Brain Injury-V9-2013 www.abiebr.com Updated August 2013
normal cognitive status) (von Steinbuchel et al., 2010). Although the QOLIBRI total score is useful as an overall summary, the analysis indicates that it does not completely describe variation in HRQoL and that this is more fully and consistently measured by the profile of individual scales
Validity Concurrent validity: There was a significant relationship between the QOLIBRI and the Glasgow Outcome Scale Extended (GOSE). The strongest relationship was with the subscale daily life and autonomy (r=.42) and the weakest was with the emotions subscale (r=.19). Those with a good recovery reported more areas as good on the HRO0L than those with moderate or severe injuries. The relationship between the HADS and the QOLIBRI was also found to be strong, with the strongest relationship between the HADS depression scale the self scale (r=-.62) and the HADS anxiety scale the emotions scale (r=-.62). The SF PCS was strongly related to the physical problems scale (r=.63) and the SF MCS was strongly associated with the emotions scale (r=.61). Construct validity: Further analysis revealed the outcome related information captured by the SF-36 mental health component score was also captured by the QOLIBR.I Construct validity (known groups): Effects of age (r=-.06), education (r=.11), time since injury (r=-.08) and the severity of injury as determined by the GCS (r=-.03) were all very weak. Current comorbid health conditions showed a significant relationship with all QOLIBRI subscales with the strongest correlation (r-.56) on the physical subscale. An association between the test scores and the QOL of the person.
Responsiveness N/A
Tested for ABI/TBI patients?* Developed to be used with those who have sustained an ABI/TBI
Other Formats The QOLIBRI was been translated into 7 languages with each scale being found reliable and valid.
Use by Proxy? No
Advantages: This scale was designed specifically for the ABI population and has been translated into 6 other languages. To date this is the only scale designed specially for those who have sustained either an acquired brain injury or a traumatic brain injury. The composite measure has the advantage of covering both functional outcomes post ABI and HRQoL post ABI. Limitations Like so many other scales measuring quality of life, the important limitation is the complexity of HRQoL, as it remains virtually impossible to capture and define an individual’s view of the future, the concept of individuality and the experience of intimacy (Truelle et al., 2010). The conclusions of the study are based on the approach to recruitment. Here subjects were a convenience sample. Subjects were chosen at various times across a multitude of settings, therefor the sample was scale orientated not patient focused (Truelle et al., 2010).

Evidence-Based Review of Moderate to Severe Acquired Brain Injury 2013
79 Module 17-Assessment of Outcomes Following Acquired/Traumatic Brain Injury-V9-2013 www.abiebr.com Updated August 2013
Summary –QOLIBRI Interpretability: Results are easy to interpret, with lower scores indicating a better QoL. Acceptability: The scale, available in 7 languages, is a self-report of how well the individual perceives themselves as doing. Feasibility: The scale is now available and ready for more regular use. It is easy to use, available in a variety of languages and there is no fee for its use.
Table 17.50 QOLIBRI Evaluation Summary
Reliability Validity Responsiveness
Rigor Results Rigor Results Rigor Results Floor/ceiling
+++ +++ (TR) +++(IC)
+++
++ N/A N/A N/A
NOTE: +++=Excellent; ++=Adequate; +=Poor; n/a = insufficient information; TR=Test re-test; IC= internal consistency; IO = Interobserver.

Evidence-Based Review of Moderate to Severe Acquired Brain Injury 2013
80 Module 17-Assessment of Outcomes Following Acquired/Traumatic Brain Injury-V9-2013 www.abiebr.com Updated August 2013
17.21 Reference List
Agrell B. & Dehlin O. (2000) Mini Mental State Examination in geriatric stroke patients. Validity, differences between subgroups of patients, and relationships to somatic and mental variables. Aging Clin Exp Res 12; 439-444.
Alcott D., Dixon K. & Swann R. (1997) The reliability of the items of the Functional Assessment Measure (FAM): differences in abstractness between FAM items. Disabil Rehabil: 9-355.
Alfonso V.A. Allison D.B., Rader D.E. & Gorman B.S. (1996) The extended satisfaction with life scale: Development and psychometric properties. Social Indicators Research 38; 275-301.
Amtmann D., Bamer A.M., Noonan V., Lang N., Kim J. & Cook K.F. (2012) Comparison of the psychometric properties of two fatigue scales in multiple sclerosis. Rehabilitation Psychology 57(2), 159-166.
Anderson S.I., Housley A.M., Jones P.A., Slattery J. & Miller J.D. (1993) Glasgow Outcome Scale: an inter-rater reliability study. Brain Injury 7; 309-317.
Anderson C., Laubscher S. & Burns R. (1996) Validation of the Short Form 36 (SF-36) health survey questionnaire among stroke patients. Stroke 27; 1812-1816.
Andresen E.M., Gravitt G.W., Aydelotte M.E. and Podgorski C.A. (1999) Limitations of the SF-36 in a sample to nursing home residents. Age and Ageing 28; 562-566.
Andresen E.M. & Meyers A.R. (2000) Health-related quality of life outcomes measures. Arch Phys Med Rehabil;81 S30-S45.
Andresen E.M. (2000) Criteria for assessing the tools of disability outcomes research. Arch Phys Med Rehabil 81; S15-S20.
Armutlu K., Korkmaz N.C., Kesser I., Sumbuloglu V., Akbiyik D.I., Gunney Z. & Karabudak R. (2007) The validity and reliability of the fatigue severity scale in Turkish multiple sclerosis patients. International Journal of Rehabilitation Research 30, 81-85.
Arrindell W.A., Heesink J. & Feij J.A. (1999) The Satisfaction with Life Scale (SWLS): appraisal with 1700 healthy young adults in the Netherlands. Personality and Individual Differences 26; 815-826.
Atienza F.L., Balaguer I., Garcia-Merita M. (2003) Satisfaction with Life Scale: analysis of factorial invariance across the sexes. Personality and Individual Differences 35; 1255-1260.
Au-Yeung S.S., Ng J.T. & Lo S.K. (2003) Does balance or motor impairment of limbs discriminate the ambulatory status of stroke survivors? Am J Phys Med Rehabil 82; 279-283.
Awad C,P. (2002) Establishing the validity of the neurobehavioral functioning inventory. PhD. Dissertation; University of Missouri-Columbia, UMI Number: 3060088.
Aylard P.R., Gooding J.H., McKenna P.J. & Snaith R.P. (1987) A validation study of three anxiety and depression self-assessment scales. Journal of Psychosomatic Research 31(2), 261-268.
Bakay R.A. & Ward A.A, Jr. (1983) Enzymatic changes in serum and cerebrospinal fluid in neurological injury. Journal of Neurosurgery 58; 27-37.

Evidence-Based Review of Moderate to Severe Acquired Brain Injury 2013
81 Module 17-Assessment of Outcomes Following Acquired/Traumatic Brain Injury-V9-2013 www.abiebr.com Updated August 2013
Balestreri M., Czosnyka M., Chatfield D.A., et al. (2004) Predictive value of Glasgow coma scale after brain trauma: change in trend over the past ten years. J Neurol Neurosurg Psychiatry 75; 161-162.
Beauchamp K., Baker S., McDaniel C., et al. (2001) Reliability of nurses' neurological assessments in the cardiothoracic surgical intensive care unit. Am J Crit Care 10; 298-305.
Beck A.T., Guth D., Steer R.A. & Ball R. (1997) Screening for major depression disorders in medical inpatients with the Beck Depression Inventory for Primary Care. Behav. Res.Ther. 35(8), 785-791. Belmont, A., Agar, N., Hugerson, C., Gallais B. & Azouvi, P. (2006) Fatigue and traumatic brain injury. Annals de Readaptation et de Medecine Physique 49, 370-374.
Berg K.O., Wood-Dauphinee S., Williams J.L. & Maki B. (1989) Measuring balance in the elderly: preliminary development of an instrument. Physiotherapy Canada 41, 304-311.
Berg K.O., Wood-Dauphinee S., Williams J.L. & Maki B. (1992) Measuring balance in the elderly: validation of an instrument. Can J Public Health 8, S7-S11.
Berg K.O., Maki B., Williams J.L., Holliday P.J. & Wood-Dauphinee S. (1992) Clinical and laboratory measures of postural balance in an elderly population. Arch Phys Med Rehabil, 73, 1073-1080.
Berg K.O., Wood-Dauphinee S. & Williams J.L. (1995) The Balance Scale: Reliability assessment with elderly residents and patients with acute stroke. Scan J Rehab Med, 27, 27-36.
Bjelland I., Dahl A.A., Haug, T.T & Neckelmann D. (2002) The validity of the Hospital Anxiety and Depression Scale: An updated literature review. Journal of Psychosomatic Research 52, 69-77.
Blake H., McKinney M., Treece K., Lee E. & Lincoln N.B. (2002) An evaluation of screening measures for cognitive impairment after stroke. Age and Ageing;31:451-456.
Bland J.M. & Altman D.G. (1986) Statistical methods for assessing agreement between two methods of clinical measurement. The Lancet;(2)8:307-310.
Bleecker M.L., Bolla-Wilson K., Kawas C. & Agnew J. (1988) Age-specific norms for the Mini Mental State Examination. Neurology 38,1565-1568.
Bode R.K., Heinemann A.W., Semik P. (2000) Measurement properties of the Galveston Orientation and Amnesia Test (GOAT) and improvement patterns during inpatient rehabilitation. Jof Head Trauma Rehabil 15, 637-655.
Bogle-Thorbahn D.B. & Newton R.A. (1996) Use of the Berg Balance Test to predict falls in elderly persons. Phys Ther76, 576-583.
Bohac D.L., Malec J.F. & Moessner A.M. (1997) Factor analysis of the Mayo-Portland Adaptability Inventory: Structure and validity. Brain Injury 11, 469-482
Bogner J.A.& Corrigan J.D. (1995) Epidemiology of agitation following brain injury. NeuroRehabilitation 5, 293-397.
Bogner J A.. Corrigan J.D., Stange M., Rabold D. & Caplan B. (1999) Reliability of the Agitated Behavior Scale. J of Head Trauma Rehabil 14(1), 91-96
Evidence-Based Review of Moderate to Severe Acquired Brain Injury 2013
82 Module 17-Assessment of Outcomes Following Acquired/Traumatic Brain Injury-V9-2013 www.abiebr.com Updated August 2013
Bogner J.A., Corrigan D., Bode R.K. & Heinemann A.W. (2000) Rating scale analysis of the Agitated Behavior Scale. J of Head Trauma Rehabil 15(1), 656-669.
Bogner J.A., Corrigan J.D., Fugate L., Mysiw W.J. & Clinchot D. (2001) Role of agitation in prediction of outcome after traumatic brain injury. Am J Phys Med Rehabil 80(9), 636-644.
Borgaro S.R., Baker J., Wethe J.V., Prigatano G.P. & Kwasnica C. (2005) Subjective reports of fatigue during early recovery from traumatic brain injury. J of Head Trauma Rehab 20(5), 416-425.
Brazier J.E., Harper R. & Jones N.M., et al. (1992) Validating the SF-36 health survey questionnaire: new outcome measure for primary care. BMJ 305, 160-164.
Brazier J.E., Jones N. & Kind P. (1993) Testing the validity of the Euroqol and comparing it with the SF-36 health survey questionnaire. Quality of Life Research 2, 169-180.
Brazier J.E., Walters S.J., Nicholl J.P., Kohler B. (1996) Using the SF-36 and the Euroqol on an elderly population. Quality of Life Research 5, 195-204.
Brazil K. (1992) Assessing the consequences of traumatic brain injury. International Journal of Rehabilitation Research 15, 93-101.
Brock K, Robinson P, Simondson J, Goldie P, Nosworthy J, Greenwood K. (1997) Prediction of length of hospital stay following stroke. J Qual Clin Practice 17, 37-46.
Brooks DN, Hosie J, Bond MR, Jennett B, Aughton M. (1986) Cognitive sequelae of severe head injury in relation to the Glasgow Outcome Scale. Journal of Neurology, Neurosurgery and Psychiatry 49, 549-553.
Burger H., Franchignoni F., Puzic N. & Giordano A. (2010) Psychometric properties of the Fatigue Severity Scale in polio Survivors. International Journal of Rehabilitation Research 33(4), 290-297.
Butcher S.J., Meshke J.M., Sheppard M.S. (2004) Reductions in functional balance, coordination, and mobility measures among patients with stable chronic obstructive pulmonary disease. J of Cardiopulmonary Rehabil 24,; 274-280.
Callahan C.D., Young P.L., Barisa M.T. (2005) Using the SF-36 for longitudinal outcomes assessment in rehabilitation. Rehabilitation Psychology 50, 65-70.
Cavanagh S.J., Hogan K., Gordon V., Fairfax J. (2000) Stroke-specific FIM models in an urban population. Journal of Neurological Nursing 32,; 17-21.
Cifu D.X., Keyser-Marcus L., Lopez E., et al. (1997) Acute predictors of successful return to work 1 year after traumatic brain injury: a multicenter analysis. Arch Phys Med Rehabil 78, 125-131.
Clarke D.M., Smith G.C. & Herrman H.E. (1993) A comparative study of screening instruments for mental disorders in general hospital patients. International Journal of Psychiatry in Medicine 23(3), 323-337.
Cohen M.I. and Marino R.J. (2000) The tools of disability outcomes research functional status measures. Arch Phys Med Rehabil 81, S21-S29.
Corrigan, J.D. and Mysiw, W. J. (1988) Agitation following traumatic bhead injury: Equivocal evidence for a discrete stage of cognitive recovery. Arch Phys Med Rehabil 69, 487-492.

Evidence-Based Review of Moderate to Severe Acquired Brain Injury 2013
83 Module 17-Assessment of Outcomes Following Acquired/Traumatic Brain Injury-V9-2013 www.abiebr.com Updated August 2013
Corrigan J.D. (1989) Development of a scale for assessment of agitation following traumatic brain injury. Journal of Clinical and Experimental Neuropsychology 11(2), 261-277.
Corrigan J.D., Dickerson J., Fisher E. & Meyer P. (1990) The Neurobehavioural Rating Scale: replication in an acute inpatient rehabilitation setting. Brain Injury 4(3), 215-222.
Corrigan J.D., Mysiw W. J., Gribble M.W. & Chock S.K. (1992) Agitation, cognition and attention during post-traumatic amnesia. Brain Injury 6(2), 155-160.
Corrigan J.D. & Bogner, J.A. (1994) Factor structure of the agitated behaviour scale. Journal of Clinical and Experimental Neuropsychology 16(3), 386-392.
Corrigan J.D. and Bogner, J.A. (1995) Assessment of agitation following brain injury. NeuroRehabilitation 5, 205-210.
Corrigan J.D. and Deming R. (1995) Psychometric characteristics of the Community Integration Questionnaire: replication and extension. J Head Trauma Rehabil 10, 41-53.
Corrigan, J.D., Bogner, J.A. & Tabloski, P.A. (1996) Comparison of agitation associated with Alzheimer’s disease and acquired brain injury. American Journal of Alzheimer’s Disease 11/12, 20-24.
Corrigan J.D., Smith-Knapp K. & Granger C. (1997) Validity of the Functional Independence Measure for persons with traumatic brain injury. Arch Phys Med Rehabil;78, 828-834.
Corrigan J.D., Smith-Knapp K. & Granger C.V.. (1998) Outcomes in the first 5 years after traumatic brain injury. Arch Phys Med Rehabil 79, 298-305.
Cusick C.P., Berhart K.A. & Mellick D.C. (2000) Participant-proxy reliability in traumatic brain injury outcome research. J Head Trauma Rehabil 15; 739-749.
Daving Y., Andren E., Nordholm L. & Grimby G. (2001) Reliability of an interview approach to the Functional Independence Measure. Clin Rehabil 15: 310.
de Koning I., van Kooten F. & Koudstaal P.J. (1998) Value of screening instruments in the diagnosis of post-stroke dementia. Haemostasis 28, 158-166.
Demetriades D., Kuncir E., Murray J., Velmahos G.C., Rhee P. & Chan L. (2004) Mortality prediction of head abbreviated injury score and Glasgow Coma Scale: analysis of 7,764 head injuries. J Am Coll Surg 199, 216-222.
DePaulo J.R.Jr. & Folstein M.F. (1978) Psychiatric disturbances in neurological patients: detection, recognition and hospital course. Ann Neurol 4, 225-228.
Desrosiers J., Noreau L., Rochette A., Bravo G. & Boutin C. (2002) Predictors of handicap situations following post-stroke rehabilitation. Disability and Rehabilitation 24, 774-785.
Dawkins N., Cloherty M.E., Gracey F. & Evans J.J. (2006) The factor Structure of the Hospital Anxiety and Depression Scale in acquired brain injury. Brain Injury 20(12), 1235-1239.
Dick J.P., Builoff R.J., Stewart A., Blackstock J., Bielawska C., Paul E.A. & Marsden,C.D. (1984). Mini-mental State Examination in neurological patients. J Neurol Neurosurg Psychiatry 47, 496-499.
Evidence-Based Review of Moderate to Severe Acquired Brain Injury 2013
84 Module 17-Assessment of Outcomes Following Acquired/Traumatic Brain Injury-V9-2013 www.abiebr.com Updated August 2013
Diener E., Emmons R.A., Larsen R.J. & Griffin S. (1985) The Satisfaction With Life Scale. J Pers Assess. 49, 71-75.
Dijkers M. (1997) Measuring the long-term outcomes of traumatic brain injury: a review of the Community Integration Questionnaire. J Head Trauma Rehabil 12, 74-91.
Dikmen S., Machamer J., Miller B., Doctor J. & Temkin N. (2001) Functional status examination: a new instrument for assessing outcome in traumatic brain injury. J Neurotrauma 18, 127-140.
Dittner A.J, Wessely S.C. & Brown R.G. (2004) The assessment of fatigue: A practical guide for clinicians and researchers. Journal of Psychosomatic Research 56, 157-170.
Dobson R., James O.F., O'Mahoney P.G., Rodgers H. & Thomson R.G. (1998) Is the SF-36 suitable for assessing health status of older stroke patients? Age and Aging 27(1), 19-23.
Dodds T.A., Martin D.P., Stolov W.C. & Deyo R. (1993) A validation of the Functional Independence Measurement and its performance among rehabilitation inpatients. Arch Phys Med Rehabil 74, 531-536.
Donaghy S. & Wass P.J.(1998) Interrater reliability of Functional Assessment Measure in a brain injury rehabilitation program. Arch Phys Med Rehabil 79, 1234-1236.
Doninger NA, Heinemann A, Bode RK, Sokol K, Corrigan JD, Moore D. (2003) Predicting community integration following traumatic brain injury with health and cognitive status measures. Rehabilitation Psychology 48, 67-76.
Dorman P.J., Slattery J., Farrell B., Dennis M. & Sandercock P. for the United Kingdom Collaborators in the International Stroke Trial (IST).(1997) A randomised comparison of the EuroQol and Short Form 36 after stroke. BMJ, 315:461.
Dorman P.J., Slattery J., Farrell B., Dennis M. & Sandercock P., for the United Kingdom Collaborators in the International Stroke Trial (IST). (1998) Qualitative comparison of the reliability of health status assessments with the EuroQol and SF-36 questionnaires after stroke. Stroke 29, 63-68.
Dorman P.J., Dennis M. & Sandercock P., for the United Kingdom Collaborators in the International Stroke Trial (IST). (1999) How do scores on the EuroQol relate to scores on the SF-36 after stroke? Stroke 30, 2146-2151.
Dromerick A.W., Edwards D.F. & Diringer M.N. (2003) Sensitivity to changes in disability after stroke: A comparison of four scales useful in clinical trials. Journal of Rehabilitation Research and Development 40,1-8.
Duncan P.W., Jorgensen H.S. & Wade D.T. (2000) Outcome measures in acute stroke trials. A systematic review and some recommendations to improve practice. Stroke 31, 1429-1438.
Duncan P.W., Lai S.M., Tyler D., Perera S., Reker D.M. & Studenski S.(2002) Evaluation of proxy responses to the Stroke Impact Scale. Stroke 33, 2593-2599.
Eblers R.G., Rietberg M.B., van Wegen, E.E., Verhoef J., Kramer S.F., Terwee, C.B. & Kwakkel, G. (2012) Self-report fatigue questionnaires in multiple sclerosis, Parkinson’s disease and Stroke: a systematic review of measurement properties. Qual Life Res 21, 925-944.

Evidence-Based Review of Moderate to Severe Acquired Brain Injury 2013
85 Module 17-Assessment of Outcomes Following Acquired/Traumatic Brain Injury-V9-2013 www.abiebr.com Updated August 2013
Edwards S. (2001) Using the Glasgow Coma Scale: analysis and limitations. British Journal of Nursing 10, 92-101.
Eliason M.R. & Topp B.W. (1984) Predictive validity of Rappaport's Disability Rating Scale in subjects with acute brain dysfunction. Phys Ther 64, 1357-1360.
Emanuelson I., Andersson H.E., Bjorklund R. & Stalhammar D. (2003) Quality of life and post-concussion symptoms in adults after mild traumatic brain injury: a population-based study in western Sweden. Acta Neurol Scand 108, 332-338.
Essink-Bot M.L., Drabbe P.F., Bonsel G.J. & Aaronson N.K. (1997) An empirical comparison of four generic health status measures: The Nottingham Health Profile, the Medical Outcomes Study 36-item Short Form Health Survey, the COOP/WONCA Charts, and the EuroQol instrument. Med Care 35, 522-537.
Fabrigoule C., Lechevallier N., Crasborn L., Dartigues J.F. & Orgogozo J.M. (2003) Inter-rater reliability of scales and tests used to measure mild cognitive impairment by general practitioners and psychologists. Current Medical Research and Opinion 19; 603-608.
Feld J.A., Rabadi M.H., Blau A.D. & Jordan B.D. (2001) Berg Balance Scale and outcome measures in acquired brain injury. Neurorehabilitation and Neural Repair 15, 239-244.
Fielding K. & Rowley G. (1990) Reliability of assessments by skilled observers using the Glasgow Coma Scale. Aust Adv Nurs 7, 13-17.
Finch E., Brooks D., Stratford P.W. & Mayo N.E. (2002) Physical Rehabilitations Outcome Measures. A Guide to Enhanced Clinical Decision-Making., 2nd ed. Toronto, Ontario: Canadian Physiotherapy Association
Findler M., Cantor J., Haddad L., Gordon W. & Ashman T. (2001) The reliability and validity of the SF-36 health survey questionnaire for use with individuals with traumatic brain injury. Brain Inj 15; 715-723.
Fitzpatrick R., Davey C., Buxton M.J. & Jones D.R. (1998) Evaluation of patient-based outcome measures for use in clinical trials. Health Technology Assessment 2; 1-74.
Fleming J,M. & Maas F. (1994) Prognosis of rehabilitation outcome in head injury using the Disability Rating Scale. Arch Phys Med Rehabil 75, 156-163.
Folstein M.F., Folstein S.E., McHugh P.R. (1975) A practical method for grading the cognitive state of patients for the clinician. Journal of Psychiatric Research 12; 198.
Forrester G. & Encel J. (1994) Geffen G. Measuring post-traumatic amnesia (PTA): an historical review. Brain Injury 8, 175-184.
Friedman J.H., Alves G., Hagell P., Marinus J., Marsh L., Martinez-Martin P., Goetz C.G. et al. (2010) Fatigue rating scales critique and recommendations by the movement disorders society task force on rating scales for Parkinson’s Disease. Movement Disorders 25(7), 805-822.
Fryer L.J. & Haffey W.J. (1987) Cognitive rehabilitation and community readaptation: Outcomes from two program models. J Head Trauma Rehabil 2, 51-63.
Gill M.R., Reiley D.G. & Green S.M. (2004) Interrater reliability of Glasgow Coma Scale scores in the emergency department. Annals of Emergency Medicine 43, 215-223.

Evidence-Based Review of Moderate to Severe Acquired Brain Injury 2013
86 Module 17-Assessment of Outcomes Following Acquired/Traumatic Brain Injury-V9-2013 www.abiebr.com Updated August 2013
Gouvier W.D., Blanton P.D., LaPorte K.K. & Nepomuceno C. (1987) Reliability and validity of the disabilty rating scale and the levels of cognitive functioning scale in monitoring recovery from severe head injury. Arch Phys Med Rehabil 68, 94-97.
Grace J., Nadler J.D., White D.A., Guilmette T.J., Giuliano A.J., Monsch A.U. & Snow M.G. (1995) Folstein vs. Modified Mini-Mental State Examination in geriatric stroke. Arch Neurol 52(5), 477-484.
Granger C.V., Hamilton B.B., Keith R.A., Zielezny M. & Sherwin F.S. (1986) Advances in functional assessment for medical rehabilitation. Topics in Geriatric Rehabilitation 1, 59-74.
Granger C.V., Cotter A.C., Hamilton B.B. & Fiedler R.C. (1993) Functional Assessment Scales: a study of persons after stroke. Arch Phys Med Rehabil 74, 133-138.
Gregg P.M. & Salisbury P.S. (2001) Confirming and expanding the usefulness of the extended satisfaction with life scale (ESWLS). Social Indicators Research 54, 1-16.
Gurka J.A., Felmingham K.L., Baguley I.J., Schotte D.E., Crooks J. & Marosszeky J.E. (1999) Utility of the Functional Assessment Measure after discharge from inpatient rehabilitation. Journal of Head Trauma Rehabilitation 14, 247-256.
Hagen C. (1982) Language cognitive disorganization following closed head injury: a coneptualization. In:Trexler L.E., ed. Cognitive Rehabilitation: Conceptualization and Intervention. New York: Plenum Press, 131-151.
Hagen C. Rancho Los Amigos - Revised. Traumatic Brain Injury Resource Guide
Hall K., Cope N. & Rappaport M. (1985) Glasgow Outcome Scale and Disability Rating Scale: comparative usefulness in following recovery in traumatic head injury. Arch Phys Med Rehabil 66, 35-37.
Hall K.M. (1992) Overview of functional assessment scales in brain injury rehabilitation. Neurorehabilitation 2, 98-113.
Hall K.M., Hamilton B., Gordon W.A. & Zasler N.D. (1993) Characteristics and comparisons of functional assessment indices: disability rating scale, functional independence measure and functional assessment measure. J Head Trauma Rehabil 8, 60-74.
Hall K.M. & Johnston M.V. (1994) Outcomes evaluation in TBI Rehabilitation. Part II: Measurement tools for a nationwide data system. Arch Phys Med Rehabil 75, SC10-SC18.
Hall K.M., Mann N.R., High W.M.Jr., Wright J., Kreutzer J.S. & Wood D. (1996) Functional measures after traumatic brain injury: ceiling effects of FIM, FIM+FAM, DRS and CIQ. J Head Trauma Rehabil 11, 27-39.
Hall K.M. (1997) Establishing a national traumatic brain injury information system based upon a unified data set. Arch Phys Med Rehabil 78, S5-S11.
Hammond F.M., Grattan K.D., Sasser H., Corrigan J.D., Bushnik T. & Zafonte R.D. (2001) Long-term recovery course after traumatic brain injury: A comparison of the Functional Independence Measure and Disabilty Rating Scale. J Head Trauma Rehabil 16, 318-329.
Hart T., Whyte J., Polansky M. et al. (2003) Concordance of patient and family report of neurobehavioral symptoms at 1 year after traumatic brain injury. Arch Phys Med Rehabil 84, 204-213.

Evidence-Based Review of Moderate to Severe Acquired Brain Injury 2013
87 Module 17-Assessment of Outcomes Following Acquired/Traumatic Brain Injury-V9-2013 www.abiebr.com Updated August 2013
Hawley C.A., Taylor R., Hellawell D.J. & Pentland B. (1999) Use of the functional assessment measure (FIM+FAM) in head injury rehabilitation: a psychometric analysis. Journal of Neurology, Neurosurgery and Psychiatry 67, 749-756.
Hayes N. & Joseph S. (2003) Big 5 correlates of three measures of subjective well-being. Personality and Individual Differences 34, 723-727.
Hayes V., Morris J., Wolfe C. & Morgan M. (1995) The SF-36 Health Survey Questionnaire: Is it suitable for use with older adults? Age and Aging 24, 120-125.
Healey C., Osler T.M., Rogers F.B., et al. (2003) Improving the Glasgow Coma Scale Score: Motor score alone is a better predictor. J Trauma 54, 671-680.
Heinemann A., Linacre J.M., Wright B.D., Hamilton B.B. & Granger C. (1994) Prediction of rehabilitation outcomes with disability measures. Arch Phys Med Rehabil 75, 133-143.
Heinemann A.W & Whiteneck G.G. (1995) Relationships among impairment, disability, handicap and life satisfaction in persons with traumatic brain injury. J Head Trauma Rehabil 10, 54-63.
Hellawell D.J. & Signorini D.F. (1997) The Edinburgh Extended Glasgow Outcome Scale (EEGOS): Rationale and pilot studies. International Journal of Rehabilitation Research 20, 345-354.
Hellawell D.J., Signorini D.F. & Pentland B. (2000) Simple assessment of outcome after acute brain injury using the Glasgow Outcome Scale. Scandinavian Journal of Rehabilitation Medicine 32, 25-27.
Herrmann C. (1997) International experiences with the Hospital Anxiety and Depression Scale-A review of the validation data and clinical results. J Psychos Res 42(1), 17-41.
Herrero M.J., Blanch J., Peri J.M., De Pablo J., Pintor L. & Bulbena A. (2003) A validation study of the hospital anxiety and depression scale (HADS) in a Spanish population. General Hospital Psychiatry 25, 277-283.
Hobart J.C., Lamping D.L., Freeman J.A., Langdon, D.W., McLellan D.J., Greenwood R.J. & Thompson A.J. (2001) Evidence-based measurement: Which disability scale for neurologic rehabilitation? Neurology 57, 644.
Hobart J.C., Williams L.S., Moran K. & Thompson A.J. (2002) Quality of life measurement after stroke. Uses and abuses of the SF-36. Stroke 33, 1348-1356.
Hsueh I.P., Lee M.M. & Hsieh C.L. (2001) Psychometric characteristics of the Barthel activities of daily living index in stroke patients. Journal of the Formosa Medical Association 100, 526-532.
Hsueh I.P., Lin J.H., Jeng J.S & Hsieh C.L. (2002) Comparison of the psychometric characteristics of the Functional Independence Measure, 5-item Barthel index and 10-item Barthel Index in patients with stroke. J Neurol Neurosurg Psychiatry 73, 188-190.
Inness E., Howe J., Verrier M.C., & Williams,J.I. (1999) Development of the community balance and mobility scale for clients with traumatic brain injury. Arch Phys Med Rehabil 80, 968.
Inness E., Howe J.A., Niechwiej-Szwedo E., Jaglal S.B., McIlroy, W.E., & Verrier, M.C. (2004) Measuring balance and mobility after traumatic brain injury: further validation of the Community Balance and Mobility Scale. Arch Phys Med Rehabil 85, E11.

Evidence-Based Review of Moderate to Severe Acquired Brain Injury 2013
88 Module 17-Assessment of Outcomes Following Acquired/Traumatic Brain Injury-V9-2013 www.abiebr.com Updated August 2013
Jain N., Layton B.S. & Murray P.K. (2000) Are aphasic patients who fail the GOAT in PTA? a modified Galveston Orientation and Amnesia Test for persons with aphasia. The Clinical Neuropsychologist 14, 13-17.
Jenkinson C., Wright L. & Coulter A. (1993) Quality of Life Measurement in Health Care. Oxford, UK: Health Services Research Unit, University of Oxford,.
Jennett B. & Bond M. (1975) Assessment of outcome after severe brain damage. Lancet 1; 480-484.
Jennett B., Snoek J., Bond M.R. & Brooks N. (1981) Disability after severe head injury: observations on the use of the Glasgow Outcome Scale. Journal of Neurology, Neurosurgery and Psychiatry 44; 285-293.
Johnston M., Pollard B. & Hennessey P. (2000) Construct validation of the hospital anxiety and depression scale with clinical population. Journal of Psychosomatic Research 48, 579-584.
Johnston M.V., Findley T.W., DeLuca J. & Katz R.T. (1991) Research in Physical Medicine and Rehabilitation. XII. Measurement tools with application to brain injury. Am J Phys Med Rehabil 70; S114-S130.
Juarez V.J. & Lyons M. (1995) Interrater reliability of the Glasgow Coma Scale. Journal of Neuroscience Nursing 27; 283-286.
Juneja G., Czyrny J.J. & Linn R.T. (1998) Admission balance and outcomes of patients admitted for acute inpatient rehabilitation. Am J Phys Med Rehabil 77; 388-393.
Jutai J. & Teasell R. (2003) The necessity and limitations of evidence-based practice in stroke rehabilitation. Topics in Stroke Rehabilitation 10; 71-78.
Kaplan C.P. (2001) The community integration questionnaire with new scoring guidelines: concurrent validity and need for appropriate norms. Brain Injury 15; 725-731.
Katz D.I. & Alexander M.P. (1994) Traumatic Brain Injury. Predicting course of recovery and outcome for patients admitted to rehabilitation. Arch Neurol 51; 661-670.
Keith M.S., Stanislav W., Wesnes K.A. (1998) Validity of a cognitive computerized assessment system in brain-injured patients. Brain Injury 12; 1037-1043.
Keller S.D., Bayliss M.S., Ware J.E. Jr., Hsu M.A., Damiano A.M .& Goss T.F. (1997) Comparison of responses to SF-36 health survey questions with one-week and four-week recall periods. HSR: Health Services Research 32; 367-384.
Kidd D., Stewart G., Baldry J., Johnson J., Rossidter D., Petruckevitch A. & Thompson A.J. (1995) The Functional Independence Measure: a comparative validity and reliability study. Disabil Rehabil 17;10-14.
Kleinman l., Zodet, M.W., Hakim Z., Aledort J., Barker C., Chan K., Krupp L. & Revicki D. (2000) Psychometric evaluation of the fatigue severity scale for use in chronic Hepatitis C. Quality of Life Research 9, 499-508
Kornetti D.L., Fritz S.L., Chiu Y-P., Light K.E. & Velozo C.A. (2004) Rating scale analysis of the Berg Balance Scale. Arch Phys Med Rehabil 85; 1128-1135.

Evidence-Based Review of Moderate to Severe Acquired Brain Injury 2013
89 Module 17-Assessment of Outcomes Following Acquired/Traumatic Brain Injury-V9-2013 www.abiebr.com Updated August 2013
Kreutzer J., Seel R., & Marwitz J. (1999) The Neurobehavioral Functioning Inventory. San Antonio, Texas: The Psychological Corporation.
Kreutzer J.S., Marwitz J.H., Seel R. & Serio C.D. (1996) Validation of a neurobehavioral functioning inventory for adults with traumatic brain injury. Arch Phys Med Rehabil 77; 116-124.
Krupp L.B., LaRocca N.G., Muir-Nash, J. & Steinberg A.D. (1989) The Fatigue Severity Scale: Application to patient with Multiple Sclerosis and Systemic Lupus Erythematosus. Arch Neurol 46, 1121-1123.
Kuipers P., Kendall M., Fleming J. & Tate R. (2004) Comparison of the Sydney Psychosocial Reintegration Scale (SPRS) with the Community Integration Questionnaire (CIQ): psychometric properties. Brain Injury18;161-177.
Kwon S., Hartzema A.G., Duncan P.W. & Lai S.M. (2004) Disability measures in stroke. Relationship among the Barthel Index, the functional ndependence Measure and the Modified Rankin Scale. Stroke 35; 918-923.
Labi M.L., Brentjens M., Shaffer K., Weiss C., Zielezny M.A.. Functional (1998) Cognition Index: A new instrument to assess cognitive disability after traumatic brain injury. J Neuro Rehabil 12; 45-52.
LaChapelle D.L & Finlayson M.A. (1998) An evaluation of subjective and objective measures of fatigue in patients with brain injury and healthy controls. Brain Injury 12(8), 649-659.
Lai S.M., Perera S., Duncan P.W. & Bode R.K. (2003) Physical and social functioning after stroke: Comparison of the Stroke Impact Scale and Short Form-36. Stroke 34; 488-493.
Law M. (2002).Evidence-based Rehabilitation. A Guide to Practice. Thorofare, NJ: Slack Press,
Levin H.S, O'Donnell V.M. & Grossman R.G. (1979) The Galveston Orientation and Amnesia Test. A practical scale to assess cognition after head injury. Journal of Nervous and Mental Disease 167; 675-684.
Levin HS, Boake C, Song J., McCauley S., Contand C., Diaz-Marchan P., Brundage S. et al. (2001) Validity and sensitivity to change of the extended Glasgow Outcome Scale in mild to moderate traumatic brain injury. Journal of Neurotrauma 18(5); 575-584.
Lewis G. & Wessely S. (1990) Comparison of the General Health Questionniare and the Hospital Anxiety and Depression Scale. British Journal of Psychiatry 157, 860-864.
Lezak M.D. (1987) Relationships between personality disorders, social disturbances and physical disability following traumatic brain injury. J Head Trauma Rehabil 2(1); 57-69.
Linacre J.M., Heinemann A.W., Wright B.D., Granger C.V. & Hamilton BB. (1994) The structure and stability of the Functional Independence Measure. Arch Phys Med Rehabil 75; 127-132.
Lindsay K.W., Carlin J., Kennedy I., Fry J., McInnes A. & Teasdale G. (1981) Evoked potentials in severe head injury -- analysis and relation to outcome. Journal of Neurology, Neurosurgery and Psychiatry 44; 796-802.
Lisspers J., Nygren A. & Soderman, E. (1997) Hospital Anxiety and Depression Scale (HAD): some psychometric data for a Swedish sample. Acta Psychiatr Scand 96, 281-286.

Evidence-Based Review of Moderate to Severe Acquired Brain Injury 2013
90 Module 17-Assessment of Outcomes Following Acquired/Traumatic Brain Injury-V9-2013 www.abiebr.com Updated August 2013
Liston R. & Brouwer B.J. (1996) Reliability and validity of measures obtained from stroke patients using the balance master. Arch Phys Med Rehabil 77; 425-430.
Lorentz W.J., Scanlan J.M. & Borson S. (2002) Brief screening tests for dementia. Canadian Journal of Psychiatry 47; 723-733.
Lowry M. (1999) The Glasgow Coma Scale in clinical practice: a critique. Nursing Times 95; 40-42.
Lucas R.E., Diener E. & Suh E. (1996) Discriminant validity of well-being measures. J Pers Soc Psychol 71; 616-628.
Maas A.I., Braakman R., Schouten H.J., Minderhoud J.M., van Zomeren A.H. (1983) Agreement between physicians on assessment of outcome following severe head injury. J Neurosurg 58; 321-325.
MacKenzie EJ, McCarthy ML, Ditunno JF, Forrester-Staz C., Gruen G.S., Marion D.W. & Schwab,W.C. (2002) Using the SF-36 for characterizing outcome after multiple trauma involving head injury. J Trauma 52; 527-534. Malec JF. (1992) Thompson JM. Relationship of the Mayo-Portland Adaptability Inventory to functional outcome and cognitive performance measures. Journal of Head Trauma Rehabilitation 9; 1-15.
Malec J.F., Moessner A.M., Kragness M. & Lezak M.D. (2000) Refining a measure of brain injury sequelae to predict postacute rehabilitation outcome: Rating scale analysis of the Mayo-Portland Adaptability Inventory. Journal of Head Trauma Rehabilitation 15; 670-682.
Malec J.F., Buffington A., Moessner A.M. & Degiorgio L. (2000) A medical/vocational case coordination system for persons with brain injury: an evaluation of employment outcomes. Arch Phys Med Rehabil 81; 1007-1015.
Malec J.F. (2001) Impact of comprehensive day treatment on societal participation for persons with acquired brain injury. Arch Phys Med Rehabil 82; 885-895.
Malec J.F. & Degiorgio L. (2002) Characteristics of successful and unsuccessful completers of 3 postacute brain injury rehabilitation pathways. Arch Phys Med Rehabil 83; 1759-1764.
Malec J.F., Lezak M.D. Manual for The Mayo-Portland Adaptability Inventory (MPAI-4) 1-77.
Malec J.F., Kragness M., Evans R.W., Finlay K.L,. Kent A. & Lezak MD. (2003) Further psychometric evaluation and revision of the Mayo-Portland Adaptability Inventory in a national sample. Journal of Head Trauma Rehabilitation 18; 479-492.
Malec J.F. (2004) The Mayo-Portland Participation Index: A brief and psychometrically sound measure of brain injury outcome. Arch Phys Med Rehabil 85; 1989-1996.
Malec J.F. (2004) Comparability of Mayo-Portland Adaptability Inventory ratings by staff, significant others and people with acquired brain injury. Brain Injury 18: 563-575.
Mao H.F., Hsueh I.P., Tang P.F., Sheu C.F. & Hsieh C.L. (2002) Analysis and comparison of the psychometric properties of three balance measures for stroke patients. Stroke 33; 1022-1027.

Evidence-Based Review of Moderate to Severe Acquired Brain Injury 2013
91 Module 17-Assessment of Outcomes Following Acquired/Traumatic Brain Injury-V9-2013 www.abiebr.com Updated August 2013
Marion D.W. & Carlier P.M. (1994) Problems with initial Glasgow Coma Scale assessment caused by prehospital treatment of patients with head injuries: results of a national survey. Journal of Trauma 36; 89-95.
Massagli T.L., Michaud L.J. & Rivara F.P. (1996) Association between injury indices and outcome after severe traumatic brain injury in children. Arch Phys Med Rehabil 77; 125-132.
Mayo N., Wood-Dauphinee S., Cote R., Durcan L. & Carlton J. (2002) Activity, participation & quality of life 6 months post-stroke. Arch Phys Med Rehabil 83; 1035-1042.
McCauley S.R., Hannay H.J. & Swank P.R. (2001) Use of the Disability Rating Scale recovery curve as a predictor of psychosocial outcome following closed head injury. Journal of the International Neuropsychological Society 7; 457-467.
McCullagh S., Ouchterlony D., Protzner A., Blair N. & Feinstein A. (2001) Prediction of neuropsychiatric outcome following mild trauma brain injury: an examination of the Glasgow Coma Scale. Brain Injury 15; 489-497.
McDowell I. (2006) Measuring Health. A Guide to Rating Scales and Questionnaires 3rd
ed. New York: Oxford University Press,
McHorney C.A., Ware J.E. Jr & Raczek A.E. (1993) The MOS 36-item short form health survey (SF-36) II: Psychometric and clinical tests of validity in measuring physical and mental health constructs. Medical Care 31; 247-263.
McHorney C.A. (1996) Measuring and monitoring general health status in elderly persons: practical and methodological issues in using the SF-36 health survey. The Gerontologist 36; 571-583.
McIntosh C.N. (2001) Report on the construct validity of the temporal satisfaction with life scale. Social Indicators Research 54; 37-56.
McNaughton H.K., Weatherall M. & McPherson K.M. (2005) Functional measures across neurologic disease states: analysis of factors in common. Arch Phys Med Rehabil 86; 2184-2188.
McPherson K.M., Pentland B., Cudmore S.F., Prescott R.J. (1996) An inter-rater reliability stud of the Functional Assessment Measure (FIM+FAM) Disabil Rehabil 18; 341-347.
McPherson K.M. & Pentland B. (1997) Disability in patients following traumatic brain injury -- which measure? International Journal of Rehabilitation Research 20; 1-10.
Meyer C, Rumpf HJ, Hapke U, John U. (2004) Impact of psychiatric disorders in the general population: satisfaction with life and the influence of comorbidity and disorder duration. Soc Psychiatry Psychiatr Epidemiol 39; 435-441.
Miller R.J., Young C.A., Nicholas R.S., Pallant J.F & Tennant A. (2009). Rasch analysis of the fatigue severity scale in multiple sclerosis. Multiple Sclerosis 15, 81-87.
Mills R.J., Young C.A., Nicholas R.S., Pallant J.F. & Tennant A. (2009). Rasch analysis of the Fatigue Severity Scale in Multiple Sclerosis. Multiple Sclerosis, 15, 81-87.
Molloy D.W. & Standish T.I. (1997) A guide to the standardized Mini Mental State Examination. International Psychogeriatrics 9; 87-94

Evidence-Based Review of Moderate to Severe Acquired Brain Injury 2013
92 Module 17-Assessment of Outcomes Following Acquired/Traumatic Brain Injury-V9-2013 www.abiebr.com Updated August 2013
Mossberg K. & McFarland C. (2001) A patient-oriented health status measure in outpatient rehabilitation. Am J Phys Med Rehabil 80; 896-902.
Mykletun A., Stordal E. & Dahl A.A. (2001) Hospital anxiety and depression (HAD) scale: factor structure, item analyses and internal consistency in a large population. British Journal of Psychiatry 179, 540-544.
Mysiw W.J., Corrigan J.D., Hunt M., Cavin D. & Fish T. (1989) Vocational evaluation of traumatic brain injury patients using the functional assessment inventory. Brain Injury 3; 27-34.
Nakamura D., Holm M. & Wilson A. (1998) Measures of balance and fear of falling in the elderly: A review. Physical and Occupational Therapy in Geriatrics 15; 17-32.
Neese L.E., Caroselli J.S., Klaas P., High W.M.Jr., Becker L.J. & Scheibel R.S. (2000) Neuropsychological assessment and the Disability Rating Scale (DRS); a concurrent validity study. Brain Injury 14; 719-724.
Neto F. (1993) The Satisfaction with Life Scale: psychometrics properties in an adolescent sample. Journal of Youth and Adolescence 22; 125-134.
Newkirk L.A., Kim J.M., Thompson J.M., Tinklenberg J.R., Yesavage J.A. & Taylor JL. (2004) Validation of a 26-Point Telephone Version of the Mini-Mental State Examination. Journal of Geriatric Psychiatry and Neurology 17; 81-87.
NIDRR Traumatic Brain Injury Model Systems. Center for Outcome Measurement in Brain Injury. Santa Clara Valley Medical Centre (2004) http://tbims.org/combi.
Novack T.A., Bergquist T.F., Bennett G. & Gouvier W.D. (1991) Primary caregiver distress following severe head injury. J Head Trauma Rehabil 6; 69-77.
Novack T.A., Dowler R.M., Bush B.A., Glen T. & Schneider J.J. (2000) Validity of the Orientation Log, relative to the Galveston Orientation and Amnesia Test. Journal of Head Trauma Rehabilitation 15; 957-961. Ocampo S. & Dawson D. (1997) Outcomes after head injury: level of agreement between subjects and their informants. Occup Ther Int 4; 163-179.
Oczkowski W. & Barreca S. (1993) The Functional Independence Measure: Its use to identify rehabilitation needs in stroke survivors. Arch Phys Med Rehabil 74; 1291-1294.
Oppenheim J.S. & Camins M.B. (1992) Predicting outcome in brain-injured patients: using the Glasgow Coma Scale in primary care practice. Brain Injury 91; 261-269.
Ottenbacher K.J., Hsu Y., Granger C.V. & Fiedler R.C. (1996) The reliability of the Functional Independence Measure: A quantitative review. Arch Phys Med Rehabil 77; 1226-1232.
Ozdemir F., Birtane M., Tabatabaei R., Ekuklu G. & Kokino S. (2001) Cognitive evaluation and functional outcome after stroke. A J of Phys Med and Rehab 80; 410-415.
Paniak C., Phillips K., Toller-Lobe G., Durand A. & Nagy J. (1999) Sensitivity of three recent questionnaires to mild traumatic brain injury-related effects. J Head Trauma Rehabil 14; 211-219.

Evidence-Based Review of Moderate to Severe Acquired Brain Injury 2013
93 Module 17-Assessment of Outcomes Following Acquired/Traumatic Brain Injury-V9-2013 www.abiebr.com Updated August 2013
Pastorek N.J., Hannay H.J. & Contant C.S. (2004) Prediction of global outcome with acute neuropsychological testing following closed-head injury. Journal of the International Neuropsychological Society 10; 807-817.
Pavot W., Diener E., Colvin C.R. & Sandvik E. (1991) Further validation of the Satisfaction with Life Scale: evidence for the cross-method convergence of well-being measures. J Pers Assess 57; 149-161.
Pavot W . & Diener E. (1993) Review of the Satisfaction with Life Scale. Psychological Assessment 5; 164-172.
Pavot W., Diener E. & Suh E. (1998) The temporal satisfaction with life scale. J Pers Assess 70; 340-354.
Petrella R.J., Overend T. & Chesworth B. (2002) FIM after hip fracture: Is telephone administration valid and sensitive to change? Am J Phys Med Rehabil 81; 639-644.
Pettigrew L.E., Wilson J.T. & Teasdale G.M. (1998) Assessing disabiilty after head injury: improved use of the Glasgow Outcome Scale. J Neurosurg 89; 939-943.
Pettigrew L.E., Wilson J.T. & Teasdale G.M. (2003) Reliability of ratings on the Glasgow Outcome Scales from in-person and telephone structured interviews. Journal of Head Trauma Rehabilitation 18; 252-258.
Pierre U., Wood-Dauphinee S., Korner-Bitensky N., Gayton D. & Hanley J. (1998) Proxy use of the Canadian SF-36 in rating health status of the disabled elderly. J Clin Epidemiol 51; 983-990.
Prasad K. (1999) The Glasgow Coma Scale: A critical appraisal of its clinimetric properties. J Clin Epidemiol 49; 755-763.
Rao N & Kilgore K.M. (1992) Predicting return to work in traumatic brain injury using assessment scales. Arch Phys Med Rehabil 73; 911-916.
Rappaport M., Hall K.M., Hopkins K., Belleza T. & Cope DN. (1982) Disability Rating Scale for severe head trauma: Coma to community. Arch Phys Med Rehabil 63; 118-123.
Riddle D.L., Stratford P. W. (1999) Interpreting validity indexes for diagnostic tests: an illustration using the Berg Balance Test. Physical Therapy 79; 939-948.
Ring H, Feder M, Schwartz J, Samuels G. Functional measures of first-stroke rehabilitation inpatients: Usefulness of the Functional Independence Measure total score with a clinical rationale. Arch Phys Med Rehabil 1997;78:630-635.
Roberts L, Counsell R. Assessment of clinical outcomes in acute stroke trials. Stroke 1998;28:986-991.
Roccaforte WH, Burke WJ, Bayer BL, Wengel SP. Validation of a telephone version of the mini-mental state examination. Journal of the American Geriatrics Society 1992;40:697-702.
Rosati DL. Early polyneuropharmacologic intervention in brain injury agitation. Am J Phys Med Rehabil 2002;81:90-93.
Rowley G, Fielding K. Reliability and accuracy of the Glasgow Coma Scale with experienced and inexperienced users. Lancet 1991;337:535-538.

Evidence-Based Review of Moderate to Severe Acquired Brain Injury 2013
94 Module 17-Assessment of Outcomes Following Acquired/Traumatic Brain Injury-V9-2013 www.abiebr.com Updated August 2013
Ruchinskas RA, Curyto KJ. Cognitive screening in geriatric rehabilitation. Rehabilitation Psychology 2003;48:14-22.
Rush BK, Malec JF, Moessner AM, Brown AW. Preinjury personality traits and the prediciton of early neurobehavioral symptoms following mild traumatic brain injury. Rehabilitation Psychology 2004;49:275-281.
Rutledge R, Lentz CW, Fakhry S, Hunt J. appropriate use of the Galsgow coma Scale in intubated patients: a linear regression prediction of the Glasgow verbal socre from the Glasgow eye and motor scores. The Journal of Trauma: Injury, Infection and Critical Care 1996;41:514-522.
Sander AM, Kreutzer JS, Fernandez CC. Neurobehavioral functioning, substance abuse and employment after brain injury: implications for vocational rehabilitation. J Head Trauma Rehabil 1997;12:28-41.
Sander A.M., Seel R.T., Kreutzer J.S., Hall K.M., High W.M.Jr. & Rosenthal M. (1997) Agreement between persons with traumatic brain injury and their relatives regarding psychosocial outcome using the Community Integration Questionnaire. Arch Phys Med Rehabil 78(4), 353-357.
Sander A.M., Fuchs K.L., High W. M. Jr., Hall K.M., Kreutzer J.S., Rosenthal M. (1999) The Community Integration Questionnaire revisited: An assessment of factor structure and validity. Arch Phys Med Rehabil 80; 1303-1308.
Satz P, Zaucha K, Forney DL, McCleary C., Asarnow R.F,., Light, R. Levin H., et al. (1998) Neuropsychological, psychosocial and vocational correlates of the Glasgow Outcome Scale at 6 months post-injury: a study of moderate to severe traumatic brain injury patients. Brain Injury 12(7); 555-567.
Schepers, V. P., Visser-Meily, A. M., Ketelaar, M. & Lindeman, E. (2006) Poststroke fatigue : course and its relation to personal and stroke-related factors. Arch Phsy Med Rehabil 87(2), 184-188.
Schonberger M. & Ponsford J. (2010) The factor structure of the Hospital Anxiety and Depression Scale in individuals with traumatic brain injury. Psychiatry Research 179, 342-349.
Seale G.S., Caroselli J.S., High W.M. Jr., Becker C.L., Neese L.E. & Scheibel R. (2002) Use of the Community Integration Questionnaire (CIQ) to characterize changes in functioning for individuals with traumatic brain injury who participated in a post-acute rehabilitation programme. Brain Injury 16: 955-967.
Seel R.T., Kreutzer J., Sander A.M.(1997) Concordance of patients' and family members' rating of neurobehavioral functioning after traumatic brain injury. Arch Phys Med Rehabil 7,:1254-1259.
Seel R.T. & Kreutzer J. (2003) Depression assessment after traumatic brain injury: An empirically based classification method. Arch Phys Med Rehabil 84,1621-1628.
Segal M.E., Gillard M. & Schall R.R. (1996) Telephone and in-person proxy agreement between stroke patients and caregivers for the Functional Independence Measure. American Journal of Physical Medicine and Rehabilitation 75; 208-212.
Segal M.E. & Schall R.R.(1994) Determining funcitonal/health status and its relation to disability in stroke survivors. Stroke 25, 2391-2397.
Shevlin M,, Brunsden V. & Miles J.N. (1998) Satisfaction with Life Scale: analysis of factorial invariance, mean structures and reliability. Personality and Individual Differences 25, 911-916.
Evidence-Based Review of Moderate to Severe Acquired Brain Injury 2013
95 Module 17-Assessment of Outcomes Following Acquired/Traumatic Brain Injury-V9-2013 www.abiebr.com Updated August 2013
Shumway-Cook A., Baldwin M., Polissar N.L. & Gruber W. (1997) Predicting the probability for falls in community-dwelling older adults. Phys Ther 77(8), 812-819.
Singh A, Black SE, Herrmann N, et al. Functional and neuroanatomic correlations in post-stroke depression. The Sunnybrook Stroke Study. Stroke 2000;31:637-644.
Smith P.M., Illig S.B., Fielder R.C., Hamilton B.B. & Ottenbacher K.J.(1996) Intermodal agreement of follow-up telephone functional assessment using the functional independence measure in patients with stroke. Arch Phys Med Rehabil 7(5), 431-435.
Snaith R.P. (2003) The Hospital Anxiety and Depression Scale. Health and Quality of Life Outcomes 1(29). http://www.hqlo.com/content/1/1/29.
Sternbach G.L. (2000) The Glasgow Coma Scale. Journal of Emergency Medicine 19, 67-71.
Stevenson T.J. (2001) Detecting change in patients with stroke using the Berg Balance Scale. Australian Journal of Physiotherapy 47, 29-38.
Suh E., Diener E. & Fujita F. (1996) Events and subjective well-being: only recent events matter. J Pers Soc Psychol 70, 1091-1102.
Suhr JA, Grace J. Brief cognitive screening of right hemisphere stroke: relation to functional outcome. Archives of Physical Medicine and Rehabilitation 1999;80:773-776.
Taylor, R.R., Jason. L.A. & Torres, A. Fatigue rating scale : An empirical comparison (2000) Psychological Medicine 20, 849-856.
Teasdale G. & Jennett B. (1974) Assessment of coma and impaired consciousness. A practical scale. Lancet 2, 45-55.
Teasdale G., Knill-Jones R. & Van Der Sande J. (1978) Observer variability in assessing impaired consciousness and coma. Journal of Neurology, Neurosurgery and Psychiatry 41, 603-610.
Teasdale G., Jennett B., Murray L. & Murray G. (1983) Glasgow Coma Scale: to sum or not to sum? [letter]. Lancet 2, 678.
Teasdale G.M., Pettigrew L.E., Wilson J.T., Murray G. & Jennett B. (1998) Analyzing outcome of treatment of severe head injury: A review and update on advancing the use of the Glasgow Outcome Scale. Journal of Neurotrauma 15, 587-597.
Teasdale G.M. & Murray L.(2000) Revisiting the Glasgow Coma Scale and Coma Score. Intensive Care Medicine 26,153-154.
Teng E.L. & Chui H.C. (1987) The modified Mini-Mental State (3MS) Examination. Journal of Clinical Psychiatry 48, 314-318.
Teoh L.S., Gowardman J.R,, Larsen P.D, Green R. & Galletty D.C. (2000) Glasgow Coma Scale: variation in mortality among permutations of specific total scores. Intensive Care Medicine 26, 157-161.
Tepper S., Beatty P. & DeJong G. (1996) Outcomes in traumatic brain injury: self-report versus report of significant others. Brain Injury 10, 575-581.
Evidence-Based Review of Moderate to Severe Acquired Brain Injury 2013
96 Module 17-Assessment of Outcomes Following Acquired/Traumatic Brain Injury-V9-2013 www.abiebr.com Updated August 2013
Timmons M., Gasquoine L. & Scibak J.W. (1987) Functional changes with rehabilitation of very severe traumatic brain injury survivors. J Head Trauma Rehabil 2, 64-73.
Tombaugh T.N. & McIntyre N.J. (1992) The Mini-Mental State Examination: A comprehensive review. Journal of the American Geriatric Society 40(9), 922-935.
Truell J-L., Koskinen, S., Hawthorne, G., Sarajuuri, J., Formisano, R. von Wild, K. et al., (2010) Quality of life after traumatic brain injury: the clinical use of the QOLIBRI, a novel disease-specific instrument. Brain injury 24(11),1272-1291.
Turner-Stokes L., Nyein K., Turner-Stokes T. & Gatehouse C. (1999) The UK FIM+FAM: development and evaluation. Clinical Rehabilitation 13, 277-287.
Udekwu P., Kromhout-Schiro S., Vaslef S., Baker C. & Oller D. (2004) Glasgow Coma Scale score, mortality and functional outcome in head-injured patients. Journal of Trauma, Injury, Infection and Critical Care 56, 1084-1089.
Van Baalan B., Odding E., Maas A.I., Ribbers G.M., Bergen M.P. & Stam H.J. Traumatic brain injury: classification of initial severity and determination of functional outcome. Disabil Rehabil 2003, 25:9-18.
van der Putten J.M., Hobart J.C., Freeman J.A. & Thompson A.J.(1999) Measuring change in disability after inpatient rehabilitation: comparison of the responsiveness of the Barthel Index and the Functional Independence Measure. J Neurol Neurosurg Psychiatry 66, 480-484.
Vitaliano P.P., Russo J., Young H.M., Becker J. & Maiuro R.D. (1991) The screen for caregiver burden. Gerontologist 31, 76-83.
von Steinbuechel, N., Richter, S., Morawetz, C. & Riemsma, R. (2005) Assessment of subjective health and health-related quality of life in persons with acquired or degenerative brain injury. Current Opinion Neurology 18(6), 681-691.
von Steinbuechel, N., Petersen, C., Bullinger, M & the QOLIBRI Group. (2005) Assessment of health-related quality of life in persons after traumatic brain injury-development of QOLIBRI, a specific measure. Acta Neurochir 9(Suppl), 43-49.
von Steinbuchel, N., Wilson, L, Gibbons, H., Hawthrone, G., Hofer, S., Schmidt S., Bullinger, M. et al., (2010a) Quality of life after brain injury (QOLIBRI) scale development and metric properties. Journal of Neurotrauma 27(7), 1167-1185.
von Steinbuchel, N., Wilson, L, Gibbons, H., Hawthrone, G., Hofer, S., Schmidt S., Bullinger, M. et al., (2010b) Quality of life after brain injury (QOLIBRI) scale calidity and correlated of quality of life Journal of Neurotrauma 27(7), 1167-1185.
Wade D.T. (1992) Measurement in neurological rehabilitation. New York: Oxford University Press.
Wagner, A. K. (2001) Functional prognosis in traumatic brain injury. Physical Medicine and Rehabilitation: State of the Art Reviews 15, 245-266.
Wallace D., Duncan P.W. & Lai S.M. (2002) Comparison of the responsiveness of the Barthel Index and the motor component of the Functional Independence Measure in stroke: the impact of using different methods for measuring responsiveness. J Clin Epidemiol 55, 922-928.
Evidence-Based Review of Moderate to Severe Acquired Brain Injury 2013
97 Module 17-Assessment of Outcomes Following Acquired/Traumatic Brain Injury-V9-2013 www.abiebr.com Updated August 2013
Walters S.J., Munro J.F. & Brazier J.E. (2001) Using the SF-36 with older adults: a cross-sectional community-based survey. Age and Aging 30, 337-343.
Ware J.E. Jr, & Sherbourne C.D. (1992) The MOS 36-item short-form health survey (SF36) I: Conceptual framework and item selection. Medical Care 30, 473-483.
Waxman K., Sundine M.J. & Young R.F. (1991) Is early prediction of outcome in severe head injury possible? Arch Surg 126, 1237-1242.
Wee J.Y., Bagg S.D. & Palepu A. (1999) The Berg Balance Scale as a predictor of length of stay and discharge in an acute stroke rehabilitation setting. Arch Phys Med Rehabil 80(4), 448-452.
Wee J.Y., Wong H. & Palepu A. (2003) Validation of the Berg Balance Scale as a predictor of length of stay and discharge destination in stroke rehabilitation. Arch Phys Med Rehabil 84(5), 731-735.
Weinberger M., Oddone E.Z., Samsa G. & Landsman P.B. (1996) Are health-related quality of life measures affected by the mode of administration? J Clin Epidemiol 49(2), 135-140.
Weinfurt K.P., Willke R., Click H.A. & Schulman K.A. (1999) Towards a composite scoring solution for the Neurobehavioral Functioning Inventory. Quality of Life Research 8(1-2), 17-24.
Westaway M.S., Maritz C. & Golele N.J. (2003) Empirical testing of the Satisfaction With Life Scale: a South African pilot study. Psychol Rep 92(2), 551-554.
Whelan-Goodinson R., Ponsford J. & Schonberger M. (2009) Validity of the Hospital Anxiety and Depression Scale to assess depression and anxiety following traumatic brain injury as compared with the Structured Clinical Interview for DSM-IV. Journal of Affective Disorder 114, 94-102.
Whitney S.L., Poole J.L. & Cass S.P. (1998) A review of balance instruments for older adults. Am J Occup Ther 52(8), 666-671.
Willer B., Rosenthal M., Kreutzer J.S., Gordon W.A. & Rempel R. (1993) Assessment of community integration following rehabilitation for traumatic brain injury. J Head Trauma Rehabil 8(2), 75-87.
Willer B., Ottenbacher K.J. & Coad M.L. (1994) The Community Integration Questionnaire: A comparative examination. Am J Phys Med Rehabil 73(2), 103-111.
Willer B., Button J. & Rempel R. (1999) Residential and home-based postacute rehabilitation of individuals with traumatic brain injury: a case control study. Arch Phys Med Rehabil 80(4), 399-406.
Williams L.S., Weinberger M., Harris L.E. & Biller J. (1999) Measuring quality of life in a way that is meaningful to stroke patients. Neurology 53(8), 1839-1843.
Wilson J.T., Pettigrew L.E. & Teasdale G.M. (1998) Structured interviews for the Glasgow Outcome Scale and the Extended Glasgow Outcome Scale: Guidelines for their use. Journal of Neurotrauma 15(8), 573-585.
Wilson J.T., Pettigrew L.E. & Teasdale G.M. (2000) Emotional and cognitive consequences of head injury in relation to the Glasgow outcome scale. Journal of Neurology, Neurosurgery and Psychiatry 69(2), 204-209.
Wilson J.T., Edwards P., Fiddes H., Stewart E. & Teasdale G.M. (2002) Reliability of post questionnaires for the Glasgow Outcome Scale. Journal of Neurotrauma 19(9), 999-1005.

Evidence-Based Review of Moderate to Severe Acquired Brain Injury 2013
98 Module 17-Assessment of Outcomes Following Acquired/Traumatic Brain Injury-V9-2013 www.abiebr.com Updated August 2013
Witol A.D., Kreutzer J.S. & Sander A.M. (1999) Emotional, behavioral and personality assessment after traumatic brain injury. In:Rosenthal M, Kreutzer J S, Griffith E R, Pentland B, eds. Rehabilitation of the Adult and Child with Traumatic Brain Injury. Philadelphia, PA: F.A. Davis Company, 167-182.
Wolfe C.D., Taub N.A., Woodrow E.J. & Burney P.G. (1991) Assessment of scales of disability and handicap for stroke patients. Stroke 22(10), 1242-1244.
Wood-Dauphinee S., Berg K.O., Bravo G. & Williams J.L. (1997) The Balance Scale: responsiveness to clinically meaningful changes. Can J Rehab 10, 35-50.
World Health Organization. (2001) International Classification of Functioning, Disability and Health: ICF. Geneva: World Health Organization.
Young B., Rapp R.P., Norton J.A., Haack D., Tibbs P.A. & Bean J.R. (1981) Early prediction of outcome in head-injured patients. J Neurosurg 54, 300-303.
Zafonte R.D., Hammond F., Mann N.R., Wood D.L., Black K.L. & Millis S.R. (1996) Relationship between Glasgow Coma Scale and functional outcome. Am J Phys Med Rehabil 75, 364-369.
Zafonte R.D., Mann N.R., Millis S.R., Black K.L., Wood D.L. & Hammond F. (1997) Posttraumatic amnesia: its relation to functional outcome. Arch Phys Med Rehabil 78, 1103-1106.
Zhang L., Abreu B.C., Gonzales V., Seale G,, Masel B. &, Ottenbacher K.J. (2002) Comparison of the Community Integration Questionnaire, the Craig Handicap Assessment and Reporting Technique and the Disability Rating Scale in Traumatic Brain Injury. J Head Trauma Rehabil 17, 497-509.
Zigmond A.S. & Snaith R.P. (1983) The Hospital Anxiety and Depression Scale. Acta Psychiatr Scand 67, 361-370.
Ziino, C. & Ponsford, J. (2005) Measurement and prediction of subjective fatigue following traumatic brain injury. Journal of the International Neuropsychological Society 11, 416-425.
Zwick D., Rochelle A., Choksi A. & Domowicz J. (2000) Evaluation and treatment of balance in the elderly: A review of the efficacy of the Berg Balance Test and Tai Chi Quan. Neurorehabilitation 15, 49-56