Embed Size (px)
Citation preview
172th EAAE SEMINAR INTERNATIONAL EXPERIENCES WITH AGRI-ENVIRONMENTAL POLICY DESIGN AND APPLICATION – SOUTH ASIA Brussels, 29 May 2019
MIO OKA
Director, Environment, Natural Resources & Agriculture Division
South Asia Department, Asian Development Bank (ADB)
OVERVIEW
• Asia’s Outlook
• Agri-Environmental Policies in South Asia
• Policy Application – Our Experience & Way Forward
2
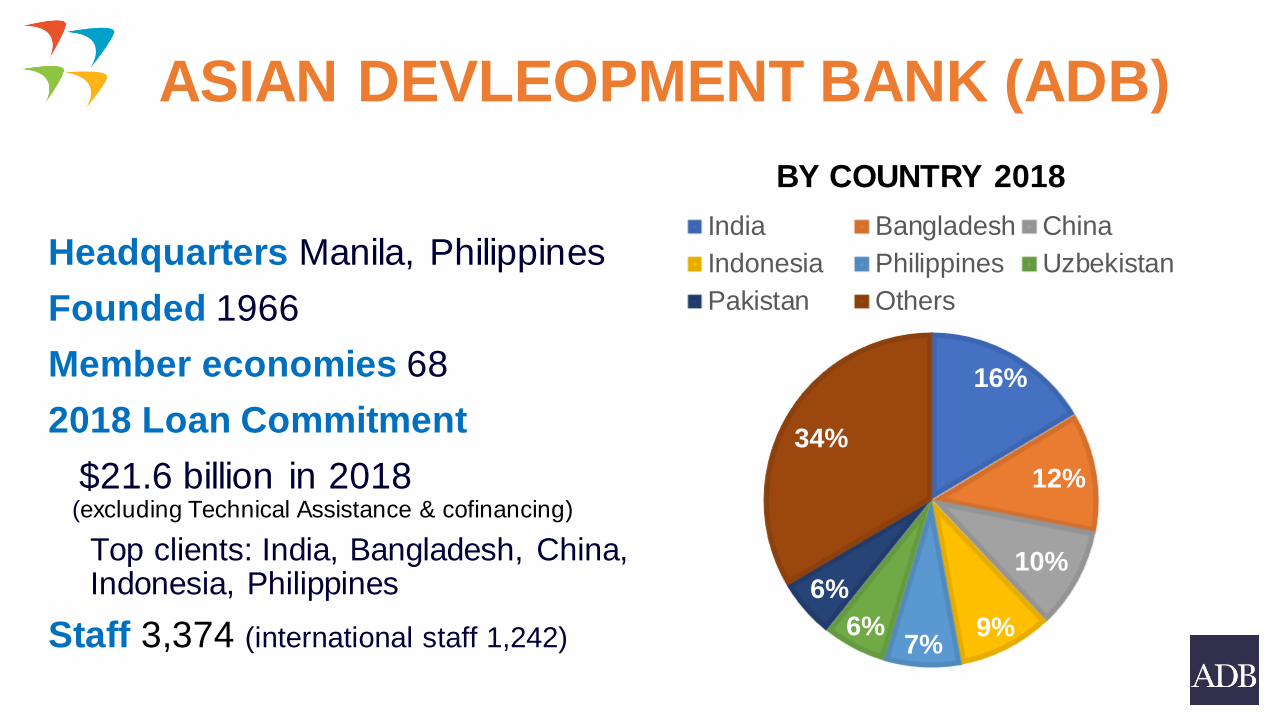
ASIAN DEVLEOPMENT BANK (ADB)
Headquarters Manila, Philippines
Founded 1966
Member economies 68
2018 Loan Commitment
$21.6 billion in 2018 (excluding Technical Assistance & cofinancing)
Top clients: India, Bangladesh, China, Indonesia, Philippines
Staff 3,374 (international staff 1,242)
BY COUNTRY 2018
16%
12%
10%
9% 7%
6%
6%
34%
India Bangladesh China
Indonesia Philippines Uzbekistan
Pakistan Others
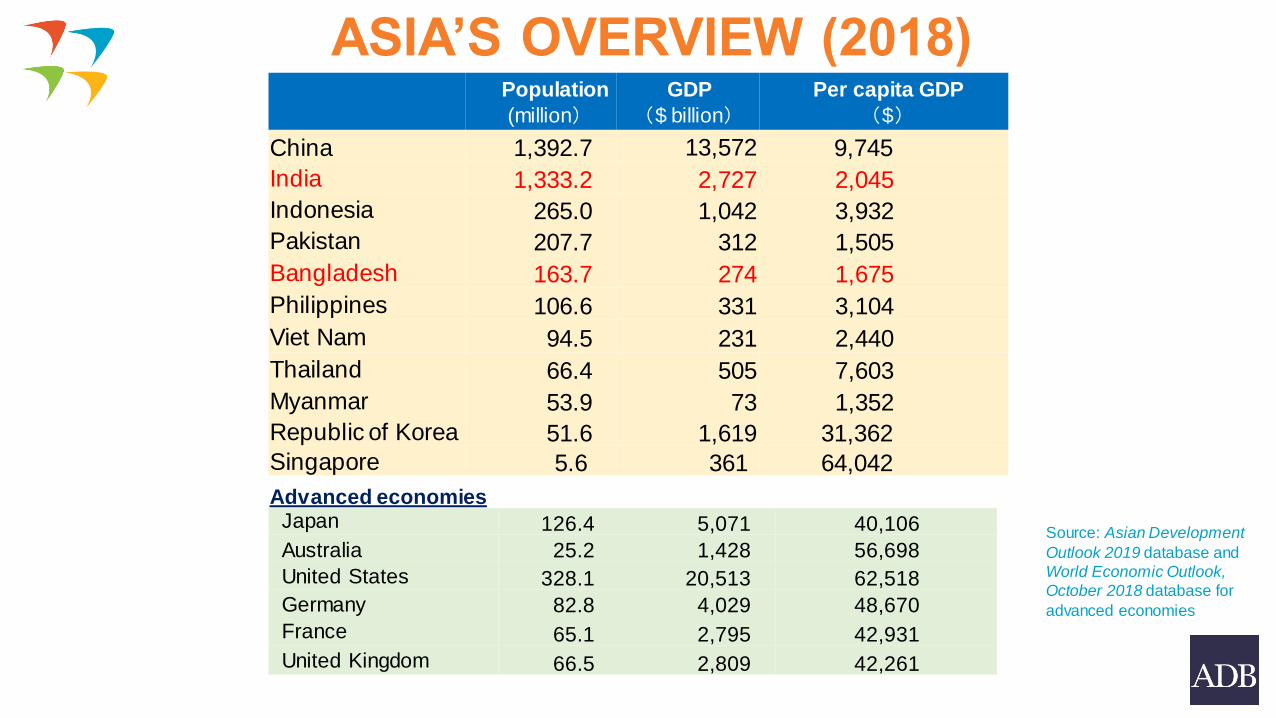
Population
(million)
GDP
($ billion)
Per capita GDP
($)
China 1,392.7 13,572 9,745
India 1,333.2 2,727 2,045
Indonesia 265.0 1,042 3,932
Pakistan 207.7 312 1,505
Bangladesh 163.7 274 1,675
Philippines 106.6 331 3,104
Viet Nam 94.5 231 2,440
Thailand 66.4 505 7,603
Myanmar 53.9 73 1,352
Republic of Korea 51.6 1,619 31,362
Singapore 5.6 361 64,042
Japan 126.4 5,071 40,106
Australia 25.2 1,428 56,698
United States 328.1 20,513 62,518
Germany 82.8 4,029 48,670
France 65.1 2,795 42,931
United Kingdom 66.5 2,809 42,261
Advanced economies
Source: Asian Development
Outlook 2019 database and
World Economic Outlook,
October 2018 database for
advanced economies
ASIA’S OVERVIEW (2018)
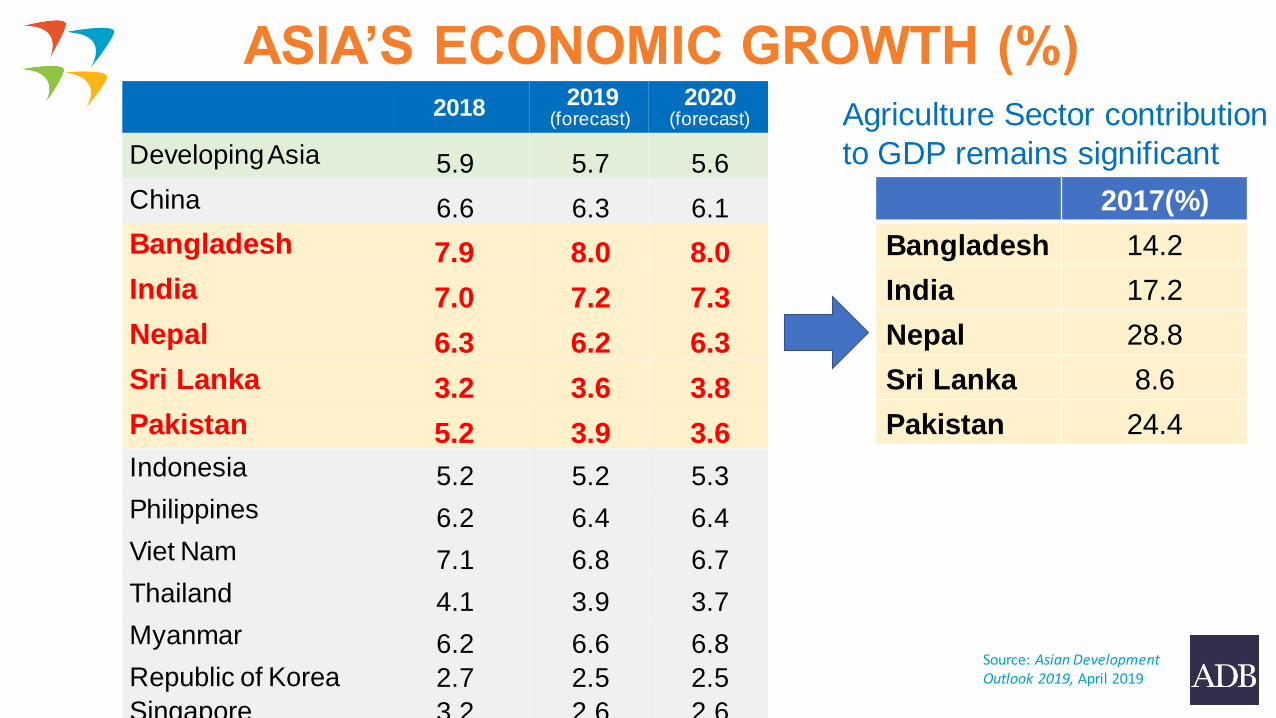
2018 2019 (forecast)
2020 (forecast)
Developing Asia 5.9 5.7 5.6
China 6.6 6.3 6.1
Bangladesh 7.9 8.0 8.0
India 7.0 7.2 7.3
Nepal 6.3 6.2 6.3
Sri Lanka 3.2 3.6 3.8
Pakistan 5.2 3.9 3.6 Indonesia 5.2 5.2 5.3
Philippines 6.2 6.4 6.4
Viet Nam 7.1 6.8 6.7
Thailand 4.1 3.9 3.7
Myanmar 6.2 6.6 6.8
Republic of Korea 2.7 2.5 2.5
Singapore 3.2 2.6 2.6
Source: Asian Development Outlook 2019, April 2019
ASIA’S ECONOMIC GROWTH (%)
2017(%)
Bangladesh 14.2
India 17.2
Nepal 28.8
Sri Lanka 8.6
Pakistan 24.4
Agriculture Sector contribution
to GDP remains significant
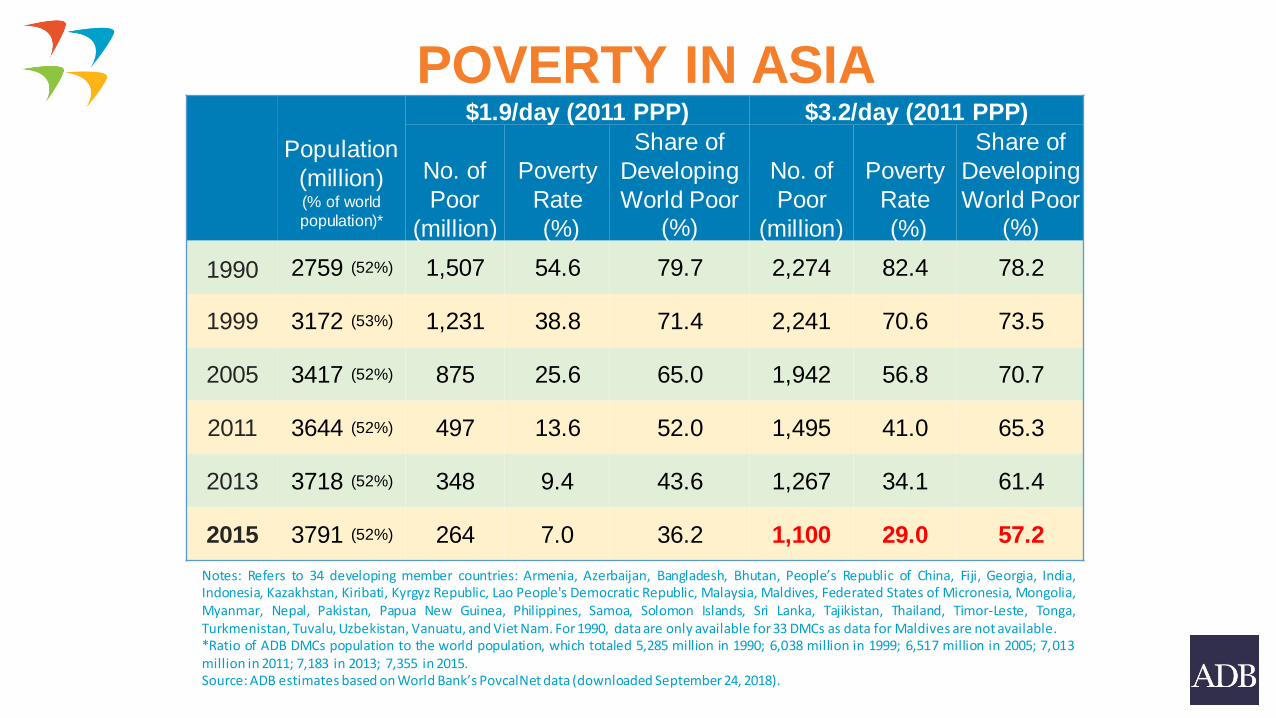
Population
(million) (% of world
population)*
$1.9/day (2011 PPP) $3.2/day (2011 PPP)
No. of
Poor
(million)
Poverty
Rate
(%)
Share of
Developing
World Poor (%)
No. of
Poor
(million)
Poverty
Rate
(%)
Share of
Developing
World Poor (%)
1990 2759 (52%) 1,507 54.6 79.7 2,274 82.4 78.2
1999 3172 (53%) 1,231 38.8 71.4 2,241 70.6 73.5
2005 3417 (52%) 875 25.6 65.0 1,942 56.8 70.7
2011 3644 (52%) 497 13.6 52.0 1,495 41.0 65.3
2013 3718 (52%) 348 9.4 43.6 1,267 34.1 61.4
2015 3791 (52%) 264 7.0 36.2 1,100 29.0 57.2
Notes: Refers to 34 developing member countries: Armenia, Azerbaijan, Bangladesh, Bhutan, People’s Republic of China, Fiji, Georgia, India, Indonesia, Kazakhstan, Kiribati, Kyrgyz Republic, Lao People's Democratic Republic, Malaysia, Maldives, Federated States of Micronesia, Mongolia, Myanmar, Nepal, Pakistan, Papua New Guinea, Philippines, Samoa, Solomon Islands, Sri Lanka, Tajikistan, Thailand, Timor-Leste, Tonga, Turkmenistan, Tuvalu, Uzbekistan, Vanuatu, and Viet Nam. For 1990, data are only available for 33 DMCs as data for Maldives are not available. *Ratio of ADB DMCs population to the world population, which totaled 5,285 million in 1990; 6,038 million in 1999; 6,517 million in 2005; 7,013 million in 2011; 7,183 in 2013; 7,355 in 2015. Source: ADB estimates based on World Bank’s PovcalNet data (downloaded September 24, 2018).
POVERTY IN ASIA
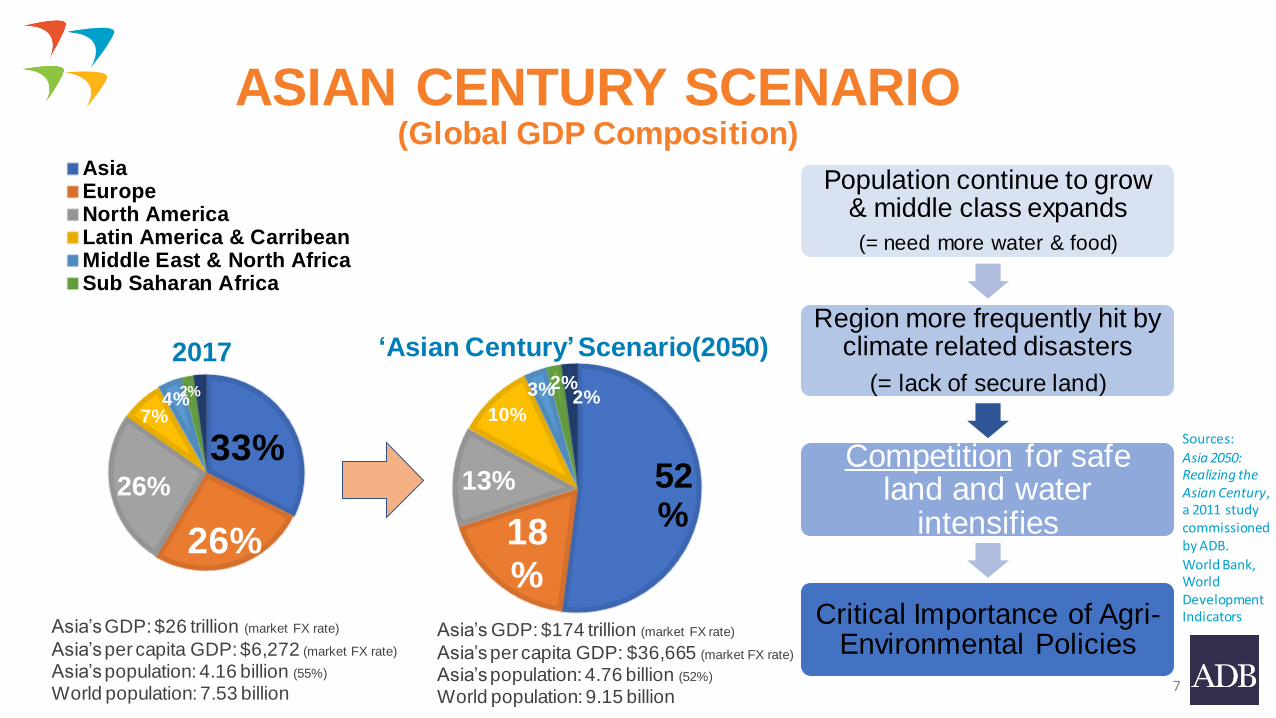
ASIAN CENTURY SCENARIO (Global GDP Composition)
7
Population continue to grow & middle class expands
(= need more water & food)
Region more frequently hit by climate related disasters
(= lack of secure land)
Competition for safe land and water
intensifies
Critical Importance of Agri-Environmental Policies
52%
18%
13%
10%
3% 2% 2%
33%
26%
26%
7% 4%
2%
2%
AsiaEuropeNorth AmericaLatin America & CarribeanMiddle East & North AfricaSub Saharan Africa
2017
Asia’s GDP: $174 trillion (market FX rate)
Asia’s per capita GDP: $36,665 (market FX rate)
Asia’s population: 4.76 billion (52%)
World population: 9.15 billion
Asia’s GDP: $26 trillion (market FX rate)
Asia’s per capita GDP: $6,272 (market FX rate)
Asia’s population: 4.16 billion (55%)
World population: 7.53 billion
‘Asian Century’ Scenario(2050)
Sources:
Asia 2050: Realizing the Asian Century, a 2011 study commissioned by ADB.
World Bank, World Development Indicators
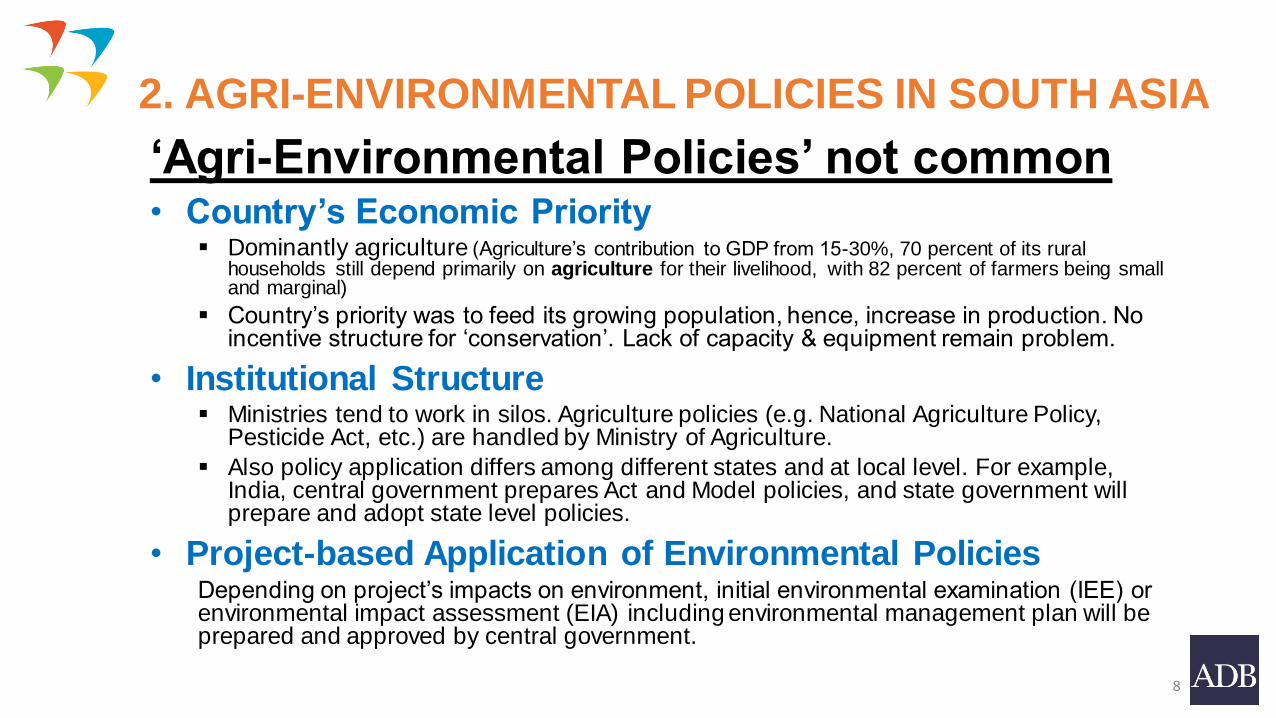
2. AGRI-ENVIRONMENTAL POLICIES IN SOUTH ASIA
‘Agri-Environmental Policies’ not common • Country’s Economic Priority
Dominantly agriculture (Agriculture’s contribution to GDP from 15-30%, 70 percent of its rural households still depend primarily on agriculture for their livelihood, with 82 percent of farmers being small and marginal)
Country’s priority was to feed its growing population, hence, increase in production. No incentive structure for ‘conservation’. Lack of capacity & equipment remain problem.
• Institutional Structure Ministries tend to work in silos. Agriculture policies (e.g. National Agriculture Policy,
Pesticide Act, etc.) are handled by Ministry of Agriculture.
Also policy application differs among different states and at local level. For example, India, central government prepares Act and Model policies, and state government will prepare and adopt state level policies.
• Project-based Application of Environmental Policies Depending on project’s impacts on environment, initial environmental examination (IEE) or environmental impact assessment (EIA) including environmental management plan will be prepared and approved by central government.
8
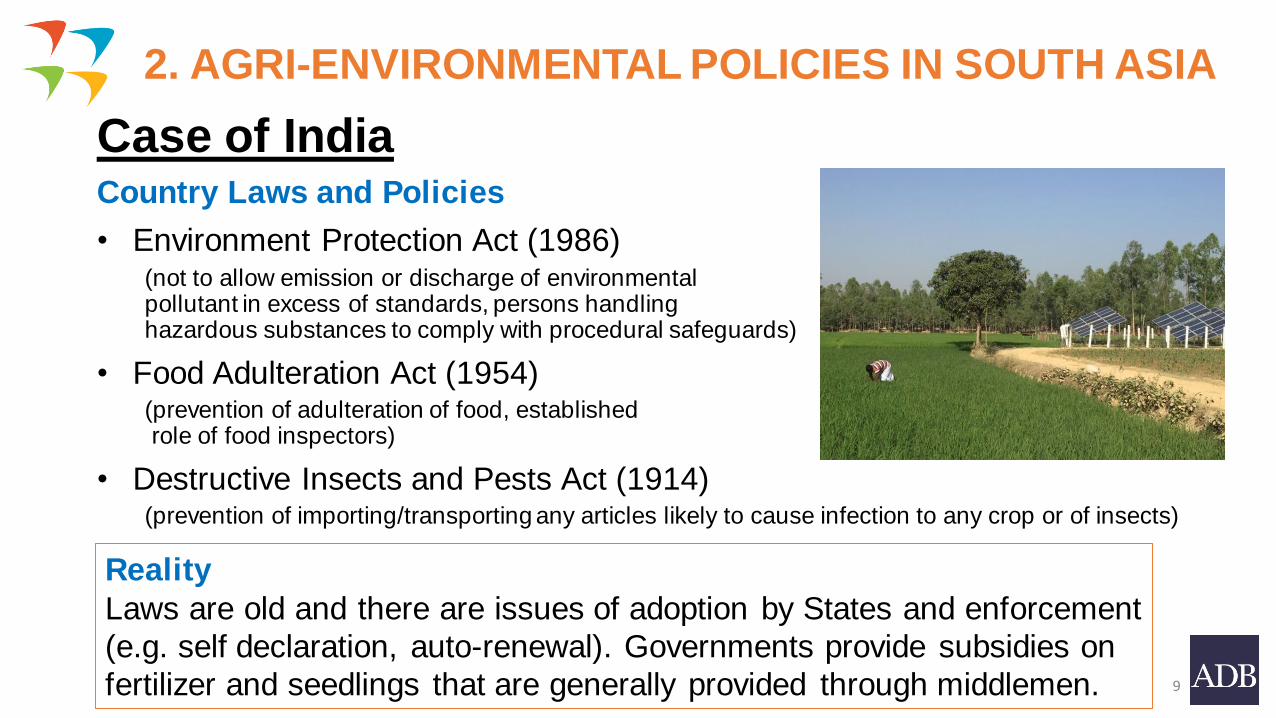
Case of India Country Laws and Policies
• Environment Protection Act (1986) (not to allow emission or discharge of environmental pollutant in excess of standards, persons handling hazardous substances to comply with procedural safeguards)
• Food Adulteration Act (1954) (prevention of adulteration of food, established role of food inspectors)
• Destructive Insects and Pests Act (1914) (prevention of importing/transporting any articles likely to cause infection to any crop or of insects)
9
2. AGRI-ENVIRONMENTAL POLICIES IN SOUTH ASIA
Reality
Laws are old and there are issues of adoption by States and enforcement
(e.g. self declaration, auto-renewal). Governments provide subsidies on
fertilizer and seedlings that are generally provided through middlemen.
Development Partners apply their Policies
ADB’s Safeguard Policy Statement (2009)
• Avoid pollution, or, when avoidance is not possible, minimize or control the intensity or load of pollutant emissions and discharges, including direct and indirect greenhouse gases emissions, waste generation, and release of hazardous materials from their production, transportation, handling, and storage.
• Avoid the use of hazardous materials subject to international bans or phaseouts.
• Purchase, use, and manage pesticides based on integrated pest management approaches and reduce reliance on synthetic chemical pesticides.
Sector Checklist (Agriculture Project’s Environmental Impact Assessment) Project location (cultural heritage, protected area, wetland, national park etc.)
Loss of ecological value & decreased biodiversity
Impact of technology on social & economic activities,
Community health and safety hazards due to the transport, storage and/or disposal of materials such as explosives, fuel, pesticide and other chemicals
Impact of infrastructure (soil erosion & pollution during construction, dust, soil nutrients due to water application, downstream water quality etc.)
10
3. AGRI-ENVIRONMENTAL POLICY APPLICATION
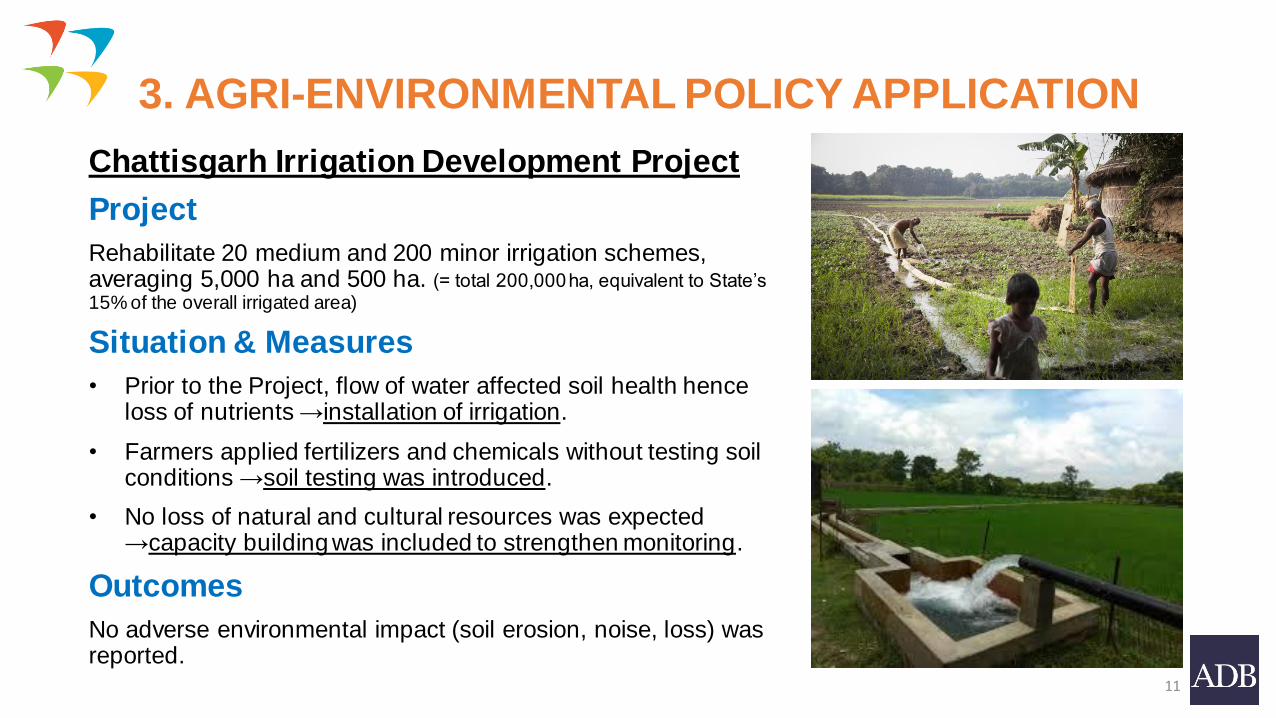
Chattisgarh Irrigation Development Project
Project
Rehabilitate 20 medium and 200 minor irrigation schemes, averaging 5,000 ha and 500 ha. (= total 200,000 ha, equivalent to State’s 15% of the overall irrigated area)
Situation & Measures
• Prior to the Project, flow of water affected soil health hence loss of nutrients →installation of irrigation.
• Farmers applied fertilizers and chemicals without testing soil conditions →soil testing was introduced.
• No loss of natural and cultural resources was expected →capacity building was included to strengthen monitoring.
Outcomes
No adverse environmental impact (soil erosion, noise, loss) was reported.
11
3. AGRI-ENVIRONMENTAL POLICY APPLICATION
Way Forward
Lessons learned Project based application may not effectively improve
country’s overall policy.
Policy Based Lending in Nepal ($50 million loan project, 2019)
• $25M: Introduction of Policy Measures on improving ‘Food Safety and Quality’ and $25M: Adoption by policies by Provincial governments.
• Adoption of (i) Plant Protection Act (revision of 2007); and (ii) Pesticide Management Bill (Pesticide Act of 1991). (Regulate import & export plant or plant products, and Regulate the production, import, export, storage, distribution and use of pesticide and control their adverse effects on human and animal health, and the environment)
• Importance of (i) establishment of Lab facilities; and (ii) capacity building.
12
3. AGRI-ENVIRONMENTAL POLICY APPLICATION
Change of ADB Policy: Strategy 2030 (2018)
Scaling-up targets for climate change mitigation and adaption by 2030
• At least 75% of the number of its committed operations (3-year rolling average)
• $80 billion cumulative in climate finance from ADB’s own resources (2019-2030)
Supporting our DMCs Nationally Determined Contributions (NDCs)
• ADB’s Climate Change Operational Framework 2030 provides the broad direction and guidance
for enhancing resilience and strengthening climate actions
• NDC Advance: Launch a program to enable DMCs to translate their NDCs into climate investment
plans in line with multilateral frameworks such as the Paris Agreement and Sendai Framework for
Disaster Risk Reduction
ADB’s projects already changed (from highways to metro/railways, from
canal construction to solar pumps/pressurized irrigation, more flood and coastal
protection etc.)
3. AGRI-ENVIRONMENTAL POLICY APPLICATION
Future Entry Point
Momentum to Address Climate Change • Competition for scarce resources (water, land and food) & sea level rise
recognized by the Government → Awareness of climate change is finally high, yet to be translated in policies.
• Greater interest in high technology (e.g. precision farming, drip irrigation) in the agriculture sector. → Developing countries can take advantage of technological advances.
• Gradual recognition of green development and sustainable agriculture, particularly in Hill areas and poorer regions. → Recent increase of projects on organic agriculture, sustainable forest management, and biodiversity conservation with use of indigenous knowledge (e.g. fallow cycles).
14
3. AGRI-ENVIRONMENTAL POLICY APPLICATION

THANK YOU For queries, please contact moka@adb (Mio Oka)
15