Embed Size (px)
Citation preview

When you have completed this chapter, you should be able to:
DESCRIBE how ocean temperatures affect weather and climate.
EXPLAIN how ocean moisture creates fogs and hurricanes.
DISCUSS warming events such as El Niño and the greenhouse effect.
Three major “layers” make up the planet Earth. In the last chapter,you learned about two layers: the land, or lithosphere, which is madeup of the core, mantle, and crust, and the water, or hydrosphere,which covers much of the land. In addition, there is the layer of air, or atmosphere, which covers the entire hydrosphere and lithosphere.These different layers interact with one another to produce changes in each part. For example, the wind makes waves. The evaporation of water from the ocean forms clouds. This, in turn, may produceprecipitation over nearby land.
Local, short-term conditions in the atmosphere, such as thehumidity, temperature, and wind velocity, are called weather. Weather varies from place to place and from day to day in any given location. However, large geographical areas have long-termprevailing patterns of weather, called climate.
The ocean exerts a great influence on weather and climate,producing a variety of conditions, from mild sea breezes to violenthurricanes (such as the one shown above). In this chapter, you will see how interactions among the hydrosphere, lithosphere, andatmosphere produce weather and climate changes.
415
17.1Ocean Temperature and Wind
17.2Moisture in the Air
17.3Stormy Weather
17.4The Greenhouse Effect
Climate and the Ocean
THE WATER PLANET
1717

17.1 OCEAN TEMPERATURE AND WIND
As you know, Earth does not have a uniform climate. It is, gener-ally, warmest at the equator and coldest at the poles. Why does thetemperature vary over the surface of the planet? The answer has todo with the rays that Earth receives from the sun—the kinds of rays,the angle at which they strike the surface, what kind of surface theystrike, how they are reflected or absorbed, the time of the year (sea-sons), and Earth’s position in relation to the sun.
Energy from the sun, which is called radiant energy, travelsthrough space as rays (also called radiation). The sun emits differentkinds of radiation. Visible light is one of these forms of radiantenergy.
Some radiant energy that strikes Earth’s surface is absorbed andchanged into heat. The rest is either absorbed by the atmosphere orreflected back into space. The amount of solar energy that reachesany part of the planet depends on the angle at which the rays strikeEarth’s surface, called the angle of insolation. The amount ofenergy that is absorbed as heat depends on conditions in the atmos-phere, physical properties of the surface the rays reach, and theangle of insolation. (See Figure 17-1.)
Solar energy is most intense at the equator because the rays aredirect, that is, they strike Earth at an angle of 90 degrees. Due toEarth’s curvature and tilt on its axis, regions north and south of theequator receive the rays at an angle that is slanted relative to thesurface. Slanted rays are spread out over a larger area than are directrays (which are more concentrated), so slanted rays are less intense.(See Figure 17-2.)
Ocean Temperature
The uneven heating of Earth’s surface causes the ocean’s tempera-ture to vary with latitude. The ocean is warmest at the equator. Asthe distance north and south of the equator increases, the tempera-ture of the ocean’s surface waters generally decreases (not countingeffects of specific ocean currents). The ocean is coldest at the polesbecause those areas have the lowest angle of insolation and receivethe least intense solar heat.
416 The Water Planet

Climate and the Ocean 417
Dust particleabsorption and
scattering
Scatteringand diffusereflection
80% reachesground
45% or lessreaches ground
Absorption in clouds
Cloud reflection
Watervapor
absorption
Ozoneabsorption
Watervapor
absorption
Ozoneabsorption
Clear sky Cloudy sky
Slanted rays
Slanted rays
Direct raysEquator
Sun
Areas A & CArea B
Slanted sun raysspread energy overa larger area,producing less heatDirect sun rays
concentrate energywithin a smallarea, producingmore heat
Sun
A
B
C
Figure 17-1 Absorption ofsolar radiation, in a clearsky and a cloudy sky.
Figure 17-2 Slanted raysare less intense than directrays.
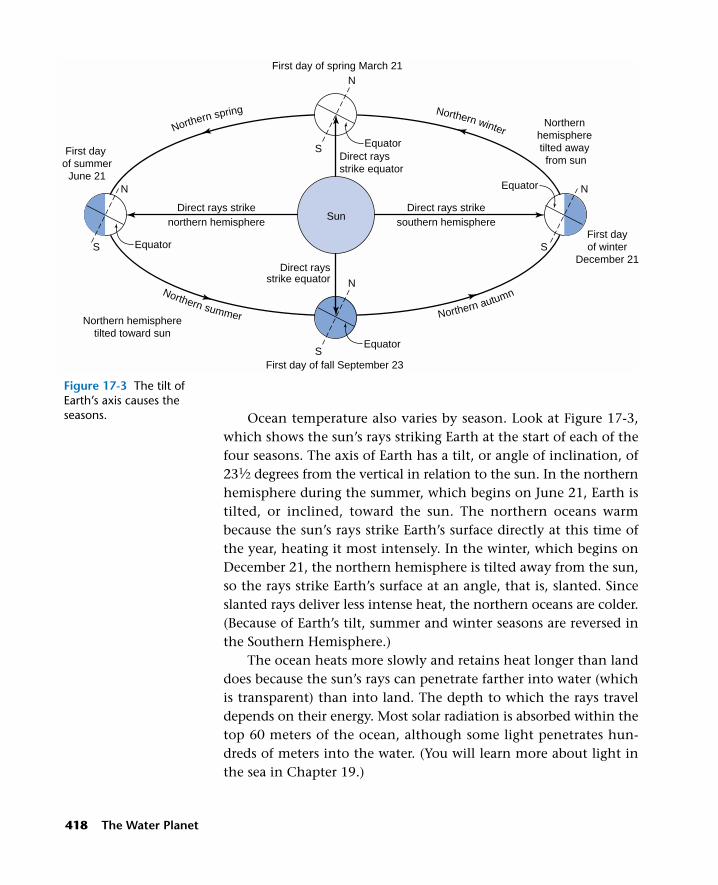
Ocean temperature also varies by season. Look at Figure 17-3,which shows the sun’s rays striking Earth at the start of each of thefour seasons. The axis of Earth has a tilt, or angle of inclination, of231⁄2 degrees from the vertical in relation to the sun. In the northernhemisphere during the summer, which begins on June 21, Earth istilted, or inclined, toward the sun. The northern oceans warmbecause the sun’s rays strike Earth’s surface directly at this time ofthe year, heating it most intensely. In the winter, which begins onDecember 21, the northern hemisphere is tilted away from the sun,so the rays strike Earth’s surface at an angle, that is, slanted. Sinceslanted rays deliver less intense heat, the northern oceans are colder.(Because of Earth’s tilt, summer and winter seasons are reversed inthe Southern Hemisphere.)
The ocean heats more slowly and retains heat longer than landdoes because the sun’s rays can penetrate farther into water (whichis transparent) than into land. The depth to which the rays traveldepends on their energy. Most solar radiation is absorbed within thetop 60 meters of the ocean, although some light penetrates hun-dreds of meters into the water. (You will learn more about light inthe sea in Chapter 19.)
418 The Water Planet
First day of summer
June 21
First dayof winter
December 21
N N
N
S S
S
N
SEquator
Equator
Equator
Equator
Direct raysstrike equator
Direct raysstrike equator
Direct rays strikenorthern hemisphere
Direct rays strikesouthern hemisphere
Northern winterNorthern spring
Northern summer Northern autumn
First day of fall September 23
First day of spring March 21
Northern hemispheretilted toward sun
Sun
Northern hemisphere tilted away from sun
Figure 17-3 The tilt ofEarth’s axis causes theseasons.

In summary, the rays that strike Earth directly (at about 90degrees, during the summer and at the equator) penetrate and heatthe water more intensely than do rays that strike at a lower angle(slanted) during the winter and above or below the equator.
Ocean Wind
On a hot summer day, you may go to the beach to get some relieffrom the heat. You feel cooler as you approach the sea because acool wind blows off the water. Often, the wind (which is a mass ofmoving air) is in the form of a gentle breeze, called a sea breeze.(See Figure 17-4.) The sea breeze is cool because air over the ocean iscooler than air over the adjacent land. Ocean air is cooler becausewater takes a longer time to heat from the sun’s rays than land does.Consequently, on a summer day, the ocean releases less heat intothe air above it than the land does. This cooler air moves in, as asea breeze, from over the ocean to above the land.
The opposite occurs at night. Cooler air from the land movesseaward, producing what is called a land breeze. (See Figure 17-4.)
Climate and the Ocean 419
Coolsea
breeze
Cool airsinks
Warm airrises
Water heats slowly,stays cool
Sun heatsboth landand water
DAY
Water holds heat,stays relatively warm
Radiationalcooling
Warmland
breeze
Warm airrises
Cool airsinks
NIGHT
Landheats
quickly
Sea Breeze
Landcools
quickly
Land Breeze
Figure 17-4 A sea breezeoccurs during the day; aland breeze occurs atnight.

After the sun sets, the land (and the air above it) cools (that is,loses heat) more quickly than the ocean does. As warmer air risesover the ocean, cooler air from the land moves in to take its place.Why the difference in heat loss between the two surfaces? Onlythe top layers of the land are heated, so the ground loses its heatquickly. However, as mentioned above, water is heated to a greaterdepth than land is, so the ocean gives up its heat more slowly andretains more heat. In fact, water has a heat storage ability, or spe-cific heat, that is about three times greater than that of land.Water’s capacity to retain heat longer and lose heat more slowlyprovides marine organisms with a more moderate environmentthan that found on land, where temperatures can fluctuate moredramatically.
What causes a sea breeze to blow toward the land, and a landbreeze to blow toward the sea? Look at Figure 17-5, which shows ademonstration of air flow in a smoking chimney. When the candleinside one chimney is lit and smoke paper is placed over the otherchimney, the smoke descends into that chimney and goes up thechimney above the candle. (Smoke is used to make the flow of airvisible.) The smoke behaves in this way because warm air rises—andthe air in the first chimney is heated by the candle, causing it torise. Cooler air flowing into the second chimney is more dense, andso it sinks and moves over to take the place of the rising air in thefirst chimney. This demonstration of how temperature differencescause air flow illustrates a convection current, which is the continualmovement of a gas or a liquid in a cycle as the heated part rises and
420 The Water Planet
Chimney
CandleConvection box
Glass front
Smoke-paperFigure 17-5 An illus-tration of air flow in achimney.

the cooler part sinks. (See Figure 17-6.) So the sea breeze and theland breeze are actually convection currents. During the day, thesun heats the sand, causing hot air to rise above it; cooler air overthe ocean flows in to take its place, producing the sea breeze. Andduring the night, cooler air over the land flows out to take the placeof warmer air that rises above the ocean.
The fact that the land and the sea gain and lose heat at differentrates helps to explain, in part, why temperatures along a coast aregenerally more moderate than those of inland areas. During thesummer, coastal cities are often a few degrees cooler than nearbyinland cities (at the same latitude), due to the cooling effect of theocean. And during the winter, coastal cities are often a few degreeswarmer than nearby inland cities (at the same latitude), becausethey benefit from the warming effect of the ocean, which slowlyreleases heat that was absorbed from the sun.
17.1 SECTION REVIEW
1. Why is the ocean surface warmer at the equator than at thepoles?
2. How does the temperature of the ocean vary with the seasons?Explain how that effect is related to Earth’s angle of insolation.
3. Why is the air usually cooler at the beach than it is inland?
Climate and the Ocean 421
In water In air
Cool air Cool air
Cool heavier water sinks
Cool heavier water sinks
Warmlighterwaterrises
Air cools and sinks
Heated air
rises
Flames Flames
Figure 17-6 Convectioncurrents in water and inair.

17.2 MOISTURE IN THE AIR
The ocean not only affects air temperature but also greatly influ-ences the amount of water vapor, or moisture, in the air. Theamount of moisture in the atmosphere is called humidity. Becausethey are near the ocean, coastal regions are often more humid thaninland regions.
Humidity
How is humidity determined? Actually, scientists calculate relativehumidity. Relative humidity is the amount of water vapor in theair compared to the maximum amount (saturation) of water vaporthe air can hold at a given temperature. Saturation occurs when theair is completely filled with water vapor and cannot hold any more.Relative humidity is expressed as a percentage. (See Figure 17-7.) Youcan use the following formula to calculate relative humidity:
Relative humidity = amount of water vapor in air�amount needed for saturation ✕ 100
For example, on a summer day, when the air temperature is26°C, the amount of moisture needed for the air to be saturatedwould be 25 grams per cubic meter (m3) of air. (Water vapor can bemeasured in different units, for example, in grains. In this case, it ismeasured in grams.) If the amount of moisture in the air is 22 gramsper m3 of air, you would figure the relative humidity as follows:
Relative humidity = 22 grams�25 grams ✕ 100
Relative humidity = 0.88 gram ✕ 100
Relative humidity = 88 percent
Relative humidity can also be determined using instrumentscalled hygrometers. One type of hygrometer, called the sling psy-chrometer, is shown in Figure 17-8. It is composed of two ther-mometers: one is uncovered (dry bulb); the other has a wet clothcovering its bulb (wet bulb). By spinning the psychrometer in the airfor a few seconds and then reading the temperature of each ther-mometer, you can use a relative humidity chart to determine therelative humidity. If the air is not saturated, there will be some evap-
422 The Water Planet
Saturated air
50 percentsaturation
2 grains
0
0
4 grains
Figure 17-7 Relativehumidity: 100 percent and50 percent saturation.(Note: one gram is equalto about 17 grains.)

oration of moisture from the wet cloth, so the wet-bulb thermome-ter will have a lower temperature than the dry-bulb thermometer.(The difference in degrees on the chart is based on the wet-bulbreading.) When the air is very dry, more water vapor evaporates,thus giving the wet bulb a much lower temperature than the drybulb. For example, when the dry-bulb temperature is 20°C and thewet-bulb temperature is 19°C (a difference of only 1°C), the relativehumidity is 91 percent; but when the dry-bulb temperature is 20°Cand the wet-bulb temperature is 15°C (a difference of 5°C), the rela-tive humidity is only 59 percent.
At each temperature, the air can hold a different quantity ofwater vapor. (See Figure 17-9.) Warm air can hold more water vaporthan cold air can. In other words, warm air has a higher saturationpoint than cold air does. (Just think of a hot, steamy jungle!) Whenwarm, moist air gets chilled by encountering a cold surface, the airmay become saturated (because cold air has a lower saturationpoint), and visible forms of water vapor such as fog or dew appear.
Fog
The air at sea level in many coastal regions is often filled with somuch moisture that it looks like a cloud. Air that is saturated withmoisture near the ground is called fog. Actually, a fog can be con-sidered a ground-level cloud. Fog forms when warm, moist air makescontact with a cold surface. The mirror in your bathroom often “fogsup” when warm, moist air from the shower makes contact with thecold surface of the mirror. When water condenses (changes from avapor to a liquid) on a solid surface, it is called dew, which you mayhave seen on cars and lawns on cool summer mornings. Dew ismoisture that comes from the warm air and condenses on the
Climate and the Ocean 423
Dry
Wet
Changing Air Temperature
Relativehumidity:
100%
Relativehumidity:
50%
Relativehumidity:
25%
Watervapor
Watervapor
Watervapor
0° C
20° C
10° C
Figure 17-8 A sling psy-chrometer.
Figure 17-9 Relativehumidity at differenttemperatures.

surface of solids that cool over night. Likewise, a glass of ice waterappears to “sweat” because moisture from the warmer air condenseson its cool surface. (See Figure 17-10.) The temperature at whichwater vapor condenses as a cloud or fog is called the dew point, andit depends on the amount of water vapor, or humidity, in the air.
Coastal fog forms at the surface of the ocean when the dewpoint is reached. The San Francisco fog occurs when the cold Cali-fornia Current moving south along the coast meets warm, moist aircarried in by prevailing westerly winds. The cold surface water coolsthe moist air above it to the point at which the air cannot hold allthe water vapor. (Remember: cold air has a lower saturation pointthan warm air.) The excess water vapor appears as fog. The foggiestplace in the world is the Newfoundland coast in Canada, whichaverages about 120 foggy days per year. There, fog is produced whenthe warm, moist air above the Gulf Stream meets the cold LabradorCurrent coming down from the north. The moisture condenses toform a thick fog that can be a serious hindrance to navigation. Thewarm Gulf Stream continues across the Atlantic Ocean. When itreaches the coast of Great Britain, it produces warm, moist air thatmeets the cool land surface, again forming a fog. (See Figure 17-11.)
17.2 SECTION REVIEW
1. How is the relative humidity of the atmosphere determined?
2. Why does it get foggy in San Francisco and Newfoundland?
3. What is the relationship between a fog and the dew point?
17.3 STORMY WEATHER
On September 8, 1900, a storm with powerful winds from the Gulfof Mexico flooded the city of Galveston, Texas, killing about 6000
424 The Water Planet
Air cooledby glass
Water dropletsform bycondensation
Warm,moistair
Figure 17-10 Condensa-tion of water on a coolsurface.
Warm, moist air
Fog
Cold land surface
Ocean
Figure 17-11 Theformation of fog.

people. Although such a great loss of lives is rare these days, eachyear from the beginning of June to the end of November, inhabi-tants along the Gulf, Atlantic, and Caribbean coasts are concernedbecause that is their hurricane season.
Hurricanes
A hurricane is a coastal storm with a wind velocity that exceeds120 km per hour. Hurricanes form in tropical seas where there ishot, moist air. Such conditions contain the heat needed to fuel ahurricane. (See Figure 17-12, which shows U.S. hurricane paths.) Asthe hot, moist air rises, it cools in the upper atmosphere and con-denses into ring-shaped clouds about 19 km in height. During con-densation, a great deal of heat energy is released, which causes morehot air to rise even quicker. This whirlwind of rising air moves in aspiral direction around a core of relatively calm air known as the“eye” of a hurricane. The eye of a hurricane may range from about25 to 65 km in diameter, while the total diameter of a large hurri-cane may be more than 500 km. The worst conditions occur justoutside the hurricane’s eye, with heavy thunderstorms and windsof over 300 km per hour. Unfortunately, some people think that ahurricane has passed when in fact they are still in its eye, and theother half of the storm has yet to pass through their area.
Climate and the Ocean 425
Canada
United States
Gulf ofMexico
Atlantic OceanMexicoPacific Ocean
Figure 17-12 U.S.hurricane paths.

The National Hurricane Center in Florida uses radar, airplanereconnaissance, and weather satellites to track hurricanes. As soonas a hurricane is spotted far out at sea by weather satellites, hurri-cane “hunters” from the U.S. Air Force and the National Oceanicand Atmospheric Administration (NOAA) fly into the eye of thestorm and monitor it continuously. Data on wind velocity and thespeed and direction of the storm are sent to weather stations alongthe coast well in advance of the storm’s arrival. Official hurricanewarnings give people a chance to get ready for possible evacuationof their area. By instructing people to move inland to higher eleva-tions, a good warning system can save many lives.
Damage by Hurricanes
When a hurricane does reach land, it can be very destructive. Mostdamage occurs when a hurricane produces a storm surge, whichraises the sea level several meters above normal and pushes thewater inland, causing flooding. A storm surge can be particularlydamaging if it occurs during a high tide. As the hurricane movesinland, it slows because its winds move slower over land and there isnot enough moisture to sustain it. If the storm continues to moveinland, it dissipates and dies out. Hurricanes also lose power as theymove over the cooler waters of the northern Atlantic because theylose the heat needed to fuel their winds. Hurricane Allen movedinland and weakened over a three-day period in August 1980. Thesatellite photos showed a tight, spiral mass in the Gulf of Mexicoon August 10; a looser spiral on August 11 as the hurricane weak-ened and passed over northern Mexico and southern Texas; andfinally, on August 12, all that remained of Hurricane Allen were dif-fuse clouds over Texas and Mexico. (See Figure 17-13.)
Hurricane intensity is rated on a scale from one to five, calledthe Saffir-Simpson Damage Potential Scale. A category-one hurri-cane causes “minimal” damage, while a category-five hurricane withwinds of over 250 km per hour causes “catastrophic” damage. Hur-ricane Andrew in 1992 was classified as a category-four hurricane.On August 23 and 24, Hurricane Andrew killed 62 people andcaused $25 billion in damage as it tore through the Bahamas, south-ern Florida, and Louisiana. More than 25,000 homes were destroyed
426 The Water Planet

and 250,000 people were left homeless. Measures have been under-taken by the federal government to prepare and protect the publicfrom hurricane damage. For example, besides having an early warn-ing system based on satellite readings, the states of Florida andLouisiana have building codes that require homes to withstand 177kilometer-per-hour winds.
A list of some of the most destructive hurricanes in recent U.S.history is in Table 17-1, on page 428. Note that even though Hurri-cane Andrew was very destructive, far fewer people were killed thanin previous hurricanes, thanks to official hurricane warnings.
El Niño and La Niña
Droughts in Australia, famine in Africa, floods in California, andother climate-related disturbances in recent years have all beenattributed to an unpredictable warm ocean current in the equatorial
Climate and the Ocean 427
Figure 17-13 Astronaut’s-eye view of a hurricane.

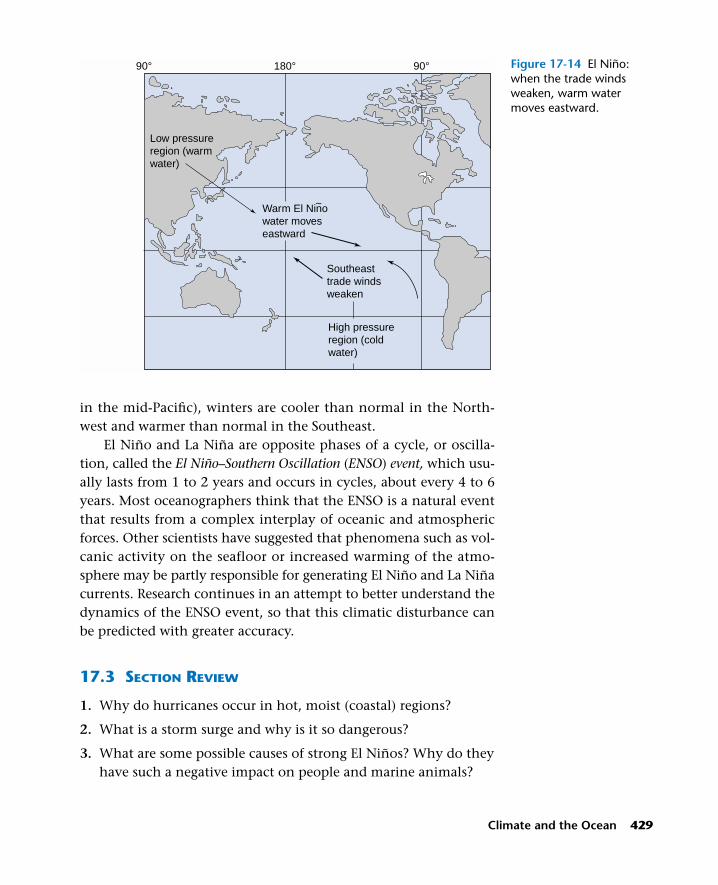
Pacific. This oceanic warming, which periodically causes deaths andgreat losses of crops, property, fisheries, and marine animals depen-dent on fish, is called El Niño. The name is Spanish for “the (Christ)child,” since this ocean current flows near South and Central Amer-ica during Christmastime. El Niño begins in the western PacificOcean, a low-pressure region where there is a large mass of warmsurface water. Normally, the warm water is held in place by the tradewinds, which blow westward from a high-pressure region in theeastern Pacific Ocean. However, from time to time the trade windsweaken, causing the warm water—called an equatorial countercur-rent—to surge eastward toward Central and South America. Thewarm water invades the cold waters off the South American coast,disrupting the fisheries and bringing floods and stormy weather toNorth and South America. (See Figure 17-14.)
In contrast to the warm El Niño ocean currents are the unusu-ally cool ocean currents that sometimes appear in the equatorialPacific. These cooler surface temperatures are called La Niña. Theimpact of El Niño and La Niña can be seen in the northern hemi-sphere during the winter months. In the continental United Statesduring El Niño years (when ocean currents are unusually warm inthe mid-Pacific), winters are warmer than normal in the Northwestand cooler than normal in the Southeast and Southwest. In con-trast, during La Niña years (when ocean currents are unusually cool
428 The Water Planet
TABLE 17-1 WORST HURRICANES IN RECENT U.S. HISTORY
Hurricane Year Deaths
Galveston* 1900 6,000
Florida Keys/Texas 1919 600–900
Florida 1928 1,836
New England 1938 600
Diane 1955 200
Audrey/Bertha 1957 390
Camille 1969 256
Agnes 1972 122
Andrew 1992 62
*Before 1953, hurricanes were not given names.
in the mid-Pacific), winters are cooler than normal in the North-west and warmer than normal in the Southeast.
El Niño and La Niña are opposite phases of a cycle, or oscilla-tion, called the El Niño–Southern Oscillation (ENSO) event, which usu-ally lasts from 1 to 2 years and occurs in cycles, about every 4 to 6years. Most oceanographers think that the ENSO is a natural eventthat results from a complex interplay of oceanic and atmosphericforces. Other scientists have suggested that phenomena such as vol-canic activity on the seafloor or increased warming of the atmo-sphere may be partly responsible for generating El Niño and La Niñacurrents. Research continues in an attempt to better understand thedynamics of the ENSO event, so that this climatic disturbance canbe predicted with greater accuracy.
17.3 SECTION REVIEW
1. Why do hurricanes occur in hot, moist (coastal) regions?
2. What is a storm surge and why is it so dangerous?
3. What are some possible causes of strong El Niños? Why do theyhave such a negative impact on people and marine animals?
Climate and the Ocean 429
90° 180° 90°
Warm El Ninowater moveseastward
~
Southeasttrade windsweaken
High pressureregion (coldwater)
Low pressureregion (warmwater)
Figure 17-14 El Niño:when the trade windsweaken, warm watermoves eastward.
17.4 THE GREENHOUSE EFFECT
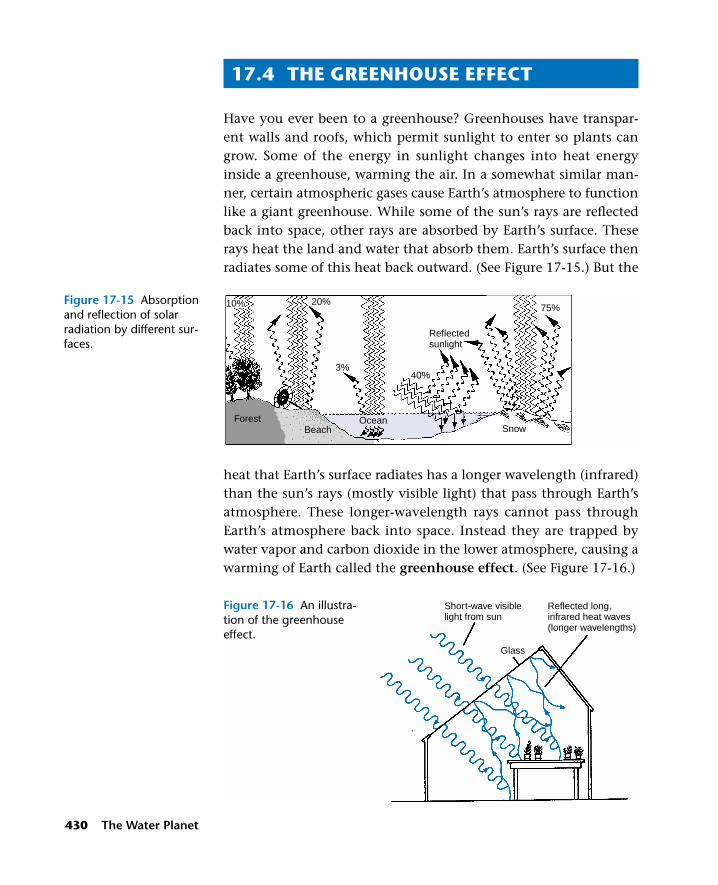
Have you ever been to a greenhouse? Greenhouses have transpar-ent walls and roofs, which permit sunlight to enter so plants cangrow. Some of the energy in sunlight changes into heat energyinside a greenhouse, warming the air. In a somewhat similar man-ner, certain atmospheric gases cause Earth’s atmosphere to functionlike a giant greenhouse. While some of the sun’s rays are reflectedback into space, other rays are absorbed by Earth’s surface. Theserays heat the land and water that absorb them. Earth’s surface thenradiates some of this heat back outward. (See Figure 17-15.) But the
heat that Earth’s surface radiates has a longer wavelength (infrared)than the sun’s rays (mostly visible light) that pass through Earth’satmosphere. These longer-wavelength rays cannot pass throughEarth’s atmosphere back into space. Instead they are trapped bywater vapor and carbon dioxide in the lower atmosphere, causing awarming of Earth called the greenhouse effect. (See Figure 17-16.)
430 The Water Planet
ForestBeach
OceanSnow
20%
Reflectedsunlight
3%
75%
40%
10%
Glass
Short-wave visiblelight from sun
Reflected long,infrared heat waves(longer wavelengths)
Figure 17-16 An illustra-tion of the greenhouseeffect.
Figure 17-15 Absorptionand reflection of solarradiation by different sur-faces.

ENVIRONMENTRising Temperatures, Rising Sea Level
1. How might a global warming trend contribute to a rise in the sea level?
2. Why would melting glaciers, but not melting ice shelves, cause a rise in sea level?
3. Explain the argument proposed by scientists who claim that a warming trend will not cause a risein the sea level.
QUESTIONS
Climate and the Ocean 431
Satellite photographs taken of Antarctica in2002 revealed the disappearance of part of itsLarsen ice shelf—a loss of ice that covered anarea the size of Rhode Island. An ice shelf is amass of floating ice that is attached to a con-tinent. Some scientists say that the melting of such a large area of ice is a result of therapidly warming atmosphere. After all, Earth’saverage air temperature has risen over the past century.
The melting of an ice shelf does notincrease the total volume of ocean water (sinceit is already part of the ocean), just as the melt-ing of ice cubes in a glass of water does notcause the water to overflow. So, the sea leveldoes not increase as a direct result of meltingice shelves. However, scientists worry that if themelting of Antarctica’s ice shelf continues, thisbuffer zone between land and sea will disap-pear, thus exposing the ice sheets and glacierson land. These glaciers could then move intothe sea, where they would melt and cause a rise in sea level. Knowing of that possibility,researchers think that the melting ice shelvescan be regarded as early warnings of climatechange.
There are some climatologists (scientistswho study climate changes) who reject the idea
that a warming trend will cause a rise in sealevel. They argue that a warming trend mayactually increase Antarctic precipitation, in theform of snow. According to this hypothesis, theheavier accumulations of snow that could resultwould be compressed over time, thereby form-ing more ice. Other scientists remain neutral,not in favor of either argument until they havemore information. In the meantime, orbitingsatellites will continue to collect data on theAntarctic ice shelf and to monitor any decreasein glaciers or increase in sea level that mayoccur.

Global Warming
Scientists have noticed that Earth is experiencing a warming trend;the planet’s mean global temperature has increased more than 1°Cover the past 100 years. It is believed that this warming trend, com-monly called global warming, has caused some melting of thepolar ice caps and a subsequent rise in sea level. (Compare thegraphs in Figure 17-17.) In fact, in just the past 100 years, the sealevel has risen approximately 10 cm. Scientists are taking measure-ments of the polar ice caps to determine if their rate of melting con-tinues to increase.
What is causing this warming trend? Look at the graph in Figure17-18, which shows an increase in atmospheric CO2 (in ppm) over arecent 35-year period. Carbon dioxide is called a greenhouse gasbecause (along with water vapor) it traps heat in the atmosphere.Much of the CO2 in our atmosphere comes from the combustion offossil fuels, such as coal, oil, and gas. The Industrial Revolution,which brought on this greater use of fossil fuels, began about 100years ago. And it was in that past century that we began to seeincreased CO2 levels, a rising sea level, and atmospheric warming.
Concern about the warming trend varies. Some scientists claimthat the warming trend is part of a natural cycle that will eventuallyreverse itself through CO2 uptake by photosynthetic marine and ter-restrial plants. Others claim that the warming of Earth’s atmosphereis a real problem that can be significantly reduced by decreasing theuse of fossil fuels and relying more on alternative energy sources,such as solar power and wind power. A real fear is that, if increased
432 The Water Planet
1880 1900 1920 1940 1960 1980–8
–4
0
4
8
1880 1900 1920 1940 1960 1980 20000
.2
.4
.6
.8
1.0
1.2
Mea
n gl
obal
tem
pera
ture
(°C
)
Atmospheric Warming Trend
Sea
leve
l (cm
)
Rising Sea Level
Figure 17-17 Both meanglobal temperature andsea level have been rising.

warming leads to a significant rise in sea level during this century,coastal cities and island nations may be inundated. (See this chap-ter’s feature, on page 431, about possible effects of rising tempera-tures on sea level.)
17.4 SECTION REVIEW
1. Explain how the greenhouse effect works in the atmosphere.
2. How does the use of fossil fuels contribute to global warming?
3. Explain how an increase in atmospheric CO2 may lead to a risein sea level.
Climate and the Ocean 433
1958 1963 1968 1973 1978 1983 1988 1993 1998300
310
330
320
340
350
360
370
Atm
osph
eric
CO
2 (p
pm)
Figure 17-18 Atmosphericcarbon dioxide has beenincreasing steadily.

Laboratory Investigation 17
434 The Water Planet
PROBLEM: How can we analyze temperature differences in ocean currents?
SKILLS: Map reading; comparing and analyzing scientific data.
MATERIALS: Colored pencils, copies of the two maps of the Pacific Ocean.
PROCEDURE
1. Examine the two maps in Figure 17-19. Notice the isotherms—lines thatconnect locations having the same temperature. Each isotherm represents adifferent temperature.
2. Use the colored pencils to highlight the temperature ranges indicated by theisotherms. Prepare a temperature key that shows the appropriate colors.
3. Next, color in the temperature ranges of the isotherms on your copy of eachmap, using the color key as a guide.
4. Study both maps to see if any significant difference is observable.
OBSERVATIONS AND ANALYSES
1. Which year had a cooler mid-ocean temperature at the equator, 1987 or1988?
2. Compare the temperatures of mid-ocean water at 20°S and at 20°N for thetwo years. Is there a noticeable difference between them?
3. Based on the ocean temperature differences between the two maps, whichyear probably shows an El Niño? Explain.
Analyzing Ocean Temperatures

Climate and the Ocean 435
20
30
2422
18
1210
14
28
16 1418
2022
30
2426
2828
26
2022
1816
14
1012
2624 22
20
181614
120 E 140 E 160 E 180 160 W 140 W 120 W 100 W 80 W 60 W60 S
40 S
20 S
EQ
20 N
40 N
60 N
Temperature Color Key
June 1987—Sea Surface Temperature (°C)
28°C or > 26–28°C 24 –26°C 22–24°C 20–22°C 20°C or <(red) (orange) (yellow) (blue) (green) (violet)
26
120 E 140 E 160 E 180 160 W 140 W 120 W 100 W 80 W 60 W60 S
40 S
20 S
EQ
20 N
40 N
60 NJune 1988—Sea Surface Temperature (°C)
8 1012
6
1416
18
24 2628
282624
22 201816
1414
22201816
28
282624
2624
30
30
16141210
86
1820
Temperature Color Key
28°C or > 26–28°C 24–26°C 22–24°C 20–22°C 20°C or <
(red) (orange) (yellow) (blue) (green) (violet)
2022
2824
16
Figure 17-19 Each isotherm represents a different surface temperature.
Answer the following questions on a separate sheet of paper.
Vocabulary
The following list contains all the boldface terms in this chapter.
angle of insolation, dew, dew point, El Niño, fog, fossil fuels,global warming, greenhouse effect, greenhouse gas, humidity,hurricane, hygrometers, land breeze, radiant energy, relativehumidity, sea breeze, specific heat
Fill In
Use one of the vocabulary terms listed above to complete each sentence.
1. The amount of water vapor in the atmosphere is the____________________.
2. Solar rays trapped in the atmosphere cause the ____________________.
3. Water has a greater heat storage ability, or ____________________, than landdoes.
4. Water vapor condenses into a cloud or a fog at the ____________________.
5. Rising hot, moist air over a tropical sea can form a ____________________.
Think and Write
Use the information in this chapter to respond to these items.
6. Explain how the angle of insolation, and physical properties ofEarth’s surface, affect the amount of solar energy absorbed.
7. Describe how and where hurricanes are formed.
8. How has industrialization caused global warming?
Chapter 17 Review
436 The Water Planet

Inquiry
Base your answers to questions 9 through 11 on the diagram below andon your knowledge of marine science.
9. Ocean temperatures at the equator would be their warmest onwhich date? a. December 21 b. March 21 c. June 21d. October 21
10. Which statement is not accurate regarding ocean temperatureand seasonal change? a. The tilt of Earth’s axis affects oceantemperature. b. Surface ocean temperatures are affected bythe angle of insolation of solar rays. c. The northern oceansare warmest from December 21 to March 21. d. Direct raysof light deliver more intense heat than do slanted rays.
11. Ocean temperatures in the southern hemisphere would betheir coldest on a. December 21 b. March 21 c. June 21d. September 23.
Multiple Choice
Choose the response that best completes the sentence or answers thequestion.
12. Cool air that moves seaward from the land is called aa. sea breeze b. land breeze c. fog d. condensation.
Climate and the Ocean 437
June 21 December 21
N N
N
S S
S
N
SEquator
Equator
Equator
Equator
Direct raysstrike equator
Direct raysstrike equator
Direct rays strikenorthern hemisphere
Direct rays strike southern hemisphere
Northern winterNorthern spring
Northern summer Northern autumn
September 23
March 21
Sun

13. The amount of water vapor in the air as compared with theamount the air can hold is the a. dew point b. greenhouseeffect c. relative humidity d. specific heat.
14. During a summer day, it is cooler at the beach than inlandbecause of a. a sea breeze b. a land breeze c. cool airthat moves from land to sea d. warm air over the ocean.
15. All of the following are true about hurricanes except a. theyare fueled by warm, moist air b. they occur only in theCaribbean and the Gulf of Mexico c. they decrease in inten-sity as they move inland d. they can be very destructive.
16. The California fog is a result of a. a warm ocean currentmaking contact with moist continental air b. warm, moistair from the ocean meeting cool continental air c. a coldocean current meeting warm moist air d. warm continentalair meeting cold continental air.
17. At night along a coast there is a. a sea breeze b. a landbreeze c. warm air rising over the land d. warm airsinking over the sea.
18. Which statement is true? a. As latitude increases, surfaceocean temperature decreases. b. As latitude increases,surface ocean temperature increases. c. Latitude affectsocean temperature only above the equator. d. Latitudeaffects ocean temperature only below the equator.
19. The photic zone is deepest at the equator because a. lightenters the water at an angle of 45 degrees b. light thatstrikes Earth is slanted c. the angle of insolation is 90degrees d. the light has longer wavelengths.
20. Which of the following statements is accurate regardinghurricanes? a. They pick up power as they move over coolerwaters. b. They originate in tropical seas where there is hot,moist air. c. They originate over land and travel out to sea.d. They have caused more deaths in recent years than in pastyears.
21. Which of the following is a true statement regarding El Niño?a. It is a destructive hurricane. b. It is an ocean currentfrom the Caribbean. c. It is a warm, tropical countercurrentin the Pacific. d. It is an active volcano in the South Pacific.
438 The Water Planet

Base your answer to the following question on the information in thischapter and on the diagram, which illustrates the greenhouse effect.
22. Which statementabout solar radiationis correct? a. Longwavelengths of heatenergy can pass backout through the glass.b. Short wavelengthsof light energy cannotpass through glass.c. The air temperatureis colder inside thestructure because heatescapes. d. The air temperature is warmer inside thestructure because some sunlight changes into heat energy.
Research/Activity
■ Track the daily path of a hurricane based on satellite pictures ina newspaper or data from NOAA on the Internet. Construct aline graph and plot the wind velocity of the hurricane over thecourse of a week. Correlate changes in the hurricane’s speedwith changes in its direction (that is, as it moves over waterand/or over land).
■ Use a copy of a map of the continental United States to showthe effects of a rise in sea level of about 30 meters. Draw in thenew coastlines with color markers. Make a list of some impor-tant cities that may end up below sea level.
■ Build a miniature greenhouse. Place one thermometer inside itand one outside it. Record the inside and outside temperaturesdaily for one week; calculate the average for each set of readings;explain any difference observed.
Climate and the Ocean 439
Short-waveLong-wave
Glass