Embed Size (px)
Citation preview

HSC 8 – E - pH Examples November 19, 2014
Research Center, Pori / Petri Kobylin, Kai Anttila
14012-ORC-J 1 (10)
Copyright © Outotec Oyj 2014
18. E - pH Examples
HSC 8 – E - pH Examples November 19, 2014
Research Center, Pori / Petri Kobylin, Kai Anttila
14012-ORC-J 2 (10)
Copyright © Outotec Oyj 2014
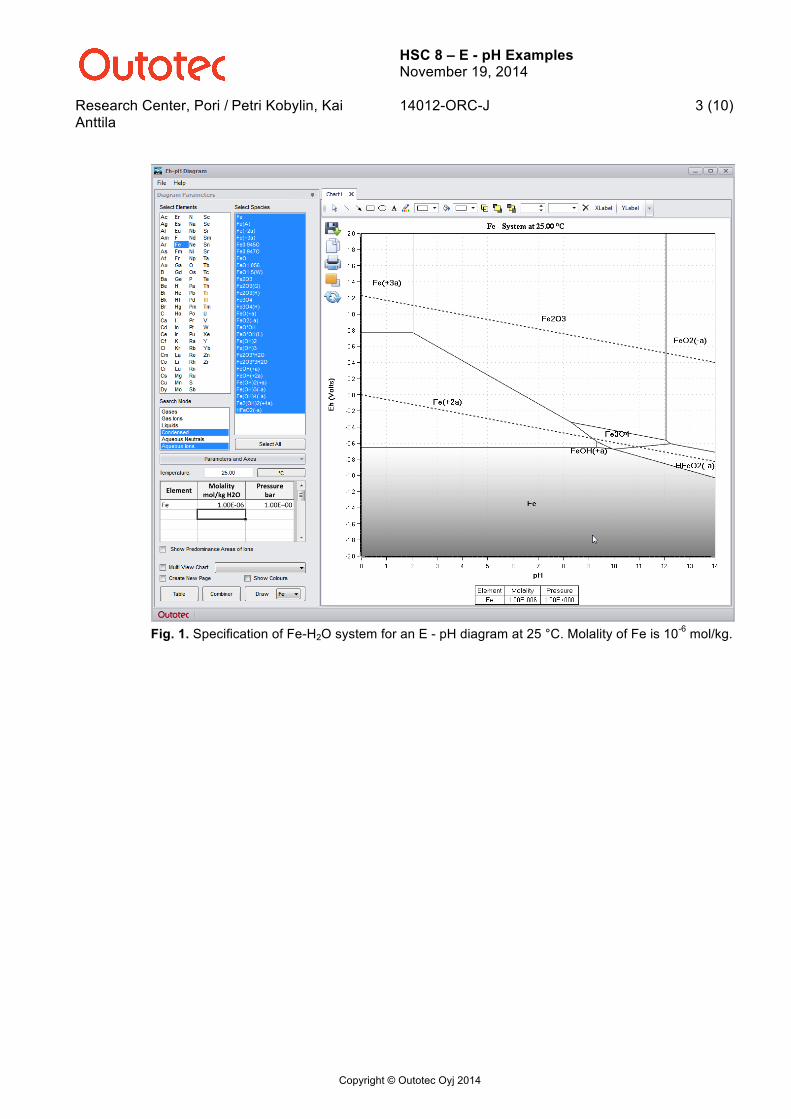
18.1. EpH Case 1: Metal Corrosion in Fe-H2O System E - pH diagrams may be used to estimate the corrosion behavior of different metals in aqueous solutions. The most common corrosion phenomenon is rust formation on iron surfaces. The corrosion rates and types depend on the chemical conditions in the aqueous solution. The E - pH diagram of an Fe-H2O system may easily be created as described in Chapter 17. The chemical system specification and the calculated diagram are shown in Fig. 1. The stability areas can be divided into three groups1: 1. Corrosion area: Formation of ions means that the metal dissolves into an aqueous
solution. For example, Fe(+3a), Fe(+2a), FeO2(-a) and HFeO2(-a) ions in an Fe-H2O system.
2. Passive area: Formation of oxides or some other condensed compounds may create a tight (impermeable) film on the metal surface which passivates the surface; good examples are Al2O3 on aluminum or TiO2 on titanium surfaces. If the oxide layer is not tight enough to prevent oxygen diffusion into the metal surface (i.e. if it is porous), corrosion may continue. This is the case with the most of the iron oxides but they may also cause passivation in favorable conditions.
3. Immunity area: All metals are stable if the electrochemical potential is low enough. Most noble metals are stable even at zero potential, but at least -0.6 volts are needed at the cathode for iron to precipitate, see Fig. 1.
The stability areas of water are shown by dotted lines in E - pH diagrams, see Fig. 1. Usually it is difficult to exceed these limits due to the formation of oxygen at the upper limit and hydrogen at the lower limit. In some solutions these limits may be exceeded due to the necessary overpotential of hydrogen and oxygen formation. According to Fig. 1, it seems that hydrogen formation occurs on the cathode before the metallic iron becomes stable. Eh-pH diagrams may be used in several ways, for example, - to find the pH, potential and temperature regions which prevent corrosion. - to find out which compounds are corrosion reaction products. - to find immune materials which can be used as protective coating. - to find a metal which may corrode instead of the construction material. For example,
the zinc layer on a steel surface.
HSC 8 – E - pH Examples November 19, 2014
Research Center, Pori / Petri Kobylin, Kai Anttila
14012-ORC-J 3 (10)
Copyright © Outotec Oyj 2014
Fig. 1. Specification of Fe-H2O system for an E - pH diagram at 25 °C. Molality of Fe is 10-6 mol/kg.
HSC 8 – E - pH Examples November 19, 2014
Research Center, Pori / Petri Kobylin, Kai Anttila
14012-ORC-J 4 (10)
Copyright © Outotec Oyj 2014
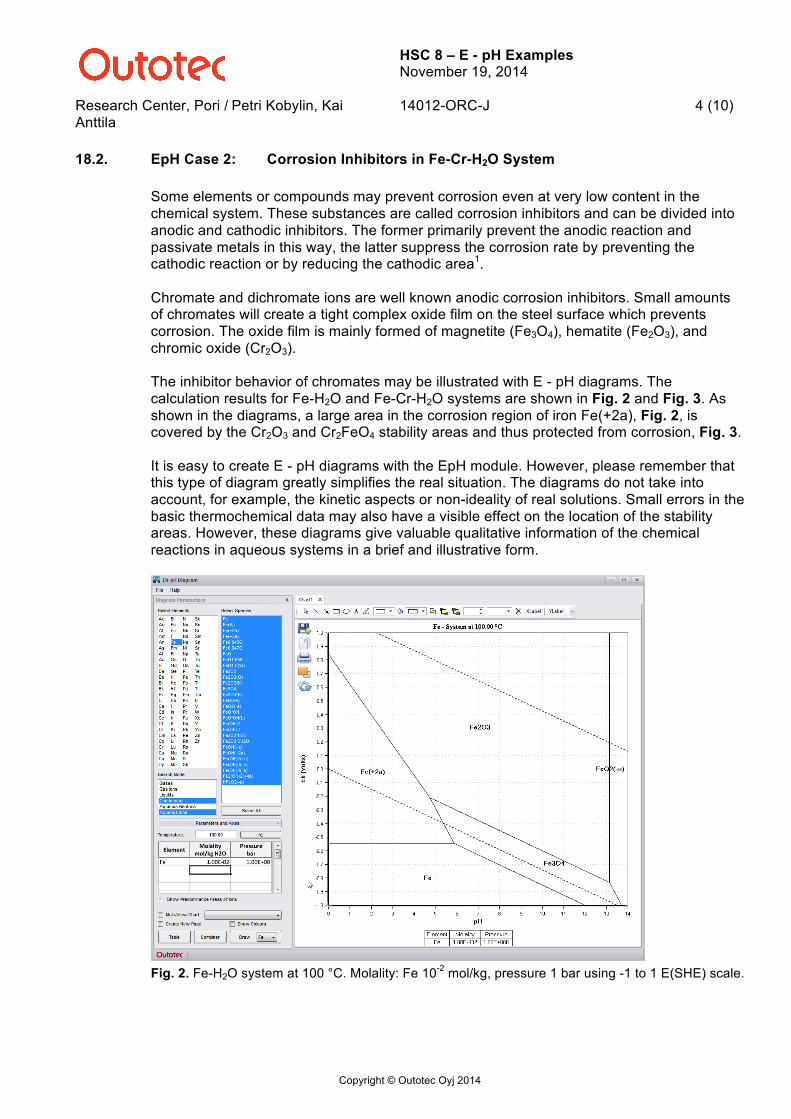
18.2. EpH Case 2: Corrosion Inhibitors in Fe-Cr-H2O System Some elements or compounds may prevent corrosion even at very low content in the chemical system. These substances are called corrosion inhibitors and can be divided into anodic and cathodic inhibitors. The former primarily prevent the anodic reaction and passivate metals in this way, the latter suppress the corrosion rate by preventing the cathodic reaction or by reducing the cathodic area1. Chromate and dichromate ions are well known anodic corrosion inhibitors. Small amounts of chromates will create a tight complex oxide film on the steel surface which prevents corrosion. The oxide film is mainly formed of magnetite (Fe3O4), hematite (Fe2O3), and chromic oxide (Cr2O3). The inhibitor behavior of chromates may be illustrated with E - pH diagrams. The calculation results for Fe-H2O and Fe-Cr-H2O systems are shown in Fig. 2 and Fig. 3. As shown in the diagrams, a large area in the corrosion region of iron Fe(+2a), Fig. 2, is covered by the Cr2O3 and Cr2FeO4 stability areas and thus protected from corrosion, Fig. 3. It is easy to create E - pH diagrams with the EpH module. However, please remember that this type of diagram greatly simplifies the real situation. The diagrams do not take into account, for example, the kinetic aspects or non-ideality of real solutions. Small errors in the basic thermochemical data may also have a visible effect on the location of the stability areas. However, these diagrams give valuable qualitative information of the chemical reactions in aqueous systems in a brief and illustrative form.
Fig. 2. Fe-H2O system at 100 °C. Molality: Fe 10-2 mol/kg, pressure 1 bar using -1 to 1 E(SHE) scale.

HSC 8 – E - pH Examples November 19, 2014
Research Center, Pori / Petri Kobylin, Kai Anttila
14012-ORC-J 5 (10)
Copyright © Outotec Oyj 2014
Fig. 3. Fe-Cr-H2O system at 100 °C. Molalities: Fe and Cr 10-2 mol/kg, pressure 1 bar.
HSC 8 – E - pH Examples November 19, 2014
Research Center, Pori / Petri Kobylin, Kai Anttila
14012-ORC-J 6 (10)
Copyright © Outotec Oyj 2014
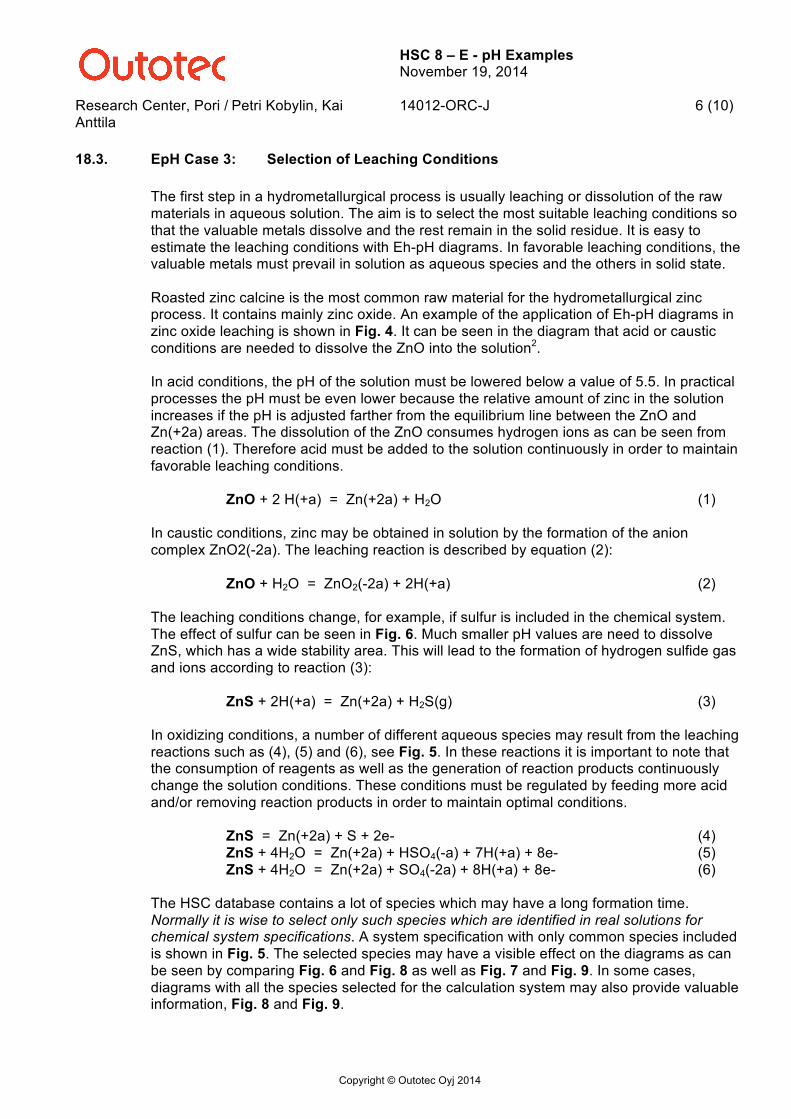
18.3. EpH Case 3: Selection of Leaching Conditions The first step in a hydrometallurgical process is usually leaching or dissolution of the raw materials in aqueous solution. The aim is to select the most suitable leaching conditions so that the valuable metals dissolve and the rest remain in the solid residue. It is easy to estimate the leaching conditions with Eh-pH diagrams. In favorable leaching conditions, the valuable metals must prevail in solution as aqueous species and the others in solid state. Roasted zinc calcine is the most common raw material for the hydrometallurgical zinc process. It contains mainly zinc oxide. An example of the application of Eh-pH diagrams in zinc oxide leaching is shown in Fig. 4. It can be seen in the diagram that acid or caustic conditions are needed to dissolve the ZnO into the solution2. In acid conditions, the pH of the solution must be lowered below a value of 5.5. In practical processes the pH must be even lower because the relative amount of zinc in the solution increases if the pH is adjusted farther from the equilibrium line between the ZnO and Zn(+2a) areas. The dissolution of the ZnO consumes hydrogen ions as can be seen from reaction (1). Therefore acid must be added to the solution continuously in order to maintain favorable leaching conditions.
ZnO + 2 H(+a) = Zn(+2a) + H2O (1) In caustic conditions, zinc may be obtained in solution by the formation of the anion complex ZnO2(-2a). The leaching reaction is described by equation (2):
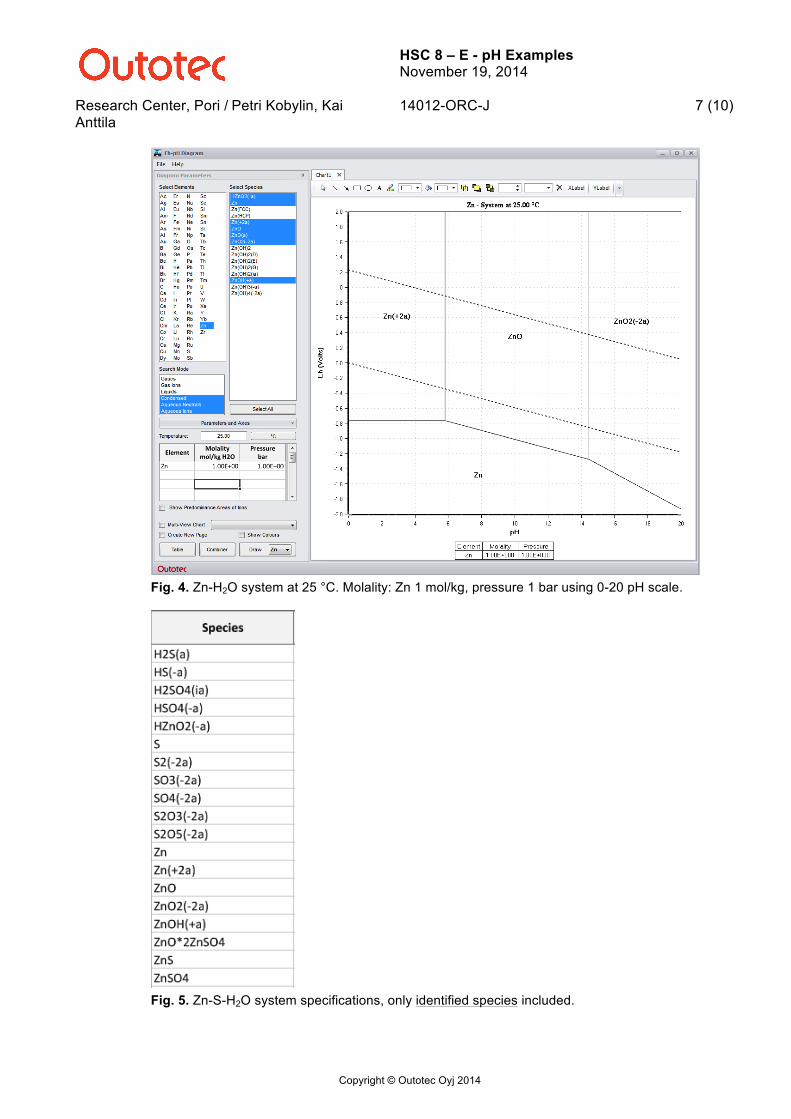
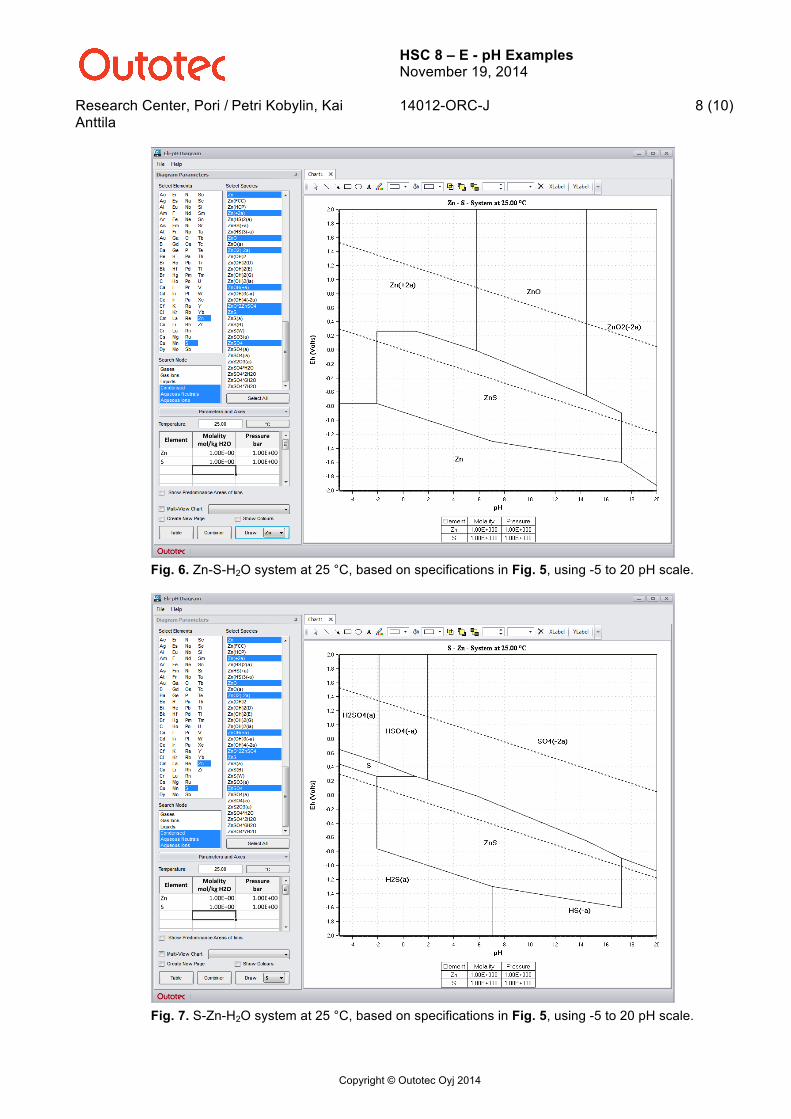
ZnO + H2O = ZnO2(-2a) + 2H(+a) (2) The leaching conditions change, for example, if sulfur is included in the chemical system. The effect of sulfur can be seen in Fig. 6. Much smaller pH values are need to dissolve ZnS, which has a wide stability area. This will lead to the formation of hydrogen sulfide gas and ions according to reaction (3):
ZnS + 2H(+a) = Zn(+2a) + H2S(g) (3) In oxidizing conditions, a number of different aqueous species may result from the leaching reactions such as (4), (5) and (6), see Fig. 5. In these reactions it is important to note that the consumption of reagents as well as the generation of reaction products continuously change the solution conditions. These conditions must be regulated by feeding more acid and/or removing reaction products in order to maintain optimal conditions.
ZnS = Zn(+2a) + S + 2e- (4) ZnS + 4H2O = Zn(+2a) + HSO4(-a) + 7H(+a) + 8e- (5) ZnS + 4H2O = Zn(+2a) + SO4(-2a) + 8H(+a) + 8e- (6)
The HSC database contains a lot of species which may have a long formation time. Normally it is wise to select only such species which are identified in real solutions for chemical system specifications. A system specification with only common species included is shown in Fig. 5. The selected species may have a visible effect on the diagrams as can be seen by comparing Fig. 6 and Fig. 8 as well as Fig. 7 and Fig. 9. In some cases, diagrams with all the species selected for the calculation system may also provide valuable information, Fig. 8 and Fig. 9.
HSC 8 – E - pH Examples November 19, 2014
Research Center, Pori / Petri Kobylin, Kai Anttila
14012-ORC-J 7 (10)
Copyright © Outotec Oyj 2014
Fig. 4. Zn-H2O system at 25 °C. Molality: Zn 1 mol/kg, pressure 1 bar using 0-20 pH scale.
Fig. 5. Zn-S-H2O system specifications, only identified species included.
HSC 8 – E - pH Examples November 19, 2014
Research Center, Pori / Petri Kobylin, Kai Anttila
14012-ORC-J 8 (10)
Copyright © Outotec Oyj 2014
Fig. 6. Zn-S-H2O system at 25 °C, based on specifications in Fig. 5, using -5 to 20 pH scale.
Fig. 7. S-Zn-H2O system at 25 °C, based on specifications in Fig. 5, using -5 to 20 pH scale.

HSC 8 – E - pH Examples November 19, 2014
Research Center, Pori / Petri Kobylin, Kai Anttila
14012-ORC-J 9 (10)
Copyright © Outotec Oyj 2014
Fig. 8. Zn-S-H2O system at 25 °C, based on all species specification, using -5 to 20 pH scale.
Fig. 9. S-Zn-H2O system at 25 °C, based on all species specification, using -5 to 20 pH scale.

HSC 8 – E - pH Examples November 19, 2014
Research Center, Pori / Petri Kobylin, Kai Anttila
14012-ORC-J 10 (10)
Copyright © Outotec Oyj 2014
18.4. References 1. Taylor D.F.: Thermodynamic Properties of Metal-Water Systems at Elevated
Temperatures, J. Electrochem. Soc. 125 (1978) 5, pp. 808-11. 2. Hayes, P. C.: Process Selection in Extractive Metallurgy. Brisbane, Hayes Publishing
Co, Australia, 1985. pp. 189-192. 3. Chen, C. M., Aral, K., Theus, G. J.: Computer-Calculated Potential pH Diagrams to
300 °C, Volume 1. Executive Summary. Alliance, The Babcock & Wilcox Company, USA, 1983. pp. 2-1 - 2-10, 3-1 - 3-10.


![Synthesis and Characterisation of Lanthanum added ZnO ...joics.org/gallery/ics-1925.pdf · ZnO [26-30]. It clearly shows that the prepared ZnO and La doped ZnO samples revelation](https://img.pdfslide.net/doc/110x75/5ea23502b68dcf2dd872f588/synthesis-and-characterisation-of-lanthanum-added-zno-joicsorggalleryics-1925pdf.jpg)