Embed Size (px)
Citation preview

18.7.2003 General Tracker meeting A. Furgeri 1
Irradiation resultsIrradiation resultsand and
Annealing scenarios for HPKAnnealing scenarios for HPKIEKP – University of Karlsruhe
Alexander Furgeri
18.7.2003 General Tracker meeting A. Furgeri 2
OutlineOutline
• Overview of relevant sensor parameters
• Main results from p-irradiation
• prequalification W1TID-, IB1- and W3-Wafers for irradiation in Louvain
• Results from irradiation in Louvain
• Scenarios of Udep for inner Barrel sensors
• Conclusions
18.7.2003 General Tracker meeting A. Furgeri 3
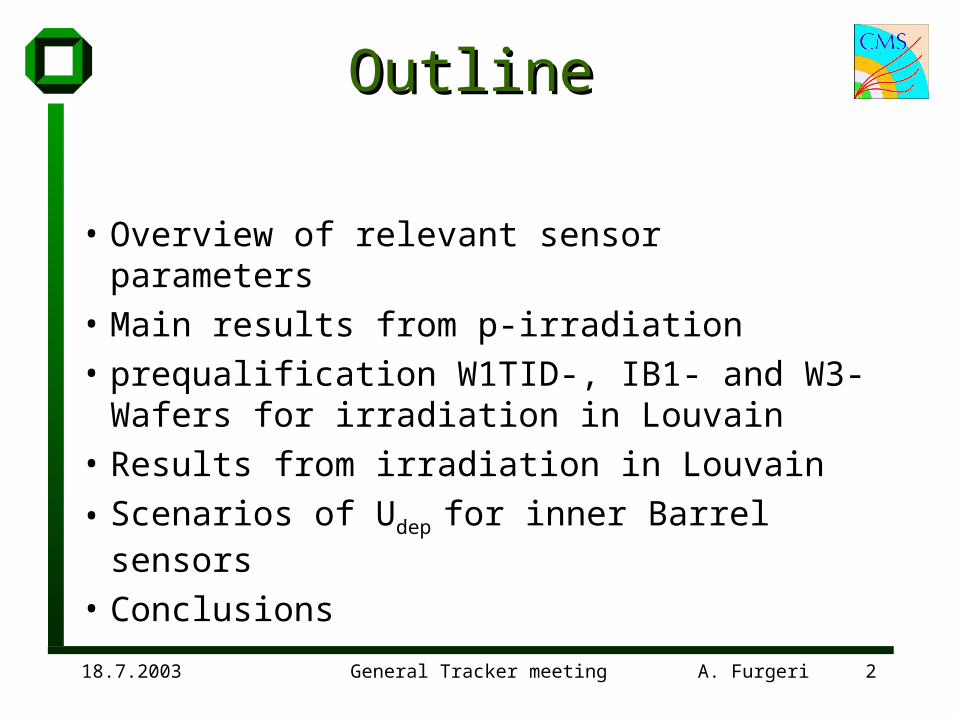
Parameters of sensorsParameters of sensors
Resistivity: expected to be <2kΩcm>varying from 1.25 to 3.25kΩcmµeNeff
1
Full depletion voltage:
Effect of thickness: 320µm 290µm (30µm n+-layer) ~19% less depletion voltage !
22 dNU effe
dep
Higher resistivity lower depletion voltage
For allowed range of resistivity: 130V < Udep <350V
ADeff NNN
18.7.2003 General Tracker meeting A. Furgeri 4
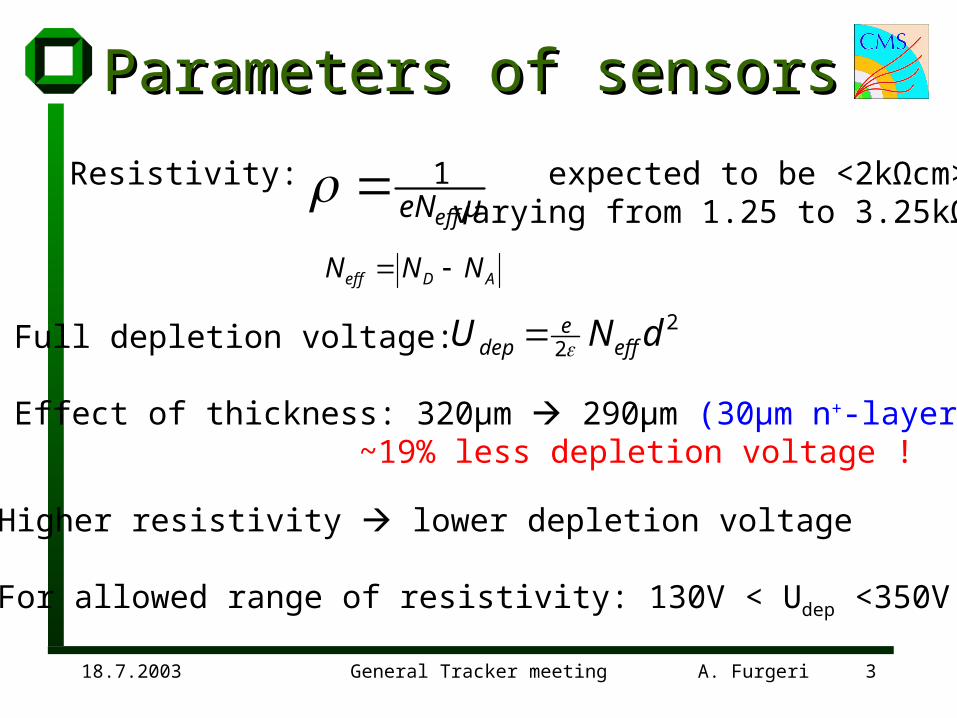
Differences diodesDifferences diodessensorssensorsThe depletion voltage for sensors are also depending from geometrie factors.
pw
dp
diodesensor fUU 21* 316.0pwf
The lowest is : ~1.16 (IB1)The highest is : ~1.31 (W3) Only HPK!
18.7.2003 General Tracker meeting A. Furgeri 5
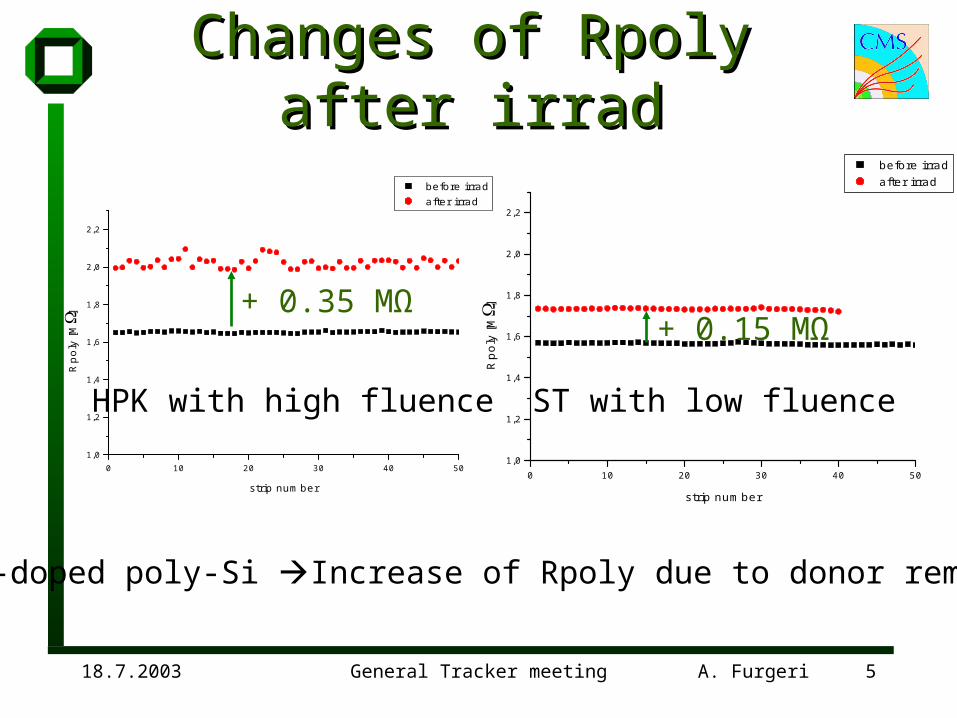
Changes of Rpoly after irradChanges of Rpoly after irrad
0 10 20 30 40 501,0
1,2
1,4
1,6
1,8
2,0
2,2
before irrad after irrad
Rp
oly
[M]
strip number0 10 20 30 40 50
1,0
1,2
1,4
1,6
1,8
2,0
2,2
before irrad after irrad
Rp
oly
[M]
strip number
+ 0.35 MΩ+ 0.15 MΩ
n-doped poly-Si Increase of Rpoly due to donor removal
HPK with high fluence ST with low fluence
18.7.2003 General Tracker meeting A. Furgeri 6
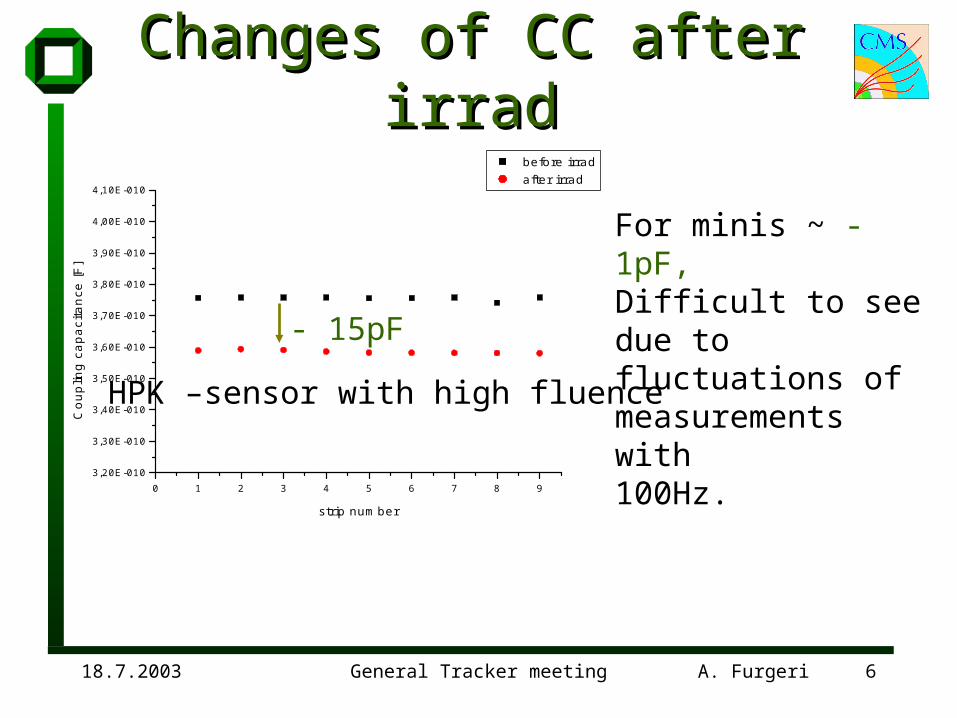
Changes of CC after irradChanges of CC after irrad
0 1 2 3 4 5 6 7 8 93,20E-010
3,30E-010
3,40E-010
3,50E-010
3,60E-010
3,70E-010
3,80E-010
3,90E-010
4,00E-010
4,10E-010
before irrad after irrad
Co
up
ling
ca
pa
cita
nce
[F]
strip number
- 15pF
HPK –sensor with high fluence
For minis ~ -1pF,Difficult to see due to fluctuations of measurements with100Hz.
18.7.2003 General Tracker meeting A. Furgeri 7
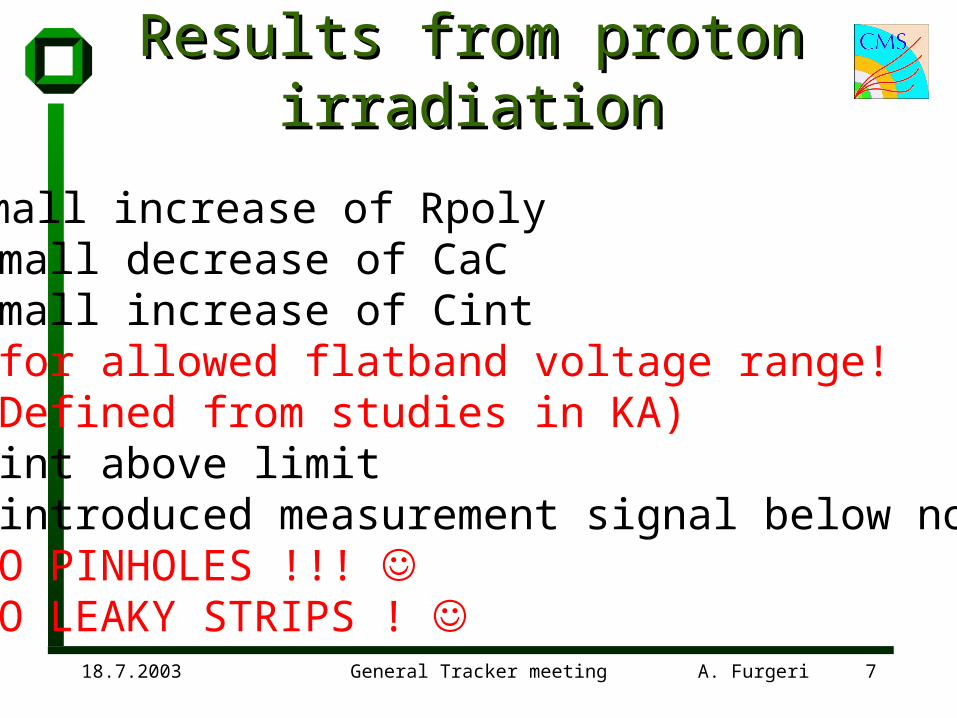
Results from proton irradiationResults from proton irradiation
• Small increase of Rpoly• small decrease of CaC• small increase of Cint (for allowed flatband voltage range! Defined from studies in KA)• Rint above limit (introduced measurement signal below noise)• NO PINHOLES !!! • NO LEAKY STRIPS !
18.7.2003 General Tracker meeting A. Furgeri 8
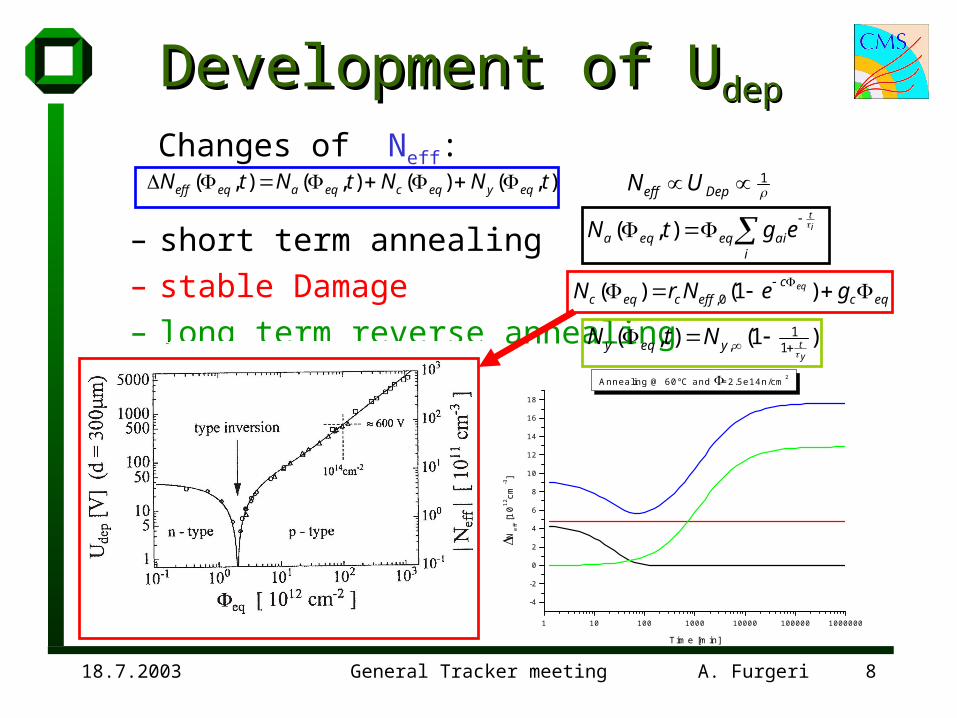
Development of UDevelopment of Udepdep
Changes of Neff:
– short term annealing
– stable Damage
– long term reverse annealing
),()(),(),( tNNtNtN eqyeqceqaeqeff
iaieqeqa
it
egtN ),(
eqcc
effceqc geNrN eq )1()( 0,
)1(),(1
1,
ytyeqy NtN
1 Depeff UN
1 10 100 1000 10000 100000 1000000
-4
-2
0
2
4
6
8
10
12
14
16
18
Annealing @ 60°C and =2.5e14n/cm2
Nef
f [1
012cm
-3]
Time [min]
18.7.2003 General Tracker meeting A. Furgeri 9
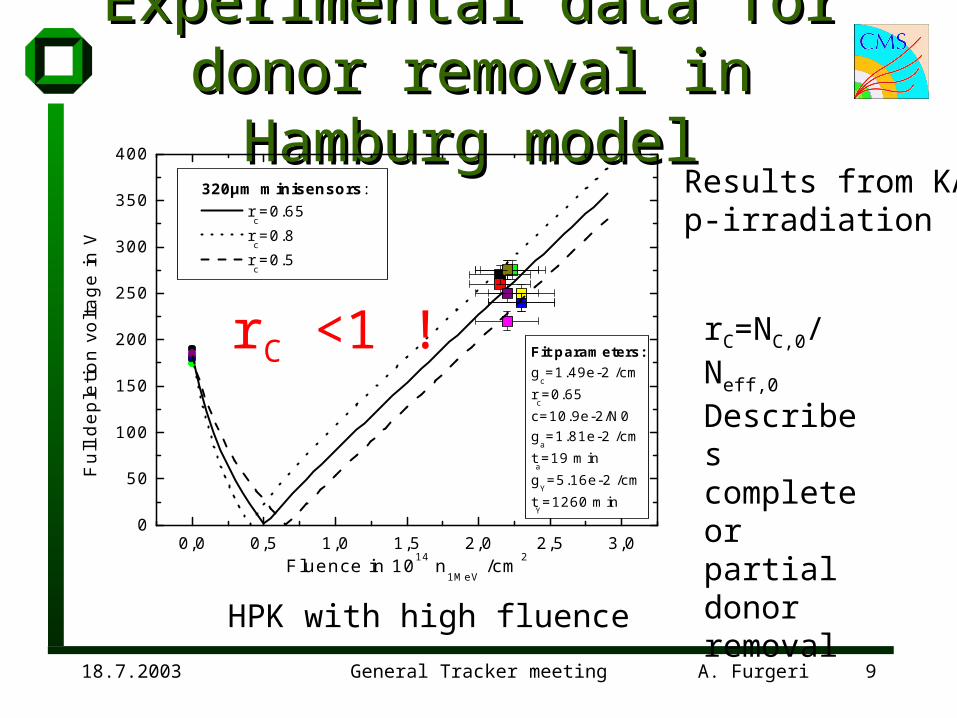
Experimental data for donor Experimental data for donor removal in Hamburg modelremoval in Hamburg model
0,0 0,5 1,0 1,5 2,0 2,5 3,00
50
100
150
200
250
300
350
400
Fit parameters:g
c=1.49e-2 /cm
rc=0.65
c=10.9e-2/N0g
a=1.81e-2 /cm
ta=19 min
gY=5.16e-2 /cm
tY=1260 min
320µm minisensors: r
c=0.65
rc=0.8
rc=0.5
Ful
l dep
letio
n vo
ltage
in V
Fluence in 1014 n1MeV
/cm2
HPK with high fluence
rC=NC,0/Neff,0
Describes complete or partial donor removal
rC <1 !
Results from KAp-irradiation
18.7.2003 General Tracker meeting A. Furgeri 10
Special n-irradiation (high res.)Special n-irradiation (high res.)
• Irradiation in Louvain of IB1,W3 & W1TID– Check for resistivity profile across wafer,
(before irradiation)– Check if sensors follow the Hamburg model !– Adjusting parameters and taking into account
for scenarios– Check of new measurement methods of
Louvain (Rpoly!) and cross check with Karlsruhe
18.7.2003 General Tracker meeting A. Furgeri 11
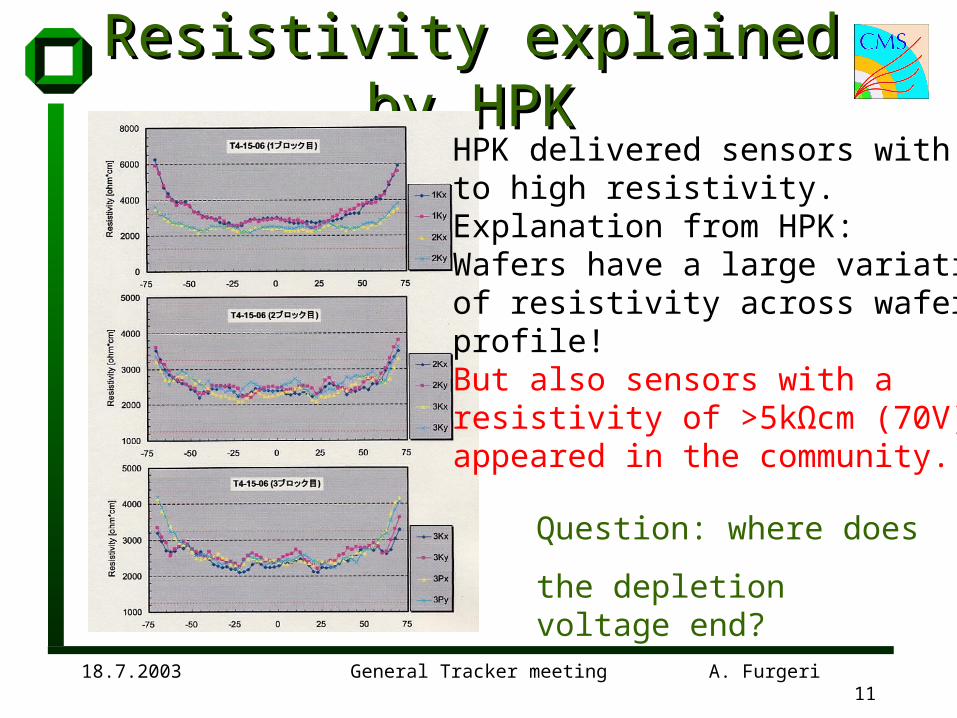
Resistivity explained by HPKResistivity explained by HPKHPK delivered sensors withto high resistivity.Explanation from HPK:Wafers have a large variationof resistivity across waferprofile! But also sensors with a resistivity of >5kΩcm (70V)appeared in the community.
Question: where does
the depletion voltage end?
18.7.2003 General Tracker meeting A. Furgeri 12
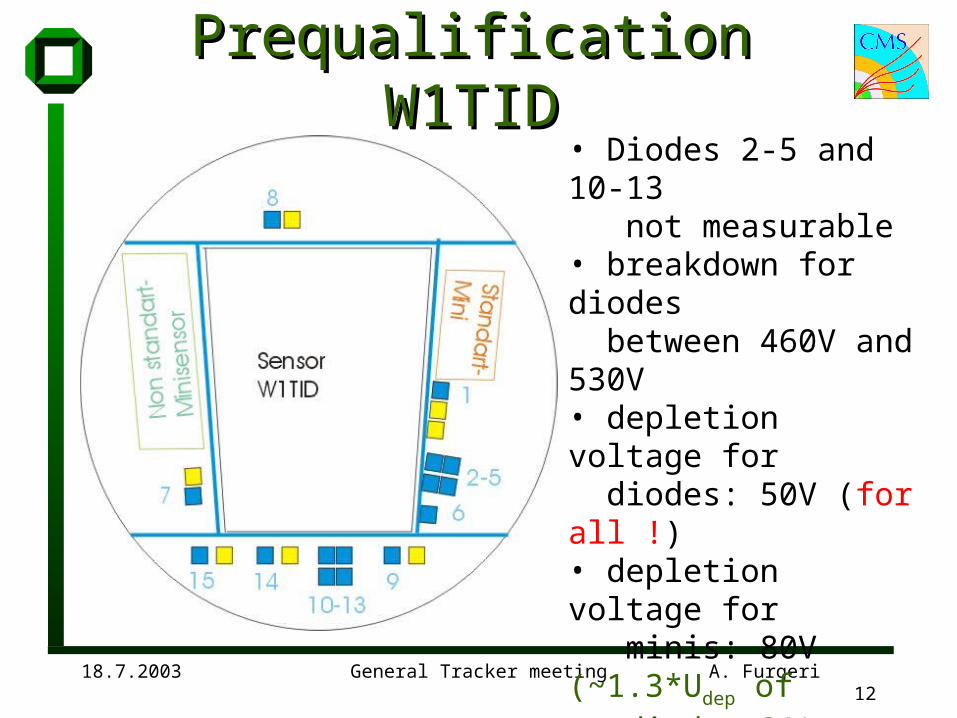
Prequalification W1TIDPrequalification W1TID• Diodes 2-5 and 10-13 not measurable• breakdown for diodes between 460V and 530V• depletion voltage for diodes: 50V (for all !)• depletion voltage for minis: 80V (~1.3*Udep of diodes ?!)• Depletion voltage for sensor 105V (profile of HPK seems to be right)• Same profile for W3
18.7.2003 General Tracker meeting A. Furgeri 13
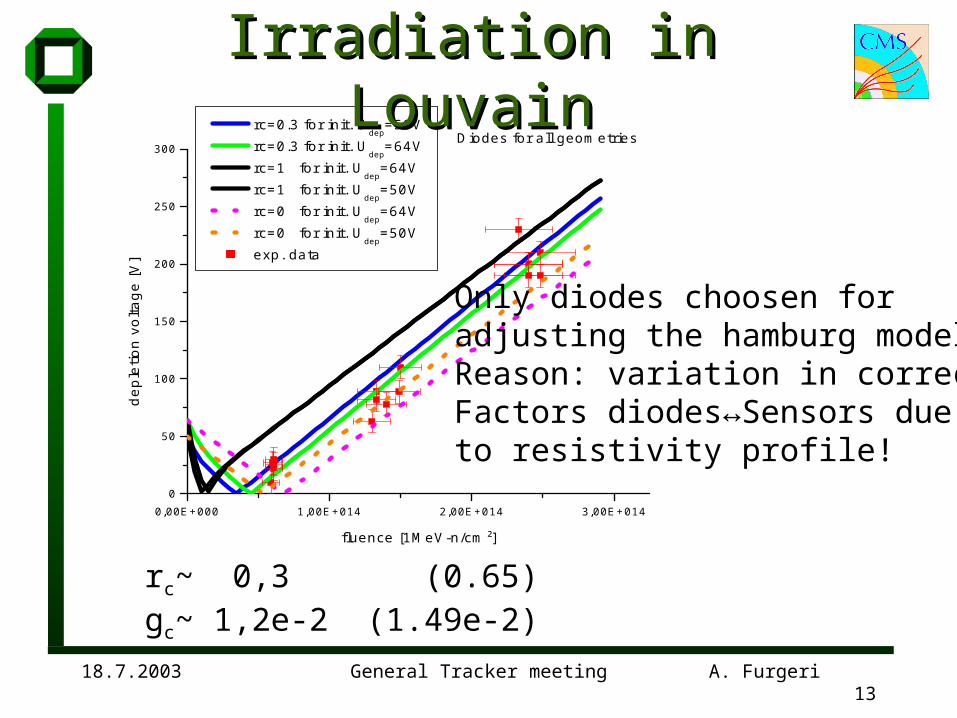
0,00E+000 1,00E+014 2,00E+014 3,00E+0140
50
100
150
200
250
300Diodes for all geometries
rc=0.3 for init. Udep
=50V rc=0.3 for init. U
dep=64V
rc=1 for init. Udep
=64V rc=1 for init. U
dep=50V
rc=0 for init. Udep
=64V rc=0 for init. U
dep=50V
exp. data
de
ple
tion
vo
ltag
e [V
]
fluence [1MeV-n/cm²]
Irradiation in LouvainIrradiation in Louvain
rc~ 0,3 (0.65)gc~ 1,2e-2 (1.49e-2)
Only diodes choosen foradjusting the hamburg model!Reason: variation in correctionFactors diodes↔Sensors due to resistivity profile!
18.7.2003 General Tracker meeting A. Furgeri 14
Irradiation in LouvainIrradiation in Louvain
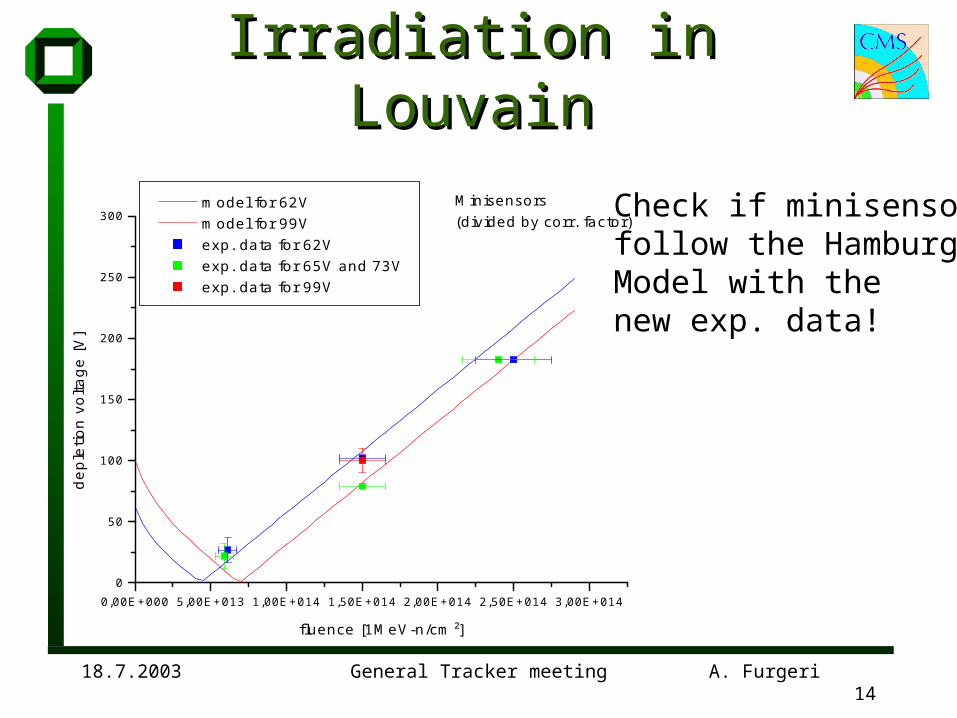
0,00E+000 5,00E+013 1,00E+014 1,50E+014 2,00E+014 2,50E+014 3,00E+0140
50
100
150
200
250
300Minisensors (divided by corr. factor)
model for 62V model for 99V exp. data for 62V exp. data for 65V and 73V exp. data for 99V
de
ple
tion
vo
ltag
e [V
]
fluence [1MeV-n/cm²]
Check if minisensorsfollow the HamburgModel with the new exp. data!
18.7.2003 General Tracker meeting A. Furgeri 15
Irradiation in LouvainIrradiation in Louvain
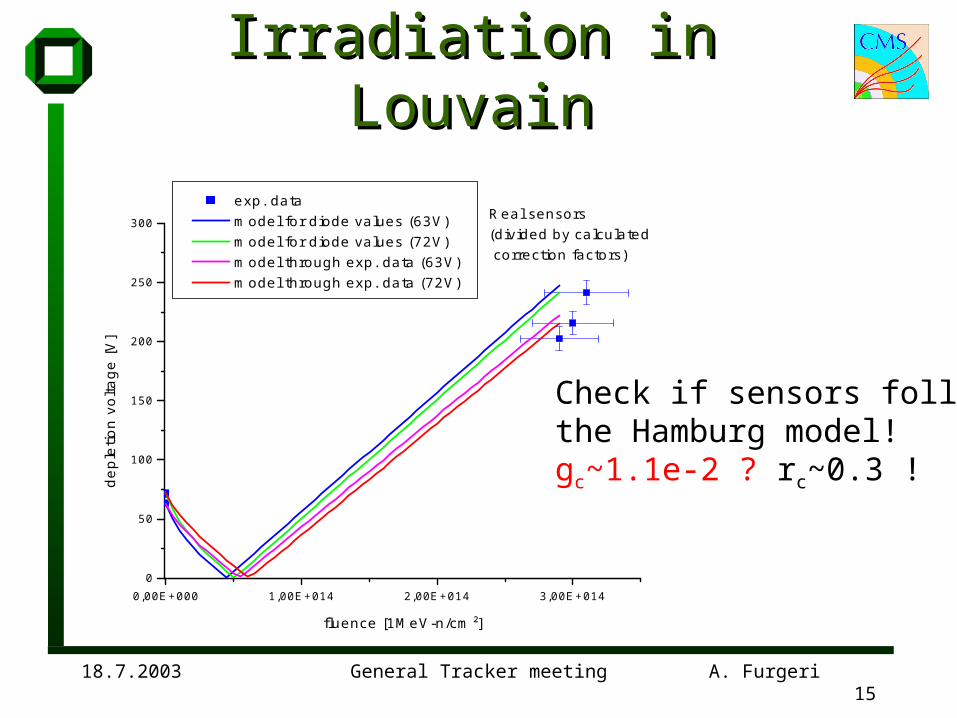
0,00E+000 1,00E+014 2,00E+014 3,00E+0140
50
100
150
200
250
300Real sensors (divided by calculated correction factors)
exp. data model for diode values (63V) model for diode values (72V) model through exp. data (63V) model through exp. data (72V)
de
ple
tion
vo
ltag
e [V
]
fluence [1MeV-n/cm²]
Check if sensors followthe Hamburg model!gc~1.1e-2 ? rc~0.3 !
18.7.2003 General Tracker meeting A. Furgeri 16
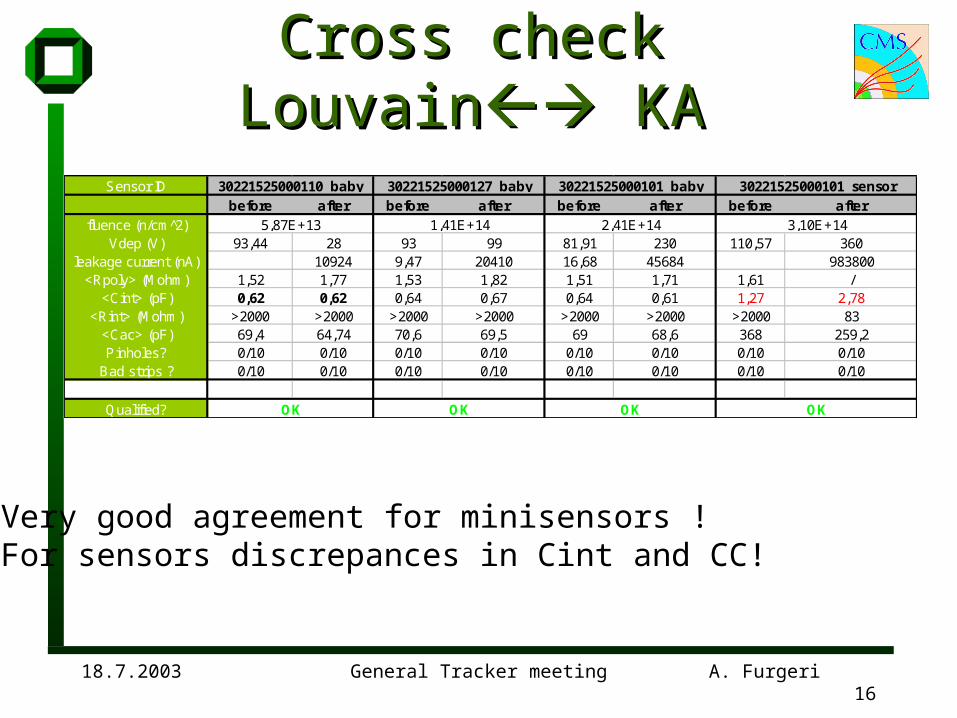
Cross check LouvainCross check Louvain KA KA
Sensor IDbefore after before after before after before after
fluence (n/cm 2̂)Vdep (V) 93,44 28 93 99 81,91 230 110,57 360
leakage current (nA) 10924 9,47 20410 16,68 45684 983800<Rpoly> (Mohm) 1,52 1,77 1,53 1,82 1,51 1,71 1,61 /
<Cint> (pF) 0,62 0,62 0,64 0,67 0,64 0,61 1,27 2,78<Rint> (Mohm) >2000 >2000 >2000 >2000 >2000 >2000 >2000 83
<Cac> (pF) 69,4 64,74 70,6 69,5 69 68,6 368 259,2Pinholes? 0/10 0/10 0/10 0/10 0/10 0/10 0/10 0/10
Bad strips ? 0/10 0/10 0/10 0/10 0/10 0/10 0/10 0/10
Qualified?
30221525000101_baby
OK
30221525000101_sensor
OK
2,41E+14 3,10E+14
30221525000110_baby
OK
30221525000127_baby
OK
5,87E+13 1,41E+14
Very good agreement for minisensors !For sensors discrepances in Cint and CC!
18.7.2003 General Tracker meeting A. Furgeri 17
Batches with high resistivityBatches with high resistivity
• HPK delivers sensors with high resistivity– higher depletion voltage in the end of CMS expected– Luminosity in the tracker
• 1. year 10%• 2. year 33%• 3. year 67%• 4.-10. year 100%
– Sensor fluence in reality depending from the location in the tracker
• Radial location (especially for charged Hadron fluence)• Z-location (especially for neutron fluence in the endcaps)
18.7.2003 General Tracker meeting A. Furgeri 18
Fluence distribution in the Fluence distribution in the trackertracker
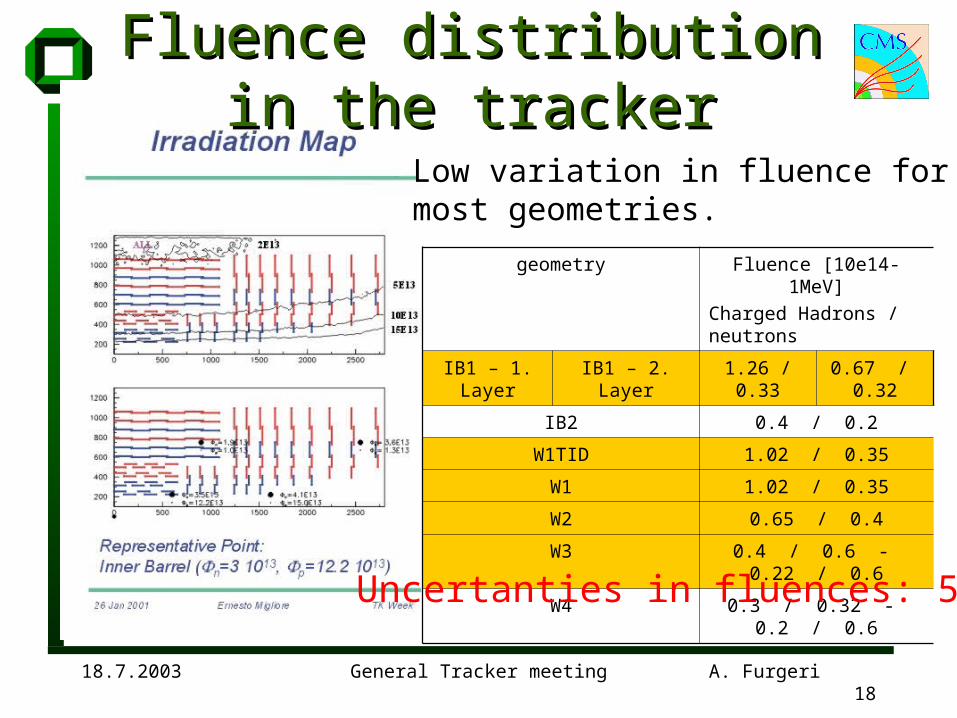
Low variation in fluence formost geometries.
geometry Fluence [10e14-1MeV]
Charged Hadrons / neutrons
IB1 – 1. Layer IB1 – 2. Layer 1.26 / 0.33 0.67 / 0.32
IB2 0.4 / 0.2
W1TID 1.02 / 0.35
W1 1.02 / 0.35
W2 0.65 / 0.4
W3 0.4 / 0.6 - 0.22 / 0.6
W4 0.3 / 0.32 - 0.2 / 0.6
Uncertanties in fluences: 50%
18.7.2003 General Tracker meeting A. Furgeri 19
Calculation of the scenarioCalculation of the scenario
• Local Distribution of fluence in the Tracker– Tracker-TDR
– comparison with E. Migliore (same source ?!)
• Fluences for different geometries• Per year:
1. Irradiation (at once)
2. Beneficial annealing (10°C & 20°C)
3. Reverse annealing (10°C & 20°C)
• Scenario for 10 years• time without beam and annealing not shown
18.7.2003 General Tracker meeting A. Furgeri 20
Time constants for HHTime constants for HH
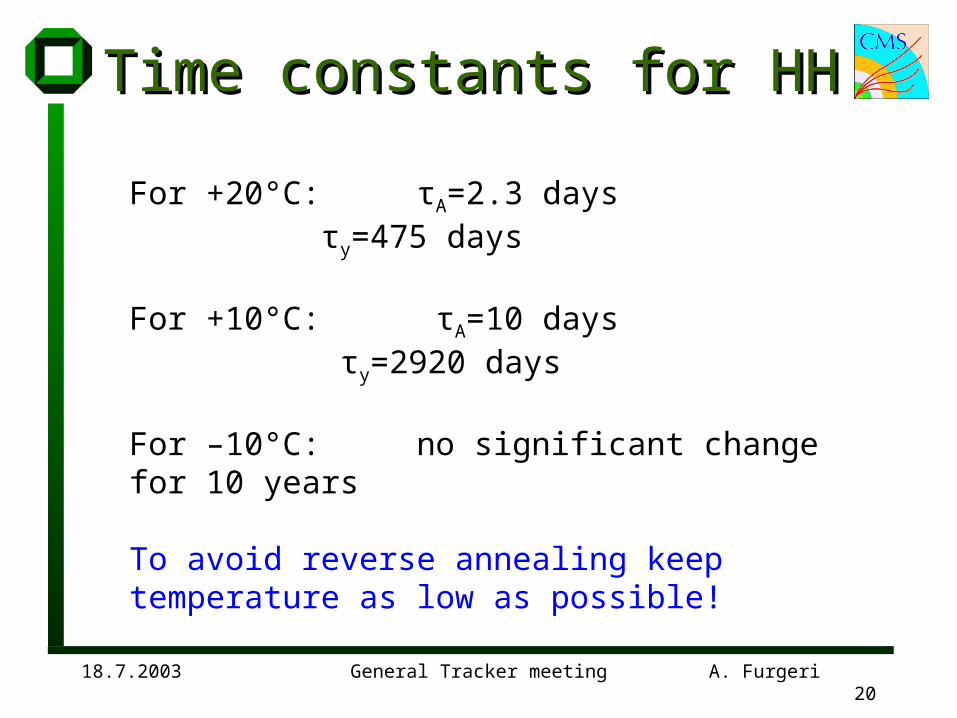
For +20°C: τA=2.3 daysτy=475 days
For +10°C: τA=10 days τy=2920 days
For –10°C: no significant change for 10 years
To avoid reverse annealing keep temperature as low as possible!
18.7.2003 General Tracker meeting A. Furgeri 21
Differences Differences A. FurgeriA. Furgeri E. Migliore E. Migliore
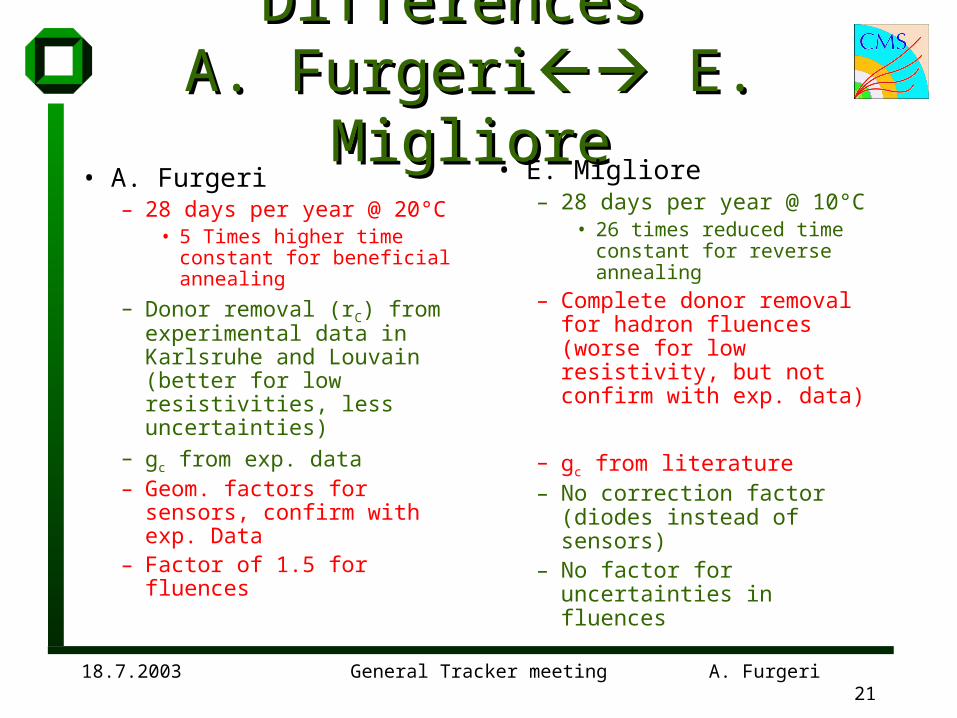
• A. Furgeri– 28 days per year @ 20°C
• 5 Times higher time constant for beneficial annealing
– Donor removal (rC) from experimental data in Karlsruhe and Louvain (better for low resistivities, less uncertainties)
– gc from exp. data– Geom. factors for sensors,
confirm with exp. Data– Factor of 1.5 for fluences
• E. Migliore– 28 days per year @ 10°C
• 26 times reduced time constant for reverse annealing
– Complete donor removal for hadron fluences (worse for low resistivity, but not confirm with exp. data)
– gc from literature– No correction factor (diodes
instead of sensors)– No factor for uncertainties
in fluences
18.7.2003 General Tracker meeting A. Furgeri 22
What‘s the allowed maximum What‘s the allowed maximum for depletion voltage?for depletion voltage?
• Max. 600V from power supplies• Factor of 1.5 for over depletion neededMaximum for depletion voltage of 400V ?!
Let‘s look where we are !
18.7.2003 General Tracker meeting A. Furgeri 23
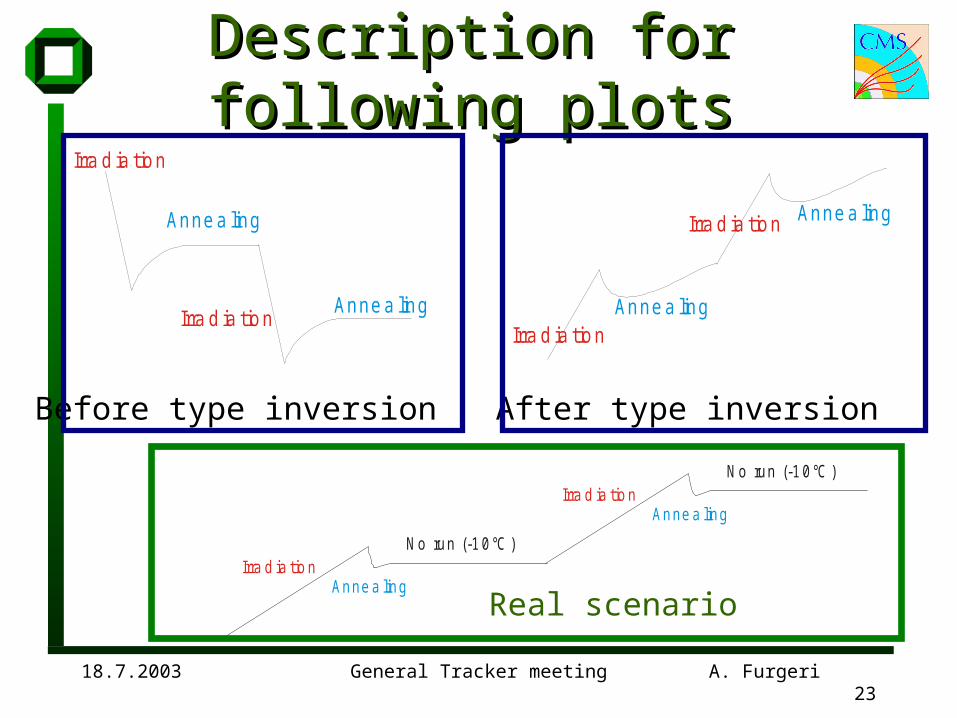
Description for following plotsDescription for following plotsIrra d ia tio n
Anne a ling
Irra d ia tio nAnne a ling
Irra d ia tio n
Irra d ia tio nAnne a ling
Anne a ling
Before type inversion After type inversion
Irra d ia tio nAnne a ling
N o run (-1 0°C )
Irra d ia tio nAnne a ling
N o run (-1 0°C )
Real scenario
18.7.2003 General Tracker meeting A. Furgeri 24
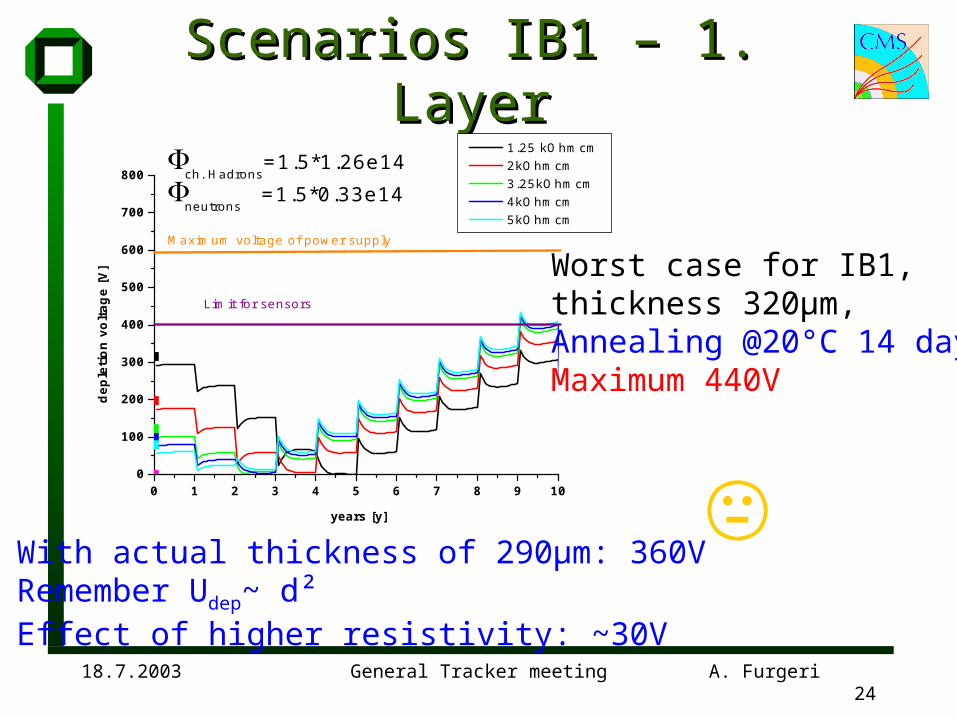
Scenarios IB1 – 1. LayerScenarios IB1 – 1. Layer
0 1 2 3 4 5 6 7 8 9 100
100
200
300
400
500
600
700
800
Maximum voltage of power supply
Limit for sensors
ch. Hadrons
=1.5*1.26e14
neutrons =1.5*0.33e14
1.25 kOhmcm 2kOhmcm 3.25kOhmcm 4kOhmcm 5kOhmcm
dep
leti
on
vo
ltag
e [V
]
years [y]
Worst case for IB1,thickness 320µm,Annealing @20°C 14 days,Maximum 440V
With actual thickness of 290µm: 360VRemember Udep~ d²Effect of higher resistivity: ~30V
18.7.2003 General Tracker meeting A. Furgeri 25
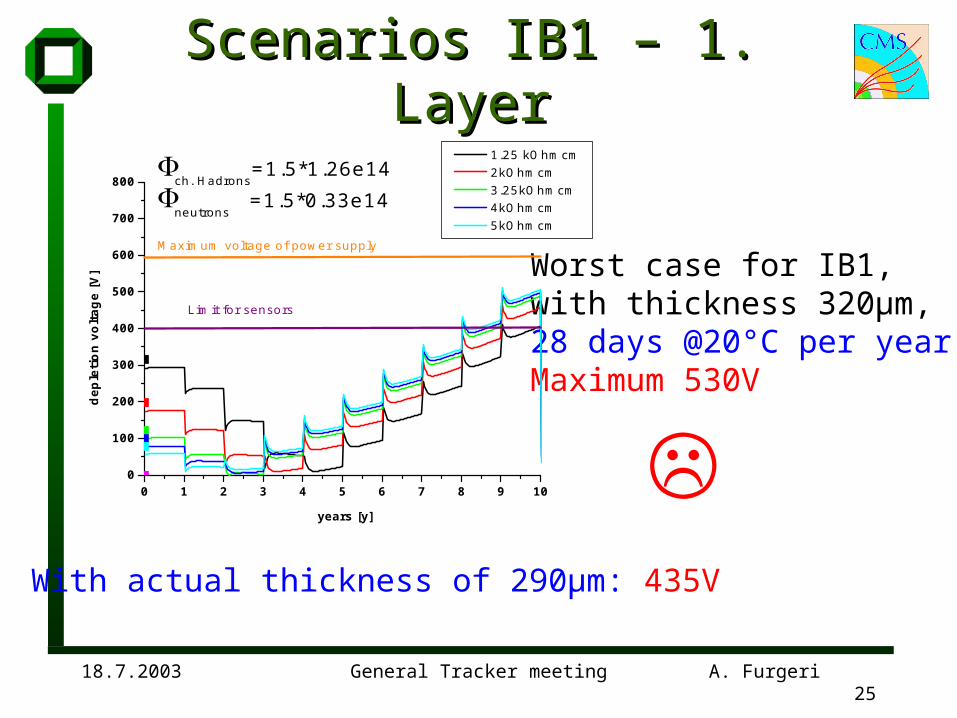
Scenarios IB1 – 1. LayerScenarios IB1 – 1. Layer
Worst case for IB1,with thickness 320µm,28 days @20°C per yearMaximum 530V
0 1 2 3 4 5 6 7 8 9 100
100
200
300
400
500
600
700
800
Maximum voltage of power supply
Limit for sensors
ch. Hadrons
=1.5*1.26e14
neutrons =1.5*0.33e14
1.25 kOhmcm 2kOhmcm 3.25kOhmcm 4kOhmcm 5kOhmcm
dep
leti
on
vo
ltag
e [V
]
years [y]
With actual thickness of 290µm: 435V
18.7.2003 General Tracker meeting A. Furgeri 26
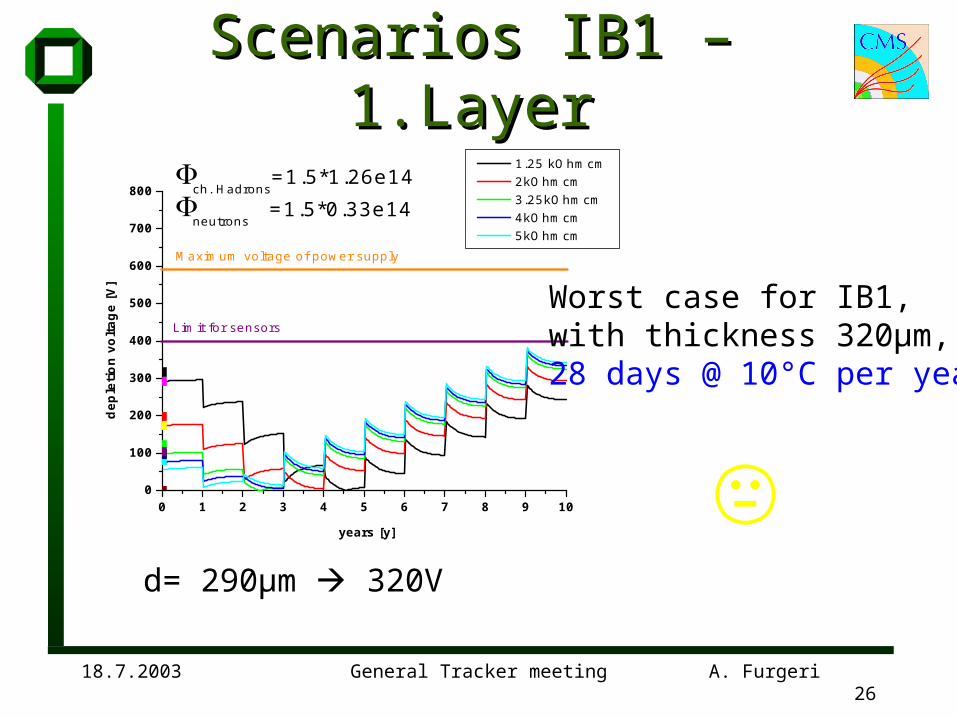
Scenarios IB1 – 1.LayerScenarios IB1 – 1.Layer
0 1 2 3 4 5 6 7 8 9 100
100
200
300
400
500
600
700
800
Maximum voltage of power supply
Limit for sensors
ch. Hadrons
=1.5*1.26e14
neutrons =1.5*0.33e14
1.25 kOhmcm 2kOhmcm 3.25kOhmcm 4kOhmcm 5kOhmcm
dep
leti
on
vo
ltag
e [V
]
years [y]
Worst case for IB1,with thickness 320µm,28 days @ 10°C per year
d= 290µm 320V
18.7.2003 General Tracker meeting A. Furgeri 27
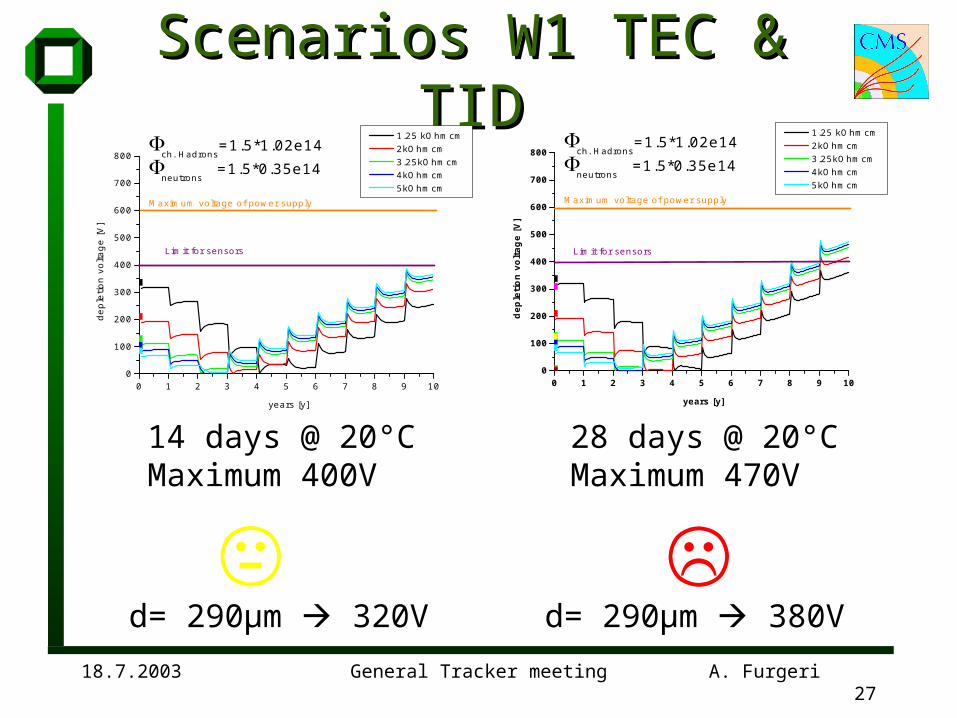
Scenarios W1 TEC & TIDScenarios W1 TEC & TID
0 1 2 3 4 5 6 7 8 9 100
100
200
300
400
500
600
700
800
Maximum voltage of power supply
Limit for sensors
ch. Hadrons
=1.5*1.02e14
neutrons =1.5*0.35e14
1.25 kOhmcm 2kOhmcm 3.25kOhmcm 4kOhmcm 5kOhmcm
depl
etio
n vo
ltage
[V]
years [y]
14 days @ 20°CMaximum 400V
28 days @ 20°CMaximum 470V
0 1 2 3 4 5 6 7 8 9 100
100
200
300
400
500
600
700
800
Maximum voltage of power supply
Limit for sensors
ch. Hadrons
=1.5*1.02e14
neutrons =1.5*0.35e14
1.25 kOhmcm 2kOhmcm 3.25kOhmcm 4kOhmcm 5kOhmcm
dep
leti
on
vo
ltag
e [V
]
years [y]
d= 290µm 380Vd= 290µm 320V
18.7.2003 General Tracker meeting A. Furgeri 28
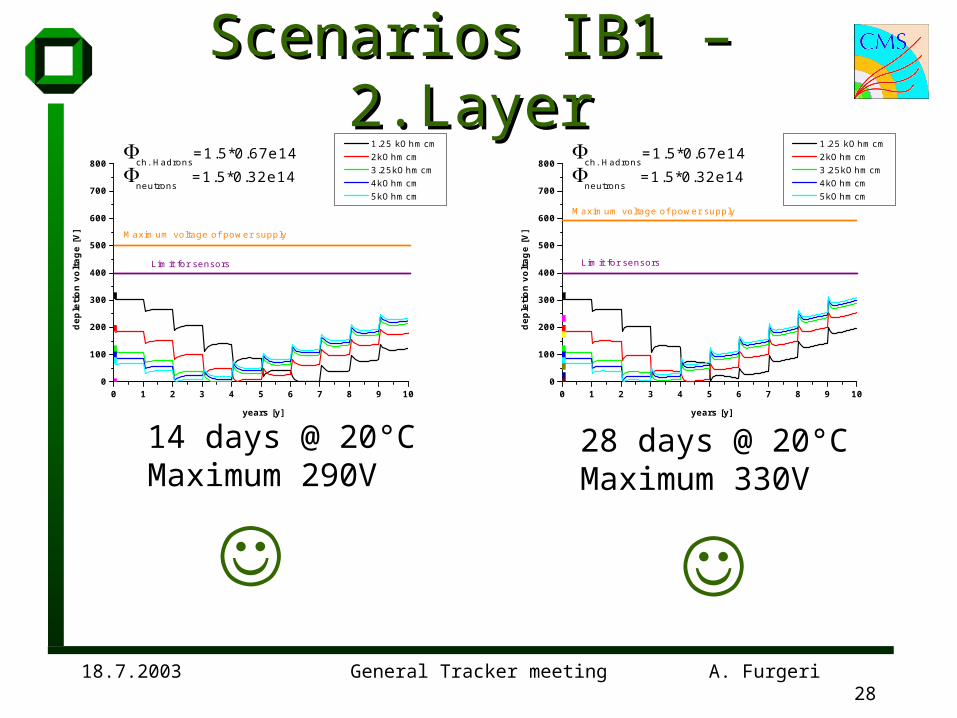
Scenarios IB1 – 2.LayerScenarios IB1 – 2.Layer
0 1 2 3 4 5 6 7 8 9 100
100
200
300
400
500
600
700
800
Maximum voltage of power supply
Limit for sensors
ch. Hadrons
=1.5*0.67e14
neutrons =1.5*0.32e14
1.25 kOhmcm 2kOhmcm 3.25kOhmcm 4kOhmcm 5kOhmcm
dep
leti
on
vo
ltag
e [V
]
years [y]
14 days @ 20°CMaximum 290V
28 days @ 20°CMaximum 330V
0 1 2 3 4 5 6 7 8 9 100
100
200
300
400
500
600
700
800
Maximum voltage of power supply
Limit for sensors
ch. Hadrons
=1.5*0.67e14
neutrons =1.5*0.32e14
1.25 kOhmcm 2kOhmcm 3.25kOhmcm 4kOhmcm 5kOhmcm
dep
leti
on
vo
ltag
e [V
]
years [y]
18.7.2003 General Tracker meeting A. Furgeri 29
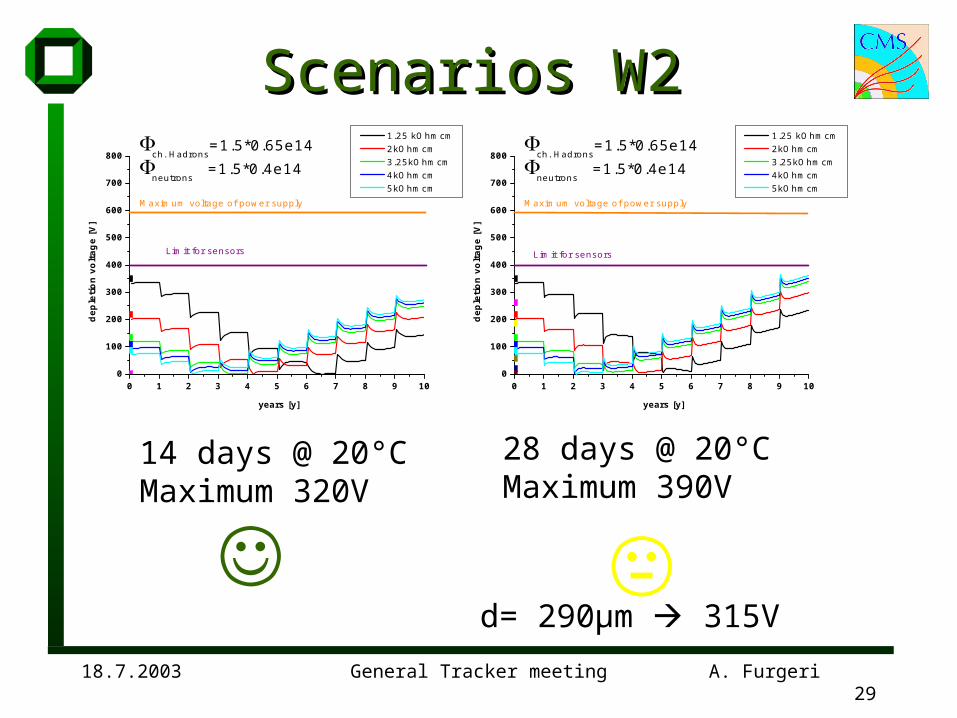
Scenarios W2Scenarios W2
0 1 2 3 4 5 6 7 8 9 100
100
200
300
400
500
600
700
800
Maximum voltage of power supply
Limit for sensors
ch. Hadrons
=1.5*0.65e14
neutrons =1.5*0.4e14
1.25 kOhmcm 2kOhmcm 3.25kOhmcm 4kOhmcm 5kOhmcm
dep
leti
on
vo
ltag
e [V
]
years [y]
14 days @ 20°CMaximum 320V
28 days @ 20°CMaximum 390V
0 1 2 3 4 5 6 7 8 9 100
100
200
300
400
500
600
700
800
Maximum voltage of power supply
Limit for sensors
ch. Hadrons
=1.5*0.65e14
neutrons =1.5*0.4e14
1.25 kOhmcm 2kOhmcm 3.25kOhmcm 4kOhmcm 5kOhmcm
dep
leti
on
vo
ltag
e [V
]
years [y]
d= 290µm 315V
18.7.2003 General Tracker meeting A. Furgeri 30
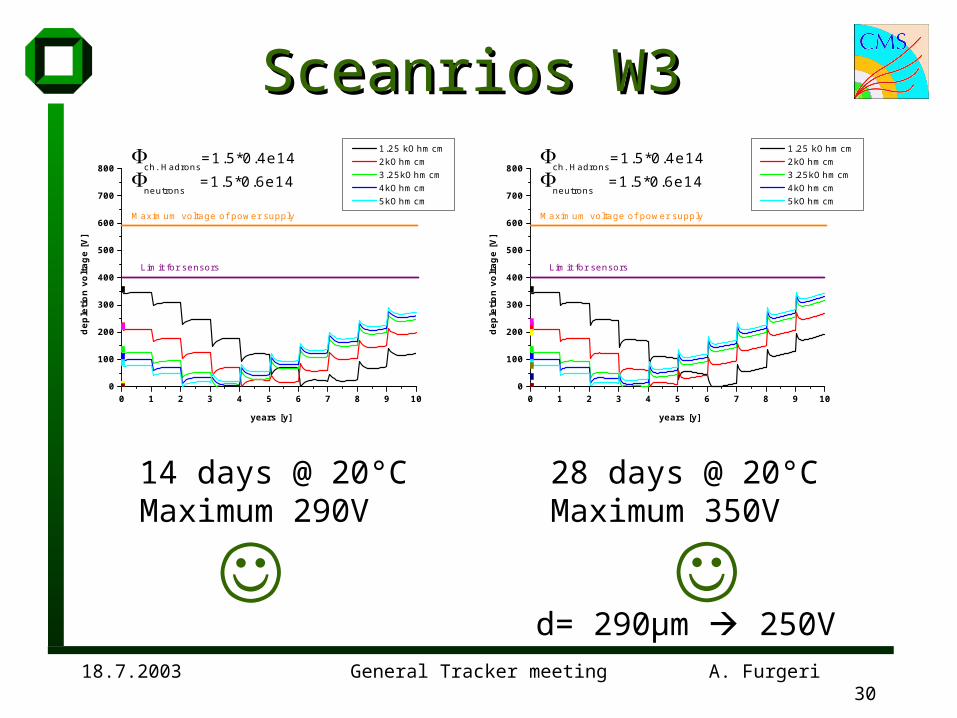
Sceanrios W3Sceanrios W3
14 days @ 20°CMaximum 290V
28 days @ 20°CMaximum 350V
0 1 2 3 4 5 6 7 8 9 100
100
200
300
400
500
600
700
800
Maximum voltage of power supply
Limit for sensors
ch. Hadrons
=1.5*0.4e14
neutrons =1.5*0.6e14
1.25 kOhmcm 2kOhmcm 3.25kOhmcm 4kOhmcm 5kOhmcm
dep
leti
on
vo
ltag
e [V
]
years [y]
0 1 2 3 4 5 6 7 8 9 100
100
200
300
400
500
600
700
800
Maximum voltage of power supply
Limit for sensors
ch. Hadrons
=1.5*0.4e14
neutrons =1.5*0.6e14
1.25 kOhmcm 2kOhmcm 3.25kOhmcm 4kOhmcm 5kOhmcm
dep
leti
on
vo
ltag
e [V
]
years [y]
d= 290µm 250V
18.7.2003 General Tracker meeting A. Furgeri 31
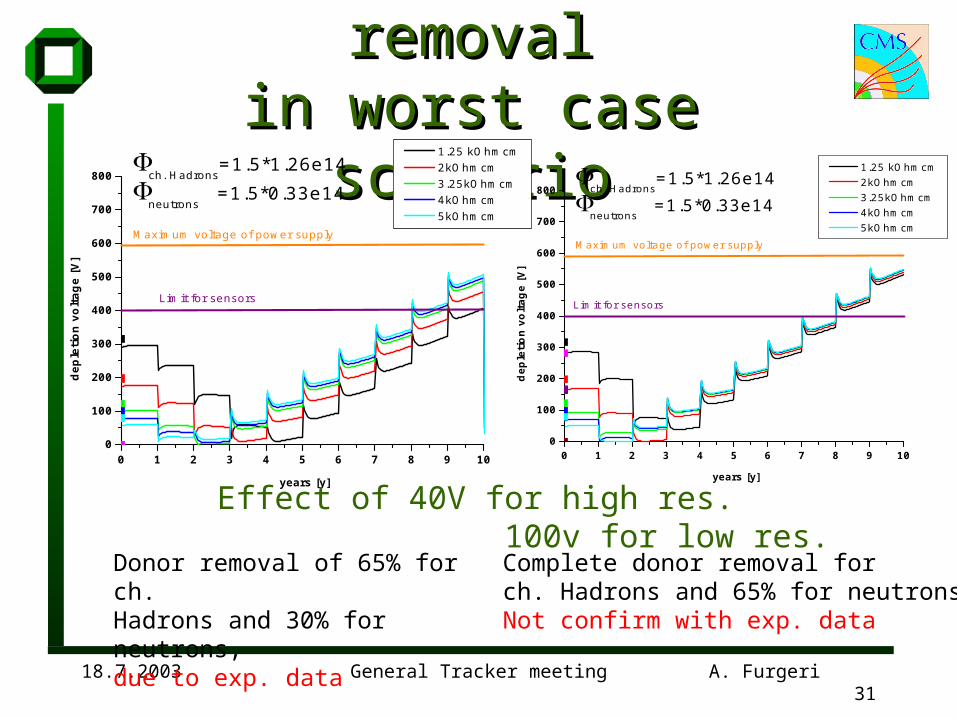
Different donor removalDifferent donor removalin worst case scenarioin worst case scenario
Donor removal of 65% for ch. Hadrons and 30% for neutrons, due to exp. data
Complete donor removal for ch. Hadrons and 65% for neutronsNot confirm with exp. data
0 1 2 3 4 5 6 7 8 9 100
100
200
300
400
500
600
700
800
Maximum voltage of power supply
Limit for sensors
ch. Hadrons
=1.5*1.26e14
neutrons =1.5*0.33e14
1.25 kOhmcm 2kOhmcm 3.25kOhmcm 4kOhmcm 5kOhmcm
dep
leti
on
vo
ltag
e [V
]
years [y]
Effect of 40V for high res. 100v for low res.
0 1 2 3 4 5 6 7 8 9 100
100
200
300
400
500
600
700
800
Maximum voltage of power supply
Limit for sensors
ch. Hadrons
=1.5*1.26e14
neutrons =1.5*0.33e14
1.25 kOhmcm 2kOhmcm 3.25kOhmcm 4kOhmcm 5kOhmcm
dep
leti
on
vo
ltag
e [V
]
years [y]
18.7.2003 General Tracker meeting A. Furgeri 32
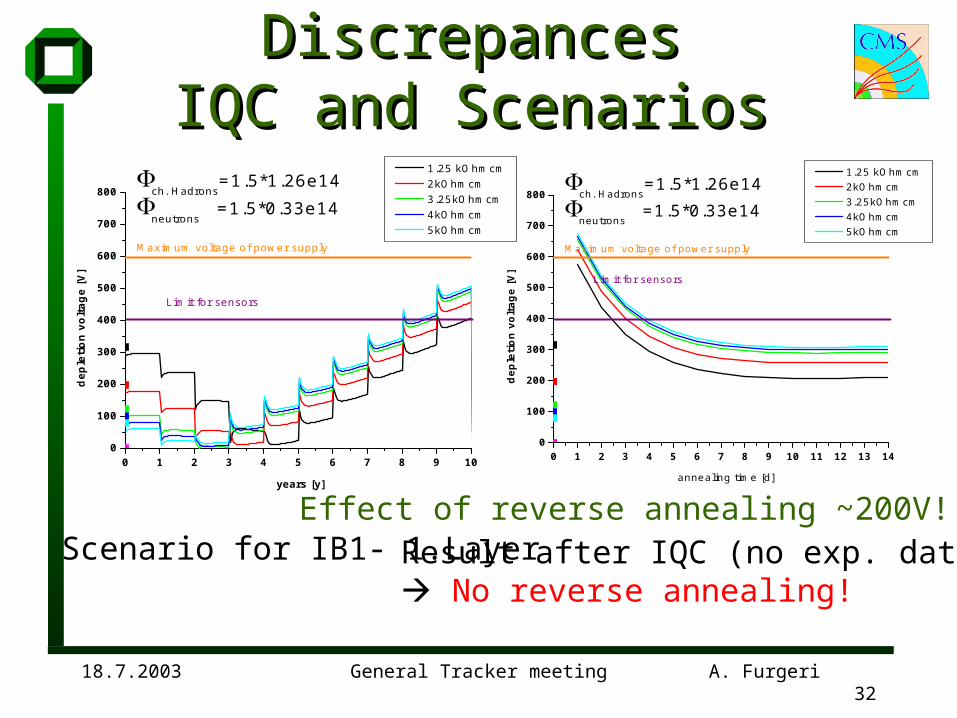
DiscrepancesDiscrepancesIQC and ScenariosIQC and Scenarios
Result after IQC (no exp. data!) No reverse annealing!
0 1 2 3 4 5 6 7 8 9 100
100
200
300
400
500
600
700
800
Maximum voltage of power supply
Limit for sensors
ch. Hadrons
=1.5*1.26e14
neutrons =1.5*0.33e14
1.25 kOhmcm 2kOhmcm 3.25kOhmcm 4kOhmcm 5kOhmcm
dep
leti
on
vo
ltag
e [V
]
years [y]
0 1 2 3 4 5 6 7 8 9 10 11 12 13 140
100
200
300
400
500
600
700
800
Maximum voltage of power supply
Limit for sensors
ch. Hadrons
=1.5*1.26e14
neutrons =1.5*0.33e14
1.25 kOhmcm 2kOhmcm 3.25kOhmcm 4kOhmcm 5kOhmcm
dep
leti
on
vo
ltag
e [V
]
annealing time [d]
Scenario for IB1- 1.LayerEffect of reverse annealing ~200V!
18.7.2003 General Tracker meeting A. Furgeri 33
Summary of uncertaintiesSummary of uncertainties• Donor removal ? Irradiation in Lubljana in progress (9
minis) for different fluences. (higher statistic)
• Temperature during shutdown and repair periods ?
– CONDITIONS CONTROLLED ?!
– Avoid reverse annealing ! Try to keep temperature below 20°C ! max. of +10°C for 4 weeks?!
• Time of shutdown and repair periods ?
– Open (warm up) the Tracker as late as possible !
• Fluences in different running periods ?
• Effectiv thickness of sensors ? Changes in production?
• … Ask me again after 10 years!
18.7.2003 General Tracker meeting A. Furgeri 34
ConclusionsConclusions• Worst case for IB1,(W1TEC & W1TID?) needs
~700V bias voltage, but expected to be better• Separation of sensors with different resistivities
possible for IB1 (1. & 2. Layer) • No separation possible for W1 and W1TID• IB2,W2,W3 & W4 not critical (high res.
accepted)• Question of high resistivity: Sensors accepted,
with compromise, that the next sensors of IB1 will have a lower resistivity (1.25-2 kOhmcm)