Embed Size (px)
Citation preview
Enabling Stakeholders formulate policies, plan and make decisions.
Ann
ual R
epor
t 20
18
/19
Annual Report 2018/19


Statistics Botswana
Private Bag 0024
Gaborone
September 27, 2019
The Honourable Minister Kenneth O. Matambo
Ministry of Finance and Economic Development
Private Bag 008
Gaborone
Dear Sir,
In accordance with Section 25 (1) of the Statistics Act of
2009, I hereby submit the Annual Report for Statistics
Botswana for the year ended 31st March 2019.
Letsema G. Motsemme
Statistics Botswana Board Chairman
LETTER TO THE MINISTER
Annual Report 2018/19
0 1
0 2
Annual Report 2018/19
TABLE OF CONTENTS
Introduction 03
Strategic Foundations 04
Statistics Botswana 06
Strategy Map
Board of Directors 08
Board Chairman’s Statement 10
Corporate Goverance 14
Internal Audit and Risk 16Management
Executive Management 18
Statistician General’s Review 20
Statistics Highlights 26
Consumer Price Index (CPI) 28
Gross Domestic Product (GDP) 29
International Merchandise Trade 30
Formal Sector Employment 31
Work Permits 32
Botswana Demographic Survey 33
Human Resources Management 34
Marketing of Official Statistics 38and Brand Visibility
Financial Statements 41
Appendices 68
0 2
Annual Report 2018/19
0 3
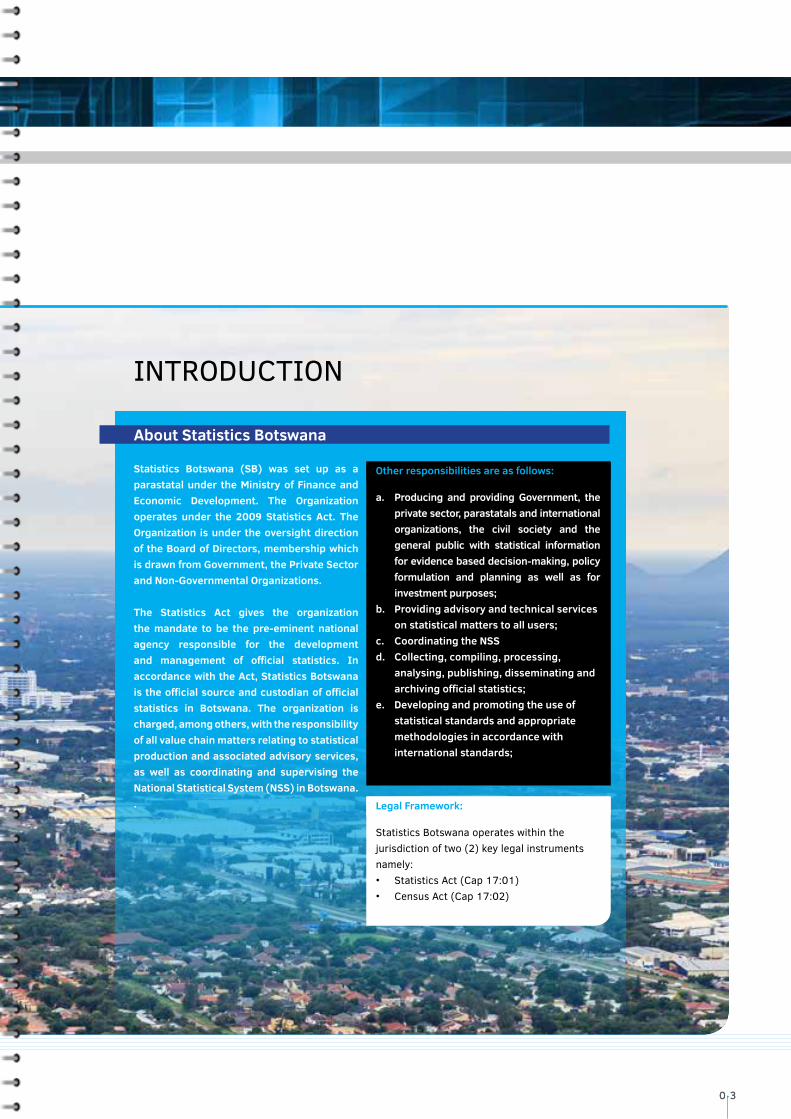
INTRODUCTION
About Statistics Botswana
Statistics Botswana (SB) was set up as a parastatal under the Ministry of Finance and Economic Development. The Organization operates under the 2009 Statistics Act. The Organization is under the oversight direction of the Board of Directors, membership which is drawn from Government, the Private Sector and Non-Governmental Organizations.
The Statistics Act gives the organization the mandate to be the pre-eminent national agency responsible for the development and management of official statistics. In accordance with the Act, Statistics Botswana is the official source and custodian of official statistics in Botswana. The organization is charged, among others, with the responsibility of all value chain matters relating to statistical production and associated advisory services, as well as coordinating and supervising the National Statistical System (NSS) in Botswana..
Other responsibilities are as follows:
a. Producing and providing Government, the private sector, parastatals and international organizations, the civil society and the general public with statistical information for evidence based decision-making, policy formulation and planning as well as for investment purposes;
b. Providing advisory and technical services on statistical matters to all users;
c. Coordinating the NSSd. Collecting, compiling, processing,
analysing, publishing, disseminating and archiving official statistics;
e. Developing and promoting the use of statistical standards and appropriate methodologies in accordance with international standards;
Legal Framework:
Statistics Botswana operates within the jurisdiction of two (2) key legal instruments namely: • Statistics Act (Cap 17:01) • Census Act (Cap 17:02)
0 3
Annual Report 2018/19
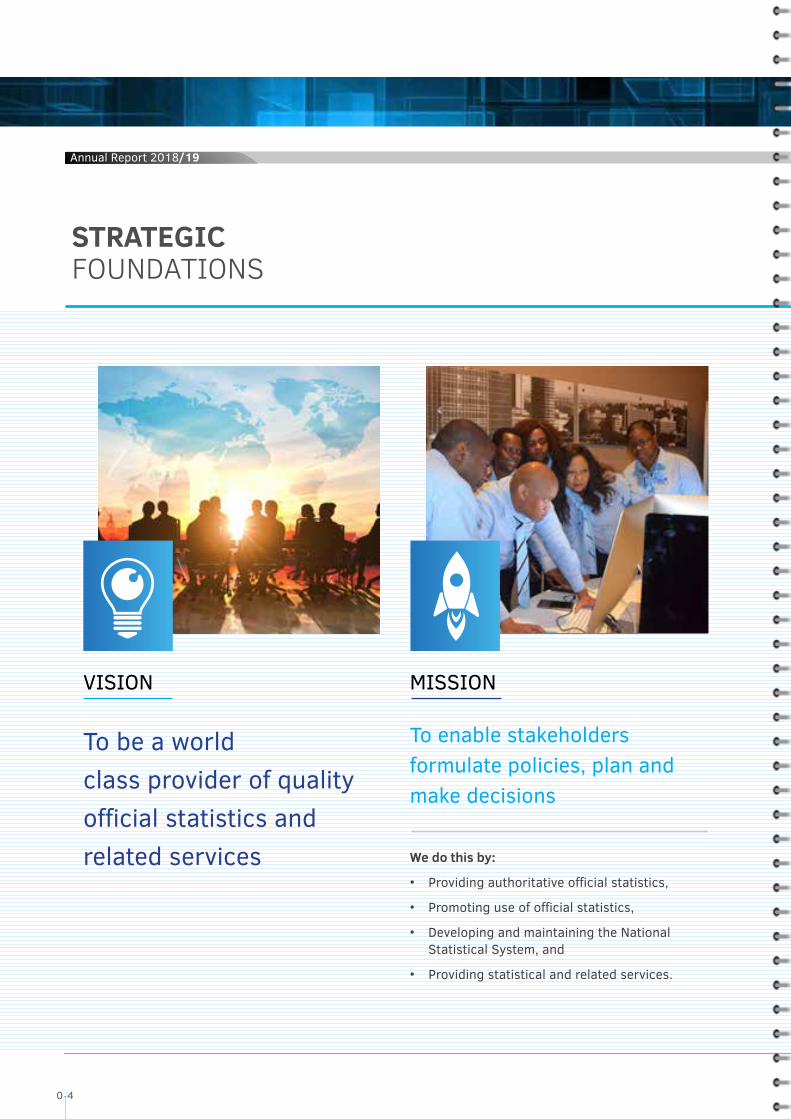
STRATEGIC FOUNDATIONS
VISION
To be a world class provider of quality official statistics and related services
MISSION
To enable stakeholders formulate policies, plan and make decisions
We do this by:
• Providing authoritative official statistics,
• Promoting use of official statistics,
• Developing and maintaining the National Statistical System, and
• Providing statistical and related services.
0 4
Annual Report 2018/19
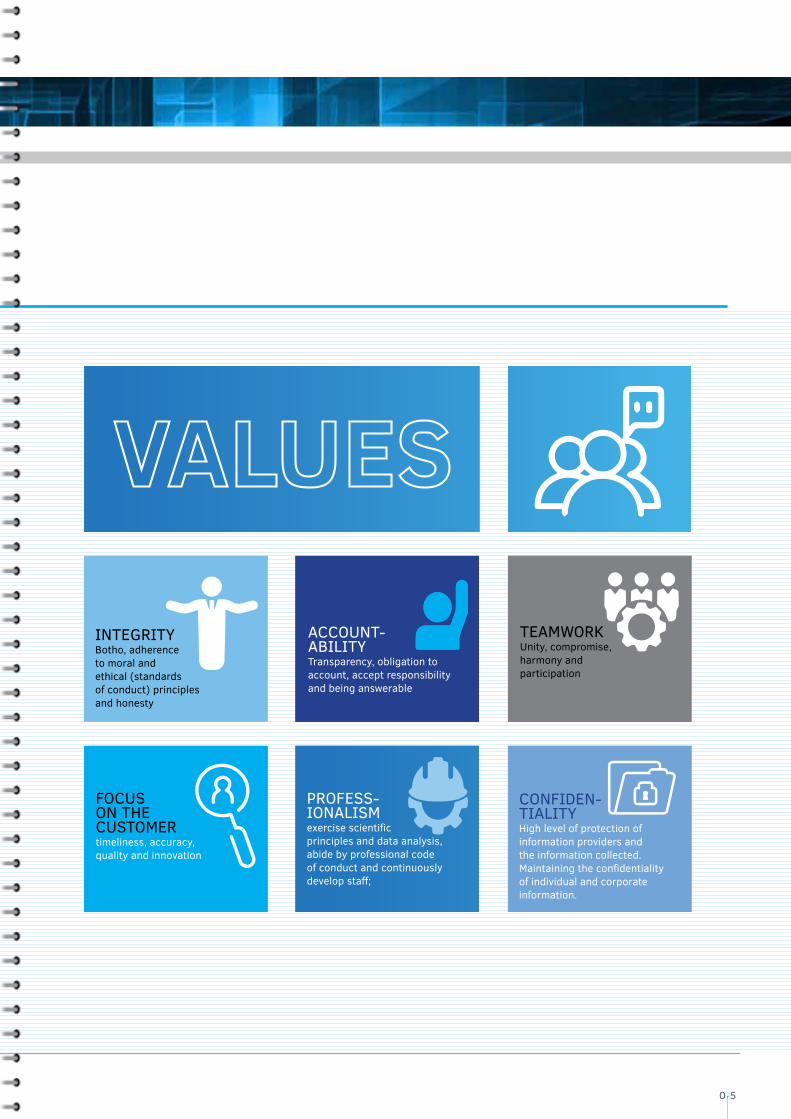
FOCUS ON THE CUSTOMERtimeliness, accuracy, quality and innovation
TEAMWORKUnity, compromise,harmony andparticipation
PROFESS-IONALISMexercise scientific principles and data analysis, abide by professional code of conduct and continuously develop staff;
INTEGRITYBotho, adherenceto moral and ethical (standards of conduct) principles and honesty
ACCOUNT-ABILITYTransparency, obligation to account, accept responsibility and being answerable
CONFIDEN-TIALITYHigh level of protection of information providers and the information collected. Maintaining the confidentiality of individual and corporate information.
0 5
Annual Report 2018/19
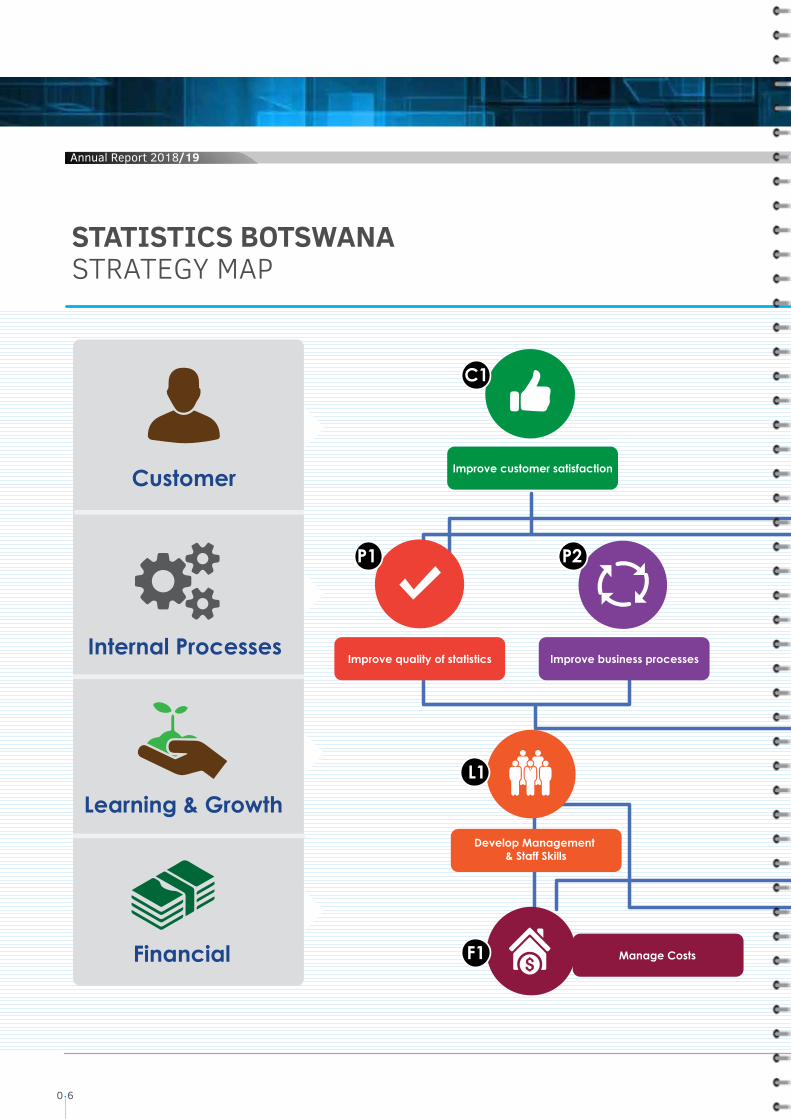
STATISTICS BOTSWANA STRATEGY MAP
0 6
Annual Report 2018/19
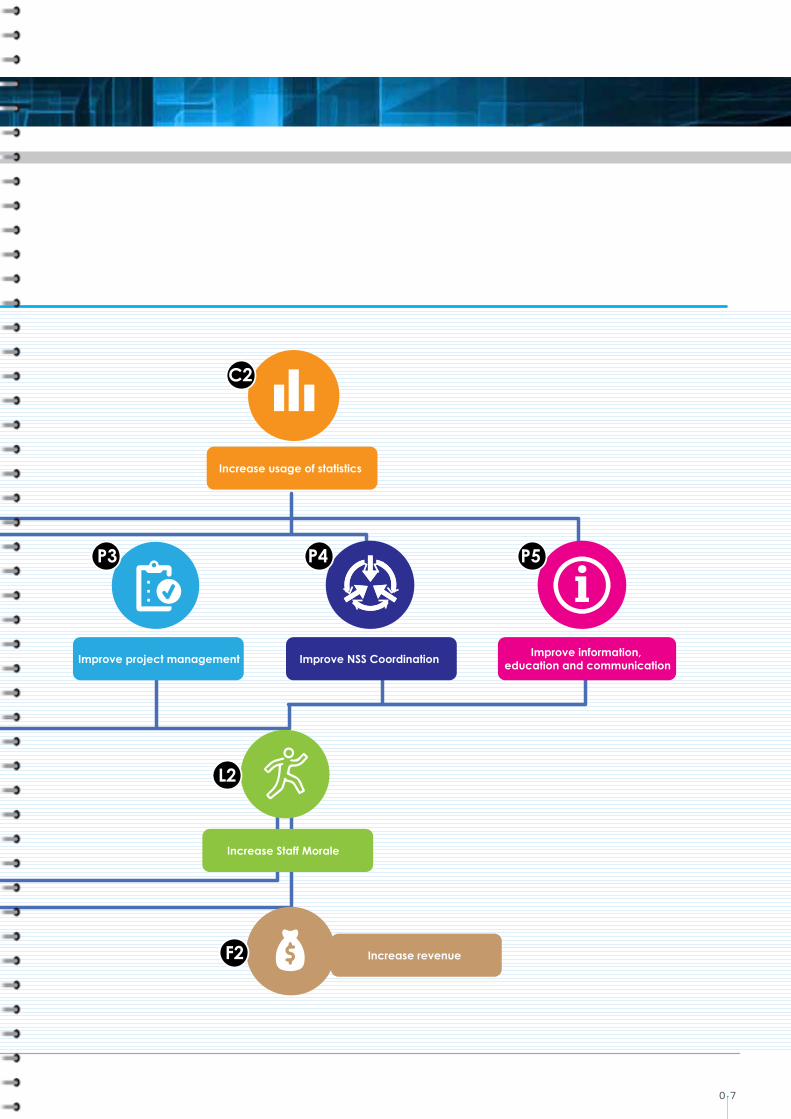
0 7
Annual Report 2018/19

Annual Report 2018/19
BOARD OFDIRECTORS
Dr Tebogo B. Seleka Dr Kealeboga Masalila
Mr Mmoloki Motsewabagale
Mr. Letsema G. MotsemmeBoard Chairperson
0 8
Annual Report 2018/19

Mr Dichaba Molobe
Dr Ernest Makhwaje
Professor Keoagile ThagaVice Chairperson
Dr Burton MguniStatistician General
0 9

BOARD CHAIRMAN’S STATEMENT
Key initiatives that were developed and/or implemented during the current strategic plan include the Communication Strategy; Enterprise Wide Risk Management; Employee Engagement Program; Leadership and Management Development Program; Review of the Performance Management System (PMS) and the Data Quality Assessment Framework (DQAF)
Annual Report 2018/19
1 0
Annual Report 2018/19

Corporate Strategy
During 2017 Statistics Botswana conducted the Mid-Term Review of the 2015-2020 Strategic Plan to monitor progress of the organization from a strategic level to determine whether the objectives were on track. The review was key to taking stock of progress, to identify and address any emerging strategic questions and to agree any decisions and actions needed to ensure effective delivery of the plan for the remaining plan period. In addition, the review assessed the management and oversight of the delivery of the strategic plan.
The strategy was considered still relevant and remains current; having anticipated national statistical requirements and global trends. The review provided insights into strengthening delivery of the
strategy and identified areas which needed to be explored further, as well as strategic decisions required as a result of the analysis. The portfolio of strategic initiatives was prioritized based on feasibility, strategic fit, and risk, in particular, budgetary constraints, resource availability and complexity of the initiative.
Key initiatives that were developed and/or implemented during the current strategic plan include the Communication Strategy; Enterprise Wide Risk Management; Employee Engagement Program; Leadership and Management Development Program; Review of the Performance Management System (PMS) and the Data Quality Assessment Framework (DQAF).
Governance
Statistics Botswana developed the Board Charter and the Shareholder Compact during current plan period. Furthermore, the organization has complied with the provisions of Statistics Act 2009 with respect to, inter-alia:
• Functions of Statistics Botswana
• Seal of Statistics Botswana
• Constitution of the Board
• Meetings and Proceedings of the Board
• Annual Business Plans
• Financial and Accountability Provisions
• Operation of the National Statistical System.
Annual Report 2018/19
1 1
BOARD CHAIRMAN’S STATEMENT [CONTINUED]
Provision of quality statistical data
The main purpose of Statistics Botswana is to provide information to inform the public and policy makers on key socio-economic developments and the functioning of society, the economy and government. To fulfil this role, it is important that the statistical outputs of Statistics Botswana meet certain quality standards. Statistics Botswana has responded to this requirement and is developing the Botswana Data Quality Assurance Framework that defines the concept of quality, as well as to provide criteria against which the quality of outputs can be judged.
The Botswana Data Quality Assurance Framework provides a common basis for managing data quality of various periodic statistical releases, such as, Consumer Price Index (CPI), Gross Domestic Product (GDP) Botswana Demographic Surveys, Botswana Multi-topic Household Surveys, Botswana Maternal Mortality Ratio, Transport and Information and International Merchandise Trade.
Challenges
Adequate funding for implementation of key initiatives, recruitment and retention of key personnel, and development of existing personnel to support development of strategic initiatives areas remains a major concern. To overcome these constraints, the organization has continued to collaborate with key global partners and leverage opportunities to improve the essential statistical infrastructure that is fundamental to the creation of high quality statistics. Outlook
Statistics Botswana will develop a new statistics plan in the coming financial year. Based on lessons learnt from the current strategic plan, there exists opportunities for:
• Agreeing on actions that will contribute to business growth
• Aligning resources for optimal results
• Prioritizing financial needs
• Effectively engaging with staff and better communicating what needs to be done.
Optimal utilization of technologies is a key area for improving data production and dissemination. The organization will continue to explore innovative technologies for statistical data collection and dissemination of results in order to improve the quality of data in terms of completeness, consistency, conformity, accuracy, integrity, timeliness and validity.
Acknowledgements
The Board is grateful for the support Statistics Botswana continues to receive from the Shareholder, the Ministry of Finance and Economic Development, as well as from the community of Development Agencies that partnered with Statistics Botswana to provide capacity building and skills transfer in various statistics disciplines.
_______________________________Letsema G. MotsemmeBOARD CHAIRMAN
1 2
Annual Report 2018/19
1 3
CORPORATE GOVERANCE
The constitution of the Board of Directors as provided for in the Statistics Act of 2009 consists on nine (9) members with the Statistician General being an ex-officio member. During the period under review, 2018/19 seven (7) Board Directors were in office.
Annual Report 2018/19
The constitution of the Board of Directors as provided for in the Statistics Act consists of nine (9) members with the Statistician General being an ex-officio member. During the period under review, seven (7) Board Directors were in office as follows:
1. Mr. Letsema Motsemme (Chairman)
2. Professor Keoagile Thaga (Deputy Chairman)3. Dr Kealeboga Masalila4. Dr. Ernest Makhwaje4. Dr. Tebogo B. Seleka5. Mr. Gaitsiwe M. Motsewabagale7. Mr. Dichaba Molobe
Ex-officio member:
8. Dr. Burton S. Mguni (Statistician General)
The Board’s role is an oversight one. This can be defined in the following thematic areas:
• Establish a policy based governance system. The Board has the responsibility of developing a governance system for the business. The articles of governance provide a framework but the Board develops a series of policies and oversees corporate governance processes by benchmarking against best practice;
• Provide direction for the organization. The Board has a strategic function in providing the vision, mission and goals of the organization;
• Establish the culture, values and ethics of the organization;
• Identify the nature and extent of the risks facing the organization in achieving its strategic aims and the risks to its long-term viability.
1 4
Annual Report 2018/19
Meetings of the Board:
During the period under review, the Board held all its four (4) statutory meetings as required by the Act.
Board Committees:
The Act recognizes the right of the Board to establish Board committees, while it maintains and complies with its legal responsibilities. These committees are made up of members of the Board with specified sets of duties. There are three Board committees which are as follows:
i. Board Human Resource Committee (BHRC)
The committee has the mandate of providing advisory services to the main Board on human capital acquisition, welfare, Industrial relations, as well as advice on implementation of the remuneration policies of Statistics Botswana. The major pre-occupation of the committee was overseeing the recruitment process for the key vacant executive positions, the review of the Terms and Conditions of Service, and the review of the organizational and pay structure.
ii. Board Tender Committee (BTC)
The Board Tender Committee is charged with the responsibility of overseeing major procurements in the organization. Its function is to examine, authorize and award all procurement of goods, works and services whose value is above the Management Tender Committee (MTC) authority limits. The committee ensures continuous adherence to the organization Assets Disposal and Procurement policies. The BTC major awards were the procurement of Statistics Botswana new Headquarters at Central Business District (CBD), and various procurement of equipment for the cartographic project.
iii. Board Finance, Audit and Risk Committee (BFARC)
During the year under review, the Board Finance Risk and Audit Committee reviewed and approved the Statistics Botswana Enterprise Risk Management (ERM) framework. Subsequently, the Committee continued with its oversight role of monitoring and reviewing progress on implementation of the ERM to ensure that factors that impact the
performance of the achievement of the organization strategic and operational objectives are accordingly managed.
In addition, the Committee considered and approved the annual internal audit plan, annual operational and development (capital) budget. Furthermore, the Committee considered and approved the audited financial statements.
1 5
INTERNAL AUDIT AND RISK MANAGEMENT
Internal Audit
Various audit activities to review the effectiveness of Statistics Botswana risk management and internal control systems were performed during the year under review. The results of the reviews together with recommendations for improvement and strengthening internal controls were shared with the Board Finance, Risk and Audit Committee. The Committee, as per its governance role of ensuring that the organisation develops and implement adequate internal controls, played a vital role in ensuring that internal audit, as well as external audit recommendations are implemented accordingly.
Risk Management
Statistics Botswana, like any other business or corporation, regularly encounters and address risks, some of which impact on the statistical indicators than anticipated. During the financial year under review, the Organization commenced implementation of the Enterprise Risk Management (ERM) framework. The framework was developed using internationally recognised risk frameworks such as The Committee of Sponsoring Organizations (COSO) of the Treadway Commission. The Board and Executive Management identified and prioritised strategic risks, plans and strategies to mitigate risks were put in place.
Statistics Botswana continues to encounter some key strategic risks, including, delayed delivery of projects, inadequate IT capacity, fraud and corruption, expertise/skills shortage, reputational damage due to inadequate understanding of international statistical standards, loss of confidence in data, information security breach, and reduction in Government subvention. These risks are not exhaustive, as the organization may face new emerging risks due to economic and international changes in statistical and other business caveats.
1 6
Annual Report 2018/19
1 7

EXECUTIVEMANAGEMENT
Mr Tapologo BaakileDirector Socio-DemographicStatistics
Ms Malebogo KerekangDeputy Statistician General (Standards & Technical Operations
Ms Banabo TshupengChief Internal Auditor
Dr Burton MguniStatistician General
1 8
Annual Report 2018/19

Ms Phetogo ZambeziDirector: Standards, Methods and & Information Systems
Ms BoitumeloMatlhagaDirector: Economic Statistics
Ms Lillian MogamiActing Director: Stakeholder Relations
Mr Jabulani MakwandaActing Board Secretary
Ms Ediretse C. Mokara Director: Corporate Services
1 9
Statistics Botswana, was applauded by the International Monetary Fund for the timely release of e-GDDS key economic indicators such GDP, CPI and Trade
STATISTICIAN GENERAL’S REVIEW
2 0
Annual Report 2018/19

STRATEGY IMPLEMENTATION
Over the period covering the financial year 2018/19, the organization continued to work on strategic initiatives of both the Corporate Strategy and the Botswana Strategy for the Development of Statistics (BSDS) through the implementation of the annual business plan. As at the end of March 2019, 13 out of the total of 37 initiatives of the corporate strategy were at various stages of implementation. As stated in the Mid-Term Evaluation Report, overall progress on corporate strategic implementation stood at 69% at the close of the year. Three initiatives were commenced being the Development of Data Collection Strategy, Development of Data Management Strategy and Development of Capacity Building Strategy for the National Statistical System (NSS).
Across the national statistics system sectors, implementation of the sector statistics plans was observed to be a challenge due to various reasons including change in leadership at Ministries, inadequate resources and human capacity to deal with statistics related issues. Overall implementation of the BSDS as at the end of the year stood at 49% as per the Mid-Term Evaluation Report. This clearly calls for more concerted efforts from all stakeholders to improve overall performance particularly as the term of the strategy ends in March 2020.
Statistics Botswana continuously monitors implementation of the strategic plans at output level through variance analysis of the actuals and planning matrix targets as well as at impact level through customer satisfaction survey results and monitoring of results of some well-established international indicators over time.
These international indicators include the Statistical Capacity Building Indicator (SCBI) which is published by the United Nations (UN), Organization for Economic Co-operation and Development (OECD), World Bank, International Monetary Fund (IMF), and European Commission (EC); and the Open Data Inventory Index (ODIN) which is published by Open Data Watch International. These are annual weighted composite indicators covering the statistics production and dissemination of the entire NSS of a country with the majority of the components relating to the National Statistic Organization.
2 1
STATISTICIAN GENERAL’S REVIEW [CONTINUED]
The SCBI was low at the time the strategies were launched in 2015, but is now beginning to grow: 2015/16 (45.6%), 2016/17 (42.2%), 2017/18 (50%), and 2018/19 (54.4%). This growth is a reflection of Botswana’s developing NSS. The ODIN of 2018 revealed that out of the 178 countries assessed for data coverage and openness. Botswana sits at position 82 with Liechtenstein in Eastern Europe. For the same assessment, Botswana sits at position 2 in Southern African. These indicators enable countries to identify and close data gaps so as to improve on the impact of their strategies.
National Statistics System (NSS) Coordination and Strategic Partnerships
In 2018/19, Statistics Botswana as the overcall coordinator of the NSS focused on reviewing existing unsigned Sector Statistics Plans and identifying ways of implementing the Sector Statistics Plans. As prescribed by the National Development Plan (NDP) 11, the organization also focused on providing technical support to the sectors in the production and processing of official statistics. A total of thirteen (13) sectors enrolled onto the BSDS process.
Statistics Botswana continues to foster new partnerships which are important for the organisation to effectively carry its mandate particularly as relates to production of statistics based on administrative data. During the just ended financial year, Memoranda of Understanding (MoU) were signed with three (3) agencies being the Ministry of Employment, Labour Productivity and Skills Development (MELSD), Ministry of Local Government and Rural Development and Ministry of Transport and Communication.
Major Projects
Statistics Botswana has embarked on a number of major projects which are of critical importance to the economy and the society at large. Below are major projects undertaken in the just ended financial year:
(a) International Comparison Programme (ICP)
Statistics Botswana participated in the International Comparison Programme (ICP), which is coordinated by World Bank under the watch of the African Development Bank (AfDB), for the Africa region. Data collection for the programme ended in December 2018 and will be used for the computation of Purchasing Power Parities (PPP). This facilitates for reliable international comparison of costs of products and services.
(b) Consumer Price Index (CPI) Rebasing
The Consumer Price Index (CPI) was successfully rebased from a base of September 2016 to December 2018. The rebased CPI was released on 05 March 2019.
(c) Gross Domestic Product (GDP) Rebasing
During the 2018/19 financial year, preparatory work began on rebasing GDP to move the base year from 2006 to 2016. The internationally accepted recommended practice is to rebase the GDP every five years. As at the end of the period under review, Statistics Botswana was not within the recommended GDP rebasing periodicity. Work will be done to ensure that following the current rebasing, future rebasing is kept within acceptable periods of the 5 year periodicity.
The rebasing exercise was needed as the country’s economy had changed in terms of economic structure, consumption patterns, prices of goods and services since the last rebasing in 2012. In addition to updating the base year, other important outcomes of the exercise are to move Botswana from the 1993 System of National Accounts (1993 SNA) to the 2008 SNA and to
2 2
Annual Report 2018/19
also to enable production of Supply and Use Tables (SUT). The SUT provides a framework that enhances the accuracy of GDP estimation.
(d) 2021 Population and Housing Census
Planning for the CensusPreparations for the 2021 census were advanced during the year under review. The National Census Coordinator was appointed, and the Census Office was established. Preparations for the development of the Census Project Document were also commenced.
Cartographic OperationsThe census cartographic exercise activities commenced, and have embraced modern technology. For example Smart Census application for census is being used for the mapping exercise. Instead of the traditional way of identifying dwellings through affixing metal plates on doors of dwellings and building structures, GPS coordinates of the dwellings or structures are being collected and mapped. The cartographic exercise field work started in March 2019 and will be concluded in April 2021.
(e) Continuous Multi Topic Household Survey (CMTHS)
During the 2015/16 financial year, Statistics Botswana conducted the Botswana Multi-Topic Household Survey (BMTHS). The BMTHS was part of the programme for Labour and Poverty Surveys which are conducted every five (5) years. Prior to the BMTHS, stakeholders had expressed the critical need for more regular data to support policy decisions and evaluation of national programmes and projects. In light of the above, Statistics Botswana designed the BMTHS as a launching pad for a Continuous Multi-Topic Household Survey (CMTHS). Preparation for the conduct of the CMTHS commenced in the year under review.
The CMTHS will be conducted starting from 2019/20 financial year going forward in order to provide more frequent socio-economic data to be used for planning and decision making. The CMTHS will on a quarterly basis, provide a set of indicators on labour force information (employment, unemployment and labour force profiles). The CMTHS will include rotational modules to be implemented in different quarters of each year in order to provide results on some of indicators of Vision 2036, NDP 11 and Sustainable Development Goals (SDGs).
Sustainable Development Goals (SDGs)
In terms of the decision of the UN Statistical Commission, national statistical organizations such as SB are to ensure that data on SDGs indicators is made available. To this end, SB started as from the 2019/20 financial year to publish an annual Stats Brief covering global SDGs indicators applicable to Botswana. In relation to the continental Africa Agenda 2063 indicators an annual Stats brief is planned to commence in the 2019/20 financial year. To further disseminate the data contained in the annual SDG Stats Brief, an SDG portal (AfDB supported) has been developed and is populated with the available Botswana Domesticated SDG indicators data. The portal can be accessed through the SB web site (http://www.statsbots.org.bw) or directly at: http://botswana.opendataforafrica.org.
Customer Satisfaction
During the year under review, Botswana through Statistics Botswana, was applauded by the International Monetary Fund for the timely release of e-GDDS key economic indicators such GDP, CPI, Trade which are also disseminated through the AfDB supported National Data Summary Page portal.
2 3
Annual Report 2018/19
STATISTICIAN GENERAL’S REVIEW [CONTINUED]
A total of sixty seven (67) monthly, quarterly, and annual statistical publications were released in 2018/19 for use by customers and various stakeholders. This represented a slight increase from sixty three (63) in the previous year.
The organization’s second customer satisfaction survey was also conducted in to measure internal and external customer satisfaction levels. These were used to establish areas of service improvement for internal and external customers. Based on these results various interventions are being implemented or planned so as to continuously improve customer satisfaction. These interventions include for example those targeted at raising staff morale as well as those aimed at increasing the periodicity of publications in response to customer demand.
A successful Statistics User/Producer Forum was held during the year. This is a platform for data users and producers nationally to dialogue on improving the production process of statistics, strengthen trust and understanding among the stakeholders and forge
new networks. The platform facilitated exchange of ideas and experiences by the data users and producers with a view to improving statistics development across all sectors. The participants greatly appreciated the platform.
In keeping with international standards on data dissemination, the organization makes available to stakeholders an advance release calendar at the beginning of each financial year. For the year under review adherence to the release calendar was 90%.
Launch of the Communications Strategy
Statistics Botswana has recognized both internal and external communications to be important drivers in the discharge of its mandate, hence the launch of its first ever Communication Strategy in 2019/20. This strategy is expected to enable the organization to implement more impactful integrated marketing communications, stakeholder engagement, and advocacy programmes into the future. The communication strategy goals are aligned to those of the Corporate Strategy and the BSDS.
Corporate Social Responsibility
Statistics Botswana continues to seek ways in which it can have a meaningful impact on communities from which it collects data. Through the Corporate Social Responsibility (CSR) programme, SB is able to positively impact on people’s quality of life. Statistics Botswana strives to work in cooperation with stakeholders to implement a transparent and socially responsible programme. As part of its CSR programme SB awarded a prize at the Institute of Health Sciences graduation ceremony in Francistown in November 2018 to the Best student in Introduction to Statistics.
Outlook
There are more initiatives that will come from Statistics Botswana which among others will be central to supporting the country’s efforts to become a knowledge-based economy. This will involve greater intensity in the use of technology, research and innovation geared towards improving its work processes.
One of the areas targeted for increased growth going into the future is the publication of geo-spatial statistics. Geospatial data, sometimes referred to as locational data is emerging as an important source of
2 4
Annual Report 2018/19
information both in traditional and big data analytics. Geospatial statistics contains statistical tools for analysing geo-spatial distributions, patterns, processes and their relationships with respect to geographical location. Geo-spatial statistics provide greater ability to present traditional statistics in a way that can be more easily understood by stakeholders as it often includes geographical maps.
Plans are also in place to start exploiting various processes to commence accessing and utilising big data. The plan is to initially make arrangements to access and utilize mobile service providers “Mobile Positioning Data” (MPD) generated by mobile phones and retail sector point of sale scanned data. The intent is to apply analytics to MPD data to produce tourism statistics and use the retail industry scanned data for the production of the Consumer Price Index (CPI).
Technology will surely play a big role in Statistics Botswana operations going forward. The intent is to increasingly move to a paperless data sharing environment through having a well-coordinated seamless ICT interfaced system with various Ministries and agencies whom we work closely in the
collection, processing and publication of statistics. The Computer Assisted Personal Interviewing (CAPI) will be used to the greatest extent in the collection of survey data and administrative data as appropriate. A related tool referred to as Computer Assisted Web Interview (CAWI) will also be explored particularly for the conduct of enterprise surveys online.
To make statistics more accessible to stakeholders, additional dissemination platforms are being sought. These include a mobile application (Mobile App) and a two way short message platform.
Special Thanks
I wish to thank our Board of Directors for the solid support and guidance it continues to give to Management.
I also wish to extend a special acknowledgement to the media for extensively publishing statistical news and official statistics as this enhances the opportunity for increased understanding and usage of statistics in the country and elsewhere. It is also appropriate to convey my gratitude to individuals, households and businesses that responded to our various data collection exercises as our work benefits immensely from
their cooperation and their gracious granting of time to respond to our questionnaires.
Management and staff of Statistics Botswana also deserve thanks and appreciation for their commitment and dedication to the organization’s continued growth and success.
_______________________________Dr. Burton S. MguniSTATISTICIAN GENERAL
2 5
Annual Report 2018/19
STATISTICS HIGHLIGHTS
Annual Report 2018/19
2 6
Annual Report 2018/19
Consumer Price Index (CPI)
Gross Domestic Product (GDP)
International Merchandise Trade
Formal Employment
Work Permits
Botswana Demographic Survey
2 7
CONSUMER PRICE INDEX (CPI)
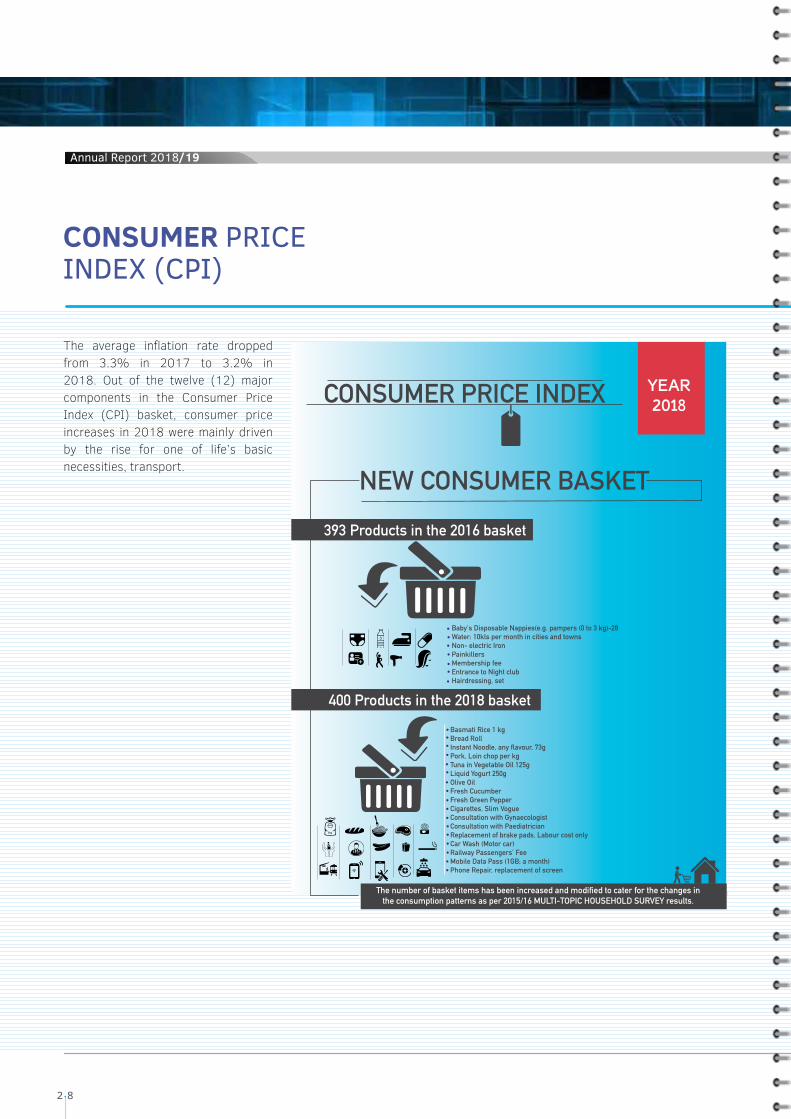
393 Products in the 2016 basket
NEW CONSUMER BASKET
CONSUMER PRICE INDEX
Baby's Disposable Nappies(e.g. pampers (0 to 3 kg)-28Water: 10kls per month in cities and townsNon- electric IronPainkillersMembership feeEntrance to Night club Hairdressing, set
Basmati Rice 1 kgBread RollInstant Noodle, any flavour, 73gPork, Loin chop per kgTuna in Vegetable Oil 125gLiquid Yogurt 250gOlive OilFresh CucumberFresh Green PepperCigarettes, Slim VogueConsultation with GynaecologistConsultation with PaediatricianReplacement of brake pads, Labour cost onlyCar Wash (Motor car)Railway Passengers’ FeeMobile Data Pass (1GB; a month)Phone Repair, replacement of screen
400 Products in the 2018 basket
The number of basket items has been increased and modified to cater for the changes in the consumption patterns as per 2015/16 MULTI-TOPIC HOUSEHOLD SURVEY results.
#KnowYourStatsBW
YEAR2018
The average inflation rate dropped from 3.3% in 2017 to 3.2% in 2018. Out of the twelve (12) major components in the Consumer Price Index (CPI) basket, consumer price increases in 2018 were mainly driven by the rise for one of life’s basic necessities, transport.
2 8
Annual Report 2018/19
GROSS DOMESTIC PRODUCT (GDP)
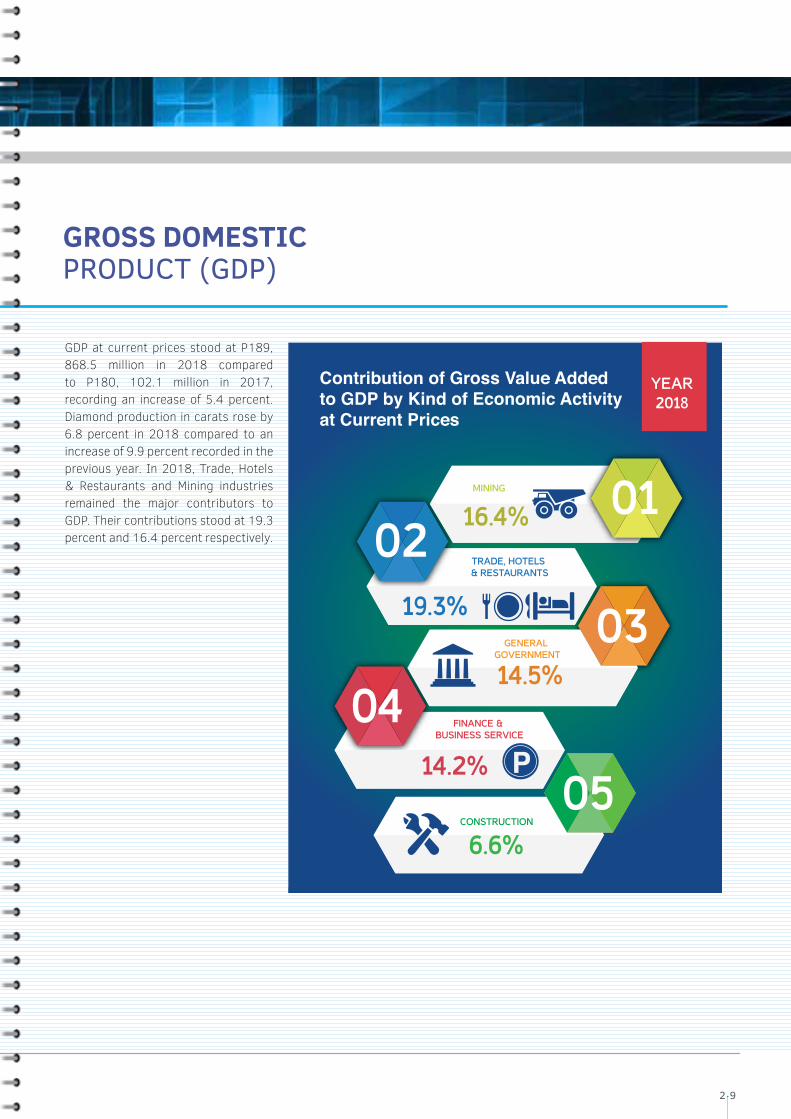
GDP at current prices stood at P189, 868.5 million in 2018 compared to P180, 102.1 million in 2017, recording an increase of 5.4 percent. Diamond production in carats rose by 6.8 percent in 2018 compared to an increase of 9.9 percent recorded in the previous year. In 2018, Trade, Hotels & Restaurants and Mining industries remained the major contributors to GDP. Their contributions stood at 19.3 percent and 16.4 percent respectively.
Contribution of Gross Value Added to GDP by Kind of Economic Activity at Current Prices
STATISTICS BOTSWANAPrivate Bag 0024, GaboroneTel: 3671300 Fax: 3952201 E-mail: [email protected]: www.statsbots.org.bw
0102
03
04
16.4%
19.3%
14.5%
14.2%
MINING
TRADE, HOTELS & RESTAURANTS
GENERAL GOVERNMENT
FINANCE & BUSINESS SERVICE
056.6%
CONSTRUCTION
YEAR2018
2 9
Annual Report 2018/19
INTERNATIONAL MERCHANDISE TRADE
Imports
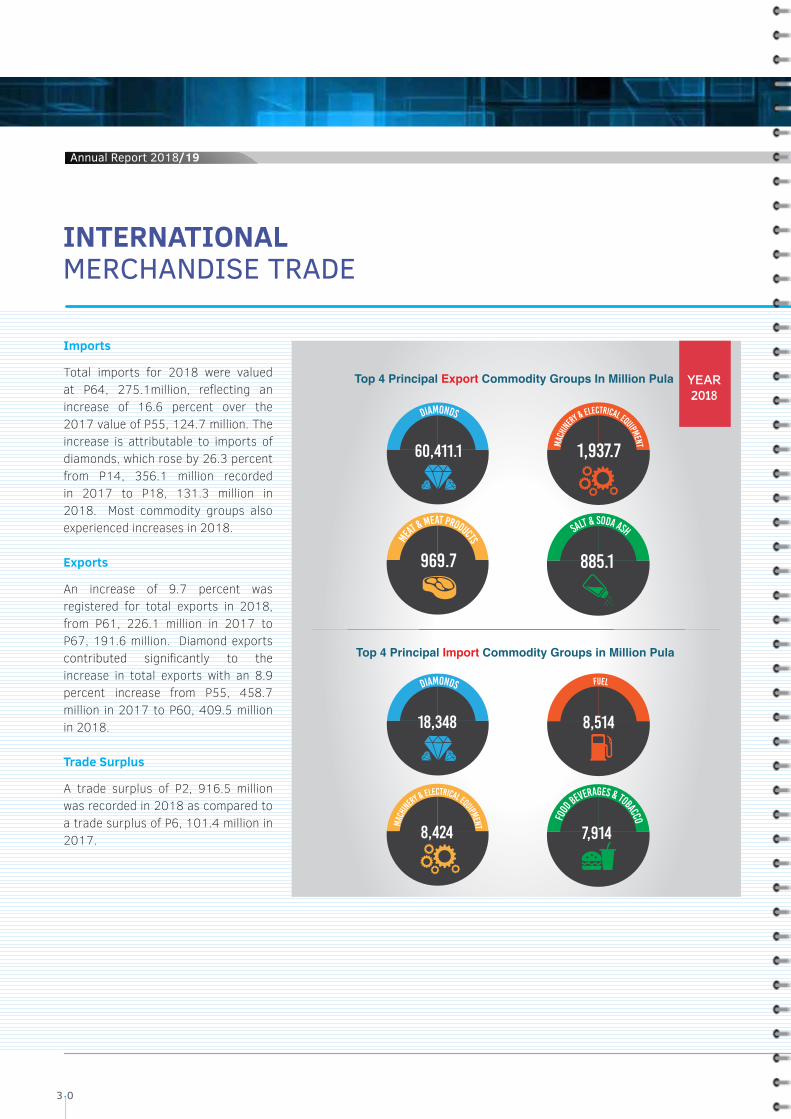
Total imports for 2018 were valued at P64, 275.1million, reflecting an increase of 16.6 percent over the 2017 value of P55, 124.7 million. The increase is attributable to imports of diamonds, which rose by 26.3 percent from P14, 356.1 million recorded in 2017 to P18, 131.3 million in 2018. Most commodity groups also experienced increases in 2018.
Exports
An increase of 9.7 percent was registered for total exports in 2018, from P61, 226.1 million in 2017 to P67, 191.6 million. Diamond exports contributed significantly to the increase in total exports with an 8.9 percent increase from P55, 458.7 million in 2017 to P60, 409.5 million in 2018.
Trade Surplus
A trade surplus of P2, 916.5 million was recorded in 2018 as compared to a trade surplus of P6, 101.4 million in 2017.
1,937.7 Mac
hine
ry & Electrical Equipment 60,411.1
DIAMONDS
969.7
MEAT & MEAT PRODUCTS
885.1
SALT & SODA ASH
8,514
FUEL
18,348
DIAMONDS
8,424
MACH
INERY & ELECTRICAL EQUIPMENT
7,914
FOOD
BEVERAGES & TOBACCO
STATISTICS BOTSWANAPrivate Bag 0024, GaboroneTel: 3671300 Fax: 3952201 E-mail: [email protected]: www.statsbots.org.bw
Top 4 Principal Import Commodity Groups in Million Pula
Top 4 Principal Export Commodity Groups In Million Pula YEAR2018
3 0
Annual Report 2018/19
FORMAL SECTOR EMPLOYMENT
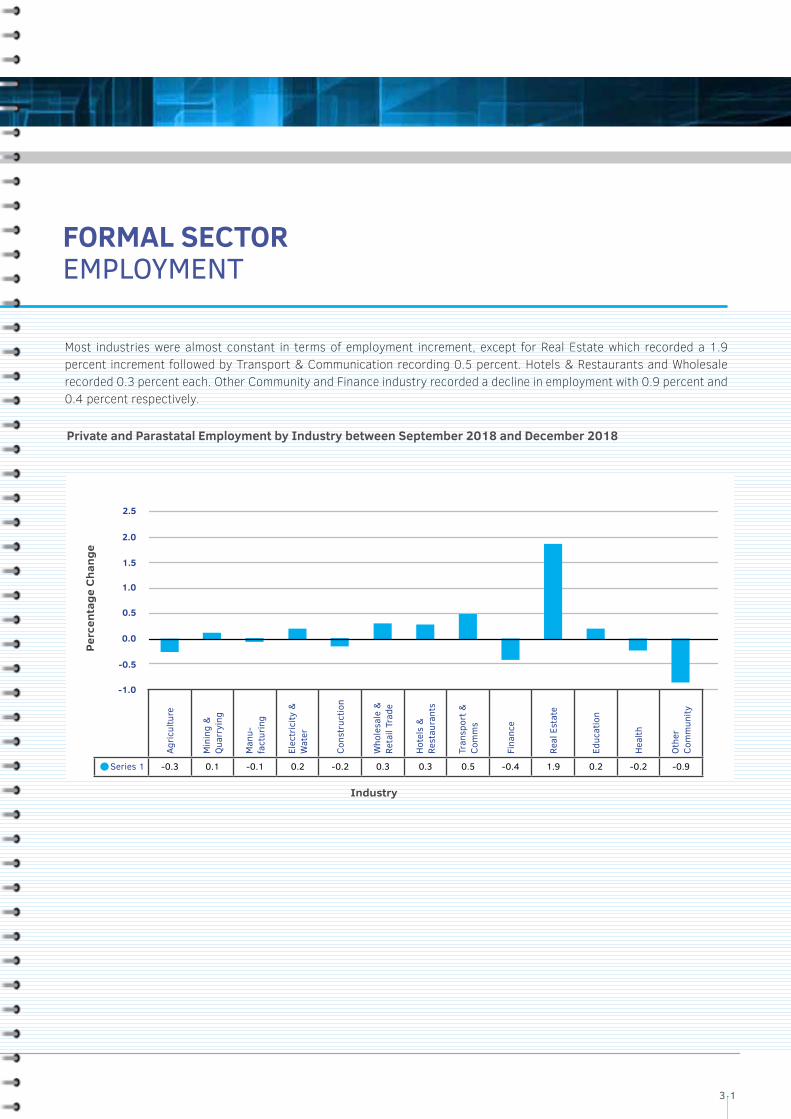
Most industries were almost constant in terms of employment increment, except for Real Estate which recorded a 1.9 percent increment followed by Transport & Communication recording 0.5 percent. Hotels & Restaurants and Wholesale recorded 0.3 percent each. Other Community and Finance industry recorded a decline in employment with 0.9 percent and 0.4 percent respectively.
Private and Parastatal Employment by Industry between September 2018 and December 2018
Industry
Perc
enta
ge C
hang
e
2.5
2.0
1.5
1.0
0.5
0.0
-0.5
-1.0
Agric
ultu
re
Min
ing
&
Qua
rryi
ng
Man
u-fa
ctur
ing
Elec
tric
ity &
Wat
er
Cons
truc
tion
Who
lesa
le &
Re
tail
Trad
e
Hot
els
&
Rest
aura
nts
Tran
spor
t &
Com
ms
Fina
nce
Real
Est
ate
Educ
atio
n
Hea
lth
Oth
erCo
mm
unity
Series 1 -0.3 0.1 -0.1 0.2 -0.2 0.3 0.3 0.5 -0.4 1.9 0.2 -0.2 -0.9
3 1
Annual Report 2018/19
WORK PERMITS
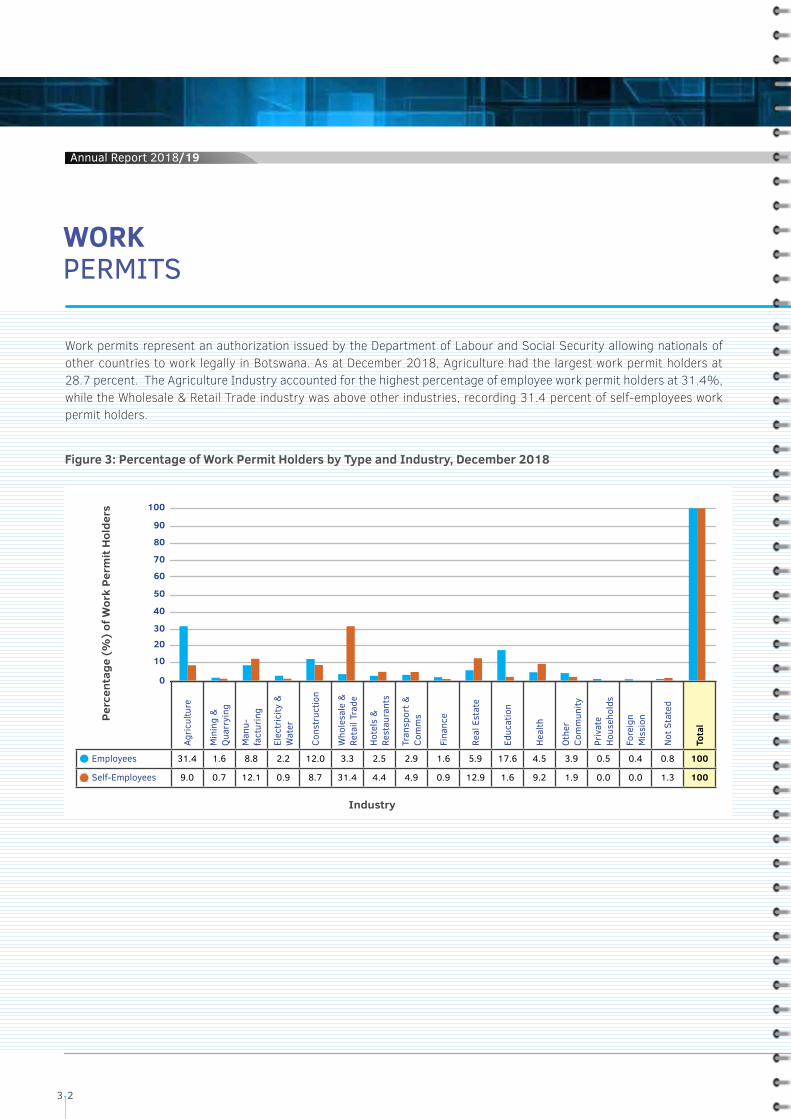
Work permits represent an authorization issued by the Department of Labour and Social Security allowing nationals of other countries to work legally in Botswana. As at December 2018, Agriculture had the largest work permit holders at 28.7 percent. The Agriculture Industry accounted for the highest percentage of employee work permit holders at 31.4%, while the Wholesale & Retail Trade industry was above other industries, recording 31.4 percent of self-employees work permit holders.
Figure 3: Percentage of Work Permit Holders by Type and Industry, December 2018
60
70
80
90
100
50
40
3020
10
0
Industry
Agric
ultu
re
Min
ing
&
Qua
rryi
ng
Man
u-fa
ctur
ing
Elec
tric
ity &
Wat
er
Cons
truc
tion
Who
lesa
le &
Re
tail
Trad
e
Hot
els
&
Rest
aura
nts
Tran
spor
t &
Com
ms
Fina
nce
Real
Est
ate
Educ
atio
n
Hea
lth
Oth
erCo
mm
unity
Priv
ate
Hou
seho
lds
Fore
ign
Mis
sion
Not
Sta
ted
Tota
l
Employees 31.4 1.6 8.8 2.2 12.0 3.3 2.5 2.9 1.6 5.9 17.6 4.5 3.9 0.5 0.4 0.8 100
Self-Employees 9.0 0.7 12.1 0.9 8.7 31.4 4.4 4.9 0.9 12.9 1.6 9.2 1.9 0.0 0.0 1.3 100
Perc
enta
ge (
%)
of W
ork
Perm
it H
olde
rs
3 2
Annual Report 2018/19
BOTSWANA DEMOGRAPHIC SURVEY
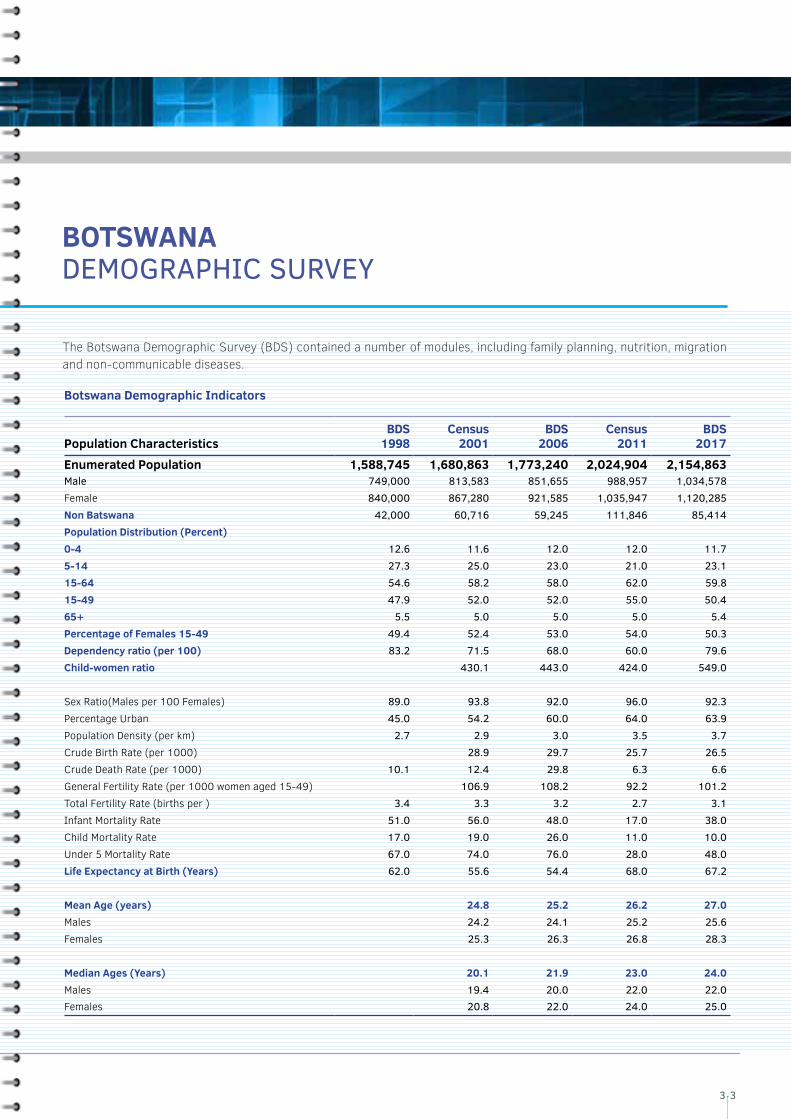
The Botswana Demographic Survey (BDS) contained a number of modules, including family planning, nutrition, migration and non-communicable diseases.
Botswana Demographic Indicators
Population CharacteristicsBDS
1998Census
2001BDS
2006Census
2011BDS
2017Enumerated Population 1,588,745 1,680,863 1,773,240 2,024,904 2,154,863Male 749,000 813,583 851,655 988,957 1,034,578Female 840,000 867,280 921,585 1,035,947 1,120,285Non Batswana 42,000 60,716 59,245 111,846 85,414Population Distribution (Percent)0-4 12.6 11.6 12.0 12.0 11.75-14 27.3 25.0 23.0 21.0 23.115-64 54.6 58.2 58.0 62.0 59.815-49 47.9 52.0 52.0 55.0 50.465+ 5.5 5.0 5.0 5.0 5.4Percentage of Females 15-49 49.4 52.4 53.0 54.0 50.3Dependency ratio (per 100) 83.2 71.5 68.0 60.0 79.6Child-women ratio 430.1 443.0 424.0 549.0
Sex Ratio(Males per 100 Females) 89.0 93.8 92.0 96.0 92.3Percentage Urban 45.0 54.2 60.0 64.0 63.9Population Density (per km) 2.7 2.9 3.0 3.5 3.7Crude Birth Rate (per 1000) 28.9 29.7 25.7 26.5Crude Death Rate (per 1000) 10.1 12.4 29.8 6.3 6.6General Fertility Rate (per 1000 women aged 15-49) 106.9 108.2 92.2 101.2Total Fertility Rate (births per ) 3.4 3.3 3.2 2.7 3.1Infant Mortality Rate 51.0 56.0 48.0 17.0 38.0Child Mortality Rate 17.0 19.0 26.0 11.0 10.0Under 5 Mortality Rate 67.0 74.0 76.0 28.0 48.0Life Expectancy at Birth (Years) 62.0 55.6 54.4 68.0 67.2
Mean Age (years) 24.8 25.2 26.2 27.0Males 24.2 24.1 25.2 25.6Females 25.3 26.3 26.8 28.3
Median Ages (Years) 20.1 21.9 23.0 24.0Males 19.4 20.0 22.0 22.0Females 20.8 22.0 24.0 25.0
3 3
Annual Report 2018/19

HUMAN RESOURCES MANAGEMENT
People
People are the most valuable resource for any organization. In this regard, Statistics Botswana continues to strive to be an employer of choice by ensuring that its employees acquire the right skills, are fully utilized and properly trained to be abreast with the ever changing technological landscape. Statistics Botswana staff compliment as at the end of the year under review stood at 214 in post against 225.
Employee Welfare
Several employee schemes are in place to improve employees’ lives. In August 2018, the organization held its annual Wellness Day where various stakeholders were invited, amongst others, physical fitness trainers; diseases testing and
Annual Report 2018/19
counselling facilities; insurance and medical schemes; and educators on financial prudence.
Capacity Building
An Employee Engagement Survey that was conducted in the previous financial year pointed, amongst other recommendations to an improvement in the leadership score. In response to this, a Leadership and Management Development Programme was conducted to train seventeen (17) members of the Senior Leadership Team through the University of Stellenbosch Business School from February, 2018 to July, 2018. All the seventeen (17) candidates successfully completed the programme.
Statistics Botswana continues to encourage its employees to embark on part-time studies, and block release training
interventions. During the year under review, two (2) employees successfully completed their Doctor of Philosophy (PhD) studies locally and abroad namely Drs. Fani Dintwa and Vincent Mabikwa. Dr. Fani Dintwa completed a PhD in Population Studies while Dr. Vincent Mabikwa completed a PhD in Health Statistics. Another employee, Ms Khumo G. Katholo completed a Masters Study programme in Project Management.
Workshops, conferences andseminars sponsored by Development Partners and Statistics Botswana continue to be an integral part of employee development and capacity building avenues. During the year under review, a total of one hundred and eighty nine (189) employees attended such seminars and conferences locally and internationally.
3 4
Annual Report 2018/19
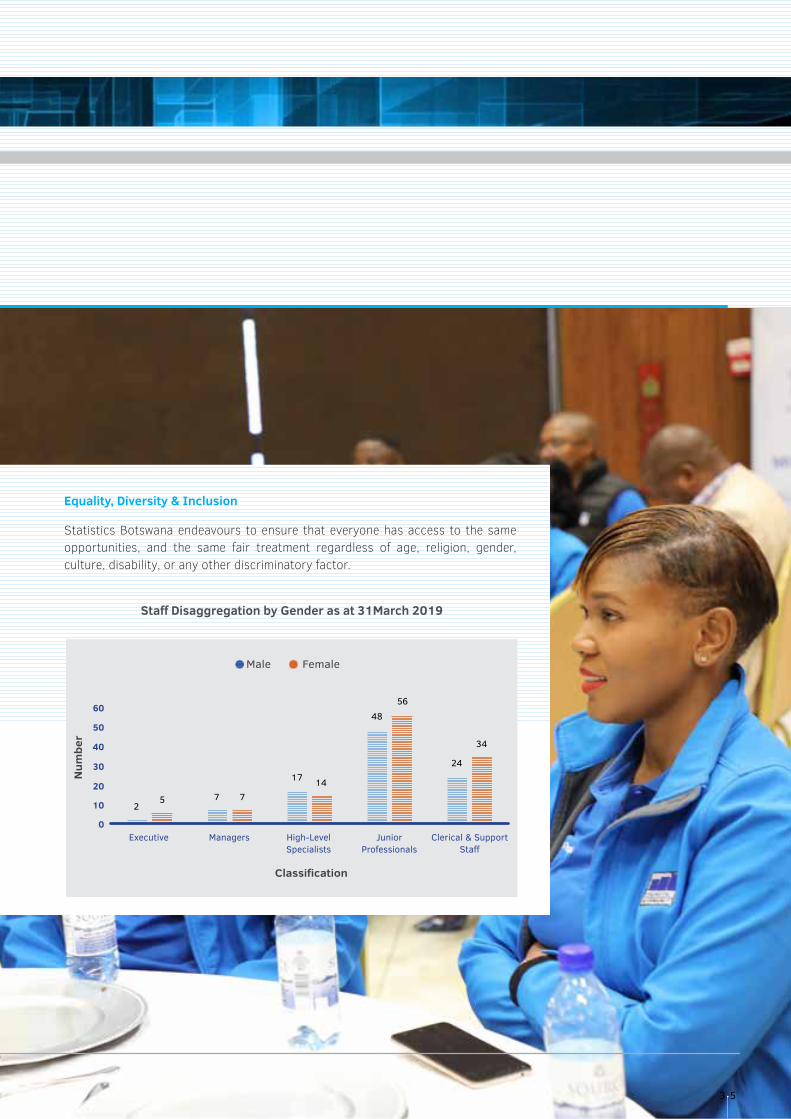
Equality, Diversity & Inclusion
Statistics Botswana endeavours to ensure that everyone has access to the same opportunities, and the same fair treatment regardless of age, religion, gender, culture, disability, or any other discriminatory factor.
Staff Disaggregation by Gender as at 31March 2019
60
50
40
30
20
10
0
Num
ber
Classification
Male Female
Clerical & SupportStaff
JuniorProfessionals
High-LevelSpecialists
ManagersExecutive
34
24
5648
1417
7752
3 5

Performance Management
Statistics Botswana continues to promote a high performance culture to ensure efficiency in achieving the strategic goals of the organization. The existing Performance Management System (PMS) was reviewed to make it user friendly and eventually to automate it into an Employee Self Service (ESS).
Review of Terms and Conditions of Service
The Statistics Botswana Terms and Conditions of Service adopted in March 2012 have been revised and approved by the Board. The revision was necessary to align the document with Labour Laws and Legislation. The document forms the basis for Statistics Botswana to deliver on its mandate. It sets out the basic tenets by which officers are guided, both in their relations with each other and in their dealings with the public which they serve.
Annual Report 2018/19
HUMAN RESOURCES [CONTINUED]
3 6
Annual Report 2018/19

3 7
MARKETING OF OFFICIAL STATISTICS AND BRAND VISIBILITY
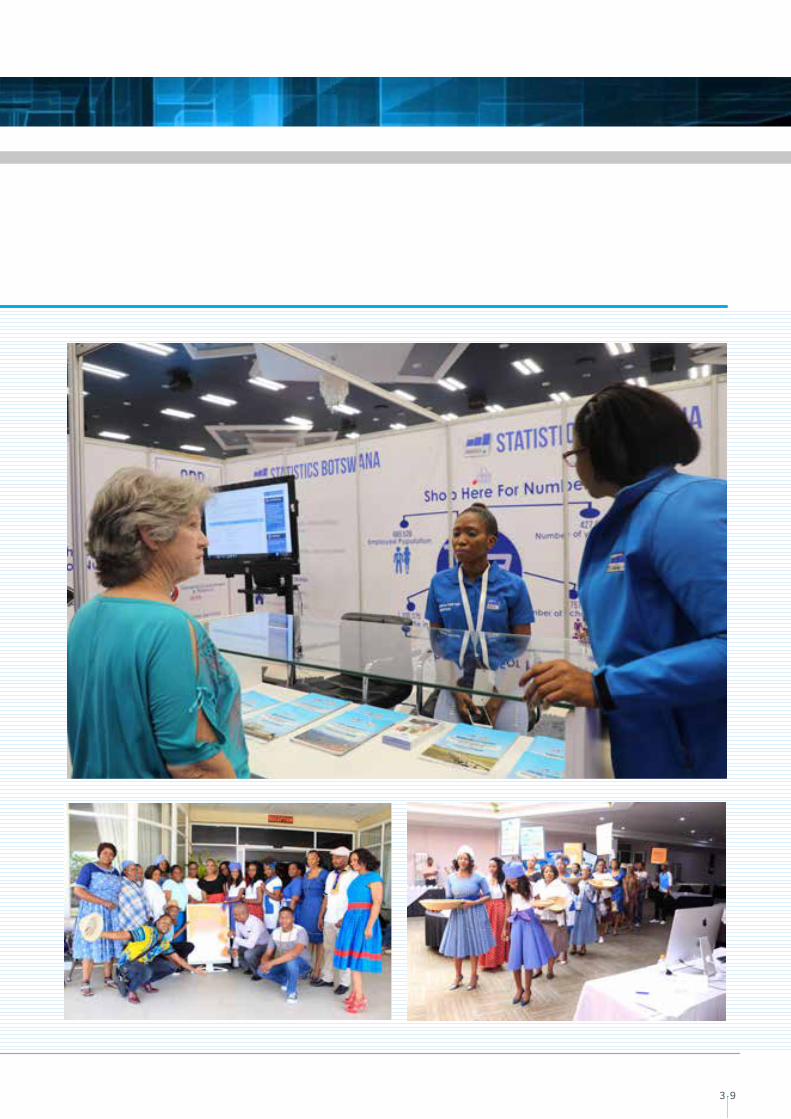
MARKETING OF OFFICIAL STATISTICS AND BRAND VISIBILITYIn the period under review, various platforms were used to publicize statistical products and services to the organization’s various stakeholders. Community outreach activities including participation at national fairs, and full council addresses were undertaken.
Annual Report 2018/19
With the intent to demystify statistics, and increase understanding and consequently usage of statistics for decision making, the organization introduced its external newsletter, “BW Statistics News” which was well received by the local and international statistics community for its rich content, and indeed its fresh, appealing and engaging look. Radio, television, print and social media were used extensively to promote the SB brand and its products and services
The organization joined other African countries in celebrating the African Statistics Day on 18 November 2018. Each year Africa celebrates this day to raise public awareness about the importance of statistics in all aspects of socio-economic life. SB celebrated the day by hosting a stakeholder consultative workshop
on the newly developed Data Quality Assurance Framework which outlines procedures for designating statistics as ‘official statistics’ and provides a rational, transparent and sustainable methodology for quality assessment of statistical products and services.
Media
Media engagement efforts yielded positive results in terms of the volume of coverage received as compared to the previous year. Statistics Botswana engages with the media by sharing information widely with all media houses through press briefings, press releases, website notifications, email, and social media regularly, and by being available to respond timely to media enquiries.
3 8
Annual Report 2018/19
3 9
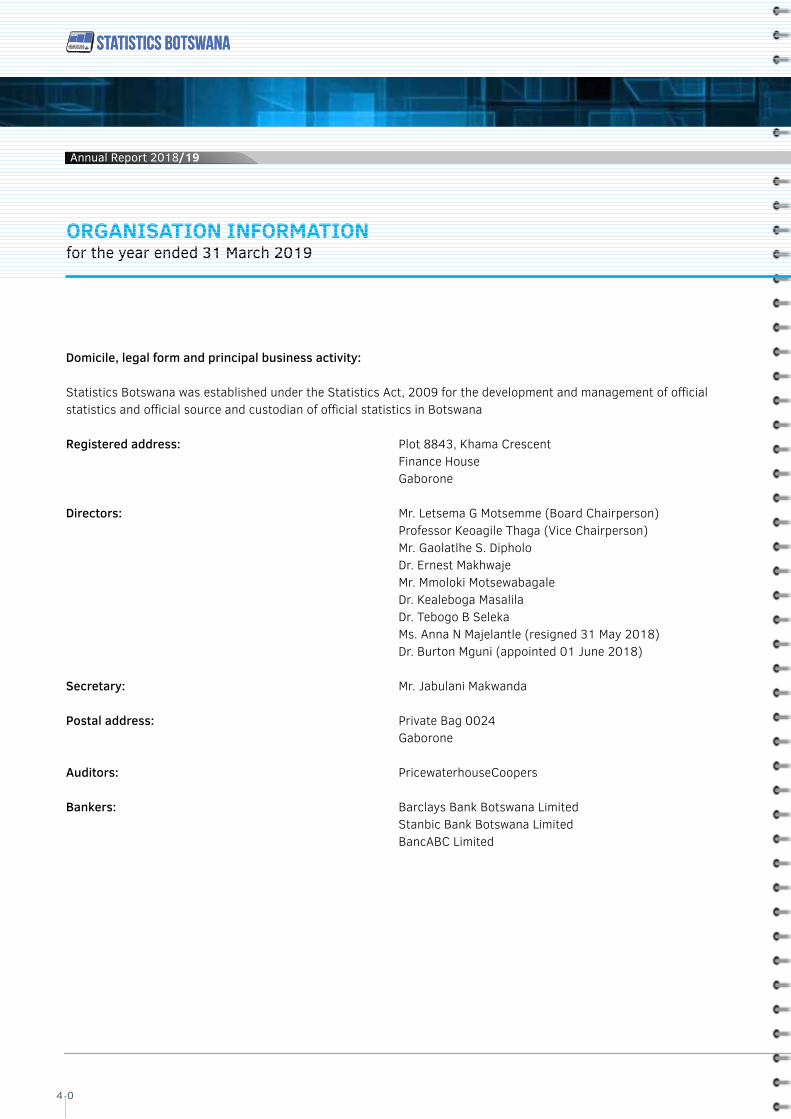
ORGANISATION INFORMATIONfor the year ended 31 March 2019
Domicile, legal form and principal business activity:
Statistics Botswana was established under the Statistics Act, 2009 for the development and management of official statistics and official source and custodian of official statistics in Botswana Registered address: Plot 8843, Khama Crescent Finance House Gaborone Directors: Mr. Letsema G Motsemme (Board Chairperson) Professor Keoagile Thaga (Vice Chairperson) Mr. Gaolatlhe S. Dipholo Dr. Ernest Makhwaje Mr. Mmoloki Motsewabagale Dr. Kealeboga Masalila Dr. Tebogo B Seleka Ms. Anna N Majelantle (resigned 31 May 2018) Dr. Burton Mguni (appointed 01 June 2018) Secretary: Mr. Jabulani Makwanda Postal address: Private Bag 0024 Gaborone Auditors: PricewaterhouseCoopers Bankers: Barclays Bank Botswana Limited Stanbic Bank Botswana Limited BancABC Limited
Annual Report 2018/19Annual Report 2018/19
4 0
Annual Report 2018/19
ANNUAL FINANCIAL STATEMENT FOR THE YEAR ENDED 31 MARCH 2019
CONTENTS
Statement of responsibility by the Board of Directors 42
Report of the independent auditors 43
Statement of comprehensive income 47
Statement of financial position 48
Statement of changes in funds 49
Statement of cash flows 50
Notes to the financial statements 51
ANNEXURE I Detailed income statement 69
4 1
STATEMENT OF RESPONSIBILITY BY THE BOARD OF DIRECTORSfor the year ended 31 March 2019
The directors of Statistics Botswana (“Organisation”) are responsible for the annual financial statements and all other information presented therewith. Their responsibility includes the maintenance of true and fair financial records and the preparation of annual financial statements in accordance with International Financial Reporting Standards and in the manner required by the Statistics Act, 2009.
The Organisation maintains systems of internal control, which are designed to provide reasonable assurance that the records accurately reflect its transactions and to provide protection against serious misuse or loss of Organisation’s assets. The directors are also responsible for the design, implementation, and maintenance and monitoring of these systems of internal financial control. Nothing has come to the attention of the directors to indicate that any significant breakdown in the functioning of these systems has occurred during the year under review.
The going concern basis has been adopted in preparing the annual financial statements. The directors have no reason to believe that the Organisation will not be a going concern in the foreseeable future, based on the continuous support by the Government of Botswana through the Ministry of Finance and Economic Development.
Our external auditors conduct an examination of the financial statements in conformity with International Standards on Auditing, which include tests of transactions and selective tests of internal accounting controls. Regular meetings are held between management and our external auditors to review matters relating to internal controls and financial reporting. The external auditors have unrestricted access to the board of directors.
The annual financial statements on pages 47 to 68 and supplementary information on Annexures I were authorised for issue on 23 September 2019 by the board of directors and are signed on its behalf by:
______________________ ________________________ Director Director
Annual Report 2018/19Annual Report 2018/19Annual Report 2018/19
4 2
Annual Report 2018/19Annual Report 2018/19
4 3
Our opinion
In our opinion, the financial statements give a true and fair view of the financial position of Statistics Botswana (the “Organisation”) as at 31 March 2019, and its financial performance and cash flows for the year then ended in accordance with International Financial Reporting Standards (“IFRS”).
What we have audited
Statistics Botswana’s financial statements set out on pages 47 to 68 comprise:• the statement of financial position as at 31 March 2019;• the statement of comprehensive income for the year then ended;• the statement of changes in funds for the year then ended;• the statement of cash flows for the year then ended; and• the notes to the financial statements, which include a summary of significant accounting policies.
Basis for opinion
We conducted our audit in accordance with International Standards on Auditing (ISAs). Our responsibilities under those standards are further described in the Auditor’s responsibilities for the audit of the financial statements section of our report.
We believe that the audit evidence we have obtained is sufficient and appropriate to provide a basis for our opinion.
Independence
We are independent of the Organisation in accordance with the International Code of Ethics for Professional Accountants (including International Independence Standards) (IESBA Code) issued by the International Ethics Standards Board for Accountants and other independence requirements applicable to performing audits of financial statements in Botswana. We have fulfilled our other ethical responsibilities in accordance with the IESBA Code and other ethical requirements applicable to performing audits of financial statements in Botswana.
Key audit matters
Key audit matters are those matters that, in our professional judgement, were of most significance in our audit of the financial statements of the current period. The matter was addressed in the context of our audit of the financial statements as a whole, and in forming our opinion thereon, and we do not provide a separate opinion on the matter. We communicate the key audit matter that relates to the audit of the financial statements of the current period in the table below.
INDEPENDENT AUDITOR’S REPORTTO THE MINISTER OF FINANCE AND ECONOMIC DEVELOPMENT
PricewaterhouseCoopers, Plot 50371, Fairground Office Park, Gaborone, P O Box 294, Gaborone, Botswana T: (267) 395 2011, F: (267) 397 3901, www.pwc.com/bw Country Senior Partner: B D Phirie Partners: R Binedell, A S Edirisinghe, L Mahesan, S K K Wijesena
PricewaterhouseCoopers, Plot 50371, Fairground Office Park, Gaborone, P O Box 294, Gaborone, Botswana T: (267) 395 2011, F: (267) 397 3901, www.pwc.com/bw Country Senior Partner: B D Phirie Partners: R Binedell, A S Edirisinghe, L Mahesan, S K K Wijesena
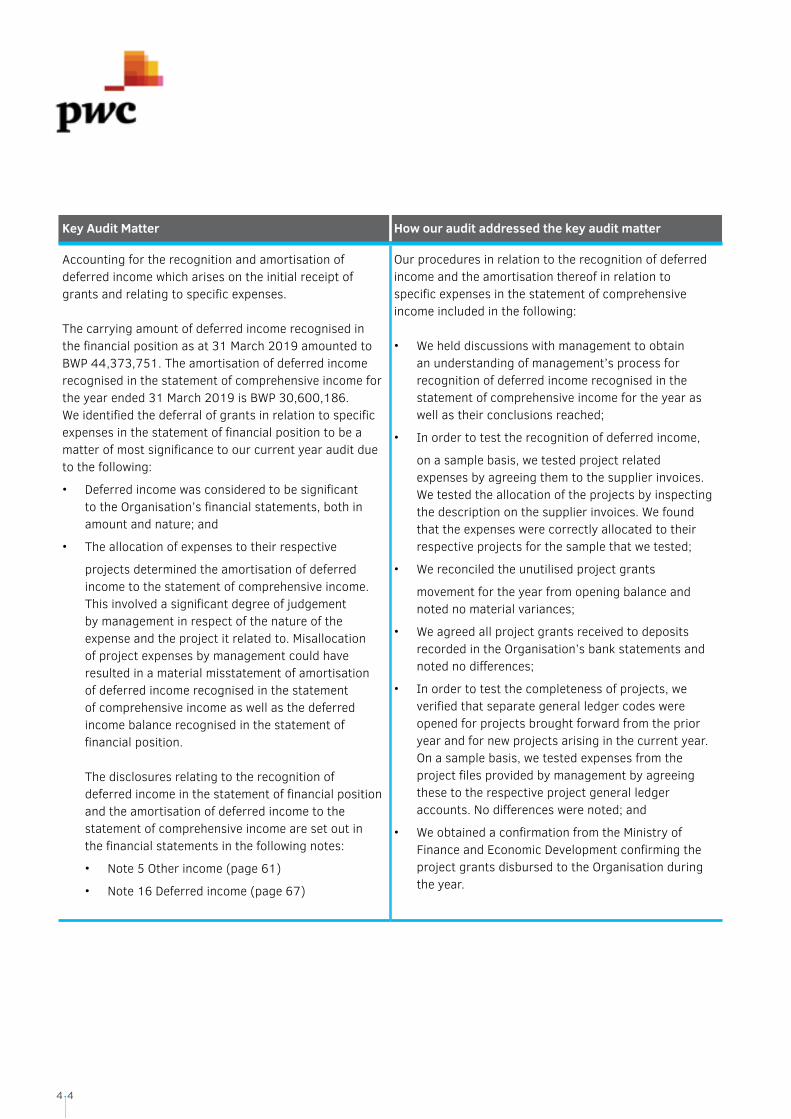
Key Audit Matter How our audit addressed the key audit matter
Accounting for the recognition and amortisation of deferred income which arises on the initial receipt of grants and relating to specific expenses.
The carrying amount of deferred income recognised in the financial position as at 31 March 2019 amounted to BWP 44,373,751. The amortisation of deferred income recognised in the statement of comprehensive income for the year ended 31 March 2019 is BWP 30,600,186.We identified the deferral of grants in relation to specific expenses in the statement of financial position to be a matter of most significance to our current year audit due to the following:
• Deferred income was considered to be significant to the Organisation’s financial statements, both in amount and nature; and
• The allocation of expenses to their respective
projects determined the amortisation of deferred income to the statement of comprehensive income. This involved a significant degree of judgement by management in respect of the nature of the expense and the project it related to. Misallocation of project expenses by management could have resulted in a material misstatement of amortisation of deferred income recognised in the statement of comprehensive income as well as the deferred income balance recognised in the statement of financial position.
The disclosures relating to the recognition of deferred income in the statement of financial position and the amortisation of deferred income to the statement of comprehensive income are set out in the financial statements in the following notes:
• Note 5 Other income (page 61)
• Note 16 Deferred income (page 67)
Our procedures in relation to the recognition of deferred income and the amortisation thereof in relation to specific expenses in the statement of comprehensive income included in the following:
• We held discussions with management to obtain an understanding of management’s process for recognition of deferred income recognised in the statement of comprehensive income for the year as well as their conclusions reached;
• In order to test the recognition of deferred income,
on a sample basis, we tested project related expenses by agreeing them to the supplier invoices. We tested the allocation of the projects by inspecting the description on the supplier invoices. We found that the expenses were correctly allocated to their respective projects for the sample that we tested;
• We reconciled the unutilised project grants
movement for the year from opening balance and noted no material variances;
• We agreed all project grants received to deposits recorded in the Organisation’s bank statements and noted no differences;
• In order to test the completeness of projects, we verified that separate general ledger codes were opened for projects brought forward from the prior year and for new projects arising in the current year. On a sample basis, we tested expenses from the project files provided by management by agreeing these to the respective project general ledger accounts. No differences were noted; and
• We obtained a confirmation from the Ministry of Finance and Economic Development confirming the project grants disbursed to the Organisation during the year.
4 4
4 5
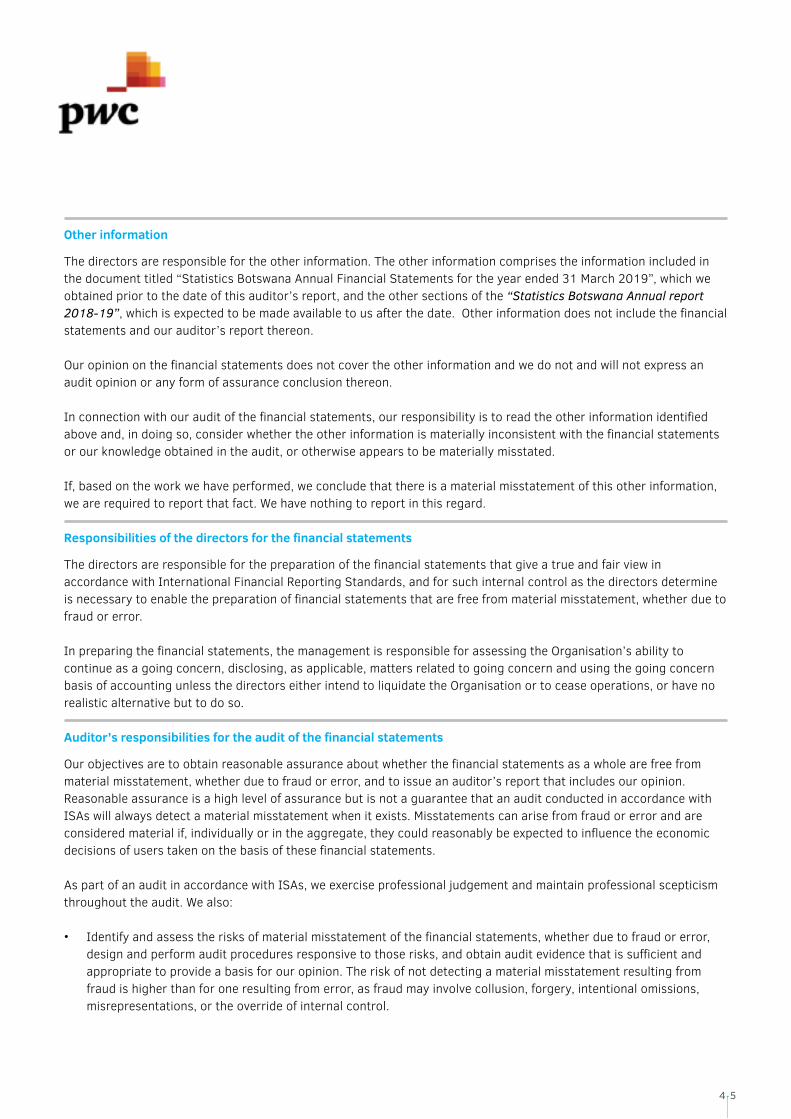
Other information
The directors are responsible for the other information. The other information comprises the information included in the document titled “Statistics Botswana Annual Financial Statements for the year ended 31 March 2019”, which we obtained prior to the date of this auditor’s report, and the other sections of the “Statistics Botswana Annual report 2018-19”, which is expected to be made available to us after the date. Other information does not include the financial statements and our auditor’s report thereon.
Our opinion on the financial statements does not cover the other information and we do not and will not express an audit opinion or any form of assurance conclusion thereon.
In connection with our audit of the financial statements, our responsibility is to read the other information identified above and, in doing so, consider whether the other information is materially inconsistent with the financial statements or our knowledge obtained in the audit, or otherwise appears to be materially misstated.
If, based on the work we have performed, we conclude that there is a material misstatement of this other information, we are required to report that fact. We have nothing to report in this regard.
Responsibilities of the directors for the financial statements
The directors are responsible for the preparation of the financial statements that give a true and fair view in accordance with International Financial Reporting Standards, and for such internal control as the directors determine is necessary to enable the preparation of financial statements that are free from material misstatement, whether due to fraud or error.
In preparing the financial statements, the management is responsible for assessing the Organisation’s ability to continue as a going concern, disclosing, as applicable, matters related to going concern and using the going concern basis of accounting unless the directors either intend to liquidate the Organisation or to cease operations, or have no realistic alternative but to do so.
Auditor’s responsibilities for the audit of the financial statements
Our objectives are to obtain reasonable assurance about whether the financial statements as a whole are free from material misstatement, whether due to fraud or error, and to issue an auditor’s report that includes our opinion. Reasonable assurance is a high level of assurance but is not a guarantee that an audit conducted in accordance with ISAs will always detect a material misstatement when it exists. Misstatements can arise from fraud or error and are considered material if, individually or in the aggregate, they could reasonably be expected to influence the economic decisions of users taken on the basis of these financial statements.
As part of an audit in accordance with ISAs, we exercise professional judgement and maintain professional scepticism throughout the audit. We also:
• Identify and assess the risks of material misstatement of the financial statements, whether due to fraud or error, design and perform audit procedures responsive to those risks, and obtain audit evidence that is sufficient and appropriate to provide a basis for our opinion. The risk of not detecting a material misstatement resulting from fraud is higher than for one resulting from error, as fraud may involve collusion, forgery, intentional omissions, misrepresentations, or the override of internal control.
Annual Report 2018/19Annual Report 2018/19
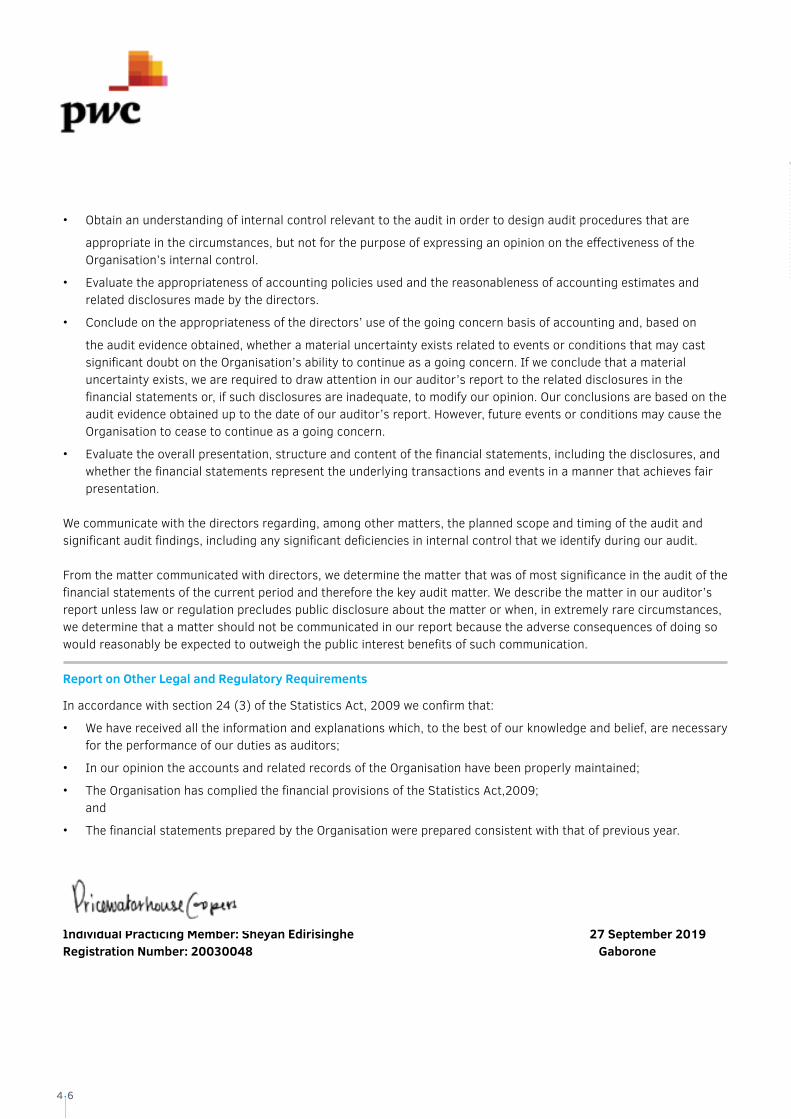
• Obtain an understanding of internal control relevant to the audit in order to design audit procedures that are
appropriate in the circumstances, but not for the purpose of expressing an opinion on the effectiveness of the Organisation’s internal control.
• Evaluate the appropriateness of accounting policies used and the reasonableness of accounting estimates and related disclosures made by the directors.
• Conclude on the appropriateness of the directors’ use of the going concern basis of accounting and, based on
the audit evidence obtained, whether a material uncertainty exists related to events or conditions that may cast significant doubt on the Organisation’s ability to continue as a going concern. If we conclude that a material uncertainty exists, we are required to draw attention in our auditor’s report to the related disclosures in the financial statements or, if such disclosures are inadequate, to modify our opinion. Our conclusions are based on the audit evidence obtained up to the date of our auditor’s report. However, future events or conditions may cause the Organisation to cease to continue as a going concern.
• Evaluate the overall presentation, structure and content of the financial statements, including the disclosures, and whether the financial statements represent the underlying transactions and events in a manner that achieves fair presentation.
We communicate with the directors regarding, among other matters, the planned scope and timing of the audit and significant audit findings, including any significant deficiencies in internal control that we identify during our audit.
From the matter communicated with directors, we determine the matter that was of most significance in the audit of the financial statements of the current period and therefore the key audit matter. We describe the matter in our auditor’s report unless law or regulation precludes public disclosure about the matter or when, in extremely rare circumstances, we determine that a matter should not be communicated in our report because the adverse consequences of doing so would reasonably be expected to outweigh the public interest benefits of such communication.
Report on Other Legal and Regulatory Requirements
In accordance with section 24 (3) of the Statistics Act, 2009 we confirm that:
• We have received all the information and explanations which, to the best of our knowledge and belief, are necessary for the performance of our duties as auditors;
• In our opinion the accounts and related records of the Organisation have been properly maintained;
• The Organisation has complied the financial provisions of the Statistics Act,2009; and
• The financial statements prepared by the Organisation were prepared consistent with that of previous year.
Individual Practicing Member: Sheyan Edirisinghe 27 September 2019Registration Number: 20030048 Gaborone
4 6
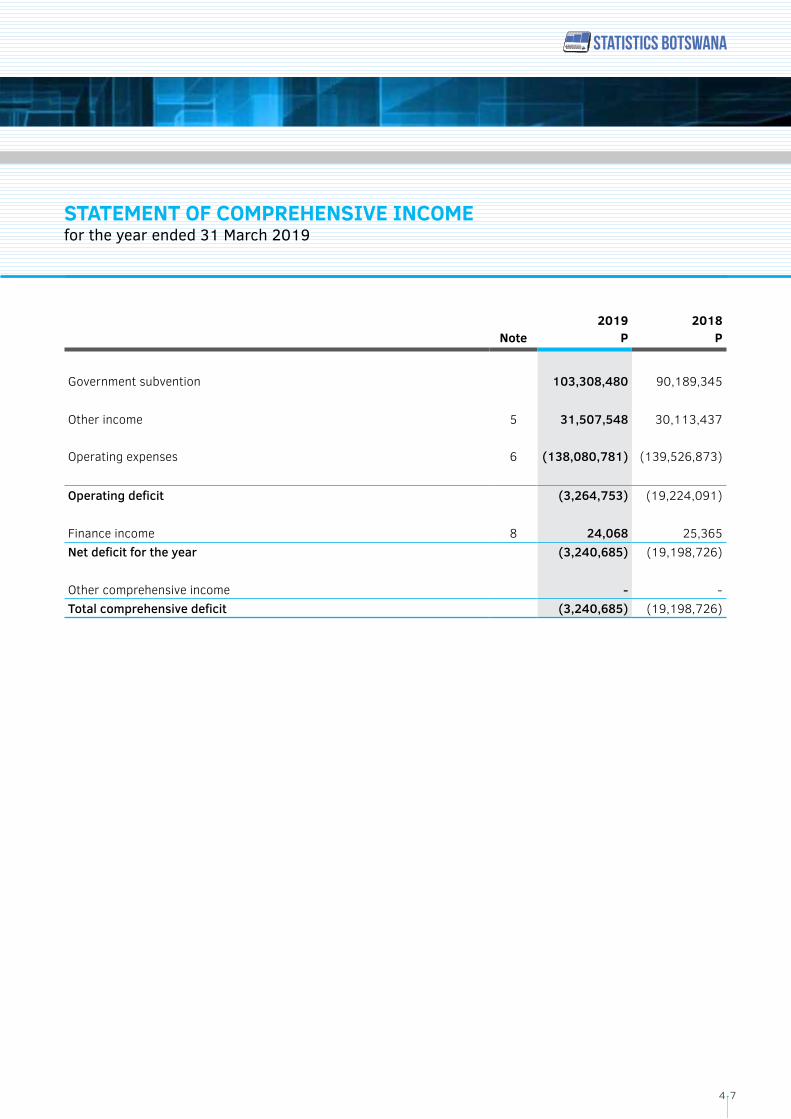
Note2019
P2018
P
Government subvention 103,308,480 90,189,345
Other income 5 31,507,548 30,113,437
Operating expenses 6 (138,080,781) (139,526,873)
Operating deficit (3,264,753) (19,224,091)
Finance income 8 24,068 25,365 Net deficit for the year (3,240,685) (19,198,726)
Other comprehensive income - - Total comprehensive deficit (3,240,685) (19,198,726)
STATEMENT OF COMPREHENSIVE INCOMEfor the year ended 31 March 2019
4 7
Note2019
P2018
P
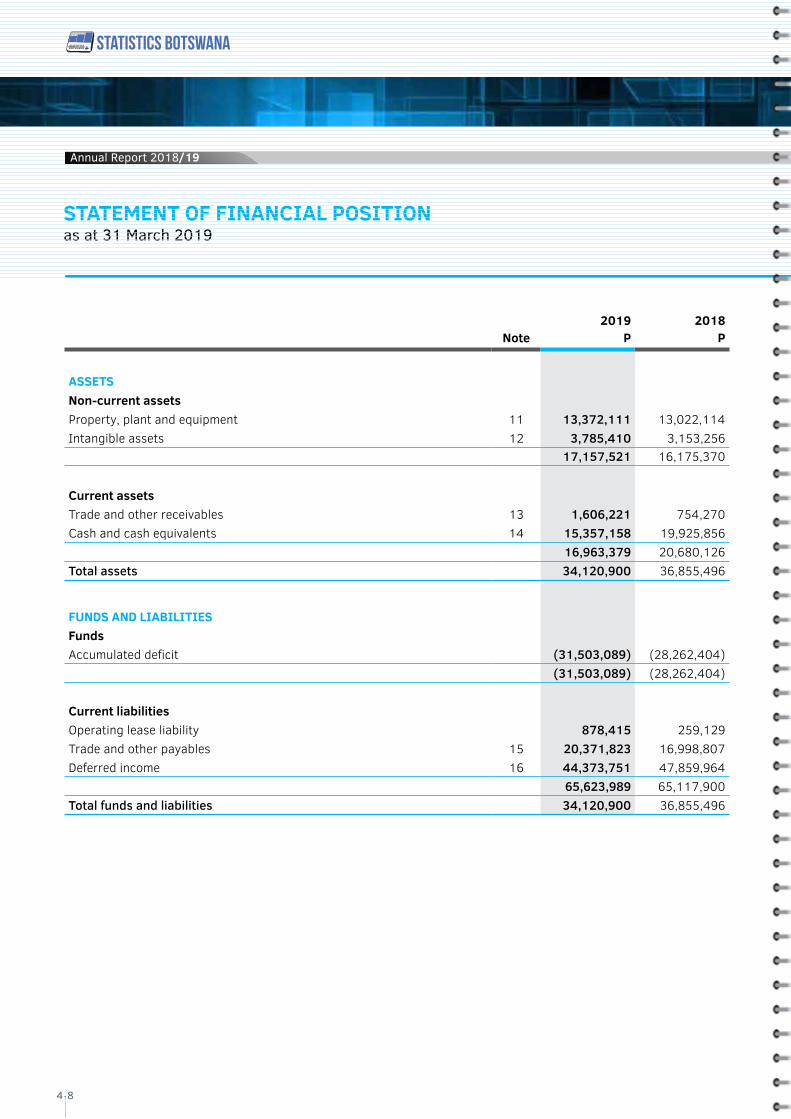
ASSETSNon-current assetsProperty, plant and equipment 11 13,372,111 13,022,114 Intangible assets 12 3,785,410 3,153,256
17,157,521 16,175,370
Current assetsTrade and other receivables 13 1,606,221 754,270 Cash and cash equivalents 14 15,357,158 19,925,856
16,963,379 20,680,126 Total assets 34,120,900 36,855,496
FUNDS AND LIABILITIESFundsAccumulated deficit (31,503,089) (28,262,404)
(31,503,089) (28,262,404)
Current liabilitiesOperating lease liability 878,415 259,129 Trade and other payables 15 20,371,823 16,998,807 Deferred income 16 44,373,751 47,859,964
65,623,989 65,117,900 Total funds and liabilities 34,120,900 36,855,496
STATEMENT OF FINANCIAL POSITIONas at 31 March 2019
Annual Report 2018/19Annual Report 2018/19
4 8
ACCUMULATED DEFICIT
P
TOTAL FUNDS
P
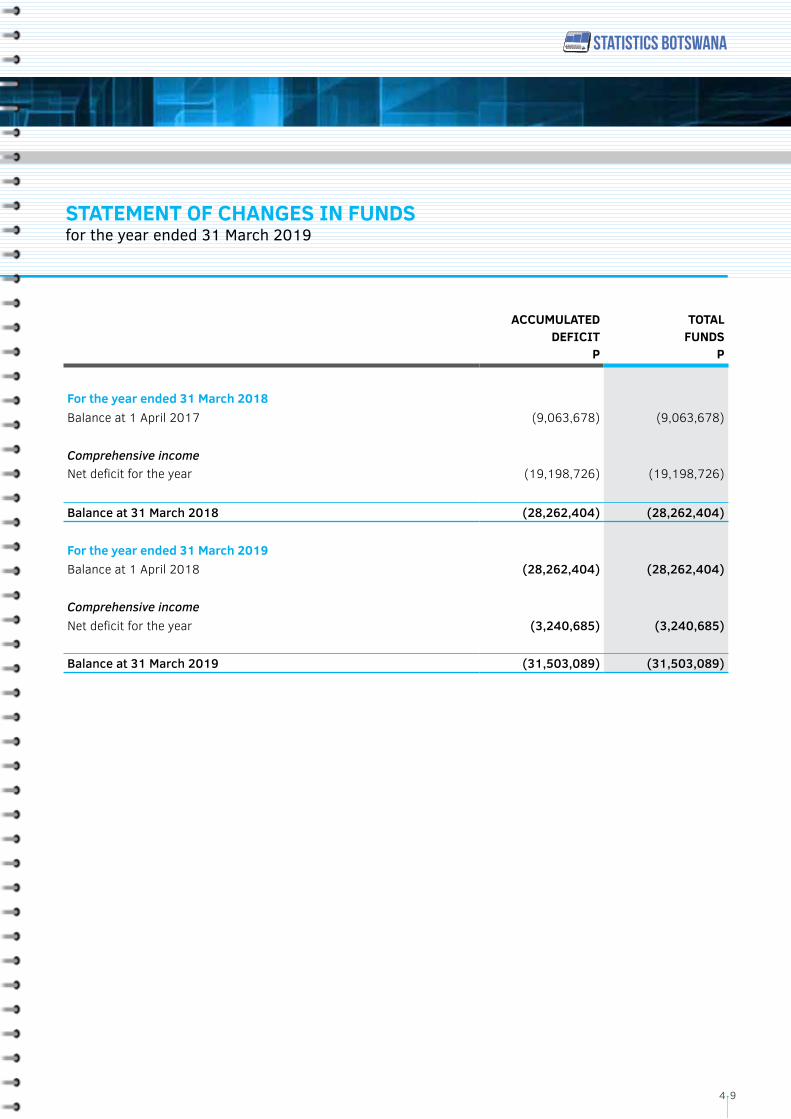
For the year ended 31 March 2018Balance at 1 April 2017 (9,063,678) (9,063,678)
Comprehensive incomeNet deficit for the year (19,198,726) (19,198,726)
Balance at 31 March 2018 (28,262,404) (28,262,404)
For the year ended 31 March 2019Balance at 1 April 2018 (28,262,404) (28,262,404)
Comprehensive incomeNet deficit for the year (3,240,685) (3,240,685)
Balance at 31 March 2019 (31,503,089) (31,503,089)
Annual Report 2018/19
4 9
STATEMENT OF CHANGES IN FUNDSfor the year ended 31 March 2019
Note2019
P2018
P
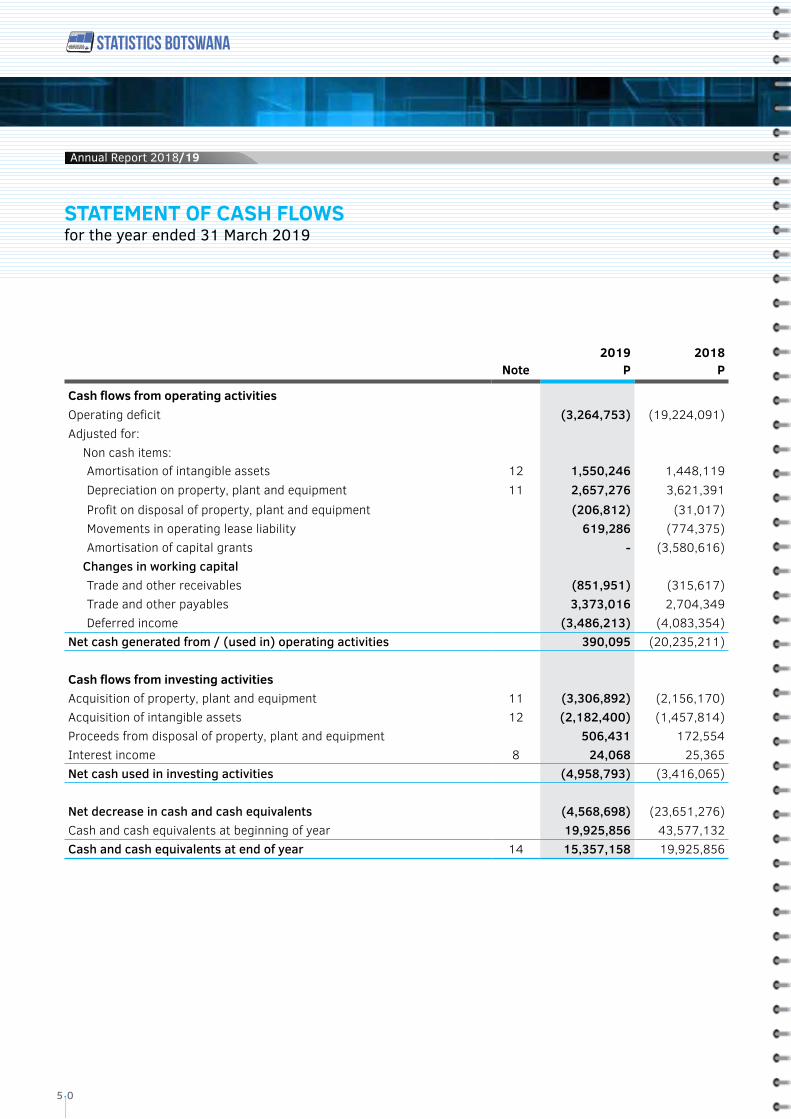
Cash flows from operating activitiesOperating deficit (3,264,753) (19,224,091)Adjusted for:
Non cash items: Amortisation of intangible assets 12 1,550,246 1,448,119 Depreciation on property, plant and equipment 11 2,657,276 3,621,391 Profit on disposal of property, plant and equipment (206,812) (31,017)Movements in operating lease liability 619,286 (774,375)Amortisation of capital grants - (3,580,616)
Changes in working capitalTrade and other receivables (851,951) (315,617)Trade and other payables 3,373,016 2,704,349 Deferred income (3,486,213) (4,083,354)
Net cash generated from / (used in) operating activities 390,095 (20,235,211)
Cash flows from investing activitiesAcquisition of property, plant and equipment 11 (3,306,892) (2,156,170)Acquisition of intangible assets 12 (2,182,400) (1,457,814)Proceeds from disposal of property, plant and equipment 506,431 172,554 Interest income 8 24,068 25,365 Net cash used in investing activities (4,958,793) (3,416,065)
Net decrease in cash and cash equivalents (4,568,698) (23,651,276)Cash and cash equivalents at beginning of year 19,925,856 43,577,132 Cash and cash equivalents at end of year 14 15,357,158 19,925,856
Annual Report 2018/19Annual Report 2018/19
5 0
STATEMENT OF CASH FLOWS for the year ended 31 March 2019
NOTES TO THE FINANCIAL STATEMENTS for the year ended 31 March 2019
1 General information
Statistics Botswana (the “Organisation”) was established under the Statistics Act, 2009 for the development and management of official statistics and official source and custodian of official statistics in Botswana. The address of its registered office is Plot 8843, Khama Crescent, Finance House, Gaborone.
The financial statements set out on pages 47 to 68 have been approved by the board of directors on 23 September 2019.
2 Principal accounting policies
The principal accounting policies applied in the preparation of these financial statements are set out below. These policies have been consistently applied to all years presented, unless otherwise stated.
2.1 Basis of preparation
The annual financial statements have been prepared in accordance with International Financial Reporting Standards (IFRS). The financial statements have been prepared under the historical cost convention.
The preparation of financial statements in conformity with IFRS requires the use of certain accounting estimates and assumptions that affect the reported amounts of assets and liabilities and disclosure of contingent assets and liabilities at the date of the financial statements and the reported amounts of income and expenses during the reporting period. Although these estimates are based on the board of directors’ best knowledge of the current events and actions, actual results may ultimately differ from those estimates. It also requires the board of directors to exercise its judgment in the process of applying the Organisation’s accounting policies.
Estimates and judgments are continually evaluated based on historical experience and other factors, including expectations of future events that are believed to be reasonable under the circumstances. The areas involving a higher degree of judgment or complexity, or areas where assumptions and estimates are significant to the financial statements are disclosed in Note 3.
2.1.1 Adoption of standards in the current financial year
(a) New and amended standards applicable to the current period
The following new standards, amendments and interpretations to existing standards are mandatory for the organisation’s accounting periods beginning on or after 1 January 2018. These have been adopted by the Organisation during the year.
• IFRS 9 – Financial Instruments (2009 & 2010), Financial liabilities, Derecognition of financial instruments, Financial assets, General hedge accounting - This standard replaces the guidance in IAS 39. It includes requirements on the classification and measurement of financial assets and liabilities; it also includes an expected credit losses model that replaces the current incurred loss impairment model.
This amendment had no material impact on the entity as the organistaion does not have financial assets other than staff debtors which are assessed for impairment individually.
Annual Report 2018/19
5 1
• IFRS 15 – Revenue from contracts with customers - The FASB and IASB issued their long awaited converged standard on revenue recognition on 29 May 2014. It is a single, comprehensive revenue recognition model for all contracts with customers to achieve greater consistency in the recognition and presentation of revenue. Revenue is recognised based on the satisfaction of performance obligations, which occurs when control of good or service transfers to a customer (Effective 1 January 2018).
The IASB has amended IFRS 15 to clarify the guidance, but there were no major changes to the standard itself. The amendments comprise clarifications of the guidance on identifying performance obligations, accounting for licences of intellectual property and the principal versus agent assessment (gross versus net revenue presentation). New and amended illustrative examples have been added for each of these areas of guidance. The IASB has also included additional practical expedients related to transition to the new revenue standard.
This amendment had no impact on the entity. The main source of revenue for the Organisation is grant income which is considered in accordance with IAS – 20, Accounting for Government Grant and Disclosure for Government Assistance. There are no sources of revenue that fall within the scope of IFRS 15.
• IFRIC 22, ‘Foreign currency transactions and advance consideration’ - This IFRIC addresses foreign currency transactions or parts of transactions where there is consideration that is denominated or priced in a foreign currency. The interpretation provides guidance for when a single payment/receipt is made as well as for situations where multiple payment/receipts are made. The guidance aims to reduce dicersity in practice.
This amendment had no inpact on the entity.
b) New standards, amendments and interpretations to existing standards that are not yet effective and have not been early adopted by the Organisation
The following new standards, amendments and interpretations to existing standards are mandatory for the Organisation. These are not yet effective and have not been early adopted by the Organisation.
• Amendment to IAS 1, ‘Presentation of financial statements’ and IAS 8, ‘Accounting policies, changes in accounting estimates and errors’ on the definition of material.
These amendments to IAS 1 and IAS 8 and consequential amendments to other IFRSs: • use a consistent definition of
materiality through IFRSs and the Conceptual Framework for Financial Reporting;
• clarify the explanation of the definition of material; and
• incorporate some of the guidance in IAS 1 about immaterial information.
2.1 Basis of preparation [Continued]
(a) New and amended standards applicable to the current period [Continued]
Annual Report 2018/19Annual Report 2018/19
5 2
NOTES TO THE FINANCIAL STATEMENTS [CONTINUED] for the year ended 31 March 2019
2.1 Basis of preparation [Continued]
b) New standards, amendments and interpretations to existing standards that are not yet effective and have not been early adopted by the Organisation [Continued]
The amended definition is: “Information is material if omitting, misstating or obscuring it could reasonably be expected to influence decisions that the primary users of general purpose financial statements make on the basis of those financial statements, which provide financial information about a specific reporting entity.”
• IFRS 16 – Leases - This standard replaces the current guidance in IAS 17 and is a far-reaching change in accounting by lessees in particular. Under IAS 17, lessees were required to make a distinction between a finance lease (on balance sheet) and an operating lease (off balance sheet). IFRS 16 now requires lessees to recognise a lease liability reflecting future lease payments and a ‘right-of-use asset’ for virtually all lease contracts. The IASB has included an optional exemption for certain short-term leases and leases of low-value assets; however, this exemption can only be applied by lessees.
For lessors, the accounting stays almost the same. However, as the IASB has updated the guidance on the definition of a lease (as well as the guidance on the combination and separation of contracts), lessors will also be affected by the new standard.
At the very least, the new accounting model for lessees is expected to impact negotiations between lessors and lessees. Under IFRS 16, a contract is, or contains, a lease if the contract conveys the right to control the use of an identified asset for a period of time in exchange for consideration.
IFRS 16 supersedes IAS 17, ‘Leases’, IFRIC 4, ‘Determining whether an Arrangement contains a Lease’, SIC 15, ‘Operating Leases – Incentives’ and SIC 27, ‘Evaluating the Substance of Transactions Involving the Legal Form of a Lease’.
Management has not as yet concluded the assessment of the impact of adopting IFRS 16.
• IAS 19 Employee benefits – These amendments require an entity to:
Use updated assumptions to determine current service cost and net interest for the
remainder of the period after a plan amendment, curtailment or settlement; and recognise in profit or loss as part of past service cost, or a gain or loss on settlement, any reduction in a surplus (recognised or unrecognised). This reflects the substance of the transaction, because a surplus that has been used to settle an obligation or provide additional benefits is recovered. The impact on the asset ceiling is recognised in other comprehensive income, and it is not reclassified to profit or loss. The impact of the amendments is to confirm that these effects are not offset.
Organisation is in the process of considering the impact of above standards.
Annual Report 2018/19
5 3
NOTES TO THE FINANCIAL STATEMENTS [CONTINUED] for the year ended 31 March 2019
2.2 Foreign currency translation
2.2.1 Functional and presentation currency
Items included in the financial statements of the Organisation are measured using the currency of the primary economic environment in which the entity operates (‘the functional currency’). The financial statements are presented in Botswana Pula, which is the Organisation’s functional and presentation currency.
2.2.2 Transactions and balances
Foreign currency transactions are translated into the functional currency using the exchange rates prevailing at the dates of the transactions or valuation where items are remeasured. Foreign exchange gains and losses resulting from the settlement of such transactions and from the translation at year-end exchange rates of monetary assets and liabilities denominated in foreign currencies are recognised in the statement of comprehensive income.
Foreign exchange gains and losses that relate to borrowings and cash and cash equivalents are presented in the statement of comprehensive income within ‘finance income or costs’. All other foreign exchange gains and losses are presented in the statement within ‘Other (losses)/gains – net’.
2.3 Property, plant and equipment
Property, plant and equipment are included at historical cost less depreciation. Historical cost includes expenditure that is directly attributable to the acquisition of the items. Subsequent costs are included in the asset’s carrying amount or recognised as a separate asset, as appropriate, only when it is probable that future economic benefits associated with the item will flow to the Organisation and the cost of the item can be measured reliably. The carrying amount of the replaced part is derecognised. All other repairs and maintenance are charged to the statement of comprehensive income during the financial period in which they are incurred.
Depreciation is calculated using the straight-line method to write off the cost of each asset to their residual values over their estimated useful lives as follows:
- Furniture and fittings 1 - 11 years - Motor vehicles 1 – 6 years - Office equipment 1 - 9 years - Computer equipment 1 - 8 years The assets’ residual values and useful lives are reviewed, and adjusted if appropriate, at the end of each reporting period. An asset’s carrying amount is written down immediately to its recoverable amount if the asset’s carrying amount is greater than its estimated recoverable amount.
Gains and losses on disposals are determined by comparing proceeds with carrying amount. These are included in the statement of comprehensive income.
NOTES TO THE FINANCIAL STATEMENTS [CONTINUED] for the year ended 31 March 2019
Annual Report 2018/19Annual Report 2018/19
5 4
2.4 Intangible assets Computer software
Costs associated with maintaining computer software programmes are recognised as an expense as incurred. Purchase costs that are directly attributable to software products controlled by Organisation are recognised as intangible assets when the following criteria are met:
– it is technically feasible to complete the software product so that it will be available for use;
– there is an ability to use the software product;– it can be demonstrated how the software product will
generate probable future economic benefits;
Directly attributable costs that are capitalised as part of the software product include the software purchase costs. Other development expenditure that do not meet these criteria are recognised as an expense as incurred. Computer software costs recognised as assets are amortised over their estimated useful lives from the time its ready for the intended use, which do not exceed five years.
2.5 Impairment of non-financial assets
Non-financial that have an indefinite useful life, such as goodwill or intangible assets not ready to use, are not subject to amortisation and are tested annually for impairment. Assets that are subject to amortisation are reviewed for impairment whenever events or changes in circumstances indicate that the carrying amount may not be recoverable. An impairment loss is recognised for the amount by which the asset’s carrying amount exceeds its recoverable amount. The recoverable amount is the higher of an asset’s fair value less costs to sell and value
in use. For the purposes of assessing impairment, assets are grouped at the lowest levels for which there are largely independent cash flows (cash-generating units). Prior impairments of non-financial assets (other than goodwill) are reviewed for possible reversal at each reporting date.
2.6 Financial assets The Organisation classifies its financial assets in the following categories: at fair value through profit or loss, loans and receivables, and available-for-sale. The classification depends on the purpose for which the financial assets were acquired. Management determines the classification of its financial assets at initial recognition.
2.6.1 Classification
(a) Financial assets at fair value through profitorloss
Financial assets at fair value through profit or loss are financial assets held for trading. A financial asset is classified in this category if acquired principally for the purpose of selling in the short-term. Derivatives are classified as held for trading unless they are designated as hedges. Assets in this category are classified as current assets if expected to be settled within 12 months, otherwise they are classified as non-current.
(b) Financial assets at amortised cost
Financial assets at amortised cost includes other receivable which are non-derivative financial assets with fixed or determinable payments that are not quoted in an active market. They are included in current assets, except for maturities greater than 12 months after the reporting date. These are classified as non-current assets. The Organisation’s loans and receivables comprise trade and other receivables and cash and cash equivalents in the statement of financial position.
Annual Report 2018/19
5 5
NOTES TO THE FINANCIAL STATEMENTS [CONTINUED] for the year ended 31 March 2019
2.6.2 Recognition and measurement
Regular purchases and sales of financial assets are recognised on the trade date, the date on which the Organisation commits to purchase or sell the asset. Investments are initially recognised at fair value plus transaction costs for all financial assets not carried at fair value through profit or loss. Financial assets carried at fair value through profit or losses are initially sed at fair value and transaction costs are expensed in the statement of comprehensive income.
Financial assets are derecognised when the rights to receive cash flows from the investments have expired or have been transferred and the Organisation has transferred substantially all risks and rewards of ownership.
Financial assets at fair value through profit or loss are subsequently carried at fair value. Loans and receivables are carried at amortised cost using the effective interest method.
Gains or losses arising from changes in the fair value of the ‘financial assets at fair value through profit or loss’ category are presented in the statement of comprehensive income within ‘other income’ in the period in which they arise.
There were no financial assets categorised as fair value through profit or loss at the reporting date.
2.6.3 Off-setting financial instruments
Financial assets and liabilities are off-set and the net amount reported in the statement of financial position when there is a legally enforceable right to off-set the recognised amounts and there is an intention to settle on a net basis or realise the asset and settle the liability simultaneously.
2.6.4 Impairment of financial assets
The Organisation assesses at each reporting date whether there is objective evidence that a financial asset or a group of financial assets is impaired. Impairment testing of trade receivables is described in note 2.7
2.7 Trade receivables
Classification
Trade and other receivables, excluding, when applicable, prepayments, are classified as financial assets and subsequently measured at amortized cost.
They have been classified in this manner because their contractual terms give rise, on specified dates to cash flows that are solely payments of principal and interest on the principal outstanding, and the Organisation’s business model is to collect the contractual cash flows on trade and other receivables.
Recognition and measurement
Trade and other receivables are recognized when the Organisation becomes a party to the contractual provisions of the receivables. They are measured, at initial recognition, at fair value plus transaction costs, if any. Subsequently they are measured at amortized cost.
The amortized cost is the amount recognized on the receivables initially, minus principal repayments, plus cumulative amortization (interest) using the effective interest method of any difference between the initial amount and the maturity amount, adjusted for any loss allowance. The Organisation does not have any trade receivables, thus no loss allowance for expected credit losses are made.
2.6 Financial assets [Continued]
Annual Report 2018/19Annual Report 2018/19
5 6
NOTES TO THE FINANCIAL STATEMENTS [CONTINUED] for the year ended 31 March 2019
2.8 Cash and cash equivalents
Cash and cash equivalents includes cash in hand, deposits held at call with banks, other short-term highly liquid investments with original maturities of three months or less, and bank overdrafts. Bank overdrafts are shown within borrowings in current liabilities on the statement of financial position.
2.9 Trade and other payables
Trade payables are obligations to pay for goods or services that have been acquired in the ordinary course of business from suppliers. Accounts payable are classified as current liabilities if payment is due within one year or less (or in the normal operating cycle of the business if longer). If not, they are presented as non-current liabilities.
Trade payables are recognised initially at fair value and subsequently measured at amortised cost using the effective interest method.
2.10 Provisions
Provisions claims are recognised when the Organisation has a present legal or constructive obligation as a result of past events, it is probable that an outflow of resources will be required to settle the obligation; and the amount has been reliably estimated. Provisions are not recognised for future operating losses.
Where there are a number of similar obligations, the likelihood that an outflow will be required in settlement is determined by considering the class of obligations as a whole. A provision is recognised even if the likelihood of an outflow with respect to any one item included in the same class of obligations may be small.
Provisions are measured at the present value of the expenditures expected to be required to settle the obligation using a pre-tax rate that reflects current market assessments of the time value of money and the risks specific to the obligation. The increase in the provision due to passage of time is recognised as interest expense.
Provisions are reviewed at the end of each reporting date and adjusted to reflect the current best estimate. If it is no longer probable that an outflow of resources embodying economic benefits will be required to settle the obligation, the provision is reversed.
2.11 Grant income
Government grants are assistance by government in the form of transfers of resources to the Organisation in return for compliance with certain conditions relating to the operating activities of the Organisation.
Government subventions relating to a particular period are recognised in the respective period at their cost where there is a reasonable assurance that the subventions will be received and the Organisation has complied with conditions attached to them.
Grants from the Government and other donor Organasations are initially recognised to deferred income under current liabilities in the statement of financial position, once there is reasonable assurance that the Organisation will comply with the conditions attaching to them (as applicable) and it is reasonably assured that the grant will be received.
Grants received for specific expenses are recognised in the statement of comprehensive income over the period necessary to match the expenses they are intended to compensate. Grants received for which the related expense have not been incurred remain included in current liabilities as deferred income.
Annual Report 2018/19
5 7
NOTES TO THE FINANCIAL STATEMENTS [CONTINUED] for the year ended 31 March 2019
Grants received for the acquisition of property, plant and equipment (“capital assets”) are recognised as capital grants in the statement of financial position in the period in which the underlying asset is bought. Grants, for which the underlying asset has been bought, is subsequently recognised in the statement of comprehensive income to match the depreciation of the related assets, as other income.
2.12 Employee benefits
The Organisation contributes to a defined contribution pension plan for its permanent citizen employees. The Organisation’s contributions are charged to income statement in the year in which they accrue and the Organisation has no further liability. A defined contribution plan is a pension plan under which the Organisation pays fixed contributions into a separate fund and will have no legal or constructive obligation to pay further contributions if the fund does not hold sufficient assets to pay all employees benefits relating to employee service in the current and prior periods. The Organisation pays gratuity to contracted staff in accordance with their respective contracts of employment.
Employees’ entitlements to annual leave are recognised when they accrue to employees and a provision is made for the estimated liability as a result of services rendered by employees up to the reporting date.
2.13 Revenue recognition
Revenue comprises the fair value of the consideration received or receivable for the sale of goods and services in the ordinary course of the Organisation’s activities. Revenue is shown net of value-added tax, returns, rebates and discounts.
Government grants
Please refer policy number 2.11
Sale of maps and booklets
The Organisation sells maps and booklets. The risks and rewards of ownership of goods is transferred to the customer at the point at which the goods have been received and accepted by the customer.
The Organisation recognises revenue from the sale of goods when the amount of revenue can be reliably measured, it is probable that the economic benefits will flow to the Organisation and when the significant risk and rewards of ownership of goods have been transferred to the buyer.
Interest income
Interest income is recognised using the effective interest method. When a loan and receivable is impaired, the Organisation reduces the carrying amount to its recoverable amount, being the estimated future cash flow discounted at the original effective interest rate of the instrument, and continues unwinding the discount as interest income. Interest income on impaired loan and receivables are recognised using the original effective interest rate.
2.14 Operating leases - Lessee
Leases where a significant portion of the risks and rewards of ownership are retained by the lessor are classified as operating leases. Payments made under operating leases (net of any incentives received from the lessor) are charged to the statement of comprehensive income on a straight-line basis over the period of the lease.
2.15 Related parties
A party is deemed related to the Organisation if it is a director, member or entity under common control. Related party transactions are disclosed in Note 17 to the financial statements.
2.11 Grant income [Continued]
NOTES TO THE FINANCIAL STATEMENTS [CONTINUED] for the year ended 31 March 2019
Annual Report 2018/19Annual Report 2018/19
5 8
3. Financial risk management 3.1 Financial risk factors The Organisation’s activities expose it to a variety of financial risks: market risk (including fair value interest rate risk and other price risk), credit risk and liquidity risk. The Organisation’s overall risk management programme focuses on the unpredictability of financial markets and seeks to minimise potential adverse effects on the Organisation’s financial performance. Risk management is carried out under policies approved by the board of directors.
(a) Market risk
(i) Foreign currency risk In the normal course of business, the Organisation may enter into transactions denominated in foreign currencies. Foreign exchange risks arises when future commercial transactions or recognised assets and liabilities are denominated in a currency that is not the entity’s functional currency. At the reporting date, the Organisation had no assets or liabilities or significant committed future transactions denominated in foreign currencies.
(ii) Cash flow and fair value interest rate risk Fluctuation in interest rates impact on the value of short-term cash investment and financing activities, giving rise to interest rate risk. The cash is managed to ensure surplus funds are invested in a manner to achieve maximum returns while minimising risk.
The Organisation has no long-term significant interest-bearing assets. The cash is deposited in short-term deposits until it is used for its purpose.
At 31 March 2019, if interest rates on short-term deposit had been 1% higher / lower with all other variables held constant, post-tax profit for the year would have been P 88 712 (2018: P 90,254) higher/lower, mainly as a result of higher / lower interest income on floating rate deposits. (iii) Price risk The Organisation is not exposed to price risks such as equity price risk, prepayment risk, and residual value risk.
(b) Credit risk
Financial assets of the Organisation, which are subject to credit risk, consist mainly of cash and cash equivalents, deposits with banks and financial institutions and receivables from customers. Cash deposits are held with high-credit-quality financial institutions. The credit quality of the customers is assessed by credit control, taking into account its financial position, past experience and other factors. Individual risk limits are set based on internal ratings.
The utilisation of credit limits is regularly monitored.
The credit quality of financial assets is disclosed in Note 10.2
(c) Liquidity risk
Prudent liquidity risk management implies maintaining sufficient cash and marketable securities, the availability of funding through an adequate amount of committed credit facilities and the ability to close out market positions.
The Organisation manages its liquidity risk by maintaining adequate cash resources and through the effective management of working capital in order to meet its commitments as they fall due.
Annual Report 2018/19
5 9
NOTES TO THE FINANCIAL STATEMENTS [CONTINUED] for the year ended 31 March 2019
Annual Report 2018/19
3. Financial risk management [Continued]
3.1 Financial risk factors [Continued]
The Organisation’s financial liabilities as given in the table below consist of trade and other payables with a maturity period of less than 12 months from the reporting date. The analyses of financial liabilities into relevant maturity groupings are based on the remaining period at the reporting date to the contractual maturity date. Balances due within 12 months equal their carrying balances as the impact of discounting is not significant.
31 March 31 March 2019 2018 P P
Financial liabilities 10,830,406 10,700,852falling due within 12 months
3.2 Capital risk management
The Organisation is a parastatal body with the main object being the development and management of official statistics and official source and custodian of official statistics in Botswana. As such all operations of the Organisation are funded by Government and therefore not subject to capital risk.
3.3 Fair value estimation of financial instruments Financial instruments consist of trade receivables, bank and cash balances and other accounts payable resulting from normal business operations. The nominal value less impairment provision of trade receivables and accounts payable are assumed to approximate their fair values. The particular recognition methods adopted are disclosed in the individual policy statements associated with each item. At the reporting date there are no assets that are either carried at fair value or where the fair value has been disclosed.
4. Critical accounting estimates and judgments
Estimates and judgments are continually evaluated and are based on historical experience and other factors, including expectations of future events that are believed to be reasonable under the circumstances.
The Organisation makes estimates and assumptions concerning the future. The resulting accounting estimates will, by definition, seldom equal the related actual results. The estimates and assumptions that have a significant risk of causing a material adjustment to the carrying amounts of assets and liabilities within financial year are discussed below.
Residual value and useful lives of property, plant and equipment The Organisation determines the estimated useful lives and related depreciation charges for its plant and equipment. This estimate is based on projections about the continued existence of a market for its services and the ability of the Organisation to penetrate a sufficient portion of that market in order to operate profitably. The Organisation increases the depreciation charge where the useful lives are less than previously estimated, or it will appropriately impair, technically obsolete or non-strategic assets that have been abandoned or identified for sale.
Residual values are based on current estimates of the value of these assets at the end of their useful lives.
Treatment of grants received Taking into account its nature and substance, the Organisation considers amounts that it receives from the Government and other donor organisations to fall within the scope of IAS 20 Accounting for Government Grants and Disclosure of Government Assistance. In reaching this conclusion, the Organisation considers the terms attached to each of the grants received and the current practice adopted by other parastatals in Botswana. Accordingly, the Organisation recognises the amounts received in accordance with the accounting policy as included in note 2.11.
NOTES TO THE FINANCIAL STATEMENTS [CONTINUED] for the year ended 31 March 2019
Annual Report 2018/19Annual Report 2018/19
6 0
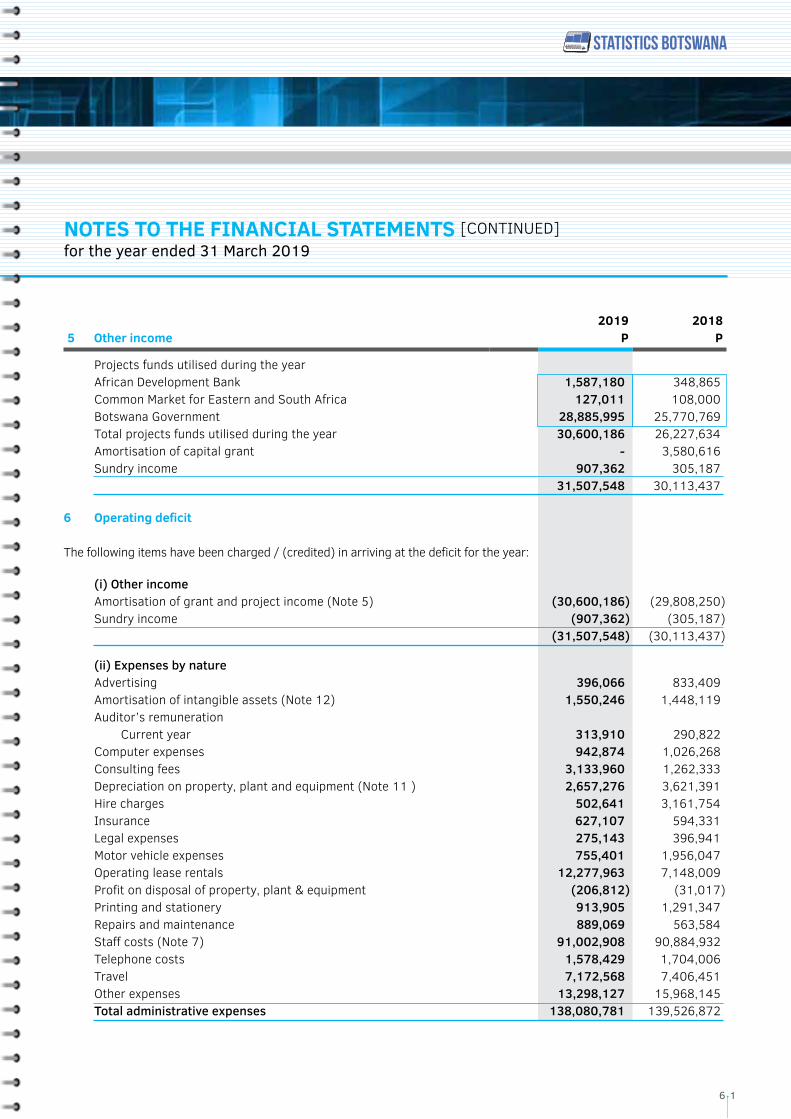
5 Other income2019
P2018
P
Projects funds utilised during the year African Development Bank 1,587,180 348,865
Common Market for Eastern and South Africa 127,011 108,000 Botswana Government 28,885,995 25,770,769 Total projects funds utilised during the year 30,600,186 26,227,634 Amortisation of capital grant - 3,580,616 Sundry income 907,362 305,187 31,507,548 30,113,437 6 Operating deficit
The following items have been charged / (credited) in arriving at the deficit for the year:
(i) Other income
Amortisation of grant and project income (Note 5) (30,600,186 ) (29,808,250 ) Sundry income (907,362 ) (305,187 ) (31,507,548 ) (30,113,437 )
(ii) Expenses by nature Advertising 396,066 833,409
Amortisation of intangible assets (Note 12) 1,550,246 1,448,119 Auditor’s remuneration
Current year 313,910 290,822 Computer expenses 942,874 1,026,268 Consulting fees 3,133,960 1,262,333 Depreciation on property, plant and equipment (Note 11 ) 2,657,276 3,621,391 Hire charges 502,641 3,161,754 Insurance 627,107 594,331 Legal expenses 275,143 396,941 Motor vehicle expenses 755,401 1,956,047 Operating lease rentals 12,277,963 7,148,009 Profit on disposal of property, plant & equipment (206,812 ) (31,017 ) Printing and stationery 913,905 1,291,347 Repairs and maintenance 889,069 563,584 Staff costs (Note 7) 91,002,908 90,884,932 Telephone costs 1,578,429 1,704,006 Travel 7,172,568 7,406,451 Other expenses 13,298,127 15,968,145 Total administrative expenses 138,080,781 139,526,872
Annual Report 2018/19
6 1
NOTES TO THE FINANCIAL STATEMENTS [CONTINUED] for the year ended 31 March 2019
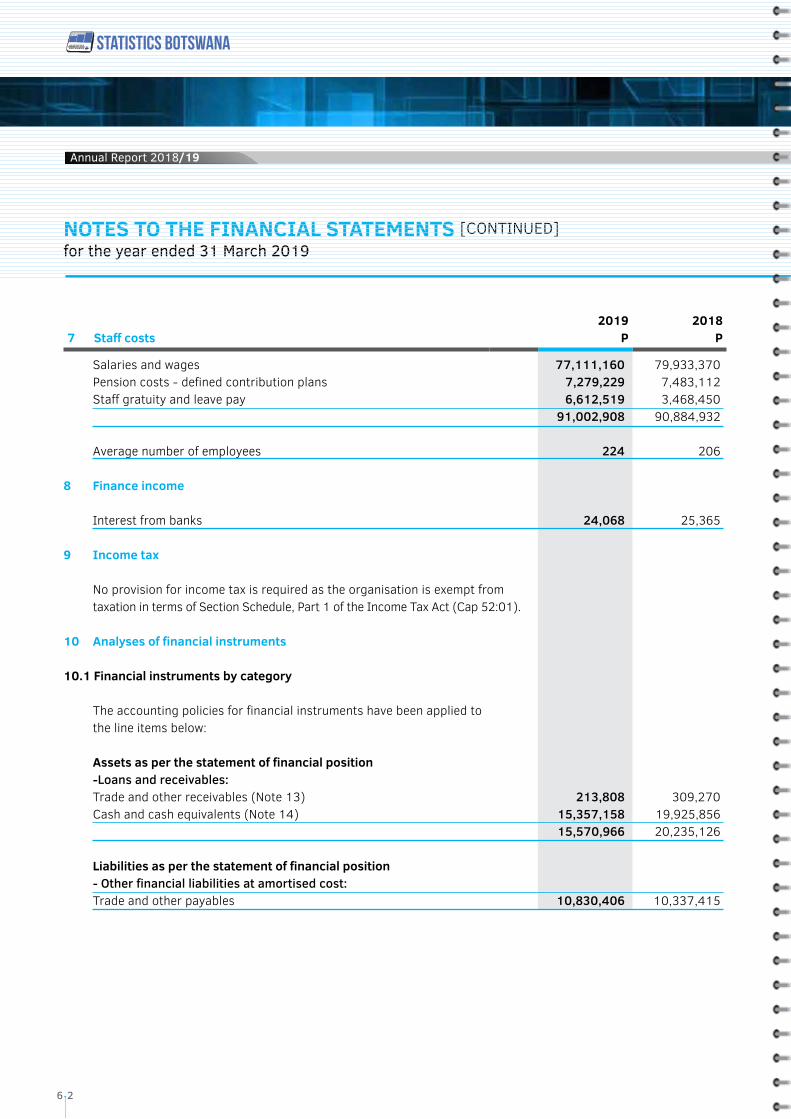
7 Staff costs2019
P2018
P
Salaries and wages 77,111,160 79,933,370 Pension costs - defined contribution plans 7,279,229 7,483,112 Staff gratuity and leave pay 6,612,519 3,468,450 91,002,908 90,884,932 Average number of employees 224 206 8 Finance income Interest from banks 24,068 25,365 9 Income tax No provision for income tax is required as the organisation is exempt from taxation in terms of Section Schedule, Part 1 of the Income Tax Act (Cap 52:01). 10 Analyses of financial instruments 10.1 Financial instruments by category The accounting policies for financial instruments have been applied to the line items below: Assets as per the statement of financial position -Loans and receivables: Trade and other receivables (Note 13) 213,808 309,270 Cash and cash equivalents (Note 14) 15,357,158 19,925,856 15,570,966 20,235,126
Liabilities as per the statement of financial position - Other financial liabilities at amortised cost: Trade and other payables 10,830,406 10,337,415
NOTES TO THE FINANCIAL STATEMENTS [CONTINUED] for the year ended 31 March 2019
Annual Report 2018/19Annual Report 2018/19
6 2
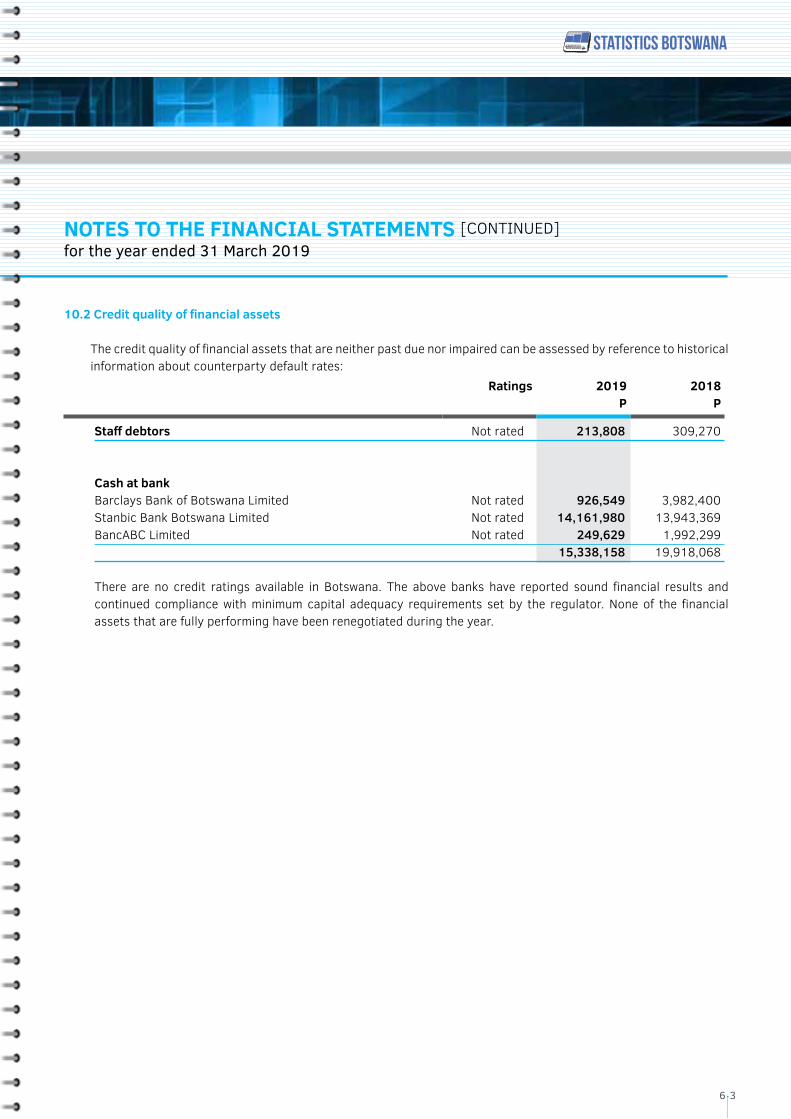
10.2 Credit quality of financial assets The credit quality of financial assets that are neither past due nor impaired can be assessed by reference to historical information about counterparty default rates:
Ratings 2019P
2018P
Staff debtors Not rated 213,808 309,270
Cash at bank Barclays Bank of Botswana Limited Not rated 926,549 3,982,400
Stanbic Bank Botswana Limited Not rated 14,161,980 13,943,369 BancABC Limited Not rated 249,629 1,992,299 15,338,158 19,918,068
There are no credit ratings available in Botswana. The above banks have reported sound financial results and
continued compliance with minimum capital adequacy requirements set by the regulator. None of the financial assets that are fully performing have been renegotiated during the year.
Annual Report 2018/19
6 3
NOTES TO THE FINANCIAL STATEMENTS [CONTINUED] for the year ended 31 March 2019
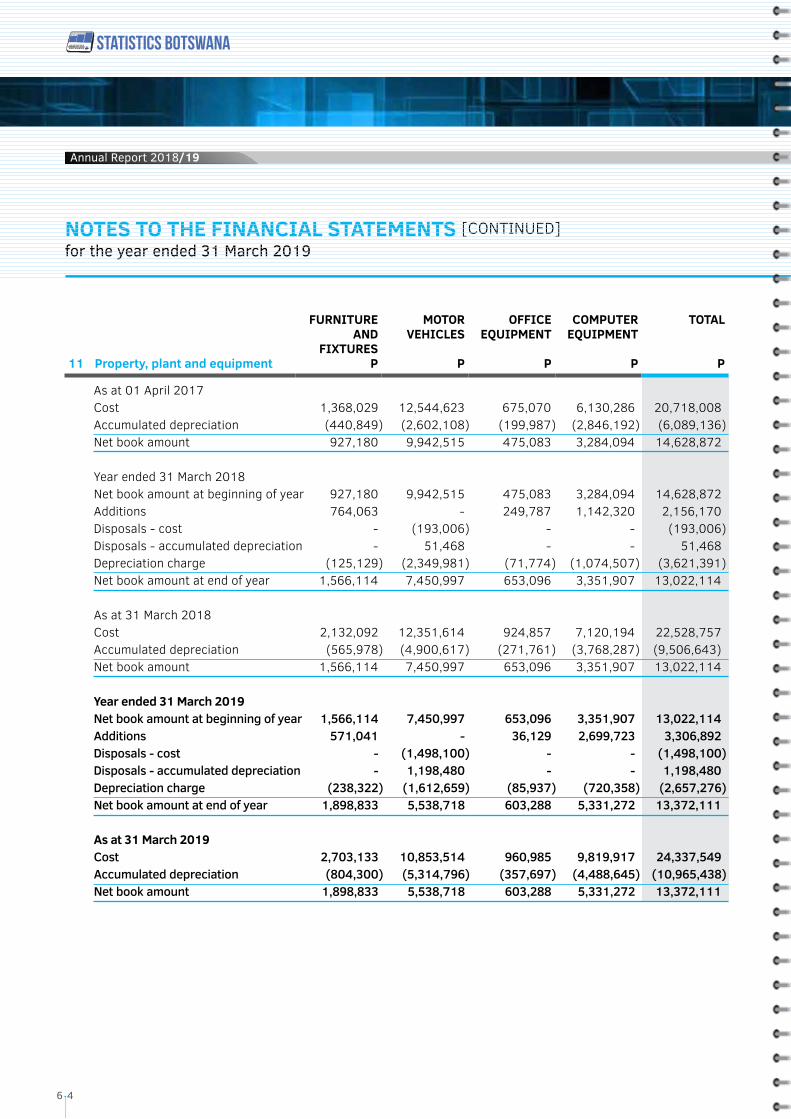
11 Property, plant and equipment
FURNITURE AND
FIXTURES P
MOTOR VEHICLES
P
OFFICE EQUIPMENT
P
COMPUTER EQUIPMENT
P
TOTAL
P
As at 01 April 2017 Cost 1,368,029 12,544,623 675,070 6,130,286 20,718,008 Accumulated depreciation (440,849 ) (2,602,108 ) (199,987 ) (2,846,192 ) (6,089,136 ) Net book amount 927,180 9,942,515 475,083 3,284,094 14,628,872 Year ended 31 March 2018 Net book amount at beginning of year 927,180 9,942,515 475,083 3,284,094 14,628,872 Additions 764,063 - 249,787 1,142,320 2,156,170 Disposals - cost - (193,006 ) - - (193,006 ) Disposals - accumulated depreciation - 51,468 - - 51,468 Depreciation charge (125,129 ) (2,349,981 ) (71,774 ) (1,074,507 ) (3,621,391 ) Net book amount at end of year 1,566,114 7,450,997 653,096 3,351,907 13,022,114 As at 31 March 2018 Cost 2,132,092 12,351,614 924,857 7,120,194 22,528,757 Accumulated depreciation (565,978 ) (4,900,617 ) (271,761 ) (3,768,287 ) (9,506,643) Net book amount 1,566,114 7,450,997 653,096 3,351,907 13,022,114 Year ended 31 March 2019 Net book amount at beginning of year 1,566,114 7,450,997 653,096 3,351,907 13,022,114 Additions 571,041 - 36,129 2,699,723 3,306,892 Disposals - cost - (1,498,100 ) - - (1,498,100 ) Disposals - accumulated depreciation - 1,198,480 - - 1,198,480 Depreciation charge (238,322 ) (1,612,659 ) (85,937 ) (720,358 ) (2,657,276 ) Net book amount at end of year 1,898,833 5,538,718 603,288 5,331,272 13,372,111 As at 31 March 2019 Cost 2,703,133 10,853,514 960,985 9,819,917 24,337,549 Accumulated depreciation (804,300 ) (5,314,796 ) (357,697 ) (4,488,645 ) (10,965,438 ) Net book amount 1,898,833 5,538,718 603,288 5,331,272 13,372,111
NOTES TO THE FINANCIAL STATEMENTS [CONTINUED] for the year ended 31 March 2019
Annual Report 2018/19Annual Report 2018/19
6 4
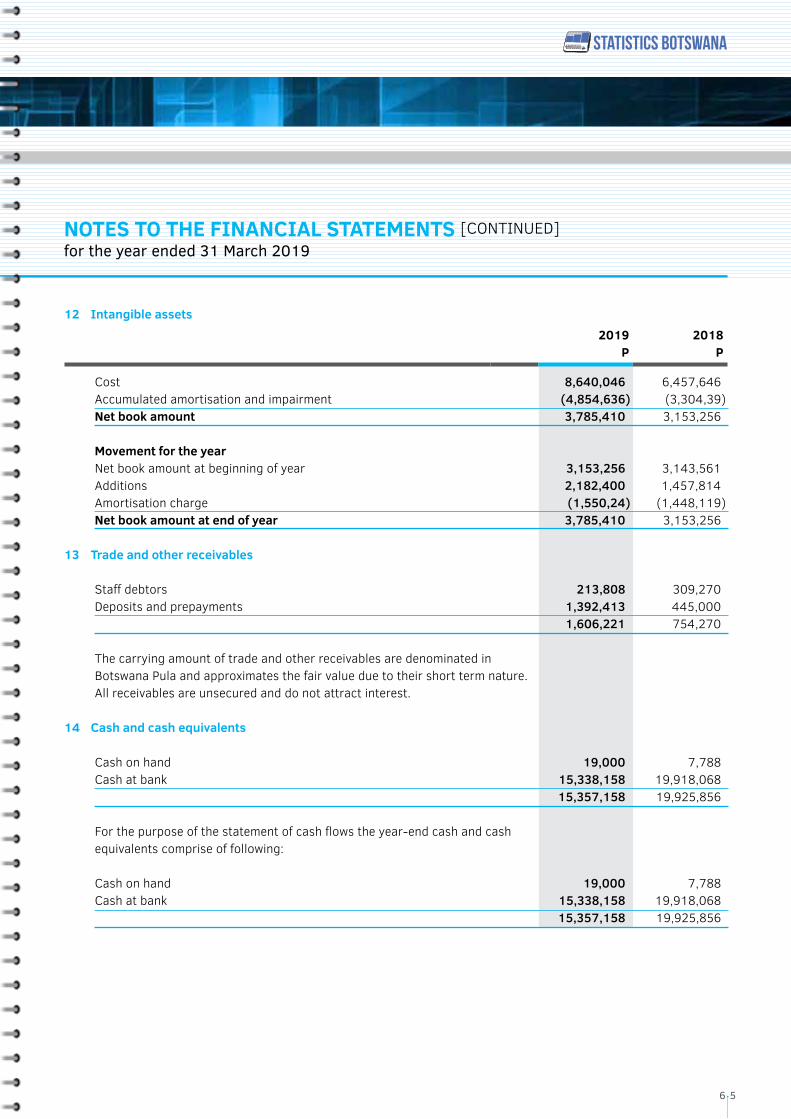
12 Intangible assets 2019
P2018
P
Cost 8,640,046 6,457,646 Accumulated amortisation and impairment (4,854,636 ) (3,304,39 ) Net book amount 3,785,410 3,153,256 Movement for the year Net book amount at beginning of year 3,153,256 3,143,561 Additions 2,182,400 1,457,814 Amortisation charge (1,550,24 ) (1,448,119 ) Net book amount at end of year 3,785,410 3,153,256 13 Trade and other receivables
Staff debtors 213,808 309,270 Deposits and prepayments 1,392,413 445,000 1,606,221 754,270 The carrying amount of trade and other receivables are denominated in Botswana Pula and approximates the fair value due to their short term nature. All receivables are unsecured and do not attract interest. 14 Cash and cash equivalents
Cash on hand 19,000 7,788 Cash at bank 15,338,158 19,918,068 15,357,158 19,925,856 For the purpose of the statement of cash flows the year-end cash and cash equivalents comprise of following: Cash on hand 19,000 7,788 Cash at bank 15,338,158 19,918,068 15,357,158 19,925,856
Annual Report 2018/19
6 5
NOTES TO THE FINANCIAL STATEMENTS [CONTINUED] for the year ended 31 March 2019
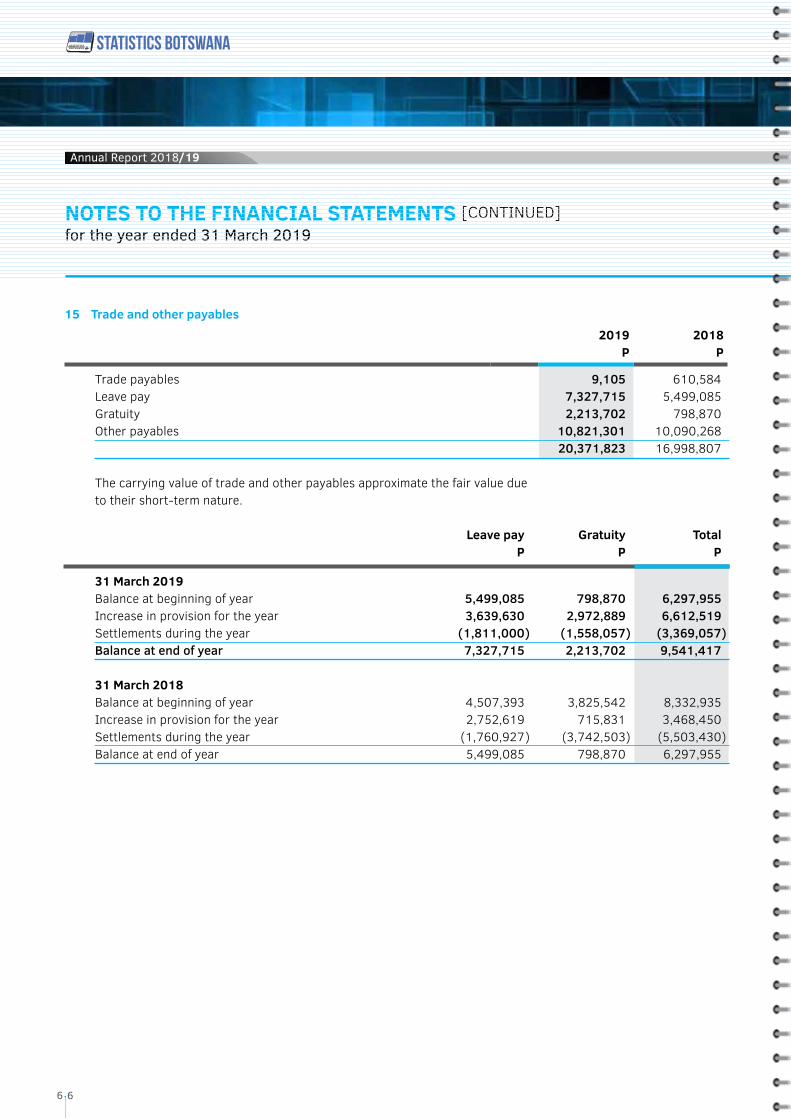
15 Trade and other payables 2019
P2018
P
Trade payables 9,105 610,584 Leave pay 7,327,715 5,499,085 Gratuity 2,213,702 798,870 Other payables 10,821,301 10,090,268 20,371,823 16,998,807 The carrying value of trade and other payables approximate the fair value due to their short-term nature. Leave pay Gratuity Total P P P 31 March 2019 Balance at beginning of year 5,499,085 798,870 6,297,955 Increase in provision for the year 3,639,630 2,972,889 6,612,519 Settlements during the year (1,811,000 ) (1,558,057 ) (3,369,057 ) Balance at end of year 7,327,715 2,213,702 9,541,417 31 March 2018 Balance at beginning of year 4,507,393 3,825,542 8,332,935 Increase in provision for the year 2,752,619 715,831 3,468,450 Settlements during the year (1,760,927 ) (3,742,503 ) (5,503,430 ) Balance at end of year 5,499,085 798,870 6,297,955
NOTES TO THE FINANCIAL STATEMENTS [CONTINUED] for the year ended 31 March 2019
Annual Report 2018/19Annual Report 2018/19
6 6
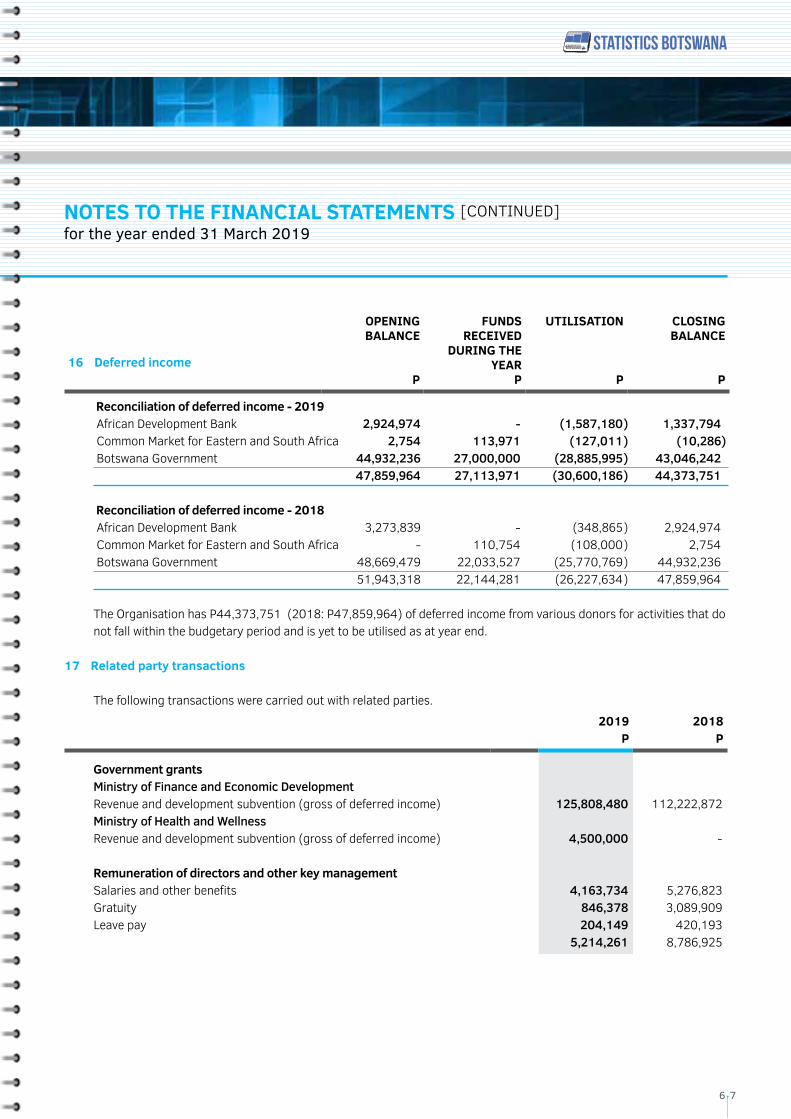
16 Deferred income
OPENING BALANCE
P
FUNDS RECEIVED
DURING THE YEAR
P
UTILISATION
P
CLOSINGBALANCE
P
Reconciliation of deferred income - 2019 African Development Bank 2,924,974 - (1,587,180 ) 1,337,794 Common Market for Eastern and South Africa 2,754 113,971 (127,011 ) (10,286 ) Botswana Government 44,932,236 27,000,000 (28,885,995 ) 43,046,242 47,859,964 27,113,971 (30,600,186 ) 44,373,751 Reconciliation of deferred income - 2018 African Development Bank 3,273,839 - (348,865 ) 2,924,974 Common Market for Eastern and South Africa - 110,754 (108,000 ) 2,754 Botswana Government 48,669,479 22,033,527 (25,770,769 ) 44,932,236 51,943,318 22,144,281 (26,227,634 ) 47,859,964 The Organisation has P44,373,751 (2018: P47,859,964) of deferred income from various donors for activities that do
not fall within the budgetary period and is yet to be utilised as at year end. 17 Related party transactions The following transactions were carried out with related parties.
2019P
2018P
Government grants
Ministry of Finance and Economic Development Revenue and development subvention (gross of deferred income) 125,808,480 112,222,872
Ministry of Health and Wellness Revenue and development subvention (gross of deferred income) 4,500,000 -
Remuneration of directors and other key management
Salaries and other benefits 4,163,734 5,276,823 Gratuity 846,378 3,089,909 Leave pay 204,149 420,193 5,214,261 8,786,925
Annual Report 2018/19
6 7
NOTES TO THE FINANCIAL STATEMENTS [CONTINUED] for the year ended 31 March 2019
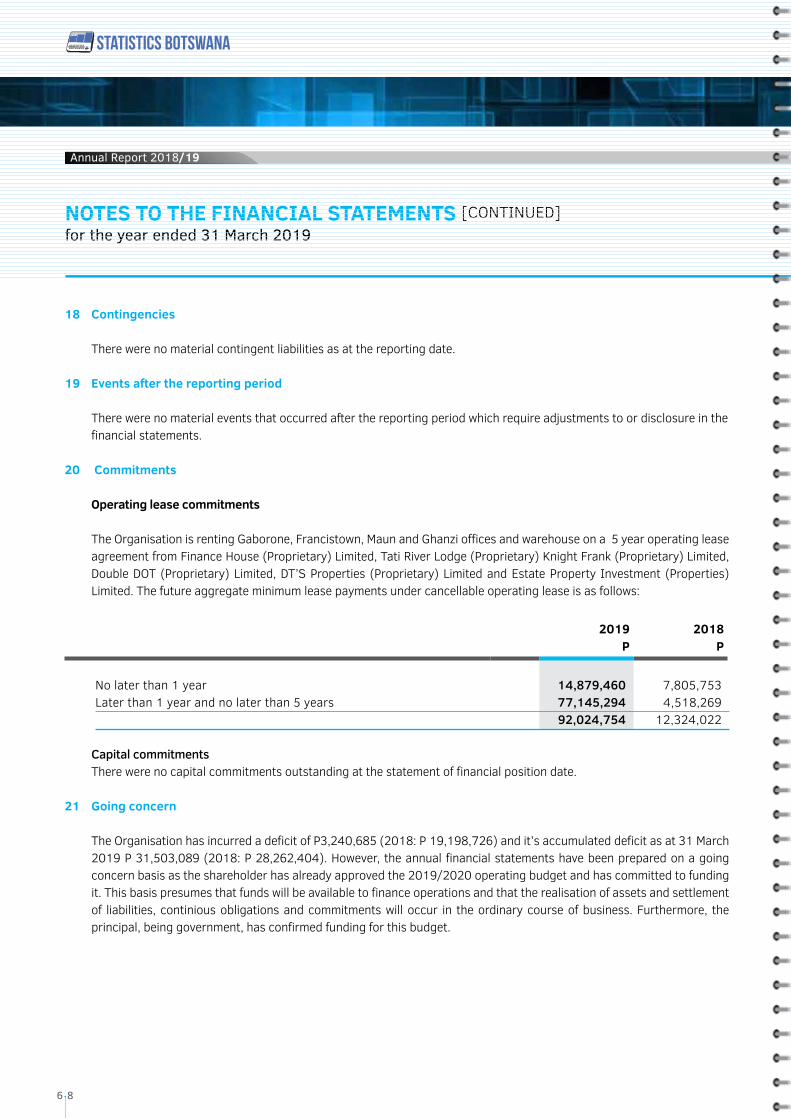
18 Contingencies There were no material contingent liabilities as at the reporting date.
19 Events after the reporting period
There were no material events that occurred after the reporting period which require adjustments to or disclosure in the financial statements.
20 Commitments
Operating lease commitments The Organisation is renting Gaborone, Francistown, Maun and Ghanzi offices and warehouse on a 5 year operating lease
agreement from Finance House (Proprietary) Limited, Tati River Lodge (Proprietary) Knight Frank (Proprietary) Limited, Double DOT (Proprietary) Limited, DT’S Properties (Proprietary) Limited and Estate Property Investment (Properties) Limited. The future aggregate minimum lease payments under cancellable operating lease is as follows:
2019P
2018P
No later than 1 year 14,879,460 7,805,753 Later than 1 year and no later than 5 years 77,145,294 4,518,269 92,024,754 12,324,022
Capital commitments There were no capital commitments outstanding at the statement of financial position date. 21 Going concern The Organisation has incurred a deficit of P3,240,685 (2018: P 19,198,726) and it’s accumulated deficit as at 31 March
2019 P 31,503,089 (2018: P 28,262,404). However, the annual financial statements have been prepared on a going concern basis as the shareholder has already approved the 2019/2020 operating budget and has committed to funding it. This basis presumes that funds will be available to finance operations and that the realisation of assets and settlement of liabilities, continious obligations and commitments will occur in the ordinary course of business. Furthermore, the principal, being government, has confirmed funding for this budget.
NOTES TO THE FINANCIAL STATEMENTS [CONTINUED] for the year ended 31 March 2019
Annual Report 2018/19Annual Report 2018/19
6 8
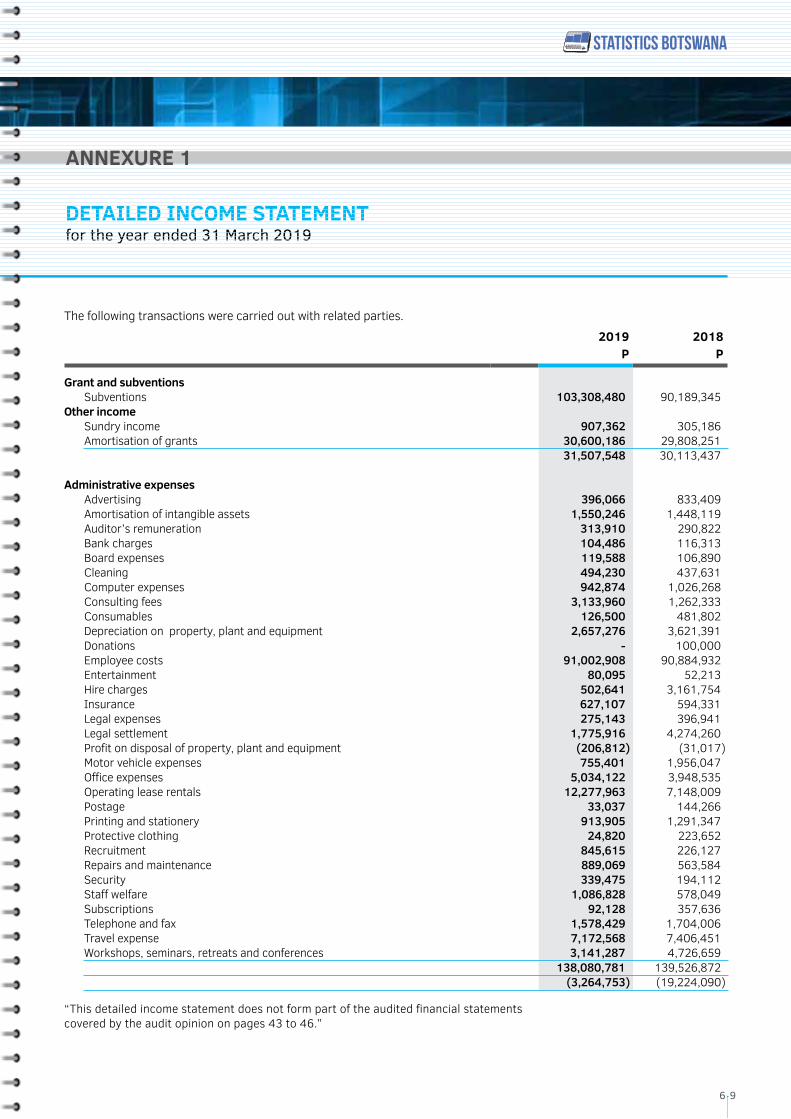
DETAILED INCOME STATEMENT for the year ended 31 March 2019
The following transactions were carried out with related parties.
2019P
2018P
Grant and subventions
Subventions 103,308,480 90,189,345 Other income
Sundry income 907,362 305,186 Amortisation of grants 30,600,186 29,808,251 31,507,548 30,113,437
Administrative expenses
Advertising 396,066 833,409 Amortisation of intangible assets 1,550,246 1,448,119 Auditor’s remuneration 313,910 290,822 Bank charges 104,486 116,313 Board expenses 119,588 106,890 Cleaning 494,230 437,631 Computer expenses 942,874 1,026,268 Consulting fees 3,133,960 1,262,333 Consumables 126,500 481,802 Depreciation on property, plant and equipment 2,657,276 3,621,391 Donations - 100,000 Employee costs 91,002,908 90,884,932 Entertainment 80,095 52,213 Hire charges 502,641 3,161,754 Insurance 627,107 594,331 Legal expenses 275,143 396,941 Legal settlement 1,775,916 4,274,260 Profit on disposal of property, plant and equipment (206,812 ) (31,017 )Motor vehicle expenses 755,401 1,956,047 Office expenses 5,034,122 3,948,535 Operating lease rentals 12,277,963 7,148,009 Postage 33,037 144,266 Printing and stationery 913,905 1,291,347 Protective clothing 24,820 223,652 Recruitment 845,615 226,127 Repairs and maintenance 889,069 563,584 Security 339,475 194,112 Staff welfare 1,086,828 578,049 Subscriptions 92,128 357,636 Telephone and fax 1,578,429 1,704,006 Travel expense 7,172,568 7,406,451 Workshops, seminars, retreats and conferences 3,141,287 4,726,659 138,080,781 139,526,872 (3,264,753 ) (19,224,090 )
“This detailed income statement does not form part of the audited financial statements covered by the audit opinion on pages 43 to 46.”
Annual Report 2018/19
6 9
ANNEXURE 1
Annual Report 2018/19
APPENDICES
APPENDIX 1: 71 SUMMARY INDICATORS
APPENDIX 2: 82STATISTICS PRODUCTION: RELEASED PUBLICATIONS
APPENDIX 3: 84SUSTAINABLE DEVELOPMENT GOALS [SDGS]
Annual Report 2018/19
7 0
Annual Report 2018/19
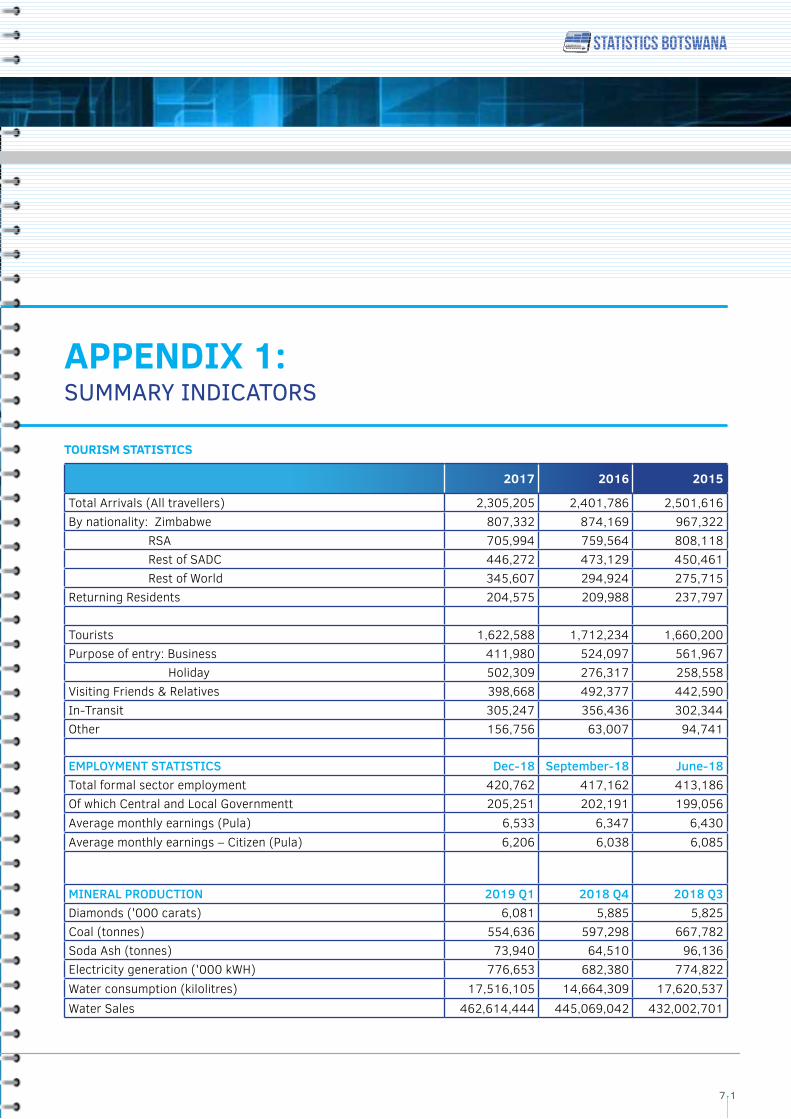
APPENDIX 1: SUMMARY INDICATORS
TOURISM STATISTICS
2017 2016 2015
Total Arrivals (All travellers) 2,305,205 2,401,786 2,501,616 By nationality: Zimbabwe 807,332 874,169 967,322 RSA 705,994 759,564 808,118 Rest of SADC 446,272 473,129 450,461 Rest of World 345,607 294,924 275,715Returning Residents 204,575 209,988 237,797
Tourists 1,622,588 1,712,234 1,660,200 Purpose of entry: Business 411,980 524,097 561,967 Holiday 502,309 276,317 258,558 Visiting Friends & Relatives 398,668 492,377 442,590 In-Transit 305,247 356,436 302,344 Other 156,756 63,007 94,741
EMPLOYMENT STATISTICS Dec-18 September-18 June-18Total formal sector employment 420,762 417,162 413,186Of which Central and Local Governmentt 205,251 202,191 199,056Average monthly earnings (Pula) 6,533 6,347 6,430Average monthly earnings – Citizen (Pula) 6,206 6,038 6,085
MINERAL PRODUCTION 2019 Q1 2018 Q4 2018 Q3Diamonds ('000 carats) 6,081 5,885 5,825Coal (tonnes) 554,636 597,298 667,782 Soda Ash (tonnes) 73,940 64,510 96,136 Electricity generation ('000 kWH) 776,653 682,380 774,822 Water consumption (kilolitres) 17,516,105 14,664,309 17,620,537 Water Sales 462,614,444 445,069,042 432,002,701
7 1
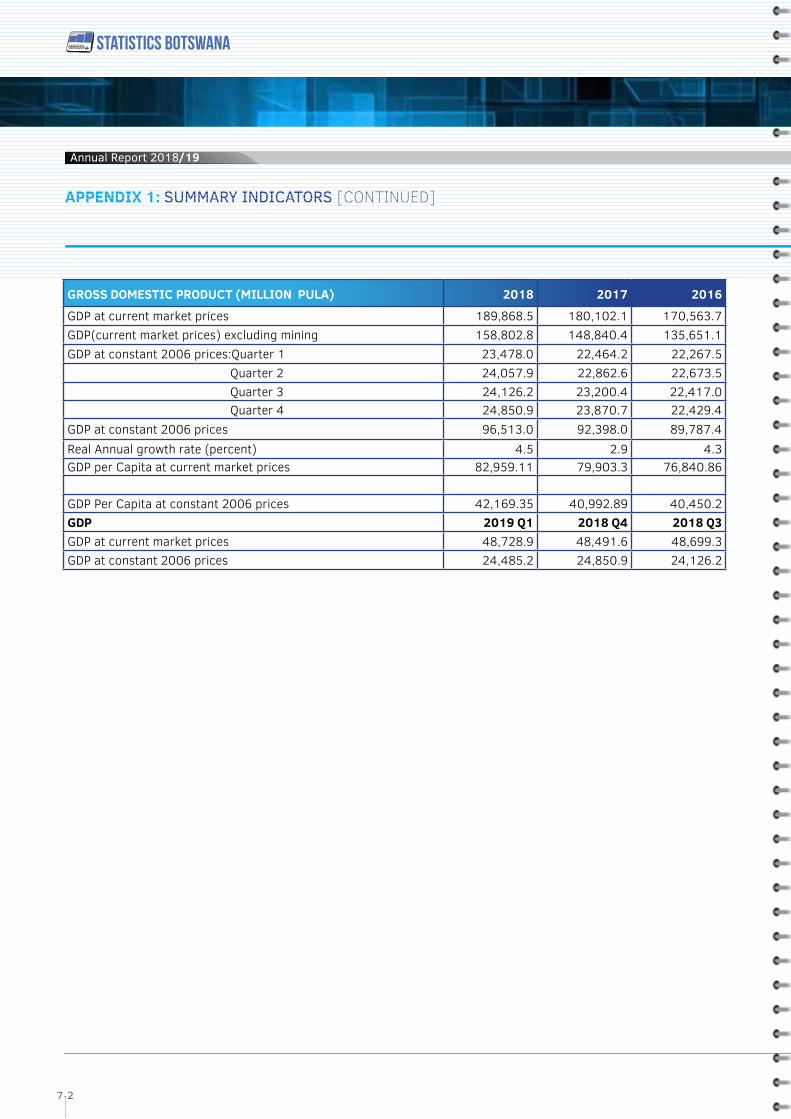
Annual Report 2018/19
GROSS DOMESTIC PRODUCT (MILLION PULA) 2018 2017 2016
GDP at current market prices 189,868.5 180,102.1 170,563.7GDP(current market prices) excluding mining 158,802.8 148,840.4 135,651.1GDP at constant 2006 prices:Quarter 1 23,478.0 22,464.2 22,267.5 Quarter 2 24,057.9 22,862.6 22,673.5 Quarter 3 24,126.2 23,200.4 22,417.0 Quarter 4 24,850.9 23,870.7 22,429.4GDP at constant 2006 prices 96,513.0 92,398.0 89,787.4Real Annual growth rate (percent) 4.5 2.9 4.3GDP per Capita at current market prices 82,959.11 79,903.3 76,840.86
GDP Per Capita at constant 2006 prices 42,169.35 40,992.89 40,450.2GDP 2019 Q1 2018 Q4 2018 Q3GDP at current market prices 48,728.9 48,491.6 48,699.3 GDP at constant 2006 prices 24,485.2 24,850.9 24,126.2
APPENDIX 1: SUMMARY INDICATORS [CONTINUED]
Annual Report 2018/19Annual Report 2018/19
7 2
Annual Report 2018/19
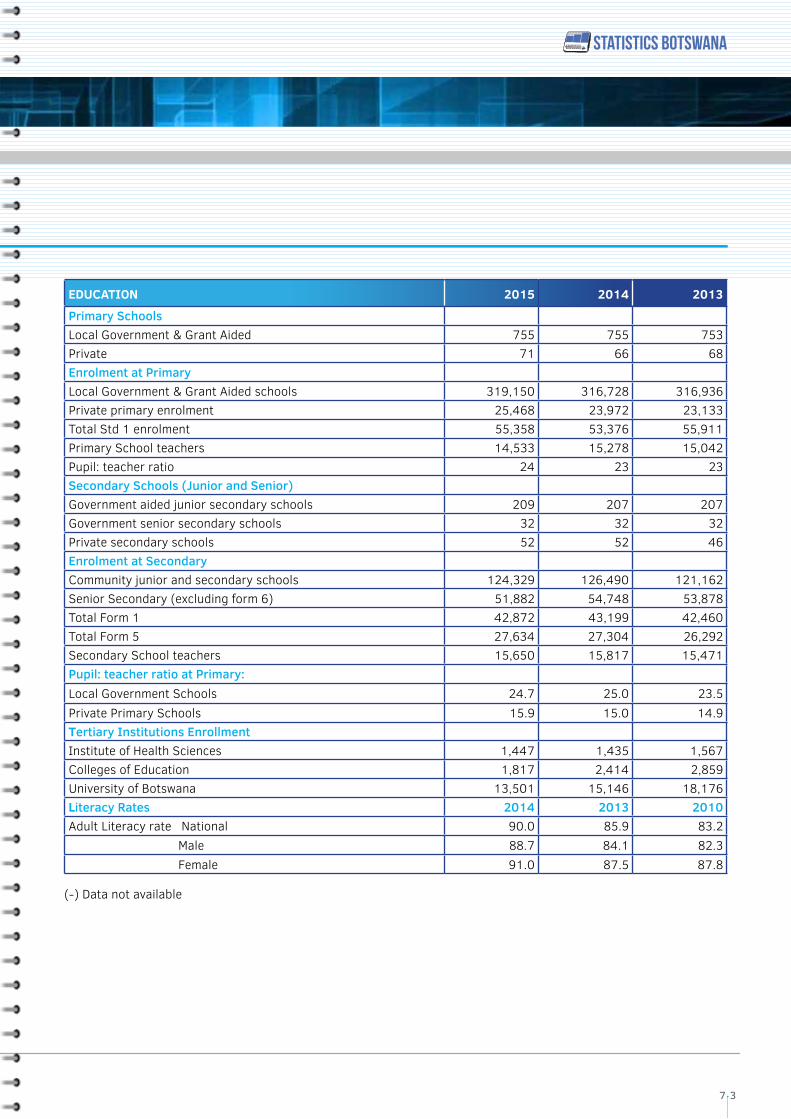
EDUCATION 2015 2014 2013
Primary SchoolsLocal Government & Grant Aided 755 755 753Private 71 66 68Enrolment at Primary Local Government & Grant Aided schools 319,150 316,728 316,936Private primary enrolment 25,468 23,972 23,133Total Std 1 enrolment 55,358 53,376 55,911Primary School teachers 14,533 15,278 15,042Pupil: teacher ratio 24 23 23Secondary Schools (Junior and Senior) Government aided junior secondary schools 209 207 207Government senior secondary schools 32 32 32Private secondary schools 52 52 46Enrolment at SecondaryCommunity junior and secondary schools 124,329 126,490 121,162Senior Secondary (excluding form 6) 51,882 54,748 53,878Total Form 1 42,872 43,199 42,460Total Form 5 27,634 27,304 26,292Secondary School teachers 15,650 15,817 15,471Pupil: teacher ratio at Primary: Local Government Schools 24.7 25.0 23.5Private Primary Schools 15.9 15.0 14.9Tertiary Institutions EnrollmentInstitute of Health Sciences 1,447 1,435 1,567Colleges of Education 1,817 2,414 2,859University of Botswana 13,501 15,146 18,176Literacy Rates 2014 2013 2010Adult Literacy rate National 90.0 85.9 83.2 Male 88.7 84.1 82.3 Female 91.0 87.5 87.8
(-) Data not available
Annual Report 2018/19
7 3
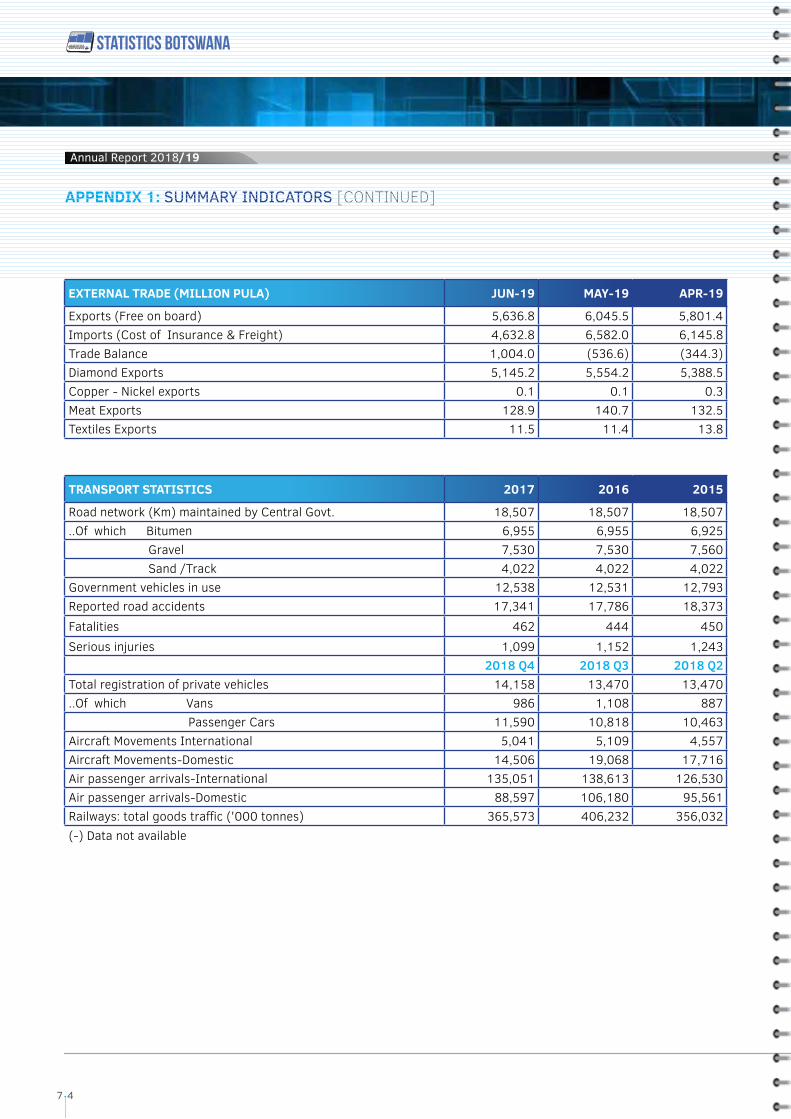
EXTERNAL TRADE (MILLION PULA) JUN-19 MAY-19 APR-19
Exports (Free on board) 5,636.8 6,045.5 5,801.4 Imports (Cost of Insurance & Freight) 4,632.8 6,582.0 6,145.8 Trade Balance 1,004.0 (536.6) (344.3)Diamond Exports 5,145.2 5,554.2 5,388.5 Copper - Nickel exports 0.1 0.1 0.3 Meat Exports 128.9 140.7 132.5 Textiles Exports 11.5 11.4 13.8
TRANSPORT STATISTICS 2017 2016 2015
Road network (Km) maintained by Central Govt. 18,507 18,507 18,507 ..Of which Bitumen 6,955 6,955 6,925 Gravel 7,530 7,530 7,560 Sand /Track 4,022 4,022 4,022 Government vehicles in use 12,538 12,531 12,793 Reported road accidents 17,341 17,786 18,373 Fatalities 462 444 450Serious injuries 1,099 1,152 1,243
2018 Q4 2018 Q3 2018 Q2Total registration of private vehicles 14,158 13,470 13,470..Of which Vans 986 1,108 887 Passenger Cars 11,590 10,818 10,463Aircraft Movements International 5,041 5,109 4,557Aircraft Movements-Domestic 14,506 19,068 17,716Air passenger arrivals-International 135,051 138,613 126,530Air passenger arrivals-Domestic 88,597 106,180 95,561Railways: total goods traffic ('000 tonnes) 365,573 406,232 356,032(-) Data not available
APPENDIX 1: SUMMARY INDICATORS [CONTINUED]
Annual Report 2018/19Annual Report 2018/19
7 4
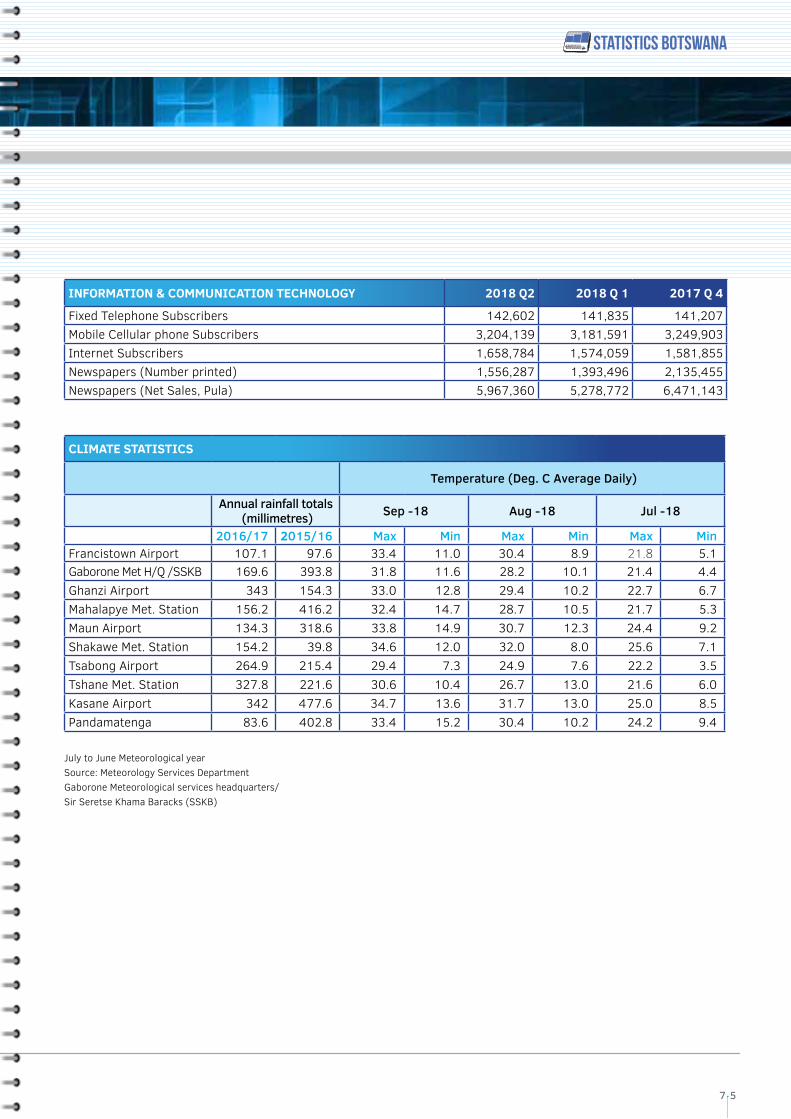
INFORMATION & COMMUNICATION TECHNOLOGY 2018 Q2 2018 Q 1 2017 Q 4
Fixed Telephone Subscribers 142,602 141,835 141,207Mobile Cellular phone Subscribers 3,204,139 3,181,591 3,249,903Internet Subscribers 1,658,784 1,574,059 1,581,855Newspapers (Number printed) 1,556,287 1,393,496 2,135,455Newspapers (Net Sales, Pula) 5,967,360 5,278,772 6,471,143
CLIMATE STATISTICS
Temperature (Deg. C Average Daily)
Annual rainfall totals (millimetres) Sep -18 Aug -18 Jul -18
2016/17 2015/16 Max Min Max Min Max MinFrancistown Airport 107.1 97.6 33.4 11.0 30.4 8.9 21.8 5.1Gaborone Met H/Q /SSKB 169.6 393.8 31.8 11.6 28.2 10.1 21.4 4.4Ghanzi Airport 343 154.3 33.0 12.8 29.4 10.2 22.7 6.7Mahalapye Met. Station 156.2 416.2 32.4 14.7 28.7 10.5 21.7 5.3Maun Airport 134.3 318.6 33.8 14.9 30.7 12.3 24.4 9.2Shakawe Met. Station 154.2 39.8 34.6 12.0 32.0 8.0 25.6 7.1Tsabong Airport 264.9 215.4 29.4 7.3 24.9 7.6 22.2 3.5Tshane Met. Station 327.8 221.6 30.6 10.4 26.7 13.0 21.6 6.0Kasane Airport 342 477.6 34.7 13.6 31.7 13.0 25.0 8.5Pandamatenga 83.6 402.8 33.4 15.2 30.4 10.2 24.2 9.4
July to June Meteorological yearSource: Meteorology Services DepartmentGaborone Meteorological services headquarters/Sir Seretse Khama Baracks (SSKB)
Annual Report 2018/19
7 5
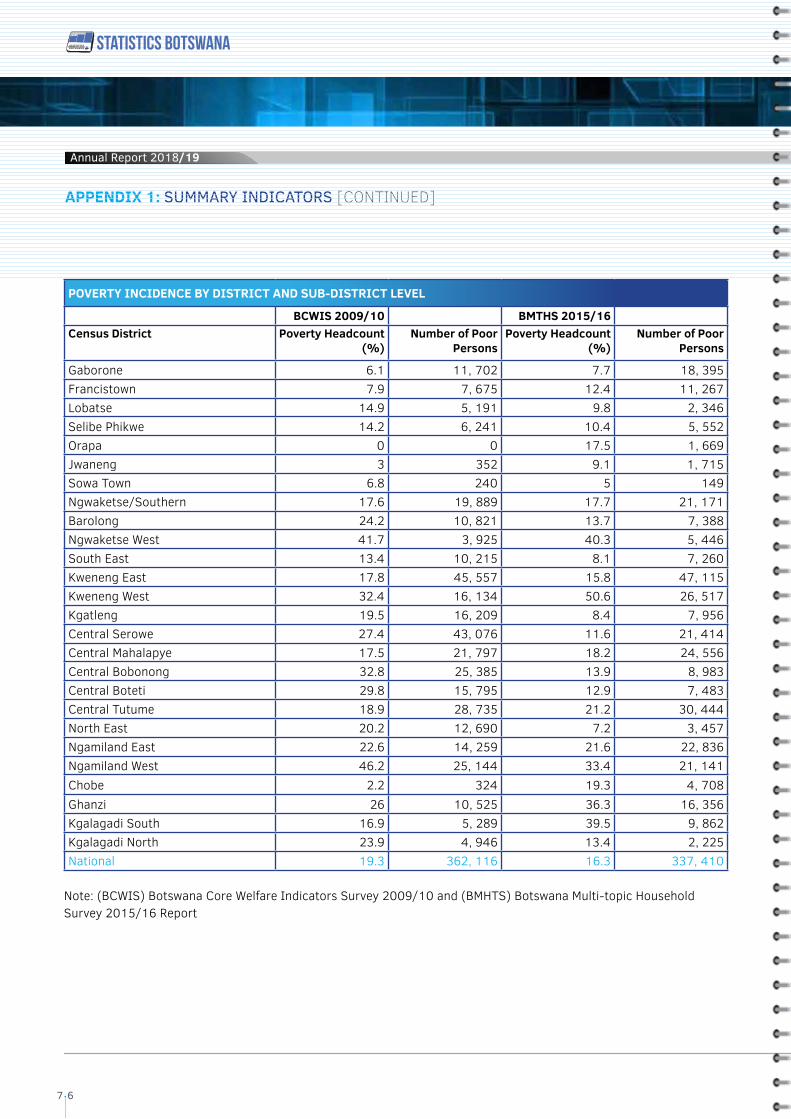
POVERTY INCIDENCE BY DISTRICT AND SUB-DISTRICT LEVEL
BCWIS 2009/10 BMTHS 2015/16Census District Poverty Headcount
(%)Number of Poor
PersonsPoverty Headcount
(%)Number of Poor
Persons
Gaborone 6.1 11, 702 7.7 18, 395Francistown 7.9 7, 675 12.4 11, 267Lobatse 14.9 5, 191 9.8 2, 346Selibe Phikwe 14.2 6, 241 10.4 5, 552Orapa 0 0 17.5 1, 669Jwaneng 3 352 9.1 1, 715Sowa Town 6.8 240 5 149Ngwaketse/Southern 17.6 19, 889 17.7 21, 171Barolong 24.2 10, 821 13.7 7, 388Ngwaketse West 41.7 3, 925 40.3 5, 446South East 13.4 10, 215 8.1 7, 260Kweneng East 17.8 45, 557 15.8 47, 115Kweneng West 32.4 16, 134 50.6 26, 517Kgatleng 19.5 16, 209 8.4 7, 956Central Serowe 27.4 43, 076 11.6 21, 414Central Mahalapye 17.5 21, 797 18.2 24, 556Central Bobonong 32.8 25, 385 13.9 8, 983Central Boteti 29.8 15, 795 12.9 7, 483Central Tutume 18.9 28, 735 21.2 30, 444North East 20.2 12, 690 7.2 3, 457Ngamiland East 22.6 14, 259 21.6 22, 836Ngamiland West 46.2 25, 144 33.4 21, 141Chobe 2.2 324 19.3 4, 708Ghanzi 26 10, 525 36.3 16, 356Kgalagadi South 16.9 5, 289 39.5 9, 862Kgalagadi North 23.9 4, 946 13.4 2, 225National 19.3 362, 116 16.3 337, 410
Note: (BCWIS) Botswana Core Welfare Indicators Survey 2009/10 and (BMHTS) Botswana Multi-topic Household Survey 2015/16 Report
APPENDIX 1: SUMMARY INDICATORS [CONTINUED]
Annual Report 2018/19Annual Report 2018/19
7 6
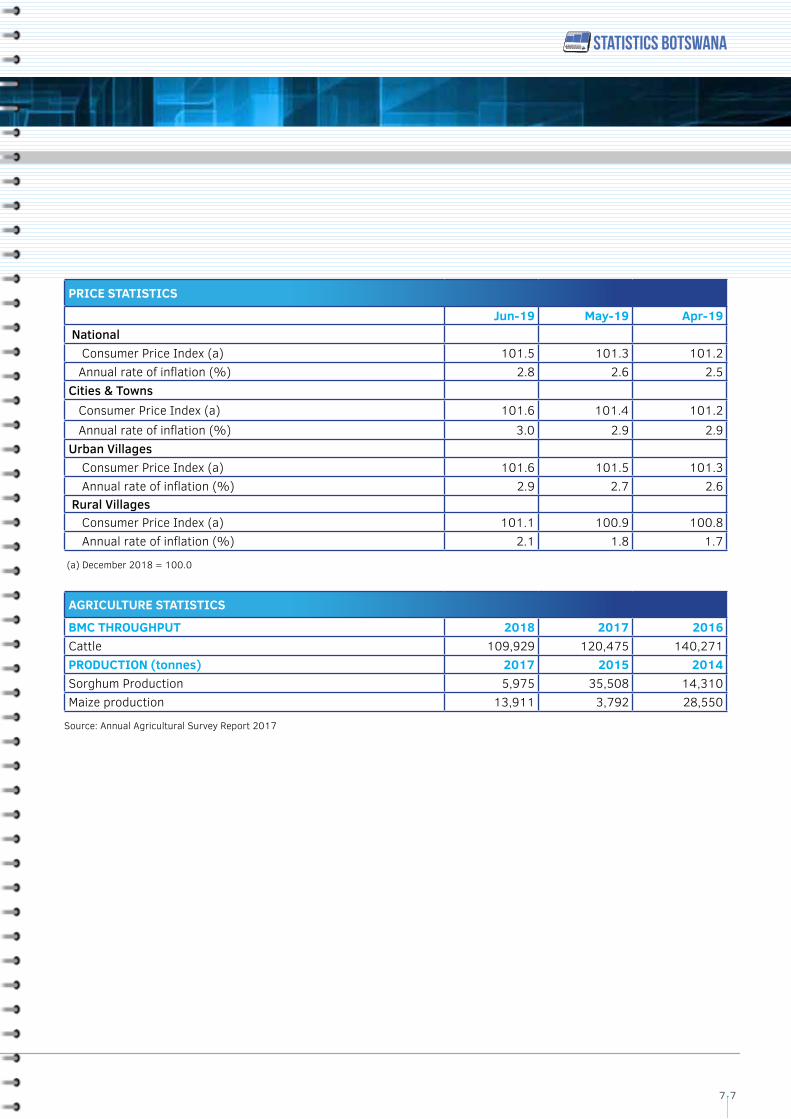
PRICE STATISTICS
Jun-19 May-19 Apr-19 National Consumer Price Index (a) 101.5 101.3 101.2 Annual rate of inflation (%) 2.8 2.6 2.5 Cities & Towns Consumer Price Index (a) 101.6 101.4 101.2 Annual rate of inflation (%) 3.0 2.9 2.9 Urban Villages Consumer Price Index (a) 101.6 101.5 101.3 Annual rate of inflation (%) 2.9 2.7 2.6 Rural Villages Consumer Price Index (a) 101.1 100.9 100.8 Annual rate of inflation (%) 2.1 1.8 1.7
(a) December 2018 = 100.0
AGRICULTURE STATISTICS
BMC THROUGHPUT 2018 2017 2016Cattle 109,929 120,475 140,271PRODUCTION (tonnes) 2017 2015 2014Sorghum Production 5,975 35,508 14,310Maize production 13,911 3,792 28,550
Source: Annual Agricultural Survey Report 2017
Annual Report 2018/19
7 7
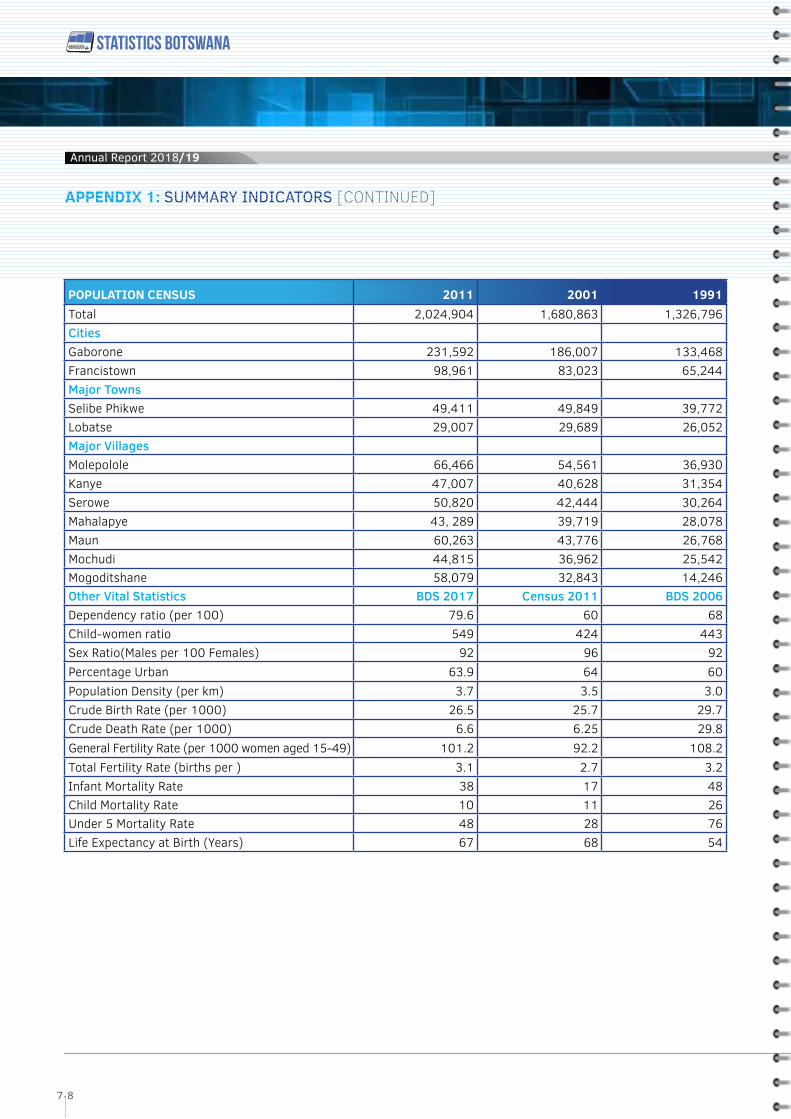
POPULATION CENSUS 2011 2001 1991Total 2,024,904 1,680,863 1,326,796CitiesGaborone 231,592 186,007 133,468Francistown 98,961 83,023 65,244Major TownsSelibe Phikwe 49,411 49,849 39,772Lobatse 29,007 29,689 26,052Major VillagesMolepolole 66,466 54,561 36,930Kanye 47,007 40,628 31,354Serowe 50,820 42,444 30,264Mahalapye 43, 289 39,719 28,078Maun 60,263 43,776 26,768Mochudi 44,815 36,962 25,542Mogoditshane 58,079 32,843 14,246Other Vital Statistics BDS 2017 Census 2011 BDS 2006Dependency ratio (per 100) 79.6 60 68Child-women ratio 549 424 443Sex Ratio(Males per 100 Females) 92 96 92Percentage Urban 63.9 64 60Population Density (per km) 3.7 3.5 3.0Crude Birth Rate (per 1000) 26.5 25.7 29.7Crude Death Rate (per 1000) 6.6 6.25 29.8General Fertility Rate (per 1000 women aged 15-49) 101.2 92.2 108.2Total Fertility Rate (births per ) 3.1 2.7 3.2 Infant Mortality Rate 38 17 48Child Mortality Rate 10 11 26Under 5 Mortality Rate 48 28 76Life Expectancy at Birth (Years) 67 68 54
APPENDIX 1: SUMMARY INDICATORS [CONTINUED]
Annual Report 2018/19Annual Report 2018/19
7 8
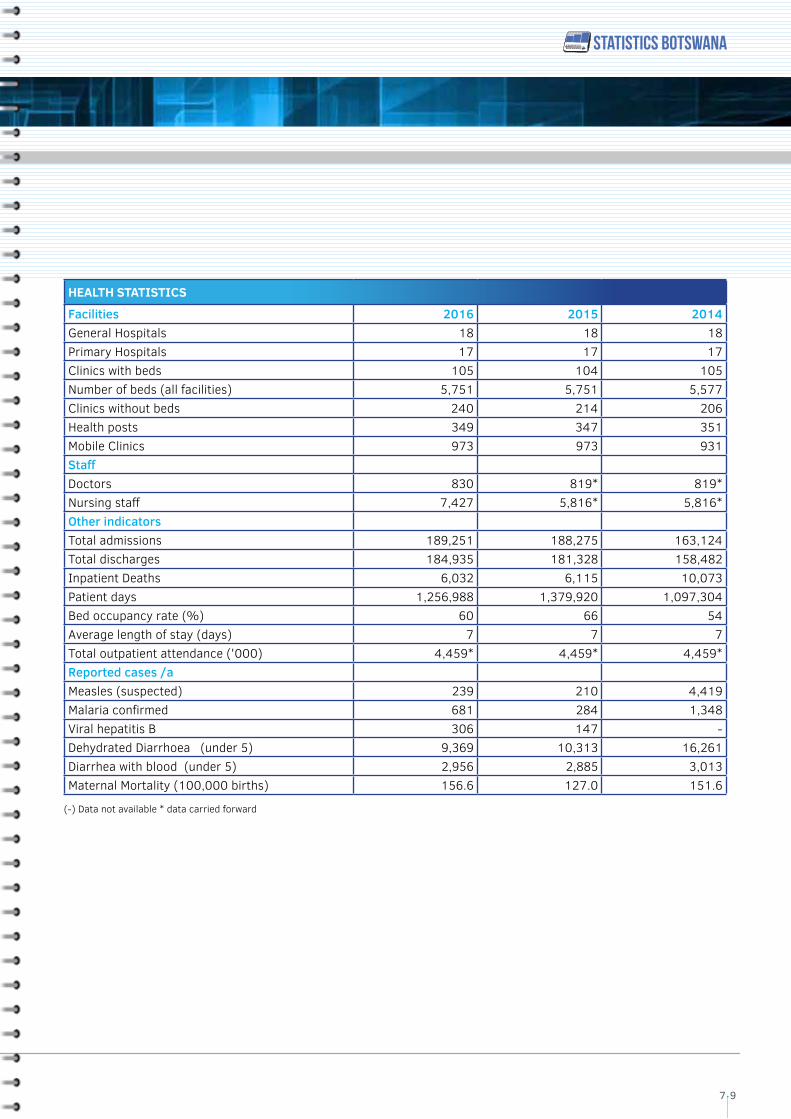
HEALTH STATISTICS
Facilities 2016 2015 2014General Hospitals 18 18 18Primary Hospitals 17 17 17Clinics with beds 105 104 105Number of beds (all facilities) 5,751 5,751 5,577Clinics without beds 240 214 206Health posts 349 347 351Mobile Clinics 973 973 931StaffDoctors 830 819* 819*Nursing staff 7,427 5,816* 5,816*Other indicatorsTotal admissions 189,251 188,275 163,124Total discharges 184,935 181,328 158,482Inpatient Deaths 6,032 6,115 10,073Patient days 1,256,988 1,379,920 1,097,304Bed occupancy rate (%) 60 66 54Average length of stay (days) 7 7 7Total outpatient attendance ('000) 4,459* 4,459* 4,459*Reported cases /a Measles (suspected) 239 210 4,419Malaria confirmed 681 284 1,348Viral hepatitis B 306 147 -Dehydrated Diarrhoea (under 5) 9,369 10,313 16,261Diarrhea with blood (under 5) 2,956 2,885 3,013Maternal Mortality (100,000 births) 156.6 127.0 151.6
(-) Data not available * data carried forward
Annual Report 2018/19
7 9
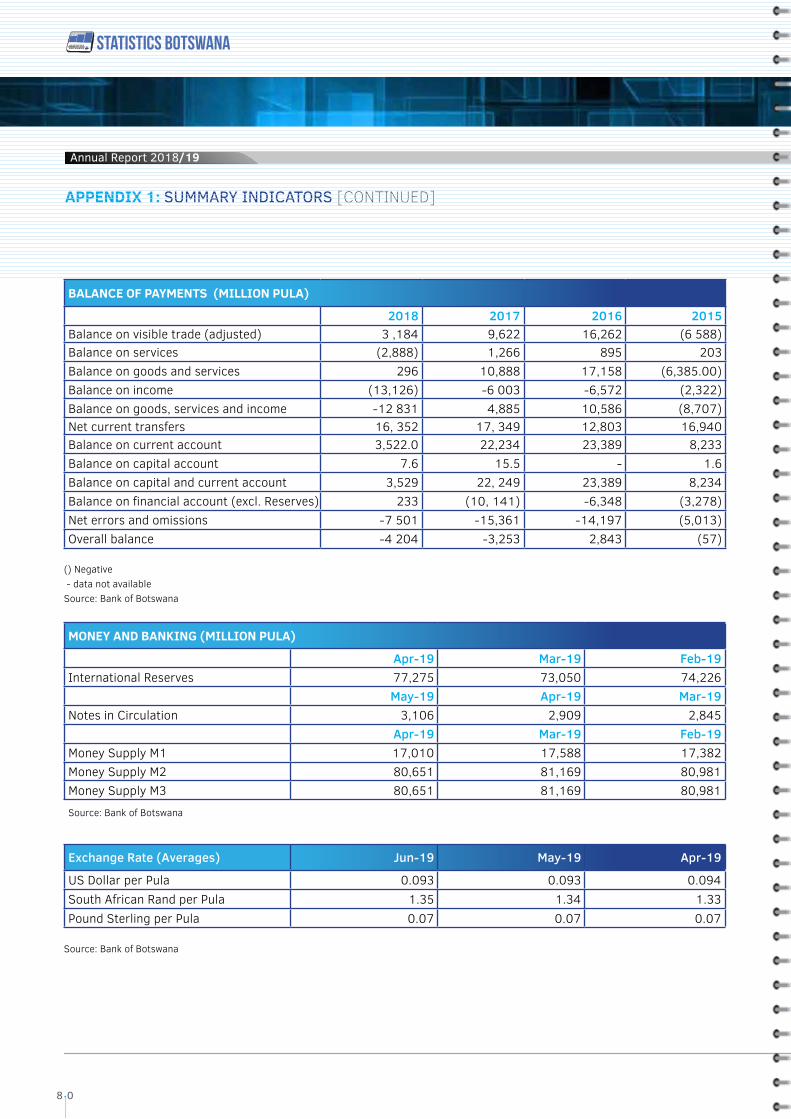
BALANCE OF PAYMENTS (MILLION PULA)
2018 2017 2016 2015Balance on visible trade (adjusted) 3 ,184 9,622 16,262 (6 588) Balance on services (2,888) 1,266 895 203 Balance on goods and services 296 10,888 17,158 (6,385.00)Balance on income (13,126) -6 003 -6,572 (2,322)Balance on goods, services and income -12 831 4,885 10,586 (8,707)Net current transfers 16, 352 17, 349 12,803 16,940 Balance on current account 3,522.0 22,234 23,389 8,233 Balance on capital account 7.6 15.5 - 1.6 Balance on capital and current account 3,529 22, 249 23,389 8,234 Balance on financial account (excl. Reserves) 233 (10, 141) -6,348 (3,278)Net errors and omissions -7 501 -15,361 -14,197 (5,013)Overall balance -4 204 -3,253 2,843 (57)
() Negative - data not availableSource: Bank of Botswana
MONEY AND BANKING (MILLION PULA)
Apr-19 Mar-19 Feb-19International Reserves 77,275 73,050 74,226
May-19 Apr-19 Mar-19Notes in Circulation 3,106 2,909 2,845
Apr-19 Mar-19 Feb-19Money Supply M1 17,010 17,588 17,382 Money Supply M2 80,651 81,169 80,981 Money Supply M3 80,651 81,169 80,981
Source: Bank of Botswana
Exchange Rate (Averages) Jun-19 May-19 Apr-19
US Dollar per Pula 0.093 0.093 0.094South African Rand per Pula 1.35 1.34 1.33 Pound Sterling per Pula 0.07 0.07 0.07
Source: Bank of Botswana
APPENDIX 1: SUMMARY INDICATORS [CONTINUED]
Annual Report 2018/19Annual Report 2018/19
8 0
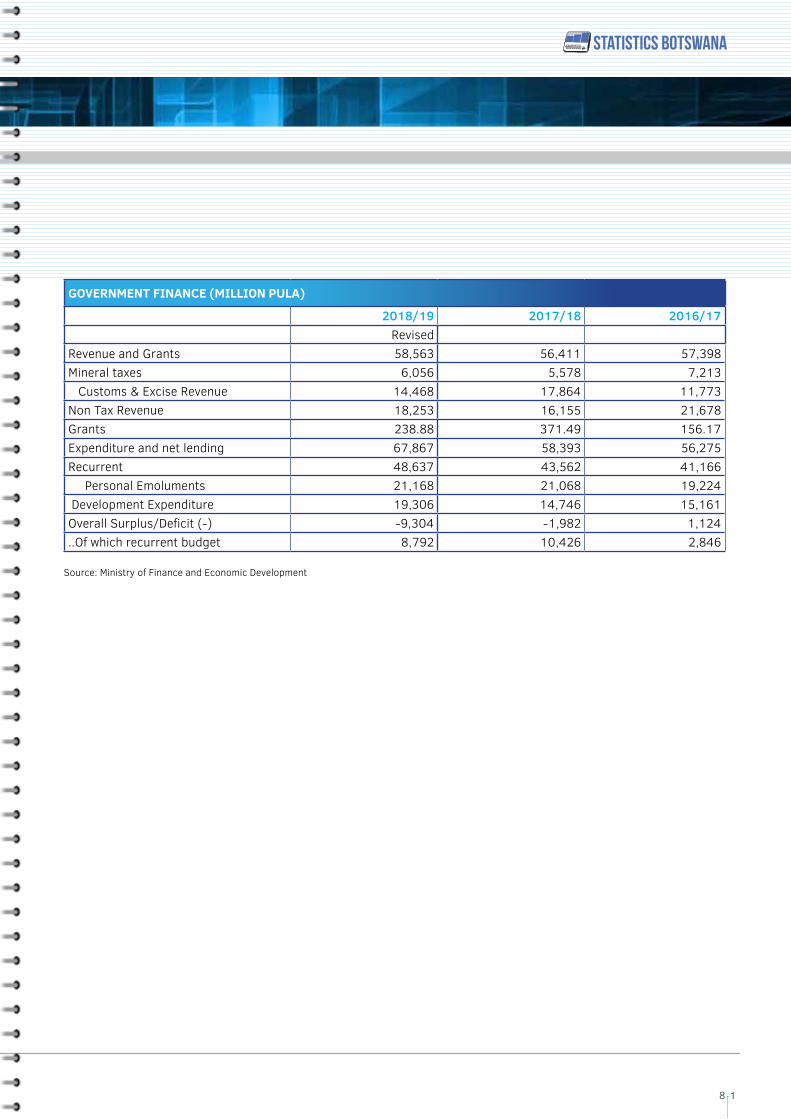
GOVERNMENT FINANCE (MILLION PULA)
2018/19 2017/18 2016/17Revised
Revenue and Grants 58,563 56,411 57,398Mineral taxes 6,056 5,578 7,213 Customs & Excise Revenue 14,468 17,864 11,773Non Tax Revenue 18,253 16,155 21,678Grants 238.88 371.49 156.17Expenditure and net lending 67,867 58,393 56,275Recurrent 48,637 43,562 41,166 Personal Emoluments 21,168 21,068 19,224 Development Expenditure 19,306 14,746 15,161Overall Surplus/Deficit (-) -9,304 -1,982 1,124..Of which recurrent budget 8,792 10,426 2,846
Source: Ministry of Finance and Economic Development
Annual Report 2018/19
8 1
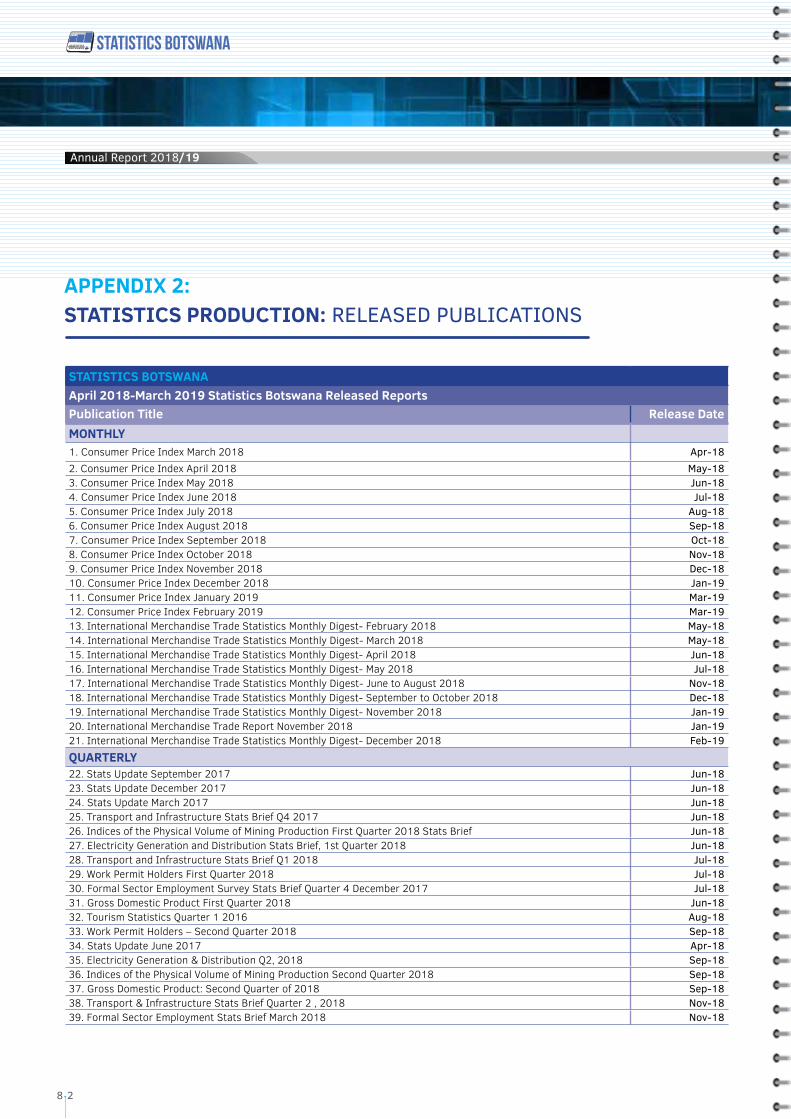
STATISTICS BOTSWANAApril 2018-March 2019 Statistics Botswana Released ReportsPublication Title Release DateMONTHLY1. Consumer Price Index March 2018 Apr-182. Consumer Price Index April 2018 May-183. Consumer Price Index May 2018 Jun-184. Consumer Price Index June 2018 Jul-185. Consumer Price Index July 2018 Aug-186. Consumer Price Index August 2018 Sep-187. Consumer Price Index September 2018 Oct-188. Consumer Price Index October 2018 Nov-189. Consumer Price Index November 2018 Dec-1810. Consumer Price Index December 2018 Jan-1911. Consumer Price Index January 2019 Mar-1912. Consumer Price Index February 2019 Mar-1913. International Merchandise Trade Statistics Monthly Digest- February 2018 May-1814. International Merchandise Trade Statistics Monthly Digest- March 2018 May-1815. International Merchandise Trade Statistics Monthly Digest- April 2018 Jun-1816. International Merchandise Trade Statistics Monthly Digest- May 2018 Jul-1817. International Merchandise Trade Statistics Monthly Digest- June to August 2018 Nov-1818. International Merchandise Trade Statistics Monthly Digest- September to October 2018 Dec-1819. International Merchandise Trade Statistics Monthly Digest- November 2018 Jan-1920. International Merchandise Trade Report November 2018 Jan-1921. International Merchandise Trade Statistics Monthly Digest- December 2018 Feb-19QUARTERLY22. Stats Update September 2017 Jun-1823. Stats Update December 2017 Jun-1824. Stats Update March 2017 Jun-1825. Transport and Infrastructure Stats Brief Q4 2017 Jun-1826. Indices of the Physical Volume of Mining Production First Quarter 2018 Stats Brief Jun-1827. Electricity Generation and Distribution Stats Brief, 1st Quarter 2018 Jun-1828. Transport and Infrastructure Stats Brief Q1 2018 Jul-1829. Work Permit Holders First Quarter 2018 Jul-1830. Formal Sector Employment Survey Stats Brief Quarter 4 December 2017 Jul-1831. Gross Domestic Product First Quarter 2018 Jun-1832. Tourism Statistics Quarter 1 2016 Aug-1833. Work Permit Holders – Second Quarter 2018 Sep-1834. Stats Update June 2017 Apr-1835. Electricity Generation & Distribution Q2, 2018 Sep-1836. Indices of the Physical Volume of Mining Production Second Quarter 2018 Sep-1837. Gross Domestic Product: Second Quarter of 2018 Sep-1838. Transport & Infrastructure Stats Brief Quarter 2 , 2018 Nov-1839. Formal Sector Employment Stats Brief March 2018 Nov-18
APPENDIX 2: STATISTICS PRODUCTION: RELEASED PUBLICATIONS
Annual Report 2018/19Annual Report 2018/19
8 2
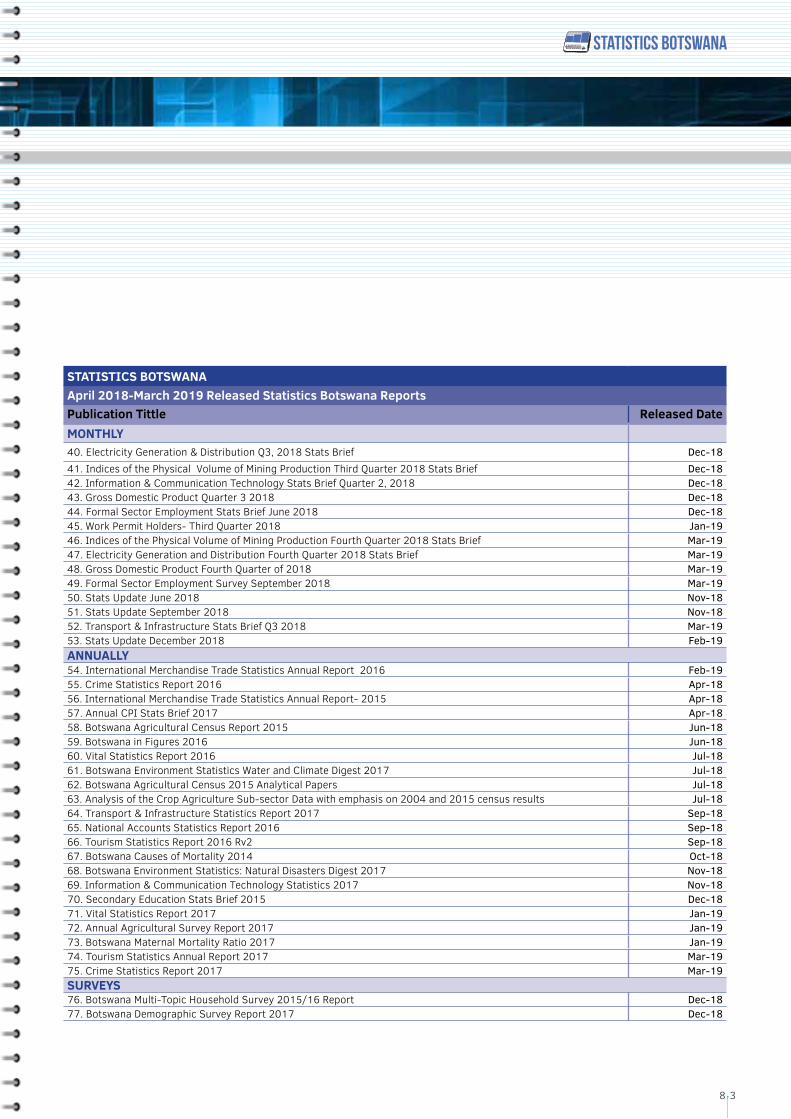
STATISTICS BOTSWANAApril 2018-March 2019 Released Statistics Botswana ReportsPublication Tittle Released DateMONTHLY40. Electricity Generation & Distribution Q3, 2018 Stats Brief Dec-1841. Indices of the Physical Volume of Mining Production Third Quarter 2018 Stats Brief Dec-1842. Information & Communication Technology Stats Brief Quarter 2, 2018 Dec-1843. Gross Domestic Product Quarter 3 2018 Dec-1844. Formal Sector Employment Stats Brief June 2018 Dec-1845. Work Permit Holders- Third Quarter 2018 Jan-1946. Indices of the Physical Volume of Mining Production Fourth Quarter 2018 Stats Brief Mar-1947. Electricity Generation and Distribution Fourth Quarter 2018 Stats Brief Mar-1948. Gross Domestic Product Fourth Quarter of 2018 Mar-1949. Formal Sector Employment Survey September 2018 Mar-1950. Stats Update June 2018 Nov-1851. Stats Update September 2018 Nov-1852. Transport & Infrastructure Stats Brief Q3 2018 Mar-1953. Stats Update December 2018 Feb-19ANNUALLY54. International Merchandise Trade Statistics Annual Report 2016 Feb-1955. Crime Statistics Report 2016 Apr-1856. International Merchandise Trade Statistics Annual Report- 2015 Apr-1857. Annual CPI Stats Brief 2017 Apr-1858. Botswana Agricultural Census Report 2015 Jun-1859. Botswana in Figures 2016 Jun-1860. Vital Statistics Report 2016 Jul-1861. Botswana Environment Statistics Water and Climate Digest 2017 Jul-1862. Botswana Agricultural Census 2015 Analytical Papers Jul-1863. Analysis of the Crop Agriculture Sub-sector Data with emphasis on 2004 and 2015 census results Jul-1864. Transport & Infrastructure Statistics Report 2017 Sep-1865. National Accounts Statistics Report 2016 Sep-1866. Tourism Statistics Report 2016 Rv2 Sep-1867. Botswana Causes of Mortality 2014 Oct-1868. Botswana Environment Statistics: Natural Disasters Digest 2017 Nov-1869. Information & Communication Technology Statistics 2017 Nov-1870. Secondary Education Stats Brief 2015 Dec-1871. Vital Statistics Report 2017 Jan-1972. Annual Agricultural Survey Report 2017 Jan-1973. Botswana Maternal Mortality Ratio 2017 Jan-1974. Tourism Statistics Annual Report 2017 Mar-1975. Crime Statistics Report 2017 Mar-19SURVEYS76. Botswana Multi-Topic Household Survey 2015/16 Report Dec-1877. Botswana Demographic Survey Report 2017 Dec-18
Annual Report 2018/19
8 3
APPENDIX 3:
SUSTAINABLE DEVELOPMENT GOALS
PARTNERSHIPSFOR THE GOALS
Annual Report 2018/19Annual Report 2018/19
8 4

Head Office (Gaborone)
Statistics BotswanaPrivate Bag 0024Four Thirty SquarePlot 54350PG Matante Road, Central Business DistrictGaborone Tel: 3671300Fax: 3952201/3956087 Toll Free: 0800 600 200Email: [email protected]
Francistown Office:
Plot 32367Unit 3, TRL HoldingsPrivate Bag F193,City of FrancistownBotswanaTel: 241 5848Fax: 241 7540
Ghanzi Office:
Plot 8624Ghanzi Mall (Tau Mall)Unit 19Private Bag 32Ghanzi Tel: 371 5723Fax: 659 7506
Maun Office:
Plot 1196Engen Centre (New Mall)Unit 1APrivate Bag 47Maun Tel: 371 5716Fax: 686 4327
https://twitter.com/statsbots
https://www.facebook.com/Statistics-Botswana
https://www.instagram.com/statistics_botswana/
Annual Report 2018/19