Embed Size (px)
Citation preview
City of Nai'k~.!lO
~g §eu"'•IJ1J!aB
0Fl:f1CI.AJ.... RfJCORJ.) COPY

DAYTON & KNIGHT lTD. Consulting Engineers
1865 MARINE DRIVE, BOX 91247, WEST VANCOUVER, B.C. V7V 3N9 PHONE 922-3255
Mr. A. W. MacDonald, Director of Public Works 1
City of Nanaimo, '~55 Wallace .'Street, Nanaimo, B.C. V9R 5J6
Dear Mr. MacDonald;
May 16, 1980
A study of the c.:at Stream Drainage Basin, ;:,~; authori;;.:ed by your letter of October 17, l979, has now been (XHnpJ.,~ted. Our report is sulxni ttcd herewith,
InitiaJ sections .:)f the r.:::port pce-:;ent data gai:b·red dl.idng the survey and the cotnpi lc·~~J cr.l.te( ia for de.sj gns iYf drainage plansG< 'The It,I..lJ[)/\.S Cornpt!ter F'rot;ri:ln1 is ~·;elected for <lnalyzing ftovvs and c;~,· ainD.ge \V()rks~
Four pbns f•)r cira.inai'': impnYVCiTl~::nt:~, ar<:~ prese:r,terf, ranging • ~ .,...,- ."""\i~- ... ,1 c ·· bc.·j· 1~ .ct~- <· (\(J (..,n·:J .• , j .. -::. ~, 1 ,·J1r1 ··r·'t. J · • 111 '-dJ.·'"~ co,,l c we,-_,\ )Jv.-,.v\ <L1' ..;··~.),)·"·'' .. , 11lC: p.an ccmpnsJ~<g a
2~:i year rai.n:fali recurrer.c::; interval and i.wo retendcn-ck~teiJtion fn.c.iJitic·s Js n::comrnem:,c;d .f;)r W!plement<Jti.c::.n at an e<:;·ii.n!dted capit2.I CO'Jt of $353,000.
The report al.sc discus~:cs futur~ stonnwat,.:::r :·nenag,~lTlent :fot the b;-.1.sin, and out line:'; sev,::rDJ pr-og•·:1rns ~'or tile City to c:c1ns ldcr.
!'11'·'·'" .... ., .. fil&xtin J. :J, [),tyton

REPORT
TO
CITY OF NANAIMO
on
PLAN 01:: IMPROVEMENTS
and
STORfvlWATER MANAGEMENT CONCEPTS
for
CAT STREAM DR!\INAGE BASIN
May 16, 1980
DAYTON & KNIGI--IT LTD. Consulting Engineers
1.
2.
3.
4.
CITY OI7 NANAIMO
CONTENTS
SUMMARY
INTRODUCTION
Terms of Reference Conduct of Survey Acknowledgements Abbreviations
EXISTING DRAINAGE FACILITIES
Drainage Area & Major Facilities Other Drainage Facilities Drainage Problems System Adequacy
CHARACTERISTICS OF AREA
Topography Geology & Sells Climate Existing Development Future Development
RAINFALL ANALYSIS
Available Records Elevation Factor Compadson of Rainfall Records Derivation of IDF Curves Seasonai Rainfall Recommended Design Curves Comparison with Previous Design Curves Storm in December 1979
Page No.
S-1
1-1
1-1 1-1 1-2 1-2
2-1
2-1 2-3 2-4 2-4
3-1
3-1 3-1 3-2 3-2 3-3
4-1
4-1 4-2 4-2 4-4 4-4 4-·5 4-5 4-6
5.
6.
7.
8.
DESIGN CRITERIA
Current Design Criteria Runoff Coefficient Storage ILLUDAS Computer Program Correlation of Strea.mflow and Rainfall Comparison of Rational Method and ILLUDAS Culvert Hydraulics Drainage Basin Polides Proposed Design Criteria
DESIGN FLOWS
25 Year Return Period Storm 200 Year Return Period Storm
ALTERNATIVES FOR IMPROVEMENTS
Design Requirements Alternative· Plans Comparison of Plans
WATERCOURSE PRESERVATION AND MANAGEMENT
Municipal Regulations Provincial Regula tlons Private versus Public Ownership Creek Preservation Area Requirements Flood Flow Routing Pollution Retention-Detention Irn plernenta tion
RECOMMENDATIONS
5-l
5-1 5-1 5-2 5-2 5-3 5~4
5-6 5-7 5--9
6--1
6-1 6-3
7-1
7-1 7-2 7-8
8-1
8~1
8--2 8-2 8-3 8-4 8-4 8-4 8-5
9-1

FIGURES
1. Location Pian 2. Drainage Area and Existing Facilities 3. Cat Stream Profile 4. Soils 5. Zoning Bylaw, Community Plan and City Ownership 6. Two Year Return Period Rainfall Comparison of Stations 7. Two Year Return Period Rainfall - Comox Airport 8. Two Year Return Period Rainfall - Vancouver Airport 9. Two Year Return Period Rainfall - Victoria Gonzales Heights
10. 'two Year Return Period Rainfall- Vancouver and Departure Bay 11. Recommended Design Rainfall Curves 12. Comparison of Design Rainfall Curves 13. December 1979 Storm - Correia tion of Calculated and Measured Flows 14. Alternative Plans for Improvements 15. Cat Stream Profile- Alternative Plans for Improvements 16. Storage Area at Third Street 17. Typical Creek Preservation Area Requirements
TABLES
1. Summary of Rainfall Intens.i ties 2. Con1puted and Measured Streamflow ·· December 1979 Storm 3. Comparison of ILLUDAS and Rational Method Flows lf.. Design Flows for 25 Year Storm- Undeveloped to
Fully Developed Conditions- No Storage 5. Design Flows and Storage Requirements- 25 Year Storm 6. Design Flows and Storage Requirements- 200 Year Storm
APPENDIX
1. Culvert Data Sheets
CITY OF f"lANA.IMO
CAT STREAM DRAINAGE STUDY
SU MT:v'U\R Y
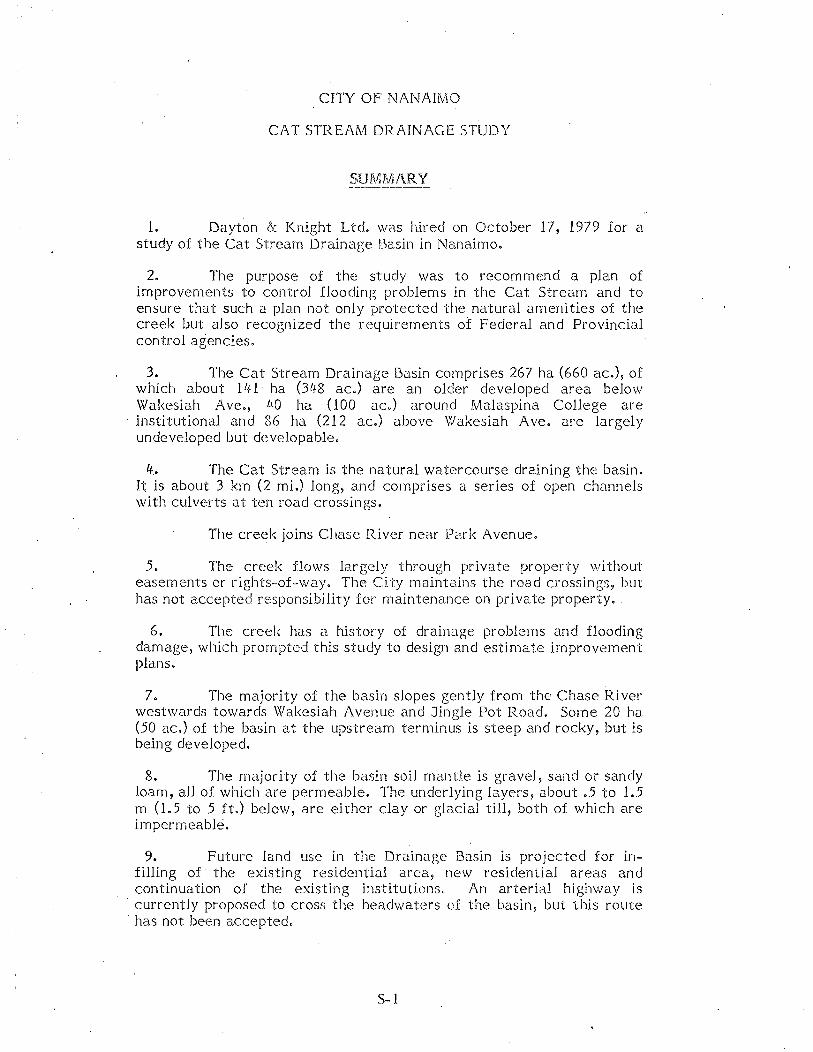
1. Dayton & Knight Ltd. was hired on October 17, 1979 for a study of the Cat Stream Drainage Basin in Nanalmo.
2. The purpose of the study was to recommend a plan of improvements to control flooding problems in the Cat Stream and to ensure that such a plan not only protected the natural amenities of the creek but also recognized the requirements of Federal and Provincial control agencies.
3. The Cat Stream Drainage Basin comprises 267 ha (660 ac.), of which about 141 ha (31+8 ac.) are an older developed area below Wakesiah Ave., ~tO ha (100 ac.) around Malaspina College are
-institutional and 86 ha (212 ac.) above Wakesiah Ave. are largely undeveloped but developable.
It_. The Cat Stream is the natural watercourse draining the basin. It is about 3 km (2 mi.) long, and comprises a series of open channels with culverts at ten road crossings.
The creek joins Chase River near Park Avenue.
5. The creek flows largely through private property without easements or rights--of-way. The City maintains the road crossings, but has not accepted responsibility for maintenance on private property.
6. The creek has a history of drainage problems and flooding damage, which prompted this study to design and estirnate improvement plans.
7. The majority of the basin slopes gently from the Chase River westwards towards Wakesiah Avenue and Jingle Pot Road. Some 20 ha (50 ac.) of the basin at the upstream terminus is steep and rocky, but is being developed.
8. The majority of tlte basin soil mantle is gravel, sand or sandy loarn, all of which are permeable. The underlying layers, about .5 to 1.5 m (1.5 to 5 ft.) below, are either clay or glacial till, both of which are impermeable.
9. Future land use in the Drainage Basin is projected for in-filling of the existing residential area, new residential areas and continuation of the existing institutions. An arterial highway is currently proposed to cross the headv,raters of the basin, but this route
· has not been accepted.
S-1
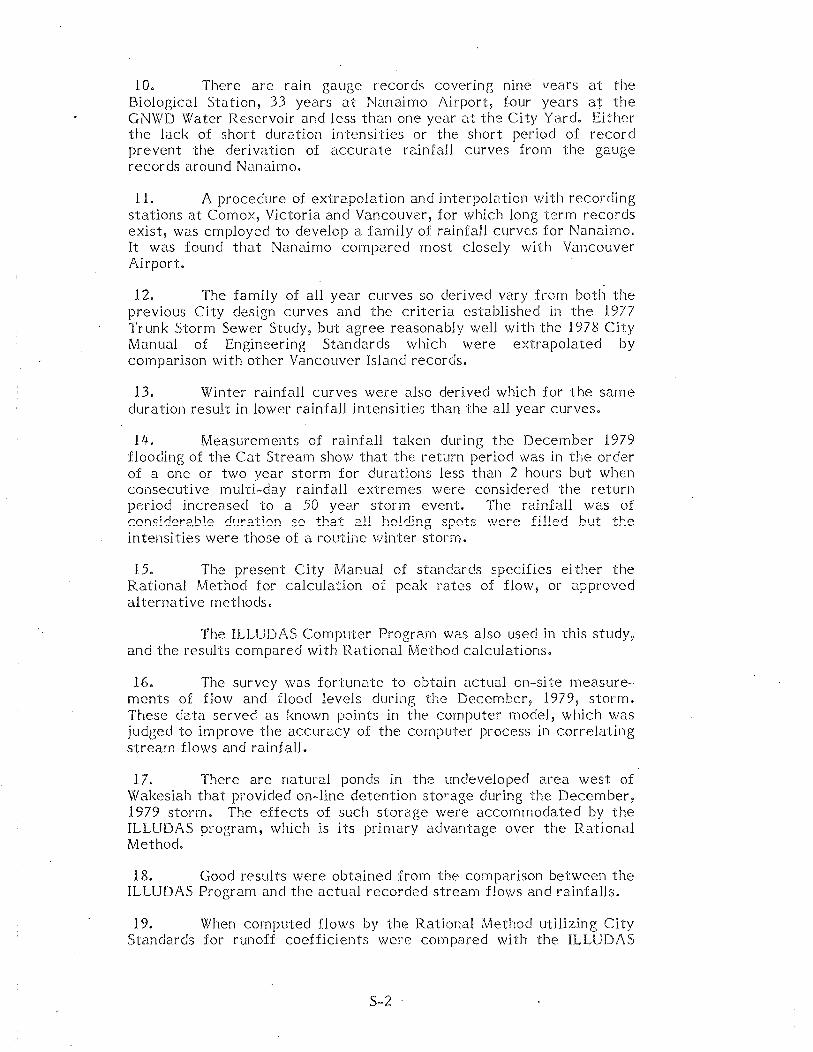
10. There are rain gauge records covering nine vears at the Biological Station, 33 years at Nanaimo Ait"port, four years at the GNWD Water Reservoir and less than one year at the City Yard. Either the lack of short duration intensities or the short period of record prevent the derivation of accurate rainfall curves from the gauge records around Nanaimo.
11. A procedure of extrapolation and interpolation v;ith recording stations at Com ox, Victoria and Vancouver, for which long term records exist, was employed to develop a family of rEdnfall curves for Nanaimo. It was found that Nanaimo compared most closely with Vancouver Airport.
12. The family of all year curves so derived vary from both the previous City design curves and the criteria established in the 1977 Trunk Storm Sewer Study, but agree reasonably well with the 1978 City Manual of Engineering Standards which \vere extrapolated by comparison with other Vancouver Island records.
13. Winter rainfall curves were also derived which for the same duration result in lowet· rainfall intensities than the all year curves.
11~. Measurements of rainfall taken during the December 1979 flooding of the Cat Stream show that the return period was in the order of a one or two year storm for durations less than 2 hours but when consecutive multi-day rainfall extremes were considered the return period increased to a 50 year storm event. The rainfall was of considerable d!.!!'"e:tlcm so that all ho!dlng spots '.ve:e fl!led b•Jt ·the intensities were those of a routine winter stotTn.
15. The present City rv1anuaJ of standards specifies either the Rational Method for calculation of peak rates of flow, or D.pproved alternative rnethods.
The ILLUDAS Computer ProB;rarn was also used in this study, and the results compared with Rational Method calculations.
16. The survey \vas fortunate to obtain actual on·-si te !Tleasure-ments of flow and flood levels during the December, 1979, storm. These data served as known po.ints in the computer model, which was jud8ed to improve the accuracy of the computer process in correlating stream flows and rainfall.
17. There are natural ponds in the undeveloped area west of Wakesiah that provided on-line detention storage during the December, 1979 storm. The effects of such storage were accommodated by the ILLUDAS program, which is its primary advantage over the Rational Method.
18. Good results were obtained from the comparison between the ILLUDAS Program and the actual recorded strean1 flows and rainfalls.
19. When computed flows by the Rational Method utilizing City Standards for runoff coefficients were compared with the ILLUDAS
S-2 ·
calculations) the ILLUDAS flows were higher. Higher runoff coeJflcicnts had to be used in the Rational Method to get comparable results.
Runoff coefficients calculated for the December storm showed the requirement for higher coefficients to be valid.
20. The hydraulics of culverts is one of the most misunderstood and mis--applied aspects of drainage design. It is often overlooked that the capacity of a culvert is usually governed by its entrance conditions, so that rnaking the culvert larger does not necessarily increase its capacity.
21. Control of debris in natural watercourses is another area of misunderstanding in rnunicipal drainage systems. Most flooding is actually caused by debris in the watercourses obstructing culverts or the channel, and not from natural causes.
22. Every watershed rnust have a major and minor routing for storm water. In the Cat Stream Drainage Basin, the Creek is both the minor and the major. route, because no alternatives exist for flood flows to be diverted or to escape.
23. The problems of debris, encroachment and erosion in natural watercourses such as the Cat Stream influence the design of drainage irnprovernents to correct flooding.
2!.;.fl This repol-t tabulates a series of dcslgr-, criteria :for the Cat Stream Drainage Basin, including rainfall curves, retention-detention storage and hydraulic calculations.
25. From the design criteria and policies, two sets of design flows and storage needs for 25 year and 200 year recurrence intervals were calculated. l\ t Park Avenue, the design flow for the 200 year recurrence is about 30 percent greater than for the 25 year.
26. Four plans were then designed and estimated for cost. Two plans were for a 25-year recurrence ·- one vvith storage of Wakesiah and the second with storage at both Wakesiah and Third. Plans 3 and li. were similar except for 200-year recurrence.
27. (Plan l)- with 25--year recurrence and storage at Wakesiah, comprises new-culverts at five road crossings between Third and Albert.
It also includes re-grading some l~OO m (1300 ft.) of the creek in the vicinity of Chesterlea..
Total capital cost is $309 1000. /
28. cPlan 2> also has a 25 year recurrence but lncot·porates two storage ponds - one west of Wakeslah and a second near Third.
The plan then requires new culverts only at Third, and the creek regrading is not needed.
S-"3
Total estimated r:apitaJ cost is $353,000, of which $150,000 is allo\ved for purchase of 2)f ha (6 ac.) of land for the storage pond at Third.
29. Malaspina Col1ege is presently planning a game sanctuary in the natural ponds west of Wakesiah, and has applied for the necessary licence. This report assumes that these ponds would also provide retention storage during flood flows in the creek.
30. Plan 3 has a 200 year recurrence and storage at Wakesiah only, so is similar to Plan 1 except for its ability to pass higher flows. Six new culvert road crossings are needed.
Total estimated capita.! cost is $431,000.
31. Plan 4, a 200 year recurrence includes the two storage areas and requires only one upgraded road crossing. Total estimated capital cost is $58/i.,OOO, including $150,000 for land purchase.
32. All costs are 1980 Contractor's prices to an Engineering News Record Construction Cost Index of 3300. They include 25 percent :for contingencies and engineering and 12 percent for interim financing.
33. The four plans should not be compared on capital cost alone because they provide different results and have different environmental impacts.
35. Cat Stream Creek is a fisheries resource, and any plan of improvements should be integrated with :fishery requirements.
36. Nanaimo's current Community Plan establishes the policy of a buffer strip or green belt along the Cat Stream.
Other bylaws and regulations set standards for setbacks and building elevations near the creek.
37. The question of private or public ownership for the bed of a natural watercourse such as the Cat Stream is not readily resolved. At present it is largely in private hands.
38. In the past few years the legal liability of municipalities for flooding damages has increased dramatically.
39. In order to protect themselves, and to enable needed improvements· to be made on private property, some municipalities are considering acquis.i tion of property containing the beds of natural watercourses.
40. Other municipalities retain a position that natural watercourses on private property are not the business of the public body as far D.s drainage is concerned.
S--4

!JJ. This study recommends that the City enact a· W·:'tercourses ( By.l<~.w, in which no work could be done in or near the creek without a (
\ permit. j
11-2. Implementation of a drainage plan such as is recommended in this report is the most difficult aspect of a drainage system in many British Columbia municipalities, p:3.rticularly with regard to financing and cost apportionment..
4-3. Ten specific recommendations arising from the study are made in the final chapter of the report.
q~A(,;l, f'-!o .C) .
S-5
CITY OF NANAIMO
CAT STREAM DRAINAGE STUDY
1. INTRODUCTION
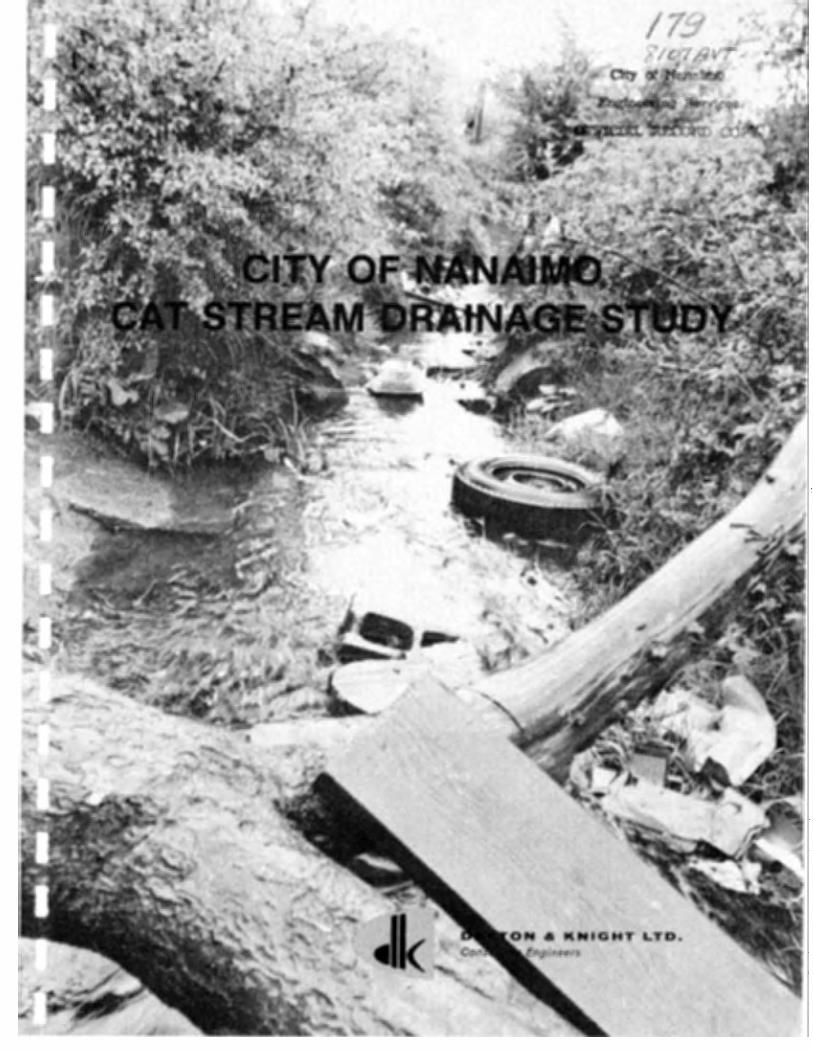
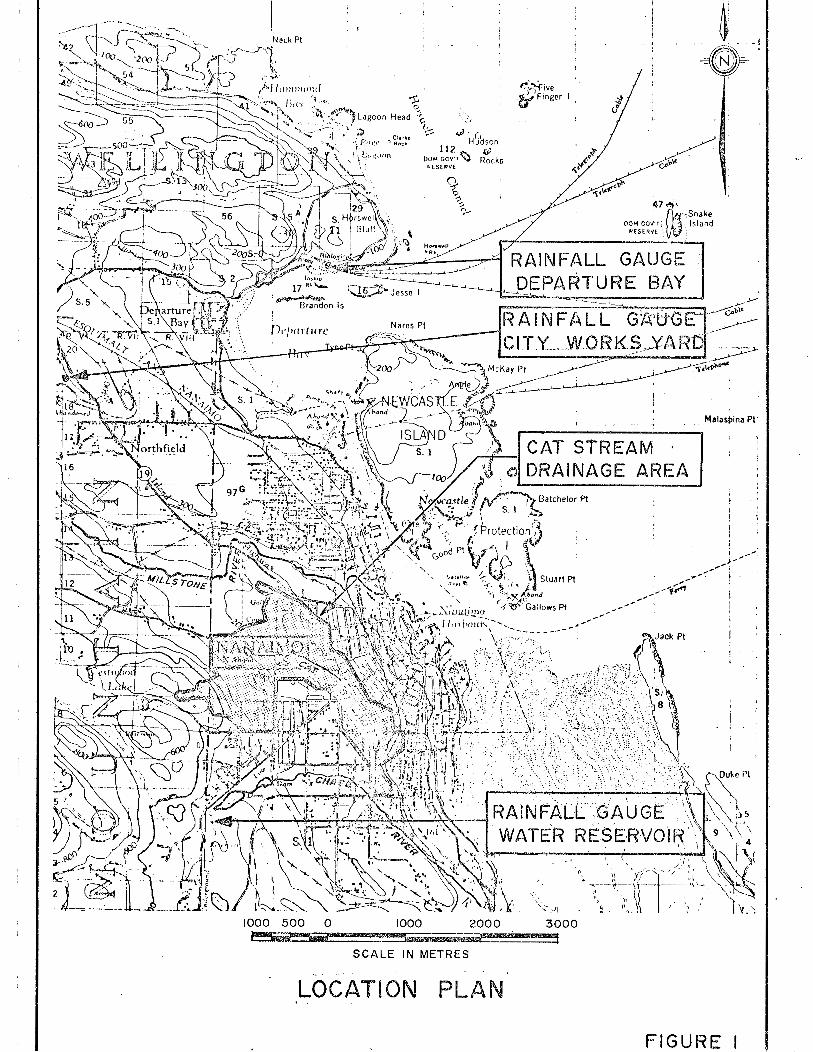
The Cat Stream is located in one of the older areas of the City of Nanaimo, beginning near Jingle Pot Road west of Wakesiah Avenue and running to the east and south to discharge into the Chase River near the intersection of Park Avenue and Seventh Street, as shown on Figures 1 & 2. The catchment or drainage area is 267 ha (660 ac.).
The Creek floods adjacent properties periodically, and is considered a potential trouble area for drainage as the tributary area in the City develops.
TERMS OF REFERENCE
Terms of Reference for this study are set out in the City of Nanaimo letter dated August 29, 1979.
The purpos~ of the study is rl.S follows:
1. To review the drainage catchment area, including existing road culverts.
2. To recommend a plan of improvements to control the flooding problems and maintain the natural amenities of the Creek.
3. To incorporate into the study the requirements of Federal and Provincial Fisheries Agencies and current stormwater management concepts.
Dayton & Knight Ltd. was awarded the survey and report on October 17, 1979.
CONDUCT OF SURVEY
Work commenced in October 1979 with field surveys to establish the drainage area boundaries and collect data on existing culverts and creek conditions. RainfaLl data was obtained from the Atmospheric Environment Service.
During the storm in December, 1979, creek levels were monitored and photographs were taken. The City provided the rainfall records for December from the Works Yard gauge.
1-1
Meetings were :1eld in January 1980 with the City of Nanaimo Planning Department and with the Fish and Wildlife Branch in Nanaimo. Progress reports were made to City Engineering staff on January 30 and March 21, 1980. The report was reviewed in draft form on May 1, 1980 prior to submission.
Engineering investigations and preparation of the report were carried out by D.J. Palmer, P.Eng., with supervision by B. L. Walker, P.Eng., and under the general direction of A. Berzins, P.Eng. and M.J.J. Dayton, P.Eng.
ACKNOWLEDGEMENTS
The assistance of the Director of Public Works, Mr. A. W. MacDonald, and his staff, in outlining specific requirements and furnishing plans and information, has been most valuable.
We also thank Mr. W.S. Mackay, Director of Planning and Development for the City of Nanaimo and Mr. G. Schaefer of the Atmospheric Environment Service for the information they provided.
ABBREVIATIONS
The following abbreviations have been used in this report:
ha m mm ft. oc OF hr cfs IL~UDAS
m~/s m3 yd CSP RC
hectares - metres - mlllimetres - feet - degrees Centigrade
degrees Fahrenheit hour cubic feet per second
- Illinois Urban Drainage Area Simulator - cubic metres per second
cubic metres - cubic yards - corrugated steel pipe - reinforced concrete
1-2
-i-f""-I
1000 500 0
SCALE IN METRES
...
LOCATION PLAN
I
I
. ! i ~ .. .. .I
~-
47 D...,}J·~ • Snake OOM GOv r 1 Island
RESER'/£
Malaspina Pt
CAT STREAM DRAINAGE AREA
FIGURE I
LEGEND
-- CAT STREAM
------- EXISTING CONTOURS
.>---< EXISTING FACILITIES 600 ·----- OIA. OR SIZE HEIGHT x WIDTH mm
DRAINAGE AREA BOUNDARY
--- SUB - AREA BOUNDARIES
f3.4"1- HECTARES
~·--ACRES
TOTAL AREA
267 .3 HECTARES
660 6 ACRES
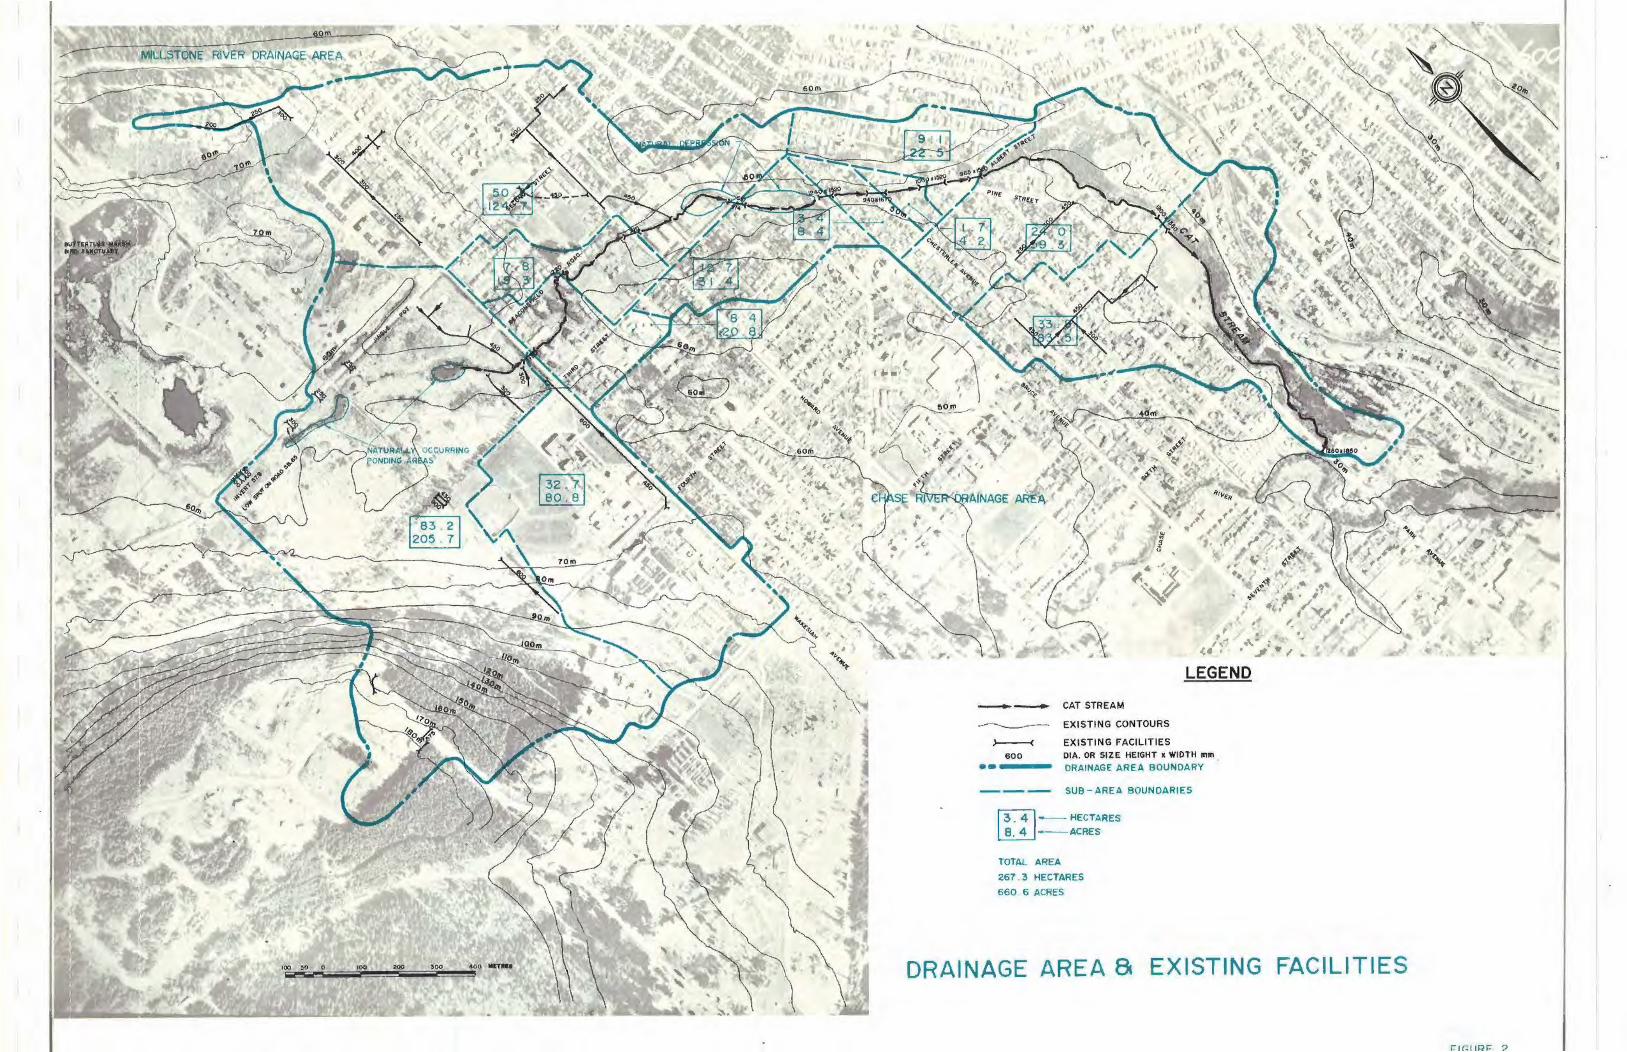
DRAINAGE AREA 8 EXISTING FACILITIES
I="IC:: IIRF ?
CITY OF NANAIMO
CAT STREAM DRAINAGE STUDY
2. EXISTING DRAINAGE FACILITIES
DRAINAGE AREA AND MAJOR FACILITIES
The drainage area is outlined on Figure 2 which also shows contours. The drainage area has been divided into 11 sub-areas, with areas varying from 83.2 ha (205.7 ac.) to 1.7 ha (4.2 ac.), such that the area contributing to each culvert can be calculated.
The highest portion of the drainage area is in the College Park Subdivision which rises to about 200 m (650 ft.). Most of the storm water from the subdivision drains over a cliff to an energy dissipation structure and diversion ditch which carries the water across Jingle Pot Road at Addison A venue into the Buttertubs Marsh area .
. The southern part of College Park Subdivision drains to the Cat Stream, finding its way overland to the natural pondlng area west of Wakeslah Avenue.
Malaspina College is serviced by a system of stormwater dr'ains which terminate in a 600 rnm (24 ln.) diameter R.C. pipe behind the High School. A system of ditches and culverts continue to the pondlng area.
An extensive drainage system serves the High School, carrying most of the runoff east to Wakesiah Avenue and then north to Third Street terminating in a 600 mrn (24 ln.) diameter R.C. pipe. A ditch continues to the entrance of the culvert under Wakeslah Avenue.
The Millstone River drainage area to the north is separated from the Cat Stream drainage area by the diversion along Addison Avenue and by Jingle Pot Road. Buttertubs Marsh to the north of Jingle Pot Road has been developed as a wildfowl sanctuary with controlled levels and an inlet from the Millstone River. The water level in the Marsh is generally higher than in the Cat Stream, as evidenced by the figure of 57.0 m ( 187 ft.) in March 1979 and 56.9 m (186.6 ft.) in April 1980. These compare with a lowest elevation of 58.65 (192 ft.) on Jingle Pot Road and elevations on the natural pond west of Wakesiah Avenue of 54.50 m (178.8 ft.) in March 1979, 54.00 m (177.1 ft.) in October 1979 and 54.77 (179.6 ft.) in April 1980.
There are five culverts crossing Jingle Pot Road between those at Addison Avenue and the intersection with Wakesiah Avenue. The three nearest Wakesiah Avenue are small and are intended to carry local drainage across Jingle Pot Road into the natural pond. The last two are 500 mm (20 in.) diameter CSP with invert elevations of 57.9 m .(189.9 in.). One is blocked at the north end.
2- 1
The drainage area includes some undeveloped residential land north of Jingle Pot Road and west of Wakesiah. East of Wakesiah Avenue the drainage area is mostly developed residential land. ·
The Cat Stream runs from the natural pending area at Wakesiah to the east and south until it enters the Chase River near Park A venue and Seventh Street. The gradients on the creek vary from near zero to 1.5 percent. The upper reaches are overgrown and restricted in some areas with vegetation and debris. Below Albert Street the channel is in better condition although there is some debris and several beaver dams.
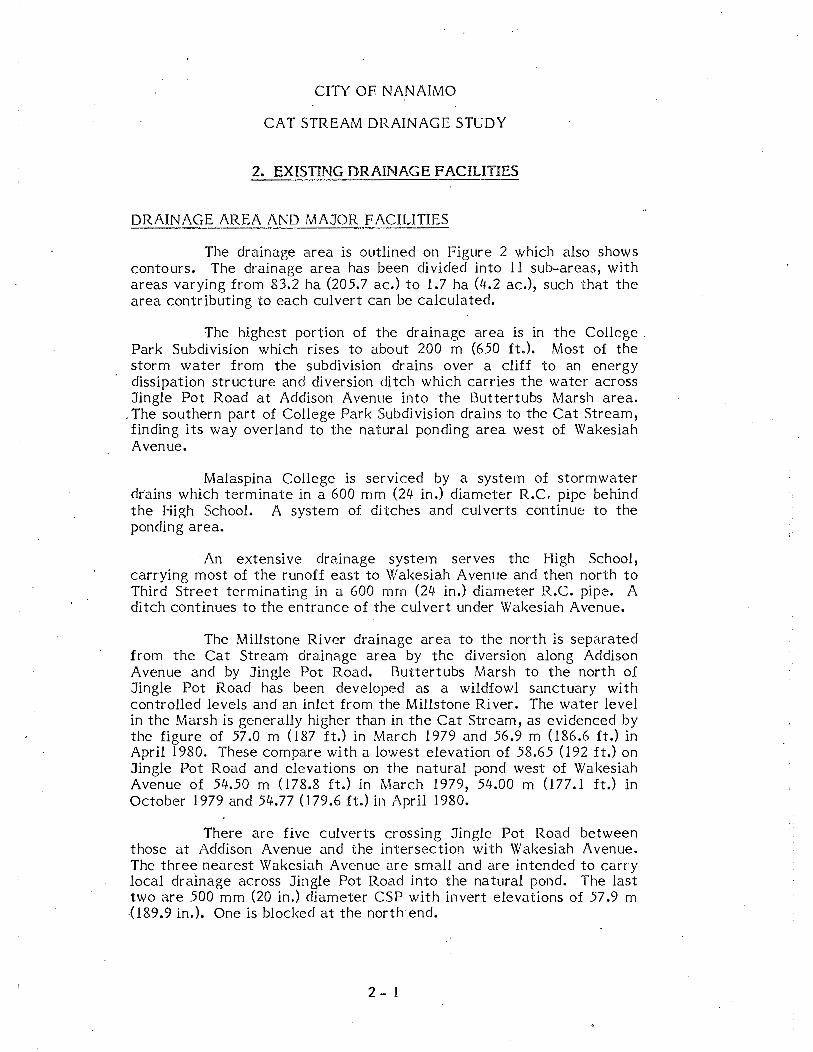
Survey has been. carried out to establish elevations, sizes, type and condition of the ten existing culverts on the creek. This information is contained in Appendix 1. Location of the culverts is shown on Figure 2 and Figure 3 shows a profile of the creek. The capacity of the culverts shown is the maximum capacity without flooding of adjacent developed ground or buildings.
Size Diameter or Type Capacity
height x width 3 Culvert Location mm 1n. m /s cfs
Wakesiah Avenue 1130. 44 Woodstave 2.4 85 Beaconsfield l<..oad 1220 48 CSP 1.8 65 Howard A venue 910 36 CSP 2.0 70 Third Street 610x910 24x36 CSP 2.3 80 Bruce Avenue 1240x1520 48x60 R.C. box 1.1 40 Chesterlea Avenue 940x1670 37x66 R.C. box 3.4 120 Pine Street 1000x1520 39x60 R.C. box 3.7 130 Albert Street 965xl520 38x60 R.C. box 3.5 125 Fifth Street(2 sections) 1200xl360 47x54 R.C. box 4.5 160 1260xl850 50x73 Park Avenue 1260xl850 50x73 R.C. box 9.6 340
The following culverts cross Jingle Pot Road east of Addison Avenue: ·
Size (dia.) Invert Elevations (m) Distance from Addison A venue
mm in. North South m ft.
500 20 57.74 blocked 60 200 500 20 57.91 57.85 75 250 300 12 57.37 59.00 265 870 250 10 blocked 400 1300
250 & 300 10 & 12 57.65 57.05 480 1580
2-2
OTHER DRAINAGE FACILITIES
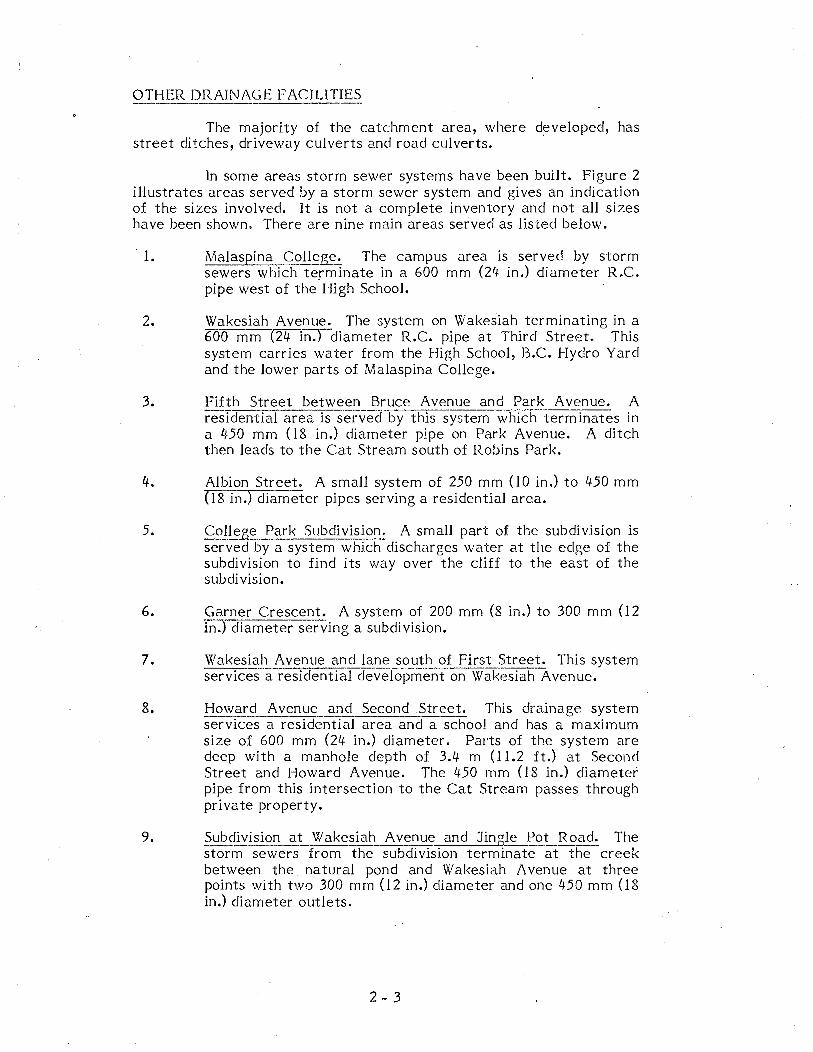
The majority of the catchment area, where developed, has street di!ches, driveway culverts and road culverts.
In some areas storm sewer systems have been built. Figure 2 illustrates areas served by a storm sewer system and gives an indication of the sizes involved. It is not a complete inventory and not all sizes have been shown. There are nine main areas served as listed below.
· 1. Malaspina College. The campus area is served by storm sewers which terminate in a 600 mrn (24 in.) diameter R.C. pipe west of the High School.
2. Wakesiah Avenue. The system on Wakesiah terminating in a 600 mm (24 i~diameter R.C. pipe at Third Street. This system carries water from the High School, B.C. Hydro Yard and the lower parts of Malaspina College.
3. Fifth Street between Bruce A venue and Park A venue. A residential area is served by this system which terminates in a l,t50 mm (18 in.) diameter pipe on Park Avenue. A ditch then leads to the Cat Stream south of Robins Park.
4. Albion Street. A small system of 250 mm (10 in.) to 450 mm (18 in.) diameter pipes serving a residential area.
5. Colle_g~ark Subdivision. A small part of the subdivision is served by a system which discharges water CJ.t the edge of the subdivision to find its way over the cliff to the east of the subdivision.
6. Garner Crescent. A system of 200 mm (8 in.) to 300 mm (12 in.) diameter serving a subdivision.
7. Wakesiah Avenue and lane south of First Street. This system services-a residential development on Wak~siah Avenue.
8. Howard Avenue and Second Street. This drainage system services a residential area and a school and has a maximum size of 600 mm (24 in.) diameter. Parts of the system are deep with a manhole depth of 3.4 m (11.2 ft.) at Second Street and Howard Avenue. The 450 mm (18 in.) diameter pipe from this intersection to the Cat Stream passes through private property.
9. Subdivision at Wakesiah Avenue and Jin~<2_t Road..=_ The storm sewers from the subdivision terminate at the creek between the natural pond and Wakesiah Avenue at three points with two 300 mm (12 in.) diameter and one 450 mm (18 in.) diameter outlets.
2- 3
DRAINAGE PROBLEMS
As development of the catchment area has progressed, the rate of runoff has increased along with flooding problems. ·
Below Fifth Street the creek is in a well defined channel. Ponding occurs on Robins Park due to a local area of low gradients. The ponding is increased by several beaver dams on the creek.
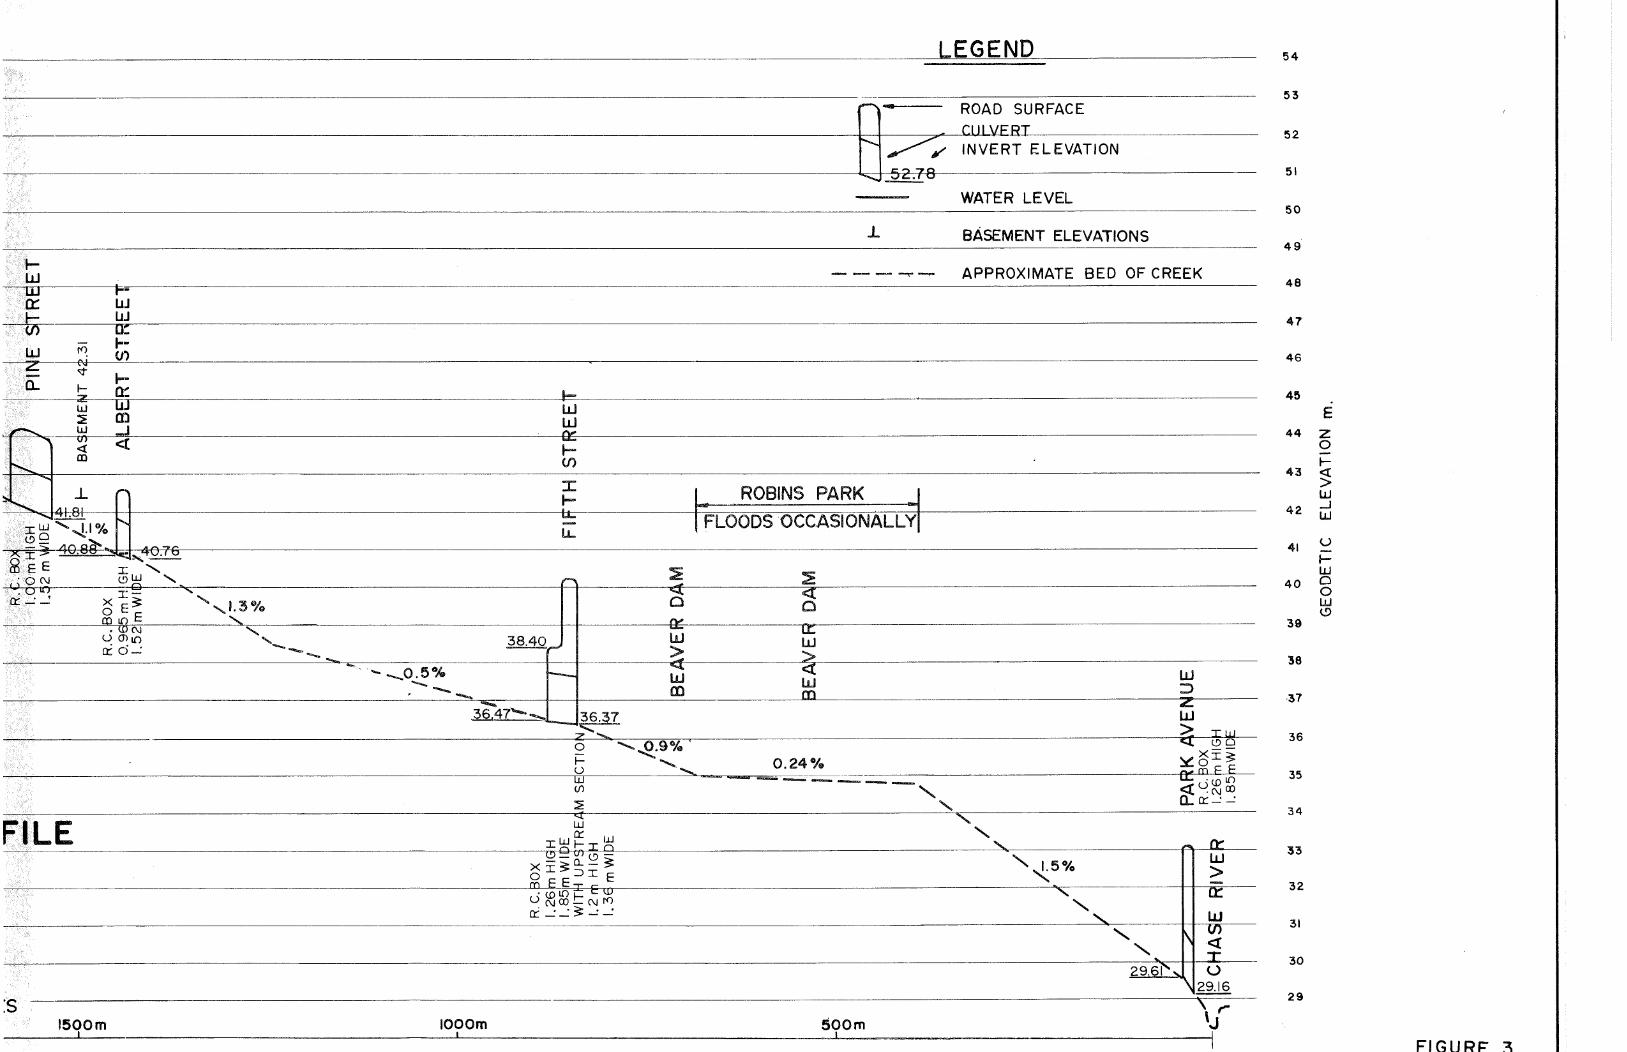
The area between Fifth Street and Wakesiah Avenue is the main area of concern. Several houses near the creek have low basement elevations compared with flood levels in the creek. Flooding occurs several times a year in this area. As can be seen from the creek profile (Fig. 3) the creek has a good gradient over most of its length, except for the area between Third Street and Pine Street.
The culverts at Chesterlea and Bruce are too high by about 900 mm (3 ft.), thus causing a backwater upstream. The lower culvert at Third Street is lower than the downstream culvert at Bruce Avenue and is therefore ineffective.
The basement in the house just upstream of the Bruce Avenue culvert floods before the culvert can run full. There was water in the basement on October 26, 1979 during a relatively minor storm.
The storm of mid-December 1979 caused a lot of problems along the creek with a considerable aiT\ount of ponding between Bruce A venue and Third Street and also upstream of Third Street.
The creek is impeded in several areas by blockages and by growth of vegetation, principally blackberries. The section of creek between Wakesiah and Beaconsfield contains debris, and the section between Beaconsfield and Howard is overgrown. The condition of the creek between Bruce Avenue and Fifth Street is better but there is some debris which should be removed and some vegetation which should be cleared.
The woodstave culvert at Wakesiah is partly filled with gravel which reduces its carrying capacity considerably. Other culverts affected by deposition of gravel are those at Beaconsfield Road, Pine Street and Albert Street. The culvert at Chesterlea is partly blocked by debris, vegetation and a fence.
SYSTEM ADEQt}ACY
The effect of the gravel deposited in the culvert at Wakesiah has been to limit flows during recent storms to about .85 m3/s (30 cfs). This has been fortunate for those downstream, especially the apart ments on Wakesiah Avenue which are situated near the creek at a low elevation. Gravel deposited in the culvert at Beaconsfield Road and the• flat gradient, however, would contribute to a high water level if a
2- 4
higher rate of flow was realized. The natural ponding occurring during a s.torm at the area o~ Third Street has also helped downstream conditions in the past.
The problem of flooded basements has occurred frequently in spite of these factors. It would have been worse, however, if they were absent.
Without a surveyed profile down the length of the creek, it is difficult to choose a proper elevation when installing culverts. The result of this lack of data is one culvert on top of another at Third Street, and a culvert downstream at Bruce Avenue which is higher than the one at Third Street.
Some houses have been built with basernent elevations too close to the creek elevation, particularly the house at Bruce Avenue with a basement elevation of 45.25 m (llJ.S ft.).
The rate of runoff has increased over the years with development while the creek has become overgrown and more restricted with debris.
2-5

54
53
52
51
50
49
48
47
46
45
E z 44
0 1- 43
~ w 42 _j
w u 41 -1-w
40 0 0 w t9 39
38
37
36
35
34
33
32
31
30
29
3500m L_
..L
""'
/----_... 53.~--,-~ w
LL..
......,,~--
0 :r:o <{0 _5: (/)~ WE ~0 ~~
3000m
w :::> z w <i lD
1'-a)
0 '¢
(/)(f) (f) ...... zu u ,1.2°/o o&\ ~ ' E E ' ~E E ......
....... w0J 0 -
(j) ID~
2500m
...... _
t::.XI::S IINu Ut::.t-'Ht::.::S::SIUN
FLOODS FREQUENTLY
- 45.47 - ........
44.22
,....
1-
E;:
~ (f) u
E E
(j)
d5 0
(]) :::1!: ,......, w
j_ ~ .L (])
1--45.52 .L 0.6%,
44?9---- _4_4.5J
I
~w x:r:o
ci ..
~ <( (])
J.. 0.4%
44.34 -~Q?
CAT STREAM
I u
r--.
............
..........
....... <::;t
-= w z ~ w w ::E ~ ~ (]) <(
(])
..1.. .l
I~ ~
"-J.3% '~ 42.26 ....
PRO I SCALES: HORIZONTAL 1=5000
VERTICAL 1:100
DISTANCE FROM CHASE RIVER IN METRE 2000m
w 0:: r-(J)
1 ~ Q t() a::_:_:
FILE
:s
.... LIJ w
~ <( CD
0 X J::~ o E Ill l(~ E
• (! C\J u Oll() 0:: ci-=
1500m
........
' ,1.3% .........
.........
' --- -, - -...0.5°.4
' -....-......_
..... r(/)
.l..
LEGEND
ROAD SURFACE
CIJI VERT INVERT ELEVATION
WATER LEVEL
BASEMENT ELEVATIONS
----............. APPROXIMATE BED OF CREEK
R ROBINS PARK IT?! FLOODS OCC.ASIONALL Y
~
<( 0 ;3 0::: -cr
38.40 .-' w w > ~ <( r--- w
00 w ro ......
36.47"'- ....... 36.37 - ........ z .......
0.24% 0 '..Q..9%. t; ............... ------w
wo:: w Ioi-J:o C?- 01 t;)
xi:~o...-~ 0 :)IE CD E E± E
• (() lO 1- CD UNCO-Nr0 ci_:__:~_:_:
-
' ' ' ' {5%
...... , ' '
w :::> z w ~ IW
- no-w > -a:: w
i\ CJ)
' <{ -r
29.6i' .... u \29.16
\ IOOOm 500m
\ ,. J
--~--~------------------------------~----------------------------~--~--~--------------------------~
54
53
52
51
50
49
48
47
46
45
E 44 z
0 1--
43 <I > w
42 _I
IJ.J
41 u ..... w
40 0 0 w (.!)
39
38
37
36
35
34
33
32
31
30
29

CITY OF NANIMO
CAT STREAM DRAINAGE STUDY
3. CHARACTERISTICS OF AREA
TOPOGRAPHY
Most of the catchment area is gently sloping, with the lower portion being mainly residential. West of Wakesiah Avenue and south of Jingle Pot Road, there is a large area of undeveloped land. The High School and Malaspina College border on the undeveloped land. West of this area a steep bank leads up to the College Park Subdivision, a small portion of which is included in the Cat Stream drainage area.. The major part of the undeveloped area drains into a natural pond west of Wakesiah Avenue. The Cat Stream commences at the pond outlet and continues east and then south to the Chase River. Along the creek there are ten culverts, the first at Wakesiah Avenue and the last at Park Avenue.
Elevations vary from 30 m (100 ft.) geodetic where the creek meets the Chase River to 54 m (177 ft.) at the pond west of Wakesiah. Most of the catchment area is below 73 m (240 ft.) with only a small portion rising to about 200 m (650ft.) in the west.
Contour plans at 3 m (10 ft.) contour intervals are available from mapping done during the period 1960 to 1963. Recent contour plans are available for part of the catchment area from mapping done in 1979 for the North-South Arterial study. These are 2 m (6.6 ft.) contours at a scale of 1:5,000. Information from both of these plans has been used to produce the 10 m (33 ft.) interval contours, shown on Figure 2.
The baseplan has been prepared from a photograph taken in March 1979.
GEOLOGY AND SOILS
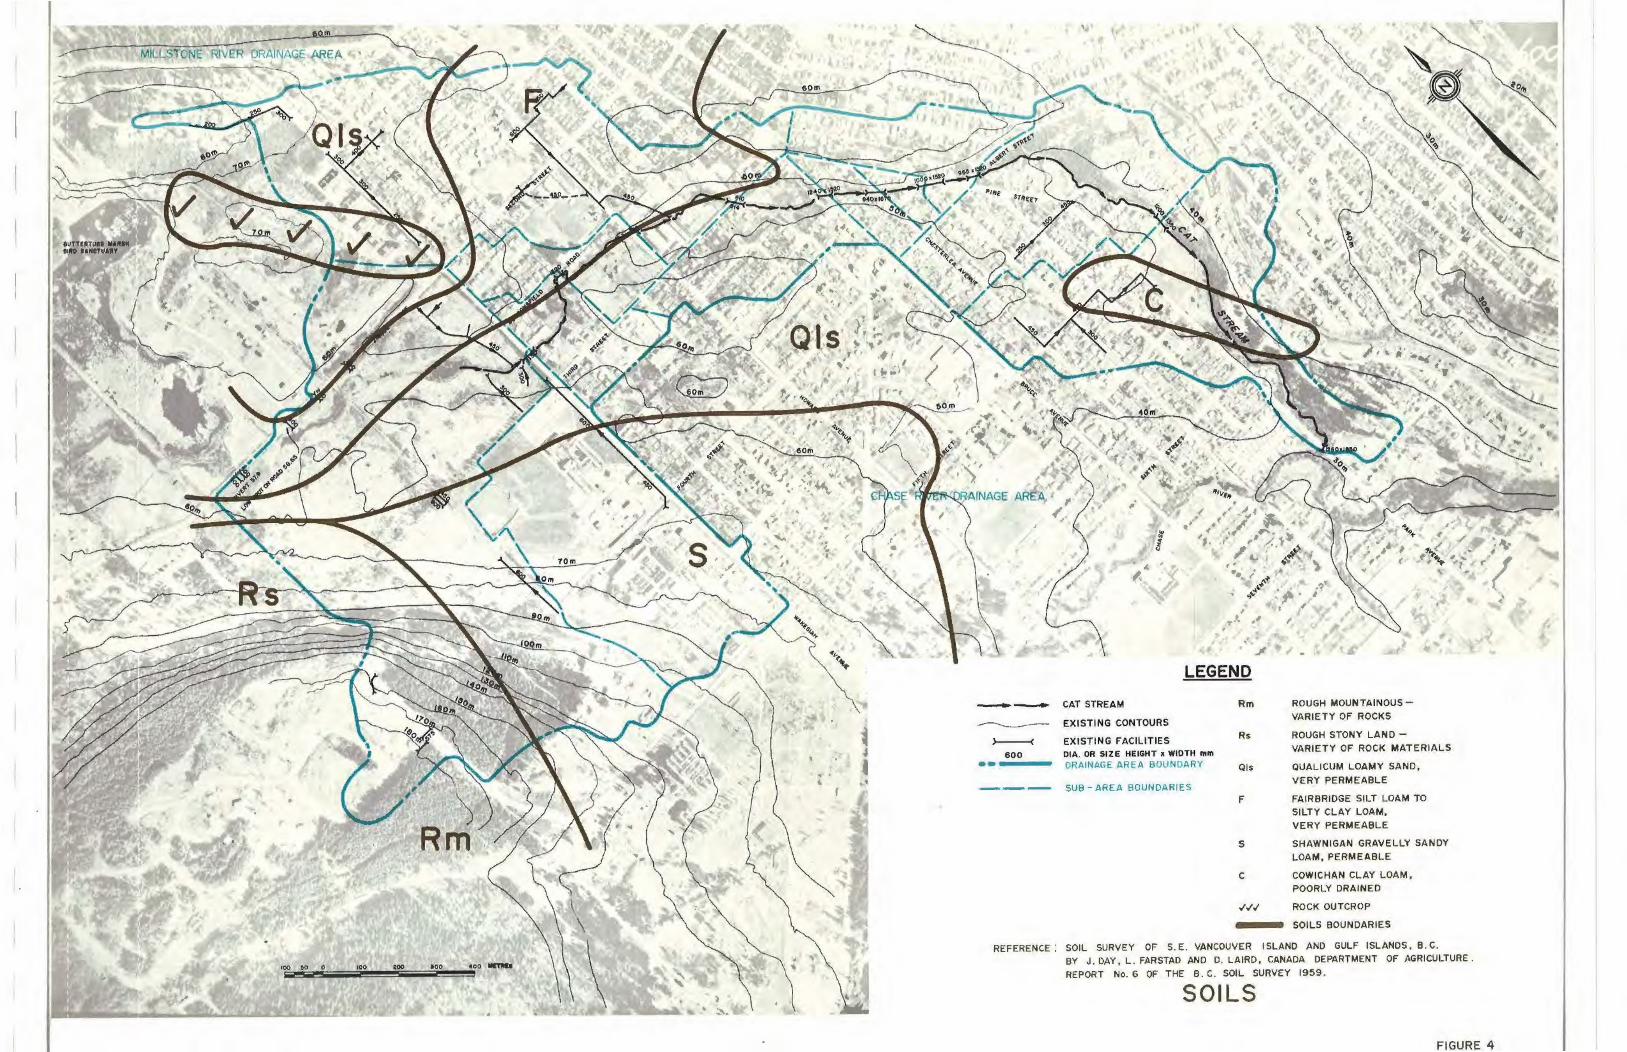
Figure 4 shows the soil types in the catchment area, as reported in "Soil Survey of Southeast Vancouver Island and Gulf Islands; B.C." by J.H. Day, L. Farstad and D.G. Laird. This report was produced by the Canada Department of Agriculture in cooperation with the University of British Columbia and the B.C. Department of Agriculture and is Report No. 6 of the B.C. Soil Survey 19 59.
The principal deposits upon which the soils in the Nanaimo area have developed were. formed before, during and after the last glaciation of the area. Glacial lee at one time filled the depression between Vancouver Island and the mainland and buried all of Vancouver Island except for the summits of the highest mountains. Glacial till, a compact mixture of clay, silt, sand, gravel and boulders deposited by
3- 1

glacial lee, was deposited over the floors and sides of valleys to a thickness of more than 30 m (100ft.) in some places.
After the glaciers retreated, the sea covered the greater part of the present lowlands, forming marine deposits. The land surface has since risen relative to the sea so that marine deposits are now found at an elevation of 120m (400ft.) at Nanaimo.
In some places the till has been removed by waves along former sea shores and thin marine gravels have combined with interglacial sand or gravel to give stony or sandy soils of the Quallcum series which cover a large part of the catchme-nt area. The Falrbrldge and Cowichan soils are formed in a similar way but have finer particles and are less permeable.
The south-western portion of the catchment area, in the area of Malaspina College, is reported as ha vlng soils of the Shawnigan series. This is a grave_lly, sandy loam underlain by compact till.
In general, the soils rest either on till or on clay so that they are not as dry as would be expected from their coarse texture.
The soils are generally described as permeable or very permeable, except for the Cowlchan series, which occupy a small part of the catchment area.
The underlying clay or glacial tills, together with the frequent v1inter rainfall promote a high water table condition as dt.;rnonstra ted by the pond \tv· est of \Vakesiah. This pvnd is reported to always contain water. The sud ace run-off of rainfall can therefore be relatively high, during the winter months when the surface soils approach saturation.
CLIMATE
The climate is referred to as modified maritime. Most precipitation occurs in the winter months as a result of storms moving inland from the Pacific Ocean. Annual precipitation averages 960 mm (38 ln.) with an average of only 50 mm ( 2 in.) occurring in July and August. Mean annual temperature is 10°C (50°F).
Typically, summer rainfall can be short duration high intensity while during winter months lower intensity longer duration rainfall events occur.
EXISTING DEVELOPMENT
The portion of the catchment area to the east of Wakeslah Avenue is mainly residential with most of the area fully developed. Undeveloped land which is zoned residential comprises lll- percent of the 1t~ 1 ha (348 ac.) in this portion.
The catchment area to the west of Wakesiah Avenue, is mainly undeveloped. Of the 126 ha (312 a c.) in this .Portion, 30 ha (7 4
3-2
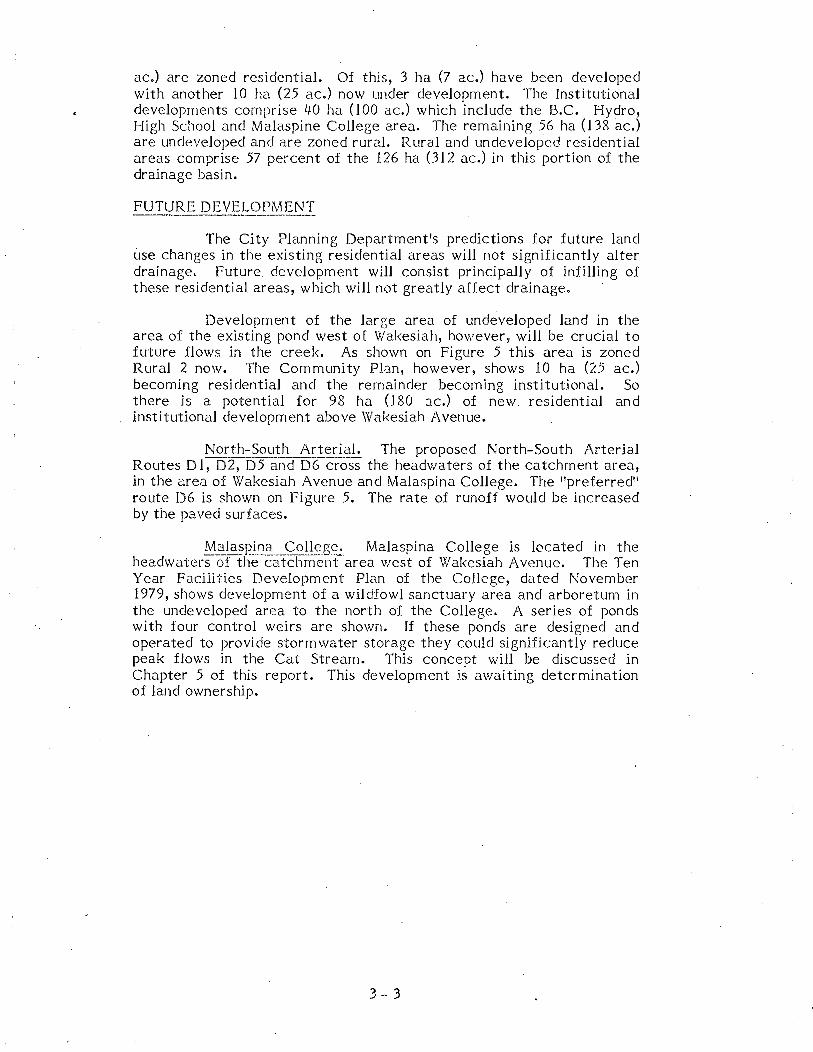
ac.) are zoned residential. Of this, 3 ha (7 ac.) have been developed with another 10 ha (25 ac.) now under development. The Institutional developments comprise 40 ha (1 00 ac.) which include the B.C. Hydro, High School and Malaspine College area. The remaining 56 ha (138 ac.) are undeveloped and are zoned rural. Rural and undeveloped residential areas comprise 57 percent of the 126 ha (312 ac.) in this portion of the drainage basin.
FUTURE DEVELOPMENT
The City Planning Department's predictions for future land use changes in the existing residential areas will not significantly alter drainage. Future development will consist principally of infilling of these residential areas, which will not greatly affect drainage.
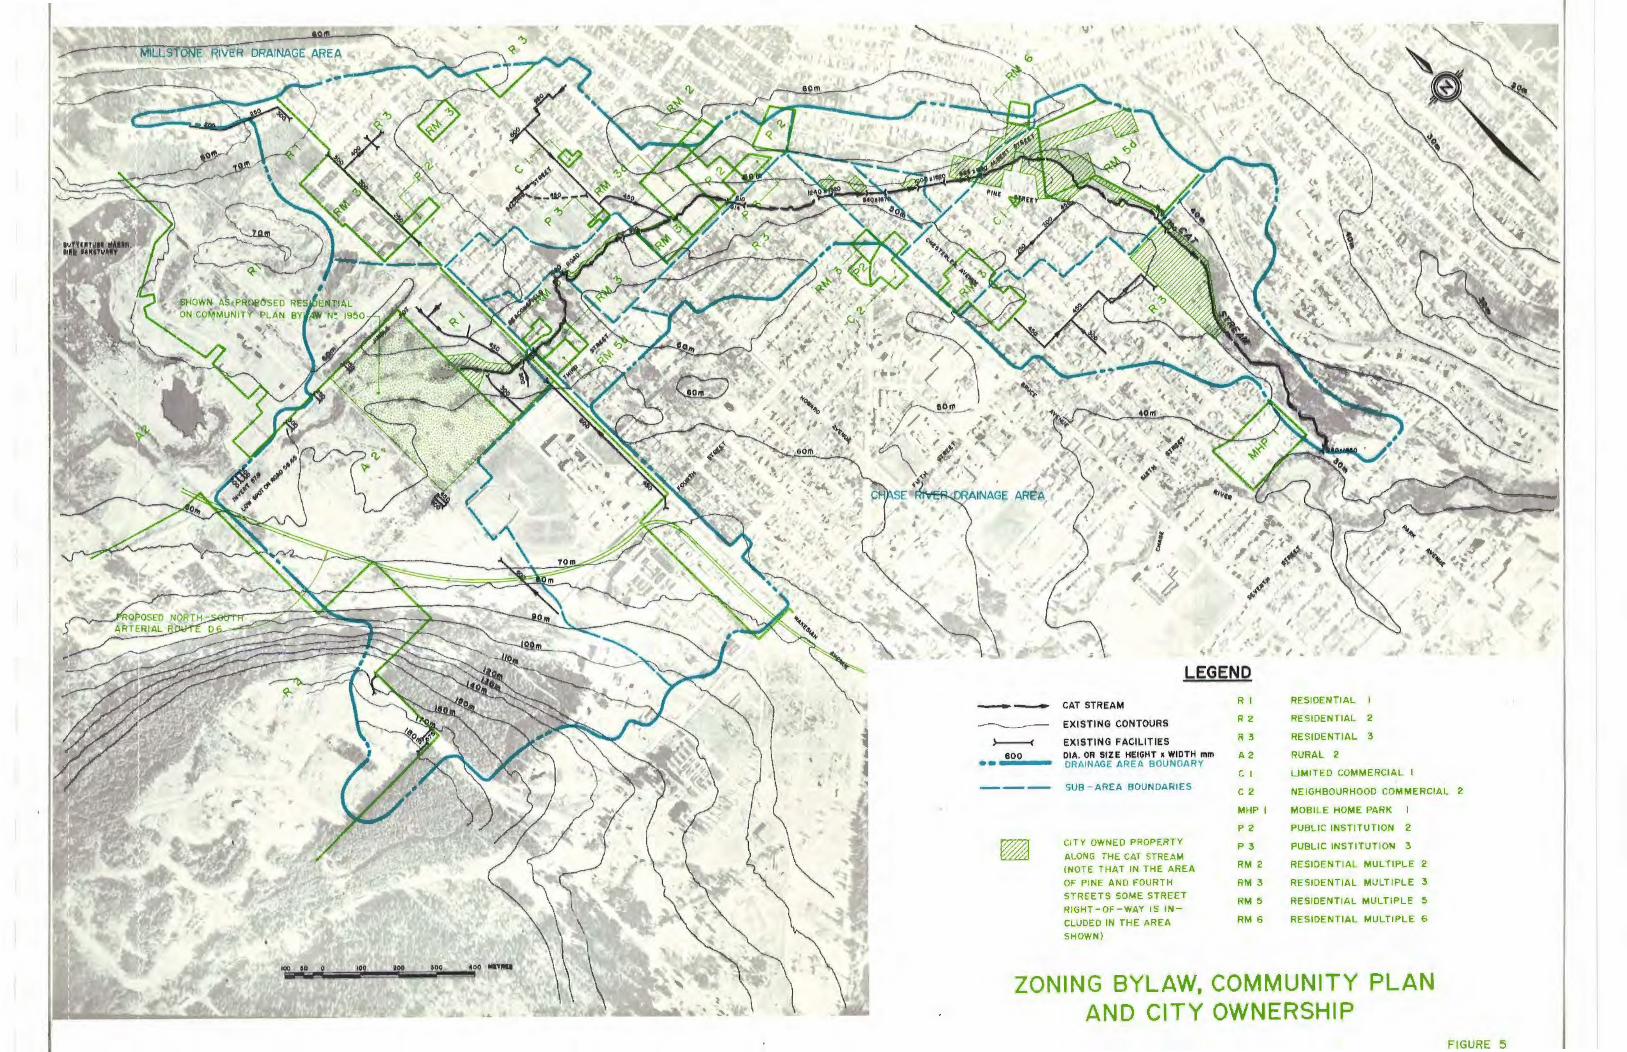
Development of the large area of undeveloped land in the area of the existing pond west of Wakesiah, however, will be crucial to future flows in the creek. As shown on Figure 5 this area is zoned Rural 2 now. The Community Plan, however, shows 10 ha (25 ac.) becoming residential and the rernainder becoming institutional. So there is a potential for 98 ha (180 ac.) of new. residential and institutional development above Wakesiah Avenue.
North-South Arterial. The proposed North-South Arterial Routes D 1, D2, fJ5 and D6--cross the headwaters of the catchment area, in the area of Wakesiah Avenue and Malaspina College. The "preferred" route D6 is shown on Figure 5. The rate of runoff would be increased by the paved surfaces.
Malaspin~ __ College. Malaspina College is located in the headwaters of the catchment area west of Wakesiah Avenue. The Ten Year Facilities Development Plan of the College, dated November 1979, shows development of a wildfowl sanctuary area and arboretum in the undeveloped area to the north of the College. A series of ponds with four control weirs are shown. If these ponds are designed and operated to provide stormwater storage they could significantly reduce peak flows in the Cat Stream. This concept will be discussed in Chapter 5 of this report. This development is awaiting determination of land ownership.
3- 3

,J
INAGE~
- --------->-----< 600
•• ---
LEGEND
CAT STREAM
EXISTING CONTOURS
EXISTI NG FACILITIES DIA. OR SIZE HEIGHT x WIDTH mm DRAINAGE ARE A BOUNDARY
SUB - AREA BOUNDARIES
Rm
Rs
Qls
F
ROUGH MOUNTAINOUS VARIETY OF ROCKS
ROUGH STONY LANDVARIETY OF ROCK MATERIALS
QUALICUM LOAMY SAND,
VERY PERMEABLE
FAIRBRIOGE SILT LOAM TO SILTY CLAY LOAM, VERY PERMEABLE
S SHAWNIGAN GRAVELLY SANOY LOAM, PERMEABLE
C COWl CHAN CLAY LOAM, POORLY DRAINED
,/././ ROCK OUTCROP
SOILS BOUNDARIES
REFERENCE: SOIL SURVEY OF S.E. VANCOUVER ISLAND AND GULF ISLANDS, B. C. BY J. DAY, L. FARSTAD AND D. LAIRD, CANADA DEPARTMENT OF AGRICULTURE.
REPORT No.6 OF THE B. C. SOIL SURVEY 1959.
SOILS
FIGURE 4
LEGEND
-- CAT STREAM
-------- EXISTING CONTOURS
.)-----{ EXISTING FACILITIES
···6·0·0-- OIA. OR SIZE HEIGHT a WIDTH mm DRAINAGE AREA BOUNDARY
Rl
R2
R 3
A2
Cl
RESIDENTIAL I
RESIDENTIAL 2
RESIDENTIAL 3
RURAL 2
U MITED COMMERCIAL I
--- SUB-AREA BOUNDARIES C2 NE IGHBOURHOOD COMMERCIAL 2
CITY OWNED PROPERTY
ALONG THE CAT STREAM (NOTE THAT IN THE AREA OF PINE AND FOURTH STREETS SOME STREET RIGIH-OF-WAY IS INCLUDED IN THE AREA SHOWN)
MHP I
P2
P3
RM 2
RM 3
RM 5
RM 6
MOBILE HOME PARK
PUBLIC INSTITUTION 2
PUBLIC INSTITUTION 3
RESIDENTIAL MULTIPLE 2
RESIDENTIAL MULTIPLE 3
RESIDENTIAL MULTIPLE 5
RESIDENTIAL MULTIPLE 6
ZONING BYLAW, COMMUNITY PLAN AND CITY OWNERSHIP
FIGURE 5
CITY OF NANAIMO
CAT STREAM DRAINAGE STUDY
4. RAINFALL ANALYSIS
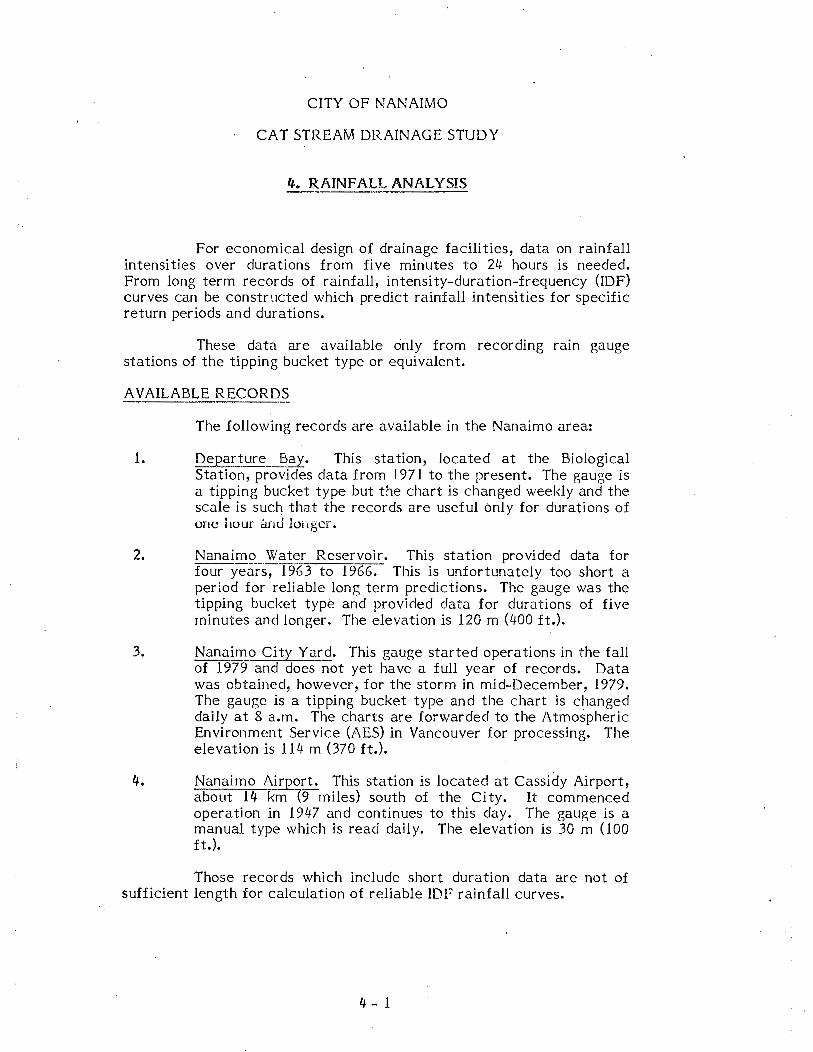
For economical design of drainage facilities, data on rainfall intensities over durations from five minutes to 24 hours is needed. From long term records of rainfall, intensity-duration-frequency (IDF) curves can be constructed which predict rainfall intensities for specific return periods and durations.
These data are available only from recording rain gauge stations of the tipping bucket type or equivalent.
AVAILABLE RECORDS
1.
2.
3.
4.
The following records are available in the Nanaimo area:
Departure Bay. This station, located at the Biological Station, provides data from 1971 to the present. The gauge is a tipping bucket type but the chart is changed weekly and the scale is such that the records are useful only for durations of one i1uur ctnd ll:mger.
Nanaimo Water Reservoir. This station provided data for four years,-1963 to 1966.- This is unfortunately too short a period for reliable long term predictions. The gauge was the tipping bucket type and provided data for durations of five minutes and longer. The elevation is 120 m (400ft.).
Nanaimo City Yard. This gauge started operations in the fall of 1979 and does not yet have a full year of records. Data was obtained, however, for the storm in mid-December, 1979. The gauge is a tipping bucket type and the chart is changed daily at 8 a.m. The charts are forwarded to the Atmospheric Environment Service (AES) in Vancouver for processing. The elevation is 114 m (370 ft.).
Nanaimo Airpcrt. This station is located at Cassidy Airport, about 14 km 9 miles) south of the City. It commenced operation in 1947 and continues to this day. The gauge is a manual type which is read daily. The elevation is 30 m (100 ft.).
Those records which include short duration data are not of sufficient length for calculation of reliable IDF rainfall curves.
4- 1
ELEVATION FACTOR
Studies of rainfall intensities in the Greater Vancouver Area have shown that as elevation increases rainfall intensities increase as well as total annual rainfall. For Greater Vancouver an elevation adjustment factor was developed for rainfall intensity curves which showed that for an elevation of 1200 m (4000 ft.) intensities were greater than at sea level by a factor of 1.6 for a 5 minute duration and 2.3 for a 120 minute duration. Some of the elevation factors for two durations are as follows:
1200 m (4000 ft.)
120 m ( 400ft.)
50 m ( 170 ft.)
5 min. 120 min.
1.6 2.3
1.1 1.3
1.07 1.13
The Nanaimo Water Reservoir gauge was situated at an elevation of about 120 m (400 ft.), while the average elevation In the Catstream basin is 50 m (170 ft.).
The clc\"3.tlcn f2..ctor for Greater \'anccuver may not be completely applicable in Nanaimo but the factor is useful in comparing IDF curves for Vancouver and Nanaimo, which will be done in a subsequent section. The errors introduced by the short term records, however, are probably more significant than the elevation effects.
COMPARISON OF RAINFALL RECORDS
Data from long term recording stations on Vancouver Island and the Greater Vancouver Area was provided by the Atmospheric Environment Service.
Three stations were chosen on the basis of their locati"on with respect to Nanaimo, the availability of records for the four years 1963 to 1966, and availability of analysis for durations down to five minutes. The period 1963 to 1966 was chosen to coincide with the period for which records are available at the Nanaimo Water Reservoir gauge. The stations chosen were:
1. Comox Airport - records are available from 1963 onwards.
2. Victoria Gonzales Heights - records are available from 1925 to 1930, 1937 to 1951, 1953 to the present.
3. Vancouver Airport - records are available from 1953 onwards.
4- 2
These records are continuing. Analysis of these records has been carried out by the A~rnospher:ic Environment Service to the end of 1977.
The Nanairno Water Reservoir records for 1963 to 1966 have been analyzed to provide IDF curves for return periods of 2, 5 and 10 years.
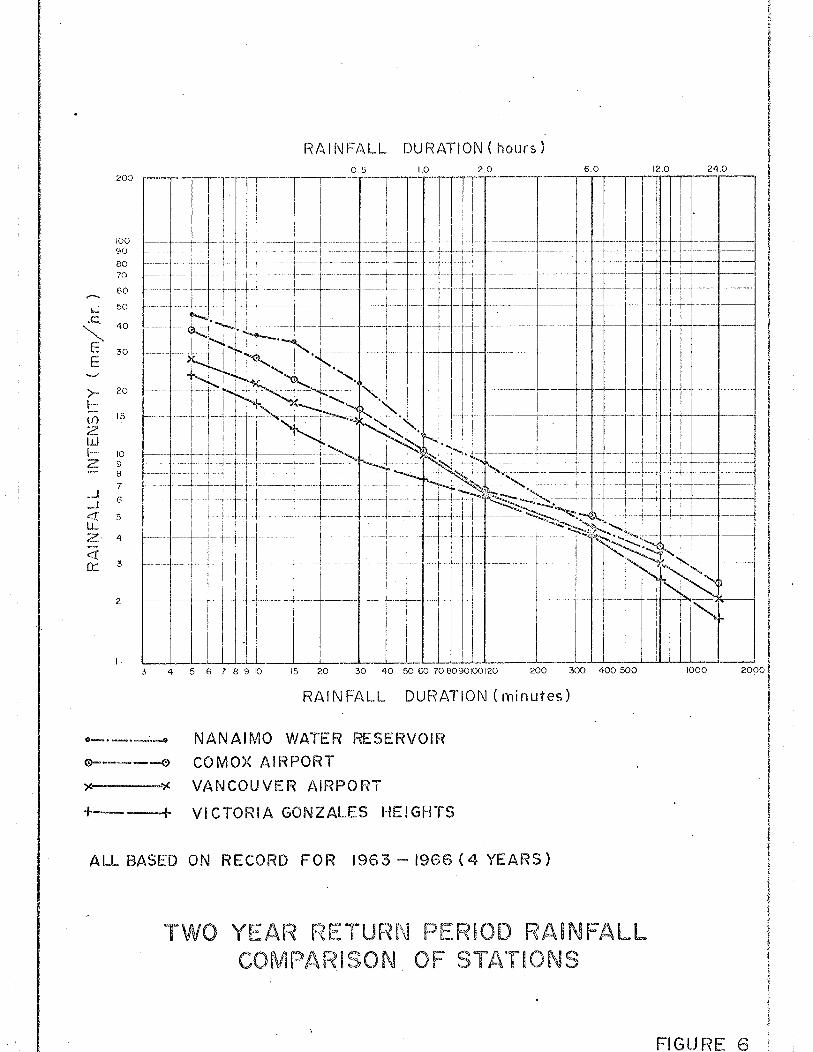
The records for the other three stations were analyzed for this study by Dayton & Knight Ltd. for the 1963 to 1966 period to · provide two year return period curves. These curves were then compared as shown in Figure 6. It can be seen that the highest intensities were recorded at the Nanaimo Water Reservoir, followed by Comox Airport, Vancouver Airport and then Victoria Gonzales Heights.
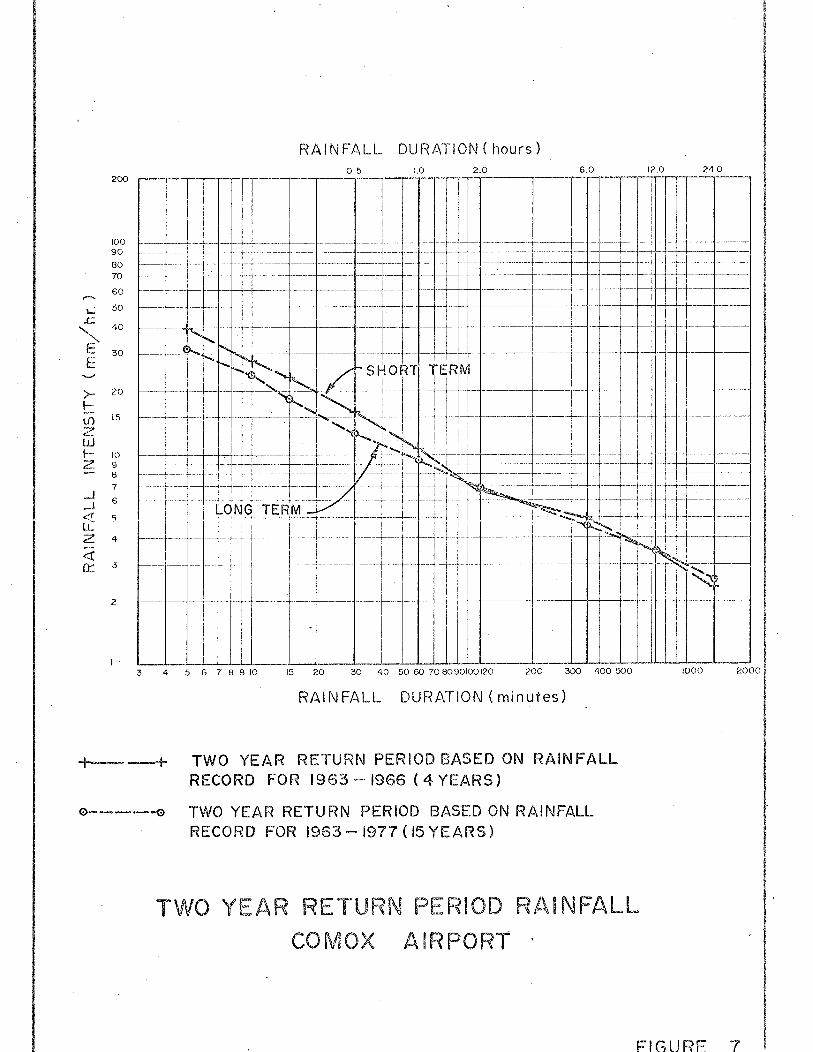
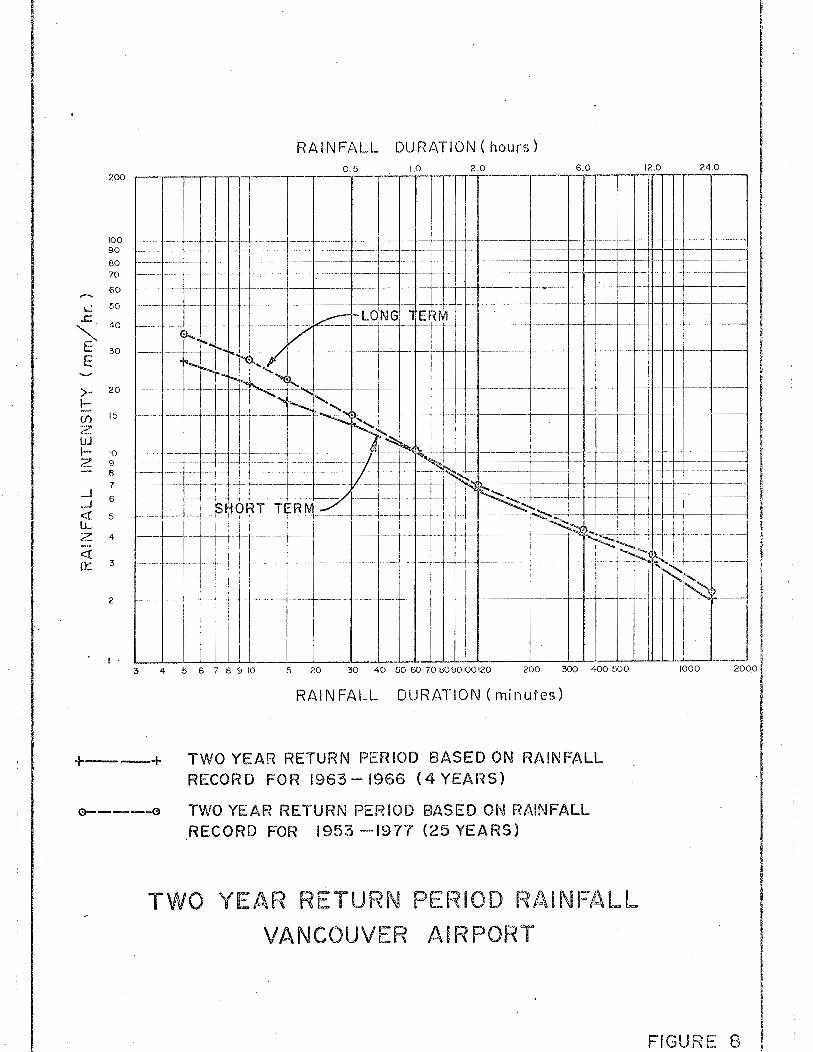
The curves derived from short term records over four years were then compared with the curves derived from the long term records for each station as shown in Figures 7, 8 and 9. It can be seen that the Comox Airport short term curve intensities are higher than the intensities for the long term curve, for durations of one hour or less. For Comox then, if the short run record was used for design, the design
. would be overly conservative. The reverse has occurred for the Vancouver Airport curves, with the long term record providing higher intensities than the short term record.
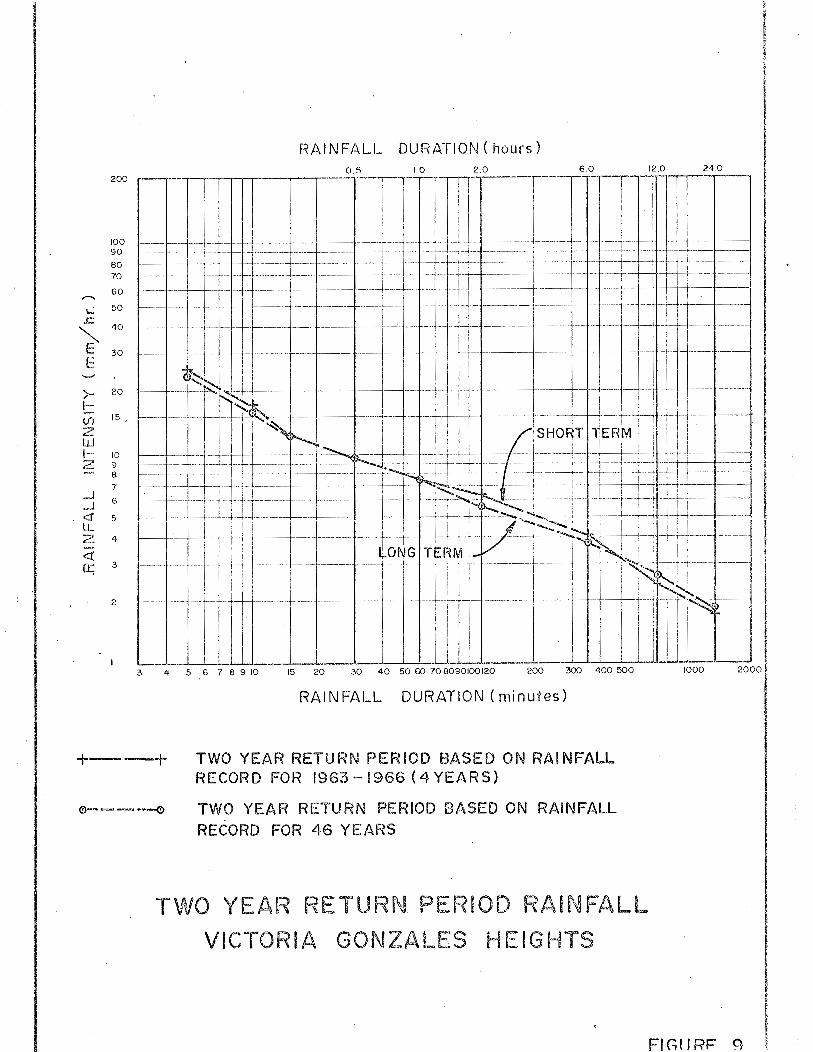
The short term and long term curves for Victoria Gonzales Heights are similar, and intensities are somewhat less than at Vancouver or Comox Airports. It appears, therefore, that the Comox and Vancouver Airport curves are more applicable to Nanaimo than the Victoria Gonzales Heights curve.
Looking at the intensities for a five minute rainfall, the short term figure for Com ox Airport is 39.6 mm/hr, while the long term value is 31.4- mm/hr. The ratio is 39.6/31.4- = 1.26.
If the figure of 4-8.3 mm/hr for the Water Reservoir is reduced by this ratio it becomes 4·8.3/ 1.26 = 38.3 mm/hr. This is similar to the 38.1 mm/hr recorded for the long term record at Vancouver Airport, and appears to be a suitable figure to use.
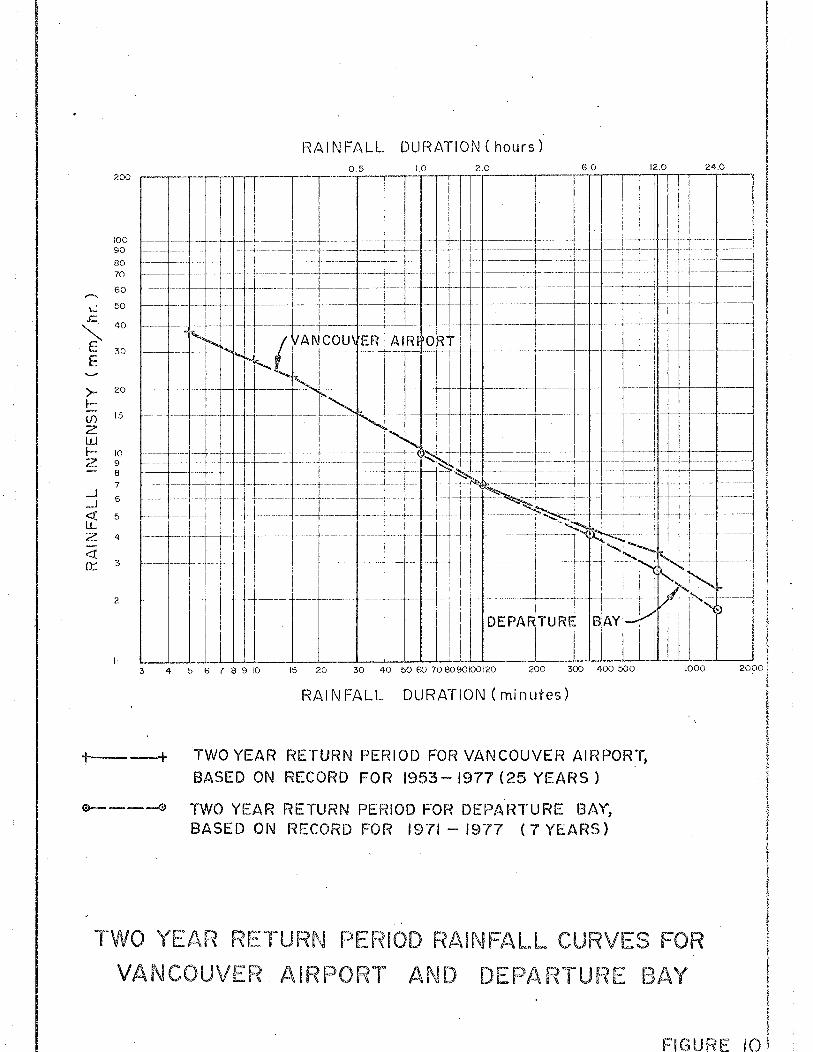
For longer durations the variations are not so great and the Vancouver Airport figure at 24- hours duration appears to be suitable. Figure 10 shows the Departure Bay and Vancouver Airport two year return period curves. The Vancouver Airport curve is conservative when compared with the Departure Bay curve.
The foregoing analysis has been based on a two year return period because it is dangerous to project a long return period from only four years of records. ·
The analysis, therefore, should be repeated every two or three years in order to refine the results and confirm their accuracy.
4-3
DERIVATION OF IDF CU~ VES
The Gumbel procedure as used by the Atmospheric Environment Service was adopted. This is based on the extreme event for each calendar year. In order to derive 5 minute intensities from a four year record the extreme events for each year are arranged in order of magnitude and assigned order numbers 1, 2, 3. and IJ..
For example, for Comox Airport, the four figures provided by, the Atmospheric Environment Service for 5 minute extreme intensities for the years 1963 to 1966 are as follows:
1963 5.1 mm 1961J. 2.0 mm 1965 IJ..l. mm 1966 2.5 mm
These are assigned an order number and the return period for each event is calculated as Tr = (n + 1)/m where n is the number of years of record.
Rainfall in Tr = n+ 1 = .2. 5 minutes m m
Order (m) mm Years
1 5.1 5.0
2 4 .·1 2.5
3 2.5 1.67
4 2.0 1.25
These values are then plotted on Gumbel paper and a straight line fitted to the four points. A programmable calculator was used to determine a least mean squares fit.
The rainfall over 5 minutes for a return period of 2 years was then calculated. It can also be read off the Gumbel plot. This point is then plotted as one point on the IDF curve after converting the rainfall over 5 minutes to an hourly rainfall. In this case the 2 year rainfall figure was 3.3 mm which is 39.6 mrn/hour.
The procedure is then repeated at durations of 10 minutes, 15 minutes, 30 minutes, 1 hour, 2 hours, 6 hours, 12 hours and 24· hours.
Table l. shows the resulting figures.
SEASONAL RAINFALL
Rainfall records for the winter months October to March can .be used to develop a series of IDF curves for the winter season. Similarly, the summer season or all year curves can also be developed.
lj.- lj.
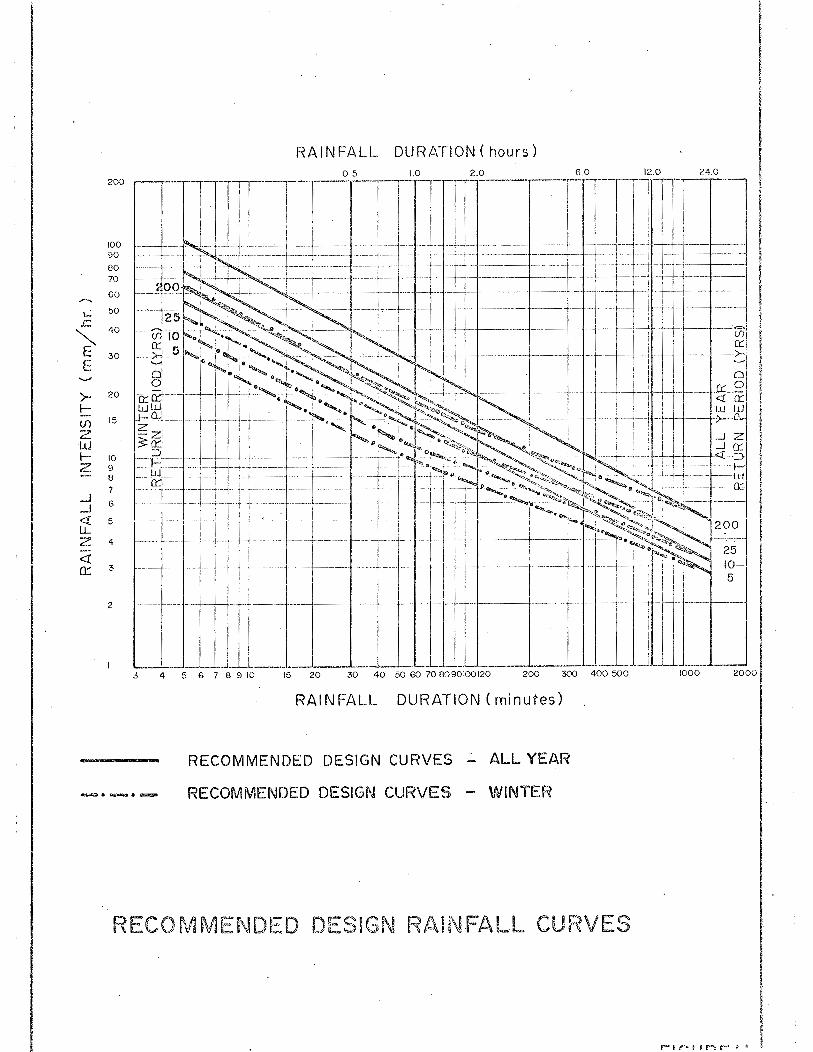
In the Greater Vancouver Area the winter rainfall intensities at short durations are considerably less than either t~e summer intensities or the all year intensities, the latter two being similar, This is illustrated on Figure 11 where the winter intensity for a 25 year, 30 minute storm is 18.5 mm/hr (0.73 in/hr) versus 28 mm/hr (1.1 in/hr) from the all year curve. Reductions in intensities occur for durations up to 24 hours, as shown by the reduction factors listed at the bottom of Table 1.
What this means is that during the winter months low intensity long duration storms prevail which frequently cause saturation of the surface soil and an increased runoff coefficient. In summer, the storms can be of much higher intensity but generally they are of short duration such that ground conditions are not normally saturated.
In the Greater Vancouver Area, the winter rainfall intensity combined with the winter runoff coefficients, because of potential saturated ground conditions, generally result in the highest flows for design purposes.
Without more local data to suggest otherwise, the winter rainfall criteria for Vancouver Airport are judged applicable for the Cat Stream basin.
RECOMMENDED DESIGN CURVES
It is recommended that the design curves for return periods of 5, 10, 25 and 200 years be as shown in Figure 11. These are based on the records at 'v'ai!couver Airport.
Figure 11 shows both winter curves and all yea.r curves. The all year curves will be slightly higher intensity than the summer curves and given the method of derivation they are also considered suitable for use as summer curves.
The recommended curves should be updated when records of sufficient length are available from the City's Works Yard gauge.
In the meantime the City Yard records will be useful for correlating runoff with rainfall.
COMPARISON WITH PREVIOUS DESIGN CURVES
Figure 12 compares the 5 year and 10 year recommended design curves with the previous City Design Curve, the Water Reservoir Curve used in the 1977 drainage study and the 1978 City Manual of Engineering Standards Design Curves.
4- 5
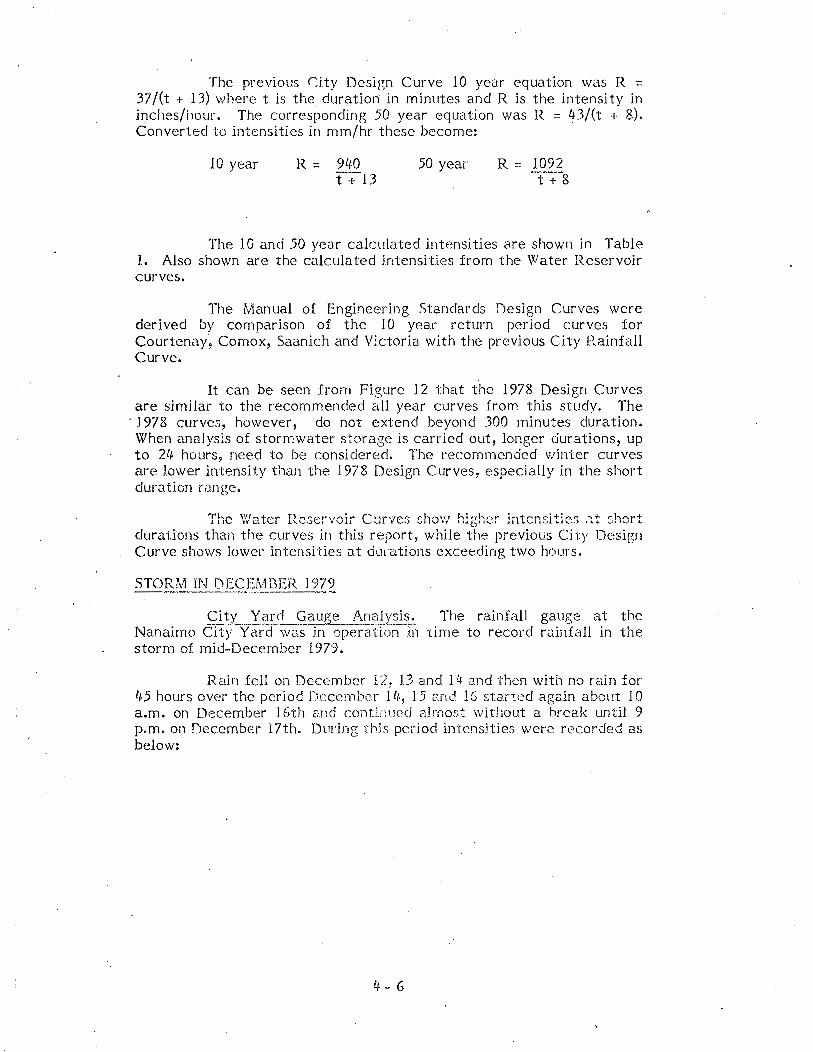
The previous r:ity Desi!';n Curve 10 year equation was R = 37 /(t + 13) where t is the duration in minutes and R is the intensity in inches/hour. The corresponding 50 year equation was R = 43/(t + 8). Converted to intensities in mm/hr these become:
10 year R = 940 t+l3
50 year
The 10 and 50 year calculated intensities are shown in Table 1. Also shown are the calculated intensities from the Water Reservoir curves.
The Manual of Engineering Standards Design Curves were derived by comparison of the 10 year return period curves for Courtenay, Comox, Saanich and Victoria with the pt·evious City Rainfall Curve.
It can be seen from Figure 12 that the 1978 Design Curves are similar to the recommended all year curves from this study. The
· J 978 curves, however, do not extend beyond 300 minutes dura tlon. When analysis of stormwater storage is carried out, longer durations, up to 24 hours, need to be considered. The recommended winter curves are lower intensity than the 1978 Design Curves, especia.lly in the short duratic;n range.
'fhc V/ntcr IZcservoir c~Jrvcs ~hO'vV higher intcnsitie~> c:.t ~hort durations than the curves in this report, while the previous City Design Curve shows lower intensities at ducations exceeding two hours.
STORM IN DECEMBER 1979
s;;.l~y _ _l:~r_c.L_G_~~ge 0-J!..?.lzsis_:_ The rainfall gauge at the Na.nairno City Yard was in operation in time to record rainfall in the storm of mid-December 1979.
Rain fell on Dccernber 12, J3 and liJ. and then with no rain for l~5 hours over the period December ltr, 15 2nd 16 sta.rted again about 10 a.m. on December 16th and contlilued almost without a break until 9 p.m. on December 17th. During tbis pedod intens.ities were recorded as below:
4 .. 6
Return Period in Years.
Duration Hours
.5 minutes 10 minutes 15 minutes 30 minutes
1 hour 2 hours 6 hours
12 hours 24- hours
Based on Vancouver Airport Intensity Figures mm/hoL!E_ All Y~ar RainJall
9.6 less than 2 8.4 less than 2 7.2 less than 2 6.4 less than 2 6.4 less than 2 6.0 less than 2 '+.2 2 3.9 5 3.05 8
Winter Rainfall
less than 2 less than 2 less than 2 less than 2 less than 2
2 4 8 8
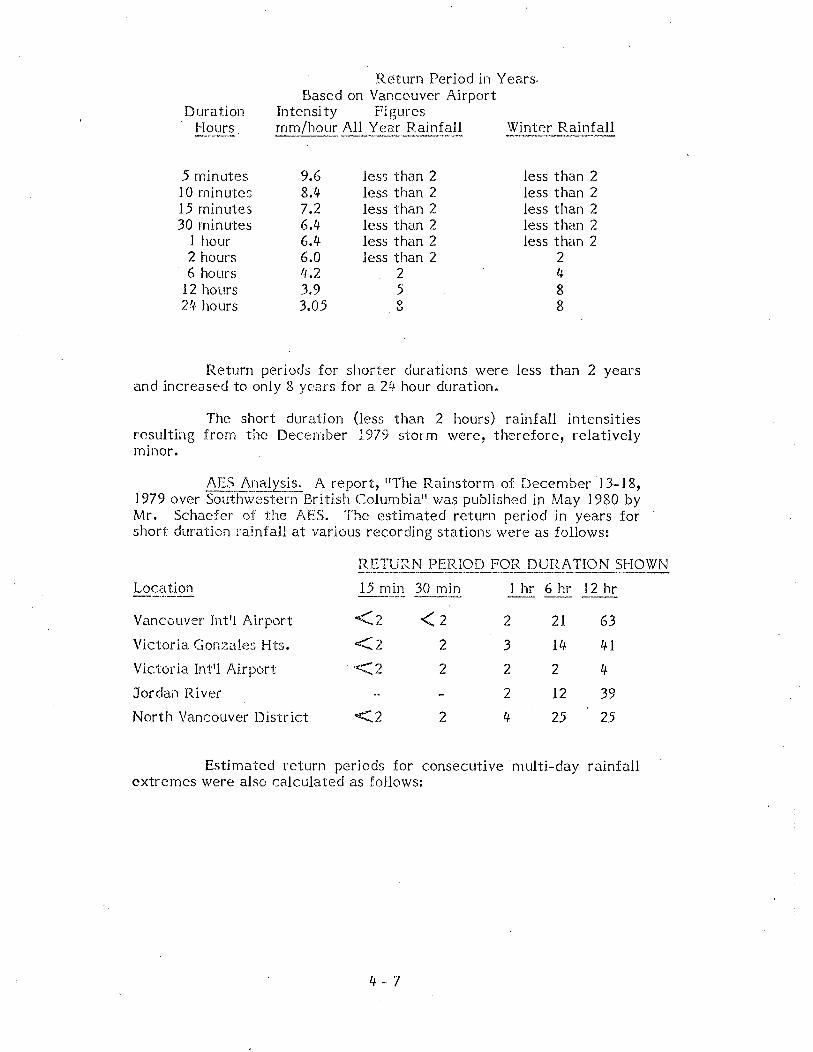
Return periods for shorter durations were less than 2 years and increased to only 8 years for a 24 hour duration.
The short duration (less than 2 hours) rainfall intensities resulting from the Dece1nber 1979 storm were, therefore, relatively minor.
AES Analy~~.: A report, 11The Rainstorm of December 13-18, 1979 over Southwestern British Columbia" was published in May 1980 by Mr. Schaefer oJ the f\E5. The estiniated return period in years for short duration rainfall at various recording stations were as follows:
RE.TURN PERIOD FOR DURATION SHO\VN
Location 15 min 30 min ----·--- ---·-·- --·-·-
Vancouver Int'l Airport <2 <z Victoria Gonzales Hts. <..'"" "> ...... L. 2
Victoria Int'l Airport ·<2 2
Jordan River
North Vancouver District <.2 2
Estimated return periods for consecutive extremes were also calculated as follows:
4 -· 7
1 hr 6 hr 12 hr
2 21 63
3 14 41
2 2 4
2 12 39
4 25 25
multi-day rainfall

II Years Return Period For Duration Shown Location Records Usecf_1 ___ 2 ') 4 5 6 Z days _.1
Vancouver Int'l Airport 33 70 38 29 42 71 70 IJ.5
Victoria Gonzales Hts. 70 57 73 33 25 82 62 48
Victoria Int'l Airport 36 7 9 6 18 62 39 25
Nanaimo Airport 29 11 5 7 21 56 42 22
Jordan River 52 60 29 25 31 73 72 60
Port Alberni 26 9 5 6 3 3 3 4
Comox Airport 32 2 2 3 2 2 2 2
From the AES analysis it is apparent that for durations of less than 1 hour the return period was generally 2 years or less. Heavy showers were not a factor. For duration between 2 and 12 hours, return periods increased rapidly at some stations (Vancouver Int'l Airport = 63 years) but remained low a relatively short distance away (Victoria Int'l Airport = 4 years).
At most stations the storm reached its greatest return period after several days of continuous rainfall. For example, at Vancouver International Airport the return period after 5 days of rain was 71 years and at Nanaimo Airport it was 56 years after the same duration. Again the storm was area sensitive in that Comox and Alberni were less than 10 year return periods.
ln summary, the December storm did not produce high short duration rainfall intensities, however, multi-day extremes exceeding 60 year return periods occurred.
Creek Measurements. During this storm, water levels at critical points along the Cat Stream were recorded so that the runoff could be correlated with rainfall as a check on the assumptions made in design.
Peak levels were reported to have occurred on the morning of December 17th. Chapter 5 of this report deals with correlation of this rainfall to stream flow.
4-8
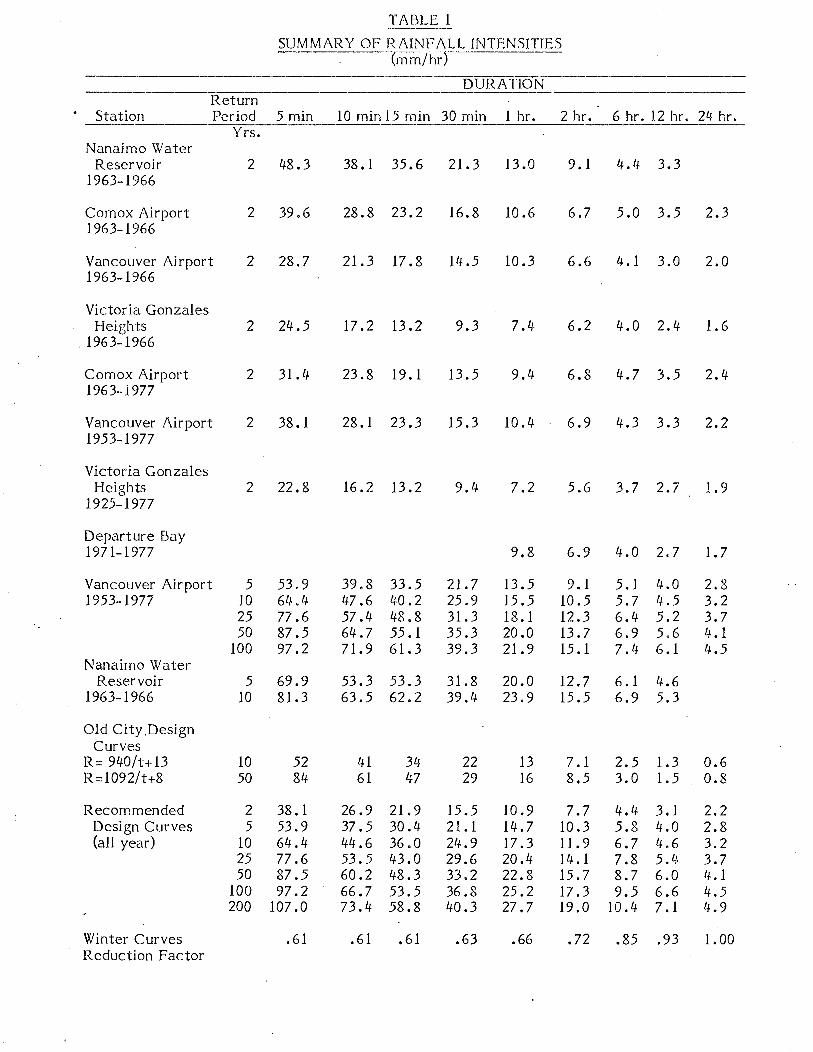
TABLE 1
SUMMARY OF RAINFALL INTENSITIES -Trnm/hr)
---· DURATION Return
Station Period 5 min 10 min 1.5 min 30 min 1 hr. 2 hr. 6 hr. 12 hr. 24 hr. Yrs.
Nanaimo Water Reservoir 2 48.3 38.1 35.6 21.3 13.0 9.1 4.4 3.3
1963-1966
Comox Airport 2 39.6 28.8 23.2 16.8 10.6 6.7 5.0 3.5 2.3 1963-1966
Vancouver Airport 2 28.7 21.3 17.8 14.5 10.3 6.6 4.1 3.0 2.0 1963-1966
Victoria Gonzales Heights 2 24.5 17.2 13.2 9.3 7. 4· 6.2 4.0 2.4 1.6
1963-1966
Comox Airport 2 31.4 23.8 19. 1 13.5 9.4 6.8 4.7 3.5 2.4 1963-1977
Vancouver Airport 2 38.1 28.1 23.3 15.3 10.4 6.9 4.3 3.3 2.2 1953-1977
Victoria Gonzales Heights 2 22.8 16.2 13.2 9.4 7.2 5.6 3.7 2.7 1.9
1925-1977
Departure Bay 1971-1977 9.8 6.9 4.0 2.7 1.7
Vancouver Airport 5 53.9 39.8 33.5 21.7 13.5 9. 1 5.1 4.0 2.8 1953--1977 10 64.4 47.6 40.2 25.9 15.5 10.5 5.7 14.5 3.2
25 77.6 57.4 48.8 31.3 18.1 12.3 6.4 5.2 3.7 50 87.5 64.7 55.1 35.3 20.0 13.7 6.9 5.6 lt,l
100 97.2 71.9 61.3 39.3 21.9 15.1 7.4 6.1 4.5 Nanaimo Water
Reservoir 5 69.9 53.3 53.3 31.8 20.0 12.7 6.1 4.6 1963--1966 10 81.3 63.5 62.2 39.4 23.9 15.5 6.9 5.3
Old City.Design Curves
R= 940/t+l3 10 52 41 34 22 13 7.1 2.5 1.3 0.6 R=l092/t+8 50 84 61 47 29 16 8.5 3.0 1.5 0.8
Recommended 2 38.1 26.9 21.9 15.5 10.9 7.7 4.4 3.1 2.2 Design Curves 5 53.9 37.5 30.4 21.1 14.7 10.3 5.8 4.0 2.8 (all year) 10 64.4 44.6 36.0 24.9 17.3 11.9 6.7 4.6 3.2
25 77.6 53.5 43.0 29.6 20.4 14.1 7.8 5 .4· 3.7 50 87.5 60.2 48.3 33.2 22.8 15.7 8.7 6.0 4.1
100 97.2 66.7 53.5 36.8 25.2 17.3 9.5 6.6 4.5 200 107.0 73.4 58.8 40.3 27.7 19.0 10.4 7 .1 4.9
Winter Curves .61 .61 .61 .63 .66 .72 .85 .93 1. 00 Reduction Factor
100 90 80 70
60
L 50
.c. 40
"" E 3o E
2
I
RAII\IFALL DURATION (minutes)
•-·-·-· . .- NANAIMO WATER RESERVOIR
0--~--0 COMOX AIRPORT
~ 'l< VANCOUVER AIRPORT
+----+ VICTORIA GONZALES HEIGHTS
ALL BASED ON RECORD FOR 1963- 1966 ( 4 YEARS)
TWO YEAR RETURN PERIOD RA~NFALL CO~v1PARISON OF STATIONS
FIGURE 6
F~AINF/\U_ DURATION (hours)
3 4 5 G 7 8 9 10
-t --+ TWO YEAR RETURN PERIOD BASED ON RAINFALL RECORD FOR 1963- 1966 { 4 YEARS)
0-----0 TWO YEAR RETURN PERIOD BASED ON RAINFALL RECORD FOR 1963- 1977 ( 15 YEARS)
TWO YEAR RETURN PERIOD RAINFALL
CO~~OX AIRPORr ·
I I
I. I I
100 90
80 70
60
....; 50 -z 40
E 3o
E
>- 20
~-tn Is
C! IJJ f- 10 z 9
8 7
_j 6 . ..J <( 5 LL z . 4
<! et: 3
2
RAINFALL DURATION (hours) 05 2.0 6.0
3 4 5 6 7 8 9 10 15 20 30 40 50 60 70 8090100120
RAINFALL DURATION (minutes)
+--+ TWO YEAR RETURN PERIOD BASED ON RAINFALL RECORD FOR 1963-1966 (4YEARS)
0-----0 TWO YEAR RETURN PERIOD BASED ON RAINFALL RECORD FOR 1953 -1977 (25 YEARS)
TWO YEAf~ RETURN PERIOD RAINF~~LL
VANCOUVER AIRPORT
24.0
1000 200.0
FIGURE 8
HAINF/~LL DURATION (hours) 0.5
200
I. 3 4 5 6 7 8 9 10 15 20 30 40 50 60 70 8090100120 200 300 400 500
RAIN FALL DURATION (minutes)
+--+ . TWO YEAR RETURN PERIOD BASED ON RAINFALL RECORD FOR 1963-1966 (4YEARS)
0-----<'> TWO YEAR RETURN PERIOD BASED ON RAINFALL RECORD FOR 46 YEARS
TWO YEAR RETURN PERIOD RAINFALL
VICTORIA GONZALES HEIGHTS
I 1000 20001
FIGURE 9
RAIN FALL DURATION (hours)
200 ,.--,-----flT1!rJ_o.?. _____ l T,o 1r r'Tf 'lllf"ol ~6' -~ ~J:l-t: ~~~:~ ~~~~-~-:-~~~ ~=J=~- -lt-1-J =~::::~:- ~- ~ :-_ ~ L.LJ:J ~ :j:t·~-- - ::1 80 -ro
~ :: , -~F'-fF~AJciu,;RtR~ o~r,t---~=-=f-~ !fr~-=:! , - I "~trr- - 1 +- r 1r - ·- -- +~1~H ---[': ' 0 ,_ , -t+ ~- -- T_l_ T f Ti- ----t- ---- ---- - I f\ #f- -- ---~ 15 ~ - -~ ----( l----- -~~J- -~ 1 r! - T-- -- iri+H -w I I i'o... ' . I ' ! Ill f- 10 z 9
8
-' 6 -' <f 5 lL z 4
<! o:::: 3
' : : ' i I j 1 I I I l : --....;;: ' 1 l 1_ -~~----~--- -- ~~R- :-q--~ --t~ --- ~- - ~ r 11 . - -___ , ____ ~-~ , I,: 1- -· + :!
~ ~ -- -- -- - i ! j 1 - ! - -l ~-- t t j f -~ -~~ J -~- --- ~ -I I I : I I I ; ' I I I I I
'I II ! I II I I ~
I I I
3 4 5 6 7 8 9 10 15 20 30 40 50 60 70 8090100120 200 300 400 500 1000 2000 ~
t--+
0-·----0
RAINFALL DURATION (minutes)
TWO YEAR RETURN PERIOD FOR VANCOUVER AIRPORT,
BASED ON RECORD FOR 1953- 1977 (25 YEARS)
TWO YEAR RETURN PE!~IOD FOR DEPARTURE BAY, BASED ON RECORD FOR 1971 - 1977 ( 7 YEARS)
T\NO YEAR RETURN PERIOD RAINFALL CURVES FOR
VANCOUVEF{ AIRPORT AND DEPAHTURE BAY
. I
I I I
I I I I I I
FIGUR.· I.
200
100 90
eo 70
60 --~ ~-; 50 .c
""' 40
E 30 E ~
>- 20
1-(f) 15
z I.JJ 1- 10 z 9
13
7 _j 6 _j
<! ~ lL z 4
<r 0:: 3
2
RAINFALL DURATION (minutes)
RECOMMENDED DESIGN CURVES - ALL YEAR
RECOMMENDED DESIGN CURVES - WINTER
RECO~v1MENDED DESiGN RAINFALL CURVES

'.
100 90
eo 70
60
t.: 50 .t::
--~ 40
E: 30
E <
..,....,
>- 20
1-U) 15
;::: li.J ~·- 10 ;?."~. 9
8
7 _.J 6 _j
<J: 5 lL
2
RAINFALL DURATION (minutes)
- •- "- RECOMMENDED DESIGN CURVES- WINTER
RECOMMENDED DESIGN CURVES- ALL YEi:!oR
)<- ><. WATER RESERVOIR CURVES
PRESENT CITY STANDt%RDS
PREVIOUS CITY DESIGN CURVE R= 9 40_ t + 13
COI\r1PARISON OF DES~GN f~A!NF.~\LL CURVES
F!GUF~E f2

CITY OF NAI".J/-\IMO
CAT STREAM DRAINAGE STUDY
5. DESY.GN CRITERIA
This Chapter reviews current City design criteria, comments .. on factors affecting drainage, discusses an alternate method for calculating flows, comments on drainage policies and recommends criteria to be used for preliminary design of improvements for this study.
CURRENT DESIGN CRITERIA
Design criteria for storm sewers in the City 11 Manual of Engineering Standards and Specifications" dated August, 1978 are based on use of the rational method. Alternative design methods are allowed if approved by the Engineer. In the Rational Method:
. where Q= Q I
A c
CIA is storm runoff flow in c.f.s. is the rainfall intensity in inches per hour from the IDF curves. is the area of the contributing catchment in acres. is the runoff coefficient.
Inlet times are not to exceed 10 rninutes. Return periods are specified as 5 years for lateral sewersj 10 years for trunk sewers and 25 years for a watercourse or integral culvert within the length of a watercourse.
Runoff coefficients are specified as follows:
.IYpe of Develo2_ment City business are-as City dense residential Rural Areas Parks, golf courses
RUNOFF COEFFICIENT
Coefficient 0.65 to 0.9(f 0.50 to 0.80 0.35 to 0.55 0.10 to 0.35
The determination of a runoff coefficient is the most crucial part of design by the rational method. The rainfall intensity and the area are generally well defined but the runoff coefficient is not. Normally the runoff is lower in the summer months when the probability of saturated ground conditions is .!ow and the rainfall is generally of short duration. The runoff coefficient increases with prolonged rainfall. Flow measurements in the City of Vancouver have shown coefficients as high as 0.8L~ during winter months for residential areas and on one occasion, in which a heavy snowfall was follo\ved by a rise in temperature and rainfall, a runoff coefficient of 1.1 was measured in ·the Still Creek drainage area.
5- 1
For this study, .1n estimate was made for each subarea 1 of the percentage of impervious area, that is paved roads, driveways and roofs which are directly connected, and for these a .coefficient of 1.0 was used. For the remaining mainly grassed area a coefficient of O.l~ was used. This resulted in a average coefficient for residential areas of approximately 0.6, which is within the range of coefficients currently in use by the City. The O.lt for grassed areas, however, is higher than the range of 0.1 to 0.35 currently specified.
These coefficients were then used to calculate flows. Later the coefficients were modified to higher values when the coefficients were re-estimated from field measurements. This will be discussed in a subsequent section.
STORAGE
Storage occurs naturally both in the channel and in low lying areas along the Cat Stream. The water stored in the paneling areas eventually flows down the creek but the delay while it is retained in the ponds means that the peak rate of streamflow is reduced.
Peak rates of flow in the creek can be decreased by providing additional storage. In order to calculate storage requirements quickly under a number of different conditions, a computer program utilizing a hydrograph design method can be used.
A number of computer models have been developed recently, each with advarttages, disadvantages and peculiai"ities. The !LLUDAS model described hereafter is available locally and enables storage and flow calculations to be carried out readily.
ILLUDAS COMPUTER PROGRAM
The Illinois Urban Drainage Area Simulator, ILLUDAS, was developed by the Illinois State \Vater Survey. The Water Survey conducted a literature search of urban runoff and found that the design method developed by the British Road Research Laboratory (RRL) and used successfully in Britain was promising. The RRL method was tested in the United States on basins in 10 cities. Runoff from paved areas was accurately predicted but the method could not be used for all urban basins unless a grassed-area component was added. The ILLUDAS program was then developed using the RRL method for paved surfaces and adding a grassed area component. This was done by taking water storage in the soil and soil categories into account.
Th~ program predicts runoff from these two components, paved areas and grassed areas, using a design storm of any chosen length and predicts rates of flow taking pipe or channel storage into account. ·
Processing for this study was carried out at the University of British Columbia Computing Centre, and some 50 computer runs were made using the ILLUDAS model.
5-2
The proper duration for a design storm must "be chosen, the critical duration being the one which causes the greatest rate of flow and/or requirement for storage at a particular point. The critical duration varies with size of catchment area, the storage requirements, the rainfall pattern and will be different at different points on the creek. Studies using ILLUDAS have shown that one hour may be used as the critical duration for a wide range of basin sizes when storage Is not considered. With storage, critical durations increase and longer dura-· tions govern for the Cat Stream.
CORRELATION OF STREAMFLOW AND RAINFALL
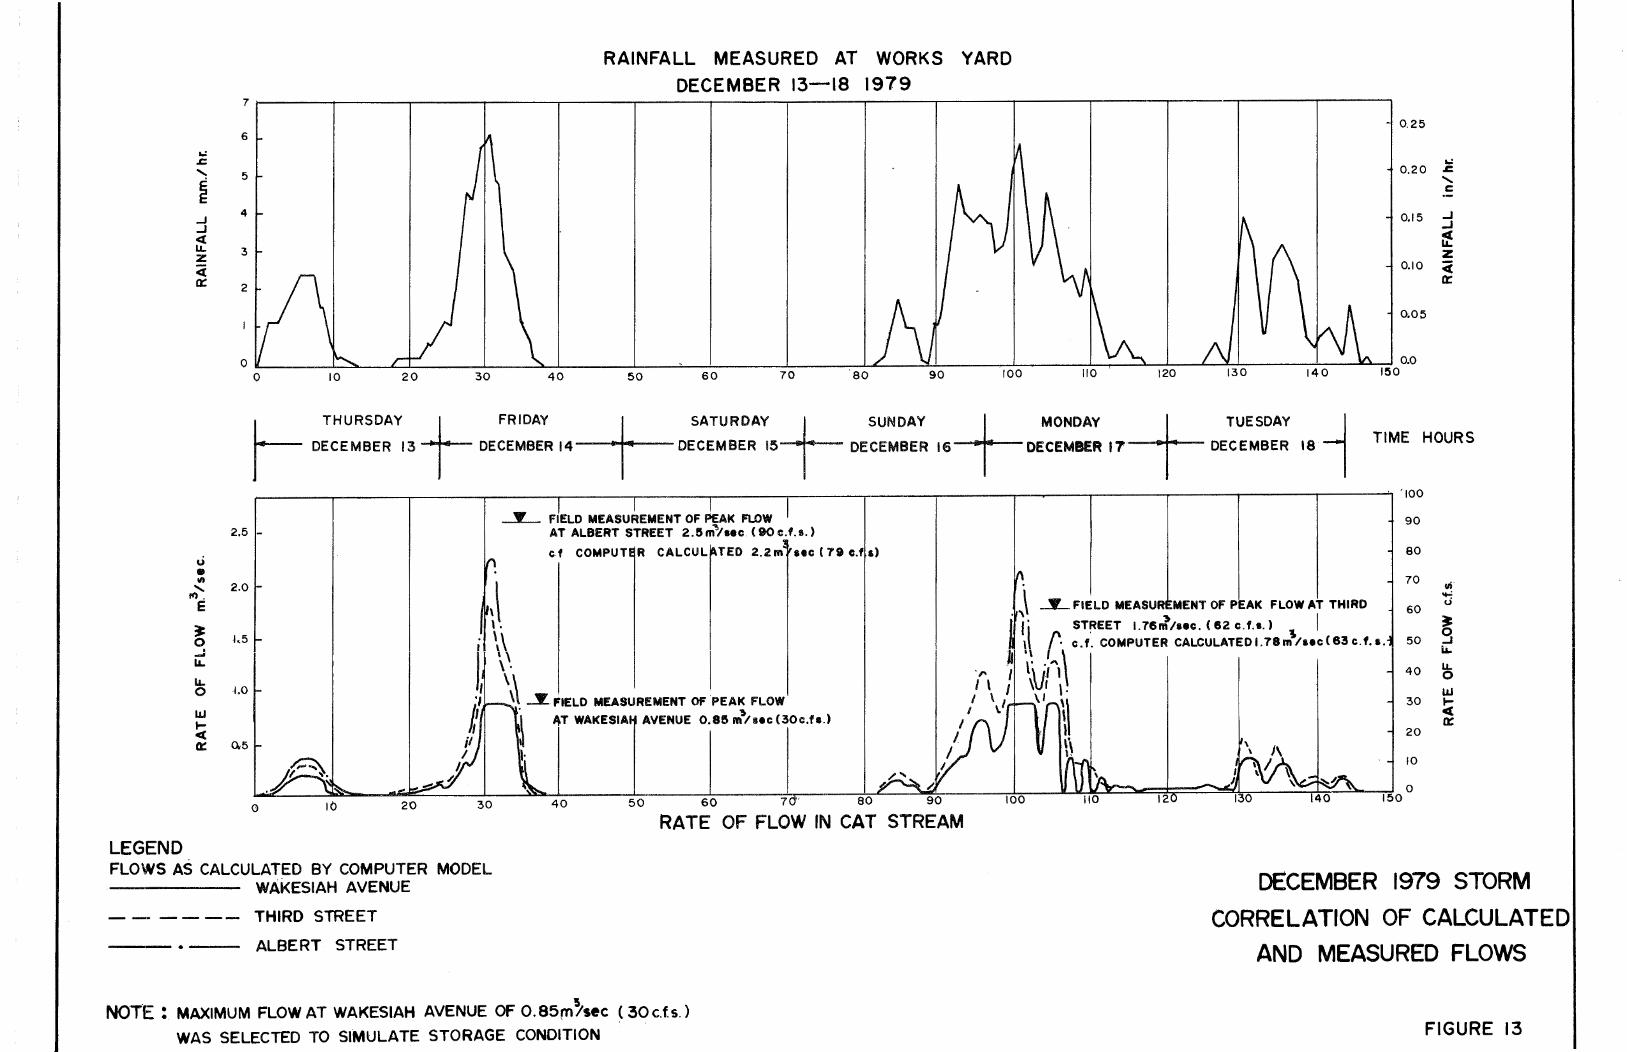
As reported In Chapter lJ., rainfall was recorded for the storm in mid-December, 1979. Water levels were also recorded at some points along the creek and a number of photographs were taken. This enabled the actual flow through cu.lver.ts to be calculated.
The ILLUDAS computer program was used to simulate the storm. The catchment area was divided into sub-areas In order to calculate flow at each culvert.
The ralnfaJl used was that recorded at the Nanaimo City Yard, starting at midnight on the 12-13th December and finishing at 1 a.m. on 19th December, a period of 6 days.
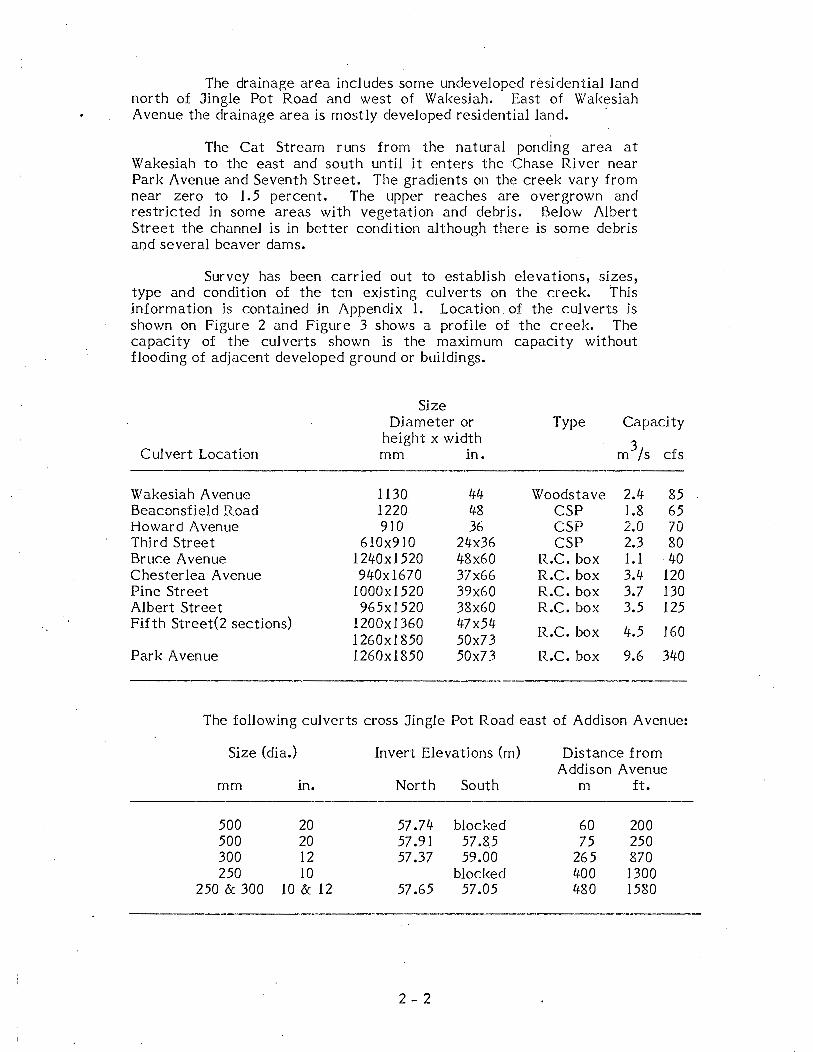
Flows calculated by ILLUDAS are shown on Figure 13 along with selected estimated flows from the field measurements. These flows represent the results of several trial runs that culminated in a reasonable correlation between COlYlputed and measured flows. It was necessary to assume relatively impervious soil conditions to achieve a good correlation.
It is Interesting to note that high flows of almost equal magnitude occurred on Friday, December 14th and on Monday, December 17th.
The effect of storage upstream of Wakesiah in the area of the existing pond was taken into account by asufjing that the culvert at Wakesiah could not discharge more than 0.85 m /s (30 cfs). This is the estimated maximum flow through the culvert with the water levels rneasured during the December storm and with the culvert partly filled with gravel.
The rainfall and flows at Wakesiah Avenue, Third Street and Albert Street are shown on Figure 13. Table 2 shows the estimated and computed flows.
5-3
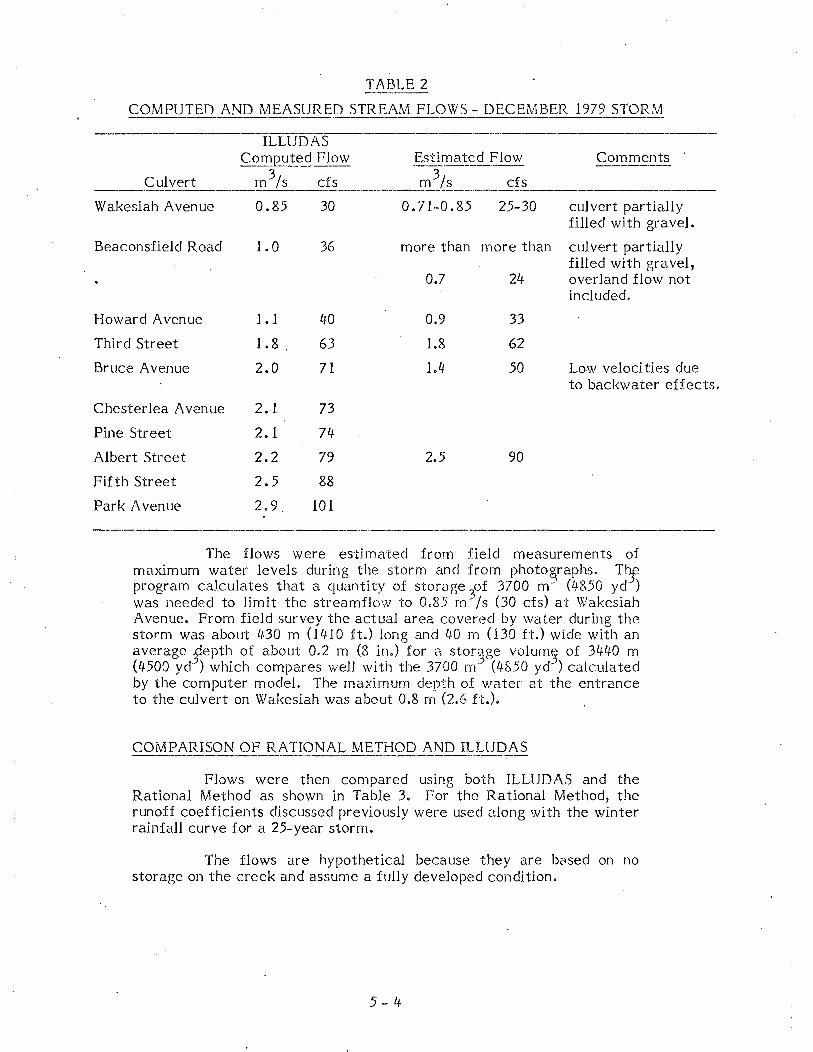
TABLE 2
COMPUTED AND MEASURED STREAM FLOWS- DECEMBER 1979 STORM
------,-· ILLUDAS
Computed Flow Estimated Flow Comments
Culvert m 3/s cfs 3 .,_ ____ f!J..)_ s cfs
Wakesiah Avenue 0.85 30 0. 71--0.85 25-30 culvert partially filled with gravel.
Beaconsfield Road 1.0 36 more than more than culvert partially filled with gravel,
0.7 24 overland flow not included.
Howard A venue 1.1 40 0.9 33
Third Street 1.8 63 1.8 62
Bruce A venue 2.0 71 1.4 50 Low velocities due to backwater effects.
Chesterlea Avenue 2.1 73
Pine Street 2.1 74
Albert Street 2.2 79 2.5 90
Fifth Street 2.5 88
Park Avenue 2.9 101
The flows were estimated from field measurements of maximum water levels during the storm and from photo~raphs. Tl~ program caJ.culates that a quantity of storage
3of 3700 m- (4850 yd )
was needed to limit the streamflow to 0.85 rn /s (30 cfs) at Wakesiah Avenue. From field survey the actual area covered by water during the storm was about 4·30 rn ( 1410 ft.) long and l,(O m ( 130 ft.) wide with an average J~eptt~ of about 0.2 m (8 J'!·) for a. stor~ge ~volum3 of 3440 m (4500 yd ) wh1ch compares well w1th the 3700 rn (40.50 yd ) caJ.culated by the computer model. The maximum depth of water at the entrance to the culvert on Wakesiah was about 0.8 m (2.6 ft.).
COMPARISON OF RATIONAL METHOD AND ILLUDAS
Flows were then compared using both ILLUDAS and the Rational Method as shown in Table 3. For the Rational Method, the runoff coefficients discussed previously were used along with the winter rainfall curve for a 25-year storm.
The flows are hypothetical because they are be'lsed on no storage on the creek and assume a fully developed condition.
5-4
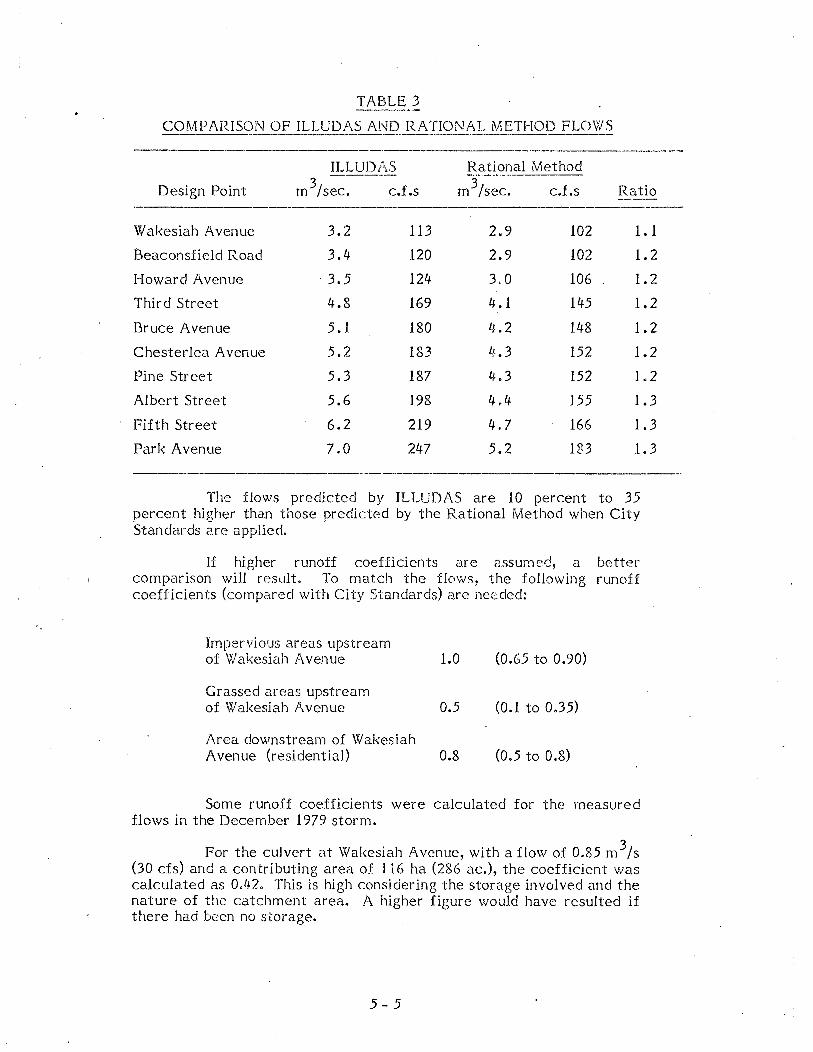
TABLE 3
COMPARISON OF ILLUDAS AND RATIONAL METHOD FLOWS '" ----··-- -
Design Point
W akesiah Avenue
Beaconsfield Road
Howard Avenue
Third Street
Bruce Avenue
Chesterlea Avenue
Pine Street
Albert Street
Fifth Street
Park Avenue
ILLUDAS 3 m /sec. c.f.s
3.2
3.4
. 3.5
4.8
5.1
5.2
5.3
5.6
6.2
7.0
113
120
124
169
180
183
187
198
219
247
Rational Method
m 3/SPC, f. - c. :.s
2.9
2.9
3.0
4.1
4-.2
lr,. 3
I.J.. 3
4.4
4.7
5.2
102
102
106
145
148
152
152
155
166
183
Ratio
1.1
1.2
1.2
1.2
1.2
1.2
1.2
1.3
1.3
1.3
The flows predicted by ILLUDAS are 10 percent to 35 percent higher than those predicted by the Rational Method when City Standards are applied.
If higher runoff coefficients are assumed, a better comparison will result. To match the flows, the following runoff coefficients (compared with City Standards) are needed:
Impervious areas upstream of Wakesiah Avenue 1.0 (0.65 to 0.90)
Grassed areas upstream · of Wakesiah Avenue 0.5 (0.1 to 0.35)
Area downstream of Wakesiah Avenue (residential) 0.8 (0.5 to 0.8)
Some runoff coefficients were calculated for the measured flows in the December 1979 storm.
For the culvert at Wakesiah Avenue, with a flow of 0.85 m3/s (30 cfs) and a contributing area of 116 ha (286 ac.), the coefficient was calculated as 0.42. This is high considering the storage involved and the nature of the catchment area. A higher figure would have resulted if there had been no storage.
5-5
For the ILLUDAS calculated flow of 2.2 rn3 /s (79 cfs) at Albert Street, the runoff coefficient is 0.6 overall and if the flow at Wakesiah Avenue is deducted, along with the contributary area to calculate the runoff coefficient for the area between Wakesiah Avenue and Albert Street culverts, jhe resulting coefficient is 0.81. For the field measured flow of 2.5 rn /s (90 cfs) the coefficient is almost 1.
A good correlation is therefore obtained between the Rational Method and ILLUDAS if the runoff coefficients are increased to the forement.ioned values, which are higher than the~ City Standards, and these higher runoff coefficients are supported by field measurements during the December 1979 storm. Saturated ground after a long wet period is the probable cause for the high runoff coefficients.
CULVERT HYDRAULICS
The flow through culverts is affected by culvert slope, size, the culvert entrance,· the channel approach velocity, the roughness of the culvert wall and the level of the headwater and tail water.
The control of flow in a culvert is either at the inlet or at the outlet. In general inlet control is the most common and occurs when the culvert barrel can carry more flow than can enter the culvert.
With inlet control the flow is dependent on the headwater elevation above the culvert invert at the entrance, the approach velocity, the culvert size and the entrance geometry.
Pending of water at a culvert entrance will increase the discharge slgnifi.cantly. In many cases some ponding is permissable. Care must be taken however to ensure that the embankment or adjacent property ls not endangered.
Culvert hydrauliC calculations in this study have been based on the Handbook of Concrete Pipe Hydraulics published by the Portland Cement Association.
DRAINAGE BASIN POLICIES
There are several problems associated with natural· watercourses in an urban environment that must be recognized in the design stage.
These problems and their effects on design criteria for the Cat Stream Drainage Basin are discussed hereafter.
flood Flow Routing. Present City requirements are to size creek culverts to pass a 25-year return perlod storm flow. This means that a storm in excess of a 25--year return period would theoretically exceed the culvert capacity. The routing and rate of discharge of this excess flow must be considered in drainage planning.
The 100 or 200 year return period should be evaluated for flood flows. The natural channe.l can be used to contain the flow if
5-6
measures such as creek 'vvidening, erosion control,· and overflow channels at roadways are judged feasible. Alternatively, a base flow, say 25-year, can be left in the creek and excess flows routed in a pipeline or alternate channel to the point of discharge. This alternative is generally expensive, but may be necessary in built-up urban areas.
Through storage, the rate of runoff from a flood event can be reduced to a lesser rate of flow to equal the capacity of the creek.
The quantity of runoff to be handled remains the same but the rate of discharge can be reduced by extending the time over which water is discharged to the creek. The more storage that is provided, the lower the rate of discharge will be, The storage can be both on stream or off stream.
The Cat Stream below Wakesic:1h passes through low density development and City owned park land. There is a natural low lying area near Third Street. Upstream of \Vakesiah, the drainage basin is largely undeveloped and a larger natural pond is found just above Wakesiah.
The existing natural storage on the creek, accordingly, is available as a means of restricting the peak rates of flow. Furthermore, the relatively undeveloped state of the land immediately adjacent to the creek rnakes the creek channel a reasonable choice for flood routing,
Erosion. The C:at Stream has an averae:e e:rade of 0.8 oercent between ChaselUver and Wakesiah Avenue, as TnclTcated on F.(gure 3. In addition there are ten culverts at major road crossings along the route.
The combination of the relatively flat grade and the fixed structures at road crossings has served to prevent significant erosion in the bed of the creek.
The creek banks, as observed, are largely covered with a mantle of weeds and brush, and are not unstable.
Erosion in the creek, accordingly, is not a problem and will not be a future problem provided creek velocities are restrained and alignments are kept reasonably uniform. For the reported soil conditions velocities should be kept in the 1.2 to 1.8 m/s (4- to 6 fps) range to prevent excessive erosion. ·
Encroachment. As discussed in Chapter 2 there are several buildings between Flftl1 and Wakeslah that have or have been threatened by flooding in the past, One house near Bruce Avenue is affected by relatively minor storms.
On the whole, however, compared to natural watercourses in other developed municipalities, the problems of encroachment in the Cat Stream Basin are not severe.
5-7
The creek is not built-in to the landscaping of properties as it is in North and West Vancouver; nor are there buildings and patios directly on or along side the creek bed. One foot bridge was noted near Albert Street. ·
Even though the creek flows on private land for most of its route, therefore, encroachment is not a major problem.
Debris. Natural watercourses in an urban environment inevitably become garbage dumps, whether it be grass clippings, leaves, stumps, branches, tires or simply household trash.
There is no other aspect of natural watercourse preservation that is more difficult to control and more harmful to the drainage function.
The majority of drainage problems are caused by debris, and this is true for every municipality and for every natural watercourse that flows through urban developments.
Nanaimo should ensure that it has the necessary authority to ·stop disposal of solid wastes into natural watercourses. Grills and protective works at culvert entrances, if properly designed and maintained, can assist in protecting against culvert blockages, but only if debris is prevented from entering the watercourse will adequate capacity in the creek be maintained.
Fisheries R.eso,,rce, Thirty or forty ye~r<; ago !ittlt'::' i'lttentlon was paid to-the-sn1all naturai watercourses as an integral part of the total fisheries resource. As a result, many of the natural spawning grounds in small creeks have been lost.
In recent years an effort has started to both return and enhance these small creek spawning grounds.
This requires, firstly, that the creek not be conduited throughout its length, and secondly, that erosion, debris and velocities be controlled to within limits.
The Provincial Fish and Wildlife Branch and the Federal Fisheries and Marine Service have joint jurisdiction over fisher1es in spawning creeks. A number of creeks are fish bearing in Nanaimo, including the Cat Stream from the confluence with Chase River to Wakesiah Avenue.
The Fish and Wildlife Branch have advised that there is limited spawning of fish in the Cat Stream but nonetheless it is desirable to protect and increase the resource. Fish hatch in the spring and live in low velocity parts of the creek until the following spring at which time they go to sea.
The Branch would like to see storage provided in the sub·areas before the main creek is t·eached to decrease the rate of runoff and thereby minimize the need to upgrade and change the main channel.
5-8
RAINFALL MEASURED AT WORKS YARD DECEMBER 13-18 1979
7r-----~-------r------~----~------~------~------~----~------~------~-----.------~------~-----,,-----~
..J
..J <l LL z <i et:
140 1!50
0.25
0.20
0.15
0.10
o.os
0.0
a.: ~
' c
..J _, ~ z ~ et:
~ THURSDAY + FRIDAY + SATURDAY + SUNDAY + MONDAY + TUESDAY l DECEMBER 13 DECEMBER 14 DECEMBER 15 DECEMBER 16 DECEMBER 17 DECEMBER 18 1 TIME HOURS
_y_ FIELD MEASUREMENT OF PEAl< FLOW 2.5 - AT ALBERT STREET 2.Sm~/sec (90c.f.s.)
c.f COMPUT R CALCUL TED 2.2m uc ( 78 c.f s) u • .,
...... 2.0 It).
E
~ 0 1,5 ..J LL.
LL. 0 l.O
IJ.I 1-c( a:: Q-5
I.
0 10 20
,\ \.
. \\
t \~. I I 'I \\ _y FIELD MEASUREMENT OF .PEAl< FLOW i' . ~T WAI<ESIA AVENUE 0.8!5 m
11/aec (30c.fs.)
il I
30 40 50 60 7 ' 80
RATE OF FLOW IN CAT STREAM LEGEND FLOWS AS CALCULATED BY COMPUTER MODEL
WAKESIAH AVENUE
---·---THIRD STREET
ALBERT STREET
NOTE: MAXIMUM FLOW AT WAKESIAH AVENUE OF 0.85m7s~c ( 30c.f.s.) '
WAS SELECTED TO SIMULATE STORAGE CONDITION
100
'100
90
80
70
60
50
40
30
20
10
0 150
en ....: u
~ i.i..
LL 0 UJ 1-c( et:
DECEMBER 1979 STORM
CORRELATION OF CALCULATED
AND MEASURED FLOWS
FIGURE 13
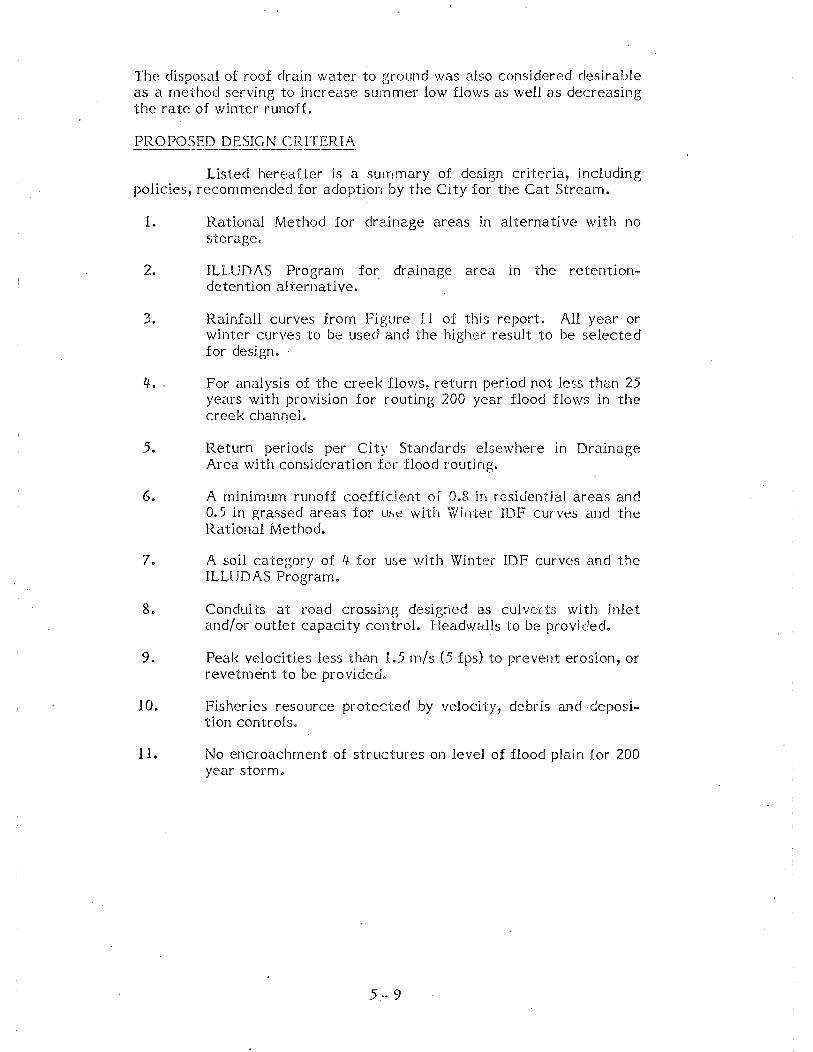
The disposal of roof drain water to ground was also considered desirable as a method serving to increase summer low flows as well as decreasing the rate of winter runoff.
PROPOSED DESIGN CRITERIA
Listed hereafter is a summary of design criteria, including policies, recommended for adoption by the City for the Cat Stream.
1. Rational Method for drainage areas in alternative with no storage.
2. ILLUDAS Program for drainage area m the retentiondetention alternative.
3. Rainfall curves from Figure 11 of this report. AU year or winter curves to be used and the higher result to be selected for design. ·
4. For analysis of the creek flows, return period not less than 25 years with provision for routing 200 year flood flows in the creek channel.
5. Return periods per City Standards elsewhere in Drainage Area with consideration for flood routing.
6. A minimum runoff coefficient of 0.8 in .residential areas and 0.5 in gr.assed areas for us~.c: with Witrter IDF curves and the Rational Method.
7. A soil category of 4 for use with Winter IDF curves and the ILLUDAS Program.
8. Conduits at road crossing designed as culverts with inlet and/ot· outlet capacity control. Headwalls to be provided.
9. Peak velocities less than 1.5 rn/s (5 fps) to prevent eroslon, or revetment to be provided.
10. Fisheries resource protected by velocity, debris and ·deposition controls.
11. No encroachment of structures on level of flood plain for 200 year storm.
5 ... 9
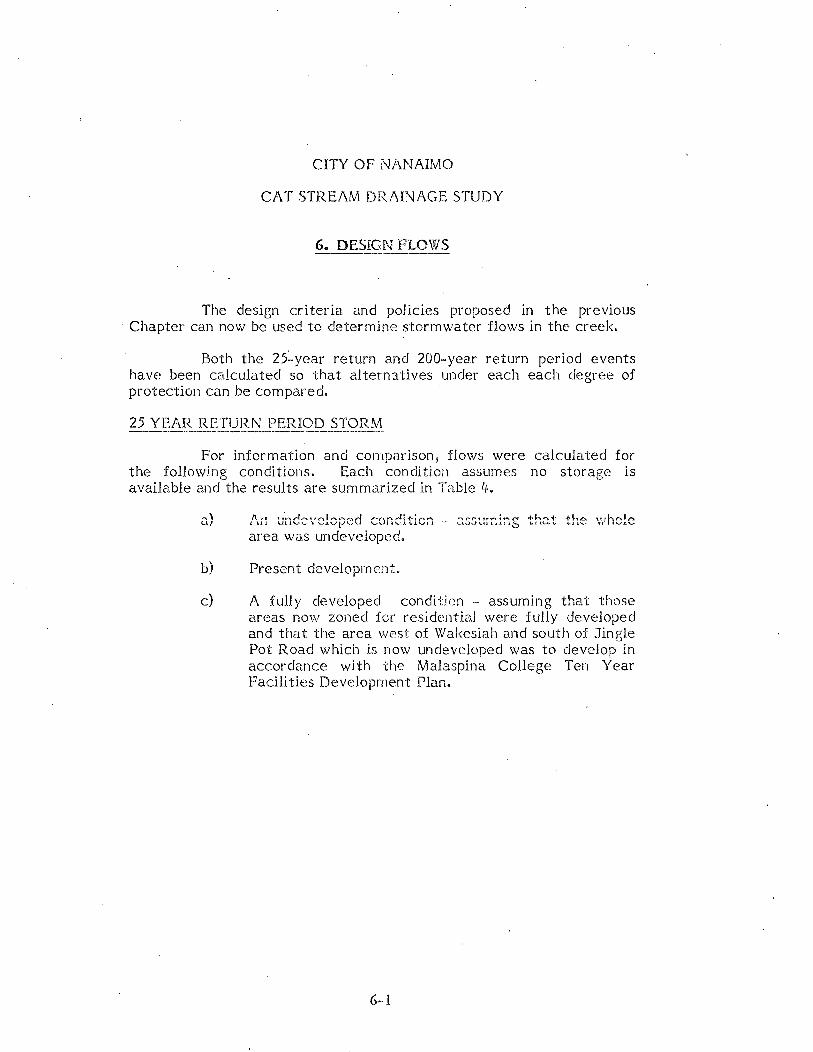
CITY OF N!\NAIMO
CAT STREAM DRAINAGE STUDY
6. DESIGN FLOWS
The design criteria and policies proposed in the previous Chapter can now be used to determine stormwater flows in the creek.
Both the 25:..year return and 200-year return period events have been calculated so that alternatives under each each degree of protection can be compared,
25 YEAR RETURN PERIOD STORM
For information and comparison, flows were calculated for the following conditions. Each condition assumes no storage is available and the results are summari.zecl in Table lJ. •
...... \ 1\v-t ,,·~·-...rf.-..,,ro..f,...t...._':'lrf -ot""'.rl~+;n......_ '""\rC"ttrv-.t,...(T +h"")+ +,.h0- tt.th~!~ UJ ttll '-...!11UV\'"-'.I.Vt.J\._. ..... I \....."-il~J.\.J.VIl ·-· '--I.V~~\.-Illl..lt16 lolH,~'>l~ - •r _....._...,.
area was undeveloped.
b) Present development.
c) A fully developed condition ·- assuming that those areas now zoned foe residential were fully developed and that the area west of Wakesiah and south of Jingle Pot Road which is now undeveloped was to develop in accordance with the Malaspina College Ten Year Facilities Development Plan.
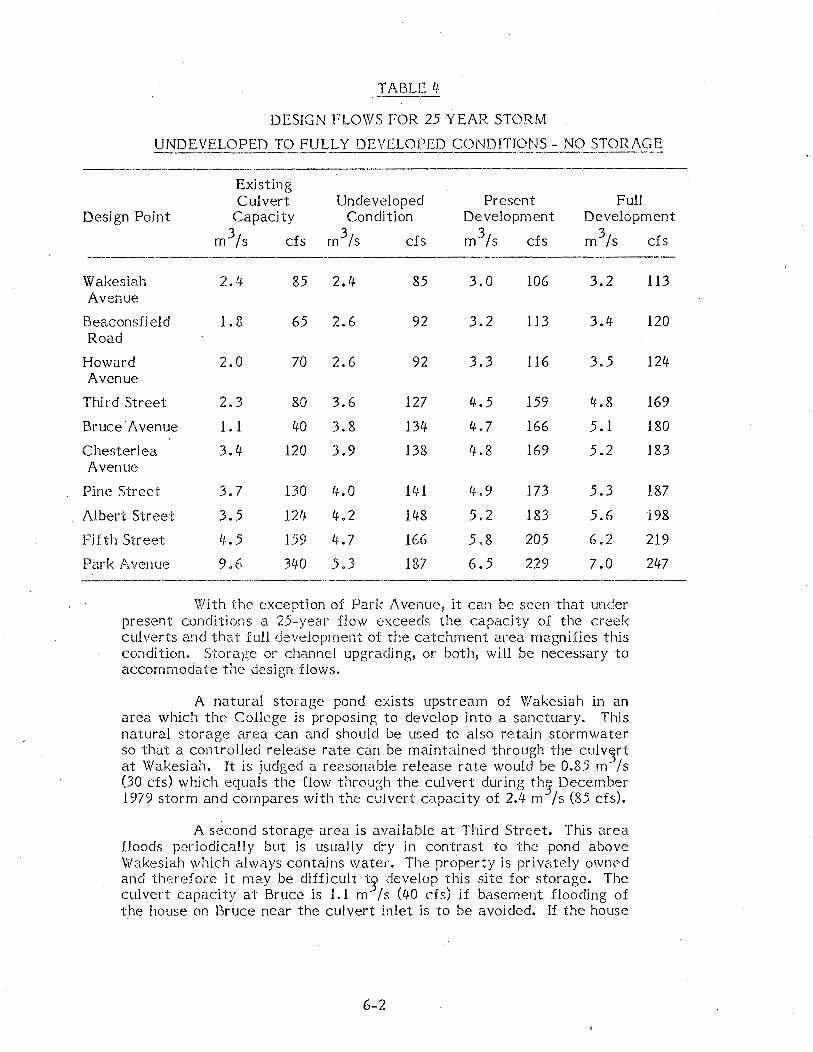
TABLE 4 .------DESIGN FLOWS FOR 25 YEAR STORM
UNDEVELOPED TO FULLY DEVELOPED CONDITIONS- NO STOP-_AGE -·--·---··· ------
----- ---·-·-----------· ·-----------·---Existing Culvert Undeveloped Present Full
Design Point Capacity Condition Development Development
m3/s cfs m3!s cfs m 3/s cfs 3 m /s
-·-----~·~----------·
Wakesiah 2.4 85 2.4 85 3.0 106 3.2 Avenue
Beaconsfield 1.8 65 2.6 92 3.2 113 3.4 Road
Howard 2.0 70 2.6 92 3.3 116 3.5 Avenue
Third Street 2.3 80 3.6 127 4.5 159 4.8
Bruce· A venue 1.1 40 3.8 134 4.7 166 5.1
Chesterlea 3.4 120 3.9 138 lt, 8 169 5.2 Avenue
Pine Street 3.7 130 4.0 141 4.9 173 5.3
Albert Street 3.5 121J 4-.2 148 r:· ? _). ,_ 183 5.6
Fifth Street IJ.,5 159 l~. 7 166 5.8 205 6.2
Park Avenue 9.6 340 5.3 187 6.5 229 7.0 ----·~····-------.~--·-·--·
With the exception of Park Avenue 9 it can be seen that under present conditions a 2.5-year flow exceeds the capacity of the creek culverts and that full development of the catchment area magnifies this condition. Storage or channel upgrading, or both, will be necessary to accommodate the design flows.
A natural storage pond exists upstream of Wakesiah .in an area which the College is proposing to develop into a sanctuary. This natural storage area can and should be used to also retain stormwater so that a controlled release rate can be maintained through the culv3rt at Wakesiah. It is judged a reasonable release rate would be 0.85 m /s (30 cfs) which equals the flow through the culvert during th:5 December 1979 storm and compares with the culvert capacity of 2.l+ m /s (85 cfs).
A second storage area is available at Third Street. This area floods periodically but is usually dry in contrast to the pond above Wakesiah which always contains water. The property is priv<:.-ttely owned and thr::refoce it may be difficult t~ develop this site for storage. The culvert capacity at Bruce is 1.1 rn /s (40 cfs) if basement flooding of the house on Bruce near the culvert inlet is to be avoided. If the house
6-2
cfs
113
120
124
169
180
183
187
198
219
247
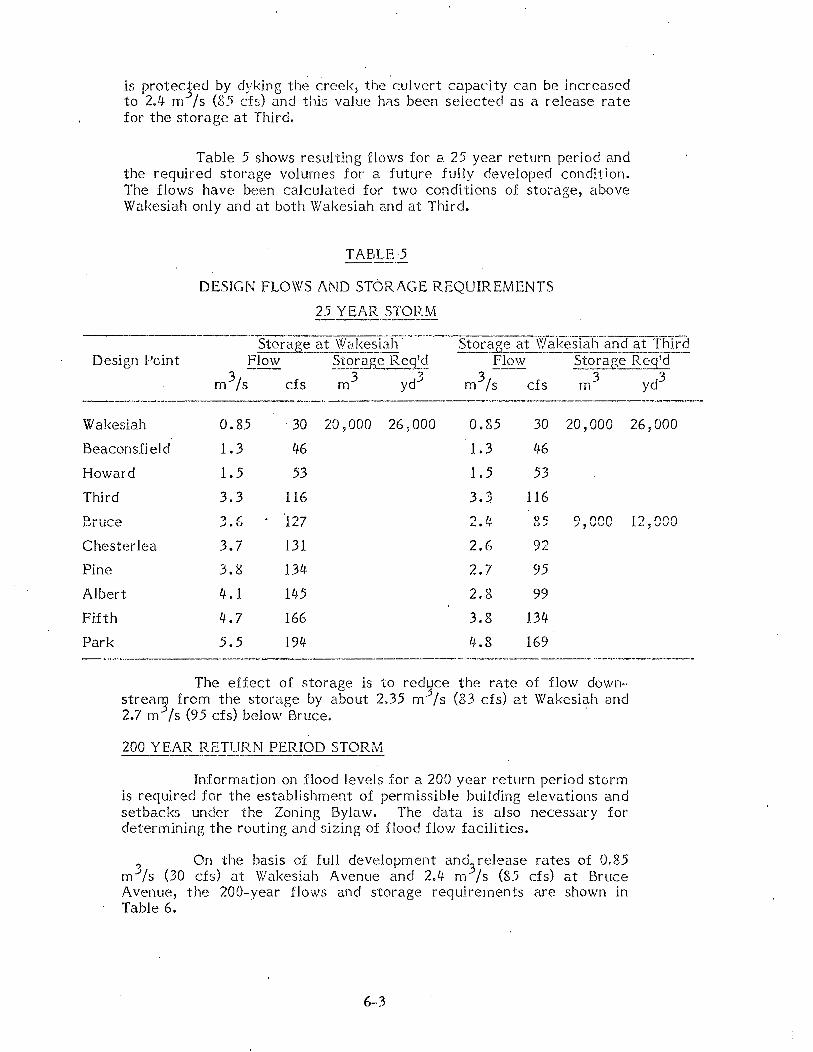
is protec_3ed by dyking the creek, the culvert capacity cari be increased to 2.'+ m /s (85 cfs) and this value has been selected as a release rate for the storage at Third.
Table 5 shows resulting flows for a 25 year return period and the required storage volumes for a future fulJy developed condition. The flows have been calculated for two conditions of stotage, above Wakesiah only and at both Wakesiah and at Third.
TAEKE 5
DESIGN FLOWS AND STORAGE REQUIREMENTS
25 YEAR STORM
··------· _________ ,. ___
Wakesiah 0.85 30 20,000 269000 0.85 30 20,000
Beaconsfield 1.3 46 1.3 46
Howard 1.5 53 1.5 53
Third 3.3 116 3.3. 116
Bruce '2 r:. 127 ') " Qc; a ()()(\ -'•V L.o'T U-' ./,VV\,.1
Chesterlea 3.7 131 2.6 92
Pine 3.8 134· 2.7 95
Albert 4.1 145 2.8 99
Fifth
Park
4.7 166 3.8 134
5.5 194 l?. 8 169
The effect of stotage is to red~ce the rate of flow down.,. strea!J' from the storage by about 2.35 m /s (83 cfs) at Wakesiah and 2.7 m /s (95 cfs) below Bruce.
200 YEAR RETURN PERIOD STORM
Information on flood levels for a 200 year return period storm is required for the establishment of permissible building elevations and setbacks under the Zoning Bylaw. The data is also necessary for determining the routing and sizing of flood flow facilities.
3 On the basis of full development and
3 release rates of 0.85
rn /s (30 cfs) at Wakesiah A venue and 2.lf m /s (85 cfs) at Bruce A venue, the 200-year flows and storage requirements are shown in Table 6.
6-3
26,000
12,000
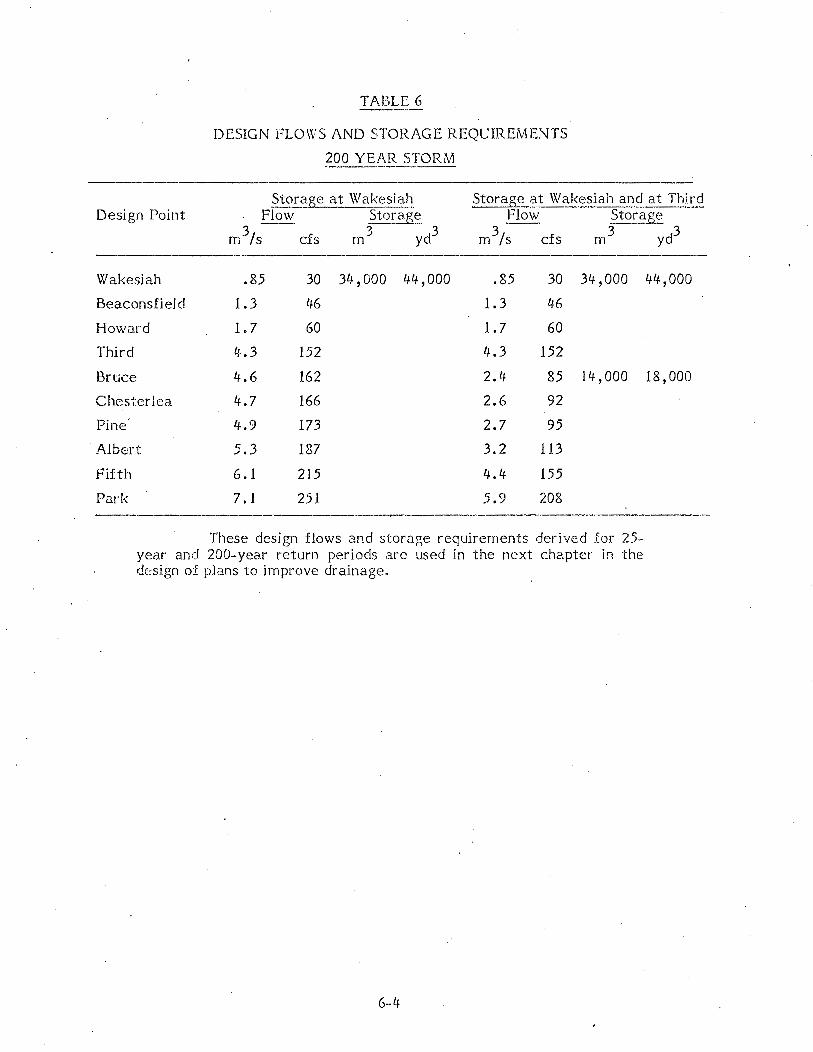
TABLE 6
DESIGN FLOWS AND STORAGE REQUIREMENTS
200 YEAR STORM
Storage at Wakesiah Storage at Wakesiah and at Third Design Point Flow Stor~~ Flow Sto.!:_~E!:.
3-- 3--cfs 3 yd3 cfs 3 yd3 m Is m m Is m
----------Wakesiah .85 30 34,000 4'+ '000 .85 30 34,000 4'+ '000
Beaconsfield 1.3 46 1.3 46
Howard 1.7 60 1.7 60
Third 4.3 152 It, 3 152
Bruce 4.6 162 2.4 85 14,000 18,000
Chester lea 4.7 166 2.6 92
Pine 4.9 173 2.7 95
Albert 5.3 187 3.2 113
Fifth 6.1 215 4.4 155
Park 7.1 251 5.9 208 -~------~·--~-----------
These design flows and storage requirements derived for 25-year and 200-year return periods are used in the next chapter in the design of plans to improve drainage.
6-4
CITY OF .Nl\N/-\IMO
CAT STREAM DRAINAGE STUDY
7. ALTERNATIVES FOR IMPROVEMENTS - .
Preceding chapters have outlined the deficiencies and problems in the existing Cat Stream drainage system, analyzed rainfall and runoff data to produce criteria for design, and established policies for improvements to the existing drainage system.
This chapter summarizes the designs and estimates of cost for alternative plans to improve the existing drainage.
Local flooding has been a common occurrence for the areas adjacent to the Cat Stream. It appears that this local flooding has worsened in recent years because there has been little maintenance on the creek and there has been an increase in deposits, weeds and bru~;h. This condition can only deteriorate further with time and upstream development.
Basic to any plan of drainage improvements, therefore, is the requirement for alleviation or elimination of local flooding problems.
A second requirement is that the creek remain a natural wat(~rcourse and not be converted into an enclosed stormwater conduit. The latter possibility would be the most expensive solution, but would be permanent, would save future operating and maintenance funds 1 and would allow other uses of the lands that presently contain the creek and its flood plain.
Since the creek is a fisheries resomce, however, and since there is now a growing demand for natural watercourse preservation and control in urban areas, as is witnessed by Nanaimo's Community Plan, conduit encJosures of the Cat Stream are not considered further.
Lastlyy future use of the Cat Stream must include the function of flood routing since there is no other route for flood flows to follow. f\ blocked cu!vcrt at Wakesiah, for exampie, would only temporarily deter stormwater from continuing along the creek.
If future faciEties were designed to be reached or exceeded in capacity on an average of once in 10 years, accordingly, the eleven year storm and greater would still have to be accommodated, somehow, in the Cat Stream.
The system, therefore, must be checked for its ability to pass flows exceeding the design criteria, and the extent of possible damage therefrom should be judged.
7-1
ALTERNATIVE PLANS.
Four plans have been designed and estimated in subsequent sections.
Two of the plans have been designed for a 25 year recurrence .interval and two for a 200 year. For both recurrence intervals, di:fferent storage conditions have been investigated. For the 25-year plans, the effect of the 200 year flood flows have been estimated, but only from preliminary calculations.
The various plans are illustrated on Figures 14, 15 and 16.
Estimates of capital cost have been prepared for each plan. Culvert work provides for the inst~tllation of reinforced concrete culvert pipe and restoration of the road surfaces. Reinforced concrete headwalls are allowed for each new and existing culvert where road crossings are improved. Trash racks would comprise a grillage above the culvert entrance with provision for overflmv and maintenance access. Creek cleaning provides for clearing out of debris and cutting back brush and brambles on banks. Where necessary to accommodate flood flows widening or dyking of the channel banks in critical sections is allowed for. Storage at Third allows for construction of the dyke but only rninor excavation to contour the basin with provision for reseeding of the disturbed soils. Storage at Wakesiah allows for only a stormwater ciiver::;i.uti It 0ttl the iu,ctd ditch and a control stt\.1Cturc. The existing pond is adequate.
To construction costs are added a 2596 allowance for engineering and contingencies and a 12 percent allowance for financing and administration.
Plan_l - 25 year winter storm.
- full development.
- storage west of Wakesiah.
Basic to this plan and the three other plans is the use of the natural storage pond west of Wakesiah which is proposed for development by i\1alaspina College.
Flow from the developed campus and High School area above Wakesiah would be diverted to the pond and released into the existing et~vert crossing Wakesiah at a controlled rate not exceeding about 0.8.5 rn Is (30 cfs).
. In Plan 1: ab?ut 20 1000 m 3 (26 ,000 yd3) of 3tora_ge are need~d m the pond to mamtam the release rate at .85 m· /s (30 cfs). nus volume represents about 0.9 m (3 ft.) of water depth over a pond area of 2 ha (5 ac.) which can be accommodated in the natural ponding area
7--2
without berm construction. Diversion of flow from the Wakesiah west dltch to the pond and a control structure to limit the release rate from the pond are required.
Below Wakesiah, five new culvert road crossings will be required between Third and Albert Avenue to accommodate the 25 year flows.
Between Third and Pine the creek would be regraded to prevent the flooding of the low lying area in this reach of the creek. Minor creek widening is needed between Pine and Albert. A trash rack would be iristaJled at Park Ave.
Otherwise, the creek channel is adequate after clearing out of debris and brush to accommodate the 25-year storm flows without flooding homes.
Assuming full implementation of Plan 1, the water levels created by the 200 year storm would not cause flooding of the road crossings but the creek channel would flood between Pine and Fifth and in Robins Park. Velocities in the creek channel between Albert and Pine would reach 2 rn/s (6.5 fps) which is above the upper limit to prevent excessive erosion. The 200-year flood would therefore cause some erosion and flooding.
7-3
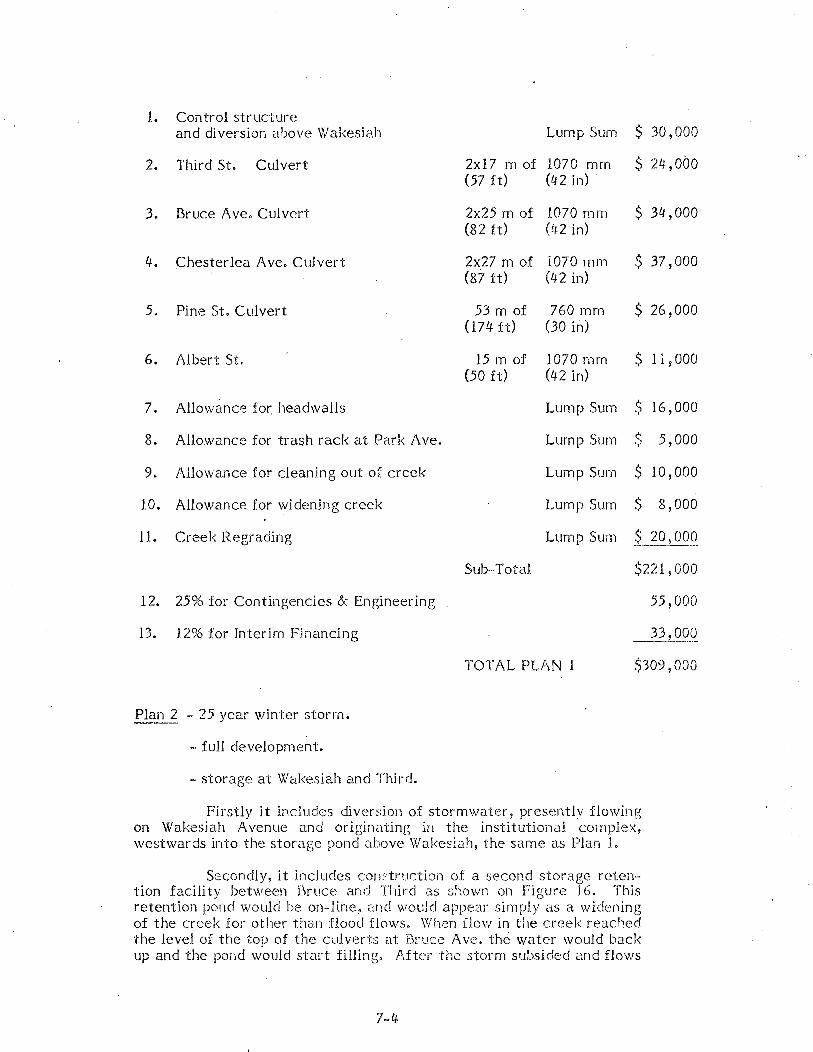
1.. Control structure and diversion above Wakesiah Lump Sum $ .30,000
2. Third St. Culvert 2xl7 m of 1070 mm $ 24,000 (57 ft) (42 in)
3. Bruce Ave. Culvert 2x25 m of 1070 mrn $ 34,000 (82 ft) (42 in)
4. Chesterlea Ave. Culvert 2x27 rn of 107'0 mm $ 37,000 (87 ft) (t~2 in)
5. Pine St. Culvert 53 rn of 760 rnrn $ 26,000 (174ft) (30 in)
6. Albert St. 15 rn of 1070 mm $ li,OOO (50 ft) (t+2 in)
7. Allowanct:'! fo~ headwalls Lump Sum $ 16,000
8. Allowance for trash rack at Park Ave. Lump Sum $ 5,000
9. Allo\vance for cleaning out of creek Lump Surn $ 10,000
J.O. Allowance for widening creek Lump Sum $ 8,000
11. Creek Regrading Lurnp Sum -~_1Qy00Q_
Sub--Total $221,000
12. 25% for Contingencies & Engineering 55,000
13. 1296 Jor Interim F.inancing _3l_J_90Q_
TOTAL PLAN 1 $309,000
Plan 2 - 25 year winter storm.
- full development.
- storage at Wakesiah and Third.
Firstly it includes diversion of storm water, presently flowing on Wakesi.ah A venue and originating in the institutional complex, westwards into the storage pond above \Vakesiah, the same as Plan 1.
Secondly, it includes construction of a second storage reten-tion facility between bruce and Third as shown on Figure lG. This retention pond would be on-line, c1.nd would appear simply as a widening of the creek for other than flood flows. When flow in the creek reached the level of the top of the culverts at Bruce Ave. the w<:1.ter would back up and the pond would start filling. /\fter the storm subsided and flows
7-4

decreased, the water would release automatically from "the pond. The maximum rate released to the creek downstream of the pond would be go3erned by the capacl ty of the culvert at Bruce. A release rate of 2.4 m /s (85 cfs) has been preliminary selected so as not to exceed the capacity of the existing downstream culverts and creek channel.
As indicated on Figure 16, earthwork is required in order to construct the pond which eliminates the creek regrading required in Plan 1. Some 1.5 ha (3.5 ac.) of private land are required for the pond, however 1 which may be difficult to acquire. Considering lot sizes, about 2.1+ ha (6 ac.) of land would have to be purchased.
New twin culverts would be required at Third, the creek must be cleaned of debris and brush and a dyke is necessary between Bruce and Third to protect the low lying i1ouses. Widening of the creek is not necessary downstream of Bruce.
Because of the storage retention, the 200 year flood flow would cause less impact than Plan L Flooding would occur between Pine and Albert and between Bruce and Chesterlea.
Estimate of Cost. The estimated total capital cost of Plan 2 is $353,000~- as-follows: --
1. Wakesiah Storage Pond Lurn Sum $
2. Third St. Culvert 2x17 m of 1070 rnm $ I,..-, ,.. . \ I J:.""" • \ VI J.LJ \'+L. 111/
3. Storage and dyke at Third Lump Sum $
30,000
24,000
30,000
lf, Pu;·chase F'ropeny 2.4 ha Lump Sum $150,000 (6 ac)
5. Allowance for headwalls Lump Sum $ 3,000
6. Allowance for trash rack at Park Ave. Lump Sum $ 5~000
7. Allowance for cleaning out creek Lump_Sum _L!_O_tOOQ
Sub;.. Total $252,000
8. 2596 for Contingencies & Engineering 63,000
9. 12% for Interim Financing ~1000
TOTAL PLAN 2 $353,000
Plan 3 - 200 year winter storm.
- full development
-storage west of Wakesiah.
7-5

. Plan 3 is similar ~o Plan 1 exrrept tha~ th~ stora~e r3quire-ment Increases to 31+,000 m {ltlf,OOO yd· ) to marntam a .85 rn /s (30 cfs) release rate and the downstream design flow at Park Ave. is about 30 percent higher. Six nev; culvert road crossings are required, together with regrading and reconstruction of the creek between Third and Pine. The Creek must be dca.red o:f debris and also widened between Pine and Fi£th. A trash rack would be installed at Park Ave.
The City Park at Fifth and Park would flood, but this is judged to be acceptable as no structures would be affected and erosion would be minimal.
Estimate of Cost. The estimated total capital cost of Plan 3 $ -----·------is 431,000, as follows:
1. Storage at Wakesiah Lump Sum s .,
2. Third St. Culvert 2xl7 m of 1070 mm $ (52 ft) ( 4-2 in)
3. Bruce Ave. 2x25 m of 1220 mrn $ (82 ft) (4.8 in)
'+. Chesterlea Ave. 2x27 m of 1220 mrn $ (87 ft) ( l,t8 in)
5. Pine St. 53 m of 121:0 rnrn $ ( J7l+ ft) ( 48 in)
6. Albert St. 2xL5 m of 1070 rnm $ (50 ft) (lJ.2 in)
7. Fifth St. 39m of 910 rnm $ ( 128 ft) (36 i.n)
8. Allowance for head walls Lump Sum $
9. Allowance for trash rack Lump Sum $
10. Allowance for cleaning out creek Lump Sum $
11. Allowance for creek widening Lump Surn <'· .:;>
35,000
2l~ '000
39,000
lf2 '000
lf.2 '000
21 '000
23,000
20,000
5,000
10 '000
22,000
12. Creek Regrading Lump Sum ~--?-5 ..1..000
Sub-Total $308,000
13. 25% for Contingencies & Engineering 77 ~ 000
11+. 1296 for Interim Financing __ ..!!:_6 ' 000
TOTAL PLAN 3 $431,000
7-6
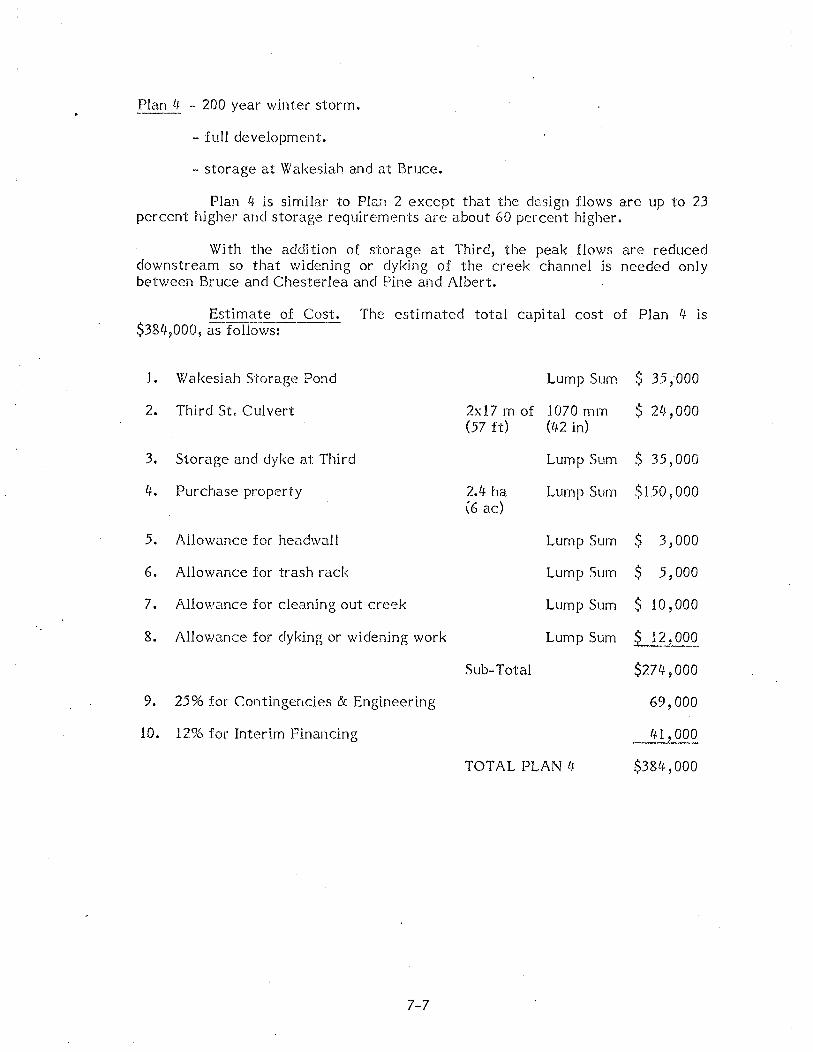
plan~ - 200 year winter storm.
- full development.
- storage at Wakesiah and at Bruce.
Plan lt is similar to Plan 2 except that the design flows are up to 23 percent higher and storage requirements are about 60 percent higher.
With the addition of storage at Third, the peak flows are reduced downstream so that widening or dyking of the creek channel. is needed only between Bruce and Chesterlea and Pine and Albert.
Estimate of Cost. The estimated total capital cost of Plan 4 is $38tt,OOO, as follows:
1. Wakesiah Storage Pond Lump Sum $ 35,000
2. Third St. Culvert 2x17 m of 1070 mm $ 24,000 (57 ft) (42 in)
3. Storage and dyke at Third Lump Sum $ 35,000
4. Purchase property 2.t-1- ha Lump Sum $1.50,00.0 (6 ac)
5. Allowance for headwall Lump Sum ~· .:;J 3,000
6. Allowance for trash rack Lump Sum $ 5,000
7. Allowance for cleaning out creek Lump Sum $ 10,000
8. Allowance for dyki.ng or widening work Lump Sum $ 12,000
Sub-Total $274,000
9. 25% for Contingencies & Engineering 69,000
10. 12% for Interim Financing -41,000
TOTAL PLAN 4 $384,000
7-7

COMPARISON OF PLANS
Caj)ital Costs. Estimated capital costs of the four plans are summarized-as-follows:-
Plan 1
Plan 2
Plan 3
Plan l~
$309,000
$353,000
$4311000
$38l? '000
Plans 1 and 2 are designed for a 25 year storm and Plans 3 and 4 for a 200 year stor·rn.
A storm exceeding a 25 year recurrence interval, assuming either Plan 1 or 2 was irnplemented, would cause some flooding of property and low lying homes below Bruce A venue. Channel erosion would also occur,
Natural ponding has always existed above Wakesiah and it is assumed the Cityts needs for retention can be accommodated with the requirements of Malaspina College.
Without a second storag0. facility at Third, five new culvert .._ • t . • 0
• !~ o • 1 ~ f . . . ~ • , . • t t 0 ,....._ I 1' t• • _. t. _
tuacJ cruss.l.ll(:,S ctnu lllltlut uee1< WJ.UClllllf) ctre lteeueo lll l-lcttl 1 101 u1e
25-year flow, while six new culvert road crossings and additional creek widening are needed in Plan 3 for the 200-year fl.ow. The capital cost of Plan .3 increases by $122,000 or L,(O percent more than Plan L
Storage at Third reduces the needed road improvements to only a new culvert crossing at Third for both Plan 2 - 2.5-yeax and Plan ,.,_- 200--year. Widening of the creek is not necessaxy in Plan 2 but some widening is required in Plan l? between Bruce and Albert.
Based on the need for 2.4- ha (6 ac.) of land for storage a.t Third at $25,000 per acre, Plan 4 costs $31,000 or 9 percent more than Plan 2. The uncertainty, however, is whether the land ccm be acquired and if the estimated price is realistic. The decision regarding storage at Third should be made on the basis of several factors, including capital costs.
Two anomalies have appeared in this study.
The first is that design flows calculated by the Rational Method are usually higher than flows calculated by the hydrograph method employed in ILLUDAS. The reverse was true in this s1;udy until runoff coefficients were substantially increased in the Rational Method.
The second is that the primary purpose of retention-detention works in a storm drainage system is to save money) but the reverse was the case in this study for the 25 year flood flows. Pian 2, with· the additional stor<.lge at Third, costs $Lflf.,000 more than Plan 1 for 25 year
7-8
flows while for 200 year protection, additional storage resulted in only an 11 percent decrease iil cost. In order to justify a second storage retention :facility on the Cat Stream, therefore, there must be other compensating factors. ·
Qpe.£ation a~29 M_ainten_~y~t;:~ As outlined previously, retention storage on the Cat Stream at Third would be empty most of the year. When the on--line system capacity was exceeded, however 1 it would be needed. ·
Experiences in parts of the United States in which such facilities have been in operation for some years is that there are maintenance problems involved in ensuring that the pond will function when needed on an intermittent, unpredictable basis.
Maintenance of the storage works, therefore, must be done by the public corporaticn on a regular basis and would be a continuing expense against the plan utllizing storage.
Fisheries Resource. Storage on a natural watercourse is beneficial to tl)e fisherie-s--resource because it reduces peak flows, reduces the need to widen the creek channel, lowers peak velocities,
·and helps with the problems of scour, erosion and depositions.
These are problems, common to all natural vmtercourses, that have been accentuated by developments \Vithin the watershed. Developments do not cause more rainfall, but they lower the percentage of rain that enters the ground and they speed up the rates at which surf~cc \Vetter r~:tches ~~ V/.J.tercourse·"
The result of development, to the fisheries resource, is a more dangerous and difficult environment for fish than existed under natural conditions.
[::.n_~.!:.9.E_1!~nent_al_l_!!2E~Ct_: A storage retention pond that is empty for most of the time would not be a nuisance or offence provided it was kept neat and tidy and was not allowed to become a breeding ground for mosquitos 1 weeds and brush.
The upstrean1 pond west of Wakesiah would be a retentiondetention pond that would have water in it ali the time. During flood flows its level would rise, but this should not adversely affect its principal use as a 3anctuary.
Though not foreseen now, it is possible that some auxiliary use for the storage pond at Third could be devised that would not prevent its use as a fl0od reservoir when needed. Provided the City cleaned it up· after each flood, for example, it could be a passive park with trees and shrubs that could tolerate an occasional flood.
There is danger to the public associated with multiple use of a storage reservoir, however, and this should not be part of the comparison in favour of retention ponds.
7·-9
In summary, j+ is judr,ed that the environmental impact of storage ponds in the Cat Stream Basin is negligible.
!~ec;~~pi tl_:ll~!.0_n..~ Protection of the fisheries resource is the single most compelling argument in favour of storage retention ponds for the Cat Strean1 Drainage Basin.
It is judged that the additional cost of $1~~~,000 for Plan 2 over Plan 1 would be justified because of the added benefits to fisheries, and Plan 2 is recommended for adoption.
7-10
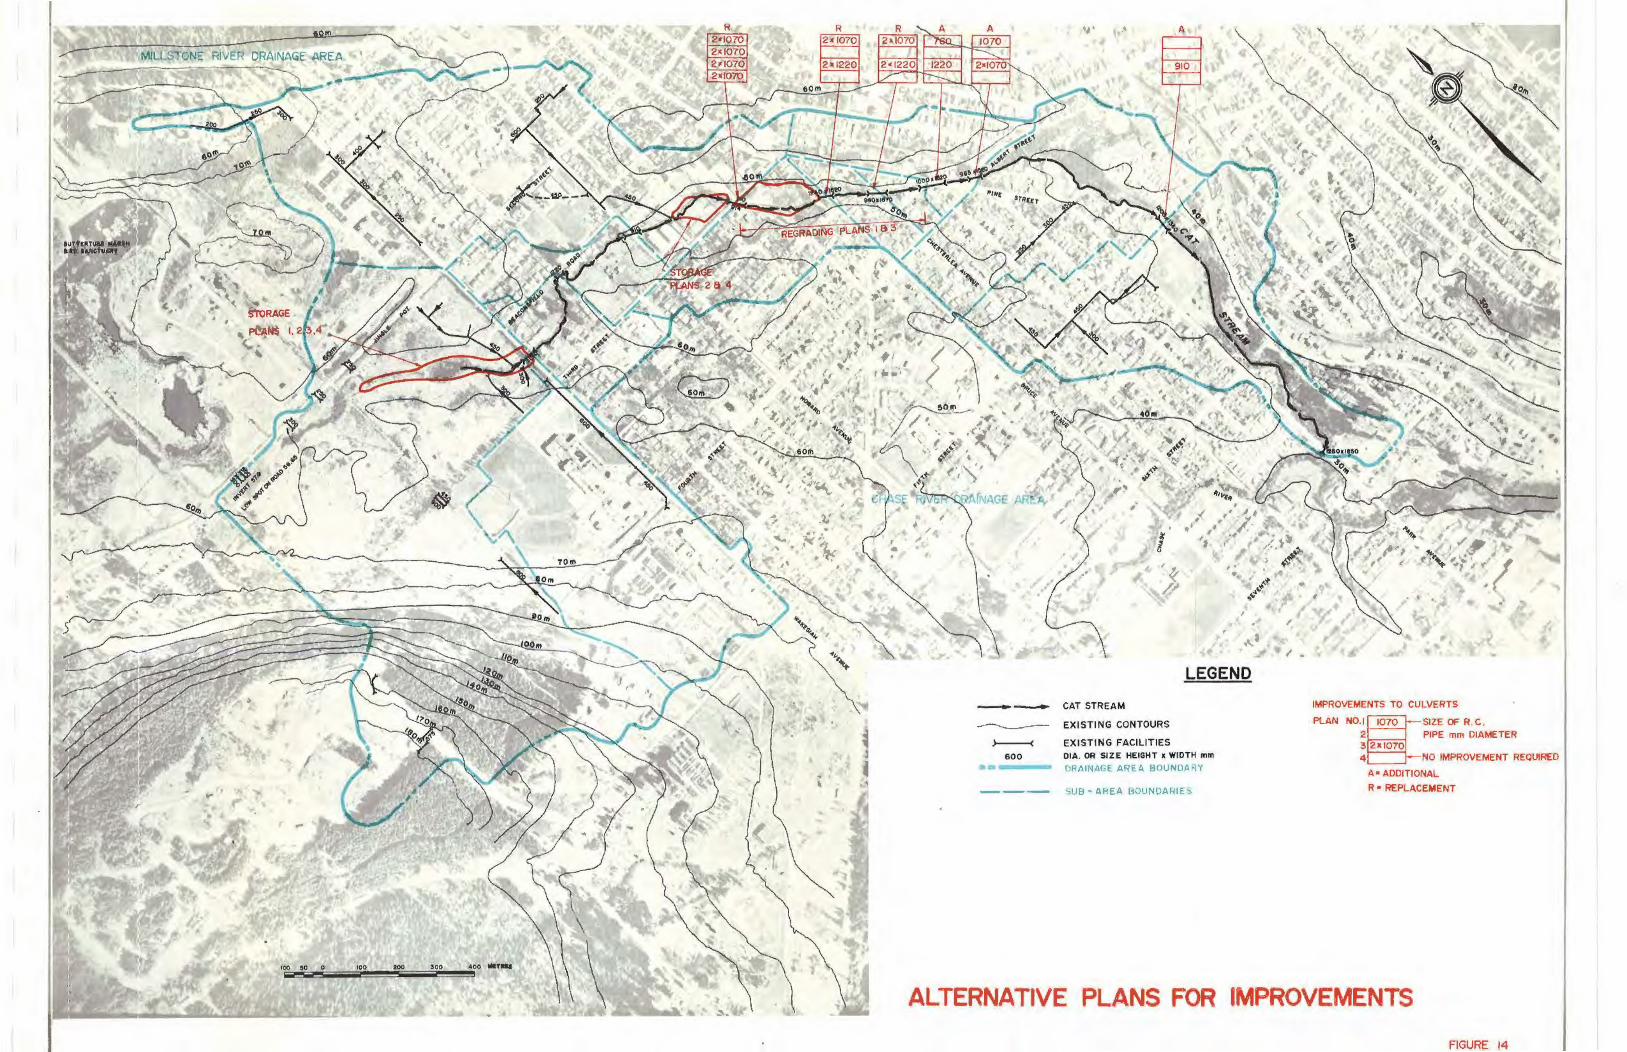
LEGEND
-- CAT STREAM IMPROVEMENTS TO CULVERTS
-------- EXISTING CONTOURS Pl.AN NO.I SIZE OF R C. 1070 t-
>----< EXISTING FACILITIES 2 PIPE rnm DIAMETER 3 2•1070
600 OIA. OR SIZE HEIGHT a WIDTH mm 4 f-NO IMPROVEMENT R£0UIREO
A• ADDITIONAL
--- UD AR A UNDARIE R • REPLACEMENT
ALTERNATIVE PLANS FOR IMPROVEMENTS
FIGURE 14
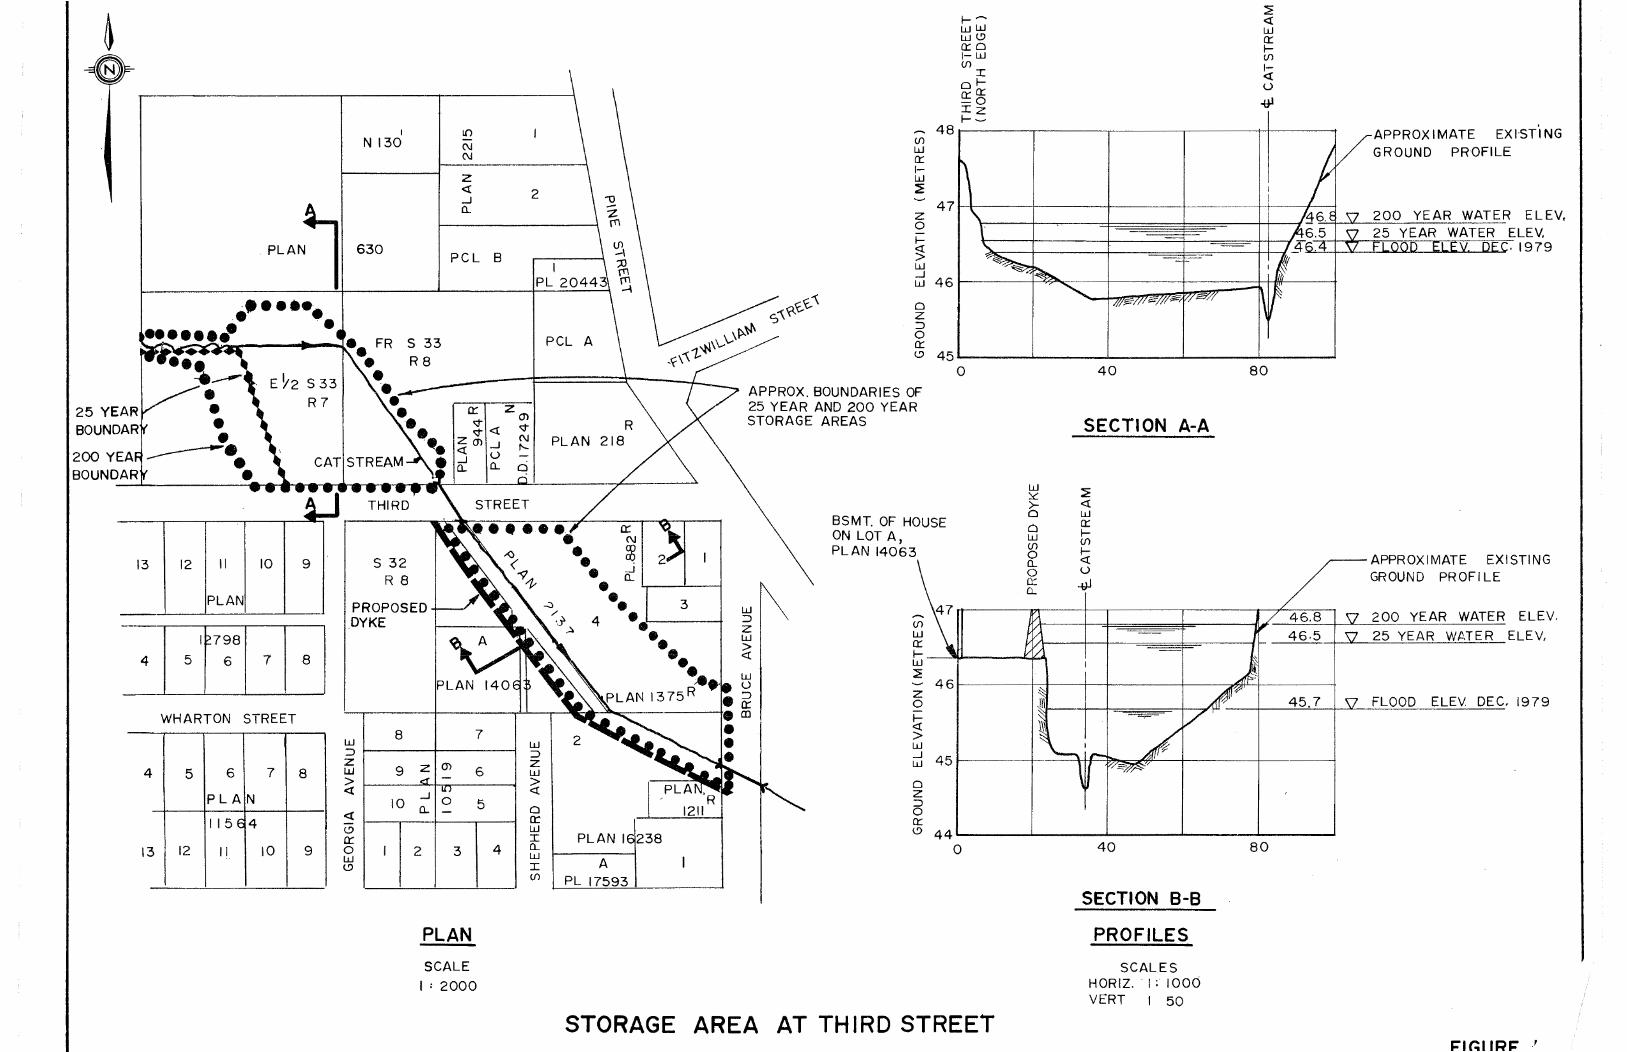
13
4
4
13
I l()
N 130 (\j (\j
z ~ _J
0..
. PLAN 630 PCL
12 II 10 9
PLAN
I 5 r=a] 7
I 8
I WHARTON STREET
5 6 7 8
PLA N
115 E 4
12 II 10 9
s 33 R8
s 32 R 8
PROPOSED DYKE
w 8 :::l z w 9 > <(
10 <(
l9 a::: 0 w l9
7
z CJ> 6
_J 0 5 0..
2 3
PLAN
SCALE
I: 2000
B
4
2
~\ I ~
PL 20443 ~
PCL A
_J 0..
4
w :::l z w > ~
0 a::: w I PLAN I 238 0.. w I A (j) PL 17593
48 (j)
w a::: 1-w :E
47 z 0 I-
~ w _J w 46
0 z
,t:>-~ :::l 0
~\\....\... -'( '" "'];
3
a::: l9
APPROX. BOUNDARIES OF 25 YEAR AND 200 YEAR STORAGE AREAS
45
BSMT. OF HOUSE ON LOT A,
w :::l z w
PLAN 14063
(j)
w a:::
I-~
ww we> a:::o 1-W (j)
I ol-a::: a::: -0 Iz I-~
0
w ~ >-0
0 w (j)
0 0.. 0 0:: 0..
1/1 8 l C1 >
~ l- __ -'llj.L-----AY'-"'1 w ~
40
SECTION A-A
~ <( w a::: I-(j)
I-~ u ~
~ ~ w a::: 1-(j)
1-~ u ~
80
/__ /__ 46.8
I-46·5
~
k
APPROXIMATE EXI-5T.ING GROUND PROFILE
APPROXIMATE EXISTING GROUND PROFILE
\7 200 YEAR WATER ELEV.
\7 25 YEAR WATER ELEV,
46~----~~---+-4------~--~--~_:~------~ z ~ 45.7 \1 FLOOD ELEV DEC. 1979 0 ~ v ~ \~ ~ ~ ~- _4 ...Jw 45~------~---=~~,~-~~A~I'~------~------~ w r'/~ 0 z :::l 0 a::: l9 44L-------~----~------~------~------~
0 40
SECTION 8-8
PROFILES
SCALES HORIZ. I: I 000 VERT 1 50
80
STORAGE AREA AT THIRD STREET

CITY OF N/\NAIMO
CAT STREAM DH.AIN/\GE STUDY
8. WATERCOURSE PRESEi:?_VATION f1.ND u~Jl/\NAGEfv1ENT
In order to overcome flooding problems and implement improvement programs, long term development policies are needed for major watercourses which pass through urban development.
The works necessary to overcome flooding and erosion problems can be expensive, particularly where urban development has encroached within the natural watercourse.
The preservation of watercourses in their natural state is desirable wherever possible and pructlcal. A "greenbelt" strip along the creek is ideally sui ted for containment of the watercourse and can also be used for multipurpose recreational activities. In many undeveloped areas this concept can readily form part of the overall planning approach.
For areas which are already developed the problem is more complex and suitable solutions more difficult to find.
MUNICIPAL REGULATIONS
Bylaw 1950, the Community Plan, sets out a policy on land adjacent to lakes and streams as follows: "New subdivision and development will be managed to improve or retain the environmental quality of the shores and banks of fresh water bodies. Techniques including purchasing~ zoning, land dedication requirernents, development permits and floodplains designation will be used to maintain a buffer area between water bodies and adjacent land uses."
The Cat Stream is included in a llst of principal water bodies concerned.
Section 2.3.0 concerning stormwater drainage states: " The City will give consideration to the adoption of a policy which would provide for the implementation of a storm drainage program in both existing and developing areas of the City. In addition, the City will give consideration to establishing cost sharing formulas for storm drainage.11
The Community Plan, then, sets out the City's intentions to maintain drainage systems in their natural state by requiring a buffer strip between a creek and adjacent land uses.
Zoning Bylaw 2000 provides for a building or structure setback of 15 m (50 ft.) from the "natural boundary" of a fish bearing watercourse. The Chase River and tributaries 1 of which the Cat Stream is one, are included in the list of fish bearing watercourses. The 15 rn
8-1
setback may be reduced t(> 7.5 m (25 ft.) if approved by the Provincial Ministry of the Environment.
For flood contro.l, the underside of the ":floor system" must be a minimum of 1.5 m (5 ft.) above the "natural boundary" or 0.6 m (2 ft.) above the 200 year flood level. The 11 natural boundary" is defined as !lthe visible high water mark of any lake, river, stream or other body of water where the presence and action of the water are so common and usual and so long continued in all ordinary years, as to mark upon the soil of the bed of the .take, river, stream, or other body of water, a character distinct from that of the banks thereof, in respect to vegetation, as well as in respect to the nature of the soil itself."
Set backs for buildings and minimum elevations to protect against :flooding are established in the Zoning Bylaw.
Both the Zoning Bylaw and Community Plan, however, apply only to new development. Existing development which do not comply
·with the current rc~gulations are another more difficult matter.
PROVINCIAL REGULATIONS
The Provincia.! Water Rights Branch has authority over storage, diversion of water and the construction oi drainage works in creeks. Water Rights approval must be obtained whether or not the creek is undc:r private or public control. \Vhen assessing proposed drainage works, the Water Rights Branch seek input from the: r'ish and Wildlife Branch.
PRIVATE VERSUS PUf~LIC 0\VNERSI-I!P
There are two basic approaches for preserving creeks and controJli.ng the effects of stormwater runoff.
a) The City could leave ownership in private hands as far as possible with responsibllity for maintenance being left to the individual owners. This is the present situation on the Cat Stream.
b) The City could adopt a policy of acqUlnng control of the creek bed and a strip of land on each side through rights-ofway. This strip could be used to provide a greenbelt along the stream with public access. Maintenance would be entirely the City's responsibility.
City. control has the advantage of permitting effective flood and erosion control measures and maintainance procedures. Control of drainage works would then be similar to control of sewerage 1 water and road facilities. The disadvantage is the need to acquire the rights-ofway.
Private ownership has the apparent advantage of leaving the responsibility for preservation of the creek in its natural state, and maintainance procedures in the hands of the private property owners.
8·-2
The obvious disadvantage is tha'i: property owners \Vill no~ maintain or preserve the creek in its natural state. Perhaps rnore important is that private ownership does not mean that a Municipality is not, at least in part, responsible or liable for damages caused by flooding or stream bed erosion, A municipality's position in law with respect to private ownership of a creek .ls not entirely clear. If the City requires new development to construct drainage works that discharge to a creek, possibly incorporating storage ponds, erosion control measures and trash racks all of which are designed for an 11 X 11 year return period and other City specified criteria, then the City may well be responsible if subsequent darnage occurs that is related to the drainage works. The City must seek the advice of its solicitor on the matter of drainage law in British Columbia.
A combination of both public and private control is frequently the case found ln Municipal.lties. For new development, the acquisition of rights-of-way can be arranged with relative ease but in existing development those properties, where negotiations are difficult, may be left as private ovmership.
In g~~neral 1 public control through acquisition of rights-of-way on either side of the creek channel is the preferred option to ensure the implementation and continued rnaintainance of drainage policy, but is often impractical or im]Jossible in presently developed a.reas.
CREEK PRESERV A.TION AREA RE.QUIREMENTS
One alternative arising from this study, accordingly, is for the City to require ::1reas to be preserved along the Cat Stream from all new development, from all existing development where control over the watercourse is judged advisable to rnit.igate flooding, and from other existing development where property rights can be obtained with relative ease so as to secure a "green belt" for as much of the crc~ek as possible.
This green belt could be cc:.lled the Creek Preservation Area. It need not be owned by the City, but could be an area in which ail future development was under close control.
This would require a Creek Preservation Area bylaw.
Preservation Area requirements would be based on the following criteria:
1. Minimum widths should comply with the City's Zoning Bylaw set back req11irements of 15 rn (50 ft.) from the edge of the creek.
2. Minimum widths :;hould also be sufficient to contain the 200-ycar flood flow with minimum .6 rn (2 ft.) freeboard.
8-3
3. Minimum widths should also be adequate to pccmit erosion control measures for flood flows, construction of trash racks and sedimentation basins ahead of culverts, and to allow access and maintainance of faciilties. ·
If.. In special cases, minimum rights-of-way widths can be reduced if the creek is confined in a revetted channel, or flume or enclosed conduit.
Figure 17 illustrates typical Preservation Area requirements. This illustration is ger,eral only and will require detailed hydraulic calculations and field surveys to establish actual requirements for various reaches of the creek.
!:.'LOOD FLOW ROUTING
As discussed in a previous chapter on drainage policies that influence design criteria, each na:tUL'al watercourse must be studied to see what will happen when the design storm is <.::xceeded.
On steeper hillsides, for example, an overflow at one point in the system may send flood waters on an entirely different route to the main watercourse, usually to the distress of downstream development.
These studies are often termed major and minor flood routing analyses. For the Catstrearn Basin, the routes coincide.
POLLUTION
AU urban drainage is polluted. Studies on the effect of urban runoff on stream pollution have shown that stormwater is sometimes more polluted than raw SE''Nage when specific po.!lutants are considered. This may be significant at times in the Cat Stream, particularly in the summer after a long dry period when stream flows are low and the first flush of a heavy rainfall carries a significant load of pollutants into the stream.
Stormwater treatment is not likely to achieve a high priority in this area in the near future. The use of ponds to control peak flows, howev2r, will have a beneficial effect on pollution.
RETENTION·- DETENTION
Much has been written in recent years about stormwater management and modern methods of drainage design.
Nearly all this writing has taken age-old principles, given them new names, and left the implication that something new has been added to drainage expertise.
The principles involved attempt to utilize the pattern of individual rain storms) in which rainfall often builds up to a peak and then gradually subsides.
8-4
In the Rational Method of design, facill ties are ,,lzed for the peak :Uows predicted to be reachecl or exceeded. It can readily r.re seen that if these peaks could be eliminated the facill ties could all be srn aller and cheaper.
The tool for eliminating peak flows on the system is storage, exactly the same as balancing reservoirs are built .in a waterworks system near the demand in order to supply peak hourly flows while the transmission system carries only peak dally demands.
Storage in drainage systems to reduce peak flows has been used for many years. It can be located on or near the major watercourse, such as Burnaby Lnke which regulates flow to Brunette River through a coritrol darn built in 1925.
Storage can also be incorporated into the lateral storm drain system and individual buildines in the area. This philosophy is relatively new in concept. Roof tops could be built with special devices so that \Vater ponds on the roof before running off. Parking lots, playing fields, roads and other facilities could have storage ponding devices. Roof downpipes could be taken to splash pads instead of storm sewers.
All these designs, properly incorporated, could serve as storage to reduce peak flows to the major watercourse. Storage on lateral storm drain systeros can be incorporated into new development providing a master plan for stormwater, roads and other utLUties are coordinated at the outset to provide for proper routing of mlnor and major flows. In existing developed areas, the task is o:ftcn impracticaL
For the Cat Stream Drainage Basin, however, with only ll+ percent undeveloped CJTea below Wakesiah, it would be virtually impossible to initiate individual on-site storage works that would be effective. Above Wakeslah, a potential 72 ha (180 ac.) are undeveloped but the existing on-~strearn pond ~;hould be utilized to keep the number of storage facilities to a minimum.
It is judged, therefore, that storage retention-detention for the Cat Stream must be .in or adjacent to the natural watercourse at thr::'! two locations proposed, namely Thixd and Wakesiah.
IMPLEMENTA'l.ION
The plan recommended for adoption in this study to relieve flooding of the Cat Stream is descr.ibcd in Chapter 7 and shown on Figures ll,t and 15. It is a straightforward drainage system comprising a balance between open channels, culverts 1 and retention·-detentlon storage.
The recommended plan, however, also includes policies for future rnanagernent of the drainage basin. If accepted, they could be applied universally thoughout the City and might have long term effects on the whole future of storm drainage in the area as a whole.
8-5
A fevi of the ptoblems involved In lrnplerncnt:ng the Cat Stream plan, accordingly, are discussed hereafter.
Financial. In general terms, the City's Community Plan includes prov-isfor1-Tor the City to provide storm drainage works in both developed and undeveloped areas, and allows for establishment of cost sharing formulas.
The City has already approved one major drainage bylaw under a Council Initiative plan, and a second is currently under consideration for the capital works budget.
F'or the two million dollar bylaw now being implemented, a general levy across the City has been instituted to cover bond redemption and interest payments.
In the Cat Stream Basin, the major drainage works recommended in this report are estimated at $353,000, with a budget of $18,000 per year for operation and maintenance.
Assuming 20 year instalment debentures at l2Yz percent, ·therefore) the totaJ annual cost of the system for 1981 would be about $68,000.
This represents a charge of $7.50 per ha ($3.00 per ac.) across the entire City~ or $258 per ha ($103 per ac.) for the Cat Stream Basin alone. On a mill rate basis, it would be the equivalent of O.l/·0 rnills over net taxable assessed valuation in the City.
MunicJpal Act. municipal l.l-iTlfty" __ _
Drainage has been called the forgotten
Under the Municipal Act, Municipalities have authority to construct and operate drainage works that are required fat public development. There al·e also special sections that deal with ditches and watercourses on farmland.
It is submitted, however, that the Act requires amendrnents in order to place drainage on the same utility basis as water and sewerage. The Act was changed in the fifties and sixties for water and sewerage, and now drainage should be included.
Along with ne\v legislation to simplify drainage approvals and· financing should go Senior Government financial assistance. Waste disposal and \Vater supply did not reach firm footings in British Columbia until the Federal and Provincial assistance plans were instituted. Drainage, which has even larger capital costs associated with it, is beyond the financial povvers of most municipalities unless there is an assistance plan. A Provincial grant of 7 5 percent of bond redemption and interest over the equivalent of 2Y2 mills 5 the sarne as for water and sewerage, would enable municipalities to solve their most pressing drainage problems.
8-6
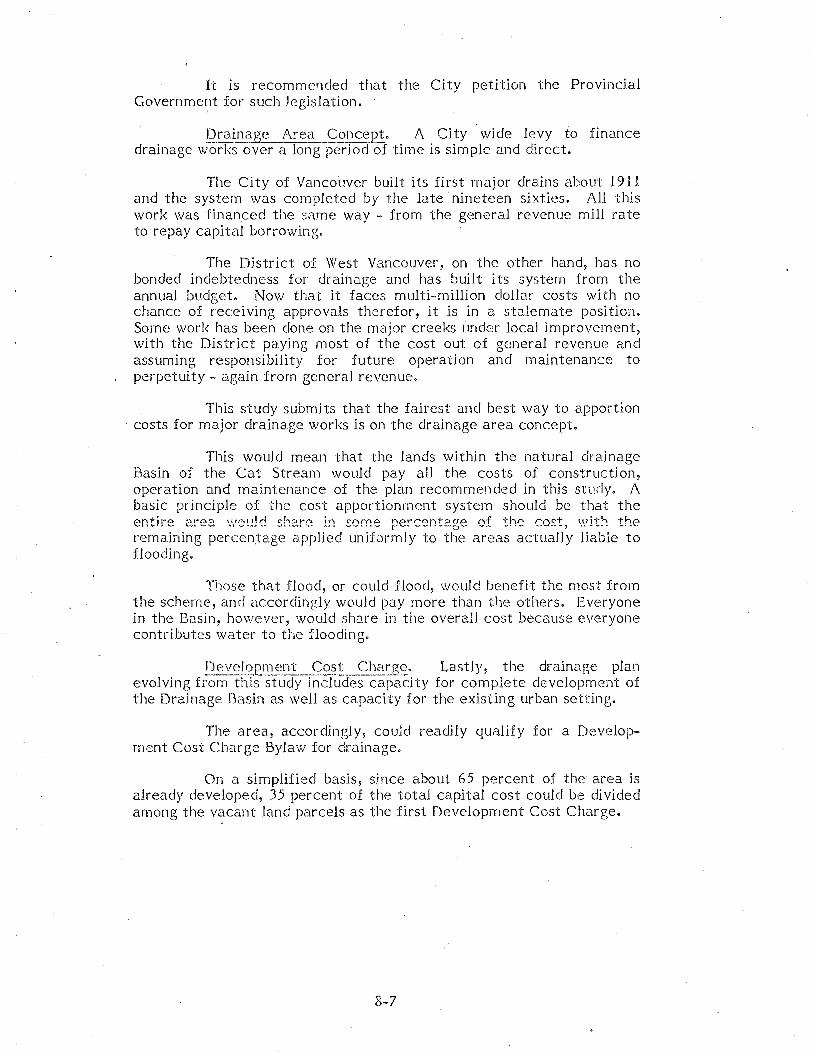
It is recommer1ded that the City petition the Provincial Governme~t for such legislation.
!~.~-~in~ Area -~_s>ncep.!_. A City wide levy to finance drainage works over a long period of time is simple and direct.
The City of Vancouver built its first major drains about 1911 and the system was completed by the late· nineteen sixties. All this work was financed the sarne way - from the general revenue mill rate to repay capital borrowing.
The District of West Vancouver, on the other hand, has no bonded indebtedness for drainage and has built its system from the annual budget. Now that it faces multi·-·million dollar costs with no chance of receiving approvals therefor, it is in a stalemate position. Some work has been done~ on the major creeks (mder local improvement, with the District paying most of the cost out of general revenue and assuming responsibility for future operation and maintenance to perpetuity - again from general revenue.
This study submits that the fairest and best way to apportion · costs for major drainage works is on the drainage area concept.
This would mean that the lands within the natural ckainage Basin of the Cat Stream would pay al.l the costs of construction, opera.tion and maintenance of the plan recommended in this study. A basic principle of the cost appor-tionment system should be that the entire area '.veuid sh2X(~ in some percentage of the cost, with the remaining percen.tage applied uniformly to the areas actually liable to flooding.
Those that flood, or could flood, would benefit the most from the scheme, and accordingly would pay more than the others. Everyone in the Basin, however, wo-uld share in the overall cost because everyone contributes water to the flooding.
peveJS?J.l.I:1_le_nt _ Cosi~- Ch~Q;!:,· Lastly, the drainage plan evolving from this study includes capacity for complete development of the Drainage Basin as well as capacity for the existing urban setting.
The area, accordingly, couJd r·eadil.y qualify for a Development Cost Charge Bylaw for drainage.
On a simplified basis, since about 65 percent of the area is a.lready developed, 35 percent of the total capital cost could be divided among the vacant land parcels as the first Development Cost Charge.
8-7
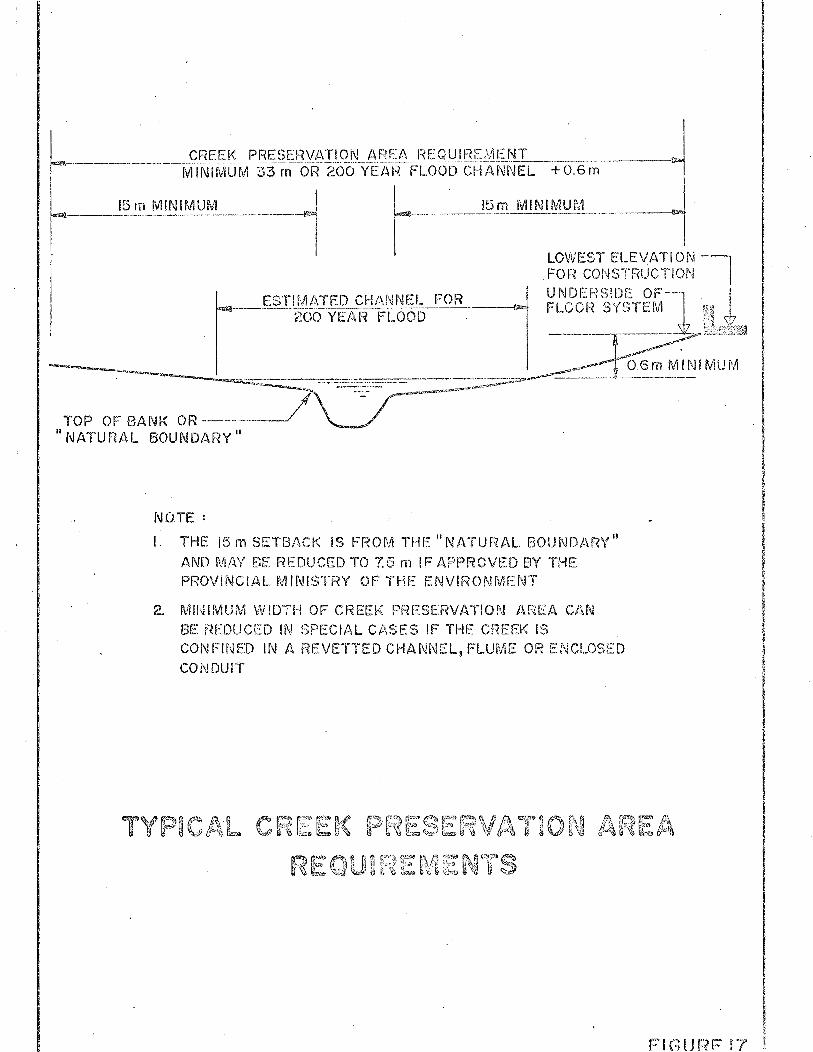
I CREEK PRESERVATION AF?EA liEQUIRE!V!t::r,J'f
-··---·-------NiTNTr~~Ll-~~--33m-Orf2(1o·Y-EAr~-f::l.~66i5-(:rtAf~f-TE:L:to.6 m-I
-~ r~ -~J
I
15m MINIMUM 15m IVI!I\!IMUM
NOTE:
I. THE 15m SET"B/\C~-( IS Ff~OM THE "NATUfiAL. BOUND/~RY" AND ~llt4.Y BE REDUCED TO 7:5 rn IF APPf'tOVt::D E3Y THE PROVINC!/.~L MINISTRY OF cfHE ENV!RONME::NT
2. M!f~IMUM WiDTH OF CREEK f~1f~ESERVATIOf\l /~FiE/.\ Cf~N
BE: f~EDUCED IN SPECIAL CASES IF THf:~ CHEEl< IS CONFINED IN A HEVETTED CHANNEL, F'LUME OR EhlCl_OSE:D
CONDUIT
FIGURF 17'
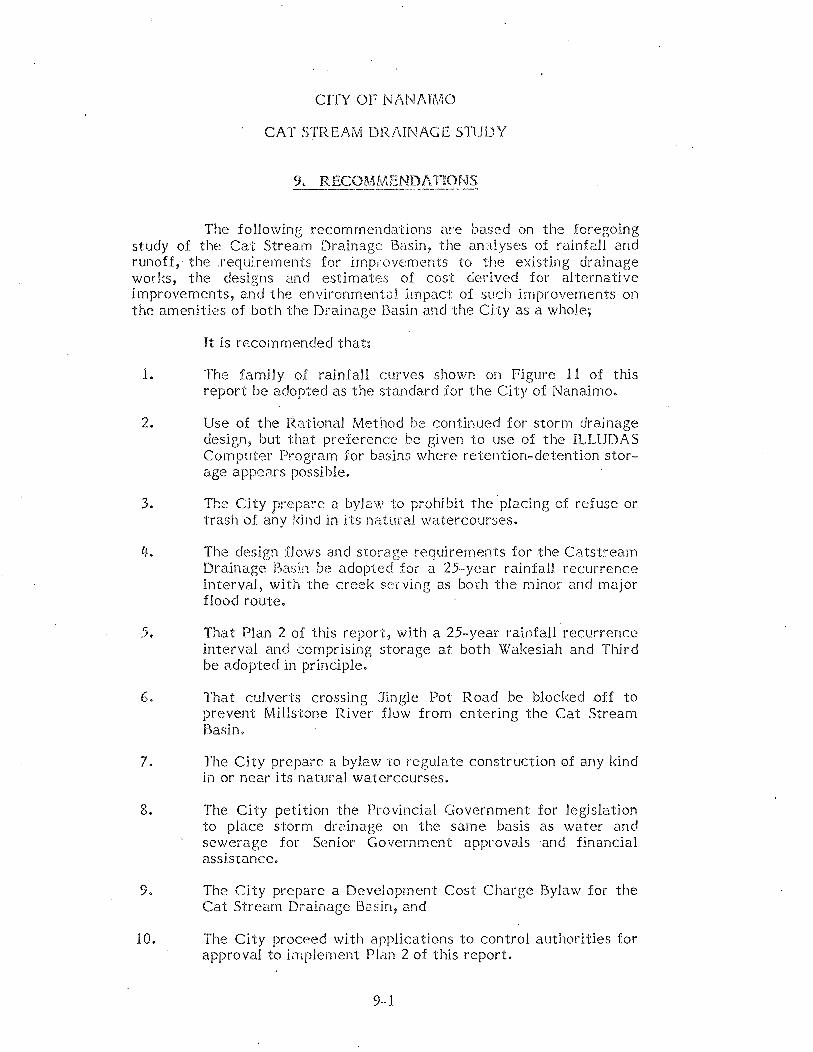
CITY OF l\lf\l\lf\IMO
CAT STREAlv'i Dl:U\INAGE STUDY
9. RECOMMENDATlOf\!S
The following recommendations are based on the foregoing study of the Cat Stream Dra.inage Basin, the anaiyses of rainfc:.dl and runoff, the .requirements for impwvements to the existing drainage works, the designs and estimates of cost derived for alternative improvements, and the environrnento.i impact of such improvements on the amenities of both the Drainage Basin and the City as a whole;
It is recommended that:
1. The family of rainfall curves shown on Figure 11 of this report be adopted as the standard for the City of Nanaimo.
2. Use of the Rational Method be continued for storm drainage design, but that preference be given to use of the ILLUDAS Computer Program for basins where retention-detention storage appears possible.
3. The City prepa:·e a bylav,' to prohibit the· placing of refuse or trash of any kind in its natural watercourses.
t~. The design :Elows and stora.ge requirements for the Catstream Drainage E\asin be adopted for a 25-year rainfall recurrence interval, with the creek serving as both the minor and major flood route.
5. That Plan 2 of this repor·i: 1 with a 25-year rainfall recurrence interval and comprising storage at both Wakesiah and Third be adopted in principle.
6. That culverts crossing Jingle Pot Road be blocked off to prevent Millstone River flow from entedng the Cat Stream Basin.
7. The City prepare a bylaw to regulate construction of any kind in or near its natural watercourses.
8. The City petition the Provincial Government for legislation to place storm dcainage on the same basis as water and sewerage for Senior Government approvals and financial assistance.
9. The City prepare a Devel.opment Cost Charge Bylaw for the Cat Strearn Drainage Basin, and
10. The City proceed with applications to control authorities for approval to implement Plan 2 of this report.
9--1
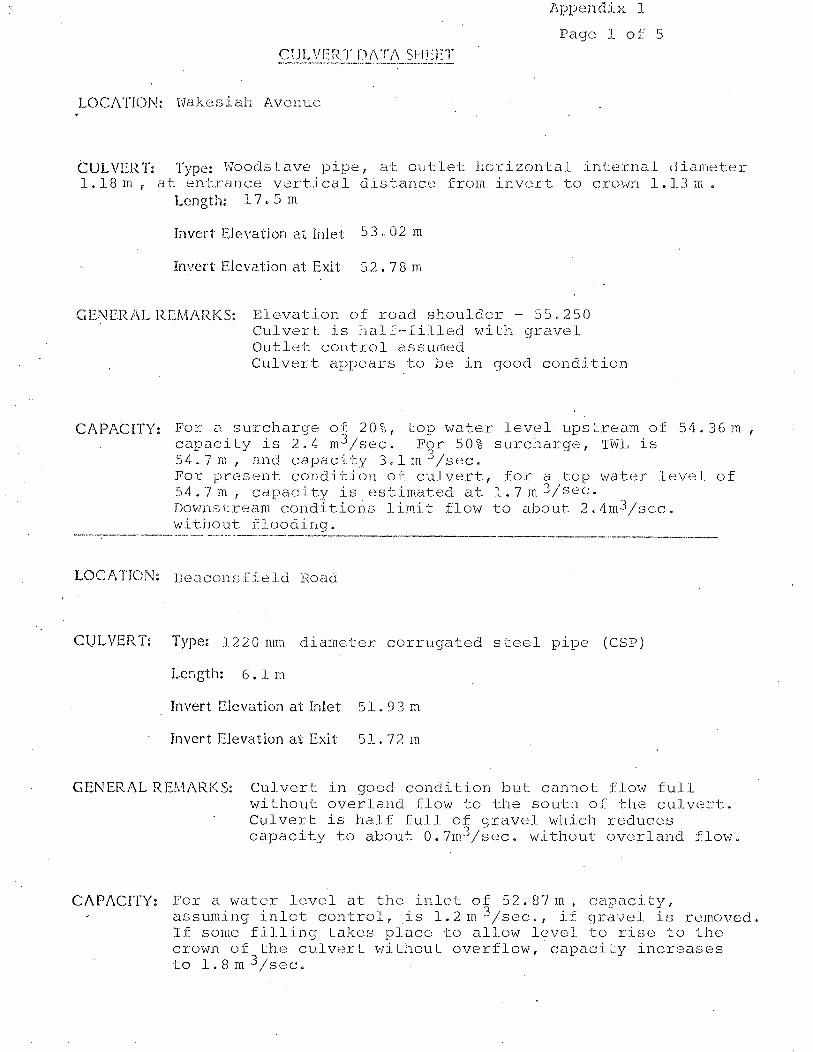
Appendix 1
Page 1 of 5
CULVERT LI/\TA SHEET
LOCATION~ lvakesiah Avenue
CULVERn Type: Woodstave pipe, at outlet horizontal internal diameter l. 18 m , at entrance vertical distance frorn invert. to crown 1. 13 m •
Length: 1 7. S m
Invert Elevation at Inlet 53 .. 02 m
Invert Elevation at Exit 52. 7 8 m
GENERAL REMARKS: Eleva·tion of road shoulder - 55.250 Culvert is half-filled with gravel Outlet control assumed
CAPACITY:
Culvert appears to be in good condition
For a surcharge of 20%, Jcop water level upstream of 54.36 m, capacity is 2.4 m3/sec. F~r 50% surcharge, TWL is 54.7m, and capacity 3.lmJ/sec. For present condition of culvert, for a top water level of 54. 7 rn , capaci t:y is. estimated at 1. 7 m 3jsec. Down.f>tr•:c:am conditions 1 imit flow ·to about 2. 4m3/sec. without flooding.
·----·---·--··---·--·· .. ---···"•"······-·-··-·-----·--·-------·---------~·····----··-------··---
LOCATION: Bca.con.sfield P.oad
Cl)LVERT: Type: 1220 mm diameter corrugated st:eel pipe (CSP)
Length: 6. 1 m
In vert Elevation at Inlet 51 . 9 3 m
Invert Elevation at Exit 51.72 m
GENERAL REMARKS: Culvert in good condition but cannot flow full without overland flow ·to the south of the culvert. Culvert is ha.lf full of gravel which reduces capacity to about 0.7m3/sec. without overland flow.
CAPACITY: For a water level at the inlet o:j: 52. 87 m , cCLpacity, assuming inlet control, is 1. 2m3 /sec., if sJravcl is rc::moved. If some filling takes place to allow level to rise to the crown of the culvert without overflow, capacity increases to l.8m3/sec.

Page 2 of 5
CULVERT D/\T/\ SHEET
LOCATION: Howard Avenue
CULVER'(: Type: 910 mm diameter CSP
Length: 17 . ~:) m
Invert Elevation at Inlet 4B.42 m
Invert Elevation at Exit 48.04 rn
GENEH.AL REMARKS: Inlet control assumed. Elevation of road shoulder is 50.6 rn.
CAPACITY~ For a surchar9e of 450 rnrn top water level is 49.79 rn. Capacity is 1.40 m3jsec. For surcharge to road elevation, capacity is 2.om3/sec .
.... -~-. ---~---~·---·---k-~0- ,_,..,r ---~-··--~-·--···----·~--:. _____ • ____ ~----·--~~.---~··-·•--•--·~--~---·---
LOCATION: Third Stree·t
610 mm dia. 914 rmn · d i a •
CULVEE.T: Type~ CSP CSP
Le:1gth~ 17.5 m 17.5 rn
Invert Elevation at Inlet 44.22 m
Invert Elevation at Exit 45.52 rn 44.29 m
GENERAL REMARKS: 1'\.YO culverts, one above the o·ther. There is believed to be a third culvert at an even greater depth. It is not visible and is probably full of gravel so its contribution has been ignored. The 914 Jt@ diameter is probably partly blocked also. P.oad shoulder elevation is 4 G. 9 m
CAPACITY: Assum'ing a) Surcharge t.o 4 6. 8m, just below road leveL b) Inlet control for 610 mrn dia. culvert. c) Outlet control for 914 mm dia. culvert.
Capacities are: 610 rnm dia. 0.6 rn3js~c. 914 rnrn dia. J:...:_.2_..!!.l] I sec~
2.3 m3/sec.
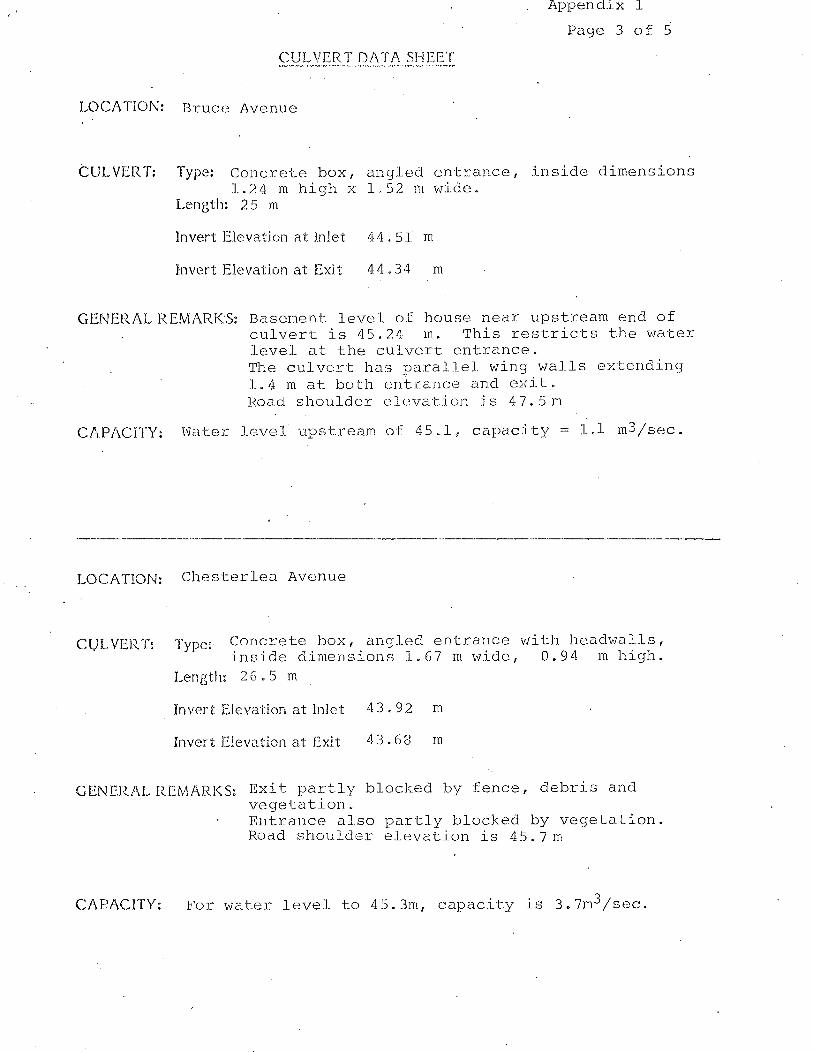
CUL VCR T D/\TA. SI-!EET
Appendix 1
Page 3 of 5
LOCATION: Bruce Avenue
CULVER~ Type: Concrete box, angled entrance, inside dimensions 1.24 m high x 1.52 m wide.
Length: 25 m
Invert Elevation at Inlet 44.51 m
Invert Elevation at Exit 4 4. 34 m
GENERAL REMARKS: Basement level of house near upstream end of culvert is 45.24. m. This restricts the water level at the culvert entrance. The culvert has parallel wing walls ex-tending 1.4 mat both en~rance and exit. Hoad shoulder e1evation is 4 7. 5 m
CAPACITY: \'·la-ter level upstream of 4 5.1, capacity = 1.1 m3 /sec.
------------·----·-----------'"'" ---· -·--------
LOCATION: Chesterlea Avenue
CVLVERI: Type: Concrete box, angled entrance with headwalls, inside dimensions 1.67 m wide, 0.94 m high.
Length: 26.5 m
InvertElevatlor:atlnlet 43.92 m
Invert Elevation at Exit 4 3. 6 8 m
GENER/\L REMARKS: Exit partly blocked by fence 1 debris and vegetation.
CAPACITY:
Entrance also partly blocked by vegetation. Hoad shoulder elevation if> 4 5. 7 m
For water level to 45.3m, capacity is 3.7m3/sec.
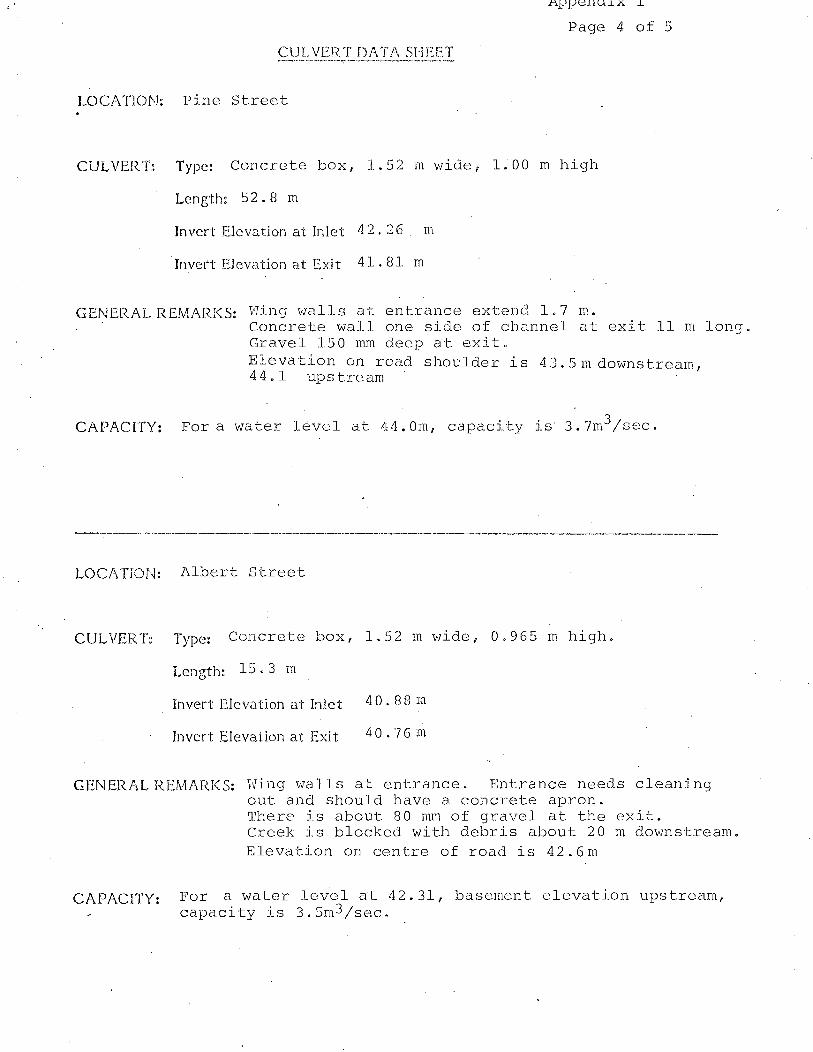
CULVERT DATI\ SHEET
ApJ?ellU.LX .L
Page 4 of 5
LOCf\ TION: Pine Street
CULVERT~ Type: Concrete box, 1. 52 m vlide, l. 0 0 m high
Length: 52. 8 m
Invert Elevation at Inlet 42.26 m
Invert Elevation a.t Exit 41. 81 m
GENERAL REMARKS: VHng walls at entrance ext:end l. 7 m. Concrete wall one side of channel at exit ll m long. Gravel 150 nun deep a·t exit. Elevation on road shoulder is 43.5 m downstream, 44 .l upstream
CAPACITY: For a water level at 44. Om, capaci·ty J_s 3. 7m3 /sec.
----------·---·-------------
LOCATION: Albert s·tree·t
CULVERT: Type: Concrete box, 1.52 m wide, 0.965 m high.
Length: 15. 3 m
Invert Elevation at Inlet 40.88 m
Invert Elevation at Exit 40 · 76 rn
GENERAL REMARKS: Wing walls at entrance. Entrance needs cleaning out and should have a concrete apron.
CAPACITY:
There j.s about 80 Mn of gravel at the exit. Creek is blocked with debris about 20 m downstream. Elevation on centre of road is 42.6rn
For a water level at 42.31, basement elevation upstream, capacity is 3.5m3/sec.
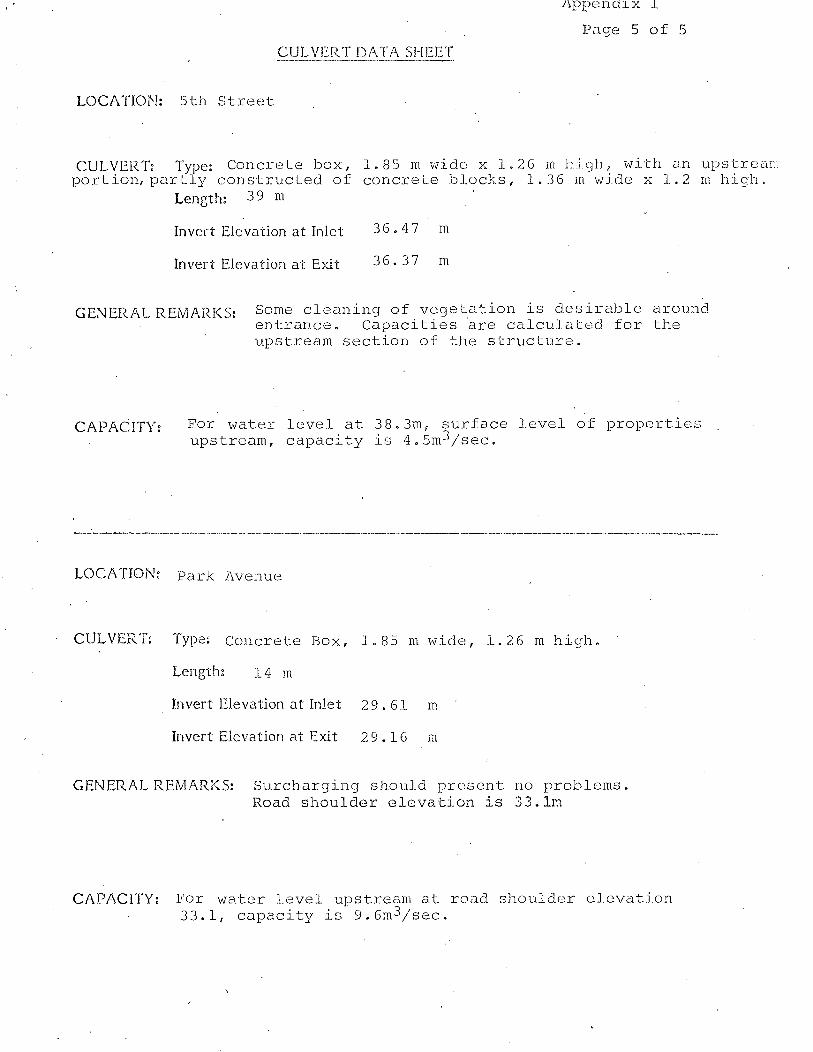
CULVERT DATA SHEET
Appendlx l
Page 5 of 5
LOCATION: 5th Street
CULVERT: Type: Concrete box, l. 85 m vvide x l. 2 6 m hic~h, with an ups trear: portion,partly constructed of concrete blocks, 1.36 m wide x 1.2 m high.
Length: 39 m
Invert Elevation at Inlet 36.47 m
Invert Elevation at Exit 36.37 m
GENERAL REMARKS: Some cleaning of vegetation is desirable around entrance. Capacities ~re calculated for the upstream section of the structure.
CAPA(IT'{: For water level at 38.3m, surface level of properties upstream, capacity is 4.5m3/sec.
LOCATION: Park Avenue
C ULVJ2't7'I'.· 1'y!)"'' c t B l 85 . d l 2 6 l . J , c. onere -e ox, . m Wl e, . . .. m 11g.1.
Length: 14 m
Invert Elevation at Inlet 29.61 m
Invert Elevation at Exit 29.16 m
GENERAL REMARKS: Surcharging should pre;,3ent no problems. Road shoulder elevation is 33.lm
CAPACITY: For water level upstream at road shoulder elevation 33.1, capacity is 9.6m3jsec.

54
52
51
50
49
48
47
46
45
E z 44
0 1-
~ 43
w 42 _J w u 41
1-w 40 0 0 w (!) 39
38
37
36
35
34
33
32
31
30
29
3500m
J...L
Zzw oiO - "':10 l;;O IHtri
(,? l{') 10 1- 1-~...... 0 0 (/) ~r::.: ..J ..J
.
-0 IO -o ..::~
(/)~ WE
--- 0.3°/o -...-.--.. ........... 51 g ·~- r-.
CE -u_CL (/)(f) 7<->
WN CD ~
' '·,J.2%
48.4Z.'
w :::> z w
r CD
'48.04 CL '.,,,, ..
EXISTING DEPRESSION
FLOODS FREQUENTLY
\ STORAGE PLANS 2 8 4
\ \ \ \
VI 1-
fl z
0 rt)
w ~ w
w --z w
I
10 u co (\J :::> r<l . ..... ,,.;
w _J .....
w
i
(/) ' <..> '1.2% \ w ~ w I
~
E E '~// / /L -L / / // / fy
<{ CD
u lJ.J z ~ w w ~
44.22. 44~9-C .L_ L L4~r 44.34 r-.... ..L ............... -"4'\a? t ~
~ ~ ......... 143.68 ""
<..> ' ~ '1.3% t"-......
lJ.J ~ w
~ ' ...... ~ REGRADING PLANS I 8 3 4.:;.~ J.. -&. ::--...,. A n
' 1'- .. ~.
a::'~ ~ . ~":~ . U"' · 0:: . • a::o....: - -
I
2 X 1070 2XI070 2WI070 ' :rso I
2 )( 1070 ]
? )( J (\7() ~llf I?~() ?wl~?n l ?~n
2•1070 l
R R R [A CAT STREAM PROFILE
SCALES: HORIZONTAL 1:5000 VERTICAL 1:100 I
,... uJ w 0:: t-(f)
<(
r:;,
X :I:~
~ ~ E • ~! (\J
<..> (j)l{')
ci C)__:
1070
~wtn7n
A
.... , ,1.3%
' ' ' --
ALTERNATIVE PLANS FOR IMPROVEMENTS :"'
DISTANCE FROM CHASE RIVER IN METRES
A
910
......
0 n.. -
38.40,... w ~ -..
- - _o .5•..4 -- -- w -..._ CD 3~7 ....... ~ -~·47
7 ......
0 ......... ._g.9•,4 i= .................. <..>
~ ~ :"": w
wa:: w Ir;;I-In ~ lL(!)3 X:r:3 -
~EE~:r:E c)lOIOJ-'-~
NCO-N 0::_:.....:~_:_:
LEGEND
---------------------------------------ROAD SURFACE CLJI VERT
INVERT ELEVATION
WATER LEVEL
l. BASEMENT ELEVATIONS
- -- -.-- APPROXIMATE BED OF CREEK
IMPROVEMENTS TO CULVERTS
PLAN N! I. 760 -SIZE OF R.C. PIPE 2 mm DIAMETER
3. 1220
4· -REQUIRED- ·-· A =ADDITIONAL R =REPLACEMENT
ROBINS PARK
FLOODS OCCASIONALLY
~ IL.
~ <t w ~ :::>
' w > ILLl COol ~Q
0.24°/o ~~I~ ct:CDEE ------
' ~ ~~:£
' a.: 0:: __: _;
........
' ~
'{5% w > -", u::
' L&J ........ r\ ·~ ' T 29.61', u
\29.16
' I
, 3000m 2500m 20pom 1500m IOOOm 500m \J,.. ~------------------------------------~'------------------------------------~'------------------------------------~-------------------------------~----~·------------------------------------~------------------------------------~~------------------------------------~1
54
53
52
51
50
49
48
47
46
45
E 44 z
0 ~
43 <{
> w
42 _J w
41 u t-w
40 0 0 w (!)
'39
38
·37
36
35
34
33
32
31
'30
29
FIGURE 15