Embed Size (px)
Citation preview

/
Bison Kills and Bone Counts

PREHISTORIC ARCHEOLOGY AND ECOLOGY A Series Edited by Karl W. Butzer and Leslie G. Freeman

Bison Kills and Bone Counts Decision Making by Ancient Hunters
John D. Speth
University of Chicago Press Chicago and London

JOHN D. SPETH is the author of numerous archeological research reports. He is currently associate professor of anthropology and associate curator of North American archeology at the University of Michigan.
The University of Chicago Press, Chicago 60637
The University of Chicago Press, Ltd., London
~1983 by The University of Chicago
All rights reserved. Published 1983
Printed in the United States of America
90 89 88 87 86 85 84 83 5 4 3 2 1
Library of congress cataloging in Publication Data
Speth, John D. Bison kills and bone counts.
(Prehistoric archeology and ecology) Bibliography: p. Includes index. 1. Garnsey Site (N.M.) 2. Indians of North
America--Southwest, New--Food. 3. Animal remains (Archaeology) --New Mexico. I. Title. II. Series. E78.N65S65 1983 978.9'43 82-21976 ISBN 0-226-76948-8 ISBN 0-226-76949-5 (pbk.)

To my parents, Alfred and Lottie, who introduced me to the beauty and complexity of nature

Contents
Series Editors' Foreword xi
Preface xiii
Acknowledgments xix
Abbreviations xxi
1. Introduction
2. The Garnsey Bison Kill 6
Introduction 6
Physical Setting 6
Present-day Climate 13
Excavation 15
Stratigraphy 16
Spatial Distribution of the Bison Remains 21
Description and Spatial Distribution of the Artifacts 27
Lithic Materials 36
Edge Angles 41
Chronology 45
3. Nature and Condition of the Bison Remains 49

Contents - viii
Inventory 49
Minimum Number of Individuals 49
Taphonomic Considerations 53
4. Selective Procurement at Garnsey 70
Seasonality, Age Structure, and the Selective Procurement of Males 70
Sex Structure: Discrepancy between Cranial and Postcranial Remains 73
Method of Procurement 79
5. Selective Processing at Garnsey 84
Introduction 84
The Modified General Utility Index 87
Processing Decisions at Garnsey: The Treatment £! Both Sexes Combined 89
Discrimination against Females in Processing 94
Fat Depletion in Females under Stress 102
Discrimination against Immature Animals in Processing 113
6. Southern Plains Bison in the Fifteenth Century 118
Introduction 118
Available Forage Species in the Southern Plains 118
Maintenance Requirements of Crude Protein and Phosphorus 119
Present-day Forage Quality in the Southern Plains 121
Prehistoric Range Conditions in the Southern Plains
7. Fat and Human Hunting Strategies
1 3 1
143

Introduction
Environmental Conditions, Animal Physiology, and Fat Levels
Animal Fat and Human Diet --- --- ----- ----8. Discussion and Conclusions
Appendix
Introduction
Measurements
Results
References
Index
Contents - ix
143
145
146
160
1 7 1
1 7 1
1 7 1
180
207
229

Series Editors' Foreword
John Speth takes a methodological approach to inter
preting the Garnsey bison kill, a well-preserved and docu
mented kill site dating from only a century or so before the
introduction of the horse to the Great Plains.
He shows that the bison parts we should expect to find
in large numbers at a kill site are those with least nutri
tional value. Based on these premises, he applies "nutri
tional analysis" to a real bison kill, a method that, as far
as we know, has been applied only once before to archeologi
cal materials. That was in Lewis Binford's seminal Bones:
Ancient Men and Modern Myths, devoted primarily to the cari
bou. Although Speth in some respects follows Binford's
lead, his development of the method improves upon Binford's,
and the greater clarity achieved should do much to establish
its potential.
Speth goes further than Binford by emphasizing that the
nutritional value of a body part does not remain constant
throughout the year, but varies with the season. He also

Series Editors' Foreword - x11
notes that in a species like bison such seasonal variation
will differ between the sexes. The implication is that,
depending on the season in which a kill. is made, the bones
of less valued body parts from one sex will tend to be left
at the site out of proportion to the representation of that
sex in the kill sample; that is, the sex ratio as calculated
from those bones will come to differ from the sex ratio in
the live (or just killed) animals. The sex ratio may also
be different for each body part in the sample left behind at
the kill site: only those bones that have virtually no nu
tritional value in either sex will reflect the original sex
ratio of the animals taken.
An important implication for zooarcheologists, whether
they are working with bison or with other ungulate species,
is that they must calculate the sex ratio from a variety of
body elements, not simply from the one that is most con
venient. Speth's application of the "nutritional utility"
method to the Garnsey bison bones, combined with his de
tailed analysis of their sex and age composition, makes this
volume unique. We believe that not only fauna specialists
but all archeologists concerned with procurement methods and
butchering/processing procedures will find Bison Kills and
Bone Counts of fundamental value.
Karl W. Butzer
Leslie G. Freeman

Preface
The object of this study is to develop an understanding
of the importance of animal physiology in the procurement
and processing decisions of prehistoric bison hunters. Ar
cheologists have long recognized the significance of condi
tion in terms of which animals were likely to be hunted.
Thus most would agree that seasonal differences in the con
dition of males and females favored preferential procurement
of bulls in the spring and cows in the fall and winter.
However, archeologists have largely ignored animal condition
as a factor affecting subsequent processing decisions, as
suming instead that all animals, once killed, would have
been handled in more or less the same manner. This study
attempts to show that processing decisions by prehistoric
hunters were necessarily highly selective, and that in cer
tain circumstances the physiological condition or fat con
tent of an anatomical part may have been as important as its
bulk 1n determining whether it would be removed from a kill
or abandoned.

Preface - x1v
The research that forms the heart of this study began
with the investigation of a seemingly anomalous late prehis
toric bison kill (Garnsey Site) in the Southern Plains re
gion of New Mexico. What made the kill unusual was that it
consisted of a series of spring-season events in which the
preferred targets were bulls, not cows. This contrasts
rather strikingly with the well-known Northern Plains pat
tern in which cows were the principal focus of procurement
activities and hunting took place mostly in the fall and
winter. Not only were bulls the major target at the Garnsey
Site, but many of the cows that were killed were systemati
cally discriminated against during butchering and process
ing. As a result, most of the bones left behind at the site
were from cows, not bulls.
Closer examination of the abandoned skeletal parts
showed that discrimination at Garnsey was directed specifi
cally against animals that were in poorest overall condition
in the spring; that is, pregnant or lactating cows. More
over, discrimination was strongest against anatomical parts,
such as marrow bones, which were most vulnerable to fat de
pletion. These and other observations indicated that the
condition of the animals, particularly their level of body
fat, was indeed an extremely important consideration in the
processing decisions at Garnsey; but it remained to be de
termined why.

Preface - xv
To better understand the importance of fat in the diets
of hunting populations, I turned to contemporary ethnograph
lC and ethnohistoric accounts. From these it immediately
became apparent that fatty foods were highly valued by vir
tually all hunters and gatherers, regardless of latitude.
More interesting, however, were numerous cases, similar to
what had been observed at Garnsey, in which hunters avoided
or abandoned animals they considered too lean for use, even
when the hunters themselves were short of food. This sug
gested that fat was valued not merely for its desirable
taste, but also for more important underlying nutritional
reasons. The next step obviously was to explore the nutri
tional role of fat in hunter-gatherer diets.
Fat is, above all, a highly concentrated source of en
ergy. In addition, at high overall calorie intakes, both
fat and carbohydrate exert a significant and roughly com
parable protein-sparing effect during protein metabolism.
Put another way, the body makes more effective use of die
tary protein when energy is provided by nonprotein sources,
regardless of whether the calories derive from fat or carbo
hydrate. However, at low total salorie intakes the protein
sparing capacities of fat and carbohydrate diverge sig
nificantly. In other words, as total energy intake de
clines, the body loses protein more rapidly if energy is
supplied by fat rather than by carbohydrate.

Preface - xvi
If these observations stand up to further scrutiny,
they have important implications for understanding not only
the highly selective behavior witnessed at Garnsey, but also
several other seemingly enigmatic aspects of hunter-gatherer
subsistence behavior. Hunters and gatherers regularly face
periods of restricted energy intake in late winter and
spring. At such times they often subsist on stored carbohy
drate foods and supplement their diet with hunted foods. It
is precisely at such times that the level of fat in the diet
becomes critical. To make effective use of the protein pro
vided by hunting, hunters must maintain their calorie intake
from fat as high as possible or else find alternative sour
ces of carbohydrate. Briefly, some of the more obvious op
tions open to hunters and gatherers to cope with the nonin
terchangeability of fat and carbohydrate at low total energy
intakes include: (1) being highly selective in the animals
they kill and the parts they consume {as at Garnsey); (2)
switching to species that maintain high body-fat levels
throughout the winter and spring (e.g., beaver or geese);
(3) emphasizing plant gathering rather than hunting in the
fall, in order to build up large carbohydrate reserves; (4)
undertaking limited cultivation; or (5) trading for carbohy
drates with horticulturalists.
Clearly, a great deal of additional research needs to
be done to reliably model seasonal changes in animal condi
tion, and especially to arrive at a satisfactory understand-

Preface - xvii
ing of the effect of these changes on the food-getting
strategies of prehistoric hunters and gatherers. I hope the
Garnsey study will serve as a first step toward these goals~

Acknowledgments
The two seasons of fieldwork at the Garnsey Bison Kill
Site were conducted under Federal Antiquities Act permit 77-
NM-037, issued to the University of Michigan by the United
States Department of the Interior and administered by the
Bureau of Land Management in the State of New Mexico (Ros
well District). Additional work of a limited nature was
conducted at the site during the summer of 1981, under tem
porary Federal Antiquities Act permit 81-EM-036.
I am extremely grateful to Elmer and Jane Garnsey, on
whose ranch the bison kill is situated, for their generosity
and kindness throughout the project.
Much of the funding for the research was provided by
the National Science Foundation (grant BNS-7806875). Ad
ditional funds were provided by the Horace H. Rackham School
of Graduate Studies and by the Museum of Anthropology, both
of the University of Michigan.
Figures 1-20 and 27-28 of this study are reproduced
from Speth and Parry (1980) with the permission of the

Acknowledgments - xx
Museum of Anthropology, University of Michigan. Figure 26
is reproduced with Michael Wilson's permission from his con
tribution in the same report. Figures 21-25, 33, and 36-60
were drawn by Lisa Klofkorn.
Earlier versions of this manuscript were read and crit
ically commented upon by Karl W. Butzer, Richard I. Ford,
Richard G. Klein, Katherine M. Moore, Susan L. Scott,
Katherine A. Spielmann, and Wirt H. Wills, to whom I am most
grateful. Obviously, whatever shortcomings remain in the
study, and there undoubtedly are many, are entirely my own.

Abbreviations
The following abbreviations are frequently used in the
text and figures.
Ast At Ax Calc Car Cer DF DH DMc DMt DR DT F H Lum Man Me Mt
GUI MGUI MNI %MNI
Anatomical Parts
Astragalus Pel Atlas PF Axis PH Calcaneus Ph 1 Carpal Ph 2 Cervical Ph 3 Distal femur PMc Distal humerus PMt Distal metacarpal PR Distal metatarsal PT Distal radius R Distal tibia Scap Femur Sk Humerus Ster Lumbar T Mandible Tar Metacarpal Th Metatarsal u
Others
General utility index Modified general utility index Minimum number of individuals
Pelvis Proximal femur Proximal humerus First phalanx Second phalanx Third phalanx Proximal metacarpal Proximal metatarsal Proximal radius Proximal tibia Radius Scapula Skull Sternum Tibia Tarsal Thoracic Ulna
Percentage (of maximum value of) minimum number of individuals

1. Introduction
Plains hunter-gatherers exercised considerable selec
tivity in hunting bison of a particular sex (cf. Ewers
1958:76; Wissler 1910:41; Point 1967:120, 166; Grinnell
1972:269; see also Appendix Pin Roe 1972:860-61). An ob
vious reason for such selectivity, and the one most widely
discussed in the literature, stems from behavioral charac
teristics that made bison of one sex easier to drive or
manipulate at particular times of year than animals of the
other sex (e.g., Wheat 1972; Frison 1974, 1978; Arthur
1975). Thus, for example, cows with calves were difficult
to handle in the spring because the calves' behavior was un
predictable, and a mother usually followed her calf if it
bolted from the herd. Smaller, more stable bull groups were
common targets in the spring. During the late-summer rut
bulls became much more aggressive and unstable and thus more
difficult to drive. Their disruptive behavior at this time
of year also made females harder to handle. Cow groups be
came the principal focus of hunting in the fall and winter,

Introduction - 2
or.ce the bulls had withdrawn from the herds after the rut
and the calves had matured enough that their behavior was no
longer erratic.
Plains procurement strategies were also clearly keyed
to differences in the nutritional condition of cows and
bulls at different seasons. For example, cows were commonly
avoided in the spring when their condition was poorest but·
became prime targets in the fall and early winter as they
built up reserves of fat to carry them through the winter.
Males, on the other hand, were preferred prey in the late
spring and early summer, when they were in better condition
than the cows, but were avoided during and after the rut
when they often were in poorer shape (Ewers 1958:76; Wissler
1910:41; Wilson 1924:306; Point 1967:120, 166; Grinnell
1972:269; Earl of Southesk 1969:80; Coues 1897:577; Roe
1972:860-61; Lott 1979:429).
Finally, Plains hunter-gatherers chose bison of a par
ticular sex to provide hides for clothing and shelter, and
secondarily to obtain specific by-products of the kill for a
wide range of tools, ritual paraphernalia, and so forth
(Ewers 1955:150, 1958~76). For example, they used cow skins
for robes; lodge covers, doors, and linings~ bedding; cloth
ing; and a variety of leather containers. They sometimes
killed cows in the spring to obtain fetuses, which, in addi
tion to being considered a delicacy by many Plains groups,
were valued for making soft bags and children's clothing.

Introduction - 3
Thicker, tougher bull hides were used to make sinew for bow
strings and bow backings; rawhide strips and thongs; shield
covers; parfleches; bedding; glue; moccasin soles; and so
forth. Some groups took bull tongues for ritual feasting
associated with the Sun Dance (Ewers 1955:150, 1958:74-76,
90; Fletcher and La Flesche 1972:272; Grinnell 1972:175-76,
187, 217-18, 225-27~ McHugh 1972:93; Weltfish 1965:90, 369).
While this list is far from exhaustive, it illustrates the
range of nonfood uses for by-products from bison of each
sex.
It is now commonplace for archeologists to investigate
sex structure in prehistoric bison kills. Such information
provides important insights into procurement strategies:
and, in conjunction with other data such as presence of
fetuses and stage of dental eruption and wear, it has proved
a useful indicator of the season when the hunt took place.
The sex structure of a kill population is usually de
termined by sexing skulls or, more commonly when these are
poorly preserved, by sexing mandibles or one or more post
cranial elements, notably metapodials (e.g., Dibble and Lor
rain 1968; Reher 1974; Reher and Frison 1980; Bedard 1974,
1978). Most prehistoric kill sites from which bison remains
have been sexed have turned out to contain primarily females
(e.g., Dibble and Lorrain 1968; Frison 1973, 1974, 1978~ but
for examples with high proportions of males see Frison, Wil
son, and Wilson 1976 and Wheat 1972). These results are not

Introduction - 4
unreasonable, since most of these same sites, on the basis
of tooth eruption and wear, have been found to be fall and/
or winter kills, a time of year when bison cows were in com
paratively good condition and were most readily manipulated.
While the majority of these kill sites may in fact con
tain primarily females, most studies of the sex structure of
kill populations have implicitly ~ssumed that the propor
tions of male and female skulls, mandibles, or metapodials
recovered archeologically directly reflect the proportions
of males and females killed. This requires that cows and
bulls, once killed, invariably be subjected to nearly iden
tical processing. In light of frequent references in the
historic and ethnographic literature to differential treat
ment of'male and female bison, this assumption is untenable.
The present study examines in detail one clear-cut case
of both selective procurement and selective processing, in
which an initial kill population dominated by bulls was
transformed by preferential removal of male elements into a
discarded residue overwhelmingly dominated by female ele
ments. The specific case to be considered is the late pre
historic spring-season Garnsey Bison Kill in the Pecos Val
ley of southeastern New Mexico.
The study begins with a general overview of the site,
summarizing its stratigraphy and chronology, the method and
seasonal timing of procurement: and the age and sex struc
ture of the original kill population. It then turns to a

Introduction 5
discussion of the nature of processing at Garnsey, examining
in detail the evidence for selectivity by the hunters as
reflected in the proportional frequencies of various male
and female skeletal parts abandoned at the site. The ob
served frequencies are evaluated in terms of the elements'
probable utility values (Binford 1978), providing insights
into some of the major factors that guided or constrained
procurement and processing strategies at the site. The
study concludes with a discussion of both methodological and
more general implications of the Garnsey case for under
standing late prehistoric bison procurement in the Southern
Plains.
2. The Garnsey Bison Kill
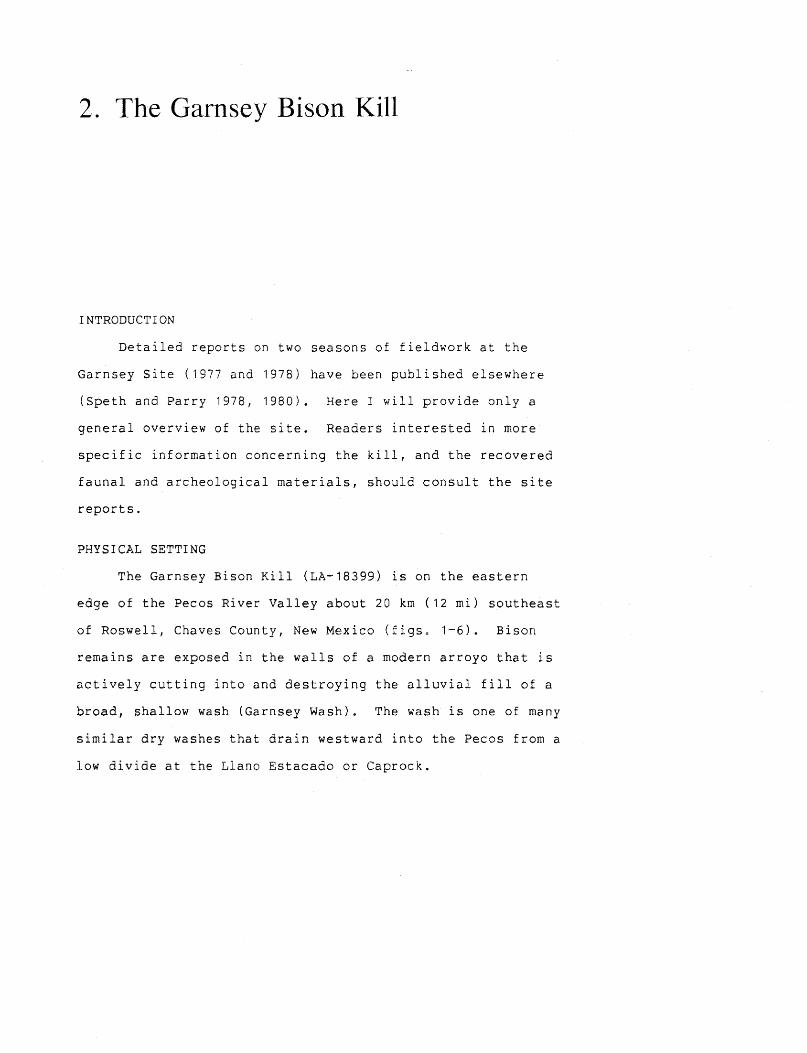
INTRODUCTION
Detailed reports on two seasons of fieldwork at the
Garnsey Site (1977 and 1978) have been published elsewhere
(Speth and Parry 1978, 1980). Here I will provide only a
general overview of the site. Readers interested in more
specific information concerning the kill, and the recovered
faunal and archeological materials, should consult the site
reports.
PHYSICAL SETTING
The Garnsey Bison Kill (LA-18399) is on the eastern
edge of the Pecos River Valley about 20 km (12 mi) southeast
of Roswell, Chaves County, New Mexico (figs. 1-6). Bison
remains are exposed in the walls of a modern arroyo that is
actively cutting into and destroying the alluvial fill of a
broad, shallow wash (Garnsey Wash). The wash is one of many
similar dry washes that drain westward into the Pecos from a
low divide at the Llano Estacado or Caprock.

NEW MEXICO
The Garnsey Bison Kill - 7
f'""l r ---, 1 L -----_.I 1
I : I ._-I I I 1
Ro~well ~-:_:;
CHAVES : ~ COUNTY j -Gar~sey
;----- Site ,J I I I I
I ' L _____ .J
Fig. 1. Location of Garnsey Site in southeastern New Mexico.
The terrain between the Llano and the Pecos, known as
the Mescalero Pediment, consists of low, rolling plains dot-
ted with playas and in many places covered with extensive
dunes. The east side of the Pecos Valley in the Roswell
area is bounded by sheer cliffs, some nearly 30 m high.
Along the base of the cliffs, and cutting deeply into them,
are numerous large circular sinkholes, in several cases

26
.,, .,.
33
I : T l1
S
!fiB-
------
---:-·
w'w
"''-o
---,-----------~J~
·-tB
ott
om
:less
L
ak
es--
----
----
__ , _
_ --
•--
__
__
__
__
_
·Sta
te
• P
ark
I
: i
:
36
/I
:;~
L7~
L,,,
o~
0 :
lh
1
Mile
s
50
F
t
Fig
. 2
. B
ott
om
less
L
akes
are
a,
New
M
exic
o,
sho
win
g
locati
on
o
f G
arn
sey
S
ite
(ad
ap
ted
fr
om
U
SGS
Bo
tto
mle
ss
Lak
es
7.5
M
inu
te
Qu
ad
ran
gle
, T
op
og
rap
hic
S
eri
es).
_"'.#
1.0.0

The Garnsey Bison Kill - 9
Fig. 3. Aerial photograph of Bottomless Lakes area (arrow denotes location of Garnsey Bison Kill Site) (BLM-ARS Series; date 09-30-73~ image 7-51-21; original negative scale 1:31, 680).

The Garnsey Bison Kill - 10
Fig. 4. Aerial view of Garnsey Wash facing west (left arrow indicates location of principal excavations at kill site; center arrow denotes location of spring; right arrow indicates position of test trenches at Garnsey Spring campsite) (Dimmitt Lake and Lea Lake visible in background; photo taken July 1978).
forming deep lakes. Six of the largest lakes are included
within Bottomless Lakes State Park. A seventh, privately
owned Dimmitt Lake, lies just south of the park (fig. 2).
The mouth of the Garnsey Wash opens into the Pecos Val-
ley near the southeastern boundary of the park, between Dim-
mitt Lake and Lea Lake. The site itself is about 350 to 650
m upstream or east from the mouth (figs. 3 and 4).
The wash today is dry throughout most of the year.
Temporary ponded water occurs in some of the more deeply

The Garnsey Bison Kill- 11
Fig. 5. Aerial view of Garnsey Wash facing south, showing principal excavations at kill site in 1977 (near side of arroyo to right of van~ backfilled) and in 1978 (both sides of arroyo opposite van and at extreme right) (East Dimmitt Wash and vertical sink wall of Dimmitt Lake visible in right background; photo taken July 1978).
scoured stretches of the arroyo after heavy spring rains,
and occasionally the arroyo flows for several hours after
summer cloudbursts. Permanent potable water is available at
nearby Dimmitt Lake and also at a spring in a small tribu-
tary off the main wash about 300 m east (upstream) of the
site (fig. 4). The water from the spring supports a rela
tively lush growth of grasses (principally sacaton, Sporobo-

The Garnsey Bison Kill - 12
Fig. 6. General view of Garnsey Wash and modern arroyo, facing southwest (south wall of Dimmitt sinkhole visible in background; datum C at instrument in left foreground; photo taken June 1977).
lus airoides) and trees (historically introduced salt cedar,
Tamarix ~ntandra). The water rapidly seeps into the ground
or is lost to evaporation, so that none reaches the floor of
the main wash.
The present-day vegetation in the area of the site has
been altered significantly by arroyo cutting and subsequent
lowering of the water table. Overgrazing also has helped
reduce the local vegetation cover and has favored increases
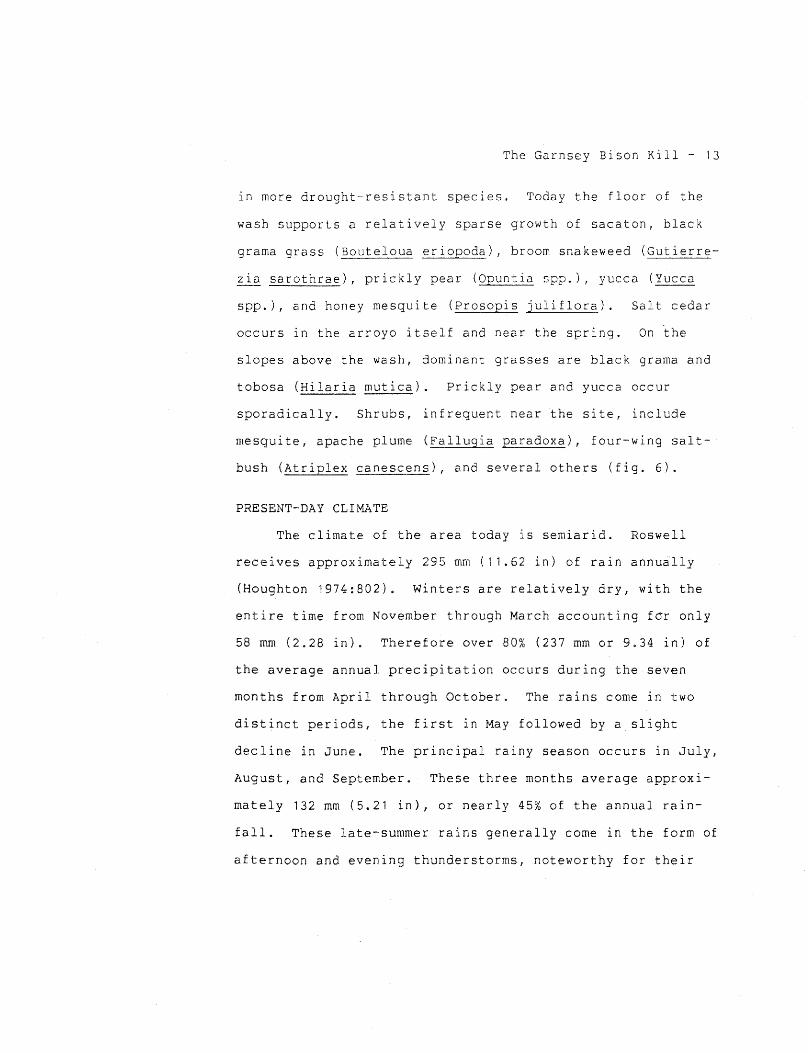
The Garnsey Bison Kill - 13
in more drought-resistant species. Today the floor of the
wash supports a relatively sparse growth of sacaton, black
grama grass (Bouteloua eriopoda), broom snakeweed (Gutierre
zia sarothrae), prickly pear (Opuntia spp.), yucca (Yucca
spp.), and honey mesquite (Prosopis juliflora). Salt cedar
occurs in the arroyo itself and near the spring. On ~he
slopes above the wash, dominant grasses are black grama and
tobosa (Hilaria mutica). Prickly pear and yucca occur
sporadically. Shrubs, infrequent near the site, include
mesquite, apache plume (Fallugia paradoxa), four-wing salt
bush (Atriplex canescens), and several others (fig. 6).
PRESENT-DAY CLIMATE
The climate of the area today is semiarid. Roswell
receives approximately 295 mm (11.62 in) of rain annu~lly
(Houghton 1974:802). Winters are relatively dry, with the
entire time from November through March accounting f6r only
58 rnm (2.28 in). Therefore over 80% (237 mm or 9.34 in) of
the average annual precipitation occurs during the seven
months from April through October. The rains come in two
distinct periods, the first in May followed by a slight
decline in June. The principal rainy season occurs in July,
August, and September. These three months average approxi
mately 132 mm (5.21 in), or nearly 45% of the annual rain
fall. These late-summer rains generally come in the form of
afternoon and evening thunderstorms, noteworthy for their
The Garnsey Bison Kill - 14
great variability in intensity, frequency, and spatial oc
currence. Hail may also occur.
The average annual precipitation values in southeastern
New Mexico and the Southern High Plains do not differ great
ly from values recorded in many parts of the Southwest or in
the Central and Northern High Plains (cf. Court 1974:
fig. 11). Looked at more closely, however, there are cer
tain aspects of the precipitation pattern in the Southern
High Plains that differ from those in surrounding areas and
that may have been very important to human groups utilizing
the region. First, a lower proportion of the total annual
precipitation falls during the winter months in southeastern
New Mexico than in other areas of the Southwest, and peak
summer rainfall comes somewhat later in the season. Second,
the average ratio of median precipitation to mean precipita
tion in the Southern High Plains (less than 75%) more close
ly resembles values in southern Arizona and the Great Basin
than values on the Colorado Plateau or in the Central or
Northern Plains (Court 1974:212). Finally, the coefficient
of variation of arinual precipitation for the period 1931-60
(over 40%) is higher than anywhere else in the Southwest or
Plains (Court 1974:211).
Summers in Roswell are warm. Average daily maxima ex
ceed 32°C (90°F) from June through August. Daytime highs
above 38°C (100°F) are common. Winters are mild. The aver
age daily high, even in January, the coldest month, is

The Garnsey Bison Kill - 15
12.8°C (55.1°F). Average minimum daily temperatures drop
below freezing from mid-November through mid-March, but
temperatures rarely reach 0°F (-18°C). The average length
of the frost-free season is 206 days, from 7 April through
30 October (Von Eschen 1961:51).
EXCAVATION
Two seasons of excavation were conducted at the Garnsey
Site (1977 and 1978} under Federal Antiquities Act permit
77-NM-037, issued to the University of Michigan by the
United States Department of the Interior and administered by
the Bureau of Land Management in the State of New Mexico
(Roswell District). Two excavation units were opened in
1977 (77-1 and 77-2; see fig. 7), exposing a total area of
approximately 120m2 • In 1978 the unexcavated strip between
77-1 and the northern edge of the arroyo was examined
(trench 78-1). This unit opened an area of about 44m2 . In
addition, a small unit, 8m2 , was opened at the northern
edge of 77-1 (78-5). Five trenches were opened on the south
side of the arroyo in 1978 (78-2, 60 m2 ; 78-3, 38 m2 ; 78-4,
60m2 ; 78-6, nearly 8m2 ; 78-7, 9m2 ), bringing the total
area excavated in the second season to 227 m2 .
The two southernmost rows of grid squares in trench
78-2 were terminated after preliminary testing indicated
they were sterile. Trench 78-3, a long, narrow unit extend-

The Garnsey Bison Kill - 16
ing south away from the arroyo, also proved sterile and was
terminated.
Trenches 78-6 and 78-7 were small units exposed on the
south side of the arroyo nearly 100m downstream (west) from
78-2. These units were opened to salvage large quantities
of bison bone unexpectedly exposed early in the 1978 season
by flash flooding. Trench 78-6 was the first of these units
to be opened and was begun before the grid system had been
extended to this area of the site. The orientation of the
unit therefore deviates from that of the other trenches.
STRATIGRAPHY
Bison remains are exposed in both walls of the Garnsey
arroyo along a stretch of nearly 300 m, beginning approxi
mately 350 m upstream from the mouth of the wash. The re
mains form numerous small, spatially discrete clusters, each
containing up to several hundred almost completely disartic
ulated bones. These clusters vary in depth from about 1.2
to 1.7 m below the present surface of the wash, although
scattered remains and occasional small clusters occur both
at shallower and at greater depths. Nowhere in the Garnsey
Site do bison remains form thick, continuous layers com
parable to the "bone beds" of many Northern Plains kills
(e.g., Vore Site; see Reher and Frison 1980).
Four stratigraphic units (A through D) were recognized
in the 2- to 4-m thick section of alluvium exposed by the

Fig
. 7
. G
arn
sey
S
ite
(LA
-18
39
9),
sh
ow
ing
are
as
ex
cav
ate
d
in
19
77
an
d
19
78
.
'01-
1078~-
\07
9
GA
RN
SEY
C
HA
VE
S
CO
. N
.M
CO
NT
OU
R
INTE
RV
AL
1.0
M
., D
ATU
M
o M
E,:[
].S"'2
o
'b~
The Garnsey Bison Kill - 18
Garnsey arroyo. Only the upper three (A through C) are of
concern here. Unit A, the uppermost unit, consists of ap
proximately 1.2 m of finely laminated silt and sand with oc
casional thin lenses and stringers of fine gravel, particu
larly in the lower part of the unit (fig. 8; sediment
samples V-ZZZ).
Unit B, the principal archeological unit at the site,
is considerably coarser than unit A, consisting of numerous
lenses of pea-sized and larger gravel (fig. 8; sediment
samples K-U); The gravel lenses are distinctly graded, and
in many places several graded sequences are directly super
posed. Within unit B is a distinctive greenish gray cienega
or "wet-meadow" horizon that may be traced along the walls
of the arroyo for more than 100 m {fig. 8; sediment sample
P). In places the horizon is only 10-15 em thick, but else
where it exceeds half a meter. When wet the cienega dis
plays blotchy, rust-colored limonite mottling. When dry it
becomes extremely hard, with distinct vertical blocky joint
ing. Although the clay content of the cienega is much high
er than in the rest of unit B, the presence of thin lenses
of gravel within the horizon attests to continued periodic
torrential deposition.
Unit C, 2.5 to 4.0 m below the surface of the wash,
consists of deposits somewhat finer than those of unit A and
lacks the fine laminae that characterize the latter (fig. 8;
sediment samples C-J). A thick greenish gray cienega hori-

0 80
0
SAN
D(%
) SI
LT(%
) C
LAY(
%)
0 70
GR
AN
UlE
S PE
BBLE
S(%
)
SMAL
LER
G
RA
IN S
IZE
--
0 2.
50
MEA
N(0
)
Fig
. 8
. T
ex
tura
l an
d
pH
an
aly
sis
o
f d
eep
arr
oy
o p
ro
fil
e
(so
uth
ed
ge
of
gri
d
sq
uare
H
-2
or
50
8S
50
2W
; see
fig
s.
1 an
d
10
fo
r ap
pro
xim
ate
lo
cati
on
),
sho
win
g str
ati
grap
hic
u
nit
s
A-D
an
d
pri
ncip
al
cie
neg
a
ho
rizo
ns
(sed
imen
t sa
mp
les
I an
d
P).
N
um
ber
s at
left
of
fig
ure
g
ive ab
so
lute
ele
vati
on
in
m
ete
rs.
POO
RER
S
OR
TIN
G--
0 1.
50
SOR
T I N
G(o
0)
7.5
8.0
pH

The Garnsey Bison Kill - 20
zon, very similar to the one in unit B, occurs near the top
of unit C (fig. 8; sediment sample I).
The cienega horizons in units B and C can be followed
along the walls of the arroyo for considerable distances.
Thus they provide useful horizon markers in deposits that
otherwise are characterized by rapid and frequent lateral
facies changes. In many parts of the arroyo the cienegas
are visible simultaneously in both walls. Elsewhere they
are present in only one wall, where they may be traced for
several meters before shifting to the opposite wall. When
followed laterally out of the main arroyo into minor tribu
taries, the horizons rise slightly and pinch out within a
few meters. The cienegas therefore appear to delineate the
course of a major broad channel, probably on the order of 5
m wide and perhaps up to 1 m deep, that may have been peren
nially moist or have contained ponded water. Periodic tor
rential flooding deposited lenses of gravel within these
moist or ponded stretches of the wash. The consistent su
perposition of cienega horizons indicates that the location
of the main channel has remained relatively stable through
out unit C and unit B times. Moreover, the modern arroyo,
which is cutting into the alluvial deposits in the wash, ap
pears to be following more or less the same course.
During unit B and unit C times, there were two or three
small, shallow, braided channels paralleling the main chan
nel on the north. These peripheral channels contain graded

The Garnsey Bison Kill - 21
deposits of gravel but show no evidence of having contained
ponded water. During unit A times the peripheral channels
were filled in with fine sediments, confining flow to the
main channel.
The vast majority of bison remains and associated cul-
tural material are found within the upper half-meter of unit
B, above the cienega horizon. Occasional bison remains oc-
curred in the lower part of unit A, and a few were found
within or below the unit B cienega. In all, six thin, spa-
tially discontinuous "bone levels" were recognized (A1-2;
B3-6). Of these, only level B3 contained significant quan
tities of material (nearly 90% of the total inventory of
bones from the two seasons of excavation).
SPATIAL DISTRIBUTION OF THE BISON REMAINS
Regardless of stratigraphic level, the bison remains
are confined to a relatively narrow zone along both flanks
of the main channel and along the flanks and bottoms of the
small parallel channels. Originally the remains probably
also extended across the bottom of the main channel, but
these have been obliterated in the past twenty to thirty
years by arroyo cutting. Although the overall distribution-
al pattern of bison remains is to some extent a product of
periodic torrential flooding in the Garnsey Wash, it largely
reflects a procurement strategy in which bison were sur-

The Garnsey Bison Kill - 22
rounded, or ambushed, and butchered in or close to the main
channel.
Figure 9 is a computer-generated north-south section or
"backplot" that illustrates the tendency at Garnsey for
bones to be concentrated along the flanks and bottoms of
channels. The plot was constructed by projecting all the
bones in eight parallel north-south rows of grid squares at
the east end of the site (trenches 77-1, 78-1, and 78-5)
onto a single vertical north-south plane, so that only the
depth of each item and its north-south position are consid
ered. The figure shows a concentration of bones, particu
larly in level B3, on the north flank of the main prehistor
ic channel, whose position more or less coincided with that
of the modern arroyo (i.e., to the right or south of square
5115). The plot also shows a heavy concentration of materi
al on the flanks and bottom of a small, shallow channel to
the left or north of the main channel (i.e., centered ap
proximately in squares 5055 and 5065).
The bison remains in each "bone level" occur in small,
spatially discrete clusters or concentrations, separated
from similar quasi-contemporary clusters by zones with few
or no remains (see figs. 10, 11, and 12 for the spatial dis
tribution of level B3 materials; the sample size from other
levels is too small to warrant illustration). While most
clusters probably reflect discrete procurement events, the
time between events within the same level is probably very

lOOcm 22
cO---~~ 11 1
f-z ==:>~--::--:-...,---......,
5015 --N~-
200cm
METERS IHOR.J 0 1 2 3
5065 1 1
1 1 11X 1X2
X 1 1
The Garnsey Bison Kill - 23
2 17
11
SURFACE
1 1
ARROYO
SECTION (501-508W) N=657 KEY: 1 11 ITEMJ
X 1>9 ITEMSJ
Fig. 9. Computer-generated north-south section or "backplot" (viewer facing east) of bison bones on north side of modern arroyo; plot constructed by projecting all items in eight parallel north-south rows of grid squares (501W to 508W; trenches 77-1, 78-1, and 78-5) onto a single north-south plane.
short, perhaps only a few days or weeks or at most a f~w
years. Radiocarbon dating (see below) indicates that the
entire 2- to 4-m alluvial sequence exposed in the Garnsey
arroyo represents a comparatively short period, probably on
the order of a few centuries or less.
Individual kill events varied in size from relatively
small ones, in which only four or five animals were taken,
to occasional substantial ones, in which fifteen to twenty

J:' 501W ,
, --;
1,,.,
>O
W
_,•
;.
;o;;
':
I
I "
' I
I . I t+n
'i
~-l~-·~---·
_lj_,.~I'1,_j_:'-l
~ ~_\Jj. I
I_
, ~
1.;
,ttf-J i ,_~_
--___ ,:--------
__
!~_,j I
' ~ '
----~---'
" I
'"~ '
I !
. . .
.·.
. . ·I
.. ·
:r ,
-. ·-·
. ·+
i
.. ; .
--
--+
-.
; "
'; ·.~;;: ",
,' _
_ _
j: _
__ ,:
-1
i , ~-· ..
. _.
-;-':j-
.i',.jJ
A: .'
'• ':::
! :-
·::'
· :;
.. ;·
r-
1
Y, ' .1 .
. ··I
I 1-•·".: 1.-----
-~+ I ,,
I ,,,
,,',"
"'·;m
,:"j
·"-
.1'
1
,-.. :
"'
.:
.. ,J_
/
~-~t-J---··t·
:;.r •? 1•
• • _
j , .J
:-.r~::·
:"f "·' 1 ,.',1 '
· ·_._
~ ~ : .. :-
r: ::; :·:
:·;, j
---r
---'-
J ..
..
,'1
, ...
4"""'1
~-.---·
±±·~. -. ~ I
, ...
. ·
.... ,-"'' ..
....
,,.· -~
~.·--,
r-tttt
' · .. ,.
,.,,.,:.,.; iil'
j ----+-'-
~1·' ,-
i '
:,.,.
, ·-
i --~
-t~· _
· .. ;:_;,
(:i
;· I,.
I ,.
': .·
, ~--
-· .
'___]_
.
, ... 2
.:---.
--"-·-
__'_
_j
. , .
r· .
,
~ -
---'·::,:
.:.:;;,;~;,:
~·;":~,L:[:~
:tt' ·~~~.t·,··
:·:!]/,
,' 1
""''.
1'"
' 1,
' "',
''"
,"---!_
'
I'
,,
• •
' '
--I
= ,,_
,~
_ __:_
... ~·~---'
TOTA
L B
ON
E
LEVE
L B3
IN=3
313)
KEY·
1
ll IT
EM
) X
1>9
1TE
MS
I
----
AR
RO
YO
MET
ERS
0 _
-1--
2-
3
Fig
. 1
0.
Co
mp
ute
r-g
en
era
ted
scatt
erp
lot
of
lev
el
83
b
iso
n
rem
ain
s in
tr
en
ch
es
77
-1,
77
-2,
78
-1,
an
d
78
-5
(see fi
g.
7 fo
r tr
en
ch
d
esig
nati
on
s).

/
The Garnsey Bison Kill - 25
(-:rG -----' / \ --,__ ,. -,\ ·-.. ,_ ..... )) .
--------- \ :::. ::.:!----------/
~ --ARROYO
TOTAL~ LEVEl B3 !N=33131
0 DENSITY !MODERATE) 0 DENSITY IHIGHI A BONE CLUSTER
METERS 0 I 2 3
501S
f---1--
1--1--
-f--
> H (/
I
-
I I 1 15185 499W
Fig. 11. Principal level B3 bone clusters in trenches 77-1, 77-2, 78-1, and 78-5 (see fig. 7 for trench designations).
or more animals were killed (the largest cluster, which was
partially d~stroyed by arroyo cutting and only partially ex
cavated, contained at least fifteen skulls). A "typical" or
average kill probably involved six to eight animals.
Butcheiing reduced the bison carcasses to piles of al
most totally disarticulated remains. To some extent the
disarticulation is due to fluvial disturbance (to be dis-
cussed more fully below), but even in clusters where such
disturbance was minimal, very few elements were found in an-
atomical order. Articulated parts were most commonly the

524S
I /~
23112 1 2
2321f11
m 11~ 4 4 1 1 21 23 21
13 21 22 3221311 1-1311 1 2244--t--12162 31
1 2 3211 1 24123 11 2361 2783 2364116534611 21 12
123 26X4622312211 21 1 J 1212 1361 4 1122 31
,,, 1~17i2~~m 3~1 li2..2" -1 32122 1 3122
1 4 1~3~1~"13~, I 1 1 1 15211
2 1 4 6 3 1222 '-----'----11
598W
METERS 0 1 2 3
The Garnsey Bison Kill 26
TOTAL BONE LEVEL B3 N= 1445 KEY: l (liTEM)
X (>9 ITEMS)
Fig. 12. Computer-generated scatterplot of level B3 bison remains in trenches 78-6 and 78-7 (see fig. 7 for trench designations).
feet and lower portions of the forelimbs (from the radius
down) or occasional short series of thoracics, lumbars, or
cervicals. Butchering units such as those encountered at
Olsen-Chubbuck (Wheat 1972) or Casper (Frison 1974) were
virtually nonexistent (the single exception was the front
end of an adult female that included the head, neck, fore-
limbs, and anterior portion of the thorax).
Limited secondary processing took place near the edge
of the main channel somewhat upstream from the kill-

The Garnsey Bison Kill - 27
butchering areas (trenches 78-2 and 78-4; see fig. 7). Two
small basin-shaped hearths were found in level B3 in this
area, ringed by aprons of highly fragmented bone (fig. 13),
hundreds of tiny retouch or resharpening flakes, and a
variety of formal stone tools. A north-south section or
"backplot" through the processing area (fig. 14) illustrates
the stratigraphy in this portion of the site and clearly
shows the location of the south flank of the main prehistor-
ic channel. Most of the bone fragments were unidentifiable,
though many clearly were derived from limbs, ribs, and ver-
tebral processes (table 1). Fire-cracked rock and ceramics
were extremely rare.
It is quite likely that similar small processing areas
remain undiscovered within the wash, each situated in the
general vicinity of one of the kill-butchering localities.
Although a large quasi-contemporary campsite has been lo-
cated on a terrace above the wash about 400-500 m east of
Garnsey (figs. 2 and 4), there is no evidence that activi
ties at this site were connected to those at the kill. No
other campsites, which might have served as processing lo-
calities associated with Garnsey, have been found in the
area.
DESCRIPTION AND SPATIAL DISTRIBUTION OF THE ARTIFACTS
The sample of artifacts from the Garnsey Site is rela
tively small and is overwhelmingly dominated by unmodified
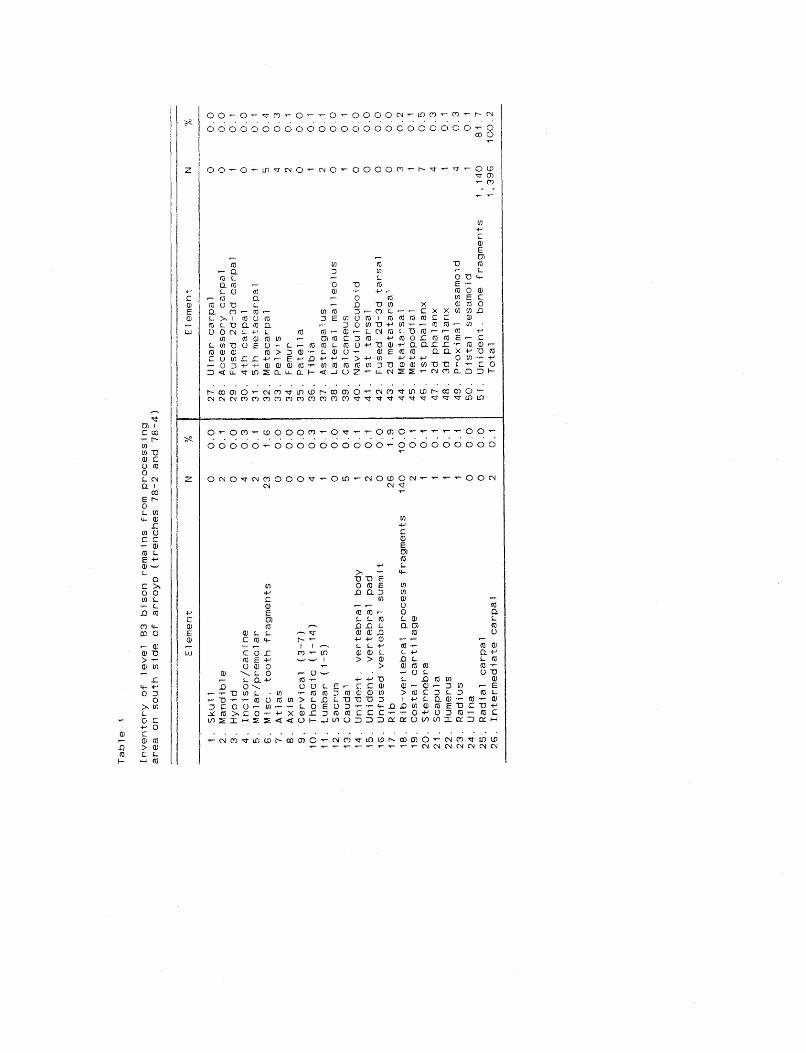
Tab
le
1
Inv
en
tory
o
f le
vel
83
b
iso
n
rem
ain
s fr
om
p
rocessin
g
are
a
on
so
uth
sid
e
of
arr
oy
o
(tre
nch
es
78
-2
an
d
78
-4)
Ele
men
t
1.
Sk
ull
2
. M
an
dib
le
3.
Hy
oid
4
. In
cis
or/
can
ine
5.
Mo
lar/
pre
mo
lar
6.
Mis
c.
too
th
frag
men
ts
7.
At
1 as
8.
Ax
is
9.
Cerv
ical
(3-7
) 1
0.
Th
ora
cic
(1
-14
) 1
1.
Lu
mb
ar
(1-5
) 1
2.
Sacru
m
13
. C
au
dal
14
. U
nid
en
t.
vert
eb
ral
bo
dy
1
5.
Un
iden
t.
vert
eb
ral
pad
1
6.
Un
fuse
d
vert
eb
ral
sum
mit
1
7.
Rib
1
8.
Rib
-vert
eb
ral
pro
cess
frag
men
ts
19
. C
osta
l carti
lag
e
20
. S
tern
eb
ra
21
. S
cap
ula
2
2.
Hu
meru
s 2
3.
Rad
ius
24
. U
lna
25
. R
ad
ial
carp
al
26
. In
term
ed
iate
carp
al
N
0 2 0 4 2 2
3
0 0 0 4 1 0 5 1 2 0 2
6
14
0
2 1 1 1 1 0 0 2
%
0.0
0
.1
0.0
0
.3
0.1
1
. 6
0.0
0
.0
0.0
0
.3
0.1
0
.0
0.4
0
. 1
0.
1 0
.0
1.9
1
0.0
0
. i
0.1
0
.1
0.
1 0
.1
0.0
0
.0
0.
1
Ele
men
t
27
. U
lnar
carp
al
28
. A
ccesso
ry
carp
al
29
. F
use
d
2d
-3d
carp
al
30
. 4
th carp
al
31
. 5
th
meta
carp
al
32
. M
eta
carp
al
33
. P
elv
is
34
. F
emu
r 3
5.
Pate
lla
36
. T
ibia
3
7.
Astr
ag
alu
s
38
. L
ate
ral
mall
eo
lus
39
. C
alc
an
eu
s
40
. N
av
icu
locu
bo
id
41
. 1
st
tarsal
42
. F
use
d
2d
-3d
ta
rsal
43
. 2
d m
eta
tars
al
44
. M
eta
tars
al
45
. M
eta
po
dia
l 4
6.
1st
ph
ala
nx
4
7.
2d
p
hala
nx
4
8.
3d
p
hala
nx
4
9.
Pro
xim
al
sesam
oid
5
0.
Dis
tal
sesa
mo
id
51
. U
nid
en
t.
bo
ne
frag
men
ts
To
tal
N
0 0 1 0 1 5 4 2 0 1 2 0 1 0 0 0 0 3 1 7 4 1 4
1'
14
0
1 '3
96
%
0.0
0
.0
0.1
0
.0
0.
i 0
. 4
0.3
0
.1
0.0
0
.1
0.
i 0
.0
0.1
0
.0
0.0
0
.0
0.0
0
. 2
0.1
0
.5
0.3
0
. 1
0.
3 0
.1
81
.7
10
0.2

'{0
--~R
RO
,,,[I~~-1---
-§~JT:E~t~;f
--1--:--1--r
-~-rm·,
l :
:
1-----
-~----
--l
' '
MET
ERS
0 1
2 3
Fig
. 1
3.
Co
mp
ute
r-g
en
era
ted
scatt
erp
lot
of
lev
el
83
b
iso
n
rem
ain
s in
th
e
pro
cess
ing
are
a
(tre
nch
es•7
8-2
an
d
78
-4;
see fi
g.
7 fo
r tr
en
ch
d
esig
nati
on
s).
I I
TOTA
L B
ON
E LE
VEL
B3 !N
=l39
7l
KEY,
1 (li
TEM
) X
(>91
TEM
S)
0 H
EAR
TH

SURFACE
METERS IHor.l 0 1
The Garnsey Bison Kill - 30
LEVEL 1 _________ ------------uvEc:z------2-- 27 4
2 1 1
13 31211~---;- 1
1 9 4 14 j 2 223 j 50
2XX X91X752 B8X11 1 4 1 72 X 4 Cm
LEVEL 3
1 2 6 8 1 1 1 7
~ ~- ----------------------cEiiEr4--
f---~5;:-:-1-:-:15:----~-5::-:1-::-2-5 -~-5-1_3_5 --.,..--5-1_4_5 ---+100 em
~N--
SECTION (477W) KEY: 1 11 ITEMI
X 1>9 ITEMS! ~ IHEARTHII
No3Q9
Fig. 14. Computer-generated north-south section or "backplot" (viewer facing east) of bison bones in processing area on south side of modern arroyo: plot constructed by projecting all items from single north-south row of grid squares (477W; trench 78-4) onto a single north-south plane.
flakes and tiny retouch and resharpening spalls. Of a total
of 801 lithic items, 459 (57.3%) are small, unmodified
flakes, 253 (31.6%) are tiny retouch and resharpening
spalls, most of which come from the secondary processing
area, and 40 (5.0%) are larger utilized flakes. Only 49
(6.1%) formal lithic tools were recovered. Of these, 3
(0.4%) are cores, 19 (2o4%) are unifacially retouched pieces
(excluding endscrapers), 6 (0.7%) are endscrapers, 3 (0.4%)
are ovate bifaces, 8 (1.0%) are bifacial knife fragments,
and 10 (1.2%) are projectile points. Several broken limb

The Garnsey Bison Kill - 31
bones may have served as choppers, but none are unambiguous
tools.
The spatial distribution of level B3 lithic tools, re-
sharpening flakes, and debitage in the kill-butchering and
processing areas is illustrated in figures 15, 16, and 17.
The boundaries of the lithic clusters correspond very close
ly to those of the bison bones. The relative abundance of
artifacts in the processing area, particularly projectile
points and scrapers, compared with the scarcity of these
items in the bone clusters, is noteworthy.
~ -ARROYO
!TOTAl~ LEVEL B3 tN·195l
KEY• 0 LITHIC DENSITY ~21M2
C: LITHIC DENSITY ;;.41M2 O ~ETE~S J .o. POINT, * SCRAPER, e BIFACE
5015
I--!-
I I I I I I ! 15"'
A99W
Fig. 15. Computer-generated scatterplot of level B3 lithic items in trenches 77-1, 77-2, 78-1, and 78-5 (see fig. 7 for trench designations).
-

The Garnsey Bison Kill - 32
TOTAL LITHICS LEVEL B3 (N=2l)
5245 KEY' 0 DENSITY ~21M2
r ' DENSITY ~41M2 I ' 598W
/ METERS 0 1 2 3
Fig. 16. Computer-generated scatterplot of level B3 lithic items in trenches 78-6 and 78-7 (see fig. 7 for trench designations).
In the second field report on the Garnsey Site (Speth
and Parry 1980:165-67), it was observed that the values of
most size-related attributes of unmodified flakes and debi-
tage (e.g., length, width, weight) decreased progressively
from level B4 to level A2, while the values of several tech-
nological attributes (e.g., medial axis angle, length/width
ratio, and perhaps platform angle) remained nearly constant
or showed no clear-cut trend. This apparent directional
trend in flake size was dismissed as an artifact of our hav-
ing included in the computations a very large and heavy out-
lier in level B4 and a moderately large outlier in level B3.

The Garnsey Bison Kill - 33
.479W
\ *I •• Iii r--~o .. ,-----!1 -~'+- --.-
11 ~~ ~ \ . i/1
I __ I l/ J I --- 5
I -ov
i
I . I
l I
-r -1\j I
TOTAL LITHICS LEVEL B3 IN·200l
I I
Ab5V.
5
'T' I
s '~' '" I
I_~ t:-::: _____ I I
--
KEY• Q liTHIC DENSITY ~21M2
C) liTHIC DENSITY ~41M2
0 HEARTH 494W
METERS ,. POINT; *SCRAPER; • BlfACE ------ ----- 0 l 2 3
Fig. 170 Computer-generated scatterplot of level B3 lithic items in processing area (trenches 78-2 and 78-4; see fig. 7 for trench designations).
Subsequent reexamination of these data using median rather
than mean values revealed that the trend was indeed real
(the median is much less sensitive than the mean to the in-
elusion of extreme values). Finally, when four exception-
ally large outliers were excluded, the trend was enhanced
rather than diminished. The data (minus these four out-
liers) are summarized in table 2.
Experimental fracture studies in which steel balls were
dropped from an electromagnet onto glass prisms of different
sizes and platform angles have shown that flake size de-
creases with decreasing core (or tool) size, all other

Tab
le
2
Metr
ic att
rib
ute
s
of
un
mo
dif
ied
fl
ak
es (~4
mm
) b
y str
ati
grap
hic
le
vel
fro
m
Garn
sey
S
ite
Lev
el/
Att
rib
ute
N
M
inim
um
M
axim
um
Lev
el
A2
Len
gth
(m
m)
74
2
.0
58
.0
Wid
th
(mm
) 7
4
3.0
3
7.0
B
ulb
th
ick
ness
(mm
) 51
0
.5
10
.0
Max
imum
th
ick
ness
(mm
) 7
4
0.5
1
6.0
M
ed
ial
ax
is
an
g 1
e ('
)
46
7
0.0
1
40
.0
Pla
tfo
rm
an
gle
(')
4
3
20
.0
12
5.0
W
eig
ht
(g)
74
0
.0
24
.2
Pla
tfo
rm
wid
th
(mm
) 4
9
1.0
2
1.0
P
latf
orm
th
ick
ness
(mm
) 4
9
0.0
7
.0
Len
gth
/wid
th rati
o
74
0
.2
3.4
Lev
el
B3
Len
gth
(m
m)
41
9
2.5
6
5.5
W
idth
( m
m)
41
9
2.5
4
2.0
B
ulb
th
ick
ness
(mm
) 2
07
0
.5
16
.0
Max
imum
th
ick
ness
(mm
) 4
19
0
.5
19
.0
Med
ial
ax
1 s
an
g 1
e ('
)
17
9
55
.0
15
5.0
P
latf
orm
an
gle
(')
1
63
1
0.0
1
35
.0
Weig
ht
(g)
41
9
0.0
2
4.7
P
latf
orm
w
idth
(m
m)
19
5
0.5
3
0.0
P
latf
orm
th
ick
ness
(mm
) 1
97
0
.0
16
.0
Len
gth
/wid
th rati
o
41
9
0.3
3
.7
Lev
el
B4
Len
gth
(m
m)
87
1
. 1
42
.0
Wid
th
(mm
) 8
7
3.0
5
5.0
B
ulb
th
ick
ness
(mm
) 4
4
0.5
1
7.5
M
axim
um
thic
kn
ess
(mm
) 8
7
1.0
1
8.0
M
ed
ial
ax
is
an
gle
(')
4
1
55
.0
12
5.0
P
latf
orm
an
gle
("
) 3
5
30
.0
11
5.0
W
eig
ht
(g)
87
0
.0
14
.2
Pla
tfo
rm
wid
th
(mm
) 4
2
1. 0
2
7.0
P
latf
orm
th
ick
ness
(mm
) 4
0
0.0
1
7.0
L
en
gth
/wid
th rati
o
87
0
.2
2.5
----------
-----------------
Mea
n
Med
ian
S
.D.
10
.7
8.5
9
.2
9.6
8
.0
6.2
2
.0
1.
5 1
. 6
2.3
1
.0
2.6
9
6.
1 9
5.0
1
3.
1 6
4.2
6
0.0
2
0.8
0
.9
0.1
3
.3
5.3
4
.0
4.2
1
. 6
i.
0 1
. 3
1.
2 i
.1
0.6
12
.2
10
.0
8.2
1
1.1
9
.5
6.4
2
.7
2.0
2
. 1
3.0
2
.0
2.5
9
2.6
9
0.0
1
3.
1 6
9.0
7
0.0
1
8.4
1
.0
0.2
2
.9
6.1
5
.0
4.5
2
.0
1. 5
1
. 9
1.
2 1
.1
0.5
14
.0
12
.0
8.0
1
2.8
9
.5
8.7
3
.6
2.5
3
.8
3.7
3
.0
3.5
9
7.3
1
00
.0
15
.7
68
.9
70
.0
19
.6
1.
3 0
.3
2.8
7
.3
5.5
5
.7
2.6
2
.0
2.9
1
. 2
1.1
0
.5

The Garnsey Bison Kill - 35
parameters being equal (i.e., platform angle, drop height,
and ball diameter; Speth 1981~ see also Dibble and Whittaker
1981; Raab, Cande, and Stahle 1979:176). The implication of
these experimental results for the Garnsey data is that the
average size of the tools being flaked or resharpened pro
gressively decreased from the older to the younger levels.
Obviously, several possible scenarios might account for this
trend. The one that is tentatively favored here, for rea
sons that will become more apparent later in the discussion,
is that the amount of on-site processing increased in the
younger levels in response to increasing transport con
straints. Given the absence of suitable chert in the vicin
ity of Garnsey, this would have necessitated longer use of
the tools brought to the site, which in turn would have led
to greater reduction in average tool size through increased
attrition and more frequent resharpening.
Eight of the ten projectile points from Garnsey are
small triangular side-notched varieties, only two of which
are complete or nearly complete (figs. 18 and 19). Of those
with bases sufficiently well preserved to permit identifica
tion, two have basal notching (Harrell type) and three lack
basal notching (Washita type; cf. Bell 1958). Among the
latter, two have concave bases and one has a nearly straight
base.
Of the remaining two points, one is an unidentifiable,
lightly serrated tip or blade fragment, the other is a large

The Garnsey Bison Kill - 36
Fig. 18. Photographs of projectile points from Garnsey Site. Top row, from left to right: H-17/1, D-8/1, E-2/4, D-7/5, 511S477W/14; middle row, from left to right: 518S483W/2, 512S476W/29, 514S477W/S(7/8/78), D-12/1; bottom row: I-13/1.
barbed, corner-notched point that has been broken and bifa-
cially reworked into a hafted knife (figs. 18 and 19).
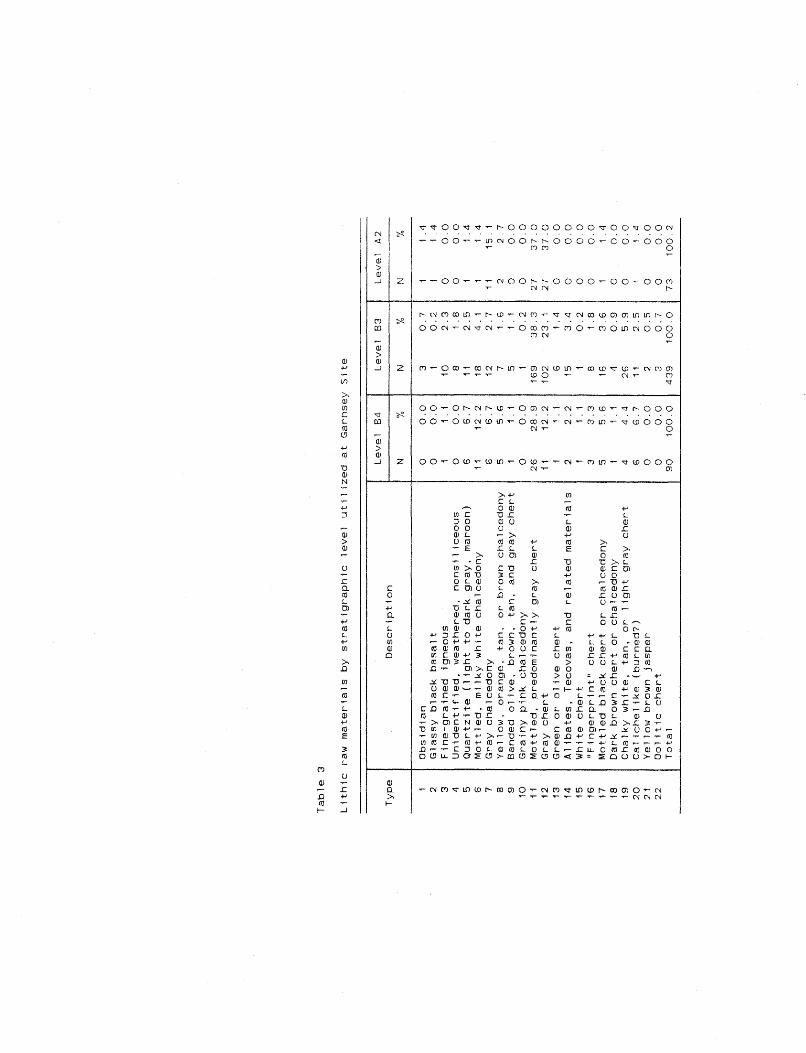
LITHIC MATERIALS
Lithic raw materials recovered at Garnsey are highly
varied in color and texture. A total of twenty-two types
was recognized (table 3), although several of these may ac-

The Garnsey Bison Kill - 37
h
!CM
Fig. 19. Illustrations of projectile points from Garnsey Site. (a) H-17/1; (b) D-8/1; (c) E-2/4; (d) D-7/5; (e) 511S477W/14; (f) 518S483W/2; (g) 512S476W/29; (h) 514S477W/S(7/8/78); (i) D-12/1; (j) I-13/1. (Drawn by Margaret Van Bolt, University of Michigan.}
The Garnsey Bison Kill - 38
tually be variants or facies of the same material. The
sources for many of the types are uncertain. Several may
have been procured as cobbles from gravels in the Pecos Val
ley. While no systematic investigations of these gravels
have as yet been undertaken, preliminary surveys indicate
that suitable materials are not available within a radius of
several kilometers of the site. Bedrock in the immediate
vicinity of the site (gypsum) is extremely soft and essen
tially useless for the manufacture of tools, including ham
mers or choppers. The most abundant lithic materials at the
site, gray and mottled gray cherts (types 11 and 12 in table
3), probably derive from limestone ridges (Permian San An
dres Formation) west of Garnsey between the Pecos Valley and
the Sacramento Mountains (Kelley 1971). The nearest chert
bearing exposures are about 25-30 km west of the site, but
similar materials would also have been available from local
ities as much as 100-140 km away. Four small pieces of ob
sidian were recovered; the nearest sources for these are
several hundred kilome~ers to the northwest, west, or south
west. Seventeen pieces of Tecovas and Alibates chert are
the only materials demonstrably derived from sources to the
east of Garnsey. Both types come from the Texas Panhandle,
a minimum of 300-400 km to the east and northeast. Of the
projectile points, 70% (seven of ten) are made of gray or
mottled gray chert from sources west of the site (types 11
and 12); none are made of eastern materials.
Tab
le
3
Lit
hic
ra
w
mate
rials
b
y str
ati
grap
hic
le
vel
uti
lized
at
Garn
sey
S
ite
Lev
el
84
L
ev
el
83
L
ev
el
A2
T
yp
e
Descri
pti
on
N
%
N
%
N
%
1 O
bsid
ian
0
0.0
3
0.7
1
1.
4 2
Gla
ssy
b
lack
b
asalt
0
0.0
1
0.2
1
1.
4 3
Fin
e-g
rain
ed
ig
neo
us
1 1
.1
10
2
.3
0 0
.0
4 U
nid
en
tifi
ed
, w
eath
ere
d,
no
nsil
iceo
us
0 0
.0
8 1
. 8
0 0
.0
5 Q
uart
zit
e
(li
gh
t to
d
ark
g
ray
, m
aro
on
) 6
6.7
1
1 2
.5
1 1
. 4
6 M
ott
led
, m
ilk
y
wh
ite
ch
alc
ed
on
y
11
1
2.2
1
8
4.
1 1
1.
4 7
Gra
y
ch
alc
ed
on
y
6 6
.7
12
2.7
i
1 1
5.
1 8
Yell
ow
, o
ran
ge,
tan
, o
r b
row
n
ch
alc
ed
on
y
5 5
.6
7 1
. 6
2 2
.7
9 B
an
ded
o
liv
e,
bro
wn
, ta
n,
an
d
gra
y ch
ert
1
1 .
1 5
1 .
1 0
0.0
1
0
Gra
iny
p
ink
ch
alc
ed
on
y
0 0
.0
1 0
.2
0 0
.0
1 1
Mo
ttle
d,
pre
do
min
an
tly
g
ray
ch
ert
2
6
28
.9
16
9
38
.3
27
3
7.0
1
2
Gra
y ch
ert
11
12
.2
10
2
23
. 1
27
3
7.0
1
3
Gre
en
o
r o
liv
e ch
ert
1
i. 1
6
1.
4 0
0.0
1
4
Al
ibate
s,
Teco
vas,
an
d
rela
ted
m
ate
rials
2
2.2
1
5
3.4
0
0.0
1
5
Wh
ite ch
ert
1
1.1
1
0.2
0
0.0
1
6
"F
ing
erp
rin
t"
ch
ert
3
3.3
8
1.
8 0
0.0
1
7
Mo
ttle
d
bla
ck
ch
ert
o
r ch
alc
ed
on
y
5 5
.6
16
3
.6
1 1
. 4
18
D
ark
b
row
n ch
ert
o
r ch
alc
ed
on
y
1 1
.1
4 0
.9
0 0
.0
19
C
halk
y
wh
ite,
tan
, o
r li
gh
t g
ray
ch
ert
4
4.4
2
6
5.9
0
0.0
2
0
Ca
1 i c
he l
ike
(bu
rned
?)
6 6
.7
1 1
2.5
1
1.
4 2
1
Yell
ow
b
row
n
jasp
er
0 0
.0
2 0
.5
0 0
.0
22
O
oli
tic ch
ert
0
0.0
3
0.7
0
0.0
T
ota
l 9
0
10
0.0
4
39
1
00
.0
73
1
00
.2

The Garnsey Bison Kill - 40
Several interesting changes occur in the use of lithic
raw materials at Garnsey during the time represented by lev
els B4, B3, and A2. The following are particularly notewor
thy: (1) the total number of different material types used
at the site decreases from sixteen in level B4 to ten in
level A2 (table 4); (2) there is a clear progressive in
crease from unit B to unit A in the value of the coefficient
of variation (C.V.) for the number of flakes per material
type (table 4); (3) the proportion of gray and mottled gray
chert and chalcedony (types 7, 11, and 12) increases from
less than 50% in level B4 to nearly 90% in level A2 (table
3); and (4) all of the demonstrably eastern lithic materials
(Tecovas and Alibates; type 14) occur in unit B (table 3).
These observations suggest that hunters, in preparing
for the kills in the younger levels at the site, had access
to a restricted range of lithic materials available primari
ly on the limestone ridges west of the Pecos Valley. Sour
ces within and east of the valley, which had been important
to hunters in the earlier levels, had dropped out almost en
tirely by unit A times.
Considered in conjunction with the evidence noted above
for increased on-site processing in the younger levels
(i.e., as reflected by decreasing overall size of retouch
and resharpening flakes), the lithic data very tentatively
suggest that during the course of the fifteenth century
hunters were coming to Garnsey from spring-season settle-

The Garnsey Bison Kill - 41
ments that may have been shifting farther and farther to the
west of the Pecos. Moreover, since the changes in the lith-
1c data are gradational rather than abrupt, it appears that
we are looking at a gradual change in settlement location
within essentially the same spring-season procurement system
rather than the replacement of one system by another. Ob-
viously, until a great deal more research specifically ad-
dressing these questions is undertaken at other settlements
in the region, these conclusions must remain little more
than speculation.
Table 4
Number of lithic raw material types per level and number of flakes per raw material type at Garnsey Site
Number of Flakes Unit/ Number Number of per Material Type Level of Material
Flakes Types Mean S.D. c.v. (%) 1
A2 73 1 0 3.32 7.82 235.8 B3 439 22 19.96 38.41 192.5 B4 90 1 6 4.09 5.80 14 1 • 6
1c.v., Coefficient of variation (C.V. 100 x S.D./mean).
EDGE ANGLES
Edge angles were determined on utilized flakes, unifa
cially and bifacially retouched tools, and resharpening
flakes with remnants of the original tool edge preserved on
their striking platforms. On tools with more than a single
working edge, each edge was treated separately, providing a
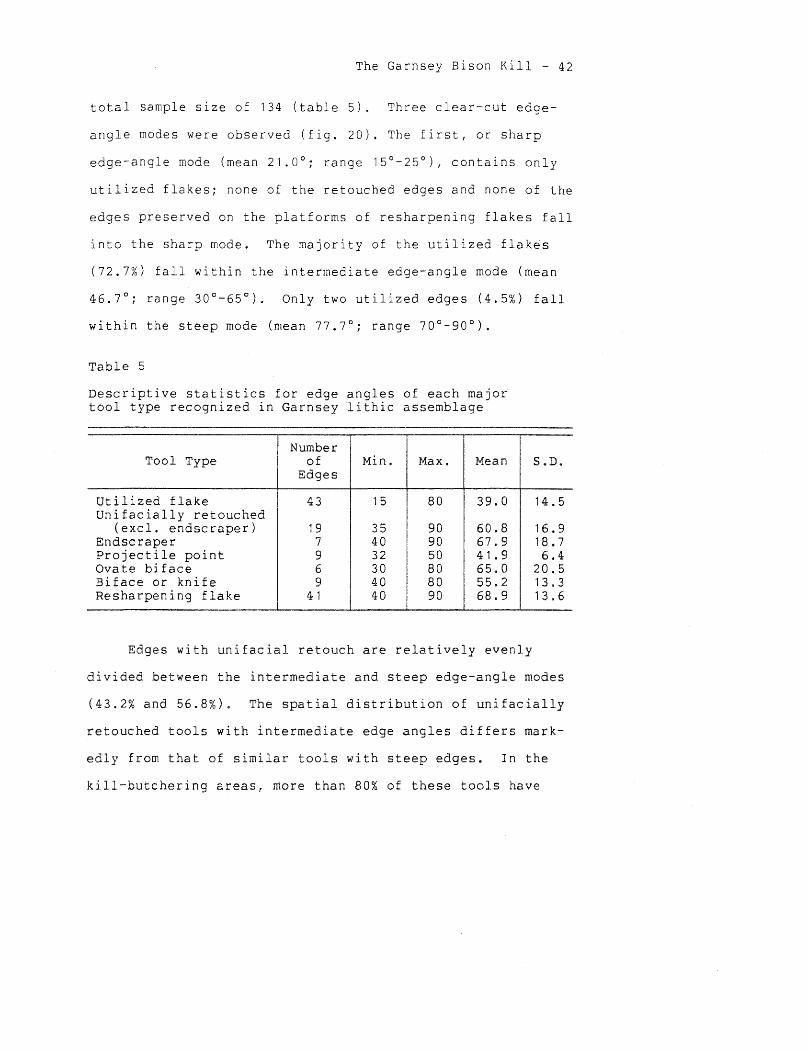
The Garnsey Bison Kill - 42
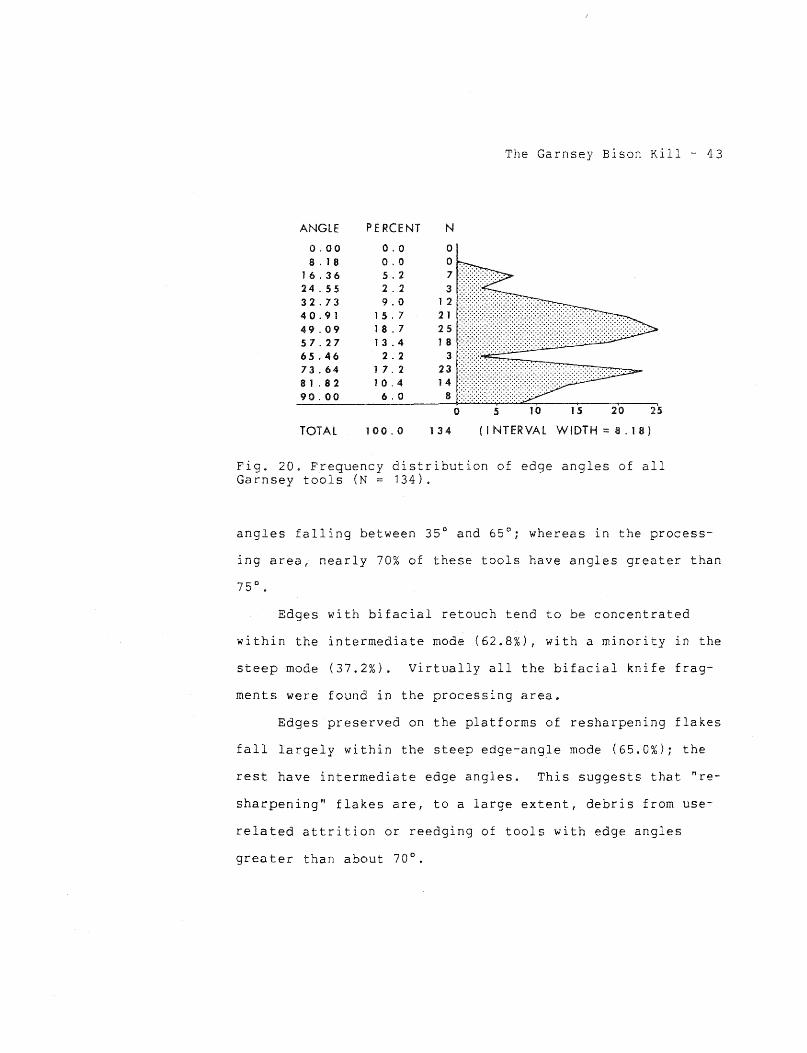
total sample size of 134 (table 5). Three clear-cut edge-
angle modes were observed (fig. 20). The first, or sharp
edge-angle mode (mean 21.0°; range 15°-25°), contains only
utilized flakes; none of the retouched edges and none of the
edges preserved on the platforms of resharpening flakes fall
into the sharp mode. The majority of the utilized flakes
(72.7%) fall within the intermediate edge-angle mode (mean
46.7°; range 30°-65°). Only two utilized edges (4.5%) fall
within the steep mode (mean 77.7°; range 70°-90°).
Table 5
Descriptive statistics for edge angles of each major tool type recognized in Garnsey lithic assemblage
Number Tool Type of Min. Max. Mean
Edges
Utilized flake 43 15 80 39.0 Unifacially retouched
(excl. endscraper) 19 35 90 60.8 Endscraper 7 40 90 67.9 Projectile point 9 32 50 41.9 Ovate biface 6 30 80 65.0 Biface or knife 9 40 80 55.2 Resharpening flake 41 40 90 68.9
Edges with unifacial retouch are relatively evenly
S.D.
14.5
16.9 18. 7 6.4
20.5 1 3. 3 13.6
divided between the intermediate and steep edge-angle modes
(43.2% and 56.8%). The spatial distribution of unifacially
retouched tools with intermediate edge angles differs mark-
edly from that of similar tools with steep edges. In the
kill-butchering areas, more than 80% of these tools have
The Garnsey Bison Kill - 43
ANGLE PERCENT N
0.00 0.0 8 . 1 8 0.0
16.36 5.2 24.55 2.2 3 32.73 9.0 1 2 4 0. 91 1 5. 7 2 l 49.09 18. 7 25 57.27 13.4 1 8
65.46 2.2 3
73.64 1 7. 2 23 . :-: <· :-:-:.:-: <. :-:-: ·>>>> :-:-:-:-:-: < .......•
8 1 .82 10.4 14 90.00 6.0 8 :.:-:-:-:-:-:-:-:-:-:-:-:-:-:-·.·.
0 5 10 15 20 25
TOTAl 100.0 134 (INTERVAL WIDTH = a. 18)
Fig. 20. Frequency distribution of edge angles of all Garnsey tools (N = 134).
angles falling between 35° and 65°; whereas in the process-
ing area, nearly 70% of these tools have angles greater than
Edges with bifacial retouch tend to be concentrated
within the intermediate mode {62.8%), with a minority in the
steep mode (37.2%). Virtually all the bifacial knife frag-
ments were found in the processing area.
Edges preserved on the platforms of resharpening flakes
fall largely within the steep edge-angle mode (65.0%); the
rest have intermediate edge angles. This suggests that "re-
sharpening" flakes are, to a large extent, debris from use-
related attrition or reedging of tools with edge angles
greater than about 70°.

The Garnsey Bison Kill - 44
Edge-angle distributions similar to the trimodal pat
tern observed at Garnsey have been noted in a variety of
other archeological assemblages. For example, Wilmsen
(1970:68-74) observed three comparable modes in Paleo-Indian
assemblages, and Frison (1970:36-38, 1974:92) documented
bimodal distributions in tools from two Wyoming bison kills
(Glenrock and Casper) comparable to the sharp and intermedi
ate modes at Garnsey.
Both Wilmsen and Frison attribute the sharp edge-angle
mode to cutting. Frison (1970:36) suggests that tools with
intermediate edge angles were used in scraping, while Wilm
sen (1970:70) posits a somewhat broader range of uses for
these tools, including both scraping and heavy-duty cutting.
Wilmsen (1970:71) attributes the steep mode to maintenance
tasks requiring tools with strong edges, such as wood work
ing, bone working, or heavy shredding.
If Wilmsen's assessment of the general nature of tasks
performed with steep-edged tools is reasonable, their ab
sence in primary kill sites such as Glenrock and Casper,
both of which lacked on-site processing areas, is not sur
prising (Frison 1970:2, 1978:173). The presence of the
steep edge-angle mode at Garnsey, then, implies that the
range of activities was broader at this site than at either
Glenrock or Casper. This conclusion is supported by the
presence of at least one secondary processing area at Garn-
sey, characterized by hearths and moderate quantities of

The Garnsey Bison Kill - 45
highly fragmented limb bones and ribs. It is further sup
ported by the fact that most unifacial tools with steep
edges were confined to the processing area. That other tool
types with steep edges were. found within kill-butchering
areas, however, suggests that a relatively broad range of
processing activities may have been taking place throughout
the site. This would help account for the high degree of
disarticulation within the various bone clusters.
CHRONOLOGY
To determine the time span of bison hunting at ihe
Garnsey 1ocality, an extensive program of radiocarbon dating
was undertaken (see Speth and Parry 1980:41 for a detailed
discussion of site chronology). Fourteen samples, all of
bone, were submitted to Geochron Laboratories, Cambridge,
Massachusetts, for analysis (table 6). Eleven of these were
from the major bone level (B3). Of the remaining samples,
one was from level B4, one from level B5 within the cienega
horizon, a~d one from level B6 below the cienega. Adequate
charcoal samples were not obtained during the excavations.
All bone dates were corrected for 13c fractionation.
The fourteen samples provided twenty-one age estimates
(nine apatite, twelve gelatin). Of these, three carne out
fully modern and were rejected. The remaining dates aver
aged 370±29 B.P. or A.D. 1580±29 (mean ~nd standard devia
tion weighted according to procedures outlined in Long and

The Garnsey Bison Kill - 46
Rippeteau 1974 and Davies 1961:133). This mean value yields
a MASCA-corrected age range (1 S.D.; new half-life of 5,730
years; Ralph, Michael, and Han 1973) of A.D. 1440-1520
(510-430 B.P.). The site is slightly younger, about A.D.
1502-98 (448-352 B.P.), if the age is calibrated using the
tables of Damon et al. (1974). A more recent calibration
scheme, developed by Stuiver (1982), yields an age estimate
more in line with the MASCA results (ca. A.D. 1445-1525 or
505-425 B.P.). No stratigraphic patterning is evident in
the dates; dates from within and below the cienega horizon
fall near the younger end of the range.
During the summer of 1980 a small sample of charred
grass culms (stems), apparently burned during a prehistoric
range fire, was collected from the margin of the main chan
nel in unit A., This sample provided the first date for unit
A and the only nonbone date for the site. The material was
submitted to Beta Analytic, Inc., in Coral Gables, Florida.
The result, previously unpublished, is A.D. 1495±100
(455±100 B.P.; Beta-1925; 13c fractionation-corrected; Libby
half-life of 5,568 years; age referenced to the year
A.D. 1950; date not MASCA-corrected).
Given the tendency for bone dates to be too young (Tam
ers and Pearson 1965), and the newly obtained date from unit
A, the "true" age of major procurement activities during
unit B times in the Garnsey Wash probably falls toward the
earlier end of the ranges given above, or about
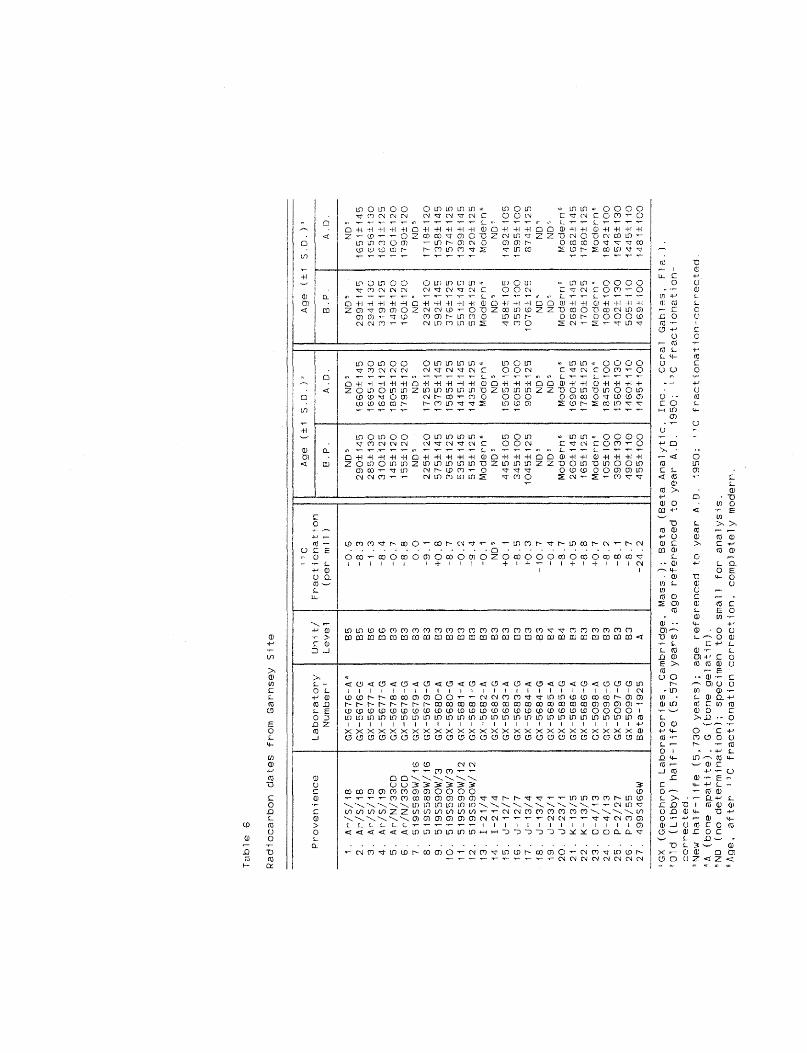
Tab
le
6
Rad
iocarb
on
d
ate
s
fro
m
Garn
sey
S
ite
I JC
A
ge
( ±
1
s. 0
.) 2
Ag
e (±
1
s. 0
.) 3
Pro
ven
ien
ce
Lab
ora
tory
U
nit
/ F
racti
on
ati
on
N
um
ber
' L
ev
el
(per
m i
1 )
B.P
. A
.D.
B.P
. A
.D.
1.
Ar/
S/1
8
GX
-56
76
-A"
85
-0
.6
ND5
N0
5 N
O"
ND
' 2
. A
r/S
/18
G
X-5
67
6-G
8
5
-8.3
2
90
±1
45
1
66
0±
14
5
29
9±
14
'3
16
51
±1
45
3
. A
r/S
/19
G
X-5
67
7-A
8
6
-1.3
2
85
±1
30
1
66
5±
13
0
29
4±
13
0
16
56
±1
30
4
. A
r/S
/19
G
X-5
67
7-G
8
6
-8.4
3
10
±1
25
1
64
0±
12
5
31
9±
12
5
16
31
±1
25
5
. A
r/N
/33
CD
G
X-5
67
8-A
8
3
-0.7
1
45
±1
20
1
80
5±
12
0
14
9±
12
0
18
01
±1
20
6
. A
r/N
/33
CO
G
X-5
67
8-G
8
3
-8
.8
15
5±
12
0
17
95
± 1
20
1
60
±1
20
1
79
0±
12
0
7.
51
9S
58
9W
/16
G
X-5
67
9-A
8
3
0.0
N
OS
NO
S N
O<
N0
5
8.
51
9S
58
9W
/16
G
X-5
67
9-G
8
3
-9.
1 2
25
±1
20
1
72
5±
12
0
23
2±
12
0
17
18
±1
20
9
. 5
19
S5
90
W/3
G
X-5
68
0-A
8
3
+0
.8
57
5±
14
5
13
75
±i4
5
59
2±
i45
1
35
8±
14
5
10
. 5
19
S5
90
W/3
G
X-5
68
0-G
8
3
-8.7
3
65
±1
25
1
58
5±
12
5
37
6±
12
5
15
74
±1
25
1
1.
51
9S
59
0W
/12
G
X-5
68
1-A
8
3
-0.2
5
35
±1
45
1
41
5±
14
5
55
1±
14
5
13
99
±1
45
1
2.
51
9S
59
0W
/12
G
X-5
68
1-G
8
3
-9.4
5
15
±1
25
1
43
5±
12
5
53
0±
12
5
14
20
±1
25
1
3.
I-2
1/4
G
X-5
68
2-A
8
3
-0.
1 M
od
ern
6 M
od
ern
6 M
od
ern
" M
od
ern
s 1
4.
I-2
1/4
G
X-5
68
2-G
8
3
ND5
NO
S N
OS
NO
S ND
O 1
5.
J-1
2/7
G
X-5
68
3-A
8
3
+o
.. ,
4
45
±1
05
1
50
5±
10
5
45
8±
10
5
14
92
±1
05
1
6.
J-1
2/7
G
X-5
68
3-G
8
3
-8.5
3
45
±1
00
1
60
5±
10
0
35
5±
10
0
15
95
±1
00
1
7.
J-1
3/4
G
X-5
68
4-A
8
3
+0
.3
10
45
± 1
25
9
05
±1
25
1
07
6±
12
5
87
4±
12
5
18
. J-1
3/4
G
X-5
68
4-G
8
3
-10
.7
Nos
N
OS
NO
' N
O'
19
. J-2
3/1
G
X-5
68
5-A
8
4
-0.4
N
O"
NO
' N
OS
NO
'· 2
0.
J-2
3/1
G
X-5
68
5-G
8
4
-8.7
M
od
ern
• M
od
ern
• M
od
ern
• M
od
ern
• 2
1.
K-1
3/5
G
X-5
68
6-A
8
3
+0
.5
26
0±
14
5
16
90
±1
45
2
68
±1
45
1
68
2±
14
5
22
. K
-13
/5
GX
-56
86
-G
83
-8
.8
16
5±
12
5
17
85
±1
25
i7
0±
12
5
17
80
±1
25
2
3.
0-4
/13
G
X-5
09
8-A
8
3
+0
.7
Mo
der
n6
Mo
der
n6
Mo
dern
' M
od
ern
6
24
. 0
-4/1
3
GX
-50
98
-G
83
-8
.2
10
5±
10
0
18
45
± 1
00
i0
8±
10
0
18
42
±1
00
2
5.
P-2
/27
G
X-5
09
7-G
8
3
-8.
1 3
90
±1
30
1
56
0±
13
0
40
2±
13
0
15
48
±1
30
2
6.
P-3
/55
G
X-5
09
9-G
8
3
-8.7
4
90
± 1
10
1
46
0±
11
0
50
5±
j 1
0
14
45
±1
10
2
7.
499S
466·
W
8eta
-19
25
A
-2
4.2
4
55
±1
00
1
49
5±
10
0
46
9±
10
0
14
81
± 1
00
..
'GX
(G
eo
ch
ron
L
ab
ora
tori
es,
Cam
bri
dg
e,
Mass.)
; B
eta
(B
eta
A
naly
tic,
Inc.,
C
ora
l G
ab
les,
F
la.)
. 10
ld
(Lib
by
) h
alf
-lif
e
(5,5
70
y
ears
);
ag
e
refe
ren
ced
to
y
ear
A.D
. 1
95
0;
tJC
fr
acti
on
ati
on
-co
rrecte
d.
3N
ew
half
-li
fe
(5,7
30
y
ears
);
ag
e
refe
ren
ced
to
y
ear
A.D
. 1
95
0;
'3
C fr
acti
on
ati
on
-co
rrecte
d.
~A
(bo
ne ap
ati
te),
G
(bo
ne g
ela
tin
).
'NO
(n
o
dete
rmin
ati
on
);
specim
en
to
o
small
fo
r an
aly
sis
. 5A
ge,
afte
r
13
C fr
acti
on
ati
on
co
rrecti
on
, co
mp
lete
ly
mo
dern
.

The Garnsey Bison Kill - 48
A.D. 1450-1500 (500-450 B.P.). This age would place the
site within the late prehistoric period, before the horse
and gun were introduced into the region (Secoy 1953).

3. Nature and Condition of the Bison Remains
INVENTORY
A total of 6,937 complete and fragmentary bones of mod-
ern bison were recovered from the Garnsey Site (see table
7). Of these, 2,549 (36.7%) were identifiable to specific
skeletal part, 1,092 (15.7%) were indistinguishable frag
ments of ribs or vertebral processes, and 3,296 (47.5%) were
small, unidentifiable fragments. A very few nonbison re-
mains were also recovered, consisting primarily of butchered
canids. A breakdown of the bison materials by stratigraphic
level is presented in table 8. Since almost 90% of the bi-
son sample from Garnsey derives from a series of quasi-
contemporary kill events in a single archeological level
(level B3), much of the subsequent discussion will treat the
total bone sample as a unit.
MINIMUM NUMBER OF INDIVIDUALS
The minimum number of individuals (MNI) has been deter-
mined for the site as a whole by dividing the number of each

c.., t
fJ
Tab
le
7
To
tal
inv
en
tory
o
f b
iso
n
rem
ain
s
(co
mp
lete
an
d
frag
men
tary
) fr
om
G
arn
sey
S
ite
Ele
men
t
1.
Sk
ull
2
. M
an
dib
le
3.
Hy
oid
4
. M
isc.
loo
se
teeth
(in
cis
or/c
an
ine)
5.
Mis
c.
loo
se
teeth
(m
ola
r/p
rem
ola
r)
6.
Mis
c.
too
th
frag
men
ts
7.
Atl
as
8.
Ax
is
9.
Cerv
ical
(3-7
) 1
0.
Th
ora
cic
(1
-14
) 11
.
Lu
mb
ar
( 1
-5)
12
. S
acru
m
13
. C
au
dal
14
. U
nid
en
t.
vert
eb
ral
bo
dy
1
5.
Un
iden
t.
vert
eb
ral
pad
1
6.
Un
fuse
d
vert
eb
ral
sum
mit
1
7.
Rib
1
8.
Mis
c.
rib
-v
erte
bral
pro
cess
frag
men
ts
19
. C
osta
l carti
lag
e
20
. S
tern
eb
ra
21
. S
cap
ula
2
2.
Hu
meru
s 2
3.
Rad
ius
24
. U
lna
N
71
2
7
13
2
9
34
18
0
29
21
9
7
19
9
64
1
3
57
2
6
13
2
28
3
08
1
,09
2
10
7
41
7
2
44
3
2
28
%
1 .0
0
.4
0.2
0
.4
0.5
2.6
0
.4
0.3
1
. 4
2.9
0
.9
0.2
0
.8
0.4
1
. 9
0.4
4
.4
15
.7
1.
5 0
.6
1.0
0
.6
0.5
0
.4
Ele
men
t
25
. R
ad
ial
carp
al
26
. In
term
ed
iate
carp
al
27
. U
lnar
carp
al
28
. A
ccesso
ry
carp
al
29
. F
use
d
2d
-3d
carp
al
30
. 4
th
carp
a1
3
1.
5th
m
eta
carp
al
32
. M
eta
carp
al
33
. P
elv
is
34
. F
emu
r 3
5.
Pate
lla
36
. T
ibia
3
7.
Astr
ag
alu
s
38
. L
ate
ral
mall
eo
lus
39
. C
alc
an
eu
s
40
. N
av
icu
locu
bo
id
41
.
1st
tar s
a 1
4
2.
Fu
sed
2
d-3
d
tarsal
43
. 2
d m
eta
tars
al
44
. M
eta
tars
al
45
. M
eta
po
dia
l 4
6.
1st
ph
ala
nx
4
7.
2d
p
hala
nx
4
8.
3d
p
hala
nx
4
9.
Pro
xim
al
sesam
oid
5
0.
Dis
tal
sesam
oid
5
1.
Un
iden
t.
bo
ne
frag
men
ts
N 19
2
5
19
16
16
1
6
9 3
6
92
5
5
19
4
4
20
1
6
24
2
0
3 13
2
28
9
10
7
85
7
4
96
3
4
3,2
96
%
0.3
0
.4
0.
3 0
.2
0.
2 0
.2
0.1
0
.5
1.
3 0
. 8
0.3
0
.6
0.3
0
.2
0.3
0
.3
o+
0.2
0
+
0.4
0
.1
1.
5 1
. 2
1.1
1
. 4
0.5
4
7.5
No
te:
Th
is
tab
le
sh
ou
ld
no
t b
e
used
to
esti
mate
m
inim
um
n
um
ber
of
ind
ivid
uals
, sin
ce
man
y
of
the
frag
men
ts
liste
d
for
a p
arti
cu
lar
sk
ele
tal
ele
men
t m
ay
deri
ve
fro
m
the
sam
e
bo
ne.

Tab
le
8
Inv
en
tory
o
f b
iso
n
rem
ain
s (c
om
ple
te
an
d
frag
men
tary
) fr
om
G
arn
sey
S
ite
by
str
ati
grap
hic
le
vel
---
·--~
A 1
1 A
2 8
3
84
8
52
86
' E
lem
en
t N
%
N
%
N
%
N
%
N
%
N
%
1.
Sk
ull
0
0.0
1
o. 3
51
0
.8
3 1
.1
0 0
.0
0 0
.0
2.
Man
dib
le
0 0
.0
2 0
.6
14
0
.2
4 1
. 5
0 0
.0
0 0
.0
3.
Hy
oid
0
0.0
0
0.0
12
0
.2
0 0
.0
0 0
.0
0 0
.0
4.
Incis
or/
can
ine
0 0
.0
0 0
.0
21
0.3
4
1.
5 0
0.0
0
0.0
5
. M
ola
r/p
rem
ola
r 0
0.0
0
0.0
3
0
0.5
0
0.0
0
0.0
0
0.0
6
. M
isc.
too
th
frag
men
ts
0 0
.0
1 0
.3
16
8
2.7
9
3.3
0
0.0
0
0.0
7
. A
tlas
0 0
.0
2 0
.6
23
0
.4
2 0
.7
0 0
.0
0 0
.0
8.
Ax
is
0 0
.0
1 0
.3
19
0
.3
1 0
.4
0 0
.0
0 0
.0
9.
Cerv
ical
(3-7
) 0
0.0
3
0.9
9
2
1.
5 0
0.0
0
0.0
0
0.0
1
0.
Th
ora
cic
(1
-14
) 0
0.0
1
3
4.0
1
77
2
.9
2 0
. 7
0 0
.0
0 0
.0
11
. L
um
bar
(1
-5)
0 0
.0
6 1
.8
61
1
.0
0 0
.0
0 0
.0
0 0
.0
12
. S
acru
m
0 0
.0
2 0
.6
10
0
.2
0 0
.0
0 0
.0
1 5
0.0
()"
'"{ -
13
. C
au
dal
0 0
.0
6 1
.8
48
0
.8
2 0
. 7
0 0
.0
0 0
.0
14
. U
nid
en
t.
vert
eb
ral
bo
dy
0
0.0
4
1.
2 2
0
0.3
0
0.0
0
0.0
0
0.0
1
5.
Un
iden
t.
vert
eb
ral
pad
0
0.0
5
1 . !
5 1
23
2
.0
3 1
.1
0 0
.0
0 0
.0
16
. U
nfu
sed
v
ert
eb
ral
sum
mit
0
0.0
0
0.0
2
8
0.5
0
0.0
0
0.0
0
0.0
1
7.
Rib
0
0.0
1
6
4.9
2
85
4
.6
2 0
. 7
0 0
.0
0 0
.0
18
. M
isc.
rib
-v
erte
bral
0 0
.0
54
1
6.4
9
75
1
5.8
3
4
12
.5
3 6
0.0
0
0.0
p
rocess
frag
men
ts
19
. C
osta
l carti
lag
e
0 0
.0
3 0
.9
10
3
1.7
0
0.0
0
0.0
0
0.0
2
0.
Ste
rneb
ra
0 0
.0
1 0
.3
39
0
.6
1 0
.4
0 0
.0
0 0
.0
21
. S
cap
ula
0
0.0
2
0.6
6
7
1.1
2
0.7
0
0.0
0
0.0
2
2.
Hu
meru
s 0
0.0
1
0.3
3
8
0.6
1
0.4
0
0.0
0
0.0
2
3.
Rad
ius
0 0
.0
2 0
.6
27
0
.4
0 0
.0
0 0
.0
0 0
.0
24
. U
lna
0 0
.0
1 0
.3
20
0
.3
0 0
.0
0 0
.0
0 0
.0
25
. R
ad
ial
carp
al
0 0
.0
1 0
.3
18
0.3
0
0.0
0
0.0
0
0.0
2
6.
Inte
rmed
iate
carp
al
0 0
.0
2 0
.6
23
0
.4
1 0
.4
0 0
.0
0 0
.0
27
. U
lnar
carp
al
0 0
.0
2 0
.6
15
0.2
1
0.4
0
0.0
0
0.0
2
8.
Accesso
ry
carp
al
0 0
.0
0 0
.0
15
0.2
0
0.0
0
0.0
0
0.0
2
9.
Fu
sed
2
d-3
d
carp
al
0 0
.0
1 0
.3
14
0
. 2
0 0
.0
0 0
.0
0 0
.0
30
. 4
th carp
al
0 0
.0
2 O
.Ei
13
0
.2
0 0
.0
0 0
.0
0 0
.0
31
.
5th
m
eta
carp
al
0 0
.0
0 0
.0
9 0
.1
0 0
.0
0 0
.0
0 0
.0
32
. M
eta
carp
al
0 0
.0
1 0
.3
31
0.5
2
0.
7 1
20
.0
0 0
.0
33
. P
elv
is
0 0
.0
2 0
.6
84
1
.4
1 0
.4
0 0
.0
0 0
.0
34
. F
emu
r 0
0.0
2
0.6
4
9
0.8
0
0.0
0
0.0
0
0.0
3
5.
Pate
lla
0 0
.0
0 0
.0
16
0.3
i
0.4
0
0.0
0
0.0
3
6.
Tib
ia
0 0
.0
1 0
.3
35
0
.6
1 0
. 4
0 0
.0
0 0
.0
37
. A
str
ag
alu
s
0 0
.0
1 0
.3
19
0
.3
0 0
.0
0 0
.0
0 0
.0
38
. L
ate
ral
mall
eo
lus
0 0
.0
0 0
.0
16
0
.3
0 0
.0
0 0
.0
0 0
.0
39
. C
alc
an
eu
s
0 0
.0
1 0
.3
22
0
.4
0 0
.0
0 0
.0
0 0
.0
40
. N
av
icu
locu
bo
id
0 0
.0
1 0
.3
16
0
.3
0 0
.0
0 0
.0
0 0
.0
41
. 1
st
tarsal
0 0
.0
0 0
.0
3 O
+
0 0
.0
0 0
.0
0 0
.0
42
. F
use
d
2d
-3d
ta
rsal
0 0
.0
0 0
.0
13
0
.2
0 0
.0
0 0
.0
0 0
.0
43
. 2
nd
m
eta
tars
al
0 0
.0
0 0
.0
2 0
+
0 0
.0
0 0
.0
0 0
.0
44
. M
eta
tal"
'sal
0 0
.0
0 0
.0
25
0
.4
1 0
.4
0 0
.0
0 0
.0
45
. M
eta
po
dia
l 0
0.0
1
0.3
7
0.1
0
0.0
0
0.0
0
0.0

c_ri N
Tab
1 e
8 (c
an
t. )
46
4
7
48
4
9
50
51
Ele
men
t
1st
ph
ala
nx
2
d
ph
ala
nx
3
d
ph
ala
nx
P
rox
imal
sesa
mo
id
Dis
tal
sesa
mo
id
Un
iden
t.
bo
ne
frag
men
ts
To
tal
~------------
A1
1
N
%
0 0
.0
0 0
.0
0 0
.0
0 0
.0
0 0
.0
7 1
00
.0
7
A2
N
%
N
7 2
. 1
93
6
1.
8 7
5
5 1
. 5
68
2
0.6
9
2
0 0
.0
34
1
65
5
0.2
2
,90
5
32
9
6'
16
3
83
8
4
85
' 8
6'
%
N
of
N
%
N
%
I''
1.
5 1
0.4
0
0.0
1
50
.0
1.
2 0
0.0
1
20
.0
0 0
.0
1.1
0
0.0
0
0.0
0
0.0
1
. 5
1 0
.4
0 0
.0
0 0
.0
0.6
0
0.0
0
0.0
0
0.0
4
7.
1 1
92
7
0.6
0
0.0
0
0.0
2
72
5
2
No
te:
Th
is
ti"'
ble
sh
ou
ld
no
t b
e
use
d
to
esti
mate
m
inim
um
n
um
ber
o
f in
div
idu
als
, b
ecau
se
man
y
fr-a
gm
en
ts
liste
d fo
r~
a particula~
sk
ele
tal
ele
men
t m
ay d
eri
ve
fro
m
sam
e b
on
e.
Mate
rial
liste
d
in
this
ta
ble
d
eri
ves
ex
clu
siv
ely
fr
om
m
ajo
r ex
cav
ati
on
u
nit
s
(tre
nch
es
77
-1,
77
-2,
78
-1,
78
-5,
78
-6
an
d,
78
-7):
it
em
s salv
ag
ed
fr
om
w
all
s
of
arr
oy
o
hav
e
no
t b
een
in
clu
ded
. 1U
nex
cav
ate
d
bo
ne clu
ste
rs,
assig
nab
le
to
lev
el
A1
, are
ex
po
sed
in
arr
oy
o
wall
s
up
stre
am
fr
om
are
as
inv
esti
gate
d
in
19
77
an
d
19
78
. 2S
am
ple
li
mit
ed
to
sp
ecim
en
s salv
ag
ed
fr
om
arr
oy
o
wall
s;
majo
r ex
cav
ati
on
u
nit
s
term
inate
d
at
lev
el
84
.

Nature and Condition of the Bison Remains - 53
specific element recovered archeologically by the number of
that element in the animal. The results are presented in
table 9. The best estimate for the minimum number of in
dividuals recovered in the two seasons of excavation is
thirty-five, based on skulls. Higher estimates would be ob
tained if: (1) each stratigraphic level were treated as a
discrete unit; (2) each bone cluster within a level were
treated as a discrete unit; (3) the ages of cranial and
postcranial elements were considered; (4) idiosyncratic met
ric and nonmetric characteristics of postcranial elements
were considered.
TAPHONOMIC CONSIDERATIONS
Before turning to a more detailed discussion of the
Garnsey bison material, a few comments are in order concern
ing the preservation of the bones and the degree to which
they have been disturbed by fluvial action subsequent to
procurement activities at the site.
Preservation
Preservation of the Garnsey remains, for the most part,
is excellent (see Speth and Parry 1980:45). With the excep
tion of horn cores, most bones, if allowed to dry out slow
ly, required relatively little or no subsequent treatment
with preservative before removal. Costal cartilage was well
preserved. In addition, delicate plaques of cartilage re
mained attached to the proximal ends of several scapulae.

Ui ~
Tab
le
9
Min
imum
n
um
ber
o
f in
div
idu
als
(M
NI)
fr
om
G
arn
sey
S
ite
Ele
men
t S
ide
1.
Sk
ull
-
2.
Man
dib
le
L R
3.
Hy
oid
L R
4
. A
tlas
-5
. A
xis
-
6.
Cerv
ical
(3-7
) -
7.
Th
ora
cic
(1
-14
) -
8.
Lu
mb
ar
(1-5
) -
9.
Sac
rum
-
10
. C
aud
al
-1
1.
Rib
L R
1
2.
Co
stal
cart
ilag
e
-1
3.
Ste
rneb
ra
-
14
. S
cap
ula
2 L R
1
5.
Pro
xim
al
llumer~us
L
R
16
. D
ista
l h
um
eru
s l R
1
7.
Pro
xim
al
rad
ius
L R
18
. D
ista
l ra
diu
s
L R
19
. U
lna
L R
20
. R
ad
ial
carp
al
L R
21
. In
term
ed
iate
carp
al
L R
22
.. U
lnar
carp
al
L R
N
MN
I
35
( 5
) I
35
( 5
) I
9 (2
) 9
(2)
13
(2)
13
(2)
5 (
1)
5 (
1)
6 6
29
( 4
) 2
9
( 4)
21
(1)
21
(
1 )
86
( 9
) 18
( 2
) 1
52
(5
) 11
(
1)
45
9
13
13
55
6
86
(
14
) 7
( 1
) 9
7
(20
) 7
( 2)
10
7
4 41
6
12
12
10
1
0
14
(2)
14
(2)
18
(5
) 1
8
( 5
) 14
14
15
(2
) 15
(2
) 1
0
( 1
) 1
0
( 1
) 13
(6
) 13
(6
) 1
0
( 4)
10
(4
) 14
(5
) 1
4
( 5)
10
( 2
) 1
0
(2)
13
(3)
13
( 3
) 6
6 13
13
14
14
11
11
i
1 (
1)
11
( 1
) 8
8

(f( v...., f
Tab
le
9 (c
on
t.)
Ele
men
t
23
. A
ccesso
ry carp
al
24
. F
use
d
2d
-3d
carp
al
25
. 4
th carp
al
26
. 5
th
meta
carp
al
27
. P
rox
imal
meta
carp
al
28
. D
ista
l m
eta
carp
al
29
. P
elv
is'
30
. P
rox
imal
fem
ur
31
. D
ista
l fe
mu
r
32
. P
ate
lla
33
. P
rox
imal
tib
ia
34
. D
ista
l ti
bia
35
. A
str
ag
alu
s
36
. L
ate
ral
rna ll
eo
lus
37
. C
alc
an
eu
s
38
. N
av
icu
locu
bo
id
39
. 1
st
tarsal
40
. F
use
d
2d
-3d
ta
rsal
Sid
e
N
MN
I
L 1
i 11
R
5
5 L
8 8
R
7 7
L
9 9
R
6 6
-9
5 L
1
8
(4)
18
( 4
) R
13
(4
) 1
3
(4)
L 12
(3
) 12
( 3
) R
1
3
(4)
13
(4
) L
1
7
(4)
17
(4)
R
31
(8
) 31
( 8
) L
9 (2
) 9
(2)
R
8 (
1)
8 (
1)
L 14
(6
) 14
(6
) R
13
(3
) 13
(3
) L
9 9
R
10
1
0
L 1
2
(2)
12
( 2
) R
1
8
(9)
18
(9
) L
9 (1
) 9
( 1
) R
13
( 2
) 1
3
(2)
L 1
0
10
R
1
0
10
L
10
1
0
R
6 6
L 1
0
( 2
) 1
0
(2)
R
12
(3)
12
(3
) L
9 9
R
11
11
-
3 2
L I
8 8
R
5 5

cr,
6'
Tab
le
9 (co
nt.
)
Ele
men
t S
ide
N
MN
I
4 i
. 2
nd
m
eta
tars
al
-2
1 4
2.
Pro
xim
al
meta
tars
al
L
14
( 3
) 1
4
(3)
R
10
(
1)
10
(
1)
43
. D
ista
l m
eta
tars
al
L
13
(
1 )
13
(
1 )
R
11
( 1
) 11
(
1 )
44
. 1
st
ph
ala
nx
u
L II
~
48
( 3
) 1
2
( 1
) "R
" 5
2
(2)
i 3
( 1
) 4
5.
2d
p
hala
nx
II
LU
4
7 (
1)
12
(
1)
IIR
II
37
(3
) 1
0
( i)
46
. 3
d
ph
ala
nx
"L
" 3
6
( 2
) 9
( 1
) "R
u 3
7
(2
)
10
(
1)
47
. P
rox
imal
sesam
oid
"L
, "C
4 2
0
( 1
) 5
( 1
) "L
, "P
2
9
( i)
8
( 1
)
"R,
"C
24
6
"R
, "P
2
3
6 4
8.
Dis
tal
sesam
oid
II
L
" 2
0
5 IIR
II 1
4
4
No
te:
MN
I (m
inim
um
n
um
ber
of
ind
ivid
uals
);
bis
on
o
nly
; d
ete
rmin
ed
b
y d
ivid
ing
n
um
ber
oF
each
sp
ecif
ic
ele
men
t re
co
vere
d arch
eo
log
icall
y
by
n
um
ber
of
that
ele
men
t in
an
imal;
co
mp
lete
li
mb
b
on
es
are
co
un
ted
tw
ice
in
tab
ula
tio
ns
(pro
xim
al
on
ce;
dis
tal
on
ce).
1N
um
bers
in
p
are
nth
eses
refer
to
nu
mb
er
of
imm
atu
re
ele
men
ts
an
d
min
imu
m
nu
mb
er
of
imm
atu
re
ind
ivid
uals
. 2In
clu
des
on
ly
sp
ecim
en
s
in
wh
ich
p
art
of
gle
no
id
cav
ity
an
d
neck
are p
reserv
ed
. 3ln
clu
des
on
ly
sp
ecim
en
s
in
wh
ich
p
art
of
aceta
bu
lum
is
p
reserv
ed
. 4"l,
"
"R"
(sid
e
of
fo
ot;
sid
e o
f an
imal
un
kn
ow
n);
C
, P
(cen
ter
or
peri
ph
ery
o
f fo
ot;
sid
e
of
an
imal
un
kn
ow
n).

Nature and Condition of the Bison Remains - 57
Even fragile horn sheaths were recovered, some still in
place over their bony horn cores, others scattered loose
among the butchering debris. Differential loss of softer,
fragile, or less dense elements owing to factors of preser
vation therefore does not appear to have played a major role
in site formation at Garnsey.
This conclusion may be illu5trated more explicitly by
comparing the frequency of various skeletal elements recov
ered at Garnsey (%MNI) with the proportion that would be ex
pected to survive on the basis of bone density (fig. 21; the
expected survival percentages are based on caribou bone den
sities as presented in Binford and Bertram 1977:138 and Bin
ford 1981:217). The correlation is low (r = 0.49; N = 25),
and with the elimination of a few obvious outliers (e.g.,
skull, atlas, pelvis, and perhaps mandible), the remaining
elements display essentially no correlation.
Destruction of elements by carnivores and rodents also
appears to have been insignificant at Garnsey. Gnaw marks,
punctures, crenulated edges, and other obvious signs of
predator-scavenger damage are extremely rare on the general
ly well-preserved bones.
Binford (1981) has recently proposed a series of more
quantitative approaches for assessing the degree of destruc
tion of faunal assemblages by predator-scavengers. One such
approach focuses on the degree of attrition of long bones as
reflected by the frequency of bone cylinders per MNI and

Nature and Condition of the Bison Remains - 58
w f-
100
(j) 90
GJ 80 (/)
z S? 70 0
f<(
60
50 0 w ~ 40 w (/)
en 30 0
- 20 z 2
10
• Ax
•Cer •PH •PMc
.DH
• Ph1 DMc-:DF ;PMt Calc. •i-DMt • DR
• Ph 2 Th: Ast 'P R • S cop
• Ph3 •Car ,pf •Lum •ra r
• Rib
• Sk
•At
• Pel
• DT • Man
0~--~~--~--~--~~~~--~--~~
0 10 20 30 40 50 60 70 80 90 100 EXPECTED SURVIVAL PERCENT AGE (BASED ON CARIBOU BONE DENSITIES)
Fig. 21. Relation between proportional frequency of elements observed at Garnsey Site (%MNI) and expected survival percentage of elements derived from caribou bone densities (from Binford and Bertram 1977:138; Binford 1981:217).
bone splinters per MNI on the site. Cylinders are major
portions or segments of long-bone shafts minus the articular
ends (Binford 1981:171)~ splinters are small shaft fragments
(Binford 1978:155, 463). Gnawing animals first attack the
articular ends of long bones, generating both cylinders and
splinters. For a given number of bones, continued attrition
then reduces the number of cylinders by gradually converting
them into splinters (Binford 1981:51 ). The result is a
graph of the sort shown in figure 22, which displays data
from a series of control assemblages with known degrees of

Nature and Condition of the Bison Remains - 59
predator-scavenger destruction (Binford 1981:176). Assem-
blages close to the origin of the graph have suffered very
little destruction; Garnsey falls clearly within this group.
100
z ~
50 . . .. 1/)
C!: w ...... . .. z -I 0.. .. 1.1) ...
0 0 5 10
CYliNDERS I MNI
• KNOWN CASES OF RAVAGED ASSEMBLAGES
x GARNSEY SITE
Figo 22. Relation between number of bone splinters per MNI and number of bone cylinders per MNI in Garnsey assemblage compared with values in a series of control assemblages with known degrees of destruction by predator-scavengers (adapted from Binford 1981:176).
Another similar way of assessing the degree of attri-
tion due to predator-scavengers is to compare the proportion
of articular ends still part of complete bones with the fre-
guency of cylinders per MNI (Binford 1981:176). This rela-
tion, shown in figure 23, assumes that, as destruction by
gnawing animals increases, the proportion of limb bones with
intact articulations decreases and the number of cylinders

Nature and Condition of the Bison Remains - 60
increases. Control assemblages known to have suffered Lela-
tively little destruction by predator-scavengers fall at the
upper left edge of the graph; again Garnsey is clearly with-
in this group.
z 0
50
0 0
. . . ·-·-·---,------, 5 10
CYLINDERS I MNI
• KNOWN CASES OF RAVAGED ASSEMBLAGES
x GARNSEY SITE
Fig. 23. Relation between frequency of articular ends remaining on complete bones and number of bone cylinders per MNI in Garnsey assemblage compared with values in a series of control assemblages with known degrees of destruction by predator-scavengers (adapted from Binford 1981:176).
Both of the figures discussed above are based on the
frequency of cylinders, which are extremely rare at Garnsey.
Similar conclusions are reached, however, concerning the
limited degree of attrition of the Garnsey assemblage when
other data are considered. The likelihood that a given bone
will survive the attacks of predator-scavengers is closely

Nature and Condition of the Bison Remains - 61
correlated with its density (Brain 1967, 1980, 1981; Binford
and Bertram 1977:138). Differences in the probability of
survival are particularly marked between the proximal and
distal ends of the humerus and tibia (Binford 1981:217-19).
The relative proportions of proximal and distal ends of
these bones on a site, therefore, provide a useful index of
the degree of attrition suffered by the assemblage. Binford
found the humerus to be particularly sensitive. Plotting a
series of control assemblages with known degrees of attri
tion, Binford (1981:219) obtained graphs of the type shown
in figures 24 and 25. In both figures Garnsey falls square
ly within the "zone of no destruction."
Finally, the destruction by predator-scavengers of
bones of immature animals should be more extensive than that
of the bones of mature animals (Brain 1967, 1980~ Binford
and Bertram 1977). This is clearly not the case at Garnseyv
The proportion of complete immature limb elements is sub
stantially greater than the proportion of intact mature limb
bones (see fig. 30 below).
Fluvial Disturbance
A somewhat more complex taphonomic problem concerns the
extent to which bones have been reworked and redeposited by
fluvial action. Their association with alluvial sediments
along the flanks and bottoms of channels suggests that re
working could have played an important role not only in dis-

IJ)
:::> ex. w
< :::> I
....J
""(
:! X 0 ex. ll..
-z <
;:;-\?
Nature and Condition of the Bison Remains - 62
100
Zone of NO DESTRUCTION
' 50
)(
0 0
50
% MNI DISTAL
oKNOWN CASES
•KNOWN CASES
)(GARNSEY SITE
Zone of DESTRUCTION
o---9 100
HUMERUS
OF RAVAGED ASSEMBLAGES
WITH NO DESTRUCTION
Fig. 24. Relation between proportional frequency of proximal humerus and distal humerus in Garnsey assemblage (%MNI) compared with values in a series of control assemblages with known degrees of destruction by predatorscavengers (adapted from Binford 1981:219). Note that %MNI has been calculated in this figure according to procedures outlined in Binford 1978:69-71.
placing materials downstream from the original kill-
processing loci, but also in sorting out and eliminating
smaller or less dense elements such as hyoids, sternebrae,
costal cartilage, rib fragments, vertebrae, and phalanges.
On the other hand, the excellent condition of the bison
skulls (many with unfused sutures), scapulae with fragile
proximal cartilage still intact, unfused epiphyses of limb
bones still in place, the absence of preferred orientations

<t cO
t=
<(
~ X 0 0.:: 0...
-z z
cf2
Nature and Condition of the Bison Remains - 63
100
Zone of NO
DESTRUCT ION
\ .
50 )( 0
0
0
•o Zone of 0 . 0
0 0 0 •• 0
DESTRUCT ION 0 0 -,
0 50 100
% MNI
oKNOWN
•KNOWN
Dl STAL Tl BIA
CASES OF RAVAGED ASSEMBLAGES
CASES WITH NO DESTRUCTION
xGARNSEY SITE
Fig. 25. Relation between proportional frequency of proximal tibia and distal tibia in Garnsey assemblage (%MNI) compared with values in a series of control assemblages with known degrees of destruction by predator-scavengers (adapted from Binford 1981:219). Note that %MNI has been calculated in this figure according to procedures outlined in Binford 1978:69-71.
of bones (strike and dip were recorded), and the fresh con-
dition of most of the bone (e.g., absence of abrasion, pol-
ish, surface exfoliation, or gnaw marks) argue for rapid
burial with little or no subsequent reworking.
One method taphonomists use to identify the nature and
extent of fluvial disturbance is to compare the observed
frequencies of skeletal elements with their expected fre-
quencies based on their dispersal potentials in flowing
water. Flume experiments have shown that the likelihood

Nature and Condition of the Bison Remains - 64
that a bone will be transported in a stream depends largely
on its density, size, and shape as well as on the velocity
of the current and various channel characteristics (Voo~hies
1969; Behrensmeyer 1975; Shipman 1981). Voorhies (1969)
showed that bones of medium-sized animals (sheep and coyote)
separated into three principal dispersal groups. The most
readily transported group (group I) contained ribs, ver
tebrae, the sacrum, and the sternum. The elements least
susceptible to transport (group III) were the skull and the
mandible. The various limb elements fell within an interme
diate dispersal group (group II). Similar studies by Beh
rensmeyer (1975) confirmed the utility of Voorhies dispersal
groups but showed that their composition varied somewhat
depending on the size of the animal.
In theory, underrepresentation at Garnsey of group I
and II elements, or overrepresentation of group III ele-
ments, would indicate that significant fluvial disturbance
and transport had occurred. Unfortunately, many of the ele
ments in groups I and II (e.g., sternum, ribs) also happen
to be among the elements of highest overall food utility
(see discussion of utility below) and therefore should be
underrepresented at a kill site, regardless of fluvial con
ditions. Other members of group I (e.g., sesamoids) are
commonly removed from kill sites as riders attached to
higher-utility parts and again will be underrepresented.
Similarly, group III elements (e.g., skull) are bulky, low-
Nature and Condition of the Bison Remains - 65
utility parts that typically are discarded at kills. Thusr
although Voorhies dispersal groups appear to provide an ob
jective measure of fluvial disturbance, in a kill site such
as Garnsey they are ambiguous.
To better understand the extent to which the Garnsey
bones have been disturbed and reworked, the configuration
and content of the various bone clusters on the site were
examined and compared (see Speth and Parry 1980:33-34).
These investigations indicate that clusters on the south
side of the original main channel are essentially intact and
undisturbed. Those on the north side have been spread out
somewhat in a downstream direction, but with little or no
significant differential loss due to sorting.
A variety of factors point to the intact nature of the
clusters on the south side of the main channel. The channel
during the fifteenth century, as today, was deflected toward
the north by bedrock outcrops as it passed through the site
area (see figs. 3 and 4). In addition, the alluvial depos
its in the wash dipped gently toward the north and west.
Both of these circumstances combined to confine overbank
flow primarily to the small peripheral channels on the north
side of the main channel.
Other factors also argue for limited disturbance of the
southern bone clusters: (1) the clusters have sharp outer
boundaries; (2) there is no evidence for size sorting of
materials within the clusters (the distribution of tiny re-

Nature and Condition of the Bison Remains - 66
sharper.ing flakes precisely matches that of the bones); (3)
the clusters occur in silt and fine sand, not in gravel as
on the north side; (4) skulls generally are intact; (5)
bones are stacked directly on top of each other with no
intervening lenses of alluvium; (6) unfused epiphyses are in
place; (7) horn sheaths are preserved and in several cases
are still on their horn cores; (8) cartilage is intact on
scapulae; (9) bones are fresh and unabraded; (10) several
fragments of butchered scapula blade are still stacked on
top of the scapula from which they were removed; and finally
(11) the southern clusters are virtually indistinguishable
from each other in terms of the proportions of various
skeletal elements, including smaller and less dense items
{table 10).
Bone clusters on the north side of the main channel
have been subjected to more fluvial disturbance than those
on the south side: (1) bones are found in gravel lenses in
and adjacent to shallow, braided channels; (2) cluster boun
daries are not sharp, particularly on the downstream side;
and (3) bones on the downstream side of clusters are often
separated vertically by thin lenses of alluvium. However,
for many of the same reasons given in the discussion of the
southern clusters, disturbance of the northern clusters ap
pears to have been comparatively minor and must have oc
curred very soon after the procurement activities at the
site (e.g., fresh condition of the bones; lack of abrasion

"' ~
Tab
le
10
Inv
en
tory
o
f id
en
tifia
ble
sk
ele
tal
ele
men
ts
in
lev
el
83
b
y
ex
cav
ati
on
u
nit
at
Garn
sey
S
ite
Tre
nch
T
ren
ch
T
ren
ch
T
ren
ch
es
78
-7
78
-6
77
-2
77
-2,
78
-6,
Ele
men
t 7
8-7
N
%
N
%
N
%
' N
%
1.
Sk
ull
2
3
5.2
4
1. 9
7
2.8
3
4
3.7
2
. M
an
dib
le
2 0
.4
0 0
.0
2 0
.8
4 0
.4
3.
Hy
oid
0
0.0
2
0.9
0
0.0
2
0.
2 4
. A
tlas
10
2
.2
2 0
.9
8 3
. i
20
2
.2
5.
Ax
is
8 1
.8
2 0
.9
5 2
.0
15
1
.6
6.
Cerv
ical
( 3
-7)
30
6
.7
11
5
.2
15
5
.9
56
6
. 1
7.
Th
ora
cic
(
1-1
4)
53
1
1.9
19
9
.0
36
1
4.2
1
08
1
1.8
8
. L
um
bar
(
1-5
) 1
4
3.
1 4
1 . 9
9
3.5
2
7
3.0
9
. S
acru
m
3 0
.7
4 1
.9
0 0
.0
7 0
.8
10
. C
au
dal
4 0
.9
6 2
.8
4 1
.6
14
1.
5 1
1 .
R
ib
68
1
5.2
4
0
18
.9
16
6.3
1
24
1
3.6
1
2.
Co
sta
l carti
lag
e
22
4
.9
9 4
.2
9 3
.5
40
4
.4
13
. S
tern
eb
ra
9 2
.0
G
2.8
4
1 .6
19
2
. 1
14
. S
cap
ula
11
2
.5
5 2
.4
10
3
.9
26
2
.9
15
. H
um
eru
s 8
1.
8 9
4.2
8
3.
1 2
5
2.7
1
6.
Rad
ius
6 1
. 3
3 1
. 4
5 2
.0
14
1.
5 1
7.
Uln
a
4 0
.9
1 0
.5
2 0
.8
7 0
.8
18
. R
ad
ial
carp
al
3 o
. 7
5 2
.4
3 1
. 2
i 1
1.
2 1
9.
Inte
rmed
iate
carp
al
2 0
.4
3 1
. 4
2 0
.8
7 0
.8
20
. U
lnar
carp
al
4 0
.9
1 0
.5
3 1
. 2
8 0
.9
21
. A
ccesso
ry
carp
al
2 0
.4
1 0
.5
2 0
.8
5 0
.5
22
. F
use
d
2d
-3d
carp
al
3 0
.7
2 0
.9
4 1
. 6
9 1
.0
23
. 4
th carp
al
3 0
.7
0 0
.0
4 1
. 6
7 0
.8
24
. 5
th
meta
carp
al
0 0
.0
0 0
.0
5 2
.0
5 0
.5
25
. M
eta
carp
al
5 1
.1
2 0
.9
4 1
. 6
1 1
1.
2 2
6.
Pelv
is
24
5
.4
16
7
.5
10
3
.9
50
5
.5
27
. F
emu
r 1
9
4.3
5
2.4
6
2.4
3
0
3.3
2
8.
Pate
lla
6 1
. 3
2 0
.9
2 0
.8
10
1
.1
29
. T
ibia
8
i. 8
6
2.8
4
1.6
1
8
2.0
3
0.
Astr
ag
alu
s
6 1
. 3
3 1
. 4
2 0
.8
11
1
. 2
Tre
nch
es
77
-1.
78
-1.
78
-5
N
%
17
1.
9 8
0.9
1
0
1.1
3
0.3
4
0.4
3
6
4.0
6
5
7.3
3
3
3.7
3
0.3
2
9
3.3
1
35
1
5.2
6
1
6.8
1
9
2 . 1
4
0
4.5
1
2
i. 3
12
1
. 3
13
1.
5 7
0.8
14
1
. 6
7 0
.8
10
1
.1
4 0
.4
6 0
.7
3 0
.3
15
1
. 7
30
3
.4
I 17
1 .9
6
0.7
1
6
i. 8
6
0.7

(f\ ~
Tab
le
10
(c
on
t. )
Tre
nch
T
ren
ch
T
ren
ch
T
ren
ch
es
Tre
nch
es
78
-7
78
-6
77
-2
77
-2,
77
-1,
78
-6,
78
-1,
Ele
men
t 7
8-7
7
8-5
N
%
N
%
N
%
N
%
N
%
31
.
Late
ral
mall
eo
lus
5 1
.1
2 0
.9
0 0
.0
7 0
.8
9 1
.0
32
. C
alc
an
eu
s
2 0
.4
4 1
. 9
3 1
. 2
9 i
.0
12
1
. 3
33
. N
av
icu
locu
bo
id
5 1
. 1
1 0
.5
0 0
.0
6 0
.7
10
1
.1
34
. 1
st
tars
al
1 0
.2
0 0
.0
0 0
.0
1 0
.1
2 0
.2
35
. F
use
d
2d
-3d
ta
rsal
4 0
.9
2 0
.9
0 0
.0
6 0
.7
7 0
.8
36
. 2
d
m,e
ta tar s
a 1
1
0.2
0
0.0
0
0.0
1
0.1
1
0.1
3
7.
Meta
tars
al
5 1
.1
4 1
. 9
2 0
.8
11
i. 2
11
1
. 2
38
. 1
st
ph
a ·1
an
x
20
4
.5
8 3
.8
13
5
. 1
41
4.5
4
5
5.
1
39
. 2
d
ph
ala
nx
1
3
2.9
7
3.3
9
3.5
2
9
3.2
4
2
4.7
40
. 3
d
ph
ala
nx
9
2.0
8
3.8
16
6
.3
33
3
.6
34
3
.8
41
. P
rox
imal
sesa
mo
id
17
3
.8
2 0
.9
17
6.7
3
6
3.9
5
2
5.8
42
. D
ista
l se
sam
oid
4
0.9
1
0.5
3
1 ..
2 8
0.9
2
5
2.8
T
ota
l 4
46
2
12
2
54
9
12
8
91
No
te:
Th
is
tab
le
om
its
loo
se
teeth
an
d
too
th
fra!;
!men
ts,
un
iden
tifi
ab
le
vert
eb
ral
fr"a
grn
en
ts,
mis
cell
an
eo
us
rib
v
ert
eb
ral
pro
cess
frag
men
ts,
meta
po
dia
ls,
an
d u
nid
en
tifi
ab
le
bo
ne
frag
men
ts.

Nature and Condition of the Bison Remains - 69
and gnawing; preservation of skulls, horn sheaths, and scap
ular cartilage; absence, for the most part, of preferred
orientations of bones; close match between distribution of
bones and resharpening flakes~ etc.). Finally, the frequen
cies of skeletal elements in the northern clusters are vir
tually identical to the frequencies in the undisturbed
southern clusters (see table 10).
In light of these observations, it seems reasonable to
proceed on the assumption that differential loss of smaller
or less dense elements, due either to factors of preserva
tion or to fluvial sorting, has not played a significant
role in the formation of the archeological record at Garn
sey.

4. Selective Procurement at Garnsey
SEASONALITY, AGE STRUCTURE, AND THE SELECTIVE PROCUREMENT OF MALES
Michael Wilson (1980:93, 123) undertook a detailed
analysis of the Garnsey dentitions to determine the age
structure of the kill population and the season when animals
were hunted within the Garnsey Wash. Combining eruption and
wear data with measurements of crown heights (metaconid and
paracone) of mandibular and maxillary molars, respectively,
Wilson concluded that the bison were killed during the
spring calving season (probably April-May, ba~ed on ihe tim-
ing of calving in Northern Plains bison). A somewhat earli-
er time for kill activities at Garnsey (late March-early
April) is suggested by calving data from Southern Plains
herds (Halloran and Glass 1959:369).
The age structure of the kill population indicated by
the Garnsey dentitions is markedly bimodal (fig. 25) and is
not typical of the expected age distribution for a cata-
strophic kill. Two distinct peaks are present, one at three
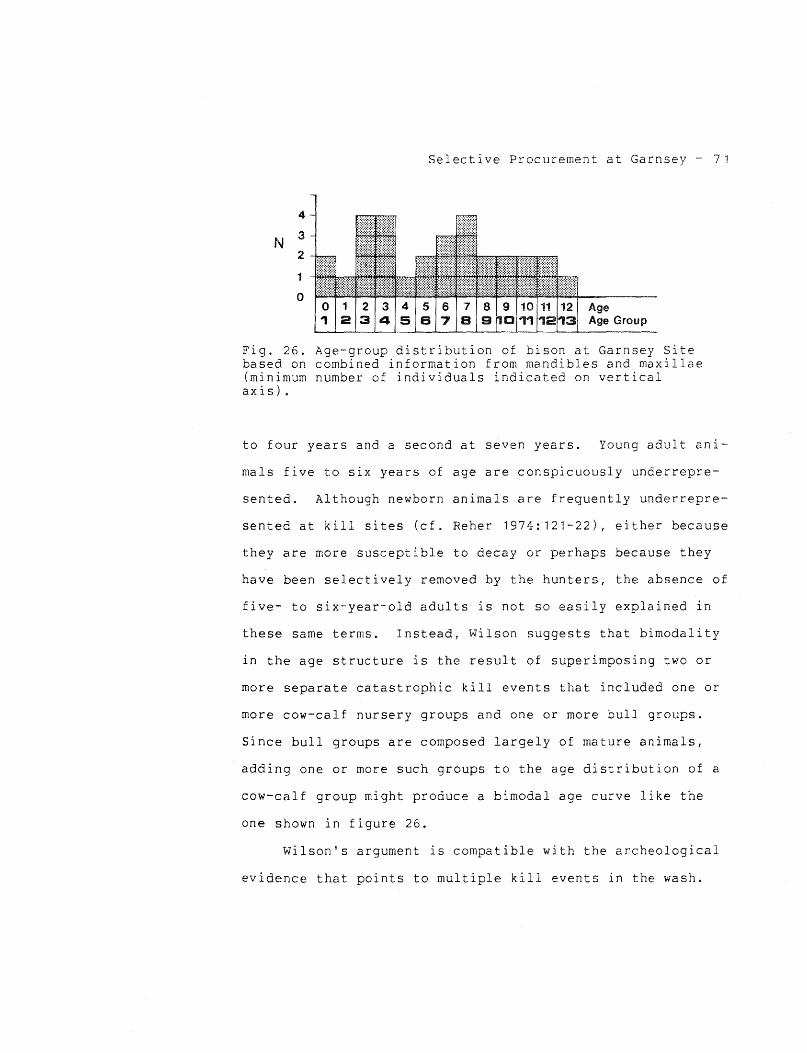
Selective Procurement at Garnsey- 71
4
N 3
2
0 Age Age Group
Fig. 26. Age-group distribution of bison at Garnsey Site based on combined information from mandibles and maxillae (minimum number of individuals indicated on vertical axis) .
to four years and a second at seven years. Young adult ani-
mals five to six years of age are conspicuously underrepre-
sented. Although newborn animals are frequently underrepre-
sented at kill sites (cf. Reher 1974:121-22), either because
they are more susceptible to decay or perhaps because they
have been selectively removed by the hunters, the absence of
five- to six-year-old adults is not so easily explained in
these same terms. Instead, Wilson suggests that bimodality
in the age structure is the result of superimposing two or
more separate catastrophic kill events that included one or
more cow-calf nursery groups and one or more bull groups.
Since bull groups are composed largely of mature animals,
adding one or more such groups to the age distribution of a
cow-calf group might produce a bimodal age curve like the
one shown in figure 26.
Wilson's argument is compatible with the archeological
evidence that points to multiple kill events in the wash.
Selective Procurement at Garnsey - 72
Wilson's conclusion also fits the observed sex structure of
the Garnsey kill population, in which 60% of the animals are
males (see below). Even during the rut the percentage of
males in modern herds does not normally approach this value.
And outside the rutting season the percentage of bulls usu
ally drops considerably lower (Wilson 1980:117; McHugh
1958: 14-15). Moreover, as already noted, the Garnsey denti
tions argue against procurement during the rut. Thus the
most plausible explanation for the high proportion of males,
which also 1s compatible with the observed bimodal age dis
tribution, is a pattern of multiple procurement events in
which one or more cow-calf groups and several bull groups
were killed in the wash. This conclusion assumes, of
course, that the predominantly male sex ratio of the skulls
accurately reflects the sex structure of the original kill
population {all events combined), an assumption I will ex
amine more fully below.
It should be pointed out that none of the bone clusters
presumably resulting from the hunting of bull groups at
Garnsey contained only bulls. As will be discussed below,
most of these clusters contained a relatively high propor
tion of females (ca. 40%). Thus, in an average bull group
of perhaps six to eight animals, two or three might be cows.
The literature is somewhat unclear concerning the composi
tion of bull groups in modern herds. McHugh (1958:14) noted
that bull groups were largest during the calving season but
Selective Procurement at Garnsey - 73
that they rarely contained cows, other than an occasional
old and barren individual. Meagher (1973:46), however, in a
more recent study of the Yellowstone herd, noted that cows
without calves were not uncommon in bull groups. Moreover,
Halloran (1968) provides evidence from the Southern Plains
that cows may not have calved every year. Thus bull groups
during the calving season may often have contained a few rna-
ture females that did not give birth that year.
The proportion of noncalving females joining bull
groups may in fact be an indirect reflection of the severity
of local environmental conditions, since the latter would
directly affect the rate of conception in the herd (Meagher
1973; Fuller 1961; Reher and Frison 1980). By this argu-
ment, the relatively high proportion of females in the Garn-
sey "bull groups" may indicate less-than-optimal range con-
ditions during the mid- to late fifteenth century in south-
eastern New Mexico, an issue to which I will return later.
Finally, it is interesting that the procurement of bull
groups containing cows that were not calving would have con-
tributed to the underrepresentation of juvenile animals at
Garnsey, despite the timing of hunts during the calving sea-
son and the presence of females in virtually every kill.
SEX STRUCTURE: DISCREPANCY BETWEEN CRANIAL AND POSTCRANIAL REMAINS
The sex of the Garnsey skulls, mandibles, and thirty-
two postcranial elements has been determined using cross-

Selective Procurement at Garnsey - 74
plots of various metric attributes and ratios (table 11).
Procedures used to sex the cranial materials and eleven of
the postcranial elements have been described elsewhere
(Speth and Parry 1980:81, 307-18). Additional criteria, de
veloped specifically to help in sexing damaged or fLagmen
tary limb elements, are presented in the Appendix. Since
the 1980 report appEared 1 twenty-one additional elements
have been sexed 1 primarily in the axial skeleton. These in
clude cervicals 3-7; thoracics 1 1 12-14; lumbars 1-5; sa
crum; manubrium; metasternum (posterior, triangular sternal
body; see Kobryn 1973); pelvis; astragalus; and phalanx 2
(both front and rear). Thoracics 2-11 could not be separat
ed with confidence and therefore were not sexed. The prin
cipal criteria used to sex these additional elements are
summarized in table 12.
Based on skulls, males outnumber females by a ratio of
60:40. Based on mandibles, females outnumber males by a
ratio of nearly 60:40. The average sex ratio for all post
cranial elements combined is approximately 66:34 in favor of
females. The proportion of female bones among axial ele
ments is lower and va~ies more widely than among appendicu
lar elements. The average ratio for all axial elements com
bined is approximately 62:38 in favor of females, while that
for all appendicular elements combined is 70:30, also in
favor of females. In addition to skulls, the only other
elements with a sex ratio in which male parts predominate

~j
Ul
Tab
le
11
Sex
o
f G
arn
sey
cra
nia
l an
d postcrani~l
mate
rial
Sex
ed
M
NI
Ele
men
t S
ex
Ele
men
t N
%
1 .
Sk
ull
M
18
6
0.0
2
1.
Meta
stern
um
F
1
2
40
.0
2.
Man
dib
le
M
5 4
1.7
2
2.
Scap
ula
F
7
58
.3
3.
Atl
as
M
7 3
5.0
2
3.
Pro
xim
al
hu
mer
us
F
13
6
5.0
4
. A
xis
M
9
50
.0
24
. D
ista
l h
um
eru
s F
9
50
.0
5.
Cerv
ical
3 M
6
46
.2
25
. P
rox
imal
rad
ius
F
7 5
3.8
6
. C
erv
ical
4 M
5
50
.0
26
. D
ista
l ra
diu
s
F
5 5
0.0
7
. C
erv
ical
5 M
8
47
. 1
27
. U
lna
F.. 9
52
.9
8.
Cerv
ical
6 M
1
0
62
.5
28
. P
rox
imal
meta
carp
al
F
6 3
7.5
9
. C
erv
ical
7 M
1
10
.0
29
. D
ista
l m
eta
carp
al
F
9 9
0.0
1
0.
Th
ora
cic
1
M
6 4
2.9
3
0.
Pelv
is
(rig
ht)
F
8 5
7.
1 11
.
Th
ora
cic
1
2
M
1 2
5.0
3
1 .
P
rox
imal
fem
ur
F 3
75
.0
12
. T
ho
racic
13
M
2
25
.0
32
. D
ista
l fe
mu
r F
6
75
.0
13
. T
ho
racic
1
4
M
2 2
5.0
3
3.
Pro
xim
al
tib
ia
F
6 7
5.0
1
4.
Lu
mb
ar
1 M
2
20
.0
34
. D
ista
l ti
bia
F
8
80
.0
15
. L
um
bar
2
M
0 0
.0
35
. A
str
ag
alu
s
F 6
10
0.0
1
6.
Lu
mb
ar
3 M
2
50
.0
36
. C
alc
an
eu
s F
2
50
.0
17
. L
um
bar
4
M
4 4
0.0
3
7.
Pro
xim
al
meta
tars
al
F
6 6
0.0
1
8.
Lu
mb
ar
5 M
5
55
.6
38
. D
ista
l m
eta
tars
al
F
4 4
4.4
1
9.
Sac
rum
M
7
53
.8
39
. P
hala
nx
2
(fro
nt)
F
6
46
.2
20
. M
anu
bri
um
M
2
33
.3
40
. P
hala
nx
2
(rear)
F
4
66
.7
Sex
ed
M
NI
Sex
N
%
M
1 2
5.0
F
3
75
.0
M
4 3
3.3
F
8
66
.7
M
2 2
5.0
F
6
75
.0
M
3 3
3.3
F
6 6
6.7
M
2
33
.3
F
4 6
6.7
M
3
42
.9
F
4 5
7.
1 M
5
50
.0
F
5 5
0.0
M
3
27
.3
F
8 7
'2.7
M
3
27
.3
F
8 7
2.7
M
12
6
0.0
F
8
40
.0
M
1 1
6.7
F
5 8
3.3
M
1
16
.7
F 5
83
.3
M
2 2
8.6
F
5
71
.4
M
3 3
7.5
F
5
62
.5
M
2 2
0.0
F
8 8
0.0
M
2
22
.2
F
7 7
7.8
M
3
27
.3
F
8 7
2.7
M
3
27
.3
F
8 7
2.7
M
6
60
.0
F
4 4
0.0
M
5
50
.0
F 5
50
.0
~--

iJ
0'
Tab
le
12.
Crit
eria
fo
r sex
ing
p
ostc
ran
ial
sk
ele
tal
ele
men
ts
Ele
men
t C
rit
eria
' R
efe
ren
ces
1 .
Cerv
ical
(3-7
) B
Fcr
x H
Fcr:
BF
cd
x
HF
cd
vo
n
den
D
riesch
(1
97
6:7
2-7
3)
BP
acr:
BP
accl
II
BP
acr:
BF
cd
x
HF
cd
II
BP
acd
:BF
cd
x
HF
cd
II
BP
acr
x B
Pacd
:BF
cd
x
HF
cd
"
2.
Th
ora
cic
(
1 '
12
-14
) B
Fcr
x H
Fcr:
BF
cd
x
HF
cd
vo
n
den
O
riesch
(1
97
6:7
2-7
3)
BP
tr:B
Pacd
II
BP
tr:B
Fcd
x
HF
cd
II
BP
tr:B
Pacr
x B
Pacd
II
3.
Lu
mb
ar
(1
-5
)
BF
cr
x H
Fcr:
BF
cd
x
HF
cd
vo
n
den
D
r i esc
tl
( 1
97
6; 7
2-7
3)
BP
acr
x B
Pacd
:GL
Pa
II
BF
cd
x H
Fcd
:GL
Pa
II
4.
Sacru
m
BF
cr
x H
Fcr:
PL
(1
st
bo
dy
o
nly
) v
on
d
en
D
r i esc
ll
(19
76
:71
)
5.
Pelv
is
Aceta
bu
lar
vo
lum
e
(AV
) K
ob
ryn
czu
k
(19
76
:39
) L
A:A
V
vo
n
den
O
riesch
(1
97
6:8
3)
Max
imum
le
ng
th
of
cra
nia
l ---
bra
nch
o
f p
ub
is
fro
m
aceta
bu
lar
rim
to
sy
m-
ph
ysis
M
axim
um
thic
kn
ess
of
pu
bis
--
-at
sym
ph
ysi
s SH
x
SB
:AV
v
on
d
en
D
riesch
(1
97
6:8
3)
- 6.
Man
ub
riu
m
IJ
Ko
bry
n
(19
73
:31
6-1
7,
32
4-2
7)
7.
Meta
stern
um
K
L K
ob
ryn
(1
97
3:3
16
-17
, 3
24
-27
) - 8
. A
str
ag
alu
s
GL
r x
GB
:Bd
v
on
d
en
D
riesch
(1
97
6:8
8-8
9)
Vo
lum
e K
ob
ryn
czu
k
an
d
Ko
bry
n
(19
73
:29
1)
- 9.
Ph
ala
nx
2
Ind
ex
:dis
tal
wid
th
Du
ffie
ld
(19
70
:79
-83
, 1
97
3)
Ind
ex
: d
ista
l w
idth
E
mp
el
an
d
Ro
sko
sz
(19
63
:27
4-7
5)
-----·---~
'Co
lon
d
en
ote
s cro
ssp
lot;
11
X"
den
ote
s
pro
du
ct;
fo
r ad
dit
ion
al
crit
eria
, see als
o
Ap
pen
dix
in
th
is
stu
dy
an
d
Sp
eth
an
d
Parr
y
(19
80
:81
, 3
07
-18
).
Selective Procurement at Garnsey - 77
are cervical 6, lumbar 5, sacrum, pelvis, and phalanx 2
(front).
The striking disparity in the sex ratio between skulls
and most other skeletal elements is not likely to be an ar
tifact of sampling bias, nor does it reflect problems in
sexing postcranial material. Smiley (1979), for example,
using an independent set of measurements, arrived at nearly
identical sex determinations for various forelimb elements
from the Garnsey Site. If anything, for many of the ele
ments there should be a bias in favor of males rather than
females. For example, fragmentary limb elements, in which
the degree of fusion of the epiphyses is unknown, can be
sexed as male if the requisite metric attributes place them
clearly within the male mode. Such specimens cannot be
classified as female, however, if they fall within the fe
male mode, because they may represent very immature males.
Thus fragmentary female specimens are more likely to be ex
cluded than fragmentary male specimens.
Considering the disparity in sex ratio between skulls
and most postcranial elements, the question naturally arises
of which element most closely approximates the sex ratio of
the original kill population. An obvious source for the
disparity is that female skulls may have been selectively
butchered or removed from the site, thereby biasing the sex
ratio of the remaining skulls in favor of males. While
selective butchering of female skulls to gain access to the

Selective Procurement at Garnsey - 78
brain is plausible because it is easier to open the vault of
the female, there is no convincing evidence that this was
regularly done at Garnsey. Skulls, regardless of sex, show
relatively little evidence of butchering. Furthermore,
cranial fragments are relatively scarce at Garnsey, making
it unlikely that a large number of skulls were demolished by
butchering. Of those fragments that did occur on the site,
many could still be sexed, and the majority of these were
male.
Selective removal from the site of female skulls is
somewhat more difficult to rule out. As I will show in more
detail below, there is a relatively strong negative correla
tion at Garnsey between the general utility of an element
(Binford 1978) and its frequency on the site expressed as a
percentage of the expected number. Thus an element of low
overall utility, such as the skull, is found in proportion
ately large numbers. The skull, in fact, was the most nu
merous-element at Garnsey, providing the best estimate for
the MNI. There is also a strong tendency at Garnsey for
discrimination against female anatomical parts to increase
with the utility of the part. These two facts together sug
gest that the lower the general utility of an element, the
more closely its observed frequency on the site approaches
the expected number~ and the more closely the sex ratio of
the element approaches the sex ratio of the original kill

Selective Procurement at Garnsey - 79
population. These issues will be addressed more fully
below.
In summary, I argue that, because of their low overall
utility, both male and female skulls normally were abandoned
at the kill site rather than being transported elsewhere for
processing or consumption. also argue that on-site pro
cessing of skulls was minimal and did not lead to signifi
cant differential destruction of female parts. These con
siderations lead to the conclusion that the sex ratio of the
skulls represents a reasonably close approximation of the
sex ratio of the original kill population, 60:40 in favor of
males (all kill events combined).
METHOD OF PROCUREMENT
The following observations are relevant to understand
ing the method of bison procurement employed at the Garnsey
Site: (1) several different kill events are represented at
the sitet (2) all these kills appear to have taken place in
the spring; {3) these kills involved both cow groups and
bull groups; (4) the bone clusters occur out on the floor of
the wash along a major, perhaps perennially moist channel
rather than close to the bedrock walls of the wash or within
the narrower tributaries of the wash; (5) the bone clusters
OGcur in groups, widely separated from similar groups (at
least two such groups were excavated in level B3, one on the
north side of the arroyo, the other about 80 to 100 m down-

Selective Procurement at Garnsey - 80
stream on the south side; one or more such groups also exist
farther upstream); (6) hunting was done on foot, without the
aid of firearms; (7) projectile points are scarce (ten
points for more than thirty-five animals).
GARNSEY SITE "NORTH-SOUTH" SECTION ISOOW LINE)
SCALE 10 M tHOR. AND VERT.!
BEDROCK ~N-
Fig. 27. North-south section of Garnsey Wash through eastern end of trenches 77-1 and 77-2 (see fig. 7 for approximate location), showing general configuration of wash and position of principal bone-bearing level (level B3; denoted by series of x's).
The methods by which the bison were gathered, con-
tained, and killed at Garnsey remain somewhat unclear.
There is no evidence that the site was an arroyo trap. Bi-
son remains do not occur in or near any of the major tribu-
taries in the vicinity of the site, and it seems unlikely
that the carcasses would have been dragged great distances
from more remote trap localities. Nor was the site a clas-
sic jump locality in which the animals would have been
killed or disabled by the fall from a cliff. The walls of
the wash in the site area are neither high enough nor steep
enough, and they offer no effective obstacle to the movement
of animals in and out of the wash (see figs. 4 and 5 above).
1062

Selective Procurement at Garnsey - 81
The unsuitable nature of the wash as a jump locality 1s
brought out more clearly in figure 27, which presents a
north-south section of the site through the eastern end of
trenches 77-1 and 77-2 (see fig. 7 for approximate location
of section).
A variant of the classic cliff jump that could have
been used at Garnsey was a stampede over the edge of the
wash into some form of pound or corral (see Frison 1978:
243ff. for a description of this method). One of the ear
liest Spanish expeditions to explore the Pecos Valley ob
served a large corral or pen somewhere near Carlsbad, New
Mexico, that may have been used for precisely this purpose:
"The twenty-third [of November 1590] we left this place,
where the river turned sharply toward the west, and we came
upon a very large corral used by the Indians for enclosing
cattle" (Castano de Sosa in Hammond and Rey 1966:260-61).
If corral trapping was in fact employed at the Garnsey
Site, the spatial distribution of bones in the wash indi
cates that several different structures would have been in
operation during the period represented by levels A2, B3,
and B4. Unfortunately, we encountered no direct evidence
for corrals during the two seasons of excavation, but it
must be noted that the site was not sampled with this
specific objective in mind.
A more opportunistic method of procurement that may
have been used at Garnsey, and one more compatible with the

Selective Procurement at Garnsey - 82
data at hand, was cooperative ambushing or surrounding of
animals grazing along the channel or attracted to the area
by the spring a few hundred meters upstream from the site.
This method would account for the occurrence of bone clus
ters in widely separated parts of the wash.
Whichever method was employed--trapping animals in a
corral ~r surrounding them on the floor of the wash--the
scarcity of projectile points, complete or fragmentary, is
problematic. Frison (1978:243ff.) notes that large numbers
of points are usually recovered from kill sites that did not
involve a lethal jump. Projectile points at Garnsey, of
course, may simply have been salvaged from the carcasses
during the butchering. It is also possible, however, that
the points used at the kill were made of a perishable mate
rial such as wood (or even the neck tendon of bison;
cf. Weitzner 1979:240~ see also comments in Medicine Crow
1978:251). Wood in particular appears to have been widely
used in the historic Southwest. Luxan's account of the Es
pejo expedition of 1582, for example, mentions some sort of
spear or javelin that may have been made entirely of wood:
"This place we called El Arroyo de las Garrochas, because we
found many goad sticks with which the Indians kill the buf
falo" (in Hammond and Rey 1966:207). Mason (1894) documents
the widespread use of arrows tipped only with wood. He
provides the following example of the existence of wooden
points among the Apache: "The arrow of the Apache sometimes

Selective Procurement at Garnsey - 83
terminates in a triangular piece of hard wood, which seems
to be perfectly effective as a weapon" (letter by J. G.
Bourke, quoted in Mason 1894:669). Opler offers a similar
example of the use of wooden points among the Apache: "When
flints are to be affixed, the shaft is split, the arrowhead
is inserted, and the shaft is tightly wrapped with moistened
sinew. More commonly, however, no flint is used; the wooden
tip of the arrow is simply sharpened and fire hardened" (Op
ler 1965:389). Unfortunately, no direct evidence of wooden
points has been found at Garnsey. Thus there is at present
no satisfactory explanation for the unexpectedly small num
ber of projectile points recovered from the kill.

5. Selective Processing at Garnsey
INTRODUCTION
It is common practice in kill-site reports to present a
table or graph displaying the observed versus the expected
frequency of the various skeletal elements recov~red. These
data indicate which anatomical parts were transported away
from the kill, were fragmented beyond recognition by on-site
processing (e.g., bone-grease rendering), or were lost
through various taphonomic processes (e.g., fluvial sort-
i ng) •
Observed versus expected frequencies for the Garnsey
material, based on a sitewide MNI value of thirty-five, are
presented in figure 28. It is evident from these data that
skulls, atlases, axes, and pelvises are among the elements
most commonly abandoned at the site. These are bulky or
low-yield parts, and their abundance therefore is not unex-
pected. Ribs, costal cartilage, sternebrae, hyoids, and
caudals are among the elements least well represented on the
site. These elements are particularly susceptible to loss
Selective Processing at Garnsey - 85
through decay, carnivore destruction, or fluvial sorting.
However, as discussed above, taphonomic factors do not ap
pear to have played a major role at Garnsey in altering the
proportional representation of smaller or less dense skele
tal elements. Preservation of bone, including cartilage, is
excellent. Furthermore, these same elements are comparably
infrequent in clusters on the south side of the main chan
nel, where virtually no fluvial disturbance occurred. Thus
their scarcity probably reflects in large part their selec
tive removal by the hunters themselves. The scarcity of
caudals may, at least in part, reflect the removal of hides.
It is worth noting in this regard that caudals are better
represented in the secondary processing area than any other
identifiable vertebral element (see table 1 above). The
other low-frequency elements noted above derive from some of
the choicest meat cuts in the bison (i.e., ribs, briskets,
and tongues), and their scarcity on the site therefore is
entirely expectable (for a survey of the ethnographic and
historic literature concerning preferred meat cuts in bison,
see Wheat 1972).
Thus, at least some of the skeletal elements displayed
in figure 28 are ordered in terms of the relative value or
utility of the meat cuts from which they derive. But such
assessments of utility are too subjective and limited to be
useful in evaluating the extent to which the entire array of
elements in figure 28 may be similarly ordered. Clearly, a

SKULL ATLAS PELVIS AXIS CERVICAL (3-7) PROX. HUMERUS PROX. METACARPAL PROX. TIBIA DIST. HUMERUS DIST. FEMUR SACRUM INTERMEDIATE CARPAL DIST. METACARPAL 1ST PHALANX DIST. RADIUS PROX. METATARSAL DIST. METATARSAL PROX. RADIUS ULNA MANDIBLE SCAPULA DIST. TIBIA CALCANEUS THORACIC 2ND PHALANX ASTRAGALUS NAVICULO-CUBOID RADIAL CARPAL ULNAR CARPAL PATELLA 3RD PHALANX LUMBAR PROX. FEMUR ACCESSORY CARPAL LATERAL MALLEOLUS FUSED 2ND-3RD CARPAL 4TH CARPAL RIB FUSED 2ND-3RD TARSAL PROX. SESAMOID STERNEBRA HYOID CAUDAL 5TH ~1ETACARPAL DIST. SESAMOID COSTAL CARTILAGE 1ST TARSAL 2ND METATARSAL
0 0 (Observed) bE (Expected)
Selective Processing at Garnsey - 86
PERCENT 100
35 35 100.0 k: :::;::·: :>::::::: ;:;:::: 29 35 82.9 48 70 68.6 k 21 35
60. 0 1::: :::· }{~
86 175 49.1 j 32 70 45.7
J 31 70 44.3 :::::
::::::; 30 70 42.9 29 70 41.4 j 27 70 3 8. 6 l3 35 37.1 25 70 35.7 25 70 35.7
100 280 3 5. 7 24 70 34.3 24 70 34.3 24 70 34.3 23 70 32.9 23 70 32.9 22 70 31.4 22 70 31.4 22 70 31.4 22 70 31.4
152 490 31.0 84 280 30.0 20 70 28.6 20 70 28.6 19 70 27.1 19 70 27.1 19 70 27.1 73 280 26.1 :::::: 45 17 5 25.7 17 70 24.3 16 70 22.9 16 70 22.9 15 70 21.4 15 70 21.4
183 980 18.7 l3 70 18.6 96 560 17.1 41 24 5 16.7 11 70 15.7 55 350 15.7
9 70 12.9 34 280 12.1
107 98 0 10.9 3 70 4. 3 2 70 2. 9
'
Fig. 28. Observed versus expected number of skeletal elements at Garnsey Site (based on MNI estimate of thirtyfive) o

Selective Processing at Garnsey - 87
broader and more objective set of criteria is needed that
can be applied to all anatomical parts of the bison.
THE MODIFIED GENERAL UTILITY INDEX
Binford (1978), in a study of Nunamiut Eskimo hunting
and processing strategies, has developed a series bf ex-
plicit, quantitative utility indexes for each element in the
skeletons of caribou and sheep. These indexes were derived
by first determining the meat, marrow, and grease yield of
each element (expressed as meat, marrow, and grease utility
indexes). These values were then combined into a single
general utility index (GUI) for each animal. Since certain
low-utility elements may be removed from the kill as riders
attached to elements of higher utility, the GUI was adjusted
to produce a modified general utility index (MGUI).
The indexes developed by Binford express the utility of
a given element relative to other elements in the same car-
cass (or similar ones). They are not intended to measure
differences between carcasses arising from sexual dimor-
phism, nutritional state, or age. Thus, femurs from bulls
and cows are assigned the same MGUI value of 100, despite
the fact that the meat yield from the male femur is undoub-
tedly greater than that from the. female. In order for iden
tical utility values to hold for both males and females, the
proportional distribution of bulk in the two sexes must be
similar. Lott (1974:383) notes that bison males differ

Selective Processing at Garnsey - 88
somewhat in shape from females. In particular, bulls have
proportionately larger humps and thicker necks. Despite
these differences, the overall distribution of bulk in
adults of the two sexes appears to be broadly comparable:
the average percentage of dressed carcass weight in the
front quarters of male bison is between 53.2 and 53.9, while
that in the fro~t quarters of females is between 52.4 and
52.5 (Peters 1958:88).
Binford (1978:475) employed variants of the caribou
MGUI to evaluate the bone frequencies from two bison kills,
Glenrock in Wyoming and Bonfire Shelter in Texas. He argued
that, in the absence of explicit utility indexes for bison,
using caribou indexes as approximations was not unreason
able, in light of the overall proportional similarity in the
anatomy of caribou, bison, and many other ungulates.
The modified general utility index derived by Binford
(1978:74, table 2.7, column 1) for caribou will be used here
to evaluate the frequency of skeletal elements recovered
from the Garnsey Site (see table 13)~ Used cautiously, the
MGUI should provide a reasonable approximation of the extent
to which processing decisions at Garnsey were predicated on
utility. Explanations of deviations from the ordering pre
dicted by the MGUI must be presented tentatively, however,
since it may be difficult at times to discriminate between
deviations that stem directly from processing decisions by
prehistoric hunters and deviations due to inadequacies in

Selective Processing at Garnsey - 89
using for bison an index designed for caribou. Neverthe-
lessr the prospect of gaining further insight into the na-
ture and causes of the variability in bone frequencies ob-
served at Garnsey makes the attempt worthwhile.
PROCESSING DECISIONS AT GARNSEY: THE TREATMENT OF BOTH SEXES COMBINED
Figure 29 shows the relationship between the MGUI and
the frequency of skeletal elements at the Garnsey Site ex
pressed as a percentage of the expected number (%MNI) for an
MNI of thirty-five animals (position and shape of "regres-
sion line" are approximate). The curve displays a relative-
ly strong negative curvilinear relationship for most ele-
ments. The shape of the curve is of interest. The frequen-
cy of most elements is confined to a rather narrow range
(ca. 25-35%) over a wide range of utility values (from ca.
15-20 to 100). Only below utility values of about 15 does
the frequency of elements rise sharply; these low-utility
elements (skull, atlas, axis) were discarded in large num-
bers on the site. The shape of the distribution in figure
29 corresponds to what Binford (1978:81) has termed a "bulk"
curve, in which hunters "select for large quantities of
parts of both high and moderate value and abandon parts of
the lowest utility at rapidly accelerating rates." The op-
posite extreme is the "gourmet" curve in which hunters se-
lect only the highest-utility parts and discard large quan-
tities of moderate- and low-value parts.

Selective Processing at Garnsey - 90
wo .sk
80 ~At
I I
.Pel
60 ~Ax
I 8 Cer(3-7)
40
1 PMc \.
I
ePH .PT .DH
.DF \
DMc. \,Ph 1 DMt PMt Man.' Q~· • •pR Cal Sc~p .or •Ph2 -----:A~t---- ·rh ___________________________ _ Ph 3eoc •l PF or um •
.Ster 20 .Rib • Tar
0~--~--~--~----~--~--~----~--~--~--~ 0 20 40 60 80 100
MGUI Fig. 29. Relation between proportional frequency of elements abandoned on Garnsey Site (%MNI) and modified general utility index (MGUI) (from Binford 1978:74, table 2.7, column 1 ) •
Five skeletal elements in figure· 29 deviate noticeably
from the general trend of the curve; these are the pelvis,
cervicals, humerus, proximal tibia, and distal femur. These
elements were abandoned at the site in frequencies greater
than would be predicted on the basis of their utility values
alone. Pelvises, apparently because of their bulk, were
stripped of meat and discarded in large numbers on the site.

Selective Processing at Garnsey - 91
The treatment of the pelvis will be considered more fully
below.
Figure 29 also shows that higher-than-expected propor
tions of neck and upper forelimb parts were left behind at
Garnsey. Similar discrimination was observed by Binford
(1978:40) in the Nunamiut treatment of caribou. Binford
noted "an anatomical bias against front legs and necks.
These are the parts considered by the Eskimo to be most re
sponsive to nutritional variability and are thus considered
less 'reliable' parts, particularly in spring." A good case
can be made for nutritional stress affecting the Garnsey bi
son, particularly the calving females, in the spring. This
will be addressed more fully below.
The higher-than-expected proportion of proximal tibiae
may also reflect discrimination by the hunters against an
anatomical part of calving females rendered less desirable
by nutritional stress in the spring. The tibia is relative
ly important as a marrow bone (Binford 1978:42-43; Stefans
son 1925:233-34). The composition of the marrow in the
proximal and distal ends is markedly different, however.
The proximal end has a lower total fat content as well as a
markedly lower content of oleic acid, the principal fatty
acid in the marrow fat (Dietz 1946; Irving, Schmidt-Nielsen,
and Abrahamsen 1957; Meng, West, and Irving 1969; West and
Shaw 1975; Binford 1978:42; Turner 1979). The marrow of the
proximal tibia apparently also is less palatable (Binford

Selective Processing at Garnsey - 92
1978:42; Stefansson 1925:233-34~ Wilson 1924:174). As I
will argue more fully below, the marrow-fat content of the
proximal tibia may have been further reduced by nutritional
stress in the spring, particularly in calving females. In
the hind leg, the proximal tibia is one of the elements most
susceptible to depletion of marrow-fat reserves (Harris
1945:320; Ratcliffe 1980:337).
Finally, the higher-than-expected proportion of distal
femurs may also reflect late-spring discrimination against a
nutritionally poor female marrow bone, much as in the case
of the proximal tibia. The composition and response to
stress of marrow in these two elements are similar. Com
parable discrimination against the proximal femur of fe
males, though not evident in figure 29, was also marked at
Garnsey and will become apparent in later discussion.
The importance of general utility in processing deci
sions at Garnsey may be seen in differences in the degree of
breakage of limb bones from the front and hind legs. Figure
30 shows the frequency of complete, mature (fused) limb ele
ments, expressed as a percentage of the total number of
identifiable specimens of that element, plotted against the
MGUI values. Since the utility values of the proximal and
distal portions of an element differ, the higher of the two
values was arbitrarily selected in constructing the figure.
Comparable results are obtained using the lower values. The
relations in figure 30 are clear-cut. First, within each

Selective Processing at Garnsey - 93
limb, front or rear, the proportion of complete elements
abandoned on the site increases as one moves down the limb
(i.e., as one moves toward lower general utility values).
Second, with the exception of the metatarsal, the proportion
of complete elements from the hind limbs is considerably
lower on the site than the proportion of complete elements
from the front limbs, again as predicted by general utility.
It is interesting that B~nford's meat utility index
(1978:23) and marrow index (1978:27), two of the principal
indexes upon which the MGUI is based, are negatively corre
lated, owing particularly to the increase in oleic acid in
the marrow of the lower-limb elements (r = -0.42, limb ele-
ments only; N 13). Figure 30 therefore indirectly shows
that the amount of breakage at Garnsey decreases with in
creasing marrow utility. This implies that much of the ob
served bone breakage may have been the result of butchering
practices rather than on-site marrow processing, unless only
the least-desirable, low-oleic-acid marrow bones were being
broken open for on-site snacking. This conclusion is also
supported by the fact that the marrow index is by far the
poorest predictor of limb-element frequencies at Garnsey, as
shown in table 14.
There is a growing debate in the literature concerning
the extent to which prehistoric hunters removed anatomical
parts from carcasses primarily by cutting elements apart at
points of articulation or instead by chopping directly

Selective Processing at Garnsey - 94
through bones, breaking them up 1n the process (Binford
1981: 142-47; Frison 1970; Lyman 1978; Read 1971:53, 67;
White 1952:338). While the Garnsey data are far from con-
elusive, they do suggest that bone chopping during butcher-
ing may have contributed to the pattern of breakage ob-
served. It should be pointed out, however, that no stone
choppers or hammers were recovered, and very few of the
broken limb bones are convincing tools.
DISCRIMINATION AGAINST FEMALES IN PROCESSING
When the sex of elements abandoned at the Garnsey Site
is taken into consideration, differential treatment of males
and females becomes readily apparent. Figure 31 displays
the relation between %MNI and the MGUI for each male and fe-
male element sexed (position and shape of "regression line"
are approximate). In this figure %MNI is calculated in-
dependently for each sex using eighteen skulls as the basis
for the MNI of males and thirteen atlases as the basis for
the MNI of females. The data used in figure 31 are sum-
marized in table 13.
Both the male and the female curves in the figure have
similar shapes of the "bulk" variety described above. For
both sexes, large numbers of elements of high and intermedi-
ate utility have been removed from the site, and the low-
utility parts have been discarded. That elements of both
sexes tend to form patterned distributions of similar gener-

w 1-w __J
CL
100
~ 50
0 u 'cf2_
Selective Processing at Garnsey - 95
eF
• FUSED o UNFUSED
o~~--~--~~~~--~--~~--~~
0 50 100
MGUI
Fig. 30. Relation between proportional frequency of complete (mature and immature) limb elements (%Complete) and modified general utility index (MGUI) (from Binford 1978:74, table 2.7, column 1).
al configuration lends support to the value of Binford's
caribou indexes for investigating bison. The overall simi-
larity of the male and female curves in figure 31 also indi-
cates that the utilities of various anatomical parts of the
female were ranked in much the same manner as were the male
parts, despite the high degree of sexual dimorphism in bi-
son. This supports the contention made earlier that the
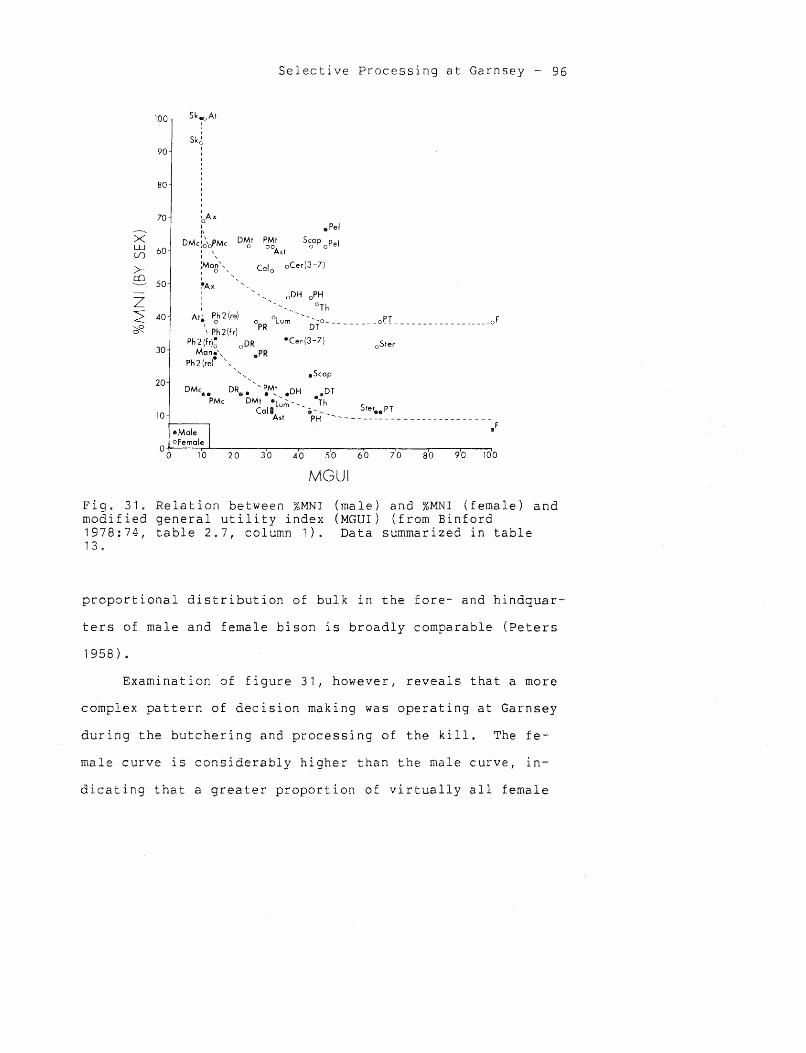
100
90
80
70
60
50
z :2 40
?f2.
30
20
10
00
Selective Processing at Garnsey - 96
Sk 80 At I
I
Sk~ I I
:A)( 0 I II
.Pel
DMc:~'0PMc DMt PMt S~op oPel o ooAst I \
I \
:Man', I 0 '
I
~A)( I I
•Mole ofemole
10 20
Colo oCer(J-7)
.scap
30 40 50 60 70 80 90 100
MGUI
Fig. 31. Relation between %MNI (male) and %MNI (female) and modified general utility index (MGUI) (from Binford 1978:74, table 2.7, column 1). Data summarized in table 1 3 •
proportional distribution of bulk in the fore- and hindquar
ters of male and female bison is broadly comparable (Peters
1958).
Examination of figure 31, however, reveals that a more
complex pattern of decision making was operating at Garnsey
during the butchering and processing of the kill. The fe-
male curve is considerably higher than the male curve, in-
dicating that a greater proportion of virtually all female

~
-N
Tab
le
13
Ob
serv
ed
p
rop
ort
ion
s
of
male
an
d
fem
ale
ele
men
ts,
based
o
n
MN
I esti
mate
s
of
eig
hte
en
b
ull
s
an
d
thir
teen
co
ws
(see
tab
le
11
) %M
NI
(fem
ale
) E
lem
en
t %
MN
I (m
ale
) %
MN
I (f
em
ale
) M
inu
s %
MN
I (m
ale
)
1.
Sk
ull
1
00
.0
92
.3
-7.7
2
. M
an
dib
le
28
.8
53
.8
+2
5.0
3
. A
tlas
38
.9
10
0.0
+
61
. 1
4.
Ax
is
50
.0
69
.2
+1
9.2
5
. C
erv
ical
(3-7
) 3
3.3
5
5.4
+
22
. 1
6.
Th
ora
cic
(
1 '
12
-14
) 1
5.3
4
4.2
+
28
.9
7.
Lu
mb
ar
(1-5
) 1
4.4
4
0.0
+
25
.6
8.
Pelv
is
(rig
ht)
6
6.7
6
1.5
-5
.2
9.
Ste
rnu
m2
11 .
1
30
.8
+1
9.7
1
0.
Scap
ula
2
2.2
6
1.5
+
39
.3
11
. P
rox
imal
hu
meru
s 1
1.
1 4
6.2
+
35
. 1
12
. D
ista
l h
um
eru
s 1
6.7
4
6.2
+
29
.5
13
. P
rox
imal
rad
ius-u
lna
3 2
7.8
3
8.5
+
10
.7
14
. D
ista
l ra
diu
s-u
lna•
16
.7
30
.8
+1
4.
1 1
5.
Pro
xim
al
meta
carp
al
16
.7
61
.5
+4
4.8
1
6.
Dis
tal
meta
carp
al
16
.7
61
.5
+4
4.8
1
7.
Pro
xim
al
fem
ur
5.6
3
8.5
+
32
.9
18
. D
ista
l fe
mu
r 5
.6
38
.5
+3
2.9
1
9.
Pro
xim
al
tib
ia
11 .
1
38
.5
+2
7.4
2
0.
Dis
tal
tib
ia
16
.7
38
.5
+2
1.
8 2
1.
Astr
ag
alu
s
1 1
. 1
61
.5
+5
0.4
2
2.
Calc
an
eu
s
11 .
1
53
.8
+4
2.7
2
3.
Pro
xim
al
meta
tars
al
16
.7
61
.5
+4
4.8
2
4.
Dis
tal
meta
tars
al
16
.7
61
.5
+4
4.8
2
5.
Ph
ala
nx
2
(fro
nt)
3
3.3
3
0.8
-2
.5
26
. P
hala
nx
2
(rear)
27
.8
38
.5
+1
0.
7 -~-
'-------------------
----------
MG
UI'
8.7
4
13
.89
9
.79
9
.79
3
5.7
1
45
.53
3
2.0
5
47
.89
6
4.
13
43
.47
4
3.4
7
36
.52
2
6.6
4
22
.23
1
2.
18
10
.50
1
00
.00
1
00
.00
6
4.7
3
47
.09
3
1.6
6
31
.66
2
9.9
3
23
.93
1
3.7
2
13
.72
-
'MG
UI
(mo
dif
ied
g
en
era
l u
tili
ty
ind
ex
)(fr
om
B
info
rd
19
78
:74
, ta
ble
2
.7,
co
lum
n
1).
2
%M
NI
(male
) an
d
%M
NI
(fem
ale
) v
alu
es
based
o
n
man
ub
riu
m o
nly
. 3
%M
NI
(male
) an
d
%M
NI
(fem
ale
) v
alu
es
based
o
n
pro
xim
al
uln
a
on
ly.
•%M
NI
(male
) an
d
%M
NI
(fem
ale
) v
alu
es
based
o
n d
ista
l ra
diu
s
on
ly.

Selective Processing at Garnsey - 98
parts, regardless of utility, was left behind at the site.
This implies that hunters were much more selective, across
the board, in handling female carcasses. Moreover, while
both male and female parts form distinct curvilinear dis
tributions with respect to the MGUI, the points representing
female parts are more scattered or dispersed with respect to
their regression line than are those for males. This is
brought out more clearly by transforming (linearizing) the
distributions using common logarithms and calculating cor
relation coefficients (table 14). These results suggest
that the proportions of various male anatomical parts re
moved from Garnsey conform more closely to the expectations
of the MGUI than do the proportions of female parts taken
from the site.
One possible explanation for the greater "noise" in the
distribution of female parts is that the data reflect deci
sions concerning two different subsets of animals--calving
and noncalving cows. As I will discuss more fully below,
the butchering decisions at Garnsey appear to have been
closely tied to the animals' nutritional condition, which in
a spring kill would have been poorest in calving females.
Not only were more female than male parts abandoned on
the site, but fewer of the discarded female elements have
been broken in butchering and/or on-site marrow processing.
Considering the same six limb elements shown in figure 30,
only 75.0% of the sexable mature (fused) male elements are

Selective Processing at Garnsey - 99
Table 14
Correlation between utility indexes (Binford 1978) and proportional frequency of male and female skeletal elements at Garnsey Site (frequency data transformed to common logarithms)
Utility Indexes
All elements(24) 1
MGUI Meat Grease Marrow
Limb elements(13) 1
MGUI Meat Grease Marrow
Log 10 %MNI (male) Log 10 %MNI (female)
-0.66 -0.45 -0.50 -0.36 -0.54 -0.29 -0.28 -0. 13
-0.85 -0.47 -0.82 -0.37 -0.58 -0.36
0. 1 5 0. 12
1values in parentheses indicate number of elements used.
complete, whereas 98.5% of the sexable mature female ele-
ments are complete. This difference may to some extent
reflect difficulties in sexing fragmentary female specimens;
but, given the magnitude of the difference in breakage be-
tween the two sexes, these data probably do reflect a real
pattern of discrimination against females ·by the prehistoric
hunters.
The nature of the discrimination against female parts
can be examined more closely from another perspective. Fig-
ure 31 shows that the male and female curves are closest
together at the low end of the utility scale, diverge in the
intermediate range, then remain widely separated, but more

Selective Processing at Garnsey - 100
or less parallel, in the upper utility range. This pattern
indicates that the higher the general utility value of an
anatomical part, the greater the discrimination against the
female part.
This trend is brought out more sharply by subtracting
the %MNI of the male from that of the female for each ele
ment and plotting the difference against the MGUI (table 13;
fig. 32). Most elements appear to conform to a reasonably
tight curvilinear pattern (position and shape of "regression
line" are approximate). The curve rises rapidly at low MGUI
values, indicating that the difference between the %MNI of
females and that of males is increasing (i.e., the discrimi
nation against the female element increases with the general
utility of the element). At intermediate and high MGUI val
ues the curve levels off, and the discrimination ~gainst fe
male parts, while remaining high, becomes more or less con
stant.
These results indicate that, when both male and female
carcasses are present (e.g., bull groups containing adult
females without calves; cow-calf groups containing younger
bulls), the hunters evaluate the utility of an 3natomical
part not only with respect to pther parts in carcasses of
the same sex, but also with respect to the same part in car
casses of the other sex. Age and nutritional state of the
carcasses also enter into the decision process (see discus-
sion below). Ultimately, in an animal as sexually dimorphic
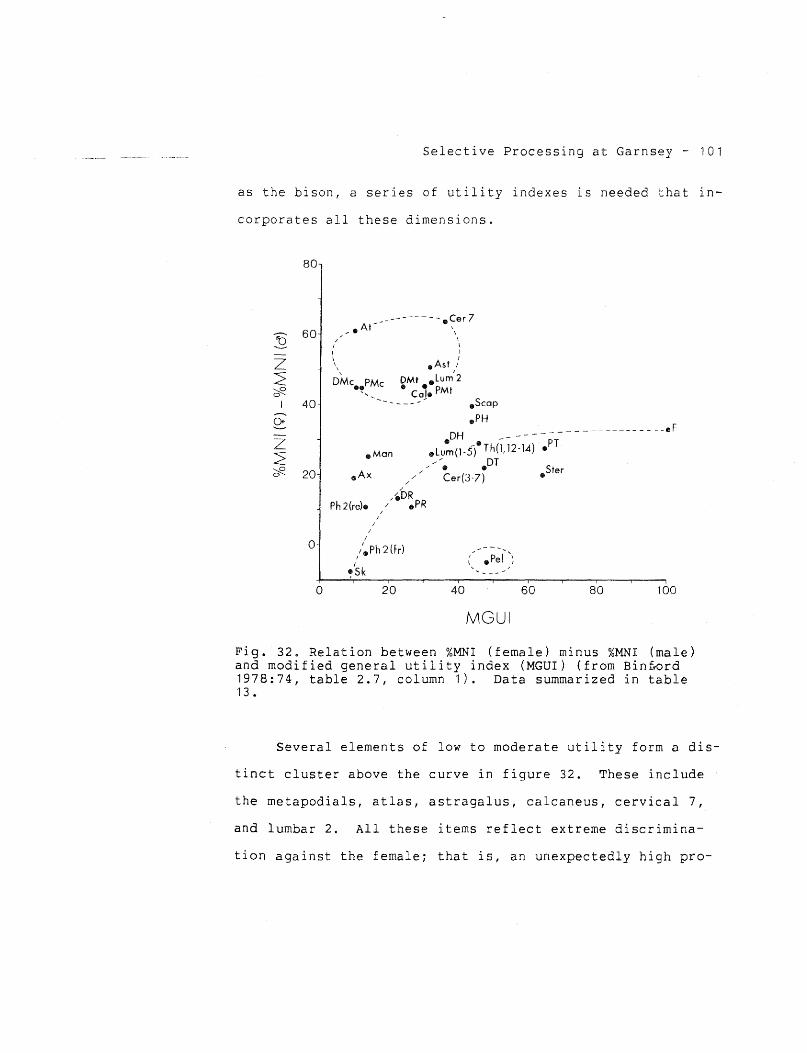
Selective Processing at Garnsey - 101
as the bison, a series of utility indexes is needed that in-
corporates all these dimensions.
80
60
40
20
/
I I
\ \
--- - ---- - Ce r 7 At-- •' -. \
I I I
DMc88
PMc
8 Ast / DMt 8 Lum'2 8 caje PMt '-..
eMan
/
/ /
19Scap
8 PH ______________ --eF
8DH _- ----
eLum(l-stTh(l, 12-14) •PT
/ -. .or Cer(3-7)
.ster
,~DR Ph 2(re)e / ePR
I
I I
I
Ol--~~/-~-P_h_2r(f-r)--~--~------~---,---.----r---,---~--~ ( 0 Pel '~ ~Sk
I I I I I
0 20 40 60 80 100
MGUI
Fig. 32. Relation between %MNI (female) minus %MNI (male) and modified general utility index (MGUI) (from Binf~rd 1978:74, table 2.7, column 1). Data summarized in table 13.
Several elements of low to moderate utility form a dis-
tinct cluster above the curve in figure 32. These include
the metapodials, atlas, astragalus, calcaneus, cervical 7,
and lumbar 2. All these items reflect extreme discrimina-
tion against the female; that is, an unexpectedly high pro-

Selective Processing at Garnsey - 102
portion of these elements left behind at the site were fe-
male. A single element, the pelvis, falls well below the
curve. In this case virtually no discrimination by sex was
made; male and female alike were dumped on the site. These
elements deserve further comment. The limb elements will be
considered first (metapodials, astragalus, and calcaneus),
followed by a discussion of the axial elements (atlas, cer-
vical 7, lumbar 2, and pelvis).
FAT DEPLETION IN FEMALES UNDER STRESS
I suggest here that the unexpectedly high degree of
discrimination against female metacarpals and metatarsals
reflects the poor nutritional state of females at the time
of the kill (spring calving season). The metapodials are
particularly important as marrow bones. They produce rela-
tively little meat, but they have large marrow-cavity vol-
umes and, under normal conditions, high fat content
(cf. Binford 1978:23). Marrow from the metapodials has a
considerably higher total fat content than marrow from the
upper portions of the limbs (Dietz 1946). Moreover, the fat
in the lower part of the limbs differs in composition from
that in the upper part. Marrow fat in the metapodials and
phalanges is composed largely of oleic acid, an unsaturated
fatty acid with a low melting point (Irving, Schmidt-
Nielsen, and Abrahamsen 1957; Meng, West, and Irving 1969;
West and Shaw 1975; Binford 1978:23-25~ Turner 1979). The

Selective Processing at Garnsey - 103
proportion of low-melting-point fat decreases as one moves
up the limbs, reaching its lowest values in the proximal
humerus and proximal femur. The sharpest decline occurs in
the proximal radius and proximal tibia. Normally the fat in
the metapodials and phalanges is fluid, while that in the
proximal radius, proximal tibia, femur, and humerus is
solid.
There is limited ethnographic documentation that marrow
from the metapodials is more palatable than marrow from
higher up in the limbs, owing to its higher total fat con
tent and perhaps to its higher proportion of oleic acid
{Stefansson 1925:233-34; Binford 1978:23-25; Weltfish 1965:
218-19; Wilson 1924: 174).
When an animal suffers from malnutrition, fat reserves
stored in various parts of the body are mobilized. In many
animals there appears to be a relatively consistent sequence
of fat mobilization, beginning with the back fat, followed
by abdominal and kidney fat, and finally marrow fat (Harris
1945; Riney 1955; Ransom 1965; Sinclair and Duncan 1972;
Pond 1978) e
Within the marrow bones themselves, depletion begins at
the proximal end of the limbs and moves toward the feet
(Ratcliffe 1980:337; Brooks, Hanks, and Ludbrook 1977). The
marrow fat from the upper front leg (humerus and radius) ap
pears to be somewhat more susceptible to depletion than that
from the upper part of the rear limb (femur and tibia). The

Selective Processing at Garnsey ~ 104
differences are greatest between the radius and the tibia.
On the other hand, the metatarsal fat appears to be slightly
more vulnerable to loss than the metacarpal fat (data based
on roe deer; Ratcliffe 1980).
Since the marrow fat is the last reserve to be deplet~
ed, reduced marrow-fat content and lowered proportions of
oleic acid are most likely to occur, if at all, in the
spring (see Turner 1979:602; Newlin and McCay 1948; Warren
1979; Warren and Kirkpatrick 1978; Franzmann and Arneson
1976:339). Fat reserves are replaced in more or less the
reverse order, beginning with the marrow (Riney 1955).
There are very few studies comparing patterns of vari
ability in the nutritional condition of male and female bi
son at different seasons, and none to my knowledge concern~
ing fat reserves in the bone marrow. To gain some idea of
the probable general condition of male and female bison, and
in particular their marrow, at various times of year, we
must draw on studies of other animals. Certain aspects of
bison condition are sufficiently well documented to provide
useful reference points in such comparisons: (1) male bison
are in best overall condition in the late spring-early sum
mer and in poorest condition during and after the rut; (2)
females are in poorest condition during the calving season
and in best condition in the fall and early winter (Ewers
1958:76; Wissler 1910:41; Point 1967:120, 166; Grinnell

Selective Processing at Garnsey - 105
1972:269; Earl of Southesk 1969:80; Coues 1897:577; Roe
1972:860-61; Lott 1979:429).
These limited observations indicate that seasonal
changes in bison condition parallel reasonably well the
changes described in many other animals. Thus the following
general pattern may be suggested for bison (Allen 1979;
Anderson et al. 1972; Nordan, Cowan, and Wood 1968; Peterson
1977; Pond 1978; Riney 1955; Sinclair and Duncan 1972; Bin
ford 1978:40)~ After a low point in late winter-early
spring, male condition improves rapidly during late spring
early summer, as the animals build up fat reserves toward a
peak at the onset of the summer rut. Male condition de
clines sharply during and after the rut (Lott 1979; Nordan,
Cowan, and Wood 1968). Lott (1979:429), for example, notes
that bison males may lose up to 10% of their normal body
weight. Losses may be sufficient to cause mobilization of
marrow fat (Brooks 1978). During late fall-early winter,
male condition may again improve somewhat, but males often
enter winter in comparatively poor condition. If there are
nutritional shortages during the winter, body-fat reserves
begin to be depleted, and overall condition declines through
late winter into spring. With the growth of new spring
forage, male condition improves rapidly, beginning a new an-
nual cycle.
Female condition varies throughout the year in a manner
broadly paralleling that of the male, but with several im-
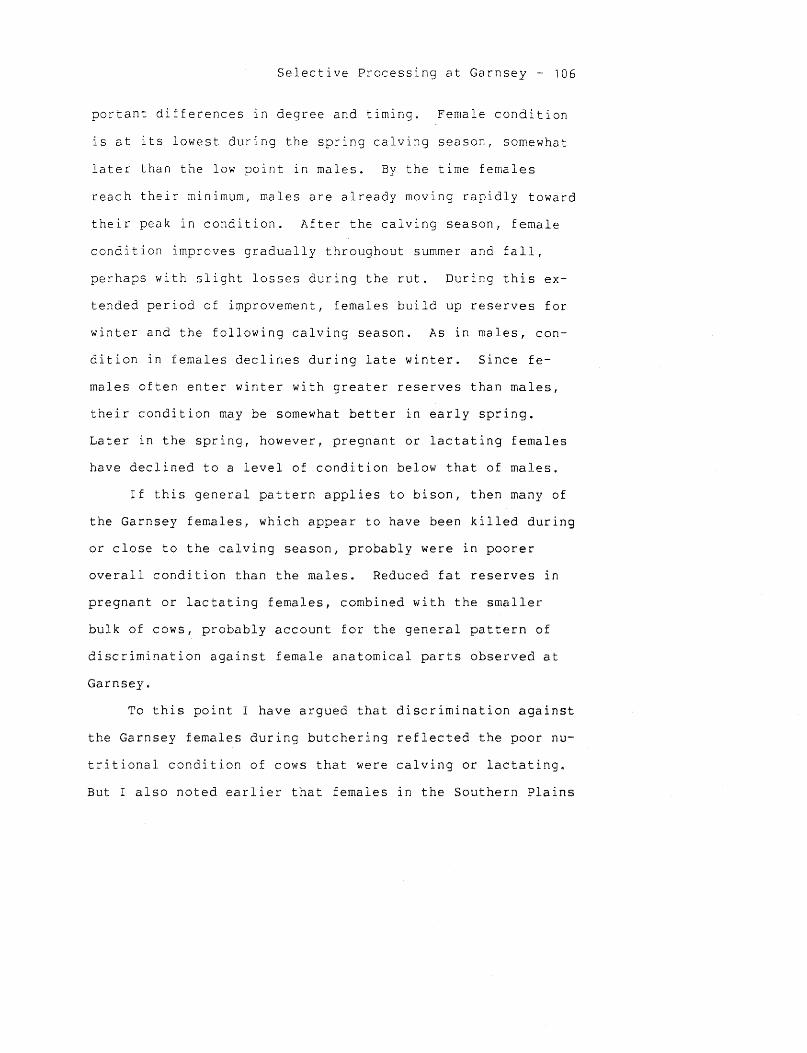
Selective Processing at Garnsey - 106
portant differences in degree and timing. Female condition
is at its lowest during the spring calving season, somewhat
later than the low point in males. By the time females
reach their minimum, males are already moving rapidly toward
their peak in condition. After the calving season, female
condition improves gradually throughout summer and fall,
perhaps with slight losses during the rut. During this ex
tended period of i~provement, females build up reserves for
winter and the following calving season. As in males, con
dition in females declines during late winter. Since fe
males often enter winter with greater reserves than males,
their condition may be somewhat better in early spring.
Later in the spring, however, pregnant or lactating females
have declined to a level of condition below that of males.
If this general pattern applies to bison, then many of
the Garnsey females, which appear to have been killed during
or close to the calving season, probably were in poorer
overall condition than the males. Reduced fat reserves in
pregnant or lactating females, combined with the smaller
bulk of cows, probably account for the general pattern of
discrirni~ation against female anatomical parts observed at
Garnsey.
To this point I have argued that discrimination against
the Garnsey females during butchering reflected the poor nu
tritional condition of cows that were calving or lactating.
But I also noted earlier that females in the Southern Plains
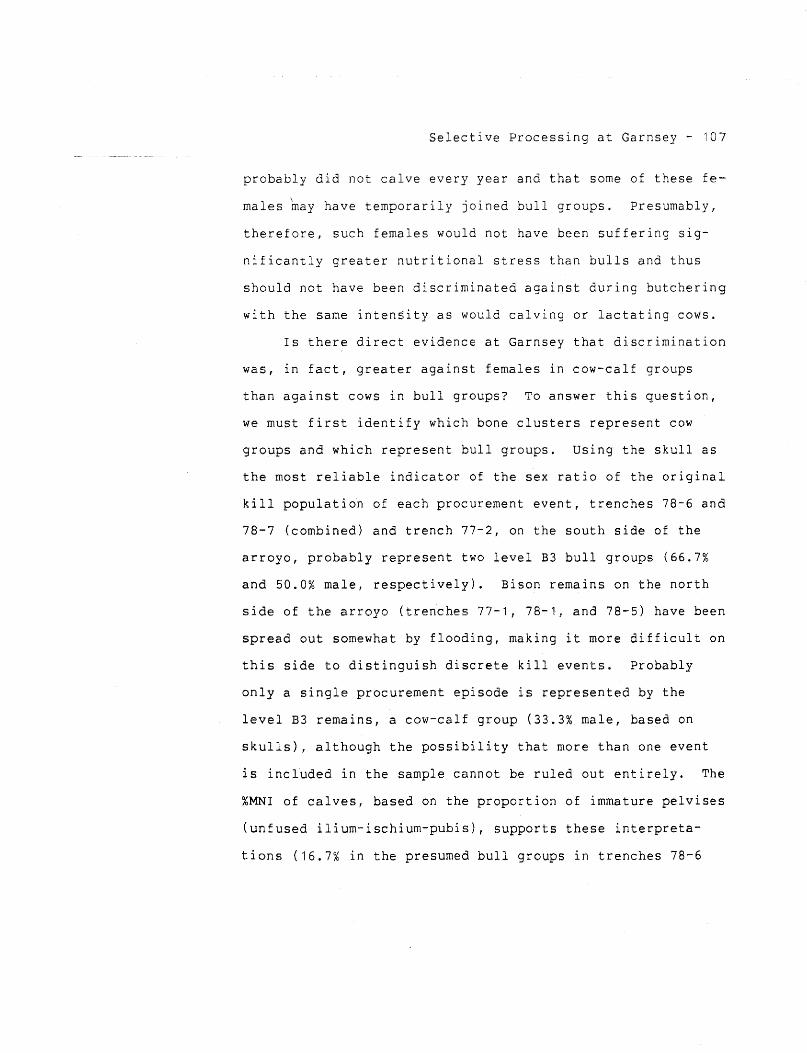
Selective Processing at Garnsey - 107
probably did not calve every year and that some of these fe
males may have temporarily joined bull groups. Presumably,
therefore, such females would not have been suffering sig
nificantly greater nutritional stress than bulls and thus
should not have been discriminated against during butchering
with the same intensity as would calving or lactating cows.
Is there direct evidence at Garnsey that discrimination
was, in fact, greater against females in cow-calf groups
than against cows in bull groups? To answer this question,
we must first identify which bone clusters represent cow
groups and which represent bull groups. Using the skull as
the most reliable indicator of the sex ratio of the original
kill populatiori of each procurement event, trenches 78-6 and
78-7 (combined) and trench 77-2, on the south side of the
arroyo, probably represent two level B3 bull groups (66.7%
and 50.0% male, respectively). Bison remains on the north
side of the arroyo (trenches 77-1, 78-1, and 78-5) have been
spread out somewhat by flooding, making it more difficult on
this side to distinguish discrete kill events. Probably
only a single procurement episode is represented by the
level B3 remains, a cow-calf group (33.3% male, based on
skulls), although the possibility that more than one event
is included in the sample cannot be ruled out entirely. The
%MNI of calves, based on the proportion of immature pelvises
(unfused ilium-ischium-pubis), supports these interpreta
tions (16.7% in the presumed bull groups in trenches 78-6

Selective Processing at Garnsey - 108
and 78-7 and in trench 77-2; 40.0% in the presumed cow-calf
group[s] in trenches 77-1, 78-1, and 78-5).
Figure 33 shows the proportion of discarded mature fe
male metapodials in the two bull groups and in the cow-calf
group(s). The figure strongly supports the argument that
discrimination was focused primarily against calving or lac
tating cows, not against females in general. Discrimination
was strongest against the metatarsal, which, as noted earli
er, is somewhat more vulnerable than the metacarpal to loss
of fat (Ratcliffe 1980).
The unexpectedly high degree of discrimination dis
played in figures 32 and 33 against two important female
marrow bones at Garnsey suggests that environmental condi
tions during the winter and spring months immediately pre
ceding the kills had been severe enough to cause the deple
tion of other major body-fat reserves in pregnant or lactat
ing members of cow-calf groups. Discrimination against the
marrow bones may also indicate that preceding summer and
fall pasture conditions had been poor, preventing pregnant
or lactating females from building up adequate reserves of
fat to make it through the winter and spring without signif
icant loss of marrow fat (Nordan, Cowan, and Wood 1968). I
assume, on the basis of the arguments presented above, that
males, which presumably had also been subject to winter and
early-spring nutritional stress, had rebounded by the spring

Selective Processing at Garnsey - 109
100 TR. r100 ~ 77-1 I s; 78-1 I 0:::
I.U
78-5 I
J ::..::
TR. "" ;;r:: I lJ.J 0...
0
TR. I "" w 0
78-6 I 8 a.. 0 0
~ 78- 7 I "" 50 rso < 8 j u
"' 0 I 0 "" < -o I ·:; c
~ 0 "
., "
0...
0 0 ,......... a E -o ()t-
a. ~ " a
- 0 c:
z ~ - :::>
~ z ~
?fi
* 0 0
0 50 100 PROPORTION OF ADULT FEMALES IN ORIGINAL
KILL POPULATIONS (Based an Skulls)
Fig. 33. Relation between oronortion of adult females in original kill population of three level B3 procurement episodes (trenches 78-6 and 78-7; 77-2; 77-1, 78-1, and 78-5) and proportional frequency of discarded female metapodials at Garnsey Site (%MNI female); figure also shows relation between proportion of adult females in original kill population of same three procurement episodes and proportional frequency of discarded immature pelvises (%MNI; unfused ilium-ischium-pubis).
calving season to the point where their overall condition
was better than that of many of the females.
The high degree of discrimination evident in figure 32
against female astragali and calcanei (and perhaps against
othe~ tarsals and carpals as well) probably is linked di-
rectly to the treatment of the metapodials. The discarded
rnetapodials were removed intact from the limbs, either by

Selective Processing at Garnsey- 110
chopping through the tibiae and radii or more commonly by
cutting through the joints; the astragali and calcanei were
removed and discarded as riders in the same process.
The unexpectedly high selectivity against the atlas,
seventh cervical, and second lumbar of female bison and the-
apparent lack of discrimination against the pelvis (fig.
32) are best understood by comparing the treatment of these /
elements with the handling of other parts of the axial skel-
eton. To accomplish this, all the vertebral elements except
thoracics 2-11 and caudals were identified and sexed. The
results are summarized in table 11 above. Criteria for
sexing the various axial elements are summarized in table
12. Thoracics 2-11 and caudals could not be distinguished
reliably and therefore were excluded from the analysis.
Figure 34b presents the results graphically, expressed as
the percentage that male parts constitute of the total num-
ber of sexed specimens for each element.
If we assume, as I argued earlier, that the sex ratio
of the original kill population is accurately reflected by
the skulls, then the distortion of this ratio at different
points along the axial skeleton owing to selective process
ing is clearly visible. If one ignores, for the moment, the
sharp downswings at the atlas, seventh cervical, and second
lumbar, there is a steady decrease in the proportion of male
parts left at the site as one moves from the skull toward
the rear of the ribcage. Beginning with the first lumbar
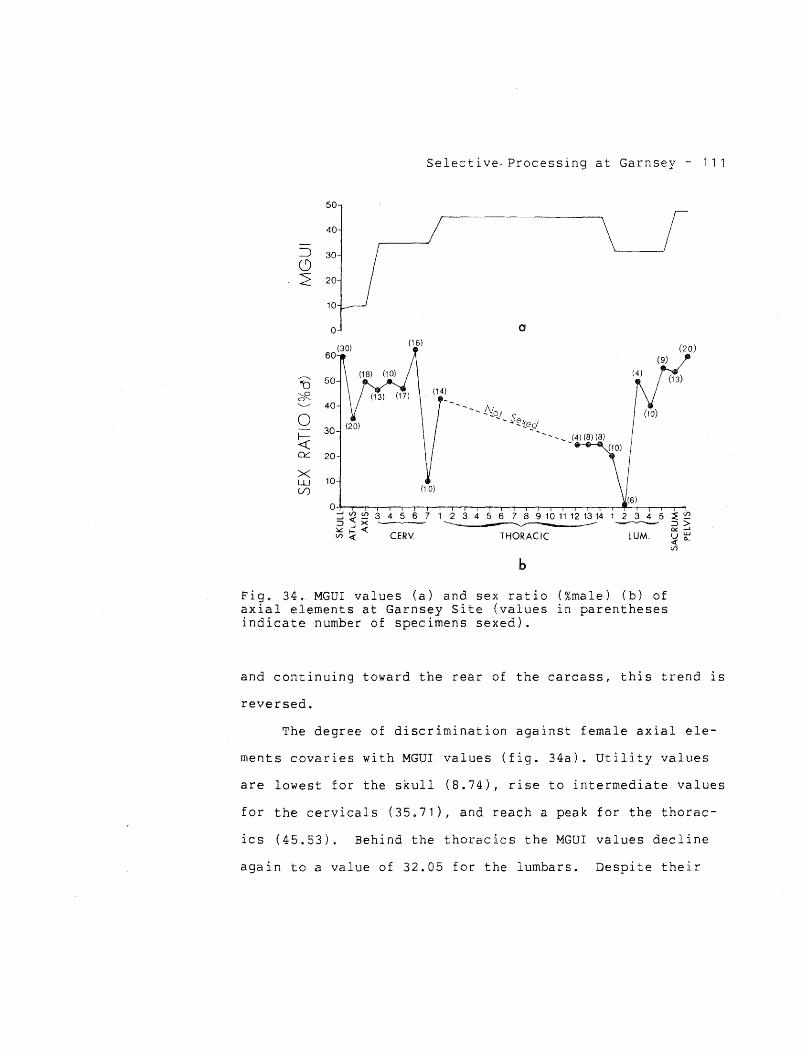
Selective-Processing at Garnsey- 111
50
40
::::J 30
0 ~ 20
,:r a
(16)
(9)
~ 50
'2f2_ "-._../ 40 ---- -N.oJ 0 -5f]_1..ed
~ 30 -- -- -- _(4) (8) (8)
(10) 0::::: 20
X w 10 U) (1 0)
0 ~ ~ ~ 3 4 5 6 7 1 2 3 4 5 6 7 8 9 10 11 12 13 14 1 2 3 4 5 ::;>_,X ~ -------:">.:::!-..:{ Vl<( CERV. THORACIC LUM.
b
Fig. 34. MGUI values (a) and sex ratio (%male) {b) of axial elements at Garnsey Site (values in parentheses indicate number of specimens sexed).
(20)
~~ ::::>> ~ -' uw <1"0.... <./)
and continuing toward the rear of the carcass, this trend is
reversed.
The degree of discrimination against female axial ele-
ments covaries with MGUI values (fig. 34a). Utility values
are lowest for the skull (8.74), rise to intermediate values
for the cervicals (35.71), and reach a peak for the thorac-
ics (45.53). Behind the thoracics the MGUI values decline
again to a value of 32.05 for the lumbars. Despite their

Selective Processing at Garnsey- 112
high utility value (47.89), the pelvises at Garnsey display
no discrimination against females. Moreover, pelvises were
discarded in substantial quantities at the site (nearly 70%
of that expected). The pelvises were broken apart and
stripped of meat on the site rather than being removed as
compo~ents of larger butchering units for processing else
where.
The anomalous sharp downswings in figure 34b at the at
las, and especially at the seventh cervical and second lum
bar, are curious, and I can offer only a tentative explana
tion. There is no apparent reason in terms of utility val
ues to expect such strong selectivity by the hunters for
these particular male elements. A more plausible explana
tion is that the downswings denote consistent points where
the male vertebral column was chopped through to divide the
carcass into transportable units. If so, at least one ad
ditional point probably existed within the long thoracic
series. If males were preferentially butchered, and if ver
tebral units were consistently separated at the same points,
it is plausible that many more male than female atlases,
seventh cervicals, and second lumbars were destroyed. It is
interesting in this regard that the downswings become more
pronounced as one moves from the front of the carcass toward
the rear, paralleling the trend toward increasing MGUI val
ues. Unfortunately, it has not been possible to verify this
explanation for the downswings in figure 34b. Although

Selective Processing at Garnsey- 113
there are many fragmentary vertebral bodies that clearly
have been chopped into or through by some sort of heavy cut-
ting tool, none can be reliably identified to specific ele-
ment, and none can be sexed.
Following the same logic, the upswings 1n figure 34b at
the sixth cervical and third lumbar may represent consistent
points in female carcasses where the spinal column was
chopped through, destroying many of the female vertebrae in
the process and elevating the proportional representation of
male elements. It is interesting that the female butchering
units so divided would have been longer than their male
counterparts, but since the female carcass is smaller, they
may have been similar to male units in total weight. These
differences in the handling of male and female vertebral
columns may reflect an attempt to maintain butchering units
of broadly comparable bulk (I am grateful to Susan L. Scott
for drawing my attention to the possible significance of the
upswings in fig. 34b).
DISCRIMINATION AGAINST IMMATURE ANIMALS IN PROCESSING
Up to this point I have focused on selective processing
stemming from two principal sources: (1) gross differences
in the bulk of adult bulls and cows; and (2) seasonal dif-
ferences in the relative nutritional state of adult bulls
and cows. Two other important sources of selectivity should
be considered: (1) differences in gross bulk and condition
Selective Processing at Garnsey- 114
between animals of the same sex at different ages; and (2)
changes in the ratio of male to female bulk at different
ages.
The degree of within- and between-sex discrimination at
different ages is particularly difficult to investigate.
First, postcranial remains can be assigned only to one of
two very broad age categories (fused versus unfused or fus
ing). Moreover, the age of fusion differs from one element
to another. Second, most unfused specimens, except for a
few obvious male parts, cannot be sexed. The only direct
way that was found to investigate the role of age in pro
cessing decisions at Garnsey was to examine the proportion
of complete unfused bones expressed as a percentage of all
complete and fragmentary unfused specimens (with or without
unfused epiphyses; only proximal fragments considered). The
results are displayed graphically in figure 30 above.
Figure 30 reveals two interesting aspects of the han
dling of younger animals. First, the proportion of complete
unfused elements is considerably higher than that of com
plete fused elements. This suggests that younger animals
were subjected to less intensive butchering and/or o~-site
marrow processing than adults. Second, the proportion of
intact immature front-limb elements is greater than the pro
portion of intact rear-limb parts. This indicates that, as
in adult animals, there was more discrimination against the
front quarters than against the rear quarters. But the dif-

Selective Processing at Garnsey- 115
terence between front- and rear-limb values is much smaller
among immature animals than among adults, suggesting that
the Garnsey hunters made much less distinction between the
front and rear legs of younger animals. Unfortunately, the
immature elements cannot be examined by discrete age groups.
It is expected that the older the animal, the greater the
discrimination against front-limb elements, approaching the
values seen in adults.
Two major factors probably contribute to the pattern of
discrimination against younger animals during processing.
The first, and most obvious, is the smaller size of immature
bison. If hunters were operating under transport or time
constraints, calves and yearlings may have been bypassed in
favor of larger animals.
The second factor that may have favored discrimination
against immature animals is their lower overall levels of
subcutaneous, intermuscular, intramuscular, and marrow fat.
No data are available for fat levels in bison of different
ages, but several studies of cattle provide useful compara
tive information. For example, the percentage of total car
cass fat in cattle increases markedly with age (Allen et
al. 1976; Link et al. 1970a,b 1 c; Link et al. 1970; Hunsley
et al. 1971). In addition, the proportion of fat in marrow
bones from both the axial and the appendicular skeletons of
cattle is substantially higher in older animals. For ex
ample, fat levels in the red or hemopoietic marrow of the

Selective Processing at Garnsey- 116
~
~ if) 20 if)
<( 1.9
u 1.8 ~
<( u 1.7
0 1.6 w if) 1.5 U) w 1.4 ~
0 1.3
()t-.. 1.2 'b
0 1.1
~ 1.0
0::::: 0.9 l[) ~ ~ ~ ~ l[) ~ l[) l[) l[) l[) ~ l[) l() L() l()
c:i .,.... C\J (") "<t l[) c.o ,.._..: a:i (j) 0 C\J (") '<i l()
AGE Fig. 35. Proportion of male to female dressed carcass weight in modern Southern Plains bison (data from Halloran 1961).
cervical vertebrae increased from 5.3% in calves to 14.8% in
utility-grade cows to 30.8% in good-grade young bulls (Field
et al. 1978: Field et al. 1980; Arasu et al. 1981). The fat
content in the lumbar vertebrae also increased with age,
more rapidly than in the cervicals, reaching considerably
higher levels in mature animals (Field et al. 1980~ Arasu et
al .. 1981; see also Kunsman et al. 1981). Finally, the
marrow-fat content of the femur in cattle increased from be-

Selective Processing at Garnsey- 117
tween 33.7% and 47.7% in calves to levels exceeding 85% to
90% in adults (Field 1976; Kunsman et al. 1981; see also
Dietz 1949; Franzmann and Arneson 1976).
Discrimination directed specifically against females
can be expected to increase with increasing age. Data pro
vided by Halloran (1961; see also Novakowski 1965) for mod
ern Southern Plains bison indicate that the ratio of male to
female dressed carcass weight increases sharply from the
ages of about 2.5 to 7.5 years, after which it levels off
(the adult dressing percentage in both sexes is almost iden~
tical at 54%)o Halloran's data are graphed in figure 35.
Unfortunately, no way was found to investigate this expecta
tion in the Garnsey sample.

6. Southern Plains Bison in the Fifteenth Century
INTRODUCTION
The selective processing of bison at Garnsey, particu-
larly the discarding of unusually high proportions of impor-
tant marrow bones from pregnant or lactating cows, very
likely reflects the stressful conditions of spring in the
Southern Plains, when the biomass and quality of available
forage were at a minimum. The severity of the food problem
confronting bison overwintering in the region can be illus-
trated more clearly by examining the nutritional value of
the major forage species.
AVAILABLE FORAGE SPECIES IN THE SOUTHERN PLAINS
Bison are grazers whose diet consists almost entirely
of grasses and some sedges (cf. Peden 1972). Forbs and
shrubs form only a minor component, generally less than 10%
by dry weight. Two of the most important forage species in
the Southern Plains are blue grama (Bouteloua gracilis) and
buffalo grass (Buchloe dactyloides). In the more xeric por-
If§

Southern Plains Bison in the Fifteenth Century - 119
tions of southeastern New Mexico, these grasses decline in
importance, and black grama (Bouteloua eriopoda) and tobosa
(Hilaria mutica) become the dominant species. Other impor-
tant grasses over much of the region include side oats grama
and hairy grama (Bouteloua curtipendula and B. hirsuta), big
and little bluestem (Andropog~ gerardi and A. scoparius),
sand dropseed (Sporobolus cryptandrus), alkali sacaton
(Sporobolus airoides), bush and ring muhly (Muhlenbergia
porteri and ~· torreyi), various species of three-awn (Aris-
tida spp. ), needle and thread (~tipa comata), and New Mexico
feather grass (Stipa neomexicana)(Bureau of Land Management
1979; Castetter 1956; Gay and Dwyer 1970; Paulsen and Ares
1962; Peden 1972; Van Dyne 1973, 1975; Shelford 1963; Kuch
ler 1964).
MAINTENANCE REQUIREMENTS OF CRUDE PROTEIN AND PHOSPHORUS
Neumann and Snapp (1969), Sinclair (1974d), and Peden
(1972) provide useful discussions of the principal aspects
of forage quality that affect nutrition in large ruminants
such as cattle, the African buffalo (Syncerus caffer), and
the American bison. These animals require a certain rate of
protein assimilation in order to remain above the level of
minimum maintenance (i.e., not to lose weight). This rate
is dependent on the time it takes forage to pass through the
rumen, which in turn is conditioned by the size of food par-
ticles (Hungate 1975:39). The mastication necessary tore-

Southern Plains Bison in the Fifteenth Century - 120
duce grasses to small enough particles increases with the
fiber content of the forage (Hungate 1975; Sinclair 1974d:
292). Moreover, the total crude protein content of high
fiber forages generally is low. Ruminants cannot compensate
to any major extent for low protein levels in forage by in
creasing their total intake, because they are limited by the
rate at which the food can be masticated. Moreover, at low
levels of forage protein microbial action in the rumen is
inhibited (Hungate 1975), further reducing the rate of pro
tein assimilation.
Sinclair (1974d:295) indicates that, at crude protein
levels below about 2.8%, forage digestibility drops to zero.
Minimum maintenance levels of crude protein in cattle, Afri
can buffalo, bison, and other large ruminants generally fall
between about 4% and 8%. Peden (1972:90) selects a value of
7% for cattle but notes that the minimum in bison is proba
bly lower (i.e., bison can subsist on poorer forage than
cattle without losing weight). Sinclair (1974d:295) uses a
value of 5% for the African buffalo, a close relative of the
bison; his figure will be used here. The requirements for
pregnant and lactating females are about 10% higher (Neumann
and Snapp 1969:182).
Minimum maintenance requirements of phosphorus, another
critical nutrient for ruminants, have not been established
for bison. Cattle require about 0.15% (Neumann and Snapp

Southern Plains Bison in the Fifteenth Century - 121
1969:182). This figure will be used in subsequent discus-
sion.
PRESENT-DAY FORAGE QUALITY IN THE SOUTHERN PLAINS
The crude protein and phosphorus contents, expressed as
percentage of total dry matter, of the principal grass spe-
cies in the Southern Plains are summarized in· table 15. Av-
erage protein and phosphorus values, determined for each
major phenological or growth stage (e.g., immature, early
bloom, mature), are presented in table 16 and plotted in
figure 36 against the average monthly precipitation recorded
in Roswell for 1931-60 (Pieper et al. 1978; Houghton 1974).
Also shown in the figure are the approximate timing in the
Southern Plains of the rut (Halloran and Glass 1959:369) and
the calving season (Halloran 1968; Halloran and Glass 1959),
and the normal duration of lactation in bison (McHugh 1958:
34).
It is clear from figure 36 that bison in the Southern
Plains would have been operating at or below maintenance
levels through most of the winter and spring. Average crude
protein levels drop below 5% by November and remain at sub-
maintenance values until about May. Protein values of blue
grama, the most important forage species in the region, drop
to about 3.3% in the winter and early spring, only a few
tenths of a percent above the theoretical zero-digestibility
level (Pieper et al. 1978:22~ Sinclair 1974d: 295).

Southern Plains Bison in the Fifteenth Century - 122
</)
::> 0 .3
J:~ e;a'?.2 0~
t .1
MIN. MAINT. REQ.(5%) -----------------------------
MIN MAINT. REO. (0.15%)
1>------------4'
0+-~--~~--~~--~~--~~~~~
J M A M
t t J J
t + A S 0 N
• END + D
CALVING RUT LACTATION
Fig. 36. Seasonal changes in average crude protein and phosphorus levels of major Southern Plains grasses in relation to minimum maintenance requirements of bison (seasonal fluctuations in local precipitation also shown).
Under actual grazing conditions, protein shortages may
have been more acute than these data indicate. The crude
protein values summarized in table 16 are averages for whole
plants (aerial parts). But protein is not uniformly dis
tributed throughout the plant; instead, the highest levels
are found in the leaves (Sinclair 1974d). Thus, once new
growth ceases after the summer rains and the grasses enter
their dormant phase, the first parts to be grazed off by

tJ w
Tab
le
15
Cru
de p
ro
tein
an
d
ph
osp
ho
rus
lev
els
(%
) o
f m
ajo
r S
ou
thern
P
lain
s
gra
ss
sp
ecie
s at
dif
feren
t sta
ges
of
gro
wth
Gro
wth
G
rass
1 S
easo
n1
Sta
ge
Blu
este
m,
big
W
arm
I
Imm
atu
re
(An
dro
po
go
n g
erard
i)
I E
arl
y
blo
om
! M
idb
loo
m
Fu
ll
blo
om
M
atu
re
Ov
err
ipe
Do
rman
t
Blu
este
m,
1 itt 1
e W
arm
Im
matu
re
(An
dro
po
go
n
sco
pari
us)
Earl
y
blo
om
M
idb
loo
m
Fu
ll
blo
om
M
atu
re
Ov
err
ipe
Do
rman
t
Blu
este
m,
san
d
War
m
Imm
atu
re
(An
dro
po
go
n h
all
ii)
Earl
y
blo
om
M
idb
loo
m
Fu
ll
blo
om
M
atu
re
Ov
err
ipe
Do
rman
t
Blu
este
m,
sil
ver
War
m
Imm
atu
re
(An
dro
po
go
n
sacch
aro
ides)
Earl
y
blo
om
M
idb
loo
m
Fu
ll
blo
om
M
atu
re
Ov
err
ipe
Do
rman
t
Bris
tle g
rass,
pla
ins
War
m
Imm
atu
re
(S
eta
ria
m
acro
sta
ch
ya)
Earl
y
blo
om
M
idb
loo
m
Fu
ll
blo
om
M
atu
re
Ov
err
ipe
Do
rman
t
Cru
de
Pro
tein
' Phosp~1orus'
(%)
(%)
15
.6
0.2
1
10
.1
0.
17
---
----
6.6
0
. 1
0
4.9
--
--2
.9
0.1
1
2.4
6 0
.04
'
12
.o•
o.
13
1
6.0
o
. 11
7
.2
----
10
.04
0.0
9
8.4
4 0
.08
---
0.0
7
5.o
• 0
. 1 t.
11
.5
----
---
----
---
0.
20
5
.2
0.1
1
3.7
0
.11
2
.0
0.0
4
---
----
11
.8
0.2
2
---
----
6.6
o
. 17
5
.7
0.
12
3.5
0
.08
--
---
--2
. 5
1 0
--
--
---
----
17
.5
0.
23
1
0.3
0
. 2
0
---
----
---
----
---
----
---
----

Tab
le
15
(co
nt.
)
-·--~----
--
Gro
wth
C
rud
e
Pro
tein
' P
t1o
sph
oru
s'
Gra
ss'
Seaso
n2
Sta
ge
(%)
(%)
Bu
ffalo
g
rass
War
m
Imm
atu
re
6.9
4 0
.23
(B
uch
loe
dacty
loid
es)
Earl
y
blo
om
1
0.6
----
Mid
blo
om
---
----
Fu
ll
blo
om
9
.8
----
Matu
re
5.9
----
Ov
err
ipe
---
0.1
6
Do
rman
t 5
.74
----
Bu
rro
g
rass
War
m
Imm
atu
re
---
----
(Scle
rop
og
on
b
rev
ifo
l iu
s)
Earl
y
blo
om
--
-----
Mid
blo
om
---
----
Fu
ll
blo
om
--
---
--M
atu
re
---
----
Ov
err
ipe
---
----
Do
rman
t ---
----
Or-
op
seed
, m
esa
W
arm
Im
matu
re
---
----
(Sp
oro
bo
lus
flex
uo
su
s)
Earl
y
blo
om
1
7.5
--
--M
idb
loo
m
8.9
0
. 1
7
Fu
ll
blo
om
1
0.8
0
. 15
M
atu
re
7.6
o
. 1
2
Ov
err
ipe
4.5
0
.06
D
orm
an
t <
4.8
9 ----
Dro
pseed
, sa
nd
W
arm
Im
matu
re
11
.8 4
5 0
.28
"
(Sp
oro
bo
lus
cry
pta
nd
rus)
Earl
y
blo
om
1
2.2
0
. 1
4
--M
idb
loo
m
---
----
N
Fu
ll
blo
om
7
.34
----
-f:
Matu
re
5.7
0
. 1
3
Ov
er'
r i p
e
5.8
0
.07
D
orm
an
t 4
.55
0.0
6
Gra
ma,
bla
ck
W
arm
Im
matu
re
11
.5
0.
16
(B
ou
telo
ua
eri
op
od
a)
Earl
y
blo
om
9
.3
0.
16
M
idb
loo
m
---
----
Fu
ll
blo
om
--
-----
Matu
re
6.4
0
.11
O
verr
ipe
5.2
0
.06
D
orm
an
t <
4.9
4 9
----

Tab
le
15
(c
on
t.)
I ~rowth
Cru
de
Pro
tein
' P
ho
sph
oru
s'
Gra
ss•
Seaso
n1
tag
e
(%)
(%)
Gra
ma.
b
lue
I W
arm
I Im
mat
ure
1
1.5
0
. 16
(B
ou
telo
ua g
racil
is)
Earl
y
blo
om
1
1.3
M
idb
loo
m
Fu
ll
blo
om
M
atu
re
7.9
O
verr
ipe
---
0.0
7
Do
rman
t 3
.35
a 0
.08
5
Gra
ma,
h
air
y
I W
arm
I Im
mat
ure
--
-0
. 1
4
(Bo
ute
lou
a
hir
su
ta)
Earl
y
blo
om
M
idb
loo
m
Fu
ll
blo
om
M
atu
re
I 5
.6
I 0
.08
}J
Overt~ i
pe
V, ~
Do
rman
t
Gra
ma,
sid
e o
ats
War~m
Imm
atu
re
I 1
1.6
I
0.
18
(Bo
ute
lou
a
cu
rtip
en
du
la)
Earl
y
blo
om
M
idb
loo
m
8.4
o
. 1
2
Fu
ll
blo
om
7
. 1
o.
10
M
atu
re
4.7
0
.08
O
verr
ipe
3.0
0
.07
D
orm
ant
2.5
4 5
0.0
7
Mu
hly
, b
usl
l I
War
m
I Imm
atu
re
(Mu
hle
nb
erg
ia p
ort
eri
) E
arl
y
blo
om
M
idb
loo
m
Fu
ll
blo
om
M
atu
re
Ov
err
ipe
7.3
0
.09
D
orm
ant
---
----
Need
le
an
d
thre
ad
I
Co
ol
I Imm
atu
re
12
.0
o.
16
(S
tip
a
co
mata
) E
arl
y
blo
om
1
1.4
M
idb
loo
m
8.9
F
ull
b
loo
m
6.6
4 0
.11
M
atur
e 4
.74
0.0
9
Ov
err
ipe
2.9
0
.07
D
orm
ant
4.o
• a
0.0
7
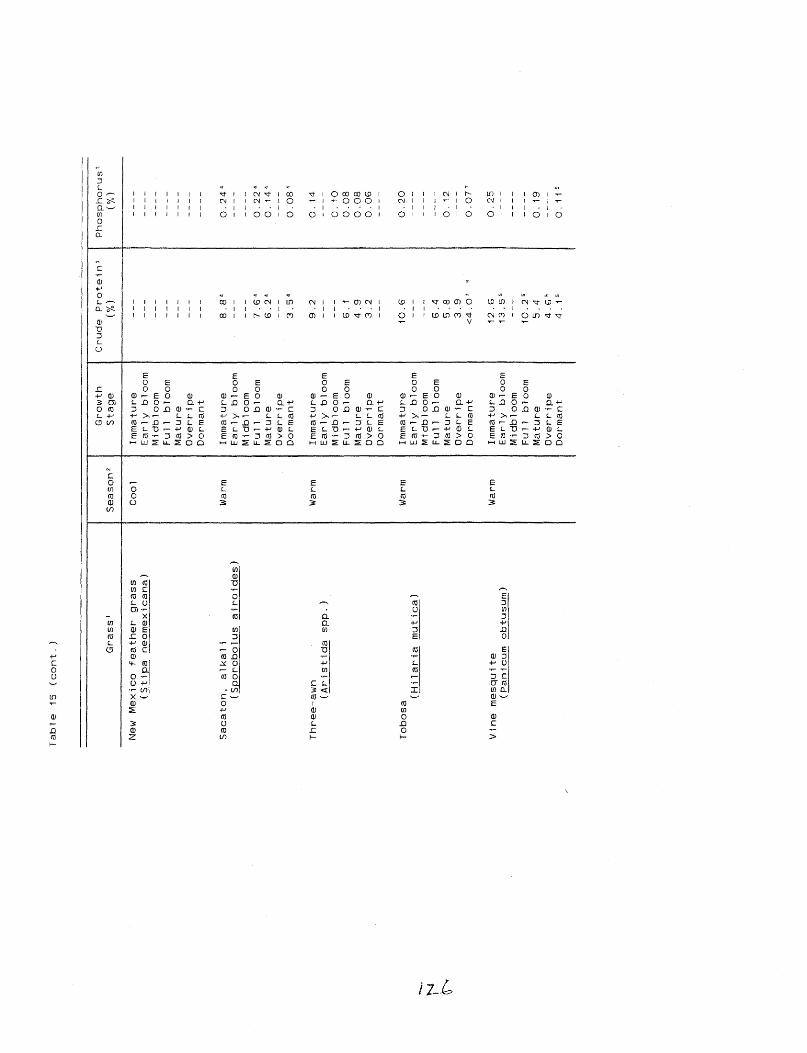
j'J
{}'<
Tab
1 e
1 5
( co
n t
. )
Gra
ss1
New
M
exic
o
feath
er
gra
ss
(Sti
pa
neo
mex
ican
a)
Sacato
n,
alk
ali
(S
po
rob
olu
s air
oid
es)
Th
ree-a
wn
(A
risti
da
sp
p.)
To
bo
sa (H
ilari
a
mu
tica)
Vin
e m
esq
uit
e
(Pan
icu
m
ob
tusu
m)
Seaso
n2
Co
ol
War
m
War
m
War
m
War
m
Gro
wth
S
tag
e
Imm
atu
re
Earl
y
blo
om
M
idb
loo
m
Fu
ll
blo
om
M
atu
re
Ov
err
ipe
Do
rman
t
Imm
atu
re
Earl
y
blo
om
M
idb
loo
m
Fu
ll
blo
om
M
atu
re
Ov
err
ipe
Do
rman
t
Imm
atu
re
Earl
y
blo
om
M
idb
loo
m
Fu
ll
blo
om
M
atu
re
Overr~ i
pe
Do
rman
t
Imm
atu
re
Earl
y
blo
om
M
idb
loo
m
Fu
ll
blo
om
M
atu
re
Ov
err
ipe
Do
rman
t
Imm
atu
re
Earl
y
blo
om
M
idb
loo
m
Fu
ll
blo
om
M
atu
re
Ov
err
ipe
Do
rman
t
Cru
de
Pro
tein
3 P
ho
sph
oru
s'
(%)
(%)
---
----
---
----
---
----
---
----
---
----
---
----
---
----
8.8~
0.2
44
---
----
---
----
7.6
4 0
.22
4
6.2
4 0
. i
44
---
----
3.5
4 o
.o8
•
9.2
0
.14
---
----
---
0.
iO
6.
1 0
.08
4
.9
0.0
8
3.2
0
.06
---
----
10
.6
0.
20
--
-----
---
----
6.4
--
--5
.8
0.
12
3
.9
----
<4
.07
g 0
.07
7
12
.6
0.2
5
13
.55
----
---
----
10
.25
----
5.4
0
. 1
9
4.6
5 ----
4.
1 5
0.
11
5

~
~
Tab
le
15
(co
nt.
)
Gro
wth
C
rud
e P
ro
tein
' P
ho
sp
ho
rus'
Gra
ss'
Seaso
n2
Sta
ge
(%)
(%)
Win
dm
i 11
g
rass,
ho
od
ed
W
arm
Im
matu
re
11
.9
0.
23
(C
hlo
ris cu
cu
llata
)
Earl
y
blo
om
---
----
Mid
blo
om
--
---
--F
ull
b
loo
m
0.1
7
Matu
re
---
0.
16
O
verr
ipe
---
----
Do
rman
t --
-----
Win
dm
i ·1
1 g
rass,
tum
ble
W
arm
Im
matu
re
12
.4
0.
20
(C
hlo
ris v
erti
cil
lata
)
Earl
y
blo
om
---
----
Mid
blo
om
--
-0
. 2
0
Fu
ll
blo
om
8
.6
0.
16
M
atu
re
5.8
0
. 1
2
Ov
err
ipe
---
·----
Do
rman
t 5
.01
0 ·-
---
'.
'Sp
ecie
s lf
st
for
so
uth
easte
rn
New
M
ex
ico
(B
ure
au
o
f L
an
d
Man
ag
em
en
t 1
97
9).
2C
oo
l-seaso
n sp
ecie
s
un
derg
o
max
imu
m
gro
wth
in
sp
rin
g o
r early
su
mm
er;
warm
-seaso
n
gra
sses att
ain
p
eak
g
row
th
in
mid
-to
la
te
sum
mer
(a
ssig
nm
en
ts
based
o
n
Bu
reau
o
f L
an
d
Man
ag
em
en
t 1
97
9;
Ph
illi
ps
Petr
ole
um
C
om
pan
y
19
63
; C
olo
rad
o
Sta
te
Un
ivers
ity
E
xte
nsio
n
Serv
ice
19
81
; G
ay
an
d
Dw
yer
1
97
0;
Red
etz
ke
an
d
Pau
r 1
97
5).
'P
erc
en
tag
e
of
tota
l d
ry m
att
er;
d
ata
o
bta
ined
fr
om
N
ati
on
al
Researc
h
Co
un
cil
1
96
9,
19
71
, ex
cep
t w
here
n
ote
d o
therw
ise.
•Ro
dg
ers
1
96
6;
Co
ok
, C
hil
d,
an
d
Lars
on
1
97
7.
5P
iep
er
et
al.
1
97
8.
6P
iep
er
19
77
. 7N
eu
en
sch
wan
der,
S
harr
ow
, an
d
Wri
gh
t 1
97
5.
'Wall
ace,
Fre
e,
an
d
Den
ham
1
97
2.
9P
au
lsen
an
d
Are
s 1
96
2.
10W
illa
rd
an
d
Sch
uste
r 1
97
3.

Southern Plains Bison in the Fifteenth Century - 128
Table 16
Average crude protein and phosphorus levels (%) of major Southern Plains grass species at different stages of growth (see table 15 for original data)
Crude Protein Phosphorus Growth Stage (mean %) (mean %)
Immature 11.4 ( 16) 1 0.20 ( 1 6 ) 1 Early bloom 12. 9 ( 1 0) 0. 16 ( 5) Midbloom 8.4 ( 6) 0. 17 ( 7) Full bloom 7.7 ( 14) 0. 13 ( 1 1 ) Mature 5.7 ( 1 7) 0. 11 ( 1 5 ) Overripe 4. 1 ( 1 2) 0.08 ( 1 2 ) Dormant 4.0 ( 14) 0.08 ( 9)
1values in parentheses indicate number of cases averaged.
large ruminants are the highly nutritious tops. By late
spring the remaining forage is significantly lower in crude
protein content.
This recurrent seasonal protein shortage is by no means
unique to the Southern Plains (for interesting general dis-
cussions concerning the nutritional inadequacy of "tropical"
or "warm season" grasses such as those found in the Southern
Plains, see Caswell et al. 1973 and Minson and McLeod 1970).
Sinclair ( 1974a,b,c,d, 1975, 1977), for example, notes that
the African buffalo and other ungulates in the Serengeti
grasslands of Tanzania subsist on diets substantially below
minimum maintenance requirements throughout most of the dry
season.
Sinclair's investigations suggest that the protein
available from the green component of the herbage during the

Southern Plains Bison in the Fifteenth Century - 129
dormant season may be a more critical limiting resource than
total energy (Sinclair 1975). It is therefore the quality
of the forage during the dry season (or winter in the case
of the Southern Plains), not the total quantity or biomass
of forage over the year, that plays the major role in deter
mining the nutritional status of the animals and ultimately
the size of the grazing populations. Interestingly, accord
ing to Sinclair (1975:515), consumption of large quantities
of suboptimal forage reduces "the rate of utilization of the
animal's fat reserves to compensate for food shortage, and
hence causes a time lag in the response of the population
through mortality to reduction in resources." Thus, in the
Southern Plains the major period of fat depletion, particu
larly of the marrow bones, would be expected to occur late
in the period of nutritional stress; in other words, during
spring. It is also of interest that black grama, unlike
most other grasses in the region, stays green during the
dormant phase (Paulsen and Ares 1962). This may have been
an important factor attracting bison to the more xeric parts
of the Southern Plains in the winter and spring.
Phosphorus levels in Southern Plains forages also fall
below minimum maintenance requirements, for even longer than
crude protein (September through May). Neumann and Snapp
(1969:142) note that forages from virtually all parts of New
Mexico and the Texas Panhandle are deficient in phosphorus
(see also Knox, Benner, and Watkins 1941). Phosphorus is

Southern Plains Bison in the Fifteenth Century - 130
critical for normal microbial activity in the rumen and for
adequate milk production in lactating cows (Neumann and
Snapp 1969: 142-43).
The most critical period for calving females is during
the last month of gestation, when most fetal growth occurs,
and the first three months of lactation (Neumann and Snapp
1969: 178; Robbins and Robbins 1979). Food requirements for
these females may be three to four times higher than for
cows without young (Sinclair 1975:503). Adequate nutrition
during this four-month.period is essential to producing a
healthy calf and is important 1n determining whether the cow
will conceive again in the next breeding season (Neumann and
Snapp 1 9 6 9: 1 7 8) .
It is evident from figure 36 that forages in the South
ern Plains region are nutritionally inadequate for many
months before the calving season. Moreover, cows that give
birth early in the season may be lactating for up to three
months while subsisting on a submaintenance diet. It is
clear from these data that weight losses in females, includ
ing depletion of stored fat reserves, may be substantial by
late spring (cf. Sinclair 1974d:302; Halloran 1968:24~ see
also Rice et al. 1974). Neumann and Snapp (1969:221) note
that weight losses of between 150 and 200 lbs (ca. 70-90 kg)
are common in calving female cattle wintered on open range.
This amounts to a loss of 15% to 20% of their normal body
weight. The average figure in bison would probably be some-

Southern Plains Bison in the Fifteenth Century - 131
what smaller. These data may help account for the observa-
tion by Halloran (1968) that Southern Plains bison cows
calve, on the average, only two out of every three years.
PREHISTORIC RANGE CONDITIONS IN THE SOUTHERN PLAINS
It is clear from the discussion thus far that pregnant
or lactating bison cows would have faced serious nutritional
shortages each spring in the Southern Plains. Thus, dis-
crimination against females during the butchering and pro-
cessing of carcasses at Garnsey may simply reflect the ex-
pected stressful conditions of spring and may offer no in-
sights into the general nature of environmental conditions
in the region at other seasons. There are several lines of
evidence, however, suggesting that poor pasture conditions
in the region may have been the norm throughout the year
during the mid- to late fifteenth century rather than an oc-
casional or seasonal phenomenon in an otherwise generally
favorable period.
Published Paleoclimatic Reconstructions
Direct evidence for environmental conditions in the
Southern Plains during the fifteenth century is at present
very limited. Nevertheless, paleoclimatic reconstructions
based on modern climate analogues by Baerreis and Bryson
(1966:114), Bryson, Baerreis, and Wendland (1970:68-69; see
also Duffield 1970:265) and by Sanchez and Kutzbach (1974)

Southern Plains Bison 1n the Fifteenth Century - 132
do point to increasing aridity in the region after about
A.D. 1450 or 1500.
The reconstructions by Sanchez and Kutzbach (1974), if
verified by future research, are of particular interest be
cause they indicate the potential complexity of paleoclimat
ic conditions in the region. First, their study suggests
that only the more southerly portions of the Southern Plains
may have become more arid; conditions may have improved in
nearby areas to the north. Second, their reconstructions
suggest that in the eastern portions of the Southern Plains
a higher proportion of the annual precipitation may have
fallen in the winter, whereas in the western portions, and
in much of the Southwest, the precipitation may have become
more concentrated in the summer months. A shift toward a
winter-dominant rainfall pattern would have exacerbated al
ready marginal forage conditions for bison wintering in the
Southern Plains by reducing moisture during the critical
growth period of the grasses and by leaching nutrients from
the forage during the dormant phase (Paulsen and Ares 1962).
Published tree-ring sequences from archeological sites
in the Southwest at or close to the western margins of the
Plains also point to generally increased aridity in the fif
teenth century. Sites providing useful sequences include
Arroyo Hondo Pueblo near Santa Fe, New Mexico (Rose, Dean,
and Robinson 1981); Tijeras Pueblo near Albuquerque, New
Mexico (Cordell 1980), and Gran Quivira Pueblo south of Al-

Southern Plains Bison in the Fifteenth Century - 133
buquerque (Dean and Robinson 1977). The Arroyo Hondo and
Gran Quivira sequences may also point to greater variability
in precipitation, a pattern that affected more northerly
latitudes as well (see, e.g., Reher and Frison 1980:55 and
discussion in Lamb 1977:465).
Dated pollen sequences from the Southern Plains span-
ning the period of interest to us here are not yet avail-
able. Ongoing palynological investigations in the Garnsey
Wash, however, may soon provide a clearer picture of prehis-
toric local and regional climatic and environmental condi-
tions (Stephen A. Hall, personal communication).
Tooth Wear ------ ----Perhaps the most direct line of evidence at present
available for suboptimal range conditions in the Southern
Plains during the fifteenth century concerns the attrition
of the lower and upper molars of the Garnsey bison. Wilson
(1980:98-99, 106) found that the average attrition rate was
significantly higher than the highest rates observed by
Reher (1974:120) and by Todd and Hofman (1978:69) at kill
sites in the Northern Plains (Casper and Horner, respective-
ly). Reher (1974:120) felt that the high rate of attrition
in the Casper sample indicated a bison population under
stress. The even higher values at Garnsey, therefore, may
reflect a bison population subsisting on extremely marginal
forage (Wilson 1980:125).

Southern Plains Bison in the Fifteenth Century - 134
Wilson combined the dentitions from all stratigraphic
levels at Garnsey in order to work with the largest possible
sample. When the wear rates are determined separately by
stratigraphic unit (units A and B), a clear directional
trend becomes apparent (table 17; mandibles only; unit A
maxillary sample inadequate). The rate of attrition of all
three lower molars increases sharply from unit B to unit k,
pointing toward progressively degenerating range conditions
during the mid- to late fifteenth century. Unfortunately,
the sample of sexed postcranial remains from unit A is too
small to determine whether there was a parallel increase in
discrimination against calving females in the butchering
process as pasture conditions deteriorated.
Table 17
Attrition rate of adult bison lower molars from Garnsey Site
1
Lower lvlolar Unit B (mm/yr)
2. 94 ( 6) 1
5.63 (6) 6.10 (6)
Unit A (mm/yr)
4.33 (5) 1 6.27 (5) 6.64 (6)
Values in parentheses indicate sample size.
The accelerating rate of attrition of the Garnsey den-
titions during the latter half of the fifteenth century
probably reflects a combination of increasing forage abra-
siveness and more grit in the diet. Forage abrasiveness is
due largely to minute particles of plant opal or silica

Southern Plains Bison in the Fifteenth Century - 135
(phytoliths). These particles, which are especially abun
dant in grasses, are harder than tooth enamel and have been
widely recognized as a major cause of tooth wear in grazers
(Baker, Jones, and Wardrop 1959; Walker, Hoeck, and Perez
1978; Covert and Kay 1981).
Numerous studies have shown that silica tends to con
centrate in the aerial parts of grasses, especially in the
leaves and inflorescences of mature plants (Handreck and
Jones 1968:456). A wide variety of factors influence the
amount of silica deposited in the leaves, including plant
species, availability of silica in the soil, soil pH, pres
ence and abundance of various soil nutrients, and especially
rate of transpiration (Jones and Handreck 1967; Dore 1960;
Handreck and Jones 1968; Lewin and Reimann 1969; Johnston,
Bezeau, and Srnoliak 1967).
In general, grasses growing under warmer and more arid
conditions, and subject to higher rates of water loss
through transpiration, develop higher concentrations of sil
ica than grasses growing in cooler or moister situations
(Dore 1960; Johnston, Bezeau, and Srnoliak 1967). Thus a
shift toward greater aridity in the Southern Plains, which
would have favored an increase in the proportion of drought
resistant grasses such as blue grama, would probably have
led to higher overall concentrations of silica in the forage
(Johnston, Bezeau, and Srnoliak 1967; Boggino 1970). This 1n
turn would have accelerated tooth wear in the bison. Low

Southern Plains Bison in the Fifteenth Century - 136
phosphorus levels, which are characteristic of soils
throughout New Mexico and the Texas Panhandle, also favor
elevated levels of silica in grasses, and hence higher rates
of tooth wear (Jones and Handreck 1967).
Grit consumed along with the forage also plays a major,
if not dominant, role in the tooth wear of ruminants such as
cattle and bison. Healy (1973; also 1968, cited in Spedding
1971:112), for example, reported that cattle may ingest up
to 450 kg of soil per animal per year. In addition, John
ston, ·Bezeau, and Smoliak ( 1967) observed that large quan
tities of silica dust adhere to grasses, particularly after
the summer rainy season has ended.
Greater aridity in the Southern Plains during the fif
teenth century would have favored an increase in the total
amount of grit bison ingested for several reasons. First,
if modern climatic analogues provide any indication of past
conditions, it is very likely that drier periods were also
windier (Rasmussen, Bertolin, and Almeyda 1971; Borchert
1950). Second, drought would have reduced the size of in
dividual grass plants and decreased total basal cover.
These changes would have forced bison to crop closer to the
ground and would have exposed larger areas of the soil to
wind erosion (Buffington and Herbel 1965; Coupland 1958:
Francis and Campion 1972; Herbel, Ares, and Wright 1972;
Humphrey 1958, 1962; Nelson 1934; Paulsen and Ares 1962;
Sims and Singh 1978; Valentine 1970; Van Dyne 1973, 1975).

Southern Plains Bison in the Fifteenth Century- 137
Finally, a reduction in total rainfall would have permitted
more dust to adhere to the grasses (Johnston, Bezeau, and
Smol iak 1967).
Thus the accelerating tooth wear observed at the Garn-
sey Site probably indicates reduced effective moisture in
the region during the latter half of the fifteenth century,
owing either to decreased total rainfall or to a shift in
the seasonal timing of precipitation relative to the growth
season of the principal forage species, or perhaps to in-
creased effective temperatures (but see Sanchez and Kutzbach
1974; LaMarche 1974; and Lamb 1977 concerning projected
cooler temperatures during the period of concern).
Carbon Isotope Chemistry and Bison Diet
Shifts in effective moisture directly affect the quali-
ty, quantity, and composition of the forage available to
grazers such as bison and lead to changes in the composition
of the animals' diets (see Van Dyne 1975 and references
therein). Some of these changes are directly reflected in
the carbon isotope chemistry of the bones.
The grasses in the Southern Plains fall into two broad
groups on the basis of their seasonal growth patterns. The
majority of species (generally 70-80% or more) are warm sea-
son types, which undergo maximum growth during the period of
peak temperatures in mid- to late summer (Teeri and Stowe
1976). The minority are cool season forms, which reach

Southern Plains Bison in the Fifteenth Century - 138
maximum growth earlier 1n the year, normally in spring or
early summer (Colorado State University Extension Service
1981; Phillips Petroleum Company 1963; Gay and Dwyer 1970;
Van Dyne 1973). Most warm and cool season species have dif
ferent photosynthetic pathways of carbon fixation. The for-
mer are characterized by the so~called Hatch-Slack or c 4
pathway, whereas the latter are characterized by the Calvin
or c3 pathway (Bender 1968; Doliner and Jolliffe 1979; Down
ton 1975; Eickmeier 1978; Hatch, Slack, and Johnson 1967;
Misra and Singh 1978; Syvertsen et al. 1976; Williams and
Markley 1973).
These two carbon pathways differ in the degree to which
they fractionate against the heavier isotopes of carbon.
Thus, collagen from bones of grazers with a diet consisting
exclusively of c4
plants has 13c fractionation values of
about -6.5 per mil, compared with values of about -21.5 per
mil in bones of animals with a nearly pure c3
diet (Sullivan
and Krueger 1981; Land, Lundelius, and Valastro 1980; van
der Merwe and Vogel 1978; van der Merwe, Roosevelt, and Vo-
gel 1981; Tauber 1981; DeNiro and Epstein 1978a,b). The
ratio of the stable carbon isotopes, 12c and 13c, in the
bones of bison therefore offers a direct means of estimating
the proportional contribution to the diet of warm and cool
season grasses.
Sullivan and Krueger (1981) 13 12 . analyzed the C/ C rat10
of bones from a series of modern herbivores with known

Southern Plains Bison 1n the Fifteenth Century - 139
diets. They found that the dietary contribution of C4
plants could be estimated directly from the isotope ratios
of both the apatite and the gelatin fractions of the bone.
In their study they also analyzed bones from several prehis
toric sites, including two specimens from level B3 of the
Garnsey Site (GX-5685 and GX-5681; their sample numbers 17
and 18; see table 6 above).
Their analyses indicated that the diet of level B3 bi
son was composed of about 85% c4 plants (Sullivan and
Krueger 1981:334). This value is very close to the figure
of about 80% warm season grasses noted by Peden (1972:39,
1976) in the diet of modern fistulated bison on the Pawnee
Grassland experimental range in northeastern Colorado.
Peden's study showed that, on lightly grazed pastures, c 3
grasses were important primarily during the spring, when
they composed nearly 54% of the diet. Of particular inter
est to us here, however, is that Peden observed a sharp in
crease in the spring contribution of cool season grasses to
nearly 80% of the diet under conditions of heavy grazing.
He attributes this dietary shift in the spring to the fact
that by the end of winter the bison have grazed off the warm
season species.
These interesting observations lead to the expectation
that the deteriorating range conditions, evidenced in level
A2 at Garnsey by accelerating wear of the bison dentitions,
may also have been accompanied by a shift, particularly dur-

Southern Plains Bison in the Fifteenth Century - 140
ing the spring, toward more cool season (c 3 ) plants in the
diet of the level A2 bison. Such a dietary change would in
turn be accompanied by a shift toward more negative average
13 f . . . f h . l C ract1onat1on values 1n the bones o t e an1ma s.
To test this expectation, bone samples from level A2
were submitted to Geochron Laboratories for isotope analysis
(I am extremely grateful to Harold W. Krueger and Charles H.
Sullivan for undertaking these additional analyses and for
permitting me to use these data as soon as they became
available). The results are summarized in table 18. The
trend in the isotope values is relatively clear-cut. Com
bining all unit B values in tables 6 and 18, the average 13c
fractionation values for apatite and gelatin are -0.2 and
-9.0 per mil, respectively. As predicted, both unit A
figures are more negative than their unit B counterparts
(average apatite, -1.0 per mil; average gelatin, -12.5 per
. , \ illl~,.
These results point toward an increase in the contribu-
tion of cool season species to the diet of the bison in the
younger levels at Garnsey. It is interesting in this regard
that the grass culms from unit A submitted to Beta Analytic
for radiocarbon dating (Beta-1925; see table 6 above), while
resembling sacaton (Sporobolus airoides; a warm season
grass; Richard I. Ford, personal communication), must be a
cool season form on the basis of the 13c fractionation value

Southern Plains Bison in the Fifteenth Century - 141
(-24.2 per mil). This grass may have been a major factor
attracting bison to the Garnsey Wash during the spring.
Table 18
13 c fractionation analyses (apatite and gelatin) of bison bones from level A2 and level B4 of the Garnsey Site (see table 6 above for additional fractionation values)
13c Fractionation 3
Provenience LaboratOljY Element Level Number Apatite Gelatin
504S507W/15 CR-17263 Me B4 -1.4(2) -11.3(3) 517S493W/2 CR-17264 Mt (A2) 2 -2.6(2) -15.4(3) 511S476W/14 CR-17265 R A2 -0.4(6) -12.6(4) 518S485W/1 CR-17266 Me A2 -0.8(2) l-12.0(3) 518S485W/3 CR-17267 R A2 -0.7(2) 1-11.8(2) 518S485W/4 CR-17268 u A2 -0.3· -10.5
1carbon isotope analyses by Harold w. Krueger and Charles
2H. Sullivan, Geochron Laboratories, Cambridge, Mass. Specimen recovered from interface of levels A2 and B3, making precise stratigraphic placement difficult; condition of bone more closely resembles that of other
31evel A2 materials. Figures in parentheses indicate number of replicate determinations averaged by lab; fractionation values (per mil) measured relative to PDB standard.
Life Expectancy £! the Garnsey Bison
Finally, there is one additional line of evidence that
points toward widespread suboptimal pasture conditions in
southeastern New Mexico. This is the life expectancy of the
Garnsey bison, a parameter that obviously is closely linked
to dental attrition (see, e.g., Sinclair 1974d:302). Pre-
dictably, the life expectancy of the Garnsey bison was short
(about twelve years). This figure is similar to the values

Southern Plains Bison 1n the Fifteenth Century - 142
observed at the Casper Site in Wyoming (Reher 1974), which
also displayed extremely high rates of dental attrition.
The life expectancy of bison from kills displaying lower
rates of tooth wear (Wardell and Glenrock) was considerably
greater (ca. 16.4 and 14.5 years, respectively; Wilson
1980: 100).

7. Fats and Human Hunting Strategies
INTRODUCTION
The importance to hunters of bulk differences between
different prey species, and between different anatomical
parts in carcasses of the same species, has been recognized,
for many years by archeologists, though it is only recently
that attempts have been made to develop objective criteria
for modeling bulk-related decision processes (Binford 1978).
The importance to hunters of an animal's physiological
state o~ condition, on the other hand, has been considered
almost solely in terms of which animals were likely to be
hunted; its influence on subsequent processing has been all
but ignored. Thus most prehistorians concur that seasonal
differences in the condition of males and females favored
preferential procurement of bulls in the spring and cows in
the fall and winter. However, most prehistorians seem also
to assume that all animals, once killed, would have been
handled in more or less the same manner--that anatomical
parts of both sexes would have been removed from the kill in

Fat and Human Hunting Strategies - 144
proportions similar to their representation in the original
kill population. This assumption is implicit, for example,
in the fact that estimates of the sex ratio of bison kill
populations commonly are based on the ratio obtained from
one skeletal element, or at most two or three (e.g., man
dible, metacarpal, or humerus).
The Garnsey case clearly demonstrates the inappropri
ateness of this assumption. At Garnsey the overall utility
of an anatomical part appears to have been evaluated simul
taneously on the basis of its bulk and its physiological
condition, compared with the bulk and condition of other
parts in carcasses of the same sex and with the bulk and
condition of the same part in carcasses of the opposite sex.
In previous discussion of the physiological condition
of the Garnsey bison and its bearing on prehistoric procure
ment and processing decisions at the site, I have made two
basic assumptions that require more explicit consideration.
First, I have assumed that changes in forage quality were
reflected in broadly parallel changes in overall animal con
dition, especially in levels of stored body fat. Second,
and of most immediate concern to us here, I have assumed
that the fat levels in an animal were of more than inciden
tal importance to the hunters. These two assumptions will
now be examined more closely.

Fat and Human Hunting Strategies - 145
ENVIRONMENTAL CONDITIONS, ANIMAL PHYSIOLOGY, AND FAT LEVELS
There is a voluminous literature documenting the close
relationship between environmental quality and the nutri-
tional status or well-being of ruminants and other animals
(see references in Pond 1978; see also Riney 1955; Harris
1945; Anderson, Medin, and Bowden 1972; Ransom 1965). These
studies also show that the quantity and distribution of fat
deposits in an animal provide an extremely sensitive index
of its condition and nutritional state. Riney (1955:431),
for example, observes that "fat can be taken as a direct
measure of the condition, reflecting the metabolic level or
goodness of physiological adjustment of an animal with its
environment." Keys and Brozek (cited in Pond 1978:519) also
emphasize the importance of body fat as a measure of condi-
tion. "Interstitial and depot fat is by far the most vari-
able constituent of the body and the one most clearly re
lated to nutrition." Finally, Martin (1977:631) points out
the close correspondence between fat reserves and an
animal's general level of well-being. "It is a well es-
tablished procedure to use the size of fat reserves as an
indicator of an animal's well-being, its general plane of
nutrition, and the favourability of its environment." These
and numerous other studies clearly testify to the close gen-
eral relationship between environmental factors, such as
forage quality, and the quantity of body fat deposited in an

Fat and Human Hunting Strategies - 146
animal's carcass. It remains to be demonstrated, however,
that the level of body fat in a carcass was of sufficient
concern to prehistoric hunters to have entered significantly
into their procurement and processing decisions.
ANIMAL FAT AND HUMAN DIET
Cultural Preferences for Fat-Rich Foods --- ---- -----
Jochim (1976, 1981), on the basis of an extensive sur-
vey of the ethnographic literature, has argued that the fat
content of foods is an important factor underlying the food
preferences of hunters and gatherers throughout the world.
He states that "high-quality protein is a requirement for
survival, but since many peoples can give reasons for their
food preferences, and since these reasons do not include the
protein content of different foods, it becomes necessary to
explore the link between stated preferences and nutritional
consequences that include protein intake. One possible link
between the two is the suggestion that, for lack of a better
name, may be called the 'Fat Hypothesis'" (Jochim 1981:81).
A few ethnographic examples will serve to illustrate the
widespread preference for fatty meat among hunting popula-
tions (see Jochim 1981:81 for additional references).
The underground species are highly desired because they are very fat, and animal fat is one of the elements most scarce in the Bushman diet. (Kalahari San, Botswana; Lee 1972:344)

Fat and Human Hunting Strategies - 147
All meat is classified in terms of whether it is fat (preferred) or lean, sweet or rank, clean or dirty, and whether it is from a nshe" or "he" animal. (Miskito, Nicaragua: Nietschmann 1973: 105)
Hunters generally seek large, fat animals (kayambo), although in times of hunger probably any susceptible one may be killed. (Eisa, Zambia; Marks 1976:105)
The Pitjandjara consider the best meats to be Kangaroo and Euro, making little distinction between them. They are selective with such animals. When killed they immediately feel the body for evidence of the presence of caul fat. If the animal is njuka, or fatless, it is usually left, unless they are themselves starving. (Pitjandjara, Australia; Tindale 1972:248)
Bear are greatly desired as food, especially because of the large amount of fat they yield. They are taken at every opportunity, but are eagerly sought during the fall when they are fattest .... Beaver rival bear as an item relished in the diet because of their high fat content. (Mistassini Cree, Canada; Rogers 1972:111-12)
Fat porcupine, bear and beaver meat are esteemed, particularly the tail of the latter. They are fond of marrow and fat. (Hidatsa, North American Plains~ Matthews 1877:24)
A final example, also from the Hidatsa, is of special
relevance to the discussion of the Garn~ey Site, because it
describes one means by which hunters could identify a bull
bison with adequate fat reserves in the spring.
"Now let me tell you again how to judge if one of the bulls is fat. As you come close, observe if the hair along the spine and just back of the eyes is black. Those so marked are the fat ones." The reason of this is that the black hair marked where

Fat and Human Hunting Strategies - 148
the buffalo had begun to shed his hair. Under the black spots were layers of fat that in those places made the buffalo shed a little earlier than his leaner fellows. But such a sign was of value only in the spring and was found only on bulls, not on cows. (Wilson 1924:306)
Biological Importance of Fat
Jochim (1981:81) points out that "ernie" preferences
among hunter-gatherers for fatty foods often represent bio-
logically sound food choices. Thus, fat provides the most
concentrated source of energy in the diet, supplying over
twice as many calories per gram as either protein or carbo-
hydrate (Guthrie 1975:45). In addition, dietary fat is a
source of essential fatty acids; it provides a vehicle for
the fat-soluble vitamins A, D, E, and K; and it is important
in the development and functioning of cell membranes (Food
and Agriculture Organization 1977; Pond 1978; Allen et
al. 1976; Guthrie 1975:45-47). Finally, fat makes foods
taste better (Food and Agriculture Organization 1977), and
many fat-rich foods also tend to be high in protein (Jochim
1981:82-83).
Although dietary fat serves a variety of functions, it
is most important as a concentrated energy source. Obvious-
ly, however, energy is not derived only from fat; carbohy-
drate is another extremely important source, and protein
beyond basic requirements also provides calories (Guthrie
1975; Taylor and Pye 1966; Chaney and Ross 1971). Given our
Fat and Human Hunting Strategies - 149
focus on the food-getting strategies of hunters, it is the
energy derived from hunted foods that most concerns us here.
Put another way, we are interested in the viability of a
diet composed largely, if not entirely, of meat; and, more
specifically, we are concerned with the importance in an
all-meat diet of fatty versus lean meat.
Eskimos are well known for diets that, aboriginally,
were largely, if not totally, devoid of plant foods (cf.
Draper 1977). In a widely publicized experiment, two arctic
explorers, Stefansson and Andersen, sustained themselves
under close medical supervision for an entire year on an
all-meat (including fat) diet (Stefansson 1935a,b, 1936; see
also Draper 1977; Chaney and Ross 1971:114-15). This ex-
periment demonstrated the viability in a nonarctic context
of a diet without plant foods. Neither of the participants
developed scurvy, despite the exceedingly low levels of
vitamin C in meat (Watt and Merrill 1963; Draper 1977:310).
Stefansson (1936:183) maintained that "if you have some
fresh meat in your diet every day, and don't overcook it,
there will be enough C from that source alone to prevent
scurvy." Recent studies suggest that bone marrow rather
than meat may have been their major source of vitamin C;
marrow appears to be a repository for significant quantities
of this important nutrient (Field 1976:68).
While an all-meat diet may be viable, Stefansson has
stressed that a diet based entirely on lean meat would

Fat and Human Hunting Strategies - 150
quickly lead to nutritional disorders, and eventually to
death. He states emphatically that "fat is the most impor-
tant ingredient of an Arctic ration" (Stefansson 1944:221).
He goes on to describe in detail the deleterious effects of
subsisting on the lean meat of rabbits in northern lati-
tudes. These animals are notoriously low in body fat, and
relying on them for food leads to a condition known as "rab-
bit starvation."
If you are transferred suddenly from a diet normal in fat to one consisting wholly of rabbit you eat bigger and bigger meals for the first few days until at the end of about a week you are eating in pounds three or four times as much as you were at the beginning of the week. By that time you are showing both signs of starvation and of protein poisoning. You eat numerous meals; you feel hungry at the end of each: you are in discomfort through distention of the stomach with much food and you begin to feel a vague restlessness. Diarrhoea will start in from a week to 10 days and will not be relieved unless you secure fat. Death will result after several weeks. (Stefansson 1944:234)
Observations similar to Stefansson's are common in the
ethnographic literature. The following examples further il-
lustrate the inadequacy, in northern latitudes, of a diet
based on lean meat.
The quantity of food consumed at one meal naturally varies according to the amount of fat it contains. Men and dogs will half-starve on a diet of lean caribou-meat, however plentiful, whereas half the quantity of blubbery seal-meat will satisfy their desires and keep them

Fat and Human Hunting Strategies - 151
well nourished. (Copper Eskimo, Canada; Jenness 1923:100)
If people had only rabbits at such times they would probably starve to death, because these animals are too lean. The same might be true if they could get only thin moose. People cannot live on lean meat alone, but if they have enough fat they can survive indefinitely. (Kutchin, Alaska; Nelson 1973: 142)
There are many similar observations in the ethnohistor-
1c literature, and these are by no means confined to the
arctic. For example, in June 1830 Warren A. Ferris, during
his expedition to the Rocky Mountains, made the following
observations concerning the poor sustenance provided by lean
buffalo.
We killed here a great many buffalo, which were all in good condition, and feasted, as may be supposed, luxuriously upon the delicate tongues, rich humps, fat roasts, and savoury steaks of this noble and excellent species of game. Heretofore we had found the meat of the poor buffalo the worst diet imaginable, and in fact grew meagre and gaunt in the midst of plenty and profusion. But in proportion as they became fat, we grew strong and hearty. (Phillips 1940:42)
Jedediah Smith led a group of trappers along the Klamath
River in California in May 1828. According to Dale Morgan
(cited in Allen 1979:457),
the party made only 3 miles on the 18th, which taxed their strength to the utmost. "The men were almost as weak as the horses, for the poor [spring] venison of this country contained little nourishment."

Fat and Human Hunting Strategies - 152
Finally, Randolph B. Marcy in the winter of 1857-58 provided
an extremely illuminating comment regarding the inadequacy
of a diet based on fat-depleted meat.
We tried the meat of horse, colt, and mules, all of which were in a starved condition, and of course not very tender, juicy, or nutritious. We consumed the enormous amount of from five to six pounds of this meat per man daily, but continued to grow weak and thin, until, at the expiration of twelve days, we were able to perform but little labor, and were continually craving for fat meat. (Marcy 1863: 16)
Of particular interest are frequent references to
situations in which hunters avoided or abandoned animals
they considered too lean in favor of fatter animals, even
when the hunters themselves· were short of food. A typical
example was recorded by Lewis and Clark in December 1804.
Captain Lewis went down with a party to hunt. They proceeded about 18 miles: but the buffalo having left the banks cf the river they saw only two, which were so poor as not to be worth killing. (Coues 1893:211)
In February 1805 Lewis and Clark made a similar entry in
their diary.
Captain Clark returned last evening with all his hunting party. During their excursion they had killed 40 deer, 3 buffalo, and 16 elk; but most of the game was too lean for use. (Coues 1893:233)
As a final example, Jacob Fowler, during his expedition to
the Rocky Mountains, made the following comment in his jour-
nal in February 1822.

Fat and Human Hunting Strategies - 153
Henters out Early--Killed one Cow Buffelow With In four Hunderd yards of Camp-but so Poor the meat Was not Worth Saveing. (Coues 1898:97; spelling as in original)
The nutritional literature offers several interesting
and important insights into reasons why hunters might have
abandoned lean or fat-depleted carcasses, even when they
themselves were short of food. Two aspects of protein me-
tabolism appear to be of particular relevance to this issue:
(1) the high "specific dynamic action" of protein ingestion;
and (2) the relatively low "protein-sparing" or "nitrogen-
sparing" effect of fat, compared with carbohydrate, in low-
calorie diets.
The specific dynamic action (SDA) of food refers to the
rise in metabolism or heat production that results from in-
gesting food (Chaney and Ross 1971:45; Barnes 1976:12-13;
Taylor and Pye 1966:39-40; Guthrie 1975:94-95; Bigwood
1972:xxii; Wing and Brown 1979:22). The SDA of a diet con-
sisting largely of fat is about 4%, while that of a diet
high in carbohydrate is about 6%. In striking contrast, the
SDA of a diet consisting almost entirely of protein is close
to 30%; in other words, for every hundred calories of pro-
tein ingested, an extra thirty are needed to compensate for
the increase in metabolism. Thus, heavy or complete reli-
ance on fat-depleted meat would have elevated the total en-
ergy needed to support a group of hunters. The effect of
increased energy demands owing to protein ingestion obvious-

Fat and Human Hunting Strategies - 154
ly would be greatest during periods when overall calorie in
take was restricted.
The other aspect of protein metabolism of interest to
us here is the protein-sparing effect of nonprotein dietary
energy. Proteins are complex substances built up of
nitrogen-containing amino acids. The amount of nitrogen
present in protein is relatively constant and uniform,
averaging about 16% (Guthrie 1975:53-54). Thus protein me
tabolism is often studied indirectly by monitoring the
amounts of nitrogen ingested and excreted (Guthrie 1975:
64-66). If the amount of nitrogen lost is lower than the
amount taken in, the individual is in positive nitrogen
balance; that is, protein is being gained. Similarly, if
the amount excreted exceeds the amount ingested, the in
dividual is in negative nitrogen balance~ protein is being
lost.
Both fat and carbohydrate exert a protein- or nitrogen
sparing action on protein metabolism (Munro 1964: Richardson
et al. 1979; Gelfand, Hendler, and Sherwin 1979; Peret and
Jacquot 1972; Goodhart and Shils 1980:820, 1128; Sim et al.
1979). This means that when either source of energy is in
creased the amount of nitrogen excreted in the urine de
clines. Numerous studies have demonstrated, however, that
the protein-sparing effect of carbohydrate is much greater
than that of fat (Richardson et al. 1979; Gelfand, Hendler,
and Sherwin 1979). "It has long been known that if fat and

Fat and Human Hunting Strategies - 155
carbohydrate are given in isocaloric amounts they do not ex
ert an equal protein-sparing effect, and that carbohydrate
is more effective than fat in promoting the utilization of
dietary protein" (Richardson et al. 1979:2224).
One indication of the greater protein-sparing effect of
carbohydrate is that when it is administered to fasting sub
jects there is a noticeable decline in the amount of nitro
gen excreted. No improvement in nitrogen balance is ob
tained when fat is given to fasting individuals. Another
indication is that when fat is substituted for carbohydrate,
while holding total dietary protein and energy intake con
stant and at normal levels, nitrogen losses increase sharp
ly. Munro (1964) suggested that increased nitrogen output
caused by substituting fat for carbohydrate was a transient
phenomenon lasting at most about fifteen days. More recent
studies by Richardson et ale (1979), however, indicate that
the negative nitrogen balance produced by fat substitution
may persist for much longer periods and may have a much more
detrimental effect. They observed that "on average, the net
protein utilization of .•. protein could be raised by
about 13% when the diet provided the majority of the energy
from carbohydrate" (Richardson et al. 1979:2223). Of par
ticular interest, Richardson et al. (1979:2223) noted a con
siderably greater protein-sparing effect (values approaching
50%) in individuals whose caloric intake was marginal.

Fat and Human Hunting Strategies - 156
If these observations on the specific dynamic action of
protein ingestion and the protein-sparing effect of dietary
carbohydrate stand up to further scrutiny, they have impor
tant implications for understanding certain critical aspects
of hunter-gatherer subsistence behavior. Let us assume in
the following discussion that we are dealing with hunting
populations during the late winter and spring. This is the
most stressful period of the year, often characterized by
diminishing supplies of stored food and the absence of col
lectible plant foods. To compensate for declining reserves,
hunter-gatherers may be forced to increase their hunting.
This in turn may increase the proportion of meat in the
diet. However, late winter and spring are not stressful
only to humans; ungulates such as deer and bison also may be
subsisting on diets of declining nutritional worth, and
their reserves of body fat may become depleted. As a conse
quence, hunters may be eating greater and greater quantities
of lean meat. It should be borne in mind throughout this
discussion that the meat of wild ungulates generally con
tains considerably less intramuscular fat than the meat of
domestic livestock, which have been bred specifically for
high degrees of marbling (cf. Draper 1977~ Speth and Spiel
mann, n.d.).
Because of the high specific dynamic action of protein,
eating more lean meat during the late winter and spring may
substantially increase the energy hunter-gatherers need to

Fat and Human Hunting Strategies - 157
maintain themselves. Moreover, with declining carbohydrate
reserves and progressively lower total calorie intake, there
may be a drop in nitrogen-sparing action during protein me
tabolism, leading to less and less effective utilization of
dietary protein.
It is clear from this discussion that diets high in
lean meat are a relatively inefficient source of suster.ance
for hunters and gatherers at times when their intake of car
bohydrate and total energy is restricted. There are several
responses they may make to cope with such caloric shortfall
(see Speth and Spielmann, n.d.).
First, when they make a successful kill, hunters may
have to eat unusually large quantities of meat, if it is
lean, to meet caloric needs and maintain positive nitrogen
balance. This may help account for the seemingly anomalous
gorging on meat at bison kills frequently noted by early
North American travelers and explorers (see discussion in
Wheat 1972:108-9).
Second, hunter-gatherers may become more selective in
killing fat animals and in processing fat-rich body parts.
It is this behavior that we are witnessing at the spring
season Garnsey Site. Archeologists must exercise great care
in distinguishing such selectivity from "waste" when food is
abundant.
Third, hunters and gatherers may shift their hunting
emphasis to animal species that normally maintain relatively

Fat and Human Hunting Strategies - 158
high levels of body fat in winter and spring. These may in
clude, for example, beaver, various migratory waterfowl, and
others, depending of course on location (cf. Rogers 1972).
Fourth, hunters and gatherers may augment their sup
plies of storable fats through labor-intensive activities
such as rendering bone grease.
Finally, in light of the substantially greater protein
sparing capacity of carbohydrate compared with fat, hunters
and gatherers may emphasize building up storable carbohy
drate reserves during the fall rather than hunting, particu
larly where adequate supplies of fat cannot be reliably pro
cured. Moreover, where carbohydrate-rich wild plant foods
are also not available in quantities adequate to store for
winter use, they may supplement their carbohydrate reserves
through limited cultivation or by trading with horticultural
populations (Speth and Spielmann, n.d.; conditions favoring
hunter-gatherer/horticulturalist food exchange have recently
been considered in detail by Spielmann 1982).
In the discussion above, I have focused on alternative
strategies open to hunters and gatherers to cope with oc
casional short-term or seasonal restrictions in their over
all calorie intake. These same arguments may be extended to
situations in which climatic, environmental, demographic, or
other changes lead to long-term reductions in available en
ergy. Under such conditions, selection may favor a per
manent shift in subsistence strategies toward carbohydrate

Fat and Human Hunting Strategies - 159
resources. The apparent increase in reliance on plant foods
in many parts of the world after the end of the Pleistocene
might profitably be explored from this perspective. Simi
larly, a long-term increase in the availability of carbohy
drate, owing, for example, to the introduction of a cul
tivated plant species, may alter the importance of animal
fat and may lead to permanent changes in the animal species
hunter-gatherers kill and the body parts they select during
butchering and processing. The caloric inadequacy of a
lean-meat diet and the noninterchangeability of fat and car
bohydrate clearly open a number of interesting avenues of
research that remain to be explored in detail.

8. Discussion and Conclusions
During the mid- to late fifteenth century, the Garnsey
Site was the locus of recurrent spring-season procurement
activities in which small groups of bison were surrounded or
ambushed in the wash, butchered, and processed for transport
to settlements that were probably to the west of the Pecos
Valley. Procurement strategies were highly selective. Al
though cows and calves were taken, the unusually high pro
portion of males (60%) points to the preferential killing of
bulls.
Sexing of most postcranial elements, made possible by
the high degree of sexual dimorphism in bison, not only
revealed great variability from element to element in the
sex ratio but also showed that in many cases the original
sex ratio had been reversed in favor of females. The Garn
sey material therefore underscores observations in the his
toric and ethnographic literature that selectivity by hunt
ers extended not only to the sex of the animals taken, but
also to the manner and intensity with which the animals,
''b

Discussion and Conclusions - 161
once killed, were processed. At Garnsey, what was killed
and what was subsequently left behind are diametrically op
posite. Thus, as a cautionary note to archeologists, let me
emphasize that the sex ratio of most anatomical parts aban
doned at a kill may bear little or no direct relation to the
sex ratio of the original kill population (see also Binford
1978:481). What remains at the site will be sharply biased
toward whichever sex was least desired at the time of the
kill. The Garnsey data also demonstrate a similar bias
against younger animals (though not necessarily against the
youngest, which are clearly underrepresented at the site).
In general, at Garnsey there was a better fit between
the sex ratio of an element and the sex ratio of the kill
population the lower the utility value of the element (i.e.,
skulls and axes provided better estimates than femurs or
humeri). But this should not be applied across the board as
a hard-and-fast rule. The atlas, for example, though very
low in general utility, nonetheless deviated sharply from
the original sex ratio, because the male element was sys
tematically destroyed during intensive butchering of the
preferred sex. The metapodials are yet another low-utility
part whose sex ratio deviated significantly from that of the
original kill population. In this case female metapodials
were systematically rejected because their spring-season
marrow-fat reserves were depleted, whereas their male coun-

Discussion and Conclusions - 162
terparts at the same time of year were in better nutritional
condition.
The clear and consistent patterning of bone remains at
Garnsey in relation to the modified general utility index
indicates that processing decisions, for the most part, were
strongly conditioned by utility. The Garnsey data therefore
provide a record of decisions by prehistoric hunters con
cerning the selection or rejection of anatomical parts,
weighted simultaneously in terms of their utility and in
terms of specific logistic constraints and maintenance needs
of the human population at the time of the kill.
Our understanding of the principal factors entering
into the decision process needs further development and
refinement so we can make more productive use of kill-site
data to ascertain the determinants underlying prehistoric
procurement strategies. Many extremely useful comparative
insights can be gained from reanalysis of the masses of
faunal data already stockpiled in museums, combined with de
tailed modeling of historically and ethnographically docu
mented Plains procurement systems.
The utility indexes developed for caribou must be ex
tended to incorporate the tremendous degree of sexual dimor
phism found in adult bison, as well as the within- and
between-sex differences in utility at different -ages. The
indexes must also be expanded to deal with within- and
between-sex seasonal variations in utility. It is clear
Discussion and Conclusions - 163
from the literature on other ungulates that seasonal changes
in condition are patterned and are therefore amenable to
modeling. Although changes in the condition of males and
females during the course of normal or abnormal years are
broadly comparable, the changes in the two sexes differ to
some extent in degree, and they are also slightly out of
phase. Both sexes are in poorest shape in the spring, but
males reach their lowest point earlier than females and are
improving at the time when females reach their lowest point.
Similarly, although both sexes improve during early summer,
males improve more rapidly. In mid- to late summer, howev
er, males decline sharply while females continue to improve
gradually throughout the summer, fall, and even early win
ter. Both sexes decline in late winter, but males often
enter this period with less fat reserve and are therefore
more vulnerable to undernutrition if conditions are severe.
Males, however, rebound much faster and sooner in the spring
than pregnant or lactating females. Finally, females, on
the average, may not calve every year (McHugh 1958; Fuller
1961; Halloran 1968; Meagher 1973). Thus their annual nu
tritional cycle when they are carrying fetuses will differ
from that in years when they are not.
If processing decisions of hunters were closely keyed
to the anatomical and physiological "facts" of bison, it is
quite likely that kills that took place during seasons other
than late spring will also display complex patterns of se-
Discussion and Conclusions - 164
lectivity in processing. Thus, bias in the bone frequencies
of kills should probably be taken as a "given," but the
degree and direction of bias can be expected to vary widely
depending on the age and sex structure of the original kill
population, the nutritional condition of the animals at the
time of the kill, and so forth. Despite the obvious com
plexity of the problem, a better understanding of annual
patterns of variability in the utility of various anatomical
parts of bison will provide more explicit sets of expecta
tions against which to compare the archeological data.
Significant patterned deviations of the bone frequen
cies observed archeologically from those expected solely on
the basis of utility will then provide useful insights into
the nature of logistic constraints and maintenance needs of
the hunters themselves. Some of the most critical factors
entering into processing decisions that would become amena
ble to investigation include the nutritional state of the
human population, time and transport constraints, and the
extent to which meat was procured for storage or for im
mediate consumption (for a discussion of the wide range of
potential factors entering into processing decisions, see
Binford 1978). Given the growing interest among archeolo
gists in the role of nutritional stress in prehistoric adap
tations and culture change (cf. Minnis 1981 and references
therein), careful intersite (or interlevel) comparisons of
the nature and degree of selective handling, particularly of

Discussion and Conclusions - 165
low-utility parts, may provide sensitive indicators of
changing patterns of food security.
At present, given the absence of decision models devel
oped explicitly for Plains procurement systems, the only
framework available within which to evaluate the Garnsey
data is the one provide6 by Binford (1978) for the Nunamiut
Eskimo. Clearly, such long-distance comparisons are tenuous
and must be made with the utmost caution. The principal in
tent of such comparisons at this juncture is to illustrate
the as yet untapped potential of Plains kill-site data.
Comparisons with the Nunamiut case are not totally
without justification. Both systems focused heavily on a
single migratory species. Both relied on logistically
oriented procurement strategies in which transport con
straints and storage were critical. And both systems
employed broadly comparable processing strategies, based
heavily on utility.
Perhaps the most obvious aspect of procurement strate
gies at Garnsey is the apparent deliberate pursuit of males.
Males provided a much greater return per animal killed, and
in late spring they were probably nutritionally in better
condition than females. A second important aspect of
procurement strategies in evidence at Garnsey is the remov
al, regardless of sex, of body parts of both high and
moderate utility and the discarding primarily of parts of
lowest overall utility. The resultant "bulk" curves imply

Discussion and Conclusions - 166
that hunters were taking many parts at rates greater than
would be expected on the basis of utility alone. These cur
ves therefore may reflect a human population subject to some
degree of food insecurity at the time of the kill events
(Binford 1978:45). The intensity of butchering at the site,
indicated by the extent of disarticulation of anatomical
units, may also point to food insecurity. On the other
hand, one could argue that the lack of selectivity toward
less-than-optimal parts reflected minimal transport con
straints. This seems unlikely for two reasons. First, the
total bulk that could be removed from the site was limited
by what the hunters could transport with dogs or on their
own backs (Spielmann 1982). Second, that butchering and
processing were intensive, with few articulated units left
behind, and that bulky items such as skulls and pelvises
were systematically stripped and dumped on the site suggest
that reducing bulk was indeed an important consideration
(Binford 1978:50, 130; see also Wilson 1924:226-28, 235-36,
251-52; Wissler 1910:42).
The nature of selectivity directed specifically against
females is informative. When articulated units were recov
ered at Garnsey, they were for the most part from females.
They included one complete front end, several lower-limb
units, an occasional series of cervicals or thoracics, and a
few other miscellaneous sets of articulated elements. But
the overall impression is that females, once killed, under-

Discussion and Conclusions - 167
went relatively intensive butchering that left few articu
lated remains. The most striking difference in the treat
ment of the two sexes is the high rate of rejection of the
nutritionally poorest parts of females, including necks, up
per forelimbs, and especially bulky marrow bones. Again,
this suggests selectivity to reduce bulk. The entire pat
tern at Garnsey therefore points to a procurement strategy,
operating within the context of at least some food insecuri
ty, that was directed toward optimizing the yield per animal
killed while at the same time minimizing bulk.
Venturing a little further into the realm of specula
tion, the frequency at kill sites of phalanges and mandibles
may be a useful indicator of the presence and degree of food
insecurity (see Binford 1978:32, 36-38, 148-50; Dorsey
1884:293; Stefansson 1925:233). Both elements produce edi
ble marrow and hence are potential food sources, but phalan
ges require considerable labor to extract useful quantities
of marrow and mandibles are bulky in relation to their
yield. Phalanges are problematic, however, because they of
ten are found at processing sites and campsites with no
evidence of having been broken open for marrow. They proba
bly were commonly removed from kill sites as riders attached
to more desirable limb units. Their relative scarcity at
Garnsey therefore does not necessarily reflect food insecu
rity. Obviously, in some sites the absence of phalanges may
be due entirely to taphonomic rather than cultural proces-

Discussion and Conclusions - 168
ses. As discussed earlier, however, this does not appear to
be true for the Garnsey Site.
The mandibles, in contrast to the phalanges, are un
likely to have been removed from Garnsey as riders, since
there are many more skulls and necks than mandibles left on
the site. The mandible has two features that lower its
desirability as a marrow bone: (1) it is bulky in relation
to the amount of marrow it produces; and (2) the oleic acid
content of the marrow fat is low (ca. 25%) compared with
much higher values in the limbs (e.g., distal femur,
ca. 51%; distal metatarsal, ca. 73%; values based on cari
bou: Binford 1978:24). Thus the mandibular marrow is proba
bly less palatable than the marrow in the limbs, assuming
that palatability is directly related to oleic acid content.
But several characteristics make the mandible useful as an
emergency food: (1) the overall proportional fat content of
mandibular marrow is higher than that of limb marrow (data
based on deer; Baker and Lueth 1967); and (2) although the
mandibular marrow fat is mobilized sooner in undernourished
animals than the marrow fat of the limbs, the percentage of
fat remaining in the mandibular marrow of animals in poorest
overall condition, regardless of sex, exceeds that in the
limbs (Baker and Lueth 1967; Nichols and Pelton 1972, 1974;
Warren 1979).
At Garnsey, nearly 70% of the expected number of man
dibles had been removed from the site for processing else-

Discussion and Conclusions - 169
where, presumably with tongues still attached. Of the com
paratively small number of mandibles left behind, approxi
mately 25% were missing their ventral borders, pointing
toward on-site processing of marrow (there is no evidence at
Garnsey that the ventral borders had been broken off by
predator-scavengers). In sum, the comparative scarcity of
mandibles at Garnsey may point to processing within the con
text of relatively intense food insecurity.
The Garnsey case by itself is insufficient to discrimi
nate clearly between occasional or seasonal food shortages
affecting only local populations and more continuous, en
demic food insecurity in the mid- to late fifteenth century
affecting populations over a much wider area of the Southern
Plains. To the extent that by A.D. 1450 bison were a major
component of regional subsistence systems (Jelinek 1967;
Collins 1966, 1971; Dillehay 1974; Gunnerson 1972; Lynott
1980), we can speculate that food insecurity may have been
the norm rather than an infrequent or seasonal problem,
This is suggested by the relatively poor condition of the
Garnsey bison themselves, particularly as reflected by their
high rate of dental attrition and short life expectancy.
These factors, in conjunction with the carbon isotope
data, indicate that the Garnsey animals were subsisting on
extremely marginal and progressively deteriorating forage,
which in turn may have had important demographic consequen
ces for local herds by lowering calf crops and increasing

Discussion and Conclusions - 170
calf and adult mortality (see discussion in Reher and Frison
1980 and in Sinclair 1974a,b,c,d, 1975). In all likelihood,
bison populations in the region were extremely vulnerable to
fluctuations in precipitation that altered local pasture
conditions; as a consequence, their numbers, their move
ments, and their nutritional condition may have been highly
variable and unpredictable from year to year. It seems
likely that exploitation of bison in the area would of ne
cessity have been opportunistic, with frequent recourse to
other hunted, gathered, or perhaps cultivated or traded
resources. Ultimately, careful comparisons among a broad
range of late prehistoric settlement types in the region are
needed, in conjunction with far more detailed paleoenviron
mental reconstructions, in order to delineate the nature,
degree, and spatiotemporal extent of food stress affecting
human adaptations during this critical and fascinating
period of Southern Plains prehistory.

Appendix
INTRODUCTION
To aid 1n sexing damaged or fragmentary limb elements,
a series of criteria have been developed using skeletal ma
terial from modern bison (Bison bison) of known sex. Com
parative collections housed in the following institutions
were examined: (1) Division of Mammals, National Museum of
Natural History; (2) Department of Mammals, Museum of Com
parative Zoology, Harvard University; and (3) Museum of
Zoology, University of Michigan.
MEASUREMENTS
Measurements were selected expressly to aid in sexing
mature limb elements that have suffered postdepositional
damage or that were broken prehistorically in butchering and
processing. The criteria developed here are designed to
augment existing procedures (see, e.g., Bedord 1974, 1978;
Duffield 1970, 1973; Lorrain 1968; Smiley 1979). The ele
ments examined were the humerus, radius, metacarpal, femur,
111

Appendix - 172
tibia, and metatarsal. Procedures similar to those de
scribed by von den Driesch (1976) were followed in collect
ing the data. Measurements were made with vernier calipers
and a measuring box. Values that could be determined with
relative ease and a high degree of replicability are denoted
by (+); those that were difficult to measure consistently
are denoted by (-). The terminology employed here is
derived from von den Driesch (1976), Sisson and Grossman
(see Getty 1975), Olsen (1960), and Brown and Gustafson
(1979). The procedures for obtaining each measurement are
outlined below and illustrated in figures 37-60. The raw
data are presented in tables 19-30.
Proximal humerus (figs. 37-38):
A- Depth of greater (lateral) tuberosity (+).
B - Depth of caudal (posterior) eminence of
greater (lateral) tuberosity (+).
C - Greatest depth of proximal end. Determined
with measuring box (+).
D - Greatest breadth of proximal end.
Determined with measuring box (+).
E - Depth of head from cranial (anterior) edge
of articular surface (+).
F - Depth of head from cranial (anterior) edge
of lesser (medial) tuberosity (+).
G - Length of cranial (anterior) eminence of
greater (lateral) tuberosity from distal

Appendix- 173
edge of rough prominence for attachment
of infraspinatus tendon (+).
H - Diagonal breadth of proximal end from
cranial (anterior) edge of lesser (medial)
tuberosity to prominent notch between head
and caudal (posterior) eminence of greater
(lateral) tuberosity (+).
Distal humerus (figs. 39-41):
I - Greatest breadth of distal condyle.
Measured parallel to longitudinal axis of
condyle on anterior surface (+).
J - Length (medial) of trochlea from bottom of
shallow depression immediately caudal to
proximal edge of articular surface of
trochlea to bottom of shallow depression
immediately caudal to distal edge of
articular surface (+).
K - Greatest diagonal depth of medial
epicondyle from bottom of shallow
depression immediately caudal to proximal
edge of articular surface of trochlea
(same as in J) ( +) •
L - Minimum depth of shaft from proximal end
of radial fossa to proximal end of
olecranon fossa. Measured on medial side
of shaft with tip of calipers in fossa (-).
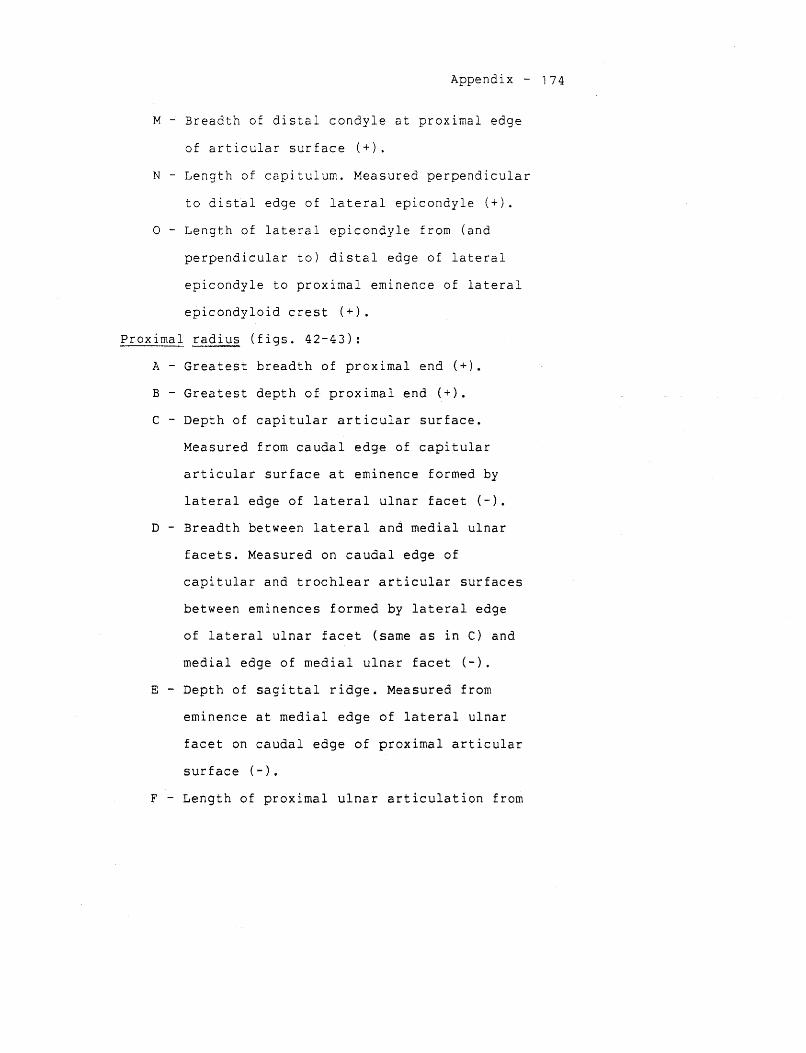
Appendix - 174
M - BLeadth of distal condyle at pLoximal edge
of aLticulaL SULface (+).
N - Length of capitulum. MeasuLed perpendiculaL
to distal edge of lateral epicondyle (+).
0 - Length of lateLal epicondyle from (and
perpendicular to) distal edge of lateral
epicondyle to proximal eminence of lateral
epicondyloid crest (+).
Proximal radius (figs. 42-43):
A- Greatest breadth of proximal end (+).
B- Greatest depth of proximal end (+).
C - Depth of capitular articular surface.
Measured from caudal edge of capitular
articular surface at eminence formed by
lateral edge of lateral ulnar facet (-).
D - Breadth between lateral and medial ulnar
facets. Measured on caudal edge of
capitular and trochlear articular surfaces
between eminences formed by lateral edge
of lateral ulnar facet (same as in C) and
medial edge of medial ulnar facet (-).
E - Depth of sagittal ridge. Measured from
eminence at medial edge of lateral ulnar
facet on caudal edge of proximal articular
surface (-).
F - Length of proximal ulnar articulation from

Appendix - 175
proximal end of interosseous space to
proximal eminence formed by medial edge of
medial ulnar facet (same as in D).
Measured on caudal surface of radius (-).
Distal radius (figs. 44-46):
G - Greatest breadth of distal end between
points of lateral and medial epiphyseal
fusion (+).
H - Length (medial) of distal epiphysis from
distal extremity of carpal articular
surface to proximal edge of prominent
tuberosity for attachment of medial carpal
ligament (point at or slightly proximal to
line of epiphyseal fusion~ same as in
G) (+).
I - Greatest breadth of articular surfaces or
facets of intermediate and radial carpals.
Measured diagonally from lateral edge of
intermediate carpal facet to prominent
tuberosity for attachment of medial
collateral ligament of carpal joint (point
on medial face of distal trochlea, antero
d~stal to tuberosity used in G and H) (+).
J - Minimum breadth of radial carpal facet.
Measured parallel to I at caudal edge of
facet (+).

Appendix - 176
K - Greatest breadth of radial carpal facet.
Measured parallel to I and J from lateral
edge of facet (same as in J) to prominent
tuberosity for attachment of medial
collateral ligament of carpal joint (same
as in I) (+).
Proximal femur (figs. 47-49):
A - Greatest breadth of proximal end. Measured
perpendicular to proximolateral surface of
greater trochanter (+).
B - Breadth of head and neck from lateral
margin of fovea capitis to most lateral
point of articular surface on proximal side
of neck (edge of fusion line). Point lies
caudal to longitudinal axis of neck (+).
C - Greatest craniocaudal diameter of head.
Identical to DC of von den Driesch (1976:
84-85) (+).
D - Greatest craniocaudal depth of greater
trochanter (+).
E - Minimum craniocaudal depth of neck.
Measured perpendicular to longitudinal axis
of neck just lateral to line of fusion (+).
F - Greatest craniocaudal depth of shaft at
lesser trochanter. Measured perpendicular
to line passing through fovea capitis and

Appendix - 177
center of greater trochanter (-).
G - Minimum length from most distal point on
lateroanterior margin of greater
trochanter to proximal saddle between
greater trochanter and neck (-).
Distal femur (figs. 50-53):
H- Greatest breadth of medial condyle (-).
I - Greatest breadth of distal end. Determined
with measuring box (~).
J. - Greatest length of lateral condyle from
bottom of shallow depression immediately
cranial to proximal edge of articular
surface to distal edge of articular
surface (-).
K - Greatest depth (medial) of distal end from
cranial surface of medial ridge of trochlea
to caudal surface of medial condyle (+).
L - Greatest length of medial condyle from
bottom of shallow depression immediately
cranial to proximal edge of articular
surface to distal edge of articular
surface (-).
M- Greatest breadth of lateral condyle (-).
N - Greatest breadth of trochlea. Measured
perpendicular to lateral ridge (-).
0 - Minimum depth from cranial surface of

Appendix - 178
medial ridge of trochlea (same as in K) to
nearest point on caudal surface of shaft.
Measured on medial side of specimen (-).
Proximal tibia (fig. 54):
A - Greatest breadth of proximal end.
Determined with measuring box (+).
B - Greatest depth from posteromedial
extremity of medial condyle to anterior
extremity of cranial border (-).
C - Breadth from posteromedial extremity of
medial condyle (same as in B) to interior
of extensor sulcus (+).
D - Greatest depth from posterolateral
extremity of lateral condyle to anterior
extremity of cranial border (same as in
B) (-).
E - Breadth of medial condyle. Measured from
posteromedial extremity of medial condyle
(same as in B) to posterolateral edge of
medial intercondylar tubercle (oblique to
horizontal plane of proximal epiphysis)
(-) . F - Breadth of lateral condyle. Measured from
lateral extremity of lateral condyle to
posteromedial edge of lateral intercon
dylar tubercle (oblique to horizontal
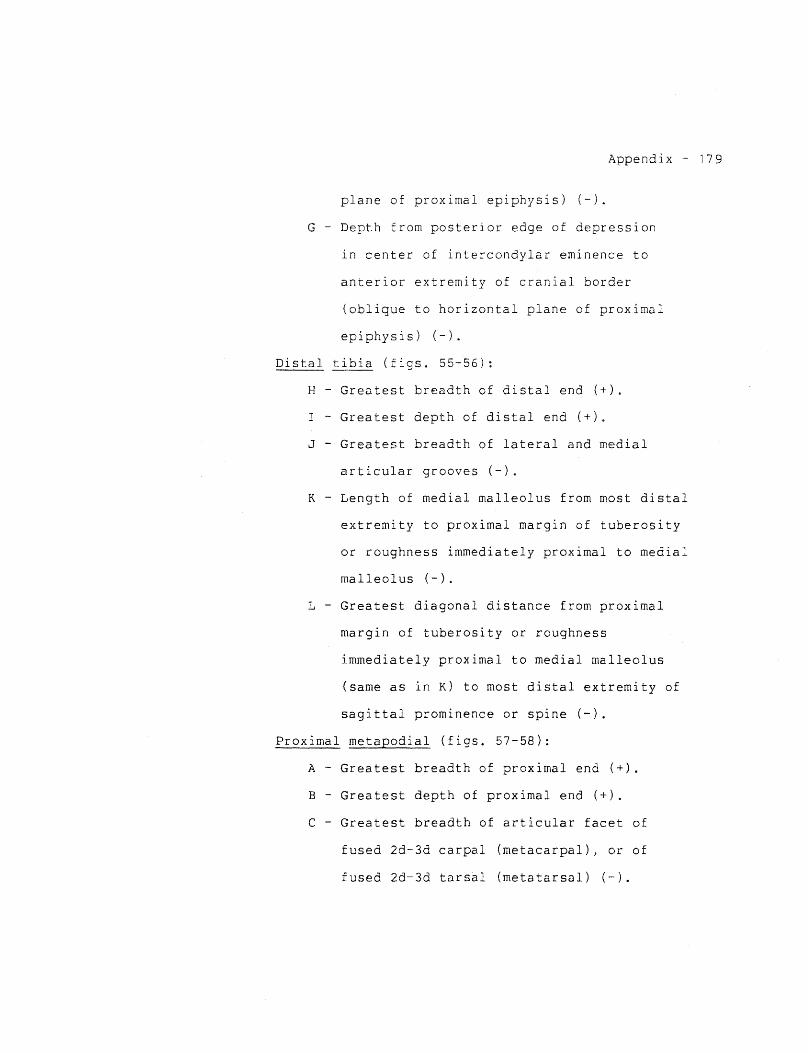
Appendix - 179
plane of proximal epiphysis) (-).
G - Depth from posterior edge of depression
in center of intercondylar eminence to
anterior extremity of cranial border
(oblique to horizontal plane of proximal
epiphysis) (-).
Distal tibia (figs. 55-56):
H- Greatest breadth of distal end (+).
I -Greatest depth of distal end (+).
J - Greatest breadth of lateral and medial
articular grooves(-).
K - Length of medial malleolus from most distal
extremity to proximal margin of tuberosity
or roughness immediately proximal to medial
malleolus (-).
L - Greatest diagonal distance from proximal
margin of tuberosity or roughness
immediately proximal to medial malleolus
(same as in K) to most distal extremity of
sagittal prominence or spine (-).
Proximal metapodial (figs. 57-58):
A- Greatest breadth of proximal end(+).
B- Greatest depth of proximal end (+).
C - Greatest breadth of articular facet of
fused 2d-3d carpal (metacarpal), or of
fused 2d-3d tarsal (metatarsal) (-).

Appendix - 180
Distal metapodial (figs. 59-60):
RESULTS
D - Greatest breadth of distal end. Measured
at line of epiphyseal fusion (+).
E - Breadth of medial condyle (Payne 1969:
296) (+).
F - Breadth of lateral condyle (Payne 1969:
29G) (+).
G - Depth of medial trochlea (Payne 1969:
296) (-).
H - Depth of lateral trochlea (Payne 1969:
296) (-).
I- Depth of medial sagittal ridge (+).
J- Depth of lateral sagittal ridge (+).
It must be stressed that the criteria developed in the
present study are designed to augment, not replace, existing
techniques for sexing bison limb elements. More important,
the present ~riteria should be applied to fragmentary speci
mens only if the specimens are known to be mature (i.e.,
fused proximal humerus fragments, but not fused distal hum
erus fragments, etc.). The effectiveness of the various
criteria developed here is indicated in tables 31 and 32
below; these tables summarize the results of a large series
of bivariate crossplots. If the sexes were clearly and
unambiguously separated in the plot for a given pair of
Appendix - 181
measurements (e.g., criteria A and B), an entry of good (G)
was made. Where the points representing each sex were sepa
rated in a plot but not tightly clustered, or where an am
biguous case existed, the pair of criteria was rated as fair
(F). An entry of poor (P) was made when no clear separation
of the sexes was observed. The proximal humerus proved to
be by far the easiest element to sex; 80% of the crossplots
provided good separation of the sexes. Good separation was
also observed in a majority of the plots for the distal hum
erus and proximal tibia. At the other extreme, none of the
criteria selected were successful in clearly sexing the
metatarsal, despite the fact that the identical criteria
worked moderately well in sexing the metacarpal.

I C F
----D -------D!
) l
Fig. 37. Proximal humerus (right) 1 proximal view.
Fig. 38. Proximal humerus (right) 1 cranial view.
~-------+-AA --------~~
\
!\\~\\
Fig. 39. Distal humerus (right), cranial view.

J I . al humerus Dlst . , \ Fig .. 40. I medial Vlew. \ (rlght, ,
'
. 1 humerus Dlsta . w Fig. 41. lateral vle . (right) 1
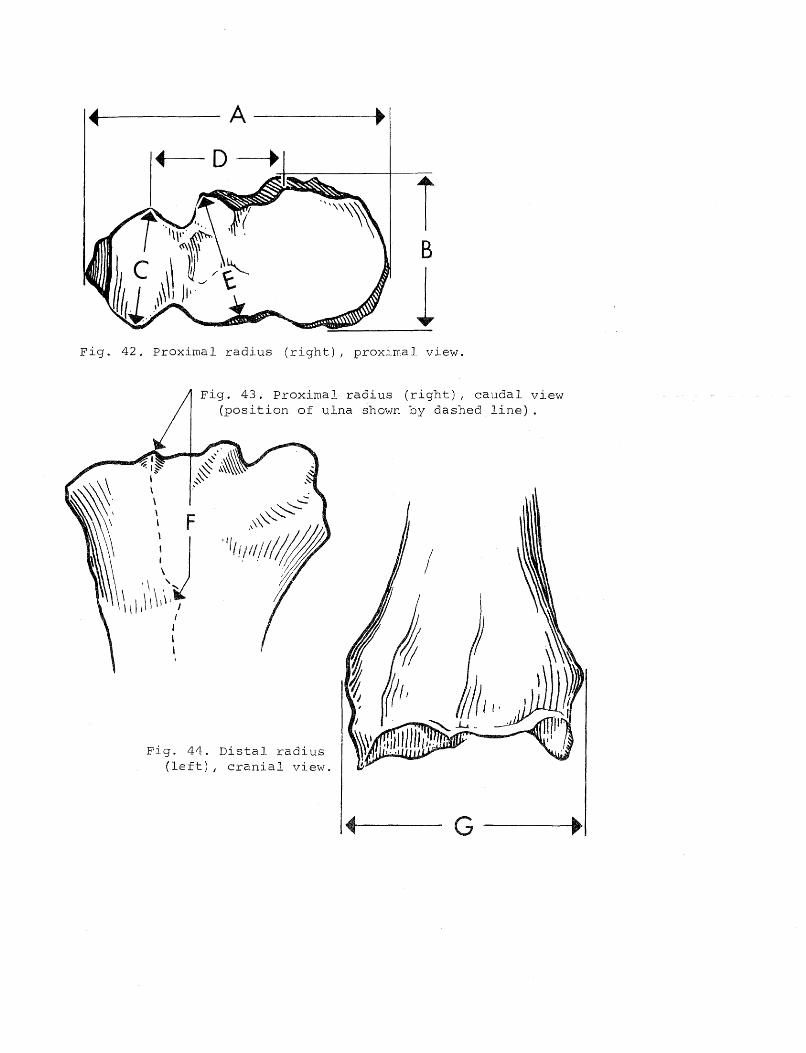
A
T B
1 Fig. 42.
. t 1 radius 4 Dls a . Fig. 4 . . al Vlew. ft) cranl ( le '

Fig. 45. Distal radius (left), medial view.
Fig. 46. Distal radius (left) 1 distal view.
--~ --- G ----~

T c
J
(i)
Fig. 47. Proximal femur (left), cranial view.
~---· --A __ ___.
Fig. 48. Proximal femur (left), proximal view.

Fig. 49. Proximal femur (left), medial view.
Fig. 50. Distal femur (left) , caudal view.
Fig. 51. Distal femur (left), lateral view.
D

L
Fig. 52. Distal femur (left) 1 medial view.
Fig. 53. Distal femur (left), cranial view.

A .. . 1 tibia Proxlma . F
ig. 54. . l Vl8W. roxlma (right) , P
. tal tibia 5 5 Dls . Fig. . distal vlew. (right),
H
. tal tibia Fig. 56. Dls l'al view.
) cran (right ,

A
Fig. 57. Proximal metacarpal (right), proximal view.
1----~ -A
Fig. 58. Proximal metatarsal (right) 1 proximal view.
~I
T B
l

Fig. 59. Distal metapodial (right), cranial view.
Fig. 60. Distal metapodial (right) r distal view.

Tab
le
19
Measu
rem
en
ts
of
bis
on
p
rox
imal
hu
meru
s
Cata
log
N
um
ber
1 S
ex
' S
ide'
A
8 c
D
E
F G
H
N5
34
06
04
., 2
11
.42
8
.60
1
3.0
0
11
.50
9
.34
1
3.3
3
10
.06
1
2.0
4
N1
72
68
9
1 1
12
.70
9
.73
1
3.5
0
13
.20
1
0.
15
15
.50
1
0.8
3
14
. 1
9
N2
49
89
4
1 1
12
.10
9
.74
1
3.0
0
12
.30
8
.78
1
3.6
2
10
.22
1
2.5
0
N0
16
29
7
1 1
11
.47
9
.08
1
3.2
0
12
.00
8
.98
1
4.0
9
10
.31
1
2.5
1
N2
00
33
1
1 2
11
.60
--
--1
2.5
0
11
.50
8
.79
1
3.7
7
10
.65
1
2.4
4
N0
00
83
9
1 2
11
.90
9
.23
1
2.9
0
12
.50
9
. 1
3
14
. 12
1
0.5
7
12
.29
N
04
96
30
1
2 1
2.2
3
9.
17
13
.30
1
2.1
0
8.5
1
13
.74
1
0.5
8
12
.85
N
25
11
47
2
1 9
.00
6
.71
1
0.8
0
9.5
0
7.8
1
11 .
GO
7
.93
9
.58
N
25
11
47
5 2
2 8
.98
6
.69
1
0.5
5
9.
50
7
.96
1
1.5
9
8.0
4
9.4
9
N0
63
36
3
1 2
10
.85
8
.20
1
:1.4
0
11
.60
7
.90
1
3.2
4
10
.24
'1
1.
69
N
04
95
71
1
2 i
1.
1 50
8
.78
1
2.0
0
12
.30
8
. 19
1
3.6
5
10
.82
1
1.9
6
N2
50
71
9
2 2
9.
15
7
.90
1
0.8
0
10
.50
7
.43
1
1.8
4
7.6
8
10
.30
N
25
07
19
2
1 9
.35
7
.63
1
0.8
0
10
.50
7
.54
1
1.9
4
7.9
3
10
.59
N
28
68
73
1
2 1
1.5
0
8.8
2
12
.70
1
1.8
0
8.6
9
14
.04
1
0.4
3
12
.36
N
02
23
74
1
2 1
0.8
5
9.0
3
12
.71
1
2.
10
9
. 1
5
13
.38
9
.52
1
2.5
0
N0
22
37
5
1 2
10
. 1
5
8.
15
1
1.5
0
10
.80
8
.90
1
3.0
0
9.0
1
11
.33
N
02
23
77
1
2 1
2.4
5
10
. 15
1
3.5
0
12
.60
9
.90
1
4.4
6
10
.51
1
3.4
0
N0
22
66
3
1 2
10
.83
8
.25
1
2.3
0
11
. 4
0
8.8
1
13
.34
9
.08
1
1.9
7
N0
49
76
0
2 1
9.6
8
7.4
4
10
.70
9
.80
6
.97
1
1.5
0
8.1
7
10
.30
N
04
97
60
2
2 9
.40
7
.39
1
0.5
0
9.8
0
6.9
0
i 1
. 33
8
.00
1
0.0
9
N1
75
78
3
i 2
11
.65
9
.36
1
2.6
0
12
.30
8
.38
1
3.2
6
10
.38
1
2.
10
N
19
77
05
2
2 9
.62
7
.68
1
0.9
0
10
.00
7
.53
1
1.
8 1
7.9
4
9.9
7
N1
97
70
5
2 1
9.4
0
7.4
6
11
. 1
0
10
.10
7
.57
. 1
2.0
2
7.7
3
9.9
9
N0
22
66
9
2 2
9.
·t8
7.4
3
10
.50
9
.60
7
.80
1
1.9
4
7.7
2
10
.21
N
02
26
69
2
1 9
.03
7
.23
1
0.6
0
9.8
0
7.7
6
11 .
86
7
.49
1
0.1
7
N0
49
55
6
2 2
9.
'16
7.
12
10
. 1
0
9.6
0
7.
10
1
1.3
2
7.6
3
10
.04
N
04
96
31
1
2 1
1.
'16
9.0
1
11
.70
1
1.6
0
8.5
7
13
.93
1
0.2
8
12
.29
N
02
26
66
1
2 1
0.
18
8
.45
1
1.9
0
11
.50
8
.85
1
2.6
9
8.5
6
11
.36
N
02
26
68
4 1
2 1
0.4
7
8.0
0
11
.50
1
0.8
0
8.5
3
12
.66
9
.56
1
1.3
0
N1
76
19
4
1 2
10
. ~1
8 8
.41
1
2.7
0
11
.70
9
.35
1
3.8
0
9.7
9
11
.88
H
00
00
92
2
2 9
. ~i
5 7
.34
1
0.9
0
9.9
0
7.6
7
11
.89
8
.06
1
0.4
0
H0
20
99
5
2 2
9.::
16
6.8
1
10
.50
9
.40
7
.26
11
. 4
3
7.9
8
10
.30
M
11
42
27
2
2 9
.22
7
. 1
5
10
.60
9
.50
7
.63
11
'8
2
8.0
1
10
. 1
4
-----
--
1H
(H
arv
ard
U
niv
ers
ity
, M
use
um
o
f C
om
para
tiv
e
Zo
olo
gy
);
M (
Un
ivers
ity
o
f M
ich
igan
, M
use
um
9
f Z
oo
log
y);
N
(N
ati
on
al
Mu
seu
m
of
Natu
ral
His
tory
).
zMal
e (1
);
fem
ale
(2
).
3L
eft
(1
);
rig
ht
(2).
4P
rox
imal
ep
iph
ysis
fu
sin
g.
5S
pecim
en
sli
gh
tly
arth
rit
ic.

Tab
le
20
Measu
rem
en
ts
of
bis
on
d
ista
l h
um
eru
s
Cata
log
N
um
ber
1 S
ex
' S
ide
3 I
J K
L
M
N
0
N5
34
06
0•
1 2
9.2
0
~5.
91
9
.66
5
.43
8
.66
4
.21
--
--N
17
26
89
1
2 1
0.5
0
6.5
0
10
.22
5
.57
9
.72
4
.63
--
-N
17
26
89
1
1 1
0.8
0
~3.
45
1
0.6
8
6.0
5
9.7
2
4.6
9
---
N2
49
89
4
1 1
9.8
0
6.1
0
10
.23
5
.67
9
.04
3
.99
---
N0
16
29
7
1 1
9.8
0
6.4
3
9.9
5
6.1
0
9.2
2
4.
17
5.3
4
N2
00
33
1
1 2
9.7
0
(;.
41
10
.03
5
.90
9
.26
4
.50
5
.66
N
00
08
39
1
2 9
.70
6
.59
1
0.0
0
6.4
3
9.3
3
4.2
8
5.9
3
N0
49
63
0
1 2
8.6
0
5.5
8
9.4
3
5.3
9
8.8
5
4.0
0
5.2
0
N2
51
14
7
2 1
7.2
0
5.
11
7.7
6
4.7
1
7.
19
3.5
3
3.9
2
N2
51
14
75
2 2
7.2
0
5.
17
7
.93
4
.70
7
.39
3
.47
3
.97
N
06
33
63
1
2 8
.30
5
.61
8
.92
5
.58
8
.33
4
.09
5
.22
N
04
95
71
1
2 9
. 1
0
5.9
0
9.3
1
5.8
6
8.8
2
4.
10
5
.92
N
25
07
19
2
2 7
.50
4
.90
8
.06
4
.33
7
.24
3
.34
3
.94
N
25
07
19
2
1 7
.60
~j
. 0
0
8.
19
4
.23
7
.23
3
.30
3
.85
I'
J28
68
73
1
2 9
.30
5
.77
9
.77
5
.81
9
. 19
4
.31
5
.49
N
02
23
74
1
2 9
.20
6
. 1
5
9.4
2
5.6
8
9.0
8
4.2
9
5.8
0
N0
22
37
5
1 2
8.8
0
!3.
71
8.7
8
5.3
8
8.7
7
4.0
3
4.5
6
N0
22
37
7
1 2
9.4
0
G.6
3
9.9
9
6.0
1
9.3
5
4.5
0
5.5
4
N0
22
66
3
1 2
8.4
0
!'i '9
4
9.0
3
5.3
4
8.6
0
4.0
7
5-
12
N0
49
76
0
2 1
7.4
0
4.9
1
7.8
7
4.4
4
7.5
6
3.2
6
3.9
2
N0
49
76
0
2 2
7.5
0
4.8
2
7.7
1
4.4
3
7.5
0
3.3
6
3.9
0
f\11
7578
3 1
2 8
.50
5
.80
9
.35
6
.00
8
.25
3
.74
5
.70
N
19
77
05
2
2 7
.90
!5
. 1
3
8.5
3
4.7
1
7.6
8
3.4
9
4.
15
N
19
77
05
2
1 7
.90
!3
. 1
4
8.7
7
4.8
7
7.7
2
3.4
2
4.3
1
N0
22
66
9
2 2
7.8
0
!~.
23
8
.32
4
.80
7
.97
3
. 7
0
4.5
8
N0
22
66
9
2 1
7.9
0
!5.
15
8
.35
4
.84
7
.98
3
.65
4
.60
1\
1049
556
2 2
8.0
0
4.9
9
7.4
7
4.4
4
7.
17
3
.37
3
.87
N
04
96
31
1
2 9
.60
!)
. 9
3
9.3
3
5.7
3
9.0
0
4.0
5
5.2
2
1\10
2266
6 1
2 8
.60
5
.90
8
.77
5
.31
8
.36
4
.00
4
.81
N
02
26
68
A
1 2
9.
10
!5
. 5
4
9.1
0
5.2
9
8.9
3
4.
14
4.9
6
f\11
7619
4 1
2 8
.80
~5 '
78
9
.66
5
.67
8
.63
3
.84
4
.77
H
00
00
92
2
2 7
.80
!3
. 1
8
8.3
4
4.6
2
7.5
4
3.7
8
4.0
2
f--1
0209
95
2 2
7.5
0
!3.
14
7
.82
4
.63
7
.25
3
.45
3
.53
M
11
42
27
2
2 8
.00
4
.92
7
.59
4
.33
7
.50
3
.57
4
.29
'····
··· 1H
(H
arv
ard
U
niv
ers
ity
, M
use
um
o
f C
om
para
tiv
e
Zo
olo
gy
);
M (
Un
ivers
ity
o
f M
ich
igan
, M
use
um
o
f Z
oo
log
y):
N
(N
ati
on
al
Mu
seu
m
of
Natu
ral
His
tory
).
2M
ale
(1
);
fem
ale
(2
).
3L
eft
(1
);
rig
ht
(2).
•P
rox
imal
ep
iph
ysis
fu
sin
g.
~specimen
sli
gh
tly
arth
rit
ic.

Tab
le
21
Measu
rem
en
ts
of
bis
on
p
rox
imal
rad
ius
Cata
log
N
um
ber
1 S
ex
' S
ide'
A
B
c 0
E
F
N5
34
06
04
1 2
10
.21
5
.32
3
.53
5
.69
4
.01
6
.22
N
17
26
89
*'
2 1
1.
49
5
.80
4
.09
5
.91
4
.43
6
.91
N
24
98
94
1
2 1
0.3
2
5.4
5
3.4
6
5.3
5
3.8
7
6.0
1
N0
16
29
7
1 2
10
.66
5
.32
3
.67
5
.48
4
.37
6
.39
N
20
03
31
1
2 1
0.2
7
5.4
5
3.6
8
5.6
9
4.
18
6.
13
N
00
08
39
1
2 1
0.4
8
5.4
1
3.7
0
6.0
7
4.4
3
6.4
3
N0
49
63
0
1 2
10
. 12
5
.20
3
.43
5
.62
3
.91
6
.29
N
25
11
47
2
2 8
.38
4
.46
2
.69
4
.79
3
.40
5
.70
N
06
33
63
1
2 9
.43
5
. 11
3
.48
5
.26
3
.94
6
.09
N
04
95
71
1
2 1
0.0
0
5.
18
3.6
0
5.4
1
3.7
8
6.5
7
N2
50
71
9
2 2
8.3
7
4.4
8
2.7
4
4.9
8
3.4
8
5.3
1
N2
86
87
3
1 2
10
.55
5
. 18
3
.49
5
.78
4
.09
6
.67
N
02
23
74
1
2 1
0.2
8
5.2
8
3.6
8
5.8
3
4.0
9
6.4
7
N0
22
37
5
1 2
9.6
0
5.
15
3.5
8
5.4
9
3.9
0
6.2
1
N0
22
37
7
1 2
10
.37
5
.67
3
.57
6
.38
4
.30
6
.71
N
02
26
63
1
2 9
.56
5
. 14
3
.54
5
.41
4
.09
6
.70
N
04
96
31
1
2 1
0.1
7
5.5
6
3.5
5
5.3
5
4.0
9
6.2
1
N0
49
76
0
2 2
8.7
6
4.4
4
2.9
0
4.8
5
3.3
0
5.5
0
N1
75
78
3
1 2
10
.08
4
.77
3
.27
5
.79
3
.77
6
.41
N
19
77
05
2
2 8
.75
4
.57
2
.99
4
.97
3
.68
5
.67
N
02
26
69
2
2 8
.85
4
.63
3
.00
4
.92
3
.75
5
.87
N
04
95
56
2
1 8
. 1
9
4.4
7
2.8
5
4.8
1
3.
\9
5.3
2
N0
22
66
6
1 2
9.3
4
5.0
3
3.2
8
5.2
5
3.8
3
5.9
1
N1
76
19
4
1 2
9.8
7
5.3
6
3.3
1
5.6
0
4.2
0
6.6
0
H0
00
09
2
2 2
8.4
7
4.5
1
2.7
9
4.6
7
3.6
9
5.6
7
H0
20
99
5
2 2
8.3
8
4.5
3
2.9
1
4.5
0
3.5
4
6.0
5
M1
14
22
7
2 2
8.9
2
4.5
0
2.8
2
4.6
2
3.4
9
5.
17
----
-----
-··
·----
'H
(Harv
ard
U
niv
ers
ity
, M
use
um
o
f C
om
para
tiv
e
Zo
olo
gy
);
M (
Un
iver
sit
y
of
Mic
hig
an
, M
use
um
o
f Z
oo
log
y);
N
(N
ati
on
al
Mu
seu
m
of
Natu
ral
His
tory
).
'Male
(1
);
fem
ale
(2
).
'Left
(1
);
rig
ht
(2).
•o
tsta
l ep
iph
ysis
fu
sin
g.

Tab
le
22
Measu
rem
en
ts
of
bis
on
d
ista
l ra
diu
s
Cata
log
N
um
ber
1 S
ex
1 S
ide
3 G
H
I
J K
N5
34
06
0•
1 2
9.
12
5.
14
5.
18
2
.07
3
.57
N
17
26
89
1
2 1
0.2
2
6.5
3
5.8
8
2.4
2
4.3
5
N2
49
89
4
1 2
9.3
5
4.7
7
5.3
1
2.3
6
3.7
9
N0
16
29
7
1 2
9.
18
5.2
5
5.
15
2
. 18
3
.62
N
20
03
31
1
2 9
.35
4
.78
5
.20
2
.09
3
.65
N
00
08
39
1
2 9
.47
5
.38
5
.72
2
.26
3
.96
N
04
96
30
1
2 9
. 1
9
5.6
4
5.3
5
2.0
8
3.8
9
N2
51
14
7
2 2
7.5
1
4.2
3
4.2
7
1.
54
2
.91
N
06
33
63
1
2 8
.86
5
. 13
5
.22
2
.03
3
.81
N
04
95
71
1
2 9
.38
4
.99
5
. 1
8
1. 9
0
3.8
5
N2
50
71
9
2 2
7.5
0
4.
16
4.3
8
1.
54
2
.95
N
28
68
73
1
2 9
.89
4
.86
5
.53
2
.23
3
.81
N
02
23
74
1
2 ~)
. 7
0
4.7
7
5.
16
1.
97
3
.52
N
02
23
75
1
2 8
.53
4
.70
5
.24
1
.93
3
.60
N
02
23
77
1
2 9
.53
5
. 13
5
.62
2
. 14
3
.94
N
02
26
63
1
2 8
.35
4
.63
4
.74
1
. 8
2
3.4
2
N0
49
63
1
1 2
9.2
8
4.9
6
5.5
0
2.0
2
3.9
3
N0
49
76
0
2 2
7.5
8
4.2
4
4.4
2
1.
75
3
.03
N
17
57
83
1
2 9
.20
4
.70
5
. 12
1
. 7 1
3
.68
N
19
77
05
2
2 7
.83
4
.48
4
.49
1
. 4
5
3.0
6
N0
22
66
9
2 2
8.4
0
4.3
9
4.5
7
1.
66
2
.99
N
04
95
56
2
1 7
.43
4
.07
3
.79
1
. 3
6
2.6
9
N0
22
66
6
1 2
8.5
1
4.8
7
4.9
2
1.6
9 J
3
.34
N
17
61
94
1
2 9
.46
4
.98
5
.07
2
.30
3
.44
H
00
00
92
2
2 7
.29
4
.37
4
.39
1
.63
2
.92
H
02
09
95
2
2 7
.45
4
.04
4
. 18
1
.56
2
.91
M
11
42
27
2
2 7
.56
4
.07
4
.32
1
.50
2
.92
--
----
_L
__
_
----
---~---~
-·---------~-
-----
1H
(H
arv
ard
U
niv
ers
ity
, M
useu
m
of
Co
mp
ara
tiv
e
Zo
olo
gy
);
M
(Un
ivers
ity
o
f M
ich
igan
, M
useu
m
of
Zo
olo
gy
);
N
(Nati
on
al
Mu
seu
m
of
Natu
ral
His
tory
).
2 M
a 1
e (
1);
fe
ma
1 e
( 2
).
'Left
(1
);
rig
ht
(2
).
4D
ista
l ep
iph
ysi
s fu
sin
g.
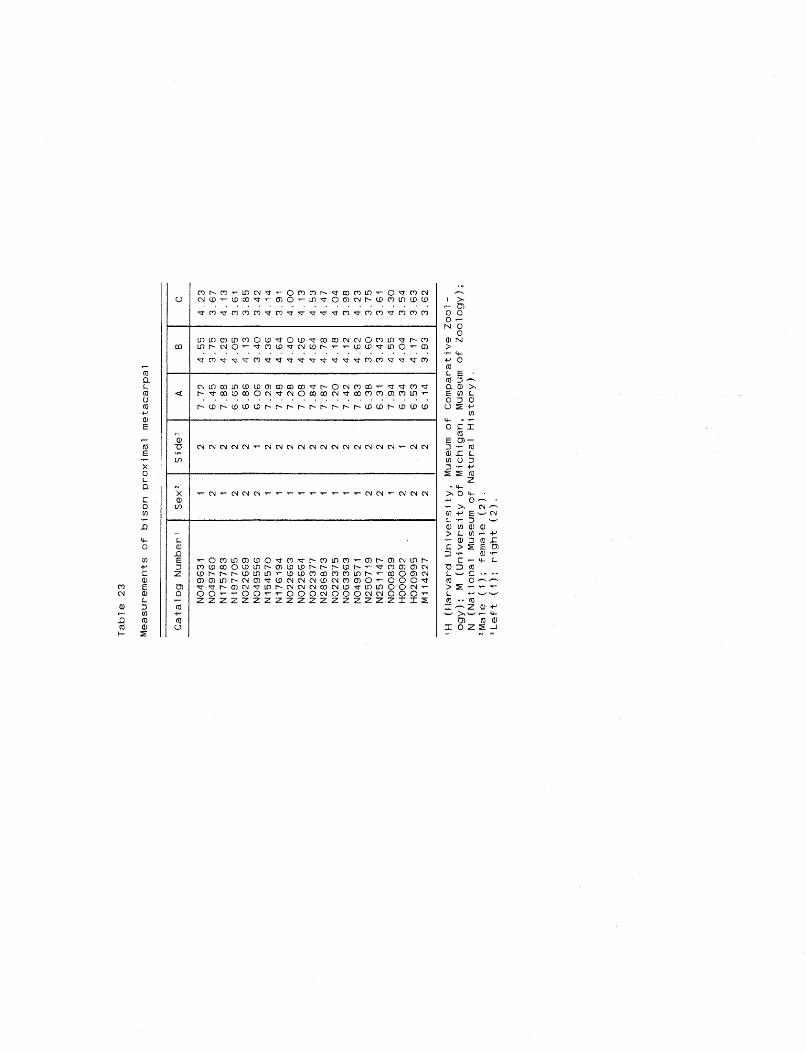
Tab
le
23
Measu
rem
en
ts
of
bis
on
p
rox
imal
meta
carp
al
Cata
log
N
um
ber
1 S
ex·z
S
ide
3 A
8
c
N0
49
63
1
1 2
7.7
2
4.5
5
4.2
3
N0
49
76
0
2 2
6.4
5
3.7
5
3.6
7
N1
75
78
3
1 2
7.8
8
4.2
9
4.
13
N1
97
70
5
2 2
6.6
5
4.0
5
3.6
1
N0
22
66
9
2 2
6.8
6
4.
13
3.8
5
N0
49
55
6
2 1
6.0
6
3.4
0
3.4
2
N1
54
57
0
1 2
7.2
9
4.3
6
4.
14
N1
76
19
4
1 2
7.4
8
4.6
4
3.9
1
N0
22
66
3
1 2
7.2
8
4.4
0
4.0
0
N0
22
66
4
1 2
7.0
8
4.2
6
4.
13
N0
22
37
7
1 2
7.8
4
4.6
4
4.5
3
N2
86
87
3
1 2
7.8
7
4.7
8
4.4
7
N0
22
37
5
1 2
7.2
0
4.
18
4.0
4
N0
63
36
3
1 2
7.4
2
4.
12
3.9
8
N0
49
57
1
1 2
7.8
3
4.6
2
4.2
3
N2
50
71
9
2 2
6.3
8
3.6
0
3.7
5
N2
51
14
7
2 2
6.3
1
3.4
3
3.6
1
N0
00
83
9
1 2
7.9
4
4.5
5
4.3
0
H0
00
09
2
2 1
6.3
4
4.0
4
3.5
4
H0
20
99
5
2 2
6.5
3
4.1
7
3.6
3
M1
14
22
7
2 2
6.
14
3
.93
3
.62
1H
(H
arv
ard
U
niv
ers
ity
, M
useu
m
of
Co
mp
ara
tiv
e
Zo
ol
og
y);
M
(U
niv
ers
ity
o
f M
ich
igan
, M
useu
m
of
Zo
olo
gy
);
N
(Nati
on
al
Mu
seu
m
of
Natu
ral
His
tory
).
1M
ale
(1);
fe
male
(2
).
3L
eft
(1
);
rig
ht
(2).

Tab
le
24
Measu
rem
en
ts
of
bis
on
d
ista
l m
eta
carp
al
Cata
log
N
um
ber
1 S
ex
2 S
ide'
D
E
F
G
H
I J
N0
49
63
1
1 2
7.5
9
3.6
5
3.4
2
3.0
5
2.7
3
4.0
5
3.9
3
N0
49
76
0
2 2
6.3
9
3.2
3
3.0
4
2.7
1
2.4
6
3.5
1
3.3
9
N1
75
78
3
1 2
7.6
9
3.3
7
3.3
4
2.8
7
2.6
3
3.8
8
3.7
6
N1
97
70
5
2 2
6.5
3
3.
11
2.9
6
2.8
0
2.5
6
3.6
3
3.5
7
N0
22
66
9
2 2
6.5
5
3.2
1
3.0
4
2.8
4
2.5
6
3.7
3
3.5
9
N0
49
55
6
2 1
6.0
3
2.8
6
2.6
5
2.4
6
2.2
7
3.3
5
3.2
0
N1
54
57
0
1 2
6.8
1
3.4
4
3.2
8
3.0
5
2.6
9
3.9
6
3.7
6
N1
76
19
4
1 2
7.2
2
3.5
9
3.3
7
3.
i7
2.8
1
3.9
1
3.8
2
N0
22
66
3
1 2
7.5
5
3.7
6
3.5
2
3.2
8
2.7
7
4.1
0
3.7
4
N0
22
66
4
1 2
6.9
7
3.6
9
3.3
8
3.
14
2.7
1
4.0
3
3.8
9
N0
22
37
7
1 2
7.4
2
3.9
2
3.6
7
3.5
1
3.0
2
4.5
3
4.2
3
N2
86
87
3
1 2
8.0
0
3.9
2
3.6
8
3.3
0
2.7
6
4.2
4
3.9
9
N0
22
37
5
1 2
6.8
4
3.4
5
3.2
0
2.9
7
2.7
3
3.9
1
3.6
9
N0
63
36
3
1 2
7.2
8
I
3.4
1
3.3
4
2.9
i 2
.61
3
.81
3
.65
N
04
95
71
1
2 7
.74
i
3.5
5
3.5
0
3.
14
2.8
6
4.
16
4
.00
N
25
07
19
" 2
2 6
.55
3
. 15
2
.91
2
.75
2
.45
3
.55
3
.40
N
25
11
47
2
2 6
.31
2
.97
2
.83
2
.61
2
.39
3
.40
3
.31
N
00
08
39
1
2 8
.00
3
.94
3
.74
3
. 1
9
2.8
4
4.
15
3
.91
H
00
00
92
2
i 6
.22
3
. 18
2
.94
2
.68
2
.39
3
.53
3
.43
H
02
09
95
2
2 6
.28
----
----
----
----
----
----
M1
14
22
7
2 2
6.4
2
i 3
. 1
1
2.8
7
2.6
3
2.3
6
3.4
8
3.3
7
I._
.
1H
(H
arv
ard
U
niv
ers
ity
, M
use
um
o
f C
om
para
tiv
e
Zo
olo
gy
);
M (
Un
ivers
ity
o
f M
ich
igan
, M
use
um
o
f Z
oo
log
y);
N
(N
ati
on
al
Mus
eum
o
f N
atu
ral
His
tory
).
'Male
(1
);
fem
ale
(2
).
3L
eft
(1
);
rig
ht
(2).
•s
pecim
en
sli
gh
tly
arth
rit
ic.

Table 25
Measurements of bison proximal femur
Catalog Number 1 Sex' Side 3 A B c 0 E F G
N534060 1 1 ----- 7.34 5.89 ---- 3.20 6.03 6.53 N534060 1 2 ----- 7.64 5.85 ---- 3. 17 5.95 6.55 N251147 2 1 12.20 6.26 5.26 6.78 2.78 5.60 5.34 N251147 2 2 12.35 6.22 5.29 6.98 2.69 5.48 5.48 N 172689 1 1 16.00 8.42 6.60 ---- 3.22 7. 18 6.93 N249894 1 1 16.03 7.45 6. 16 ---- 2.98 6.07 6.43
N249894 1" 2 14.53 7. 13 5.87 9.20 3.20 6.25 8.21 N016297 1 2 15.22 7.86 6. 10 9.94 3.07 6.57 6.36 N200331 1 1 14.54 6.97 5.67 ---- 2.92 5.93 6.41 N200331 1 2 14.42 7.05 5.65 8.93 2.91 5.79 6.39 N000839 1 2 14.87 7.50 6. 15 8.59 3.05 5.95 6. 10 N000839 1 1 14.78 7.78 6. 14 8.50 3.30 6.04 6.27 N000839 1 1 14.47 7.07 5.75 8.89 3.63 6.43 6:72 N049630 1 2 13.93 6.90 5.97 8.84 3.29 6.23 5.83 N049630 1 1 14.08 6.85 5.47 8.65 2.97 6.32 5.86 N269169 1 1 14. 13 7. 11 5.82 8.74 3. 12 6.23 6.23 N269169 1 2 14. 14 7. 15 5.87 8.53 3. 11 6.00 6.23 N063363 1 1 13.66 6.72 5.39 7.92 2.64 6. 14 5.40 N063363 1 2 13.60 6.78 5.40 7.92 2.70 6. 12 5.93 N049571 1 2 14.98 7.45 5.81 8.88 3.20 6.24 6.34 N250719 2 1 12.50 6.21 5. 18 7.80 2.66 5.29 5.28 N250719 2 2 12.40 6.34 5. 17 7.50 2.74 ---- 4.99 N286873 1 1 14.99 7. 10 5.69 8.90 2.92 6.72 5.99 N022374 1 2 14.76 7.07 5.67 9.24 3. 17 6.48 6. 17
N022375 1 1 13.82 7. 12 5.44 8.30 2.50 5.31 5.76
N022377 1 2 14.44 7. 15 5.65 8.68 2.79 6.04
I 6.02
N022663 1 2 14.23 7.17 5.82 8.81 3.08 6.34 6.29 N049631 1 1 14.20 6.74 5.72 9. 15 2.88 6.38 6.32 N049760 2 1 11 .99 6.04 4.98 7.62 2.67 5.40 5.36 N049760 2 2 11.86 6. 11 4.91 7.41 2.65 5. 16 5.57 N175783 1 1 14.57 6.84 5. 43 9.83 3. 16 6.50 6.39 N197705 2 1 12.71 6.40 5.50 7.48 2.62 5.43 5.05
N197705 2 2 12.85 6.51 5.34 7.54 2.66 5.62 5.34 N022669 2 1 12.50 6.25 5.48 6.80 2.74 5.78 5.39 N022669 2 2 12.83 6.46 5.40 6.82 2.85 5.59 5.32 N049556 2 2 12.26 6.02 5.02 7.72 2.51 5.06 4.92
N049631 1 2 14.46 6.68 5.66 9.34 2.79 6. 12 5.96
N022666 1 2 13.34 6.60 5.26 8.35 2.86 5.68 5.84 N022668 1 2 14.40 6.62 5.52 8.41 2.72 5.76 5.88 N176194 1 2 13.96 7. 14 5.81 8.86 2.61 5.81 6.07 H000092 2 2 12.75 6.30 5.27 7.52 2.82 5.48 5.45 H020995 2 2 11.52 6.02 5. 13 6.79 2.49 5.54 5.56
M114227 2 2 12.25 6.00 5.19 7.03 2.28 5.01 5.56
1 H (Harvard University, Museum of Comparative Zoology): M (University of Michigan, Museum of Zoology); N (National Museum of Natural History).
1 Male (1); female (2). 3 Left (1); right (2).

Tab
le
26
Measu
rem
en
ts
of
bis
on
d
ista
l fe
mu
r
:a l
og
1
ber
1 S
exz
Sid
e1
H
I J
K
L M
N
0
~4060
i 1
5.2
5
11
.98
7
.40
1
5.2
5
6.
10
5
.41
6
.68
1
0.6
9
,40
60
1
2 5
. 1
5
12
.00
7
.00
--
---
6.0
5
5.
10
--
----
---
'26
89
1
1 6
. 1
0
13
.09
7
.58
1
5.9
0
6.7
7
6.0
9
6.9
2
11
.21
1
98
94
1
1 5
.09
11
. 1
fl 7
.26
1
4.7
4
5.7
5
5.8
8
6.3
7
10
.78
1
98
94
1
2 5
.26
11
. 8:
::1
6.8
2
15
.50
5
.60
6
.03
6
.21
11
.0
3
16
29
7
1 2
5.0
6
12
.04
7
.54
1
5.2
3
6.2
1
5.8
7
6.5
0
10
.95
}0
33
1
1 1
----
----
-7
.50
--
---
5.8
2
----
----
----
-)0
33
1
1 2
5.0
0
12
.07
7
. 17
1
5.2
6
5.7
5
5.8
8
6.
14
10
.64
)0
83
9
1 2
5.3
1
11
.80
7
.00
1
5.2
1
6.0
2
6.7
5
6.G
O
10
.81
)0
83
9
1 1
5.
12
1
1.
79
6
.98
1
4.6
9
6.0
5
6.7
7
6.4
8
10
.83
1
96
30
1
2 0
.00
i
1. 6
0
6.5
8
14
.78
5
.80
6
. 1
3
6.2
2
10
.28
1
96
30
1
i 4
.95
1
i .6
6
6.9
7
14
.63
5
.79
6
.10
6
. 19
1
0.2
5
)91
69
1
i 5
. 1
8
12
.74
7
.20
1
4.7
2
6.0
0
5.8
4
6.0
5
10
.77
)9
16
9
1 2
5.3
0
12
.35
7
.06
1
4.7
0
5.8
6
5.8
6
6.2
2
10
.33
i3
36
3
i 1
4.8
2
11
. 12
6
.35
1
3.9
8
5.5
6
5.4
4
6.0
6
9.4
0
)33
63
1
2 4
.84
1
1.2
0
6.2
3
13
.97
5
.50
5
.34
6
.40
9
.40
1
95
71
1
2 4
.87
1
1.8
1
7.0
0
14
.77
6
.01
5
.76
6
.87
1
0.4
7
)07
19
2
1 4
.31
1
0.0
5
5.7
8
12
.99
4
.92
4
.74
5
.40
9
.29
!6
87
3
1 1
5.
16
12
.28
7
.01
1
4.7
3
5.9
0
6.0
5
5.9
4
10
.68
~2374
1 2
4.9
3
12
.03
6
.69
1
4.9
6
6.0
0
5.7
4
6.3
9
10
.48
~2375
1 1
4.8
1
11
. 13
6
.32
1
3.8
3
5.4
0
5.3
0
5.8
6
9.8
6
~2377
1 2
4.9
4
11
.44
6
.91
1
4.8
4
5.9
1
6.
14
6.5
5
10
.58
~2663
1 2
5.0
5
11 .
91
6.8
0
14
.85
6
.24
6
.09
6
.50
1
0.5
4
1963
·f 1
1 5
.45
1
1.9
9
G.6
0
14
.88
5
.68
5
.52
6
.38
1
0.6
3
19
76
0
2 1
4.
13
9
.79
5
.39
1
3.3
1
4.9
3
4.5
9
5.4
9
9.
14
~9760
2 2
4.0
7
9.7
0
5.4
9
13
.35
4
.83
4
.48
5
.35
9
. 15
'5
78
3
1 1
4.8
1
11
,39
6
. 1
0
14
.73
5
.49
5
.44
5
.95
1
0.4
2
l77
05
2
1 4
.27
1
0.0
3
5.8
8
13
.68
5
.29
4
.37
5
.73
9
.69
1
77
05
2
2 4
.27
1
0.3
0
6.0
8
13
.50
5
. 15
4
.54
5
.59
9
.72
~2669
2 1
4.5
2
10
.60
6
.08
1
3.6
8
4.9
2
5.0
0
5.3
3
9.
71
~2669
2 2
4.3
7
10
.64
6
.02
1
3.7
2
5.0
4
4.5
0
5.2
9
9.7
0
19
55
6
2 2
4.0
2
9.7
0
5.3
4
12
.78
4
.84
4
. 19
5
. 1
2
9.
12
~9631
1 2
5.3
8
11
.78
6
.41
1
4.8
3
5.8
0
5.
12
6.6
9
10
.45
~2666
1 2
4.8
1
11 .
21
6
.29
1
4.2
0
5.6
9
5.2
0
5.6
/ 1
0.
14
~2668
1 2
4.8
2
11
.35
6
.23
1
4.
17
5.5
4
5.2
2
6.
i i
10
.04
r6
19
4
1 2
5.0
9
11
.55
6
.60
1
4.4
8
6.0
9
5.6
4
6.5
0
10
.43
)0
09
2
2 2
4.
14
1
0.2
4
5.7
1
13
. 18
5
.03
4
.52
5
.35
9
.33
W
99
5
2 2
4.0
8
10
.22
5
.46
1
2.4
4
5.0
1
4.5
1
4.8
7
8.4
8
14
22
7
2 2
4.4
7
10
.06
5
.88
1
3.2
1
5.
16
4.0
2
5.2
4
9.2
2
--
---~---·---
'H
(Harv
ard
U
niv
ers
ity
, M
use
um
o
f C
om
para
tiv
e
Zo
olo
gy
);
M (
Un
ivers
ity
o
f M
ich
igan
, M
use
um
o
f Z
oo
log
y);
N
(N
ati
on
al
Mu
seu
m
of
Natu
ra1
H
isto
ry).
'M
ale
(1
):
fem
ale
(2
).
3L
eft
(1
);
rig
ht
(2).

Tab
le
27
Measu
rem
en
ts
of
bis
on
p
rox
imal
tib
ia
Cata
log
N
um
ber'
S
ex2
Sid
e3
A
B
c D
E
F
N5
34
06
0a
1 2
11
. 8
5
11
.94
9
.42
1
1.8
0
6.2
4
5.9
0
N2
49
89
4
1 2
12
.25
1
2.4
5
9.2
7
12
. 1
9
6.0
7
6.5
3
N0
16
29
7
1 2
12
.32
1
2.3
8
9.5
5
12
.78
6
.32
6
.48
N
20
03
31
1
2 1
2.4
3
12
.01
9
.40
1
2.2
8
6.
13
6
.67
N
00
08
39
1
2 1
2.2
2
12
.20
9
.88
1
1.7
8
6.5
2
6.6
6
N0
49
63
0
1 2
12
.26
1
1.8
2
9.2
4
11
.88
6
.29
6
. 12
N
25
11
47
5 2
2 11
.0
0
10
.81
8
. 14
1
0.4
5
----
----
N0
63
36
3
1 2
11 .
64
1
1.2
6
9.0
0
11
.07
6
.03
5
.96
N
04
95
71
1
2 1
2.4
3
11
.85
9
. 16
1
1.5
5
6.
12
6.8
2
N2
50
71
9
2 1
10
.17
1
0.1
1
7.9
7
9.9
8
5.2
6
5.3
0
N2
86
87
3
1 2
12
. 1
9
12
. 17
9
. 14
1
2.
11
6.5
3
6.3
7
N0
22
37
4
1 2
12
.40
1
2.
13
9.2
9
12
.41
6
.47
6
.00
N
02
23
75
1
2 1
1.7
0
10
.93
8
.81
1
0.7
4
6.
12
6.0
2
N0
22
37
7
1 2
13
.02
1
2.6
0
9.4
6
12
.07
6
.57
6
.82
N
02
26
63
1
2 1
2.3
0
11
.67
9
.24
1
2.0
5
6.0
5
6.4
3
N0
49
76
0
2 2
10
.43
1
0.4
3
8.
12
10
.27
5
.33
5
.30
N
17
57
83
i
2 1
1.6
2
11
.52
8
.84
1
1.6
8
6.0
8
5.9
9
N1
97
70
5
2 2
10
.54
1
0.8
7
8.3
2
10
.63
5
.32
5
.77
N
02
26
69
2
2 1
0.8
7
11 .
08
8
.41
1
0.8
0
5.4
8
5.4
9
N0
49
55
6
2 1
9.8
9
9.9
4
7.6
9
9.8
8
5.0
4
5.0
9
N0
49
63
1
1 2
I 1
2.2
6
12
.05
9
.24
1
1.8
0
6.5
1
6.5
4
N0
22
66
6
1 2
11
.53
1
1.1
6
8.6
5
11
.03
5
.85
6
.37
N
02
26
68
4 i
2 1
1.8
7
11
.46
9
.01
1
1.3
9
5.9
8
6.
16
N
17
61
94
i
2 1
1.8
8
12
.06
9
. 1
9
12
. 1
2
6.3
3
6.
13
H
00
00
92
2
2 1
0.7
2
10
.43
8
. 1
2
10
.42
5
.33
5
.95
H
02
09
95
2
1 1
0.3
0
10
.07
7
.93
1
0.0
9
4.9
3
5.3
1
M1
14
22
7
2 2
10
.68
1
0.5
9
8.0
5
10
.64
5
.33
5
.58
--
· ...
'H
(Harv
ard
U
niv
ers
ity
, M
useu
m
of
Co
mp
ara
tiv
e
Zo
olo
gy
);
M (
Un
ivers
ity
o
f M
ich
igan
, M
use
um
o
f Z
oo
log
y);
N
(N
ati
on
al
Mus
eum
o
f N
atu
ral
His
tory
).
2M
ale
(1
);
fem
ale
(2
).
3L
eft
(1
):
rig
ht
(2).
•P
rox
imal
ep
iph
ysis
fu
sin
g.
5S
pecim
en
sli
gh
tly
arth
rit
ic.
G
9.4
9
9.2
2
9.7
4
9.6
1
9.7
4
9.2
3
----
8.7
2
9.5
0
7.8
5
9.2
7
9.5
0
8.4
5
10
.29
9
.58
8
.23
8
.62
8
.28
8
.54
7
.63
9
. 1
4
8.5
7
8.9
8
9.5
9
8.2
2
7.7
4
8.2
1

Tab
le
28
Measu
rem
en
ts
of
bis
on
d
ista
l ti
bia
Cata
log
Number~ 1
S
ex
1 S
ide
3 H
I
J K
L
N5
34
06
04
1 2
7.7
5
5.5
5
5.5
0
4.3
8
5.6
5
N2
49
89
4
1 2
7.9
2
5.7
3
5.3
3
4.5
0
5.5
9
N0
16
29
7
1 2
7.7
6
5.5
9
5.5
6
5.0
2
5.9
5
N2
00
33
1
1 2
7.9
1
5.3
4
5.2
3
5.
18
5.8
6
N0
00
83
9
1 2
7.5
6
5.8
4
5.2
5
5.
10
6
.01
N
04
96
30
1
2 7
.45
5
.55
5
. 1
0
4.8
7
5.8
5
N2
51
14
7'
2 2
6.3
6
4.8
2
4.4
8
3.4
1
4.8
6
N0
63
36
3
1 2
7.3
7
5.5
6
5.1
3
4.7
0
5.7
3
N0
49
57
1
1 2
7.6
8
5.6
3
5.
16
5
.41
6
.27
N
25
07
19
2
1 6
.61
5
.02
4
.57
3
.81
4
.86
N
28
68
73
1
2 7
.77
5
.89
5
.38
5
.34
6
. 18
N
02
23
74
1
2 7
.62
5
.90
5
.43
4
.99
5
.96
N
02
23
75
1
2 7
.02
5
. 1
9
5.
11
4.2
0
5.2
8
N0
22
37
7
1 2
7.9
8
5.8
3
5.4
6
5.2
6
6.2
9
N0
22
66
3
1 2
7.6
7
5.5
4
5.4
7
5.0
0
6.0
9
N0
49
76
0
2 2
6.5
4
5.
13
4
.99
4
.21
5
.06
N
17
57
83
1
2 7
.56
5
.83
5
. 1
0
4.7
4
5.6
1
N1
97
70
5
2 2
6.8
5
5.0
6
4.8
5
4.
17
5.2
6
N0
22
66
9
2 2
7.3
4
5.3
6
5.0
8
4.2
5
5.3
9
N0
49
55
6
2 1
6.2
3
4.6
7
4.4
3
3.6
4
4.6
0
N0
49
63
1
i 2
7.6
8
5.9
0
5.2
4
4.7
1
5.5
4
N0
22
66
6
1 2
7.0
7
5.
11
5.2
3
4.7
7
5.7
2
N0
22
66
84
1 2
7.3
6
5.3
1
5.4
4
4.8
6
5.7
0
N1
76
19
4
1 2
7.
31
5
.47
5
.38
4
.88
5
.75
H
00
00
92
2
2 6
.75
4
.94
4
. 7
7
3.9
1
4.9
9
H0
20
99
5
2 1
G.5
5
5.0
4
4.6
3
3.9
0
4.9
8
M1
14
22
7
2 2
(3.
73
4
.81
4
.69
3
.95
5
.03
-~--
'H
(Harv
ard
U
niv
ers
ity
, M
use
um
o
f C
om
para
tiv
e
Zo
olo
gy
);
M
(Un
ivers
ity
o
f M
ich
igan
, M
use
um
o
f Z
oo
log
y);
N
(N
ati
on
al
Mu
seu
m
of
Natu
ral
His
tory
).
2 M
a 1
e (
1 )
; f
em a
1 e
( 2
) .
'Left
(1);
rig
ht
(2).
•P
rox
imal
ep
iph
ysis
fu
sin
g.
'Sp
ecim
en
sli
gh
tly
arth
rit
ic.

Tab
le
29
Measu
rem
en
ts
of
bis
on
p
rox
imal
meta
tars
al
Cata
log
N
um
ber
' S
ex
2 S
ide'
A
B
c
N0
49
63
1
1 2
6.0
6
5.4
7
3.0
7
N0
49
76
0
2 2
5.0
4
4.7
7
2.6
9
N1
75
78
3
1 2
6.6
8
6.1
0
3'
18
N1
97
70
5
2 2
5-
11
5.0
7
2.7
3
N0
22
66
9
2 2
5.
16
5-
18
2.6
5
N0
49
55
6
2 2
4.6
8
4.6
3
2..
45
N
15
45
70
1
2 5
.23
5
.31
2
.61
N
17
61
94
1
2 5
.56
5
.33
2
.73
N
02
26
64
1
2 5
.45
5
.50
2
.95
N
02
23
77
1
2 6
.28
5
.90
3
.02
N
28
68
73
1
2 5
.98
5
.73
3
.05
N
02
23
75
1
2 5
.57
5
.01
2
.59
N
06
33
63
1
2 6
.27
5
.26
2
.92
N
04
95
71
1
2 6
.12
5
.69
3
.04
N
25
07
19
2
2 5
.03
4
.71
2
.56
N
25
11
47
2
2 4
.85
4
.69
2
.40
N
00
08
39
1
2 5
.85
5
.55
2
.78
H
00
00
92
2
2 4
.99
4
.93
2
.46
H
02
09
95
2
2 4
.85
4
.95
2
.58
M
11
42
27
2
1 5
.30
4
.87
2
.45
'H
(Harv
ard
U
niv
ers
ity
, M
useu
m
of
Co
mp
ara
tiv
e
Zo
ol
og
y);
M
(U
niv
ers
ity
o
f M
ich
igan
, M
useu
m
of
Zo
olo
gy
);
N
(Nati
on
al
Mu
seu
m
of
Natu
ral
His
tory
).
2M
ale
(1
):
fem
ale
(2
).
3L
eft
(1
);
l'ig
ht
(2).

Tab
le
30
Measu
rem
en
ts
of
bis
on
d
ista
l m
eta
tars
al
Cata
log
N
um
ber
1 S
ex
1 S
ide
3 0
E
F
G
H
I J
N0
49
63
1
1 2
6.7
0
3.2
1
3.
12
2.8
9
2.5
3
3.9
9
3.8
2
N0
49
76
0
2 2
5.9~
2.8
3
2.7
0
2.6
2
2.4
7
3.5
6
3.4
8
N1
75
78
3
1 2
6.8
4
2.9
0
2.8
2
2.8
0
2.5
0
3.8
7
3.7
1
N1
97
70
5
2 2
6.0
8
2.7
4
2.5
8
2.7
6
2.4
6
3.6
6
3.5
1
N0
22
66
9
2 2
6.3
5
3.
13
2.9
0
2.9
0
2.5
4
3.8
5
3.6
8
N0
49
55
6
2 2
5.4
3
2.4
6
2.3
9
2.3
9
2.
19
3.3
3
3.2
1
N1
54
57
0
1 2
6.2
1
3.0
2
2.8
7
2.7
0
2.4
9
3.8
1
3.6
1
N1
76
i94
1
2 6
.44
3
.08
2
.92
2
.82
2
.58
3
.75
3
.64
N
02
26
64
1
2 6
.37
3
.22
3
.00
2
.98
2
.62
3
.95
3
.68
N
02
23
77
1
2 6
.81
3
.36
3
. 1
8
3.2
3
2.9
1
4.2
8
4.
17
N
28
68
73
1
2 6
.86
3
.20
3
.06
2
.92
2
.64
4
. 1
5
3.9
2
N0
22
37
5
i 2
6.
14
2.9
6
2.8
5
2.8
5
2.5
7
3.7
5
3.5
7
N0
63
36
3
1 2
6.6
0
3.0
2
2.8
5
2.8
0
2.3
9
3.6
7
3.4
6
N0
49
57
1
1 2
6.9
1
3.
17
3.0
3
2.9
4
2.6
2
4.0
4
~~.
85
N
25
07
19
2
2 5
.61
2
.72
2
.48
2
.64
2
.29
3
.48
3
.32
N
25
11
47
2
2 5
.80
2
.67
2
.56
2
.61
2
.37
3
.56
3
.31
N
00
08
39
1
2 6
.88
3
.32
3
. 18
3
.08
2
.80
4
. 1
0
3.8
8
H0
00
09
2
2 2
5.8
7
2.8
8
2.7
6
2.6
7
2.5
1
3.6
1
3.5
1
H0
20
99
5
2 2
5.7
0
----
----
----
----
----
----
Mi1
42
27
' 2
1 6
.22
2
.90
2
.72
2
.68
2
.33
3
.60
3
.35
-~--------------
L_
__
_.
L_
_._
___ ~--
-,_
-L
...
1H
(H
arv
ard
U
niv
ers
ity
, M
use
um
o
f C
om
para
tiv
e
Zo
olo
gy
);
M (
Un
ivers
ity
o
f M
ich
igan
, M
use
um
o
f Z
oo
log
y);
N
(N
ati
on
al
Mus
eum
o
f N
atu
ral
His
tory
).
"Male
(1
);
fem
ale
(2
).
3L
eft
(1
);
rig
ht
(2).
•s
pecim
en
sli
gh
tly
arth
rit
ic.

Tab
le
31
Eff
ecti
ven
ess
of
crit
eria
fo
r se
xin
g
fro
nt-
lim
b
ele
men
ts
of
mo
der
n
bis
on
PH
DH
PR
DR
PMc
DM
c
CI
R'
c R
c
R
c R
c
R
c R
A:B
G
I:J
G
A
:B
G
G:H
F
A:B
F
D:E
G
A
:C
G
I:
K
F A
:C
G
G:
I F
A:C
G
D
:F
G
A:D
G
I:
L
G
A:D
G
G
:J
F B
:C
F D
:G
F A
:E
G
I: M
G
A
:E
F G
:K
G
--
D:H
F
A:F
G
I:
N
F A
:F
p H
: I
F -
-D
: I
F A
:G
G
I: 0
G
B
:C
G
H:J
p
--
D:J
F
A:H
G
J:
K
G
B:D
G
H
:K
G
--
E:F
G
B
:C
F J:
L
G
B:E
F
I:J
p
--
E:G
F
B:D
F
J:
M
G
B:F
F
I: K
G
-
-E
:H
F B
:E
F J:
N
G
C:D
G
J:
K
F -
-E
:I
F B
:F
G
J:O
G
C
:E
F -
--
-E
:J
F B
:G
G
K:L
F
C:F
F
--
--
F:G
F
B:H
G
K
:M
F D
:E
F -
--
-F
:H
G
C:D
G
K
:N
F D
:F
F -
--
-F
:I
G
C:E
F
K:O
p
E:F
p
--
--
F:J
F
C:F
G
L
:M
G
--
--
--
G:H
p
C:G
G
L
:N
G
--
--
--
G:
I F
C:H
G
L
:O
G
--
--
--
G:J
F
D:E
G
M
:N
p -
--
--
-H
: I
F D
:F
G
M:O
F
--
--
--
H:J
F
D:G
G
N
:O
p -
--
--
-I:J
F
D:H
F
E:F
G
E
:G
G
E:H
G
F
:G
G
F:H
G
G
:H
G
IC
(Cri
teri
a;
co
lon
d
en
ote
s cro
ssp
lot)
. z R
(R
ati
ng
: G
, g
oo
d;
F'
fair
; P
, p
oo
r).

Tab
le
32
Eff
ecti
ven
ess
of
crit
eria
fo
r se
xin
g
rear-
lim
b
ele
men
ts
of
mo
der
n
bis
on
PF
O
F PT
D
T
c~
R 2
c R
c
R
c
A:B
G
H
: I
G
A:B
G
H
: I
A:C
G
H
:J
G
A:C
G
H
:J
A:D
G
H
:K
G
A:I
J G
H
:K
A:E
F
H:L
G
A
:E
G
H:L
A
:F
F H
:M
G
A:F
G
I:
J
A:G
G
H
:N
G
A:G
G
I:
K
B:C
p
H:O
F
B:C
p
I:L
B
:D
G
I:J
G
8
:[)
p J:
K
B:E
p
I: K
G
B
:E
G
J:L
B
:F
F I:
L
G
B:F
p
K:L
B
:G
F I:
M
G
B:G
p
-C
:D
p I:
N
G
C:D
p
-C
:E
p I:
0 F
C:E
G
-
C:F
p
J:K
p
C:F
G
-
C:G
p
J:L
p
C:G
p
-
D:E
p
J:M
p
D:E
G
-
D:F
F
J:N
p
D:F
p
-D
:G
p J:
O
p O
:G
p -
E:F
p
K:L
p
E:F
G
-
E:G
p
K:M
p
E:G
G
-
F:G
p
K:N
p
F:G
p
--
-K
:O
p -
--
--
L:M
F
-
--
--
L:N
p
--
--
-L
:O
p -
--
--
M:N
p
--
--
-M
:O
F -
--
--
N:O
p
--
-
R
F F F G
p p p p p p - - - - - - - - - - - - - - - - - -
1C
(C
rite
ria;
co
lon
d
en
ote
s cro
ssp
lot)
. 2R
(R
ati
ng
: G
, g
oo
d;
F,
fair
; P
, p
oo
r).
PMt
DM
t
c R
c
R
A:B
p
D:E
p
A:C
p
D:F
p
B:C
p
D:G
p
--
O:H
p
--
D:
I p
--
O:J
p
--
E:F
p
--
E:G
p
--
E:H
p
--
E:I
p
--
E:J
p
--
F:G
p
--
F :H
p
--
F:I
p
--
F:J
p
--
G:H
p
--
G:
I p
--
G:J
p
--
H:
I p
--
H:J
p
--
I:J
F
--
--
--
--
--
--
--
--
--
--
--
--
--
--

References
Allen, C. E., D. C. Beitz, D. A. Cramer, and R. G. Kauffman. 1976. Biology of fat in meat animals. North Central Regional Research Publication 234. Madison: University of Wisconsin, College of Agricultural and Life Sciences.
Allen, Durward L. 1979. Wolves of Minong. Boston: Houghton Mifflin.
Anderson, A. E., D. E. Medin, and D. C. Bowden. 1972. Indices of carcass fat in a Colorado mule deer population. Journal of Wildlife Management 36(2):579-94.
Arasu, P., R. A. Field, w. G. Kruggel, and G. J. Miller. 1981. Nucleic acid content of bovine bone marrow, muscle and mechanically deboned beef. Journal of Food Science 46(4): 1114-16.
Arthur, George W. 1975. An introduction to the eco~ of early historic communal bison hunting among the Northern Plains Indians. Mercury Series, Archaeological Survey of Canada Paper 37. Ottawa: National Museum of Man.
Baerreis, David A., and Reid A. Bryson. 1966. Dating the Panhandle Aspect cultures. Oklahoma Anthropological Society Bulletin 14:105-16.
Baker, G., L. H. P. Jones, and I. D. Wardrop. 1959. Cause of wear in sheeps' teeth. Nature 184:1583-84.
Baker, Maurice F., and Francis X. Lueth. 1967. Mandibular cavity tissue as a possible indicator of condition in deer. Southeastern Association of Game and Fish Commissioners, Annual Conference Proceedings-20:69-74.

References - 208
Barnes, Richard H. 1976. Energy. In Present knowledge in nutrition, 4th ed., ed. D. M. Hegsted et al., pp. 1G=16. New York: Nutrition Foundation.
Bedard, Jean N. 1974. Morphological variation in bison metacarpals and metatarsals. In The Casper Site, ed. George C. Frison, pp. 199-240. New York: Academic Press .
. 1978. A technique for sex determination of mature ----~~ bison metapodials. Plains Anthropologist Memoir
14:40-43.
Behrensmeyer, Anna K. 1975. The taphonomy and paleoecology of Plio-Pleistocene vertebrate assemblages east of Lake Rudolf, Kenya. Harvard University, Museum £f Comparative Zoology Bulletin 146(10) :473-578.
Bell, Robert E. 1958. ~guide to the identification£! certain American Indian projectile points. Special Bulletin 1. Oklahoma City: Oklahoma Anthropological Society.
Bender, Margaret M. 1968. Mass spectrometric studies of carbon 13 variations in corn and other grasses. Radiocarbon 10(2):468-72.
Bigwood, E. J., ed. 1972. Protein and amino acid functions. Oxford: Pergamon Press.
Binford, Lewis R. 1978. Nunamiut ethnoarchaeology. New York: Academic Press .
. 1981. Bones: Ancient men and modern myth~. New ----=Y-ork: Academic Press.
Binford, Lewis R., and Jack B. Bertram. 1977. Bone frequencies--and attritional processes. In For theory building iQ archaeology, ed. Lewis R. Binford, pp. 77-153. New York: Academic Press.
Boggino, Eloy J. A. 1970. Chemical composition and in vitro dry matter digestibility of range grasses. M.S. thesis, Animal Science, New Mexico State University.
Borchert, John R. 1950. The climate of the central North American grassland. Annals of the Association of American Geographers 40(1):1-39-.--

References - 209
Brain, C. K. 1967. Hottentot food remains and their meaning in the interpretation of fossil bone assemblages. Namib Desert Research Station Scientific Papers 32:1-11.
______ . 1980. Some criteria for the recognition of bonecollecting agencies in African caves. In Fossils in the makinq, ed. Anna K. Behrensmeyer and Andrew P. Hill, pp. 107-30. Chicago: University of Chicago Press.
1981. The hunters or the hunted? An introduction to African cave taphonomy-.- Chicago: University of ChicagoPress.
Brooks, P. M. 1978. Relationship between body condition and age, growth, reproduction and social status in impala, and its application to management. South African Jour-nal~ Wildlif~ Research 8(4):151-57-.---- ----
Brooks, P. M., J. Hanks, and J. V. Ludbrook. 1977. Bone marrow as an index of condition in African ungulates. South African Journal of Wildlife Research 7(2):61-66.
Brown, Christopher L., and Carl E. Gustafson. 1979. ~~to postcranial skeletal remains of cattle/bison, elk, and horse. Reports of Investigations 57. Pullman: Washington State University Laboratory of Anthropology.
Bryson, R. A., D. A. Baerreis, and W. M. Wendland. 1970. The character of late glacial and post-glacial climatic changes. In Pleistocene and Recent environments of the central Great Plains, ed. Wakefield Dort, Jr., an~--J. Knox Jones, Jr., pp. 53-74. Lawrence: University Press of Kansas.
Buffington, Lee C., and Carlton H. Herbel. 1965. Vegetational changes on a semidesert grassland range from 1858 to 1963. Ecological Monographs 35(2):139-64.
Bureau of Land Management. 1979. East Roswell grazing environmental statement. United States Department of the Interior, Bureau of Land Management, Roswell District, New Mexico.
Castetter, Edward F. 1956. The vegetation~ New Mexico. Annual Research Lecture~ Albuquerque: University of New Mexico.
Caswell, H., F. Reed, S. N. Stephenson, and P. A. Werner. 1973. Photosynthetic pathways and selective herbivory: A hypothesis. American Naturalist 107(956):465-80.

References - 210
Chaney , Margaret S . , and Marga ret L . R o s s . 1 9 7 1 . Nut r i t i on . 8th ed. Boston: Houghton Mifflin.
Collins, Michael B. 1966. The Andrews Lake Sites: Evidence of semi-sedentary prehistoric occupation in Andrews County, Texas. Midland Archaeological Society Bulletin 1:27-43 .
---- . 1971. A review of Llano Estacado archeology and eth-nohistory. Plains Anthropologist 16:85-104.
Colorado State University Extension Service. 1981. Handbook Qi Colorado native grasses. Bulletin 450-A. Fort Collins: Colorado State University Extension Service.
Cook, C. W., R. D. Child, and L. L. Larson. 1977. Digestible protein ~ range forages as an index to nutrient content and animal response. Science Series 29. Fort Collins: Colorado State University Range Science Department.
Cordell, Linda S. 1980. Prehistoric climate and agriculture. In Tijeras Canyon: Analysis of the past, ed. Linda S. Cordell, pp. 60-70. Albuquerque: University of New Mexico Press.
Coues, Elliott, ed. 1893. The history of the Lewis and Clark Expedition, vol. 1. New York: Francis _P. Harper.
------=· 1897. The manuscript journals of Alexander Henry and of David Thompson, 1799-1£1!, vol. 2. New York: Francis P. Harper.
1898. The journal of Jacob Fowler. New York: Francis P. Harper.
Coupland, Robert T. 1958. The effects of fluctuations in weather upon the grasslands of the Great Plains. Botanical Review 24{5):273-317.
Court, Arnold. 1974. The climate of the conterminous United States. In World survey of climatology, vol. 11, Climates of North America, ed. R. A. Bryson and F. K. Hare, pp.--193-266. Amsterdam: Elsevier Scientific Publishing Company.
Covert, Herbert H., and Richard F. Kay. 1981. Dental microwear and diet: Implications for determining the feeding behaviors of extinct primates, with a comment on the dietary pattern of Sivapithecus. American Journal of Physical Anthropologv 55:331-36.

References - 211
Damon, P. E., C. W. Ferguson, A. Long, and E. I. Wallick. 1974. Dendrochronologic calibration of the radiocarbon time scale. American Antiquity 39(2) :350-66.
Davies, Owen L., ed. and production.
1961. Statistical methods in research New York: Hafner.
Dean, JeffreyS., and William J. Robinson. 1977. Dendroclimatic variability in the American Southwest, ~.Q. 680 to 1970. Final report to the National Park Service, U.S. Department of the Interior (National Technical Information Service PB-266-340).
DeNiro, Michael J., and Samuel Epstein. 1978a. Carbon isotopic evidence for different feeding patterns in two hyrax species occupying the same habitat. Science 201:906-8.
----~· 1978b. Influence of diet on the distribution of carbon isotopes in animals. Geochimica et Cosmochimica Acta 42:495-506. --
Dibble, DavidS., and Dessamae Lorrain. 1968. Bonfire Shelter: ~ stratified bison kill site, Val Verde County, Texas. Miscellaneous Paper 1. Austin: University of Texas, Texas Memorial Museum.
Dibble, Harold L., and John C. Whittaker. 1981. New experimental evidence on the relation between percussion flaking and flake variation. Journal of Archaeological Science 8:283-96.
Dietz, Albert A. 1946. Composition of normal bone marrow in rabbits. Journal of Biological Chemistry 165(2):505-11 .
. 1949. Chemical composition of normal bone marrow. ----~-Archives£! Biochemistry 23(2):211-21.
Dillehay, Tom D. 1974. Late Quaternary bison population changes on the Southern Plains. Plains Anthropologist 19:180-96.
Doliner, L. H., and P. A. Jolliffe. 1979. Ecological evidence concerning the adaptive significance of the C dicarboxylic acid pathway of photosynthesis. Oecologi~ (Berlin) 38:23-34.
Dore, W. G. 1960. Silica deposits in leaves of Canadian grasses. Annual Meeting Proceedings 6. -cuelph, Ont.: Canadian Society of Agronomy.
References - 212
Dorsey, J. Owen. 1884. Omaha sociology. Bureau of American Ethnology Annual Report 3. Washington, D.C.: Smithsonian Institution.
Downton, W. J. S. 1975. The occurrence of c4 photosynthesis among plants. Photosynthetica 9(1):96-TOS.
Draper, H. H. 1977. The aboriginal Eskimo diet in modern perspective. American Anthropologist 79:309-16.
Driesch, Angela von den. 1976. ~guide to the measurement of an irnal_ bones from archaeological sites. Peabody Museum Bulletin 1. Cambridge: Harvard University, Peabody Museum of Archaeology and Ethnology.
Duffield, Lathel Flay. 1970. Some Panhandle Aspect sites: Their vertebrates and paleoecology. Ph.D. diss., Department of Anthropology, University of Wisconsin.
----~· 1973. Aging and sexing the post-cranial skeleton of bison. Plains Anthropologist 18(60): 132-39.
Earl of Southesk. 1969. Saskatchewan and the Rocky Mountains: ~ diary and narrative of travel, sport, and adventure, during~ journey through the Hudson'~ Bay Com~~~ territories, in 1859 and 1860. Rutland, Vt.: Charles E. Tuttle.
Eickmeier, W. G. 1978. Photosynthetic pathway distributions along an aridity gradient in Big Bend National Park, and implications for enhanced resource partitioning. Photosynthetica 12(3):290-97.
Empel, Wojciech, and Tadeusz Roskosz. 1963. Das Skelett der Gliedmassen des Wisents, Bison bonasus {Linnaeus, 1758). Acta Theriologica 7(13):259-99$
Ewers, John C. 1955. The horse in Blackfoot Indian culture. Bureau of American Ethnology-Bulletin 159. Washington, D.C.: Smithsonian Institution .
. 1958. The Blackfeet. Norman: University of Oklahoma --=P-ress.
Field, R. A. 1976. Increased animal protein production with mechanical deboners. World Review of Animal Production 12(1):61-73. -- -
References - 213
Field, R. A., H. M. Sanchez, T. H. Ji, Y.-0. Chang, and F. C. Smith. 1978. Amino acid analysis and acrylamide gel electrophoresis patterns of bovine hemopoietic marrow. Journal of Agriculture and Food Chemistry 26(4) :851-54.
Field, R. A., L. R. Sanchez, J. E. Kunsman, and w. G. Kruggel. 1980. Heme pigment content of bovine hemopoietic marrow and muscle. Journal of Food Science 45(5): 1109-12.
Fletcher, Alice C., and Francis La Flesche. 1972. The Omaha tribe, vol. 1. Lincoln: University of Nebraska Press:-
Food and Agriculture Organization. 1977. Dietary fats and oils in human nutrition. Food and Nutrition Paper 3. Rome:-united Nations Food and Agriculture Organization.
Francis, R. C., and M. Campion. 1972. Statistical analysis 2f intraseasonal herbage dynamics ~ ~ variety of grassland communities. US/IBP Grassland Biome Technical Report 141. Fort Collins: Colorado State University.
Franzmann, Albert W., and Paul D. Arneson. 1976. Marrow fat in Alaskan moose femurs in relation to mortality factors. Journal of Wildlife Management 40(2):336-39.
Frison, George C. 1970. The Glenrock Buffalo Jump, 48C0304: Late prehistoric period buffalo procurement and butchering on the northwestern Plains. Plains Anthropologist Memoir 7:1-66.
______ . 1973. The Wardell Buffalo Trap 48 SU 301: Communal procurement in the ~Green River basin, Wyoming. Anthropological Paper 48. Ann Arbor: University of Michigan Museum of Anthropology.
______ , ed. 1974. The Casper Site. New York: Academic Press.
______ . 1978. Prehistoric hunters of the High Plains. New York: Academic Press.
Frison, George C., M. Wilson, and D. J. Wilson. 1976. Fossil bison and artifacts from an early Altithermal period arroyo trap in Wyoming. American Antiquity 41(1):28-57.
Fuller, W. A. 1961. The ecology and management of the American bison. La Terre et la Vie 108(2-3):286-304.

References - 214
Gay, Charles W., Jr., and Don D. Dwyer. 1970. New Mexico range plants. Cooperative Extension Service Circular 374. Las Cruces: New Mexico State University.
Gelfand, R. A., R. G. Hendler, and R. S. Sherwin. 1979. Dietary carbohydrate and metabolism of ingested protein. Lancet 1:65-68.
Getty, Robert. 1975. Sisson and Grossman'~ the anatomy of the domestic animals. 5th ed. Philadelphia: W. B. Saunders.
Goodhart; Robert S., and Maurice E. Shils, eds. 1980. Modern nutrition in health and disease. 6th ed. Philadelphia: Lea and Febiger.
Grinnell, George Bird. 1972. The Cheyenne Indians, vol. 1. Lincoln: University of Nebraska Press.
Gunnerson, Dolores A. 1972. Man and bison on the Plains in the protohistoric period. Plains Anthropologist 17(55): 1-10.
Guthrie, Helen A. 1975. Introductory nutrition. 3d ed. Saint Louis: C. V. Mosby.
Halloran, Arthur F. 1961. American bison weights and measurements from the Wichita Mountains Wildlife Refuge. Proceedings Qi the Oklahoma Academy of Science 41:212-18 .
. 1968. Bison (Bovidae) productivity on ~ne Wichita -----Mountains Wildlife Refuge, Oklahoma. Southwestern Naturalist 13(1):23-260
Halloran, Arthur F., and Bryan P. Glass. 1959. The carnivores and ungulates of the Wichita Mountains Wildlife Refuge, Oklahoma. Journal Qf Mammalogy 40(3):360-70.
Hammond, George P., and Agapito Rey. 1966. The rediscovery of New Mexico, 1580-1594. Albuquerque: University of New Mexico Press:-- ----
Handreck, K. A., and L. H. P. Jones. 1968. Studies of silica in the oat plant. IV, Silica content of plant parts in relation to stage of growth, supply of silica, and transpiration. Plant and Soil 29(3):449-59.
Harris, Dave. 1945. Symptoms of malnutrition in deer. Journal of Wildlife Management 9(4):319-22.

References - 215
Hatch, M. D., C. R. Slack, and H. S. Johnson. 1967. Further studies on a new pathway of photosynthetic carbon dioxide fixation in sugar-cane and its occurrence in other plant species. Biochemistry Journal 102:417-22.
Healy, W. B. 1973. Nutritional aspects of soil ingestion by grazing animals. In Chemistry and biochemistry 2f herbage, vol. 1, ed. G. w. Butler and R. W. Bailey, pp. 567-88. New York: Academic Press.
Herbel, C. H., F. N. Ares, and R. A. Wright. effects on a semidesert grassland range. 53(6):1084-93.
1972. Drought Ecology
Houghton, Frank E. 1974. The climate of New Mexico. In Climates of the states, vol. 2, Western states, by Officials of the United States National Oceanic and Atmospheric Administration, pp. 794-810. Port Washington, N.Y.: Water Information Center.
Humphrey, Robert R. 1958. The desert grassland: A history of vegetational change and an analysis of causes. Botanical Review 24(4):193-252.
______ . 1962. Range ecology. New York: Ronald Press.
Hungate, R. E. 1975. The rumen microbial ecosystem. Annual Review of Ecology and Systematics 6:39-66.
Hunsley, R. E., R. L. Vetter, E. A. Kline, and W. Burroughs. 1971. Effects of age and sex on quality, tenderness and collagen content of bovine longissimus muscle. Journal of Animal Science 33(5):933-38.
Irving, L., K. Schmidt-Nielsen, and N. S. B. Abrahamsen. 1957. On the melting points of animal fats in cold climates. Physiological Zoology 30(2):93-105.
Jelinek, Arthur J. 1967. ~prehistoric sequence in the Middle Pecos Valley, New Mexico. Anthropological Paper 31. Ann Arbor: University of Michigan Museum of Anthropology.
Jenness, Diamond. 1923. Report of the Canadian Arctic Expedition, lZll-~ (Southern Party, 1913-1916), vol. 12, The Copper Eskimos. Ottawa: F. A. Acland.
Jochim, Michael A. 1976. Hunter-gatherer subsistence and settlement: ~predictive model. New York: Academ~ Press.

References - 216
______ . 1981. Strategies for survival. New York: Academic Press.
Johnston, A., L. M. Bezeau, and S. Smoliak. 1967. Variation in silica content of range grasses. Canadian Journal of Plant Science 47(1):65-71.
Jones, L. H. P., and K. A. Handreck. 1967. Silica in soils, plants, and animals. Advances in Agronomy 19:107-49.
Kelley, Vincent C. 1971. Geology Qf the Pecos country, southeastern New Mexico. Memoir 24. Socorro: New Mexico State Bureau of Mines and Mineral Resources.
Knox, J. H., J. W. Benner, and w. E. Watkins. 1941. Seasonal calcium and phosphorus requirements of range cattle, as shown ~ blood analyses. Agricultural Experiment Station Bulletin 282. Las Cruces: New Mexico College of Agriculture and Mechanic Arts.
Kobryn, Henryk. 1973. The thorax in European bison and other ruminants. Acta Theriologica 18(17):313-41.
Kobrynczuk, Franciszek. 1976. Joints and ligaments of hindlimbs of the European bison in its postnatal development. Acta Theriologica 21(4):37-100.
Kobrynczuk, Franciszek, and Henryk Kobryn. 1973. Postembryonic growth of bones of the autopodia in the European bison. Acta Theriologica 18(16):289-311.
K0chler, A. W. 1964. Potential natural vegetation of the conterminous United States. Special publication 36. Washington, D.C.: American Geographical Society.
Kunsman, J. E., M.A. Collins, R. A. Field, and G. J. Miller. 1981. Cholesterol content of beef bone marrow and mechanically deboned meat. Journal of Food Science 46: 1785-88. - --
LaMarche, Valmore C., Jr. 1974. Paleoclimatic inferences from long tree-ring records. Science 183:1043-48.
Lamb, H. H. 1977. Climate: Present, past and future, vol. 2, Climatic history and the future. London: Methuen.
Land, L. S., E. L. Lundelius, Jr., and S. Valastro, Jr. 1980. Isotope ecology of deer bones. Palaeogeography, Palaeoclimatology, Palaeoecology 32:143-51.

References - 217
Lee, Richard B. 1972. The !Kung Bushmen of Botswana. In Hunters and gatherers today, ed. M. G. Bicchieri, pp. 327-68. New York: Holt, Rinehart and Winston.
Lewin, Joyce, and B. E. F. Reimann. 1969. Silicon and plant growth. Annual Review £! Pla~ Physiology 20:289-304.
Link, B. A., R. W. Bray, R. G. Cassens, and R. G. Kauffman. 1970a. Lipid deposition in bovine skeletal muscle during growth. Journal of Animal Science 30:6-9.
----~· 1970b. Fatty acid composition of bovine subcutaneous adipose tissue lipids during growth. Journal £! Animal Science 30:722-25.
______ . 1970c. Fatty acid composition of bovine skeletal muscle lipids during growth. Journal of Animal Science 30:726-31.
Link, B. A., R. G. Cassens, R. G. Kauffman, and R. W. Bray. 1970. Changes in the solubility of bovine muscle proteins during growth. Journal £i Animal Science 30:10-14.
Long, Austin, and Bruce Rippeteau. 1974. Testing contemporaneity and averaging radiocarbon dates. American Antiquity 39:205-15.
Lorrain, Dessamae. 1968. Analysis of the bison bones from Bonfire Shelter. In Bonfire Shelter: A stratified bison kill site, Val Verde County, Texas, by-David Dibble~ Dessamae Lorrain, pp. 77-138. Miscellaneous Paper 1. Austin: University of Texas, Texas Memorial Museum.
Lott, Dale F. 1974. Sexual and aggressive behavior of adult male American bison (Bison bison). In The behaviour of ungulates and its relatiOn to managemen~vol. 1, ed.-v. Geist and F. Walther, pp. 382-94. Publication 24. Morges, Switzerland: International Union for Conservation of Nature and Natural Resources.
______ . 1979. Dominance relations and breeding rate in mature male American bison. Zeitschrift fur Tierpsychologie 49:418-32.
Lyman, R. Lee. 1978. Prehistoric butchering techniques in the Lower Granite Reservoir, southeastern Washington. Tebiwa 13:1-25.

References - 218
Lynott, Mark J. 1980. Prehistoric bison populations of northcentral Texas. Texas Archaeological Society Bul-letin 50:89-101. ---
McHugh, Tom. 1958. Social behavior of the American buffalo (Bison bison bison). Zoologica 43(1):1-40 .
. 1972. The time of the buffalo. Lincoln: University -----o~f Nebraska Press. --
Marcy, Randolph B. 1863. The prairie traveler: A handbook for overland expeditions. London: Trubner.
Marks, Stuart A. 1976. Large mammals and .9_ brave people: Subsistence hunters in Zambia. Seattle: University of Washington Press.
Martin, John T. 1977. Fat reserves of the wild rabbit, Oryctolagus cuniculus (L.). Australian Journal of Zoology 25:631-39.
Mason, Otis Tufton. 1894. North American bows, arrows and quivers. Smithsonian Institution Annual Report for 1893, pp. 631-80.
Matthews, Washington. 1877. Ethnography and philology of the Hidatsa Indians. Miscellaneous Publication 7. Washington, D.C.: United States Geological and Geographical Survey.
Meagher, Margaret M. 1973. The bison of Yellowstone National Park. Scientific Monograph Series 1. Washington, D.C.: National Park Service.
Medicine Crow, Joe. 1978. Notes on Crow Indian buffalo jump traditions. Plains Anthropologist Memoir 14:249~53.
Meng, M.S., G. C. West, and L. Irving. 1969. Fatty acid composition of caribou bone marrow. Comparative Biochemistry and Physiology 30:187-91.
Merwe, N. J. van der, A. C. Roosevelt, and J. C. Vogel. 1981. Isotopic evidence for prehistoric subsistence change at Parmana, Venezuela. Nature 292:536-38.
1 3 Merwe, N. J. van der, and J. C. Vogel. 1978. C content of human collagen as a measure of prehistoric diet in woodland North America. Nature 276:815-16.

References - 219
Minnis, Paul E. 1981. Economic and organizational responses to food stress by non-stratified societies: An example from prehistoric New Mexico. Ph.D. diss., Department of Anthropology, University of Michigan.
Minson, D. J., and M. N. McLeod. 1970. The digestibility of temperate and tropical grasses. Proceedings of the International Grassland Congress 11:719-22.
Misra, Gopa, and K. P. Singh. 1978. Some aspects of physiological ecology o~ C~ and c4 grasses. In Glimpses Qf ecology, ed. J. s. S1ngn and B. Gopal, pp. 201-5. Jaipur, India: Internati0nal Scientific Publications.
Munro, H. N. 1964. General aspects of the regulation of protein metabolism by diet and by hormones$ In Mammalian protein metabolism, vol. 1, ed. H. N. Munro and J. B. Allison, pp. 381-481. New York: Academic Press.
National Research Council. 1969. United States-Canadian tables of feed composition. Publication 1684. Washington, D.C.: National Academy of Sciences.
_______ . 1971. Atlas of nutritional data on United States and Canadian feeds. -washington, D.~National Academy o-f-Sciences.
Nelson, Enoch w. 1934. The influence of precipitation and grazing upon black grama grass range. Technical Bulletin 409. Washington, D.C.: U.S. Department of Agriculture.
Nelson, Richard K. 1973. Hunters of the northern forest: Designs for survival among the AiaSkan Kutchin. Chicago: University of Chicago Press.
Neuenschwander, L. F., S. H. Sharrow, and H. A. Wright. 1975. Review of tobosa grass (Hilaria mutica). Southwestern Naturalist 20(2):255-63.
Neumann, A. L., and Roscoe R. Snapp. 1969. Beef cattle. 6th ed. New York: John Wiley.
Newlin, H. E., and C. M. McCay. 1948. Bone marrow for fat storage in rabbits. Archives of Biochemistry 17(1):125-28.

References - 220
Nichols, Robert G., and Michael R. Pelton. 1972. Variations in fat levels of mandibular cavity tissue in white-tail deer (Odocoileus virginianus) in Tennessee. Southeastern Association of Game and Fish Commissioners, Annual conference Proceedings-26:57-68 .
. 1974. Fat in the mandibular cavity as an indicator -----o~f condition in deer. Southeastern Association of Game
and Fish Commissioners, Annual Conference Proceedings--28:540-48.
Nietschmann, Bernard. 1973. Between land and water: The subsistence ecology of the Miskito India~ eastern Nicaragua. New York: Seminar Press.
Nordan, H. C., I. MeT. Cowan, and A. J. Wood. 1968. Nutritional requirements and growth of black-tailed deer, Odocoileus hemionus columbianus, in captivity. Symposium of the Zoological Society of London 21:89-96.
Novakowski, N. S. 1965. Cemental deposition as an age criterion in bison, and the relation of incisor wear, eye-lens weight, and dressed bison carcass weight to age. Canadian Journal of Zoology 43:173-78.
Olsen, Stanley J. 1960. Postcranial skeletal characters of Bison and Bos. Harvard University Paper 35(4). Cambridge: Peabody Museum of Archaeology and Ethnology.
Opler, Morris Edward. 1965. An Apache life-way. New York: Cooper Square Publishers.
Paulsen, Harold A., Jr., and Fred N. Ares. 1962. Grazing values and management of black grama and tobosa grasslands and associated shrub ranges of the Southwest. Forest Service Technical Bulletin 1270. Washington, D.C.: U.S. Department of Agriculture.
Payne, Sebastian. 1969. A metrical distinction between sheep and goat metacarpals. In The domestication and exploitation of plants and animals, ed. Peter ~Ucko and G. W. Dimbleby, pp. 295-306. Chicago: Aldine.
Peden, Donald G. 1972. The trophic relations of Bison bison to the shortgrass plains. Ph.D. diss., Ecology, Colorado State University .
. 1976. Botanical composition of bison diets on short--------grass plains. American Midland Naturalist 96(1) :225-29.

References - 221
Peret, Jean, and Raymond Jacquot. 1972. Nitrogen excretion in complete fasting and on a nitrogen-free diet-endogenous nitrogen. In Protein and amino acid functions, ed. E. J. Bigwood, pp. 73-TTS.--oxford: Pergamon Press.
Peters, H. F. 1958. A feedlot study of bison, cattalo and Hereford calves. Canadian Journal of Animal Science ---38:87-90.
Peterson, Rolf 0. 1977. Wolf ecology and~ relationships on Isle Royale. Scientific Monograph Series 11. Washington, D.C.: National Park Service.
Phillips, Paul C., ed. 1940~ Life in the Rocky Mountains, by W. A. Ferris. Denver: Old West Publishing Company.
Phillips Petroleum Company. 1963. Pasture and range plants. Bartlesville, Okla.: Phillips. ---
Pieper, Rex D. 1977. Effects of herbivores on nutrient cycling and distribution. United States/Australia Rangeland Panel Proceedings 2:249-75.
Pieper, R. D., et al. 1978. Chemical composition and digestibility of important range grass species in southcentral New Mexico. Agricultural Experiment Station Bullet-in- 662~ Las Cruces: New Mexico State University.
Point, Nicolas. 1967. Wilderness kingdom. New York: Holt, Rinehart and Winston.
Pond, Caroline M. 1978. Morphological aspects and the ecological and mechanical consequences of fat deposition in wild vertebrates. Annual Review of Ecology and ~tematics 9:519-70.
Raab, L. M., R. F. Cande, and D. W. Stahle. 1979. Debitage graphs and archaic settlement patterns in the Arkansas Ozarks. Mid-Continental Journal of Archaeology 4(2):167-82.
Ralph, E. K., H. N. Michael, and M. C. Han. 1973. Radiocarbon dates and reality. MASCA Newsletter 9:1-20.
Ransom, A. Brian. 1965. Kidney and marrow fat as indicators of white-tailed deer condition. Journal of Wildlife Management 29(2):397-98.

References - 222
Rasmussen, J. L., G. Bertolin, and G. F. Almeyda. 1971. Grassland climatology Q! the Pawnee Grassland. US/IBP Grassland Biome Technical Report 127. Fort Collins: Colorado State University.
Ratcliffe, Philip R. 1980. Bone marrow fat as an indicator of condition in Roe deer. Acta Theriologica 25(26):333-40. --
Read, Catherine E. 1971. Animal bones and human behavior: Approaches to faunal analysis in archeology. Ph.D. diss., Department of Anthropology, University of CalifoLnia, Los Angeles.
Redetzke, Keith A., and Leonard F. Paur. 1975. Long-term grazing intensity data from the Great Plains. DSlfBP Grassland Biome Technical Report 272. Fort Collins: Colorado State University.
Reher, Charles A. 1974. Population study of the Casper Site bison. In The Casper Site, ed. George c. Frison, pp. 113-24. New York: Academic Press.
Reher, Charles A., and George C. Frison. 1980. The Vore Site, 48CK302, a stratified buffalo jump in the Wyoming Black Hills. Plains Anthropologist Memoir 16:1-190.
Rice, R. w., J. G. Morris, B. T. Maeda, and R. L. Baldwin. 1974. Simulation of animal functions in models of production systems: Ruminants on the range. Federation Proceedings 33(2):188-95.
Richardson, D. P., A. H. Wayler, N. S. Scrimshaw, and v. R. Young. 1979. Quantitative effect of an isoenergetic exchange of fat for carbohydrate on dietary protein. American Journal of Clinical Nutrition 32:2217-26.
Riney, T. 1955. Evaluating condition of free-ranging red deer (Cervus elaphus), with special reference to New Zealand. New Zealand Journal of Science and Technology 36(5) :429-63.
Robbins, Charles T., and Barbara L. Robbins. 1979. Fetal and neonatal growth patterns and maternal reproductive effort in ungulates and subungulates. American Naturalist 114(1):101-16.
Rodgers, Joseph D. 1966. Seasonal protein content of some important range grasses in Lynn County, Texas. M.S. thesis, Range Management, Texas Technological College.

References - 223
Roe, Frank G. 1972. The North American buffalo. 2d ed. Newton Abbot: David-and Charles.
Rogers, Edward S. 1972. The Mistassini Cree. In Hunters and gatherers today, ed. M. G. Bicchieri, pp. 90-137. New-York: Holt, Rinehart and Winston.
Rose, Martin R., JeffreyS. Dean, and William J. Robinson. 1981. The past climate of Arroyo Hondo, New Mexico, reconstructed from tree rings. Arroyo Hondo Archaeological Series 4. Santa Fe: School of American Research.
Sanchez, W. A., and J. E. Kutzbach. 1974. Climate of the American tropics and subtropics in the 1960s and possible comparisons with climatic variations of the last millennium. Quaternary Research 4:128-35.
Secoy, F. R. 1953. Changing military patterns on the Great Plains. American Ethnological Society Monograph -2-,-.-Seattle: University of Washington Press.
Shelford, Victor E. 1963. The ecology Q! North America. Urbana: University of Illinois Press.
Shipman, Pat. 1981. Life history of~ fossil. Cambridge: Harvard University Press.
Sim, A. J. W., et al. 1979. Glucose promotes whole-body protein synthesis from infused aminoacids in fasting man. Lancet 1:68-72.
Sims, Phillip L., and J. s. Singh. 1978. The structure and function of ten western North American grasslands. III, Net primary production, turnover and efficiencies of energy capture and water use. Journal of Ecology 66:573-97.
Sinclair, A. R. E. 1974a. The natural regulation of buffalo populations in East Africa. I, Introduction and resource requirements. East African Wildlife Journal 12:135-54.
----~· 1974b. The natural regulation of buffalo populations in East Africa. II, Reproduction, recruitment and growth. East African Wildlife Journal 12:169-83.
----~· 1974c. The natural regulation of buffalo populations in East Africa. III, Population trends and mortality. East African Wildlife Journal 12:185-200.

References - 224
----~· 1974d. The natural regulation of buffalo populations in East Africa. IV, The food supply as a regulating factor, and competition. East African Wildlife Journal 12:291-311.
______ . 1975. The resource limitation of trophic levels in tropical grassland ecosystems. Journal of Animal EcolQSY 44(2):497-520.
----~· 1977. The African buffalo: ~study Q! resource limitation of populations. Chicago: University of Chicago Press.
Sinclair, A. R. E., and P. Duncan. 1972. Indices of condition in tropical ruminants. East African Wildlife Journal 10! 143-49.
Smiley, Francis E. 1979. An analysis of cursorial aspects of the biomechanics of the forelimb in Wyoming Holocene bison. M.A. thesis, Department of Anthropology, University of Wyoming.
Spedding, c. R. w. 1971. Grassland ecology. Oxford: Clarendon Press.
Speth, John D. 1981. The role of platform angle and core size in hard-hammer percussion flaking. Lithic TechnolQgy 10(1): 16-21.
Speth, John D., and William J. Parry. 1978. Late prehistoric bison procurement in southeastern New Mexico: The 1977 season at the Garnsey Site. Technical Report 8. Ann Arbor: University of Michigan Museum of Anthropology.
_______ . 1980. Late prehistoric bison procurement in southeastern New Mexico: The 1978 season at the Garnsey Site (LA-1839~ Technical Report 12. Ann Arbor: University or-Michigan Museum of Anthropology.
Speth, John D., and Katherine A. Spielmann. n.d. Energy source, protein metabolism and hunter-gatherer subsistence strategies. In preparation.
Spielmann, Katherine A. 1982. Inter-societal food acquisition among egalitarian societies: An ecological study of Plains-Pueblo interaction in the American Southwest. Ph.D. diss., Department of Anthropology, University of Michigan.
Stefansson, Vilhjalmur. 1925. The friendly arctic. New York: Macmillan.

References - 225
1935a. Adventures in diet, part I . Har12er'~ Magazine 171:668-75.
1935b. Adventures in diet, part I I . Har12er'.§_ Magazine 172:46-54.
1936. Adventures ln diet, part I I I . Harner's Magazine 172:178-89 .
. 1944. Arctic manual. New York: Macmillan. ---Stuiver, Minze. 1982. A high-precision calibration of the AD
radiocarbon time scale. Radiocarbon 24(1):1-26.
Sullivan, Charles H., and Harold W. Krueger. 1981. Carbon isotope analysis of separate chemical phases in modern and fossil bone. Nature 292:333-35.
Syvertsen, J. P., G. L. Nickell, R. W. Spellenberg, and G. L. Cunningham. 1976. Carbon reduction pathways and standing crop in three Chihuahuan desert plant communities. Southwestern Naturalist 21(3):311-20.
Tamers, M. A., and F. J. Pearson, Jr. 1965. Validity of radiocarbon dates on bone. Nature 208:1053-55.
1 'j
Tauber, Henrik. 1981. '-'c evidence for dietary habits of prehistoric man in Denmark. Nature 292:332-33.
Taylor, Clara M., and Orrea F. Pye. 1966. Foundations of nutrition. 6th ed. New York: Macmillan.
Teeri, J. A., and L. G. Stowe. 1976. Climatic patterns and the distribution of C~ grasses in North America. Oeco-1 og i a (Berlin) 2 3: 1-12.
Tindale, Norman B. 1972. The Pitjandjara. In Hunters and gatherers today, ed. M. G. Bicchieri, pp. 217-68. New York: Holt, Rinehart and Winston.
Todd, Lawrence C., Jr~, and Jack L. Hofman. 1978. A study of the bison mandibles from the Horner and Finley sites: Two Paleoindian bison kills in Wyoming. Wyoming Contributions to Anthropology 1:67-104.
Turner, Jack C. 1979. Adaptive strategies of selective fatty acid deposition in the bone marrow of desert bighorn sheep. Comparative Biochemistry and Physiology 62A:599-604.

References - 226
Valentine, K. A. 1970. Influence of grazing intensity on improvement Qi deteriorated black grama range. Agricul=tural Experiment Station Bulletin 553. Las Cruces: New Mexico State University.
Van Dyne, George M. 1973. Analysis of structure, function and utilization of grassland ecosystems, vol. 2. Unpublished progress report submitted to the National Science Foundation by the Natural Resource Ecology Laboratory, Colorado State University, Fort Collins.
______ . 1975. An overview £f the ecology of the Great Plains grasslands with special reference to climate and its impact. US/IBP Grassland Biome Technical Report 290. Fort Collins: Colorado State University.
Von Eschen, G. F. 1961. The climate of New Mexico. In-formation Series 3-r-:-- Albuque.rque:University Mexico, Bureau of Business Research.
Business of New
Voorhies, M. R. 1969. Taphonomy and population dynamics £! an early Pliocene vertebrate fauna, Knox County, Nebraska. Contributions to Geology, Special Paper 1. Laramie: University of Wyoming.
Walker, A., H. N. Hoeck, and L. Perez. 1978. Microwear of mammalian teeth as an indicator of diet. Science 201:908-10.
Wallace, J. D., J. C. Free, and A. H. Denham. 1972. Seasonal changes in herbage and cattle diets on sandhill grassland. Journal of Range Management 25(2):100-4.
Warren, Robert J. 1979. Physiological indices for the assessment of nutritional status in white-tailed deer. Ph~D. diss., Fisheries and Wildlife Science, Virginia Polytechnic Institute and State University.
Warren, Robert J., and Roy L. Kirkpatrick. 1978. Indices of nutritional status in cottontail rabbits fed controlled diets. Journal of Wildlife Management 42(1):154-58.
Watt, B. K., and A. L. Merrill. 1963. Composition of foods: Raw, processed, prepared. Handbook 8. Washington, D.C.: U.S. Department of Agriculture.
Weitzner, Bella. 1979. Notes on the Hidatsa Indians based on data recorded £y the late~ilbert L. Wilson. Anthropo--logical Paper 56(2). New York: American Museum of Natural History.

References - 227
Weltfish, Gene. 1965. The lost universe: Pawnee life and culture. Lincoln: University of Nebraska Press.
West, G~o:ge C., and Diane L. Shaw. 1975. Fatty acid composltlon of Dall sheep bone marrow. Comparative Biochemistry and Physiology 50B:599-601.
Wheat, Joe Ben. 1972. The Olsen-Chubbuck Site: A PaleoIndian bison kill.~emoir 26. Washington,-D~ Society-ror-American Archaeology.
White, Theodore E. 1952. Observations on the butchering technique of some aboriginal peoples, I. American Antiquity 17(4):337-38.
Willard, E. Earl, and Joseph L. Schuster. 1973. Chemical composition of six southern Great Plains grasses as related to season and precipitation. Journal Qi Range Management 26(1):37-38.
Williams, G. J., III, and J. L. Markley. 1973. The photosynthetic pathway type of North American shortgrass prairie species and some ecological implications. Photosynthetica 7(3):262-70.
Wilmsen, Edwin N. 1970. Lithic analysis and cultural inference: ~Paleo-Indian ~· Anthropological Paper 16. Tucson: University of Arizona.
Wilson, Gilbert L. 1924. The horse and the dog in Hidatsa culture. Anthropological Paper-,s(~ New York: American Museum of Natural History.
Wilson, Michael. 1980. Population dynamics of the Garnsey Site bison. In Late prehistoric bison procurement in southeastern New Mexico: The 1978 season at the Garnsey Site (LA-18399>; by John D. Speth and William J. Parry, pp. 88=12~echnical Report 12. Ann Arbor: University of Michigan Museum of Anthropology.
Wing, Elizabeth S., and Antoinette B. Brown. 1979. Paleonutrition. New York: Academic Press.
Wissler, Clark. 1910. Material culture of the Blackfoot Indians. Anthropological Paper 5(1).--New York: American Museum of Natural History.

Index
Age structure and body weight, 117 of catastrophic kills, 71 and dental attrition, 70-72 as evidence for multiple
kills, 71 and 1 i fe expectancy, 141-42 scarcity of calves, 71 scarcity of young adults, 71 and utility, 113-17 See also Bones, bison; Den--- tal attrition
Alibates chert, 38, 39, 40 Apache plume {Fallugia paradoxa),
13 Appendicular elements
criteria for sexing, 74, 76, 171-205
marrow fat in, 115-16 observed versus expected
number, 84-87 sex ratio of, 75 See also specific skeletal
elements Articular ends, bone. See
Taphonomy Artifacts
alibates chert, 38, 39, 40 bifaces, 30, 42, 43 bone tools, 30-31, 94 ceramics, 27 cores, 30 edge angles, 41-45 endscrapers, 30, 42-43 fire-cracked rock, 27 and fracture studies, 33, 35 inventory of, at Garnsey
Site, 27, 30-45
lithic sources, 36, 38-41 obsidian, 38-39 and processing, 27, 33, 35 projectile points, 30, 31,
35-37, 38, 42, 80, 82-83
resharpening flakes, 30, 42, 43
size-related attributes of, 32-35
spatial distribution, 27, 31-33, 65-66
stone choppers, 38, 94 unifacial tools 1 30, 42-43 unmodified flakes, 30, 34 utilized flakes 1 30, 42
Astragalus
Atlas
discrimination against, in cows, 101-2, 109-10
sex ratio of, 75 utility index of, 97
density of, and preservation, 57
discrimination against, in cows, 101-2, 161
as estimator of MNI, 94 sex ratio of, 75, 161 utility index of, 97
Australian aborigines, fat in diet of, 147
Axial elements criteria for sexing, 74, 76,
110 discrimination against, in
cows, 110-13 rna r row fat in , 1 1 5- 1 6 observed versus expected

Axis
number, 84-87 sex ratio of, 75, 110-13 See also Vertebrae
and sex structure, 161 utility index of, 97
Bear, as source of fat, 147 Beaver, as source of fat, 14 7,
158 Beta Analytic (Florida), 46, 47,
140 Bifaces. See Artifacts Binford, Lewis R., and utility
indexes, 87-89 passim Eisa, fat in diet of, 147 Bison
dental attrition in, 133-37 development of utility in
dexes for, 162 diet of, 118 dressed carcass weight, 88,
96, 117 lean meat of, in human diet,
151-53 life expectancy of, 141-42,
169 modern herd composition,
72-73 nonfood uses of, 2-3 nutrient requirements of,
119-21, 130 physiological condition of,
2 , 9 1 , 1 0 7- 9 , 1 3 0 pa s -s i m , 1 4 5-4 6 pa s s i m
selective hunting of bulls and cows, 1, 70-83 passim
in Southern Plains subsis-tence systems, 169-70
timing of rut, 121, 122 See also Bull groups; Bulls; --- Cow groups; Cows
Bones, bison articulated elements, 16,
25, 26, 45, 166 association with channels,
21-22 of calves, 54-56, 61, 95 and fluvial disturbance, 25,
63-651 84-851 107
fragmentation of, 45, 49, 50, 92-94, 95, 98-99, 114
inventory of, 28, 49-52, 54-56, 67-68
from multiple kill events, 22-23, 160
in museum collect i,ons, 162 in north and south clusters,
65-69 number of animals per kill
event, 23, 25 observed versus expected
number, 84-87 in processing area, 28-30 and seasonality of kill
events, 70, 160 and selective hunting of
bulls, 70-83 passim, 160 passim
spatial distribution of, 21-27
stratigraphic occurrence of, 16, 18-21, 28, 51-52
and utility indexes, 87-117 passim
See also Age structure; Dental attrition; Garnsey Site; Minimum number of individuals; Processing; Sex structure; Taphonomy
Bone tools. See Artifacts Bottomless Lakes (New Mexico}, 7,
8 p 91 10 f 11 Buffalo, African (Syncerus ~af
fer), 119, 120, 128 Buffalo, American. See Bison Buffalo grass (Buchloe-dacty
loides), 118, 124. See also Grasses --- ----
Bull groups
Bulls
cows in, 72-73, 107-8, 109 as preferred prey, 1-3,
70-83 passim and scarcity of calves, 73 size of, 72 See also Bulls; Cow groups; -- Cows
condition of, seasonal changes in, 104-6, 147

dressed carcass weight, 117 loss of weight in rut, 105
Bushmen (San), fat in diet of, 146
Butchering. See Bones, bison; Processing
Calcaneus discrimination against, in
cows, 101-2, 109-10 sex ratio of, 75 utility index of, 97
Calves birth season of, in bison,
70 bones of, complete, 61, 95,
114 bones of, and fluvial dis
turbance, 62, 66 bones of, inventory, 54-56 discrimination against, in
processing, 113-17 fat reserves in, 115-17 and hunting strategies, 1-3 scarcity of, 71, 73
Canids, 49. See also Taphonomy, carnivore damage
Carbohydrate as energy source, 148 exchange of, with farmers,
158 protein-sparing action of,
154-59 specific dynamic action of,
153-54 storage of, 158
Carbon isotopes and bison diet, 137-41 and paleoclimate, 139-41
Caribou bones, density of, 57-58 as Eskimo food, 91, 150 and utility indexes, 87-88
Carnivores. See Taphonomy Casper Site (Wyoming), 44, 133,
142 Cattle, fat levels in, 115-17 Caudal
and hide removal, 85 sexingof, 110
Ceramics. See Artifacts Cervical --
criteria for sexing, 74, 76, 110
discrimination against, in cows, 101-2, 110-13
marrow fat in, 115-16 sex ratio of, 75 utility index of, 97 See also Axial elements; -- Vertebrae
Chronology, and radiocarbon datinq, 23, 45-48
Climate, present-day, 13-15. See also Paleoclimate
Condition, animal, seasonal changes in, 2, 130, 145-46, 156, 163. See also Diet, bison; Fat; Marrow-fat; Nutritional stress
Condition, bone. See Taphonomy Cores. See Artifacts Corral, described by Spaniards,
81 Costal cartilage
and fluvial disturbance, 62 preservation of, 53, 62
Cow groups, selective hunting of, 1-3. See also Bull groups; Bulls; Cow_s __
Cows articulated elements, 1 oo in bull groups, 72, 107-8,
109 condition, seasonal changes
in, 104-6 dressed carcass weight, 117 nutrition in calving season,
130 Cree, fat in diet of, 147 Crown height (of teeth), 70. See
also Dental attrition Cylinders, bone. See Taphonomy
Deer, lean meat of, 151, 152 Dental attrition
and grit ingestion, 136-37 and life expectancy, 141-42,
169 and paleoclimate, 133-37,
139-40 and phytoliths, 134-36 and seasonality of kill
events, 70

Diet, bison, 118, 119-21, 130, 139-40 and carbon isotopes, 137-41 and dental attrition, 133-37
Diet, human biological role of fat in,
148-59 and bone-grease rendering,
158 gorging of meat, 157 lean meat in, 149-59 marginal caloric intakes,
155 preferences for fat in,
146-48 and
and
See
protein sparing, 153, 154-59
specific dynamic action of food, 153-54
also Carbohydrate; Fat; Marrow fat; Protein
Edge angles. See Artifacts Elk, lean meat-of, 152 Endscrapers. See Arti~acts Eskimo ---
Fat
hunting strategies of, 165 importance of fat to, 91,
149, 150-51
and animal condition, 92, 102-13, 129, 130-31, 145-46, 167-69
biological importance of; 148-59
bone-grease rendering, 158 in calves, 115-17 cultural preferences for,
146-48 as energy source, 148 and fat-soluble vitamins,
148 and hunting strategies,
143-59, 167-69 in marrow bones, 91-92,
102-4, 129, 167-69 mobilization of, in bison,
103-6 oleic acid in, 91, 102-4 and palatability of food,
148 protein-sparing action of,
154-59 specific dynamic action of,
153-54 storage of, 158 See also Diet, human; Marrow ----raE; Nutritional stress
"Fat hypothesis" (Jochim), 146 Femur
criteria for sexing, 171-205 as marrow bone, 92, 103,
116-17, 168 sex ratio of, 75, 161 utility index of, 97
Ferris, Warren A., expedition, and lean meat, 151
Fingerprint chert, 39 Fire-cracked rock. See Artifacts Flakes. See Artifac~ Flooding,--1-1, 16, 20, 21, 107 Fluvial disturbance. See
Taphonomy ---Fowler, Jacob, expedition, and
lean meat, 152 Fragmentation, bone. See Pro
cessing; Taphonomy
Garnsey Site articulated elements at, 16,
25, 26, 45, 166 bones, inventory of, 28,
49-52, 54-56, 67-68 cienega horizons at, 18-21 climate, present-day, 13-15 configuration of wash, 79-80 discrimination against cows
at, 94- 1 1 3 , 1 57 , 1 6 0-6 2 excavations at, 15-16, 17 fluvial disturbance. See
Taphonomy ---former channels at, 20-22 location of, 6-11 method of hunting at, 79-83,
160 multiple kill events at,
22-23, 160 number of animals per kill
event, 23, 25 physical setting, 6-15 processing area at, 26-27,
28, 35, 44

seasonality of, 70, 160 sedimentology, 18-21 selective hunting of bulls
a t , 7 0- 8 3 pa 5 5 i m , 1 6 0 , 165
spatial distribution of bones, 16, 21-27, 65-69
s t rat i graph y , 1 6 , 1 8- 2 1 , 5 1 , 141
~egetation, present-day, 12-13
See also Artifacts; Bones, bison; Chronology; Minimum number of individuals; Processing; Taphonomy
Garnsey Wash. See Garnsey Site General utility-.--See Utility Geochron Laboratories (Mas·-
sachusetts), 45, 47, 140, 141
Glenrock Site (Wyoming), 44, 142 Grama grass (Bouteloua spp.), 13,
118, 119, 124-25, 129, 135. See also Grasses
Grasses- --and bison diet, 118 importance of black grama,
129 leaching of nutrients, 132 phosphorus in, 121-30 phytoliths in, 134-36 protein in, 121-30 in Southern Plains, 13,
118-31 warm and cool season forms,
123-27, 128, 137-41 Grease index
derivation of, 87 as predictor of bone fre
quencies, 99
Harrell point, 35. See also Artifacts
Hearths, 27, 44. See also Processing
Hidatsa, importance of fat to, 147-48
High Plains. See Southern Plains Horn, preservation of, 53, 57,
66, 69
Horner Site (Wyoming), 133 Humerus
criteria for sexing, 171-205 as marrow bone, 103 sex ratio of, 75, 161 as taphonomic indicator, 61,
62. See also Tibia utility index ~97
Hunter-gatherers cultivation by, 158 Eskimo and Garnsey hunting
strategies compared, 165
exchange with farmers, 158. See also Carbohydrate
and hunting of bison, 1-3, 70-83 passim
importance of fat to, 143-59 importance of utility to,
162 See also specific groups
Hunting Eskimo and Garnsey strate-
gies compared, 165 and gorging of meat, 157 by Hidatsa, 14 7 and importance of fat,
143-59 and importance of utility,
162. See also Utility method of, at Garnsey Site,
79-83 and scarcity of projectile
points, 80 seasonality of, at Garnsey
Site, 70 selective, of bulls and
cows, 1-3, 70-83, 165 use of wooden points in,
82-83 and wastage of meat, 157 See also Bones, bison; Garn
sey Site Hyoids, and fluvial dist~rbance,
62
Kill (type of), 79-82 Kutchin, importance of fat to,
151

Lewis and Clark expedition, and lean meat, 152
Mescalero pediment, 7 Mesquite (Prosopis juliflora), 13 Metacarpal Limb elements. See Appendicul~r
elements Lithic materials. See Artifacts Llano Estacada (Caprock), 6 Lumbar
criteria for sexing, 171-205 discrimination against, in
cows, 108 as marrow bone, 102-4 sex ratio of, 75 utility index of, 97
criteria tor sexing, 74, 76, 110
discrimination against, in cows, 101-2, 110-13
rna r row fat in , 1 1 6 sex ratio of, 75 utility index of, 97
Metaconid height (of teeth), 70. See also Dental attrition
Metapodia~ discrimination against, in
eows, 101-2, 108, 161 frequency of, as environmen
tal indicator, 108 Mandible as marrow bone, 1 02-4, 1 61
density of, and preserva- oleic acid in, 102 tion, 57 Metatarsal
and dental attrition, 70-71, criteria for sexing, 171-20:; 134 discrimination against, in
as marrow bone, 167-69 cows, 108 sex ratio of, 75 as marrow bone, 102-4, 168 utility index of, 97 sex ratio of, 75
Marcy, Randolph B., expedition, utility index of, 97 and lean meat, 152 Minimum number of individuals
Marrow fat (MNI) in axial elements, 115-16 based on skull, 53 in calves, 115-17 at Gar·nsey Site, 49, 53-56, in femur, 92, 103 57 passim in humerus, 103 method of estimating, 49, 53 i n rna n d i b 1 e , 1 6 7- 6 9 and u t i 1 i t y , 7 8 , 8 9 pa s s i m in metapodials, 102-4 Miskito, fat in diet of, 147 oleic acid in, 91, 93, 102-4 MNI. See Minimum number of in-pa 1 at a b i l i t y , 9 1 , 1 0 3 , 1 6 8 d i vidual s in ohalanoes. 102. 167-68 Modified general utility index, in ~adius; 103-4 , See Utility in tibia, 91, 103-4 mobilization of, 103-4, 129,
167-69 vi tam in C in , 1 4 9
Marrow index derivation of, 87
Nitrogen balance. See Protein sparing
Nunamiut. See Eskimo Nutritional-stress
as predictor of bone frequencies, 93, 99
MASCA correction, 46 Maxilla, and dental attrition,
70-71. See also Dental at-
Meat trition index derivation of, 87 as predictor of bone
quencies, 99 fre-
and fat depl~tion in cows, 91-92, 102-13, 130-31 passim
and human subsistence strategies, 156-59, 164, 167
low-utility parts as indicator of, 164, 167-69
See also Diet, human; Fat; Marrow fat

Obsidian, 38, 39 Oleic acid, 91, 93, 102-4, 168
Paleoclimate and carbon isotopes, 139-41 in Southern Plains, 131-42 and tree rings, 132-33 See also Dental attrition;
Pollen Paleoenvironment. See
Paleoclimate Paleo-Indian, 44 Paracone height (of teeth), 70.
See also Dental attrition Pecos Valley (New Mexico), 4, 6,
7, 10, 38, 40, 41, 81, 160 Pelvis
bulk as factor in discard, 90-91, 112
of calves, in cow groups, 107-8, 109
density of, and preservation, 57
discrimination against, in cows, 102, 112
sex ratio of, 75, 112 utility index of, 97
Phalanges and fluvial disturbance, 62,
167-68 as marrow bone, 102, 167-69 oleic acid in, 102 sex ratio of, 75 utility index of, 97
Phosphorus bison requirements of,
119-21, 130 in Southern Plains grasses,
119-31 Physiology, animal. See Condi-
tion, animal Phytoliths, in grasses, 134-36 Pitjandjara, fat in diet of, 147 Pollen, at Garnsey Site, 133 Porcupine, as source of fat, 147 Preservation, bone. See
Taphonomy ---Prickly pear (Opuntia spp.), 13 Processing
area, at Garnsey Site, 26-27, 44
and bone disarticulation,
16, 25, 166 and bone fragmentation,
92-94, 95, 98-99 and chopping, 93-94 discrimination against
calves in, 113-17 discrimination against cows
in, 94-113, 160-61, 165-66
discrimination against neck and front legs, 91, 167
and dressed carcass weight, 88, 96, 117
effect of, on sex structure, 161
increase of, at Garnsey Site, 35
low-utility parts and nutritional stress, 164, 167-69
observed versus expected number of bones, 84-87
selective, at Garnsey Site, 84-117, 160-61
stone and bone choppers in, 94
and utility, 87-117 passim, 164, 167-69
See also Artifacts; Bones, bison; Huntinq
Projectile points. See-Artifacts Protein
bison requirements of, 119-20, 121, 130
as energy source, ·148 metabolism of, 153-59 in Southern Plains grasses,
119-31. See also -----Grasses specific dynamic action of,
153-54 See also Protein sparing
Prote~sparing, and nitrogen balance, 154
Rabbits, and lean meat, 150, 151 Radiocarbon dating, and chronol
ogy, 45-48 Radius
criteria for sexing, 171-205 as marrow bone, 103-4 sex ratio of, 75
utility index of, 97 Ribs, and fluvial disturbance,
62, 64 Roswell (New Mexico), 6, 7, 13,
14, 15, 121
Sacaton (Sporobolus airoides), 11-12, 13, 119, 126, 140. See also Grasses
Sacramento Mountains (New Mexico), 38
Sacrum, sex ratio of, 75 Saltbush (Atriplex canescens), 13 Salt cedar (Tamarix pentandra),
12 San Andres Formation (Permian),
38 Scapula
and fluvial disturbance, 62, 66
preservation of, 53, 66 sex ratio of, 75 utility index of, 97
Scavengers. See Taphonomy Scurvy, and all-meat diets, 149 Seasonality
and hunting strategies, 1-3, 70
of kill events, 70 See also Dental attrition
Sedimentology. See Garnsey Site, stratigraphy
Serenget i grasslands, 128 Sesamoid
and fluvial disturbance, 64 loss from site as rider, 64
Sex ratio. See Sex structure Sex structur_e_
altered by processing, 161-62
bias in estimates, 77 of cranial and postcranial
bones, 73-79, 97 passim, 111, 161-62
criteria for sexing bones, 73-74, 171-205
as indicator of seasonality, 3
of original kill population, 77, 79, 161-62
predominance of bulls, 72, 79, 160
and utility, 78, 79, 94-113, 161-62
Skeletal elements. See specific elements
Skull density of, and preserva
tion, 57 as est i rna tor of MN I , 53 , 7 8 ,
94 and fluvial disturbance, 62 frequency of, and utility,
78 preservation of, 57, 66 selective loss of, 77-78 sex ratio of, 75, 161 and sex structure of kill
population, 72, 75, 161 utility index of, 97
Smith, Jedediah, expedition, and lean meat, 151
Snakeweed (Gutierrezia sarothrae), 13
Southern Plains biomass in spring r 118 bison as food in, 169-70 climate, present-day, 13-15 grasses, 13, 118-31 paleoclimate of, and carbon
i sot opes , 1 3 7- 4 1 paleoclimate of, and tree
rings, 132-33 range conditions, prehistor
ic, 131-42 range conditions, present
day, 118-31 vegetation, present-day,
12-13 Specific dynamic action, of food,
153-54 Stefansson, V., and all-meat
diets, 149 Sternum
and fluvial disturbance, 62, 64
utility index of, 97 Stratigraphy. See Garnsey Site Subsistence. See Diet, human
Taphonomy articular ends of bones,
59-61 association of bones and

chan nels , 2 1 - 2 2 , 6 1 bone cylinders and
splinters, 57-59 and bone density, 57-58,
84-85 bone fragmentation, 45, 49,
50, 57-61, 92-93, 95 bone preservation, 53,
57-61, 84-85 carnivore damage, 57-61, 85 and complete calf bones, 61,
95 fluvial disturbance, 25,
62-65, 69, 84-85, 107 and Garnsey Site, 53, 57-69,
84-85 north and south bone clus
ters, 65-69 orientation of bones, 62-63,
69 rate of burial, 63 ratio of proximal to distal
humerus, 61, 62 ratio of proximal to distal
tibia, 61, 63 scavenger damage, 57-61 Voorhies dispersal groups,
63-65 See also specific elements
Tecovas chert, 38, 39, 40 Teeth, bison. See Dental at
trition --Texas Panhandle, 38, 129, 136 Thoracic
Tibia
criteria for sexing, 74, 76, 110
discrimination against, in cows, 110-13
sex ratio of, 75 utility index of, 97 See also Axial elements;
Vertebrae
criteria for sexing, 171-205
Ulna sex ratio of, 75 utility index of, 97
Utility and bone fragmentation,
92-93, 95, 98-99 and "bulk" curves, 89,
165 94,
development of indexes for bison, 162
and discrimination against cows, 78 passim, 94-113, 165-66
and "gourmet" curves, 89 indexes developed by Bin
ford, 87-89, 97 and marrow index, 93 and observed versus expected
number of bones, 85-117 and sex ratio of elements,
97, 99, 161 and Voorhies dispersal
groups, 64-65 See also Grease index; Mar
row index; Meat index
Vegetation, present-day, at Garnsey Site, 12-13. See also Paleoclimate --- ----
Vertebrae discrimination against, in
cows, 11 o- 13 and fluvial disturbance, 62 sex See
Vitamins fat and
ratio of, 75, 110-13 also Axial elements
as vehicle for, 148 scurvy in all-meat diets, 149
Voorhies dispersal groups. See Taphonomy
Vore Site (Wyoming), 16
as marrow bone I 91-92 1 102-4 sex ratio of, 75 Wardell Site (Wyoming), 142 as taphonomic indicator, 61 Washita point, 35. See also Ar-
63 ' tifacts utility index of, 97 Waterfowl, as source of fat, 158
Tobosa (Hilaria mutica), 13, 119 1
126. See also Grasses Tools. See Artifacts Tree rings, and paleoclimate,
132-33
Yellowstone bison herd, composition of, 73
Yucca (Yucca spp. ), 13

Bison Kills and Bone Counts Decision Making by Ancient Hunters
John D. Speth
/
During the late prehistoric period in the High Plains region of southeastern New Mexico, there occurred a seemingly anomalous series of bison kills. In contrast to the well-known Northern Plains pattern in which cows were the principal victims and hunting took place in the fall and winter, the Garnsey Site reveals a spring -season series of kills in which bulls were the preferred targets. Those cows that were killed were discriminated against in butchering and processing, and so most of the bones left behind at the site were from cows, not bulls. Since spring was generally a time of food shortage for the prehistoric peoples of the region, why would hunters have wasted potentially valuable food by abandoning parts of the animals they had killed? .
Traditional archeological explanations for such apparent waste suppose that the hunters were ·unable to transport all the meat or thatthe kill netted more than they could consume. John D. Speth here explores an alternative explanation of the hunters' decision.
Using and refining a system of analysis based on nutritional utility; Speth shows that it was precisely those parts that were of least nutritional value that were discarded: the lean and fatdepleted remains of pregnant and lactating cows. The prehistoric hunters appear to have been highly selective and efficient in the animals they procured and the parts they consumed, maximizing their calorie intake at a time of the year when stored foods were low or exhausted. Speth's study thus suggests methodological implications for all analyses of bones in archeology and contributes significantly to our knowledge of the· subsistence activities of prehistoric hunters and gathers.
John D. Speth is the author of numerous archeological research reports. He is currently associate professor of anthropology and associate curator of North American archeology at the University of Michigan.
The University of.Chicago ·Press
ISBN 0-226~76949-6