Embed Size (px)
Citation preview
1997Air Quality
AnnualReport
forWashington
State
Publication Number 97-208
1
The Department of Ecology is an equal opportunity agency and does not discriminate on thebasis of race, creed, color, disability, Vietnam Era veteran’s status, or sexual orientation.
If you have special accommodation needs or require this document in an alternative format,please contact Tami Dahlgren at the Air Quality Program, (360) 407-6830 (voice) or (360) 407-6006 (TDD only).
For additional copies of this report, contact the Department of Ecology Publications DistributionCenter, (360) 407-7472.
Publication #97-208
2
Table of Contents
Introduction Page 3
Glossary of Terms Page 4
Determining the State of Our Air Page 5
Air Monitoring Sites Page 6
Identifying Air Pollution Sources Page 7
Managing Air Quality Page 8 Air Quality Standards Page 8
Criteria Pollutants Page 9Nonattainment Area Maps Page 11PM10 Page 12Ozone Page 21Carbon Monoxide Page 25Sulfur Dioxide Page 29Nitrogen Oxides/Lead Page 32
New Federal Air Quality Standards Page 33
Toxic Air Pollutants Page 35
Emission Check Program Page 36
Stage 2 Gasoline Refueling Vapor Recovery Page 44
Protecting Visibility Page 45
Grass Seed Field Burning Page 48
Columbia Plateau Project Page 49
Air Quality Program Internet Site Page 51
3
Introduction
1997 brought many changes and challenges for those concerned with Washington State’s airquality. Several areas that formerly did not meet air quality standards were either redesignatedas meeting standards, or were proposed for redesignation. The federal Environmental ProtectionAgency (EPA) adopted new federal standards for two air pollutants, spurring changes in the wayair quality agencies monitor and control those pollutants. The Department of Ecology’s AirQuality Program conducted an evaluation of its vehicle Emission Check Program to determinehow to achieve maximum air quality benefits with minimum public impact. And Ecology beganan initiative to improve the ways we protect and enhance visibility in Washington’s scenic areas.
Highlights of 1997 include:
• Monitored air pollutant levels were within federal air quality standards in all areas of thestate.
• EPA redesignated the Vancouver-Portland bi-state area to an attainment area for ozone.
• Ecology submitted a plan for the Thurston County area to be redesignated to attainment forparticulate matter.
• In the Spokane area, where attainment of the carbon monoxide standard is still an issue,Ecology continued working in cooperation with local agencies and EPA to define controls tohelp improve and maintain air quality.
This report describes many of the actions taken during 1997 by Ecology and local agencies thathave resulted in cleaner air for Washington’s citizens.
4
Glossary of Terms
Air monitoring network: A network of air monitors located around the state to determine levelsof criteria pollutants in the air, identify areas with the worst air pollution, identify where healthrisks may exist, and determine if control strategies are working.
Attainment area: An area that meets federal air quality standards.
Class I area: All international parks, national wilderness areas, and memorial parks whichexceed 5,000 acres, and all national parks which exceed 6,000 acres. Class I areas haverestrictions on use of land and resources to prevent damage to visibility, plants, soil, and otherresources.
Control strategies: Methods used to control emissions of a specific pollutant, usually in aspecific area of the state.
Criteria pollutants: A limited set of air pollutants for which federal standards have been set toprotect human health. Includes carbon monoxide, nitrogen dioxide, sulfur dioxide, ozone,particulate matter, and lead.
Emission inventory: A data bank of air pollution statistics which identifies the type, size, andlocation of various pollution sources. Categories include point sources (sources such asindustrial facilities that are located at a specific geographic point) and area sources (sources notconfined to one point but spread out over a wider area, such as automobiles and wood stoves).
Maintenance area: A geographic region redesignated by EPA from nonattainment to attainmentas a result of monitored attainment of the standard and EPA approval of a plan to maintain airquality standards for at least a 10-year period.
Maintenance plan: A plan developed by state and/or local air quality agencies to meet airquality standards in an area for at least a 10-year period.
Nonattainment area: A geographic region designated by EPA in which federal air qualitystandards are not or were not met by a certain date. Areas once designated as nonattainment thatnow meet air quality standards remain nonattainment until EPA has approved a redesignationrequest and maintenance plan.
State Implementation Plan (SIP): A plan the state adopts and implements to ensure the statemeets federal and state air quality standards and goals.
Toxic air pollutants: Compounds which may cause cancer and/or other health problems at verylow concentrations.
5
Determining the State of Our Air
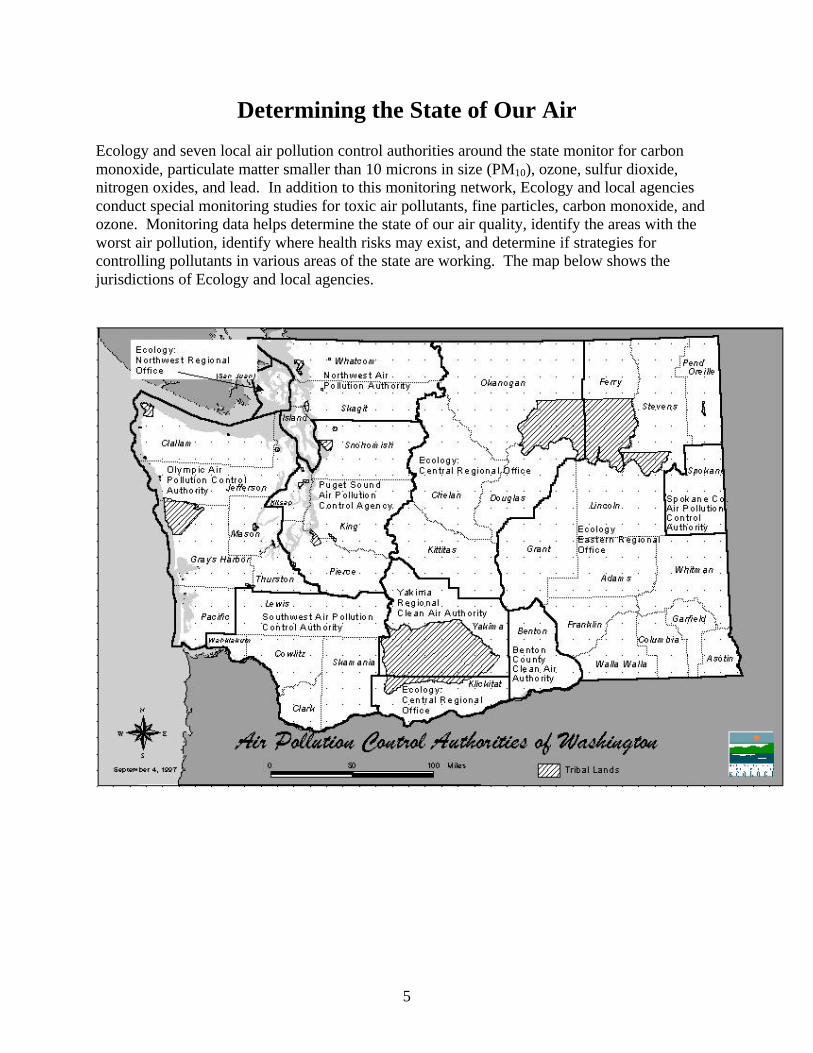
Ecology and seven local air pollution control authorities around the state monitor for carbonmonoxide, particulate matter smaller than 10 microns in size (PM10), ozone, sulfur dioxide,nitrogen oxides, and lead. In addition to this monitoring network, Ecology and local agenciesconduct special monitoring studies for toxic air pollutants, fine particles, carbon monoxide, andozone. Monitoring data helps determine the state of our air quality, identify the areas with theworst air pollution, identify where health risks may exist, and determine if strategies forcontrolling pollutants in various areas of the state are working. The map below shows thejurisdictions of Ecology and local agencies.
6
Air Monitoring Sites
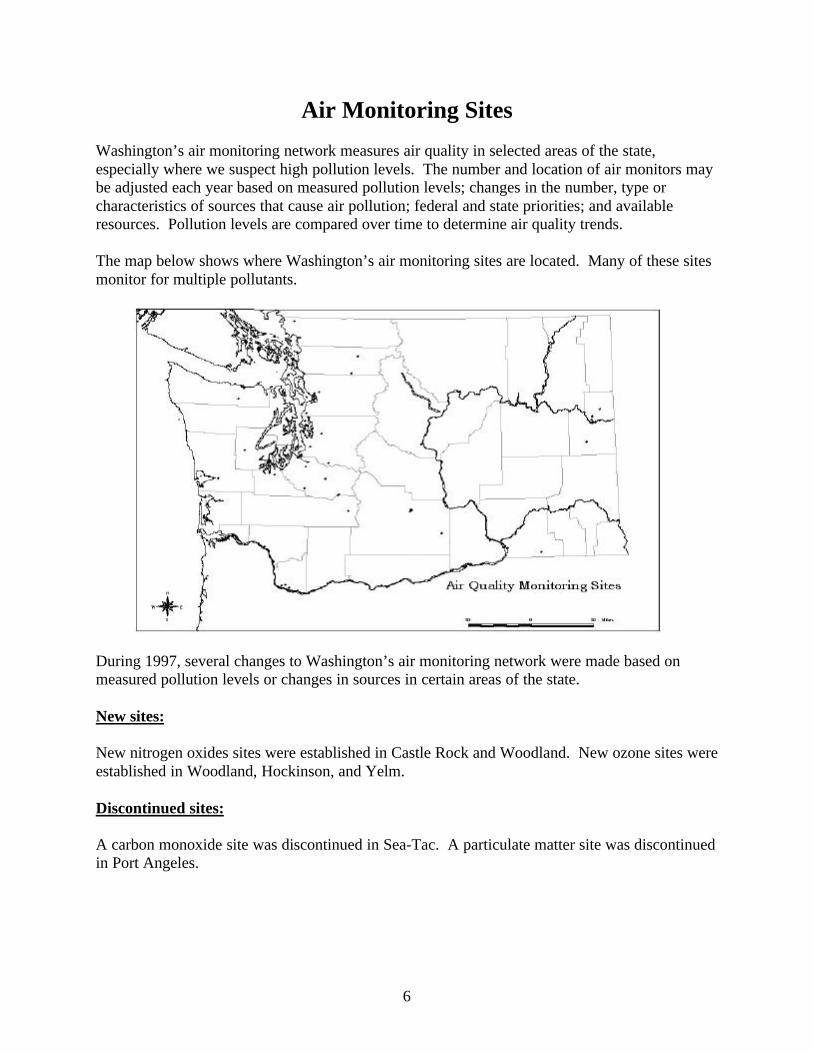
Washington’s air monitoring network measures air quality in selected areas of the state,especially where we suspect high pollution levels. The number and location of air monitors maybe adjusted each year based on measured pollution levels; changes in the number, type orcharacteristics of sources that cause air pollution; federal and state priorities; and availableresources. Pollution levels are compared over time to determine air quality trends.
The map below shows where Washington’s air monitoring sites are located. Many of these sitesmonitor for multiple pollutants.
During 1997, several changes to Washington’s air monitoring network were made based onmeasured pollution levels or changes in sources in certain areas of the state.
New sites:
New nitrogen oxides sites were established in Castle Rock and Woodland. New ozone sites wereestablished in Woodland, Hockinson, and Yelm.
Discontinued sites:
A carbon monoxide site was discontinued in Sea-Tac. A particulate matter site was discontinuedin Port Angeles.
7
Identifying Air Pollution Sources
Many air quality decisions are based on information provided by “emission inventories,” datathat give us information about the type, size, and location of sources of various air pollutants.An emission inventory categorizes air pollution sources into three main groups: point sources,area sources, and mobile sources.
Point sources are sources that are located at a specific geographical point. They are usuallylarger commercial or industrial facilities. Area sources are sources that are too small or toonumerous to be counted individually, such as wood stoves or house painting. Area sources alsoinclude sources that may be spread over a large area, such as windblown dust or wildfires.Mobile sources include motor vehicles, aircraft, trains, boats, and construction.
The information provided by an emission inventory shows whether emissions of an air pollutantare increasing or decreasing in a certain area of the state, as well as where the air pollutant iscoming from. This type of information helps state and local air quality agencies determine whatstrategies work best to control air pollution in certain areas. An example of how an emissioninventory was used during 1997 to make decisions about protecting visibility in Washington isdescribed on page 46.
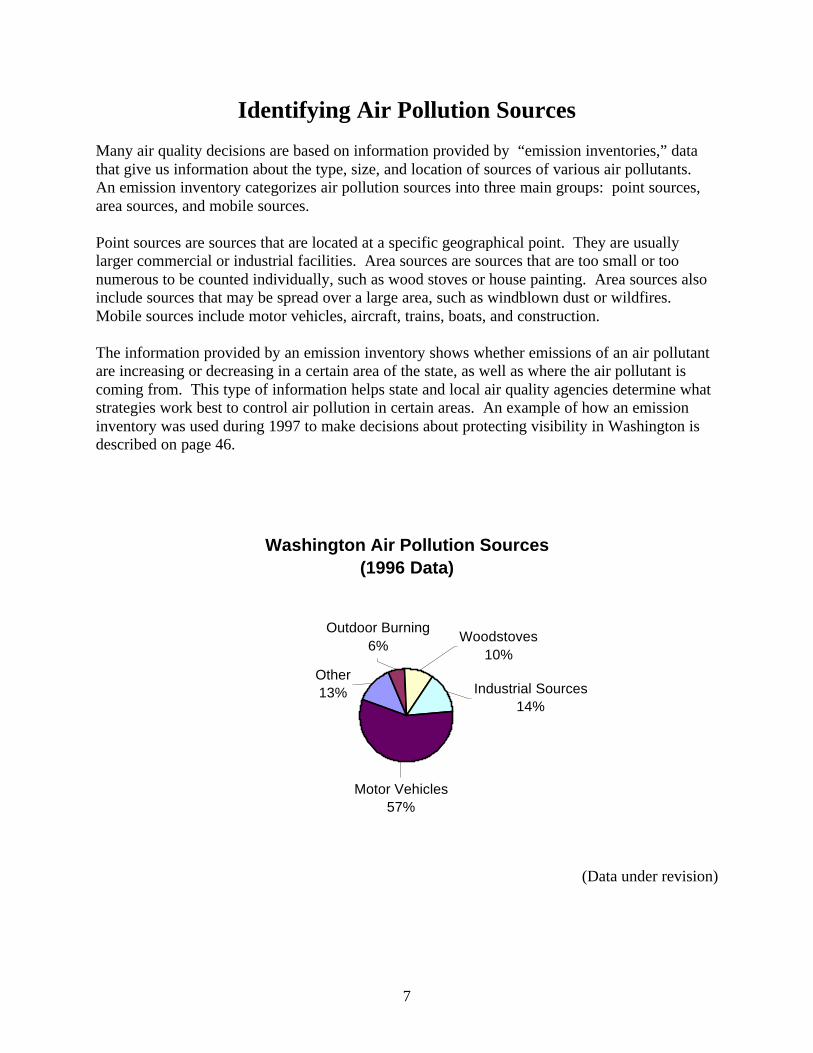
(Data under revision)
Washington Air Pollution Sources(1996 Data)
Industrial Sources14%
Woodstoves10%
Outdoor Burning6%
Other13%
Motor Vehicles57%
8
Managing Air Quality
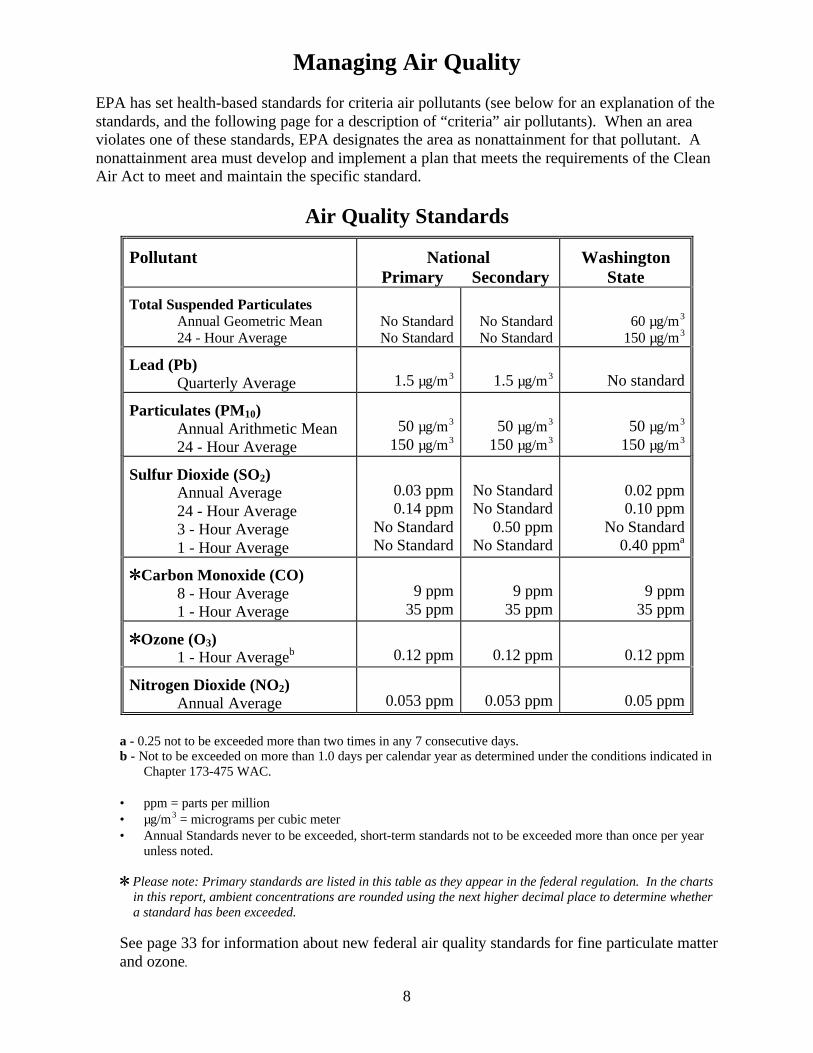
EPA has set health-based standards for criteria air pollutants (see below for an explanation of thestandards, and the following page for a description of “criteria” air pollutants). When an areaviolates one of these standards, EPA designates the area as nonattainment for that pollutant. Anonattainment area must develop and implement a plan that meets the requirements of the CleanAir Act to meet and maintain the specific standard.
Air Quality Standards
Pollutant National Primary Secondary
WashingtonState
Total Suspended ParticulatesAnnual Geometric Mean24 - Hour Average
No StandardNo Standard
No StandardNo Standard
60 µg/m3
150 µg/m3
Lead (Pb)Quarterly Average 1.5 µg/m3 1.5 µg/m3 No standard
Particulates (PM10)Annual Arithmetic Mean24 - Hour Average
50 µg/m3
150 µg/m350 µg/m3
150 µg/m350 µg/m3
150 µg/m3
Sulfur Dioxide (SO2)Annual Average24 - Hour Average3 - Hour Average1 - Hour Average
0.03 ppm0.14 ppm
No StandardNo Standard
No StandardNo Standard
0.50 ppmNo Standard
0.02 ppm0.10 ppm
No Standard0.40 ppma
\\Carbon Monoxide (CO)8 - Hour Average1 - Hour Average
9 ppm35 ppm
9 ppm35 ppm
9 ppm35 ppm
\\Ozone (O3)1 - Hour Averageb 0.12 ppm 0.12 ppm 0.12 ppm
Nitrogen Dioxide (NO2)Annual Average 0.053 ppm 0.053 ppm 0.05 ppm
a - 0.25 not to be exceeded more than two times in any 7 consecutive days.b - Not to be exceeded on more than 1.0 days per calendar year as determined under the conditions indicated in
Chapter 173-475 WAC.
• ppm = parts per million• µg/m3 = micrograms per cubic meter• Annual Standards never to be exceeded, short-term standards not to be exceeded more than once per year
unless noted.
\\ Please note: Primary standards are listed in this table as they appear in the federal regulation. In the chartsin this report, ambient concentrations are rounded using the next higher decimal place to determine whethera standard has been exceeded.
See page 33 for information about new federal air quality standards for fine particulate matterand ozone.
9
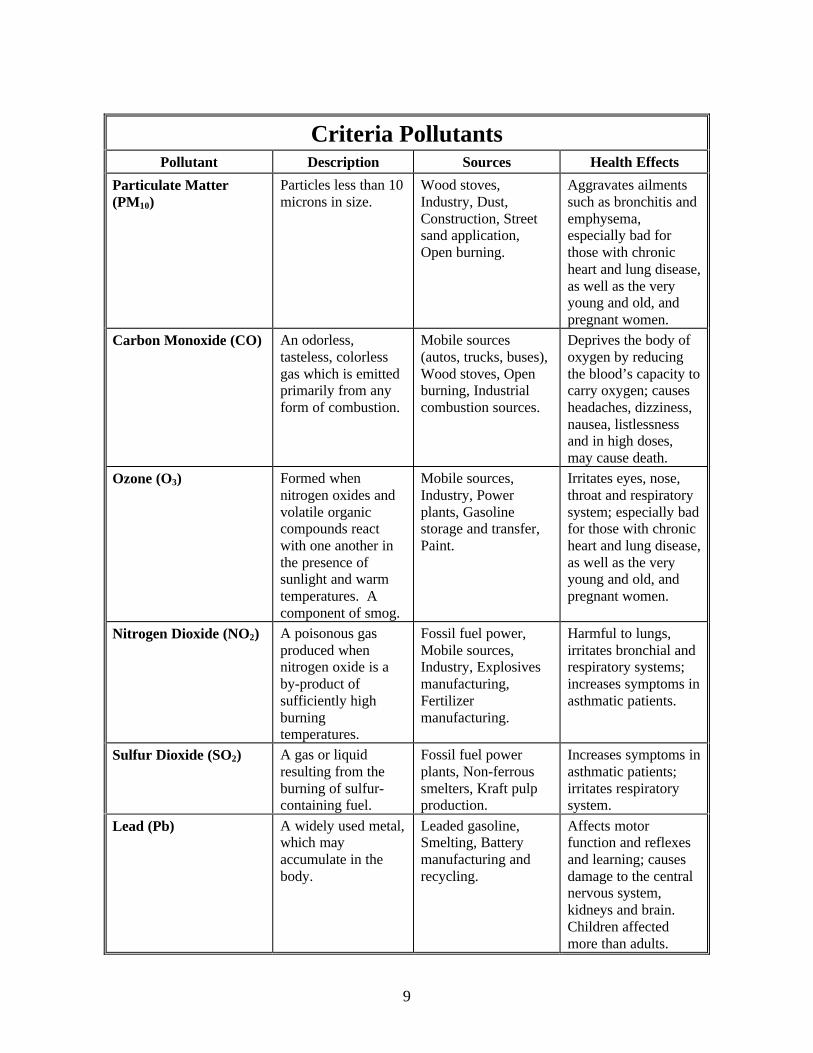
Criteria PollutantsPollutant Description Sources Health Effects
Particulate Matter(PM10)
Particles less than 10microns in size.
Wood stoves,Industry, Dust,Construction, Streetsand application,Open burning.
Aggravates ailmentssuch as bronchitis andemphysema,especially bad forthose with chronicheart and lung disease,as well as the veryyoung and old, andpregnant women.
Carbon Monoxide (CO) An odorless,tasteless, colorlessgas which is emittedprimarily from anyform of combustion.
Mobile sources(autos, trucks, buses),Wood stoves, Openburning, Industrialcombustion sources.
Deprives the body ofoxygen by reducingthe blood’s capacity tocarry oxygen; causesheadaches, dizziness,nausea, listlessnessand in high doses,may cause death.
Ozone (O3) Formed whennitrogen oxides andvolatile organiccompounds reactwith one another inthe presence ofsunlight and warmtemperatures. Acomponent of smog.
Mobile sources,Industry, Powerplants, Gasolinestorage and transfer,Paint.
Irritates eyes, nose,throat and respiratorysystem; especially badfor those with chronicheart and lung disease,as well as the veryyoung and old, andpregnant women.
Nitrogen Dioxide (NO2) A poisonous gasproduced whennitrogen oxide is aby-product ofsufficiently highburningtemperatures.
Fossil fuel power,Mobile sources,Industry, Explosivesmanufacturing,Fertilizermanufacturing.
Harmful to lungs,irritates bronchial andrespiratory systems;increases symptoms inasthmatic patients.
Sulfur Dioxide (SO2) A gas or liquidresulting from theburning of sulfur-containing fuel.
Fossil fuel powerplants, Non-ferroussmelters, Kraft pulpproduction.
Increases symptoms inasthmatic patients;irritates respiratorysystem.
Lead (Pb) A widely used metal,which mayaccumulate in thebody.
Leaded gasoline,Smelting, Batterymanufacturing andrecycling.
Affects motorfunction and reflexesand learning; causesdamage to the centralnervous system,kidneys and brain.Children affectedmore than adults.
10
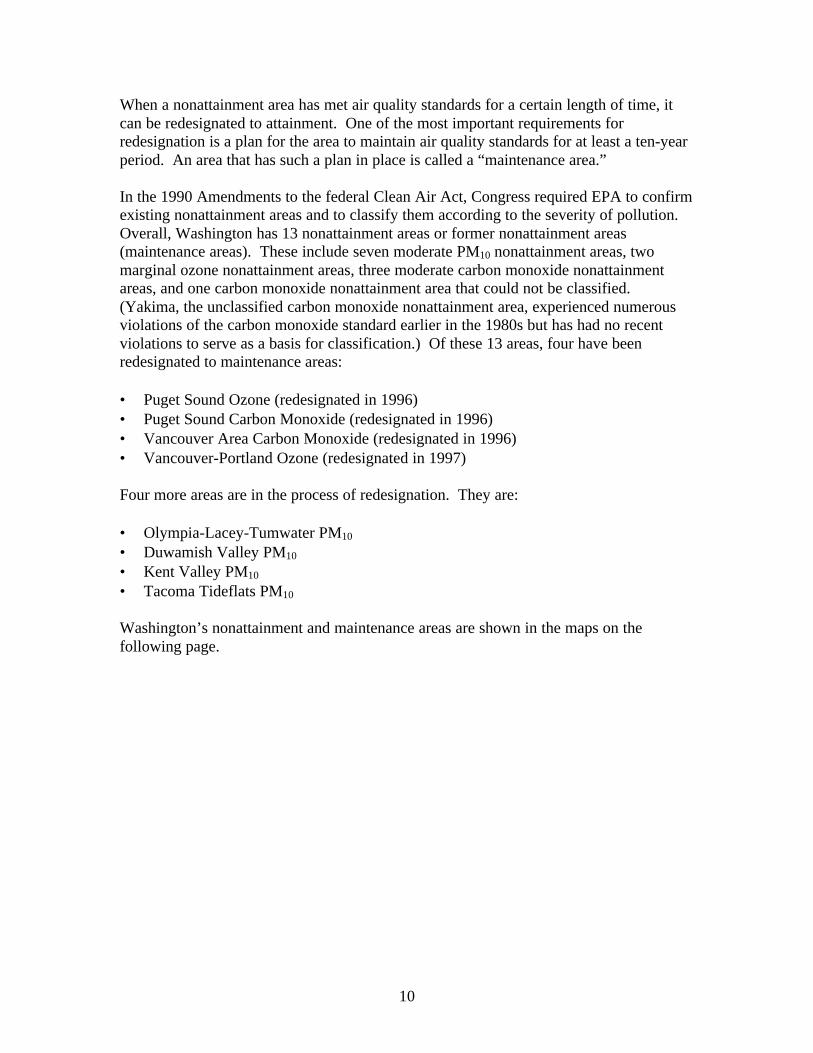
When a nonattainment area has met air quality standards for a certain length of time, itcan be redesignated to attainment. One of the most important requirements forredesignation is a plan for the area to maintain air quality standards for at least a ten-yearperiod. An area that has such a plan in place is called a “maintenance area.”
In the 1990 Amendments to the federal Clean Air Act, Congress required EPA to confirmexisting nonattainment areas and to classify them according to the severity of pollution.Overall, Washington has 13 nonattainment areas or former nonattainment areas(maintenance areas). These include seven moderate PM10 nonattainment areas, twomarginal ozone nonattainment areas, three moderate carbon monoxide nonattainmentareas, and one carbon monoxide nonattainment area that could not be classified.(Yakima, the unclassified carbon monoxide nonattainment area, experienced numerousviolations of the carbon monoxide standard earlier in the 1980s but has had no recentviolations to serve as a basis for classification.) Of these 13 areas, four have beenredesignated to maintenance areas:
• Puget Sound Ozone (redesignated in 1996)• Puget Sound Carbon Monoxide (redesignated in 1996)• Vancouver Area Carbon Monoxide (redesignated in 1996)• Vancouver-Portland Ozone (redesignated in 1997)
Four more areas are in the process of redesignation. They are:
• Olympia-Lacey-Tumwater PM10
• Duwamish Valley PM10
• Kent Valley PM10
• Tacoma Tideflats PM10
Washington’s nonattainment and maintenance areas are shown in the maps on thefollowing page.
11
12
PM10
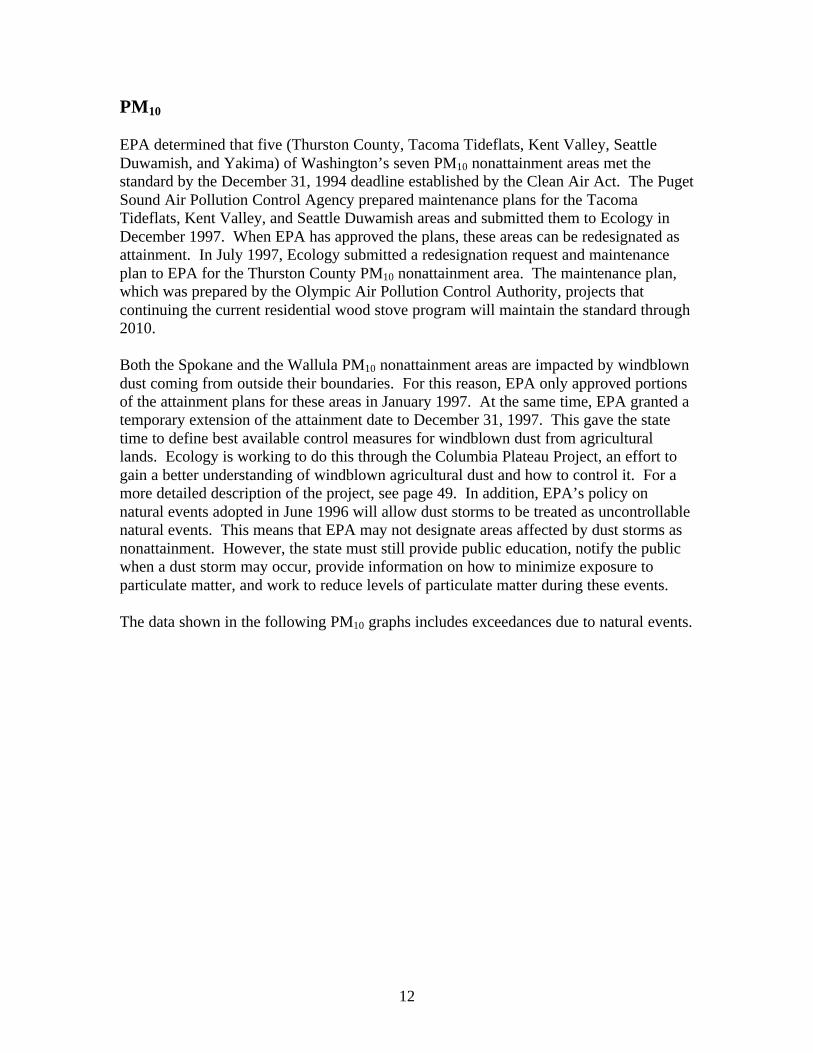
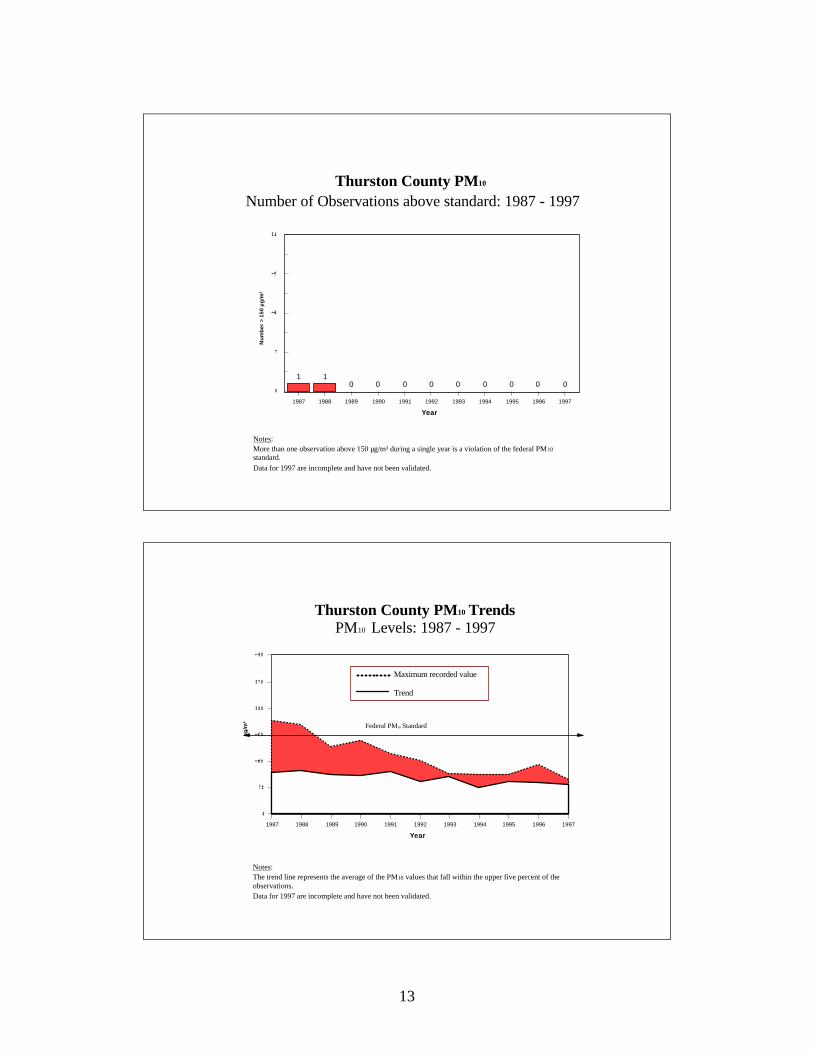
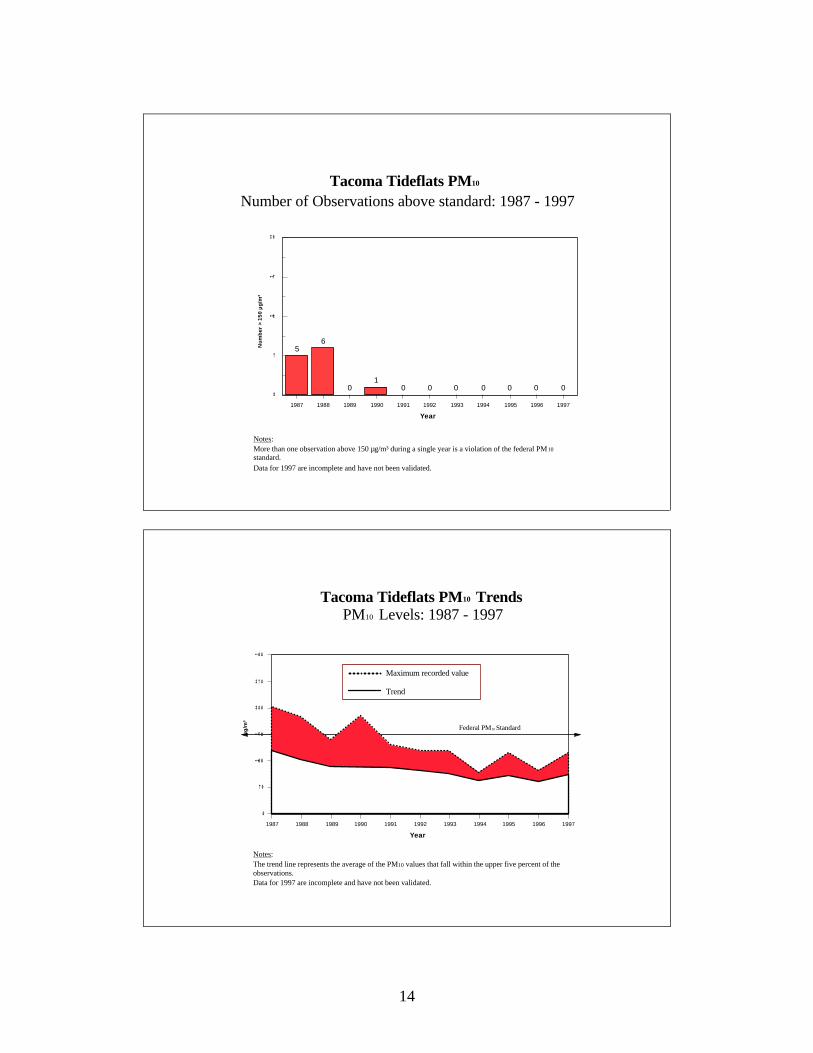
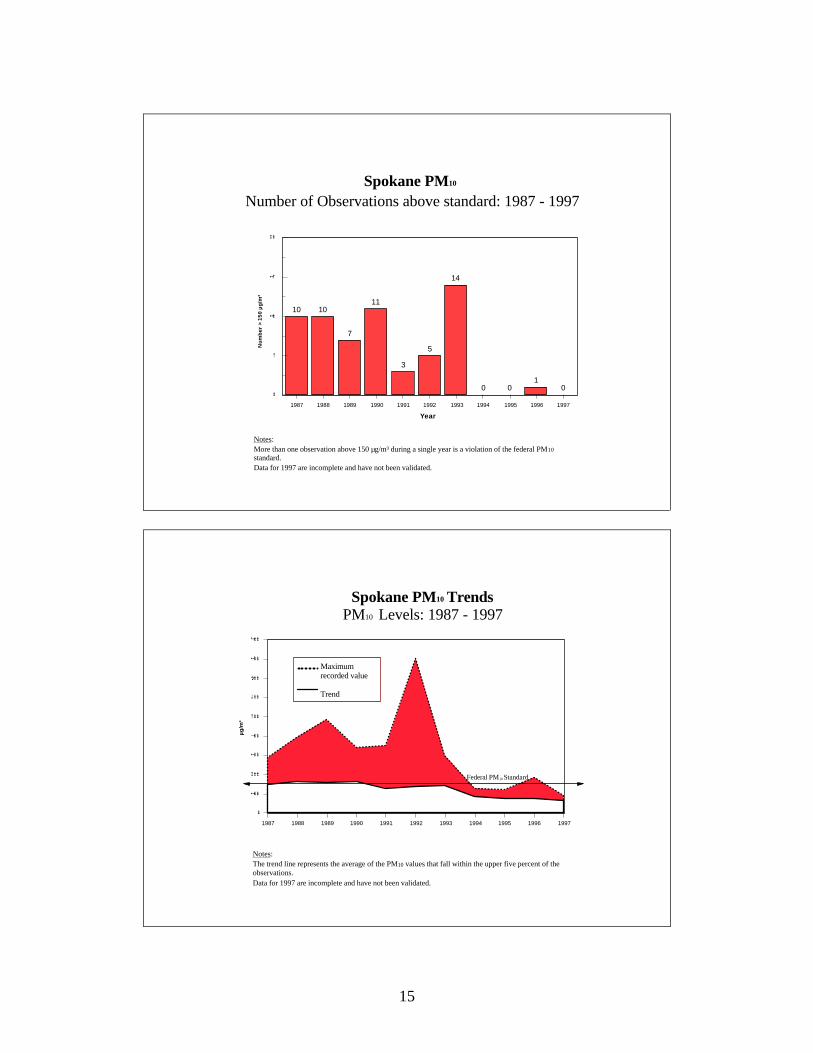
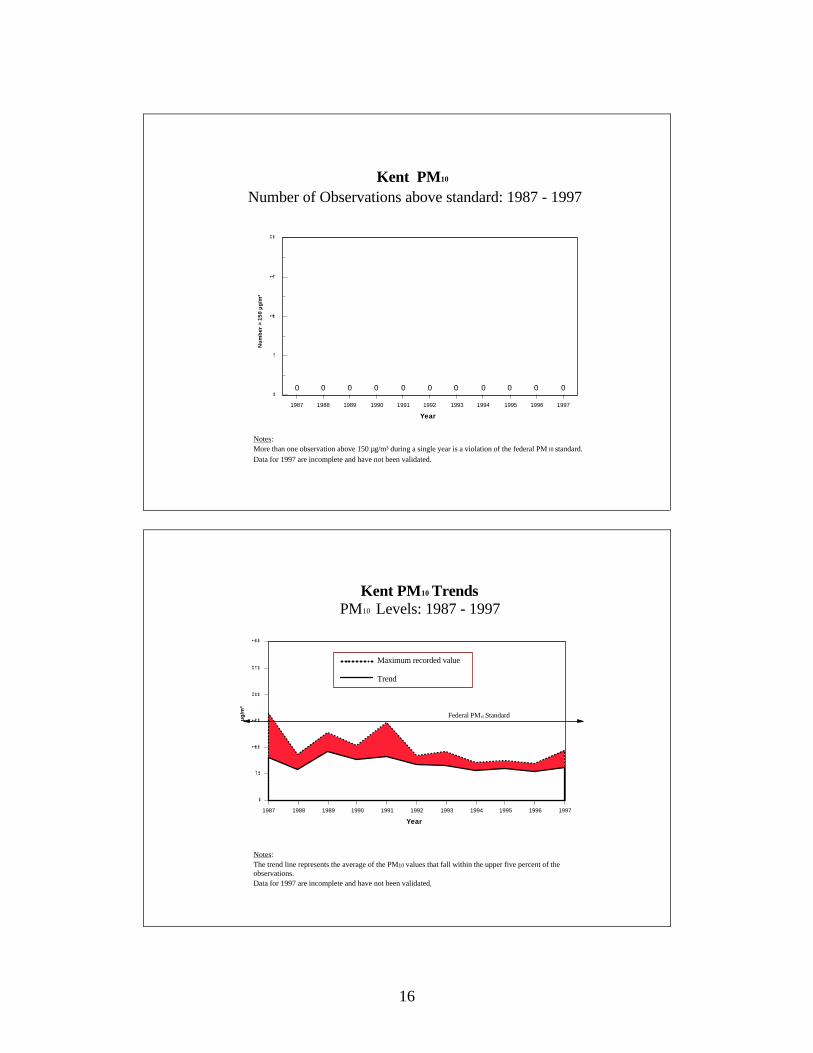
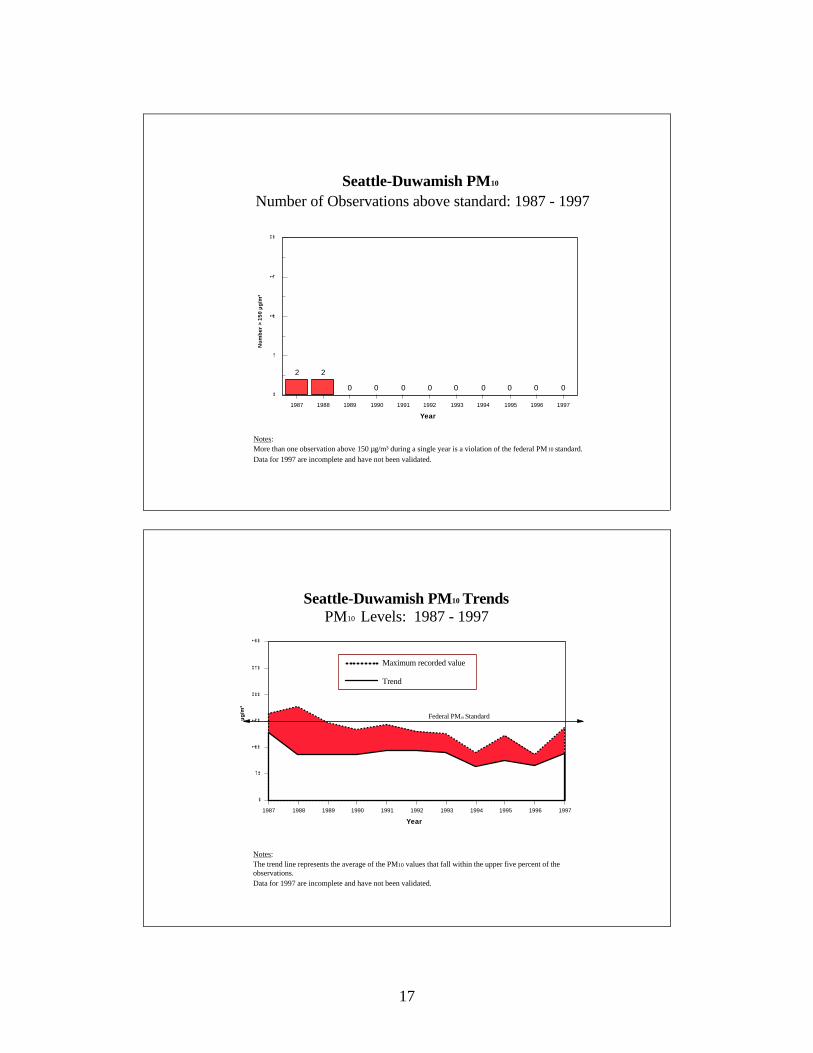
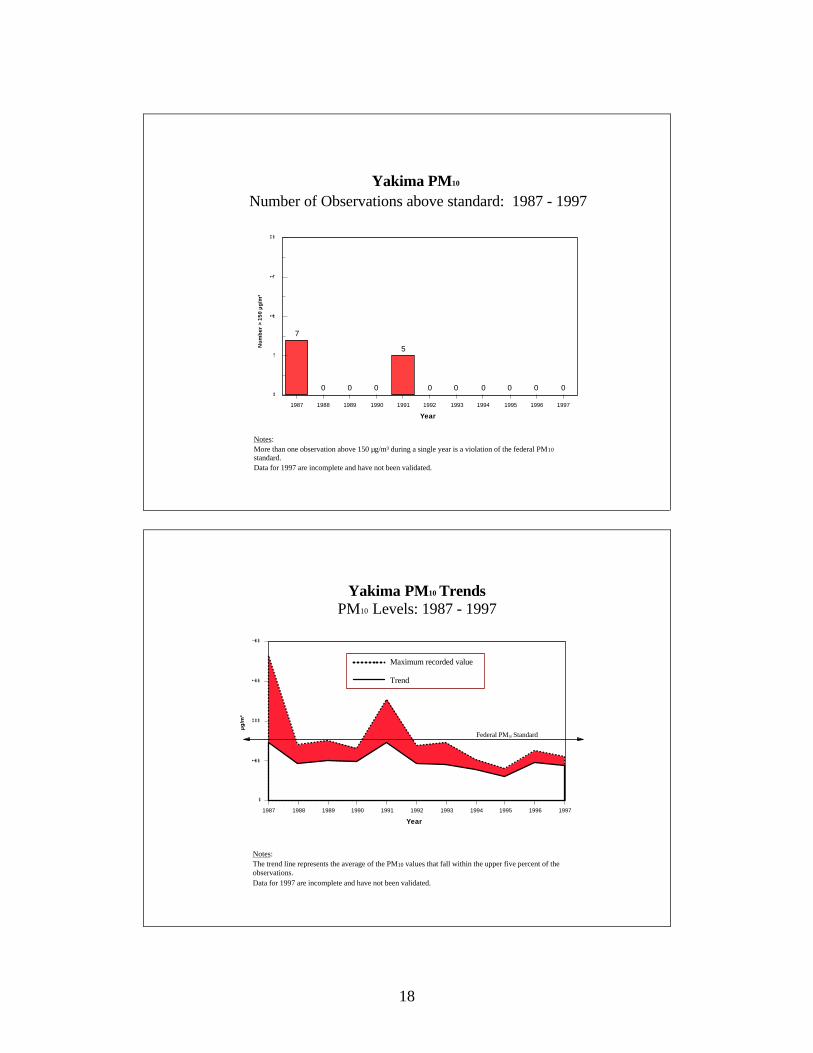
EPA determined that five (Thurston County, Tacoma Tideflats, Kent Valley, SeattleDuwamish, and Yakima) of Washington’s seven PM10 nonattainment areas met thestandard by the December 31, 1994 deadline established by the Clean Air Act. The PugetSound Air Pollution Control Agency prepared maintenance plans for the TacomaTideflats, Kent Valley, and Seattle Duwamish areas and submitted them to Ecology inDecember 1997. When EPA has approved the plans, these areas can be redesignated asattainment. In July 1997, Ecology submitted a redesignation request and maintenanceplan to EPA for the Thurston County PM10 nonattainment area. The maintenance plan,which was prepared by the Olympic Air Pollution Control Authority, projects thatcontinuing the current residential wood stove program will maintain the standard through2010.
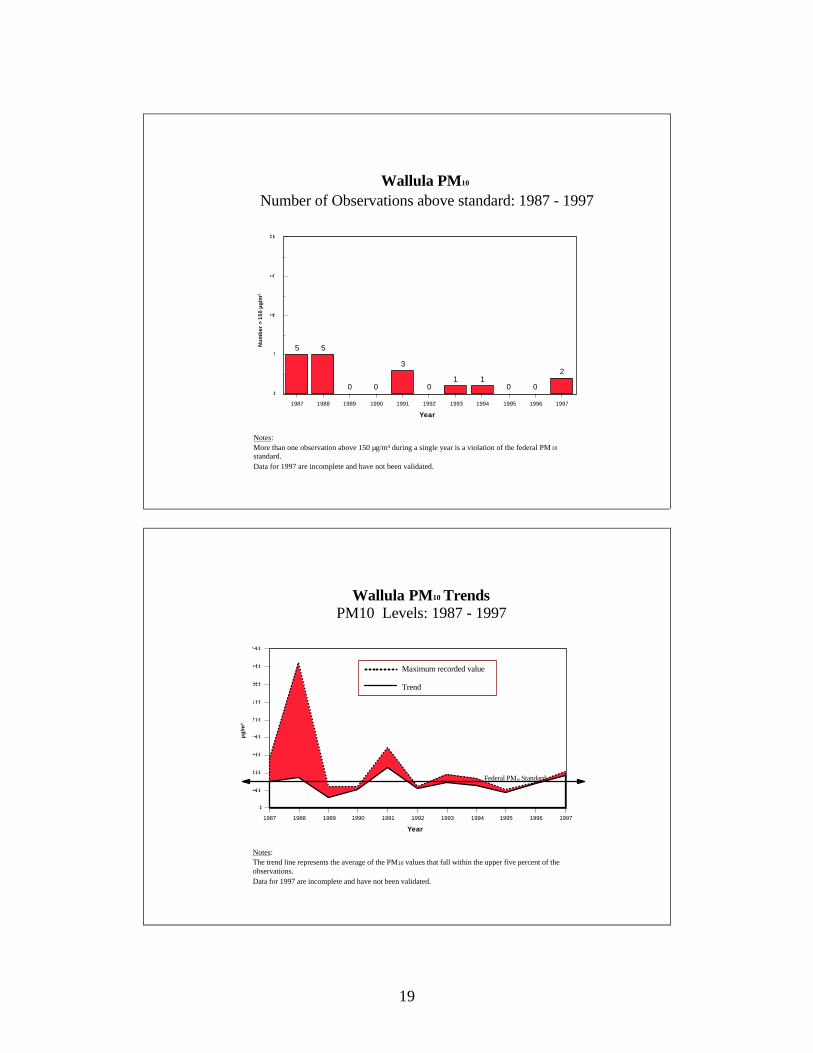
Both the Spokane and the Wallula PM10 nonattainment areas are impacted by windblowndust coming from outside their boundaries. For this reason, EPA only approved portionsof the attainment plans for these areas in January 1997. At the same time, EPA granted atemporary extension of the attainment date to December 31, 1997. This gave the statetime to define best available control measures for windblown dust from agriculturallands. Ecology is working to do this through the Columbia Plateau Project, an effort togain a better understanding of windblown agricultural dust and how to control it. For amore detailed description of the project, see page 49. In addition, EPA’s policy onnatural events adopted in June 1996 will allow dust storms to be treated as uncontrollablenatural events. This means that EPA may not designate areas affected by dust storms asnonattainment. However, the state must still provide public education, notify the publicwhen a dust storm may occur, provide information on how to minimize exposure toparticulate matter, and work to reduce levels of particulate matter during these events.
The data shown in the following PM10 graphs includes exceedances due to natural events.
13
Notes:More than one observation above 150 µg/m³ during a single year is a violation of the federal PM10 standard.Data for 1997 are incomplete and have not been validated.
Thurston County PM10 Number of Observations above standard: 1987 - 1997
1 10 0 0 0 0 0 0 0 0
1987 1988 1989 1990 1991 1992 1993 1994 1995 1996 1997
Year
0
5
10
15
20
Nu
mb
er
> 1
50
µg
/m³
1987 1988 1989 1990 1991 1992 1993 1994 1995 1996 1997
Year
0
50
100
150
200
250
300
µ
g/m
³
Thurston County PM10 TrendsPM10 Levels: 1987 - 1997
Federal PM10 Standard
Notes:The trend line represents the average of the PM10 values that fall within the upper five percent of the observations.Data for 1997 are incomplete and have not been validated.
Maximum recorded value
Trend
14
Tacoma Tideflats PM10 Number of Observations above standard: 1987 - 1997
Notes:More than one observation above 150 µg/m³ during a single year is a violation of the federal PM10 standard.Data for 1997 are incomplete and have not been validated.
56
01
0 0 0 0 0 0 0
1987 1988 1989 1990 1991 1992 1993 1994 1995 1996 1997
Year
0
5
10
15
20
Nu
mb
er
> 1
50
µg
/m³
Tacoma Tideflats PM10 TrendsPM10 Levels: 1987 - 1997
Notes:The trend line represents the average of the PM10 values that fall within the upper five percent of the observations.Data for 1997 are incomplete and have not been validated.
Maximum recorded value
Trend
Federal PM10 Standard
1987 1988 1989 1990 1991 1992 1993 1994 1995 1996 1997
Year
0
50
100
150
200
250
300
µ
g/m
³
15
Spokane PM10 Number of Observations above standard: 1987 - 1997
Notes:More than one observation above 150 µg/m³ during a single year is a violation of the federal PM10 standard.Data for 1997 are incomplete and have not been validated.
10 10
7
11
3
5
14
0 01
0
1987 1988 1989 1990 1991 1992 1993 1994 1995 1996 1997
Year
0
5
10
15
20
Nu
mb
er
> 1
50
µg
/m³
1987 1988 1989 1990 1991 1992 1993 1994 1995 1996 1997
0
100
200
300
400
500
600
700
800
900
µg
/m³
Spokane PM10 TrendsPM10 Levels: 1987 - 1997
Federal PM10 Standard
Notes:The trend line represents the average of the PM10 values that fall within the upper five percent of the observations.Data for 1997 are incomplete and have not been validated.
Maximum recorded value
Trend
16
Kent PM10 Number of Observations above standard: 1987 - 1997
Notes:More than one observation above 150 µg/m³ during a single year is a violation of the federal PM10 standard.Data for 1997 are incomplete and have not been validated.
0 0 0 0 0 0 0 0 0 0 0
1987 1988 1989 1990 1991 1992 1993 1994 1995 1996 1997
Year
0
5
10
15
20
Nu
mb
er
> 1
50
µg
/m³
1987 1988 1989 1990 1991 1992 1993 1994 1995 1996 1997
Year
0
50
100
150
200
250
300
µg
/m³
Kent PM10 TrendsPM10 Levels: 1987 - 1997
Notes:The trend line represents the average of the PM10 values that fall within the upper five percent of the observations.Data for 1997 are incomplete and have not been validated.
Federal PM10 Standard
Maximum recorded value
Trend
17
Seattle-Duwamish PM10 Number of Observations above standard: 1987 - 1997
Notes:More than one observation above 150 µg/m³ during a single year is a violation of the federal PM10 standard.Data for 1997 are incomplete and have not been validated.
2 2
0 0 0 0 0 0 0 0 0
1987 1988 1989 1990 1991 1992 1993 1994 1995 1996 1997
Year
0
5
10
15
20
Nu
mb
er
> 1
50
µg
/m³
1987 1988 1989 1990 1991 1992 1993 1994 1995 1996 1997
Year
0
50
100
150
200
250
300
µg
/m³
Seattle-Duwamish PM10 TrendsPM10 Levels: 1987 - 1997
Federal PM10 Standard
Notes:The trend line represents the average of the PM10 values that fall within the upper five percent of the observations.Data for 1997 are incomplete and have not been validated.
Maximum recorded value
Trend
18
Yakima PM10 Number of Observations above standard: 1987 - 1997
Notes:More than one observation above 150 µg/m³ during a single year is a violation of the federal PM10 standard.Data for 1997 are incomplete and have not been validated.
7
0 0 0
5
0 0 0 0 0 0
1987 1988 1989 1990 1991 1992 1993 1994 1995 1996 1997
Year
0
5
10
15
20
Nu
mb
er
> 1
50
µg
/m³
1987 1988 1989 1990 1991 1992 1993 1994 1995 1996 1997
Year
0
100
200
300
400
µg
/m³
Yakima PM10 TrendsPM10 Levels: 1987 - 1997
Federal PM10 Standard
Notes:The trend line represents the average of the PM10 values that fall within the upper five percent of the observations.Data for 1997 are incomplete and have not been validated.
Maximum recorded value
Trend
19
Wallula PM10 Number of Observations above standard: 1987 - 1997
Notes:More than one observation above 150 µg/m³ during a single year is a violation of the federal PM 10 standard.Data for 1997 are incomplete and have not been validated.
5 5
0 0
3
01 1
0 0
2
1987 1988 1989 1990 1991 1992 1993 1994 1995 1996 1997
Year
0
5
10
15
20
Nu
mb
er
> 1
50
µg
/m³
1987 1988 1989 1990 1991 1992 1993 1994 1995 1996 1997
Year
0
100
200
300
400
500
600
700
800
900
µg
/m³
Wallula PM10 TrendsPM10 Levels: 1987 - 1997
Federal PM10 Standard
Notes:The trend line represents the average of the PM10 values that fall within the upper five percent of the observations.Data for 1997 are incomplete and have not been validated.
Maximum recorded value
Trend
20
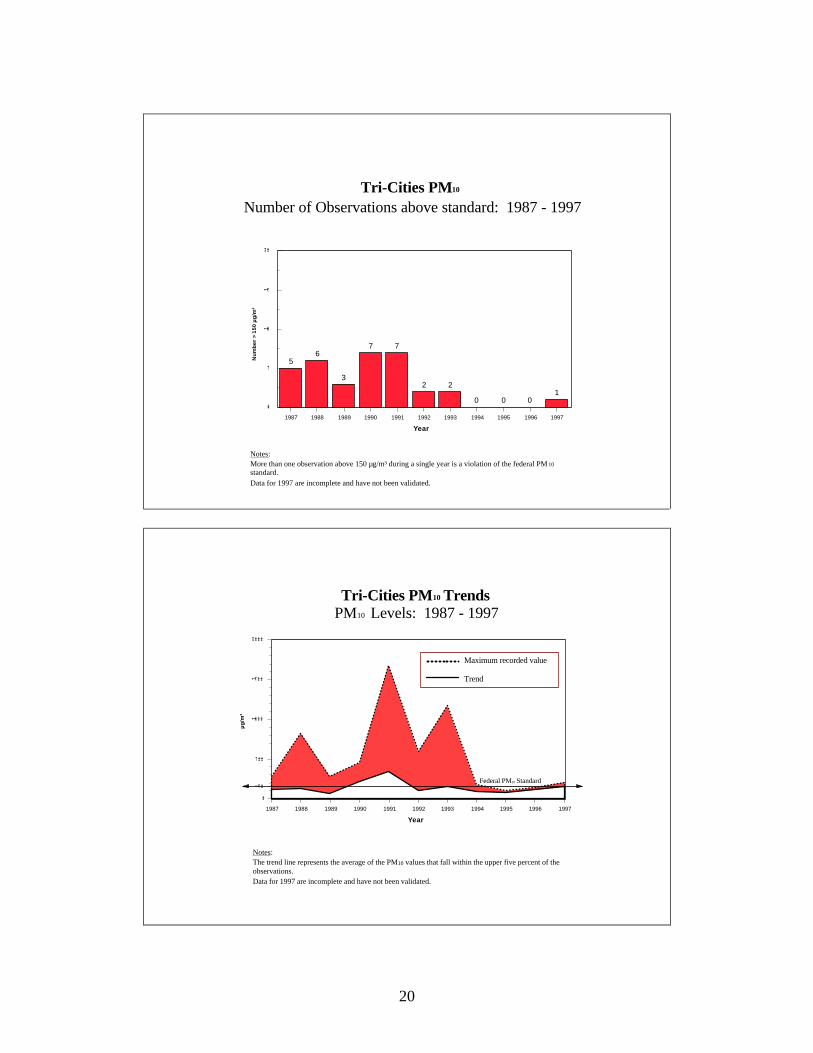
Tri-Cities PM10 Number of Observations above standard: 1987 - 1997
Notes:More than one observation above 150 µg/m³ during a single year is a violation of the federal PM 10 standard.Data for 1997 are incomplete and have not been validated.
56
3
7 7
2 2
0 0 01
1987 1988 1989 1990 1991 1992 1993 1994 1995 1996 1997
Year
0
5
10
15
20N
um
be
r >
15
0 µ
g/m
³
1987 1988 1989 1990 1991 1992 1993 1994 1995 1996 1997
Year
0
500
1000
1500
2000
150
µg
/m³
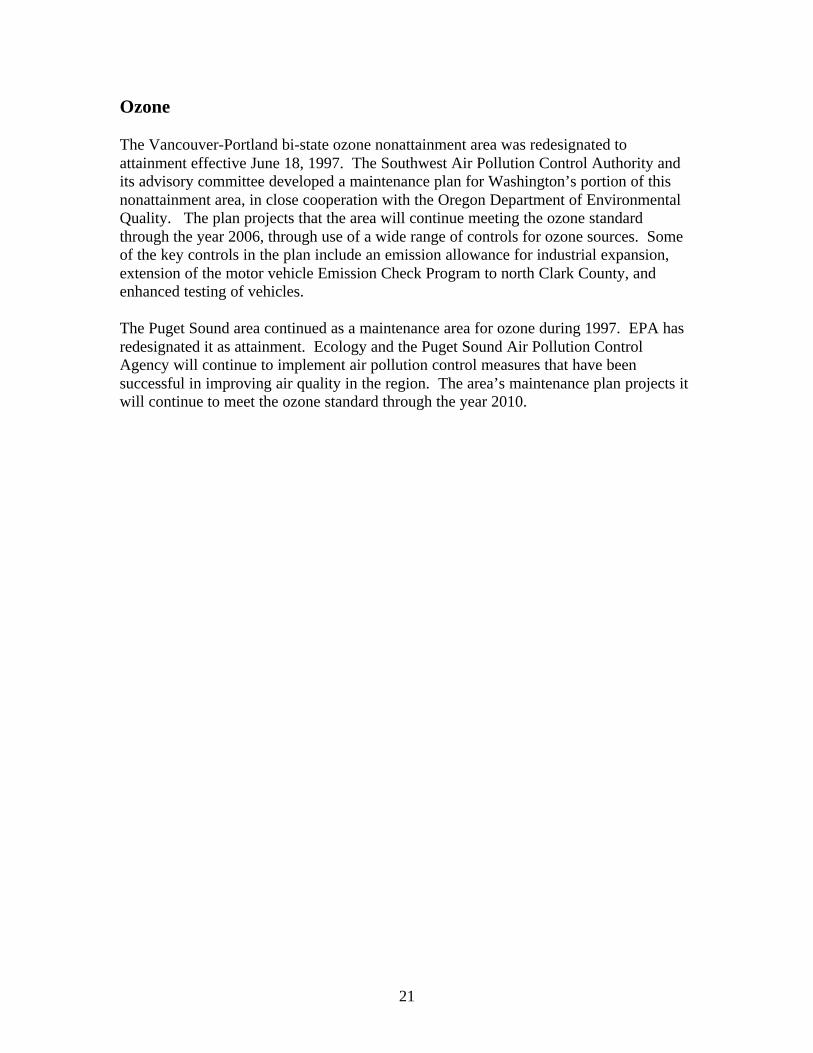
Tri-Cities PM10 TrendsPM10 Levels: 1987 - 1997
Federal PM10 Standard
Notes:The trend line represents the average of the PM10 values that fall within the upper five percent of the observations.Data for 1997 are incomplete and have not been validated.
Maximum recorded value
Trend
21
Ozone
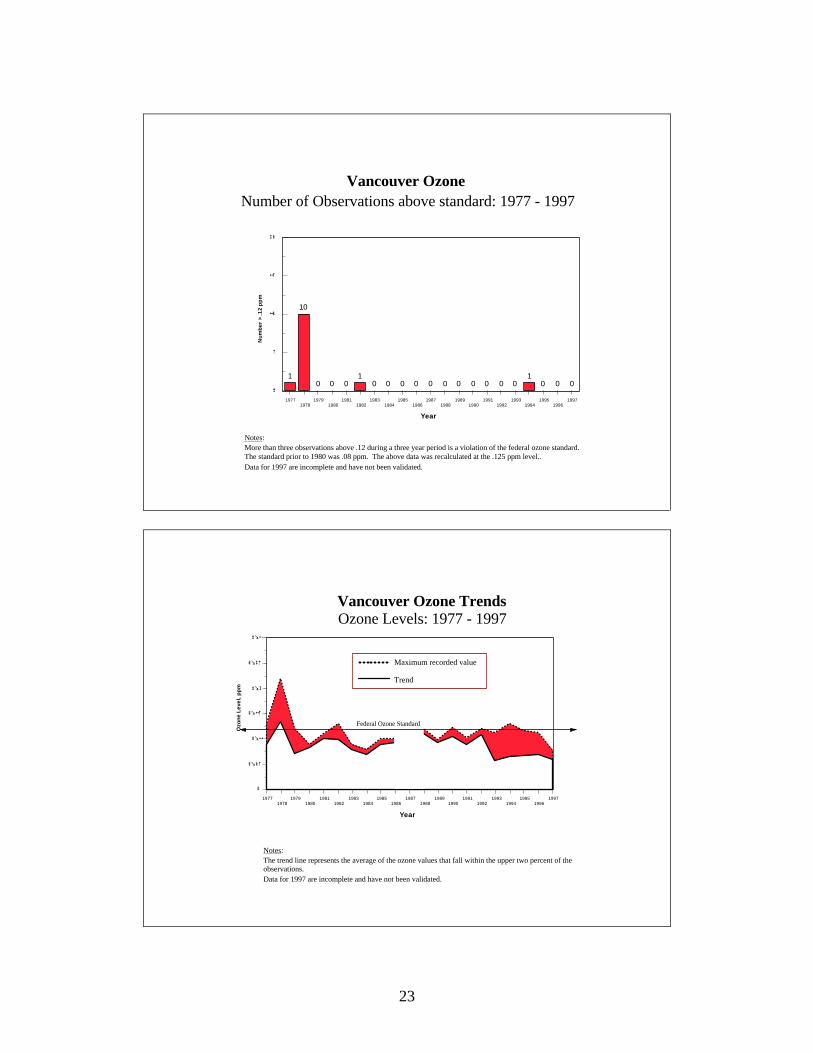
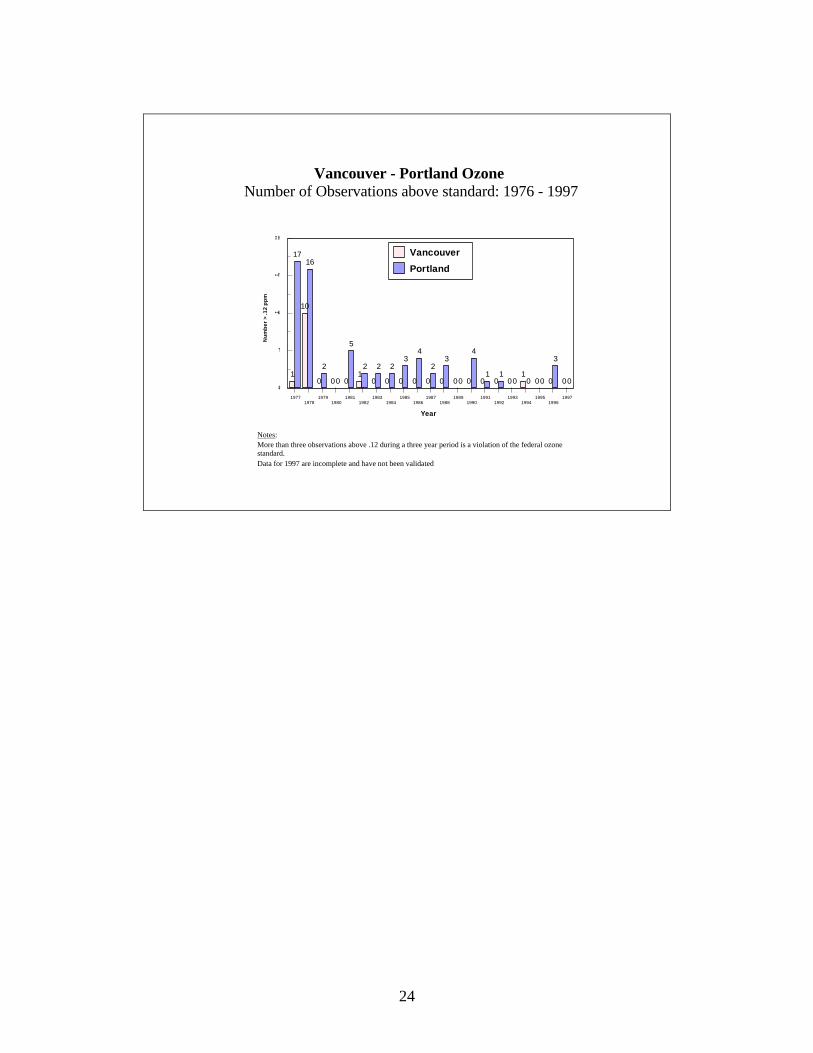
The Vancouver-Portland bi-state ozone nonattainment area was redesignated toattainment effective June 18, 1997. The Southwest Air Pollution Control Authority andits advisory committee developed a maintenance plan for Washington’s portion of thisnonattainment area, in close cooperation with the Oregon Department of EnvironmentalQuality. The plan projects that the area will continue meeting the ozone standardthrough the year 2006, through use of a wide range of controls for ozone sources. Someof the key controls in the plan include an emission allowance for industrial expansion,extension of the motor vehicle Emission Check Program to north Clark County, andenhanced testing of vehicles.
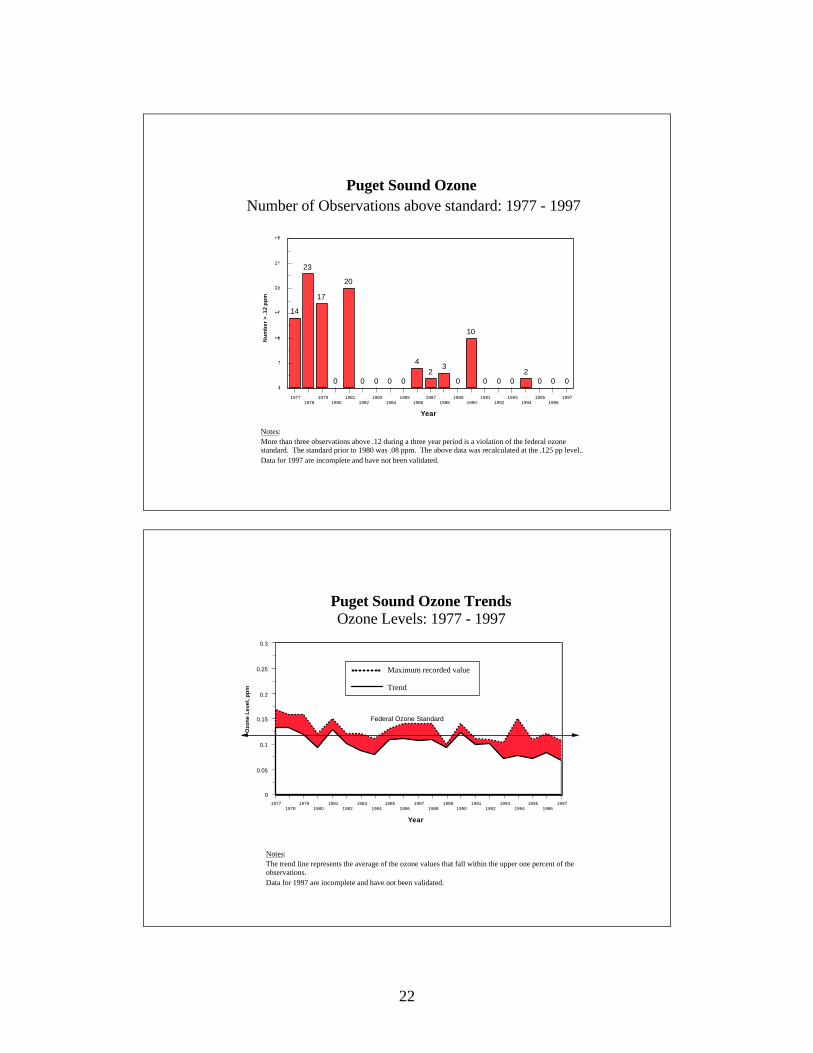
The Puget Sound area continued as a maintenance area for ozone during 1997. EPA hasredesignated it as attainment. Ecology and the Puget Sound Air Pollution ControlAgency will continue to implement air pollution control measures that have beensuccessful in improving air quality in the region. The area’s maintenance plan projects itwill continue to meet the ozone standard through the year 2010.
22
Puget Sound Ozone Number of Observations above standard: 1977 - 1997
Notes:More than three observations above .12 during a three year period is a violation of the federal ozone standard. The standard prior to 1980 was .08 ppm. The above data was recalculated at the .125 pp level..Data for 1997 are incomplete and have not been validated.
14
23
17
0
20
0 0 0 0
42
3
0
10
0 0 02
0 0 0
19771978
19791980
19811982
19831984
19851986
19871988
19891990
19911992
19931994
19951996
1997
Year
0
5
10
15
20
25
30
Nu
mb
er
> .1
2 p
pm
19771978
19791980
19811982
19831984
19851986
19871988
19891990
19911992
19931994
19951996
1997
Year
0
0.05
0.1
0.15
0.2
0.25
0.3
O
zon
e L
eve
l, p
pm
Puget Sound Ozone TrendsOzone Levels: 1977 - 1997
Notes:The trend line represents the average of the ozone values that fall within the upper one percent of the observations.Data for 1997 are incomplete and have not been validated.
Federal Ozone Standard
Maximum recorded value
Trend
23
Vancouver Ozone Number of Observations above standard: 1977 - 1997
Notes:More than three observations above .12 during a three year period is a violation of the federal ozone standard. The standard prior to 1980 was .08 ppm. The above data was recalculated at the .125 ppm level..Data for 1997 are incomplete and have not been validated.
1
10
0 0 01
0 0 0 0 0 0 0 0 0 0 01
0 0 0
19771978
19791980
19811982
19831984
19851986
19871988
19891990
19911992
19931994
19951996
1997
Year
0
5
10
15
20
Nu
mb
er
> .1
2 p
pm
19771978
19791980
19811982
19831984
19851986
19871988
19891990
19911992
19931994
19951996
1997
Year
0
0.05
0.1
0.15
0.2
0.25
0.3
Ozo
ne
Le
vel,
pp
m
Vancouver Ozone TrendsOzone Levels: 1977 - 1997
Notes:The trend line represents the average of the ozone values that fall within the upper two percent of the observations.Data for 1997 are incomplete and have not been validated.
Federal Ozone Standard
Maximum recorded value
Trend
24
Vancouver - Portland Ozone Number of Observations above standard: 1976 - 1997
Notes:More than three observations above .12 during a three year period is a violation of the federal ozone standard. Data for 1997 are incomplete and have not been validated
1716
2
0
5
2 2 23
4
23
0
4
1 10 0 0
3
01
10
0 0 01
0 0 0 0 0 0 0 0 0 0 01
0 0 0
19771978
19791980
19811982
19831984
19851986
19871988
19891990
19911992
19931994
19951996
1997
Year
0
5
10
15
20
Nu
mb
er
> .1
2 p
pm
Vancouver
Portland
25
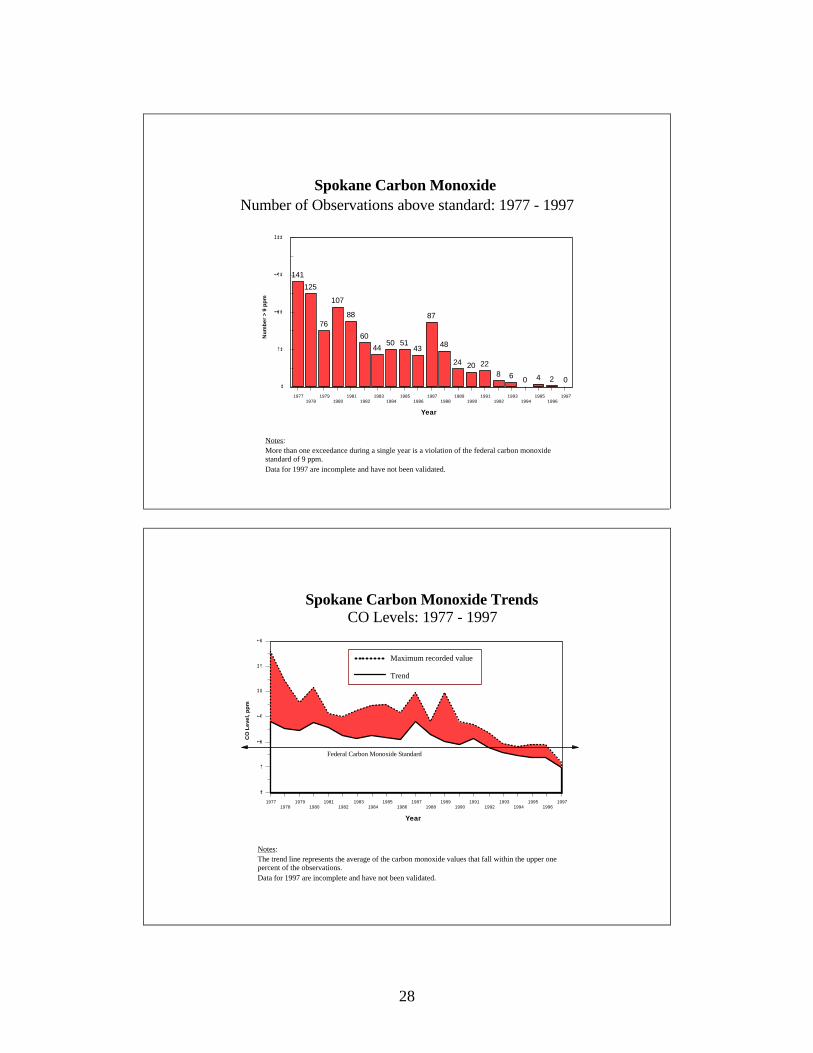
Carbon monoxide
In December 1997, EPA announced it is reclassifying Spokane from a moderate to aserious nonattainment area for carbon monoxide. Spokane’s air quality data show thatcarbon monoxide levels exceeded the standard four times in 1995 and twice in 1996.Spokane had no carbon monoxide exceedances in 1997. As a moderate nonattainmentarea, Spokane’s original deadline to meet the carbon monoxide standard was December31, 1995. EPA is required to reclassify a moderate area to “serious” if the deadline wasmissed. The new deadline for meeting the standard then becomes December 31, 2000.
A serious designation means state and local planning agencies must consider whetheradditional control measures are needed to reduce emissions of carbon monoxide in thearea. EPA, Ecology, Spokane County Air Pollution Control Authority (SCAPCA), andSpokane Regional Transportation Council have worked together to develop carbonmonoxide controls for Spokane. These include continued implementation of theEmission Check Program, with some changes (see page 40 for a description of thechanges to Spokane’s program); and use of oxygenated gasoline during the wintermonths. SCAPCA and the Spokane Regional Transportation Council have workedclosely with local citizens to develop possible additional control measures to achievefurther emission reductions. These include a public education program asking people tocarpool, bus, walk, or bicycle instead of driving on days when high levels of carbonmonoxide are predicted. If favorable trends continue, Ecology and SCAPCA may beable to apply for redesignation of Spokane as early as 1999.
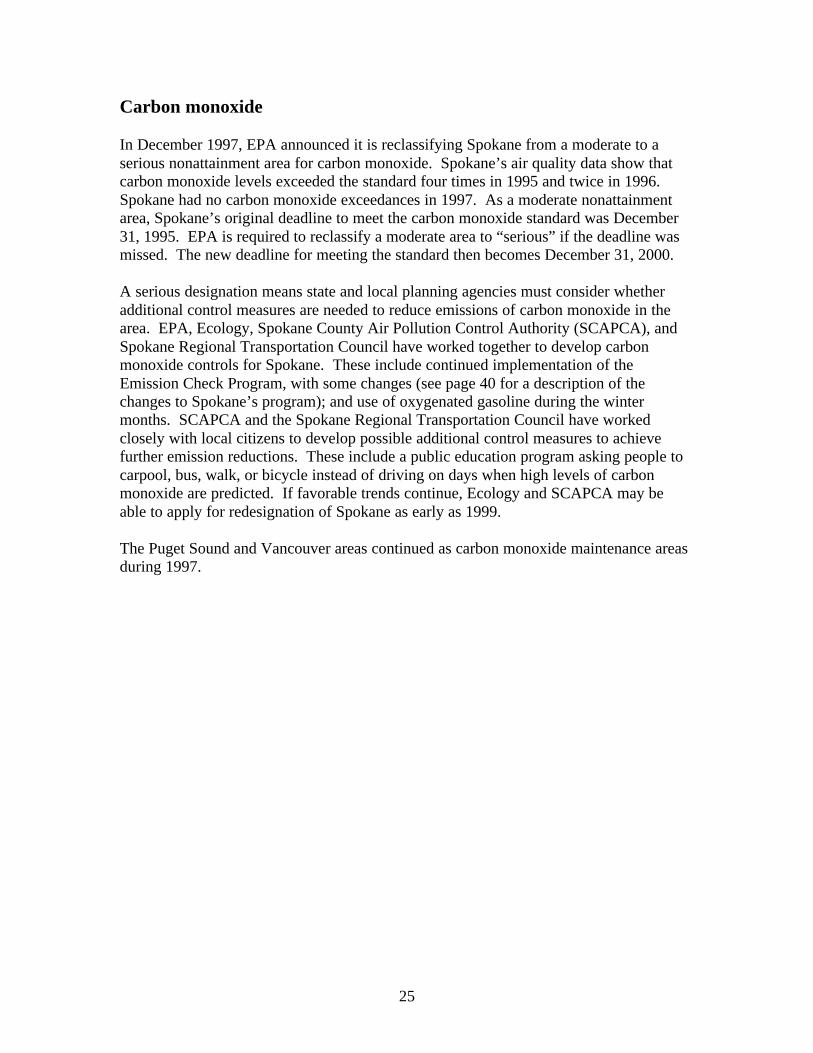
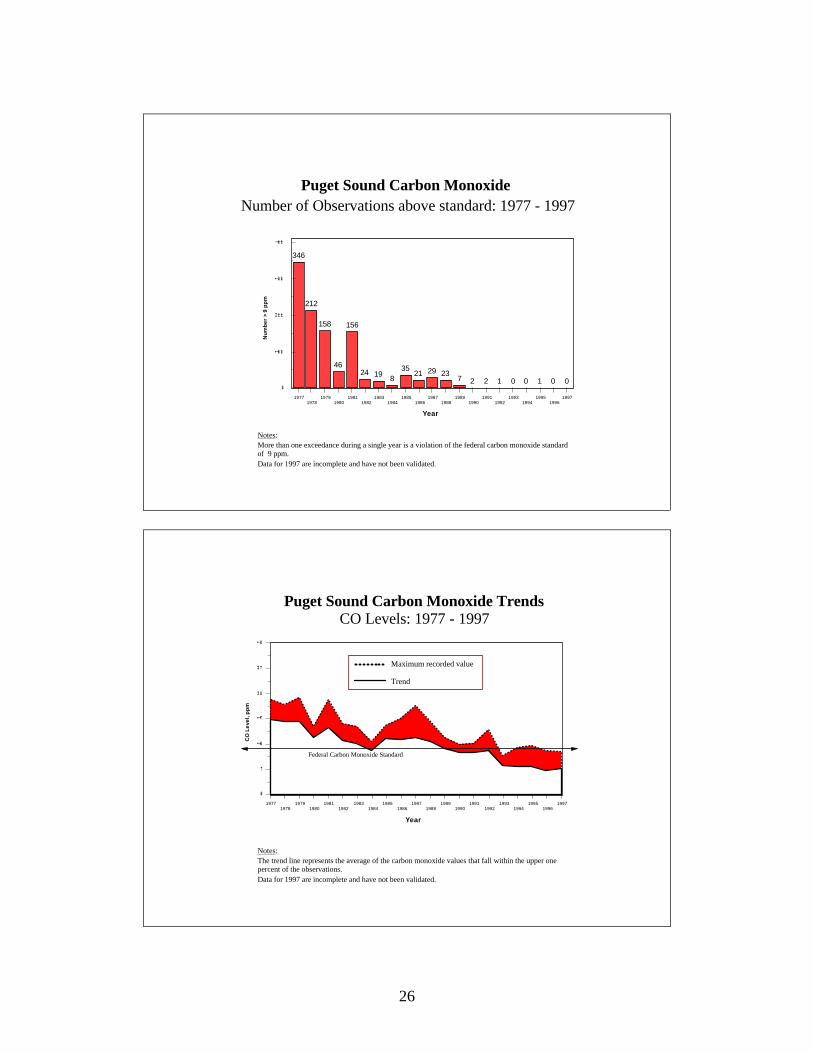
The Puget Sound and Vancouver areas continued as carbon monoxide maintenance areasduring 1997.
26
Puget Sound Carbon Monoxide Number of Observations above standard: 1977 - 1997
Notes:More than one exceedance during a single year is a violation of the federal carbon monoxide standard of 9 ppm.Data for 1997 are incomplete and have not been validated.
346
212
158
46
156
24 198
3521 29 23
7 2 2 1 0 0 1 0 0
19771978
19791980
19811982
19831984
19851986
19871988
19891990
19911992
19931994
19951996
1997
Year
0
100
200
300
400
Nu
mb
er
> 9
pp
m
19771978
19791980
19811982
19831984
19851986
19871988
19891990
19911992
19931994
19951996
1997
Year
0
5
10
15
20
25
30
CO
Le
vel,
pp
m
Puget Sound Carbon Monoxide TrendsCO Levels: 1977 - 1997
Notes:The trend line represents the average of the carbon monoxide values that fall within the upper one percent of the observations.Data for 1997 are incomplete and have not been validated.
Federal Carbon Monoxide Standard
Maximum recorded value
Trend
27
Vancouver Carbon Monoxide Number of Observations above standard: 1977 - 1997
Notes:More than one exceedance during a single year is a violation of the federal carbon monoxide standard of 9 ppm.Data for 1997 are incomplete and have not been validated.
0
15
2 2
0 01 1
0 0
43
2 2 2
0 01
0 0 0
19771978
19791980
19811982
19831984
19851986
19871988
19891990
19911992
19931994
19951996
1997
Year
0
5
10
15
20
Nu
mb
er
> 9
pp
m
19771978
19791980
19811982
19831984
19851986
19871988
19891990
19911992
19931994
19951996
1997
Year
0
5
10
15
20
25
30
CO
Le
vel,
pp
m
Vancouver Carbon Monoxide TrendsCO Levels: 1977 - 1997
Notes:The trend line represents the average of the carbon monoxide values that fall within the upper one percent of the observations.Data for 1997 are incomplete and have not been validated.
Federal Carbon Monoxide Standard
Maximum recorded value
Trend
28
Spokane Carbon Monoxide Number of Observations above standard: 1977 - 1997
Notes:More than one exceedance during a single year is a violation of the federal carbon monoxide standard of 9 ppm.Data for 1997 are incomplete and have not been validated.
141
125
76
107
88
60
4450 51
43
87
48
24 20 228 6 0 4 2 0
19771978
19791980
19811982
19831984
19851986
19871988
19891990
19911992
19931994
19951996
1997
Year
0
50
100
150
200
Nu
mb
er
> 9
pp
m
Spokane Carbon Monoxide TrendsCO Levels: 1977 - 1997
19771978
19791980
19811982
19831984
19851986
19871988
19891990
19911992
19931994
19951996
1997
Year
0
5
10
15
20
25
30
CO
Le
vel,
pp
m
Federal Carbon Monoxide Standard
Notes:The trend line represents the average of the carbon monoxide values that fall within the upper one percent of the observations.Data for 1997 are incomplete and have not been validated.
Maximum recorded value
Trend
29
Sulfur dioxide
All areas of Washington meet the sulfur dioxide standard. However, relatively highlevels of sulfur dioxide have occurred in some areas of the state, resulting in increasingpublic concern about this air pollutant. Since sulfur dioxide comes primarily fromindustrial emissions, it is controlled by regulating industrial facilities that produce it.Trends charts are shown on the following pages.
30
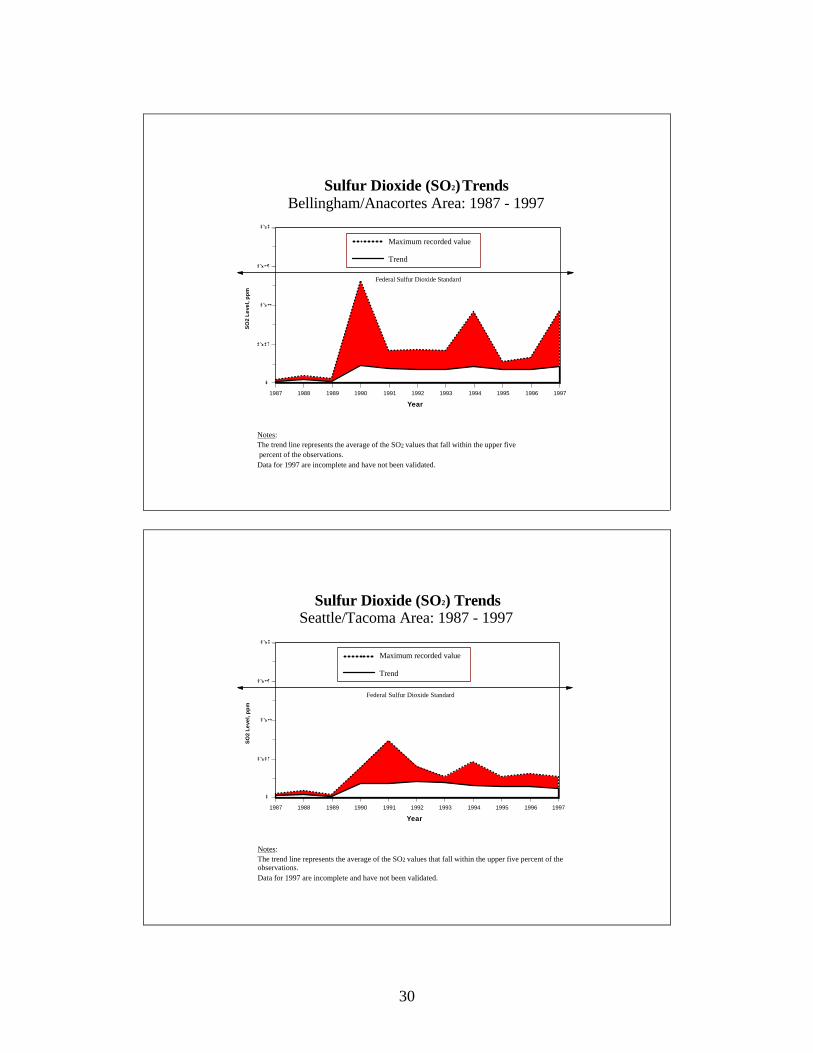
Sulfur Dioxide (SO2) TrendsBellingham/Anacortes Area: 1987 - 1997
Notes:The trend line represents the average of the SO2 values that fall within the upper five percent of the observations.Data for 1997 are incomplete and have not been validated.
1987 1988 1989 1990 1991 1992 1993 1994 1995 1996 1997
Year
0
0.05
0.1
0.15
0.2
SO
2 L
eve
l, p
pm
Maximum recorded value
Trend
Federal Sulfur Dioxide Standard
1987 1988 1989 1990 1991 1992 1993 1994 1995 1996 1997
Year
0
0.05
0.1
0.15
0.2
SO
2 L
eve
l, p
pm
Sulfur Dioxide (SO2) TrendsSeattle/Tacoma Area: 1987 - 1997
Federal Sulfur Dioxide Standard
Notes:The trend line represents the average of the SO2 values that fall within the upper five percent of the observations.Data for 1997 are incomplete and have not been validated.
Maximum recorded value
Trend
31
1987 1988 1989 1990 1991 1992 1993 1994 1995 1996 1997
Year
0
0.05
0.1
0.15
0.2
SO
2 L
eve
l, p
pm
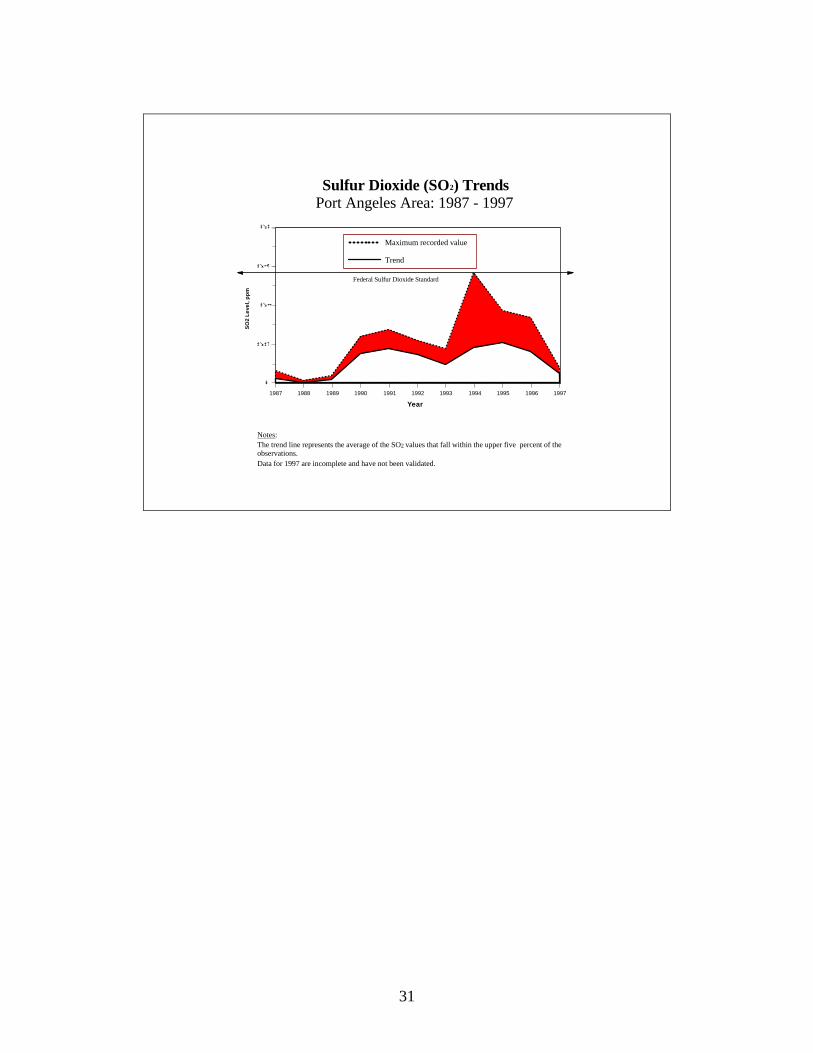
Sulfur Dioxide (SO2) TrendsPort Angeles Area: 1987 - 1997
Federal Sulfur Dioxide Standard
Notes:The trend line represents the average of the SO2 values that fall within the upper five percent of the observations.Data for 1997 are incomplete and have not been validated.
Maximum recorded value
Trend
32
Nitrogen oxides
All areas of Washington meet the nitrogen oxide standard. Because nitrogen oxideshistorically have not been a problem in Washington, Ecology has not monitored them forseveral years. Ecology began monitoring them again in 1995. Nitrogen oxides are ofconcern largely because they contribute to the formation of ozone.
Lead
Lead was a problem in Washington during the 1960s. Because of controls including thephasing out of leaded gasoline and regulation of industries that produce lead,concentrations of lead have dropped considerably. Lead monitoring is currently doneonly in the Puget Sound area and no significant concentrations have been found.
33
New Federal Air Quality Standards
EPA issued new air quality standards for particulate matter and ozone on July 18, 1997.EPA developed and proposed the new standards in response to research that foundparticulate matter and ozone are harmful to human health at levels that meet the existingstandards.
States will have up to 15 years to bring areas violating the new standards into attainment.Decisions on violations of the new particulate matter standard will be delayed for five toeight years to give states time to develop a monitoring network and obtain three years ofdata for particulate matter smaller than 2.5 microns in diameter (PM2.5).
Particulate matter
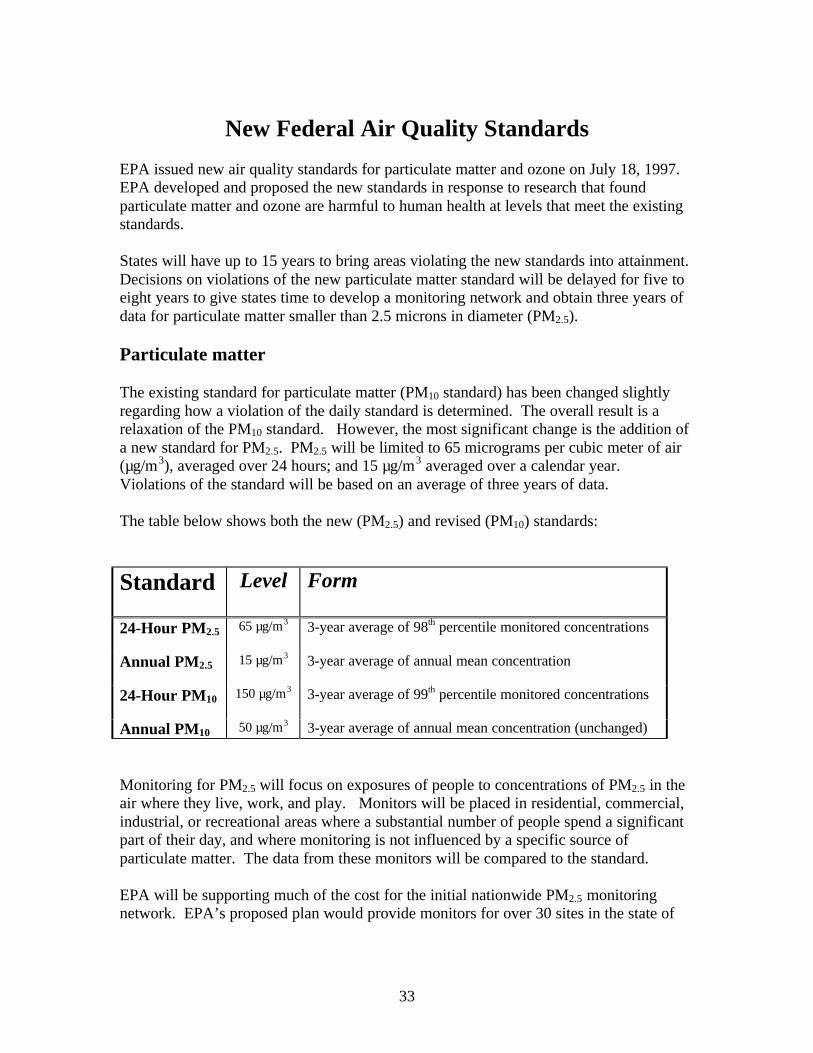
The existing standard for particulate matter (PM10 standard) has been changed slightlyregarding how a violation of the daily standard is determined. The overall result is arelaxation of the PM10 standard. However, the most significant change is the addition ofa new standard for PM2.5. PM2.5 will be limited to 65 micrograms per cubic meter of air(µg/m3), averaged over 24 hours; and 15 µg/m3 averaged over a calendar year.Violations of the standard will be based on an average of three years of data.
The table below shows both the new (PM2.5) and revised (PM10) standards:
Standard Level Form
24-Hour PM2.5 65 µg/m3 3-year average of 98th percentile monitored concentrations
Annual PM2.5 15 µg/m3 3-year average of annual mean concentration
24-Hour PM10 150 µg/m3 3-year average of 99th percentile monitored concentrations
Annual PM10 50 µg/m3 3-year average of annual mean concentration (unchanged)
Monitoring for PM2.5 will focus on exposures of people to concentrations of PM2.5 in theair where they live, work, and play. Monitors will be placed in residential, commercial,industrial, or recreational areas where a substantial number of people spend a significantpart of their day, and where monitoring is not influenced by a specific source ofparticulate matter. The data from these monitors will be compared to the standard.
EPA will be supporting much of the cost for the initial nationwide PM2.5 monitoringnetwork. EPA’s proposed plan would provide monitors for over 30 sites in the state of
34
Washington. In addition, Congress has appropriated sufficient funding for EPA to defrayall or some operation and maintenance costs for the first two years.
Ecology and local air pollution control agencies have been controlling PM10 through apermit program for industrial facilities, limitations on wood stove use, restrictions onbackyard and land clearing fires, reductions in slash burning and agricultural burning, andactions that reduce road dust and soil erosion. Air quality agencies may need to changethe ways they control particulate matter in some areas of the state in order to control thesmaller PM2.5 particles. While dust and soil erosion are a major cause of PM10, PM2.5 iscaused mainly by combustion (diesel-powered vehicles, industry, outdoor burning, andwood stoves). In some areas where controlling dust and soil erosion has been a majorfocus, wood stoves, outdoor burning, motor vehicles, and industry could become moreimportant.
It is unclear whether areas of Washington that are now designated nonattainment forPM10 would also be nonattainment for PM2.5. Based on very limited data, it appears thata few of Washington’s current PM10 nonattainment areas may remain nonattainmentunder the proposed new fine particulate standard. Ecology expects that most of the statewill meet the new standard.
Ozone
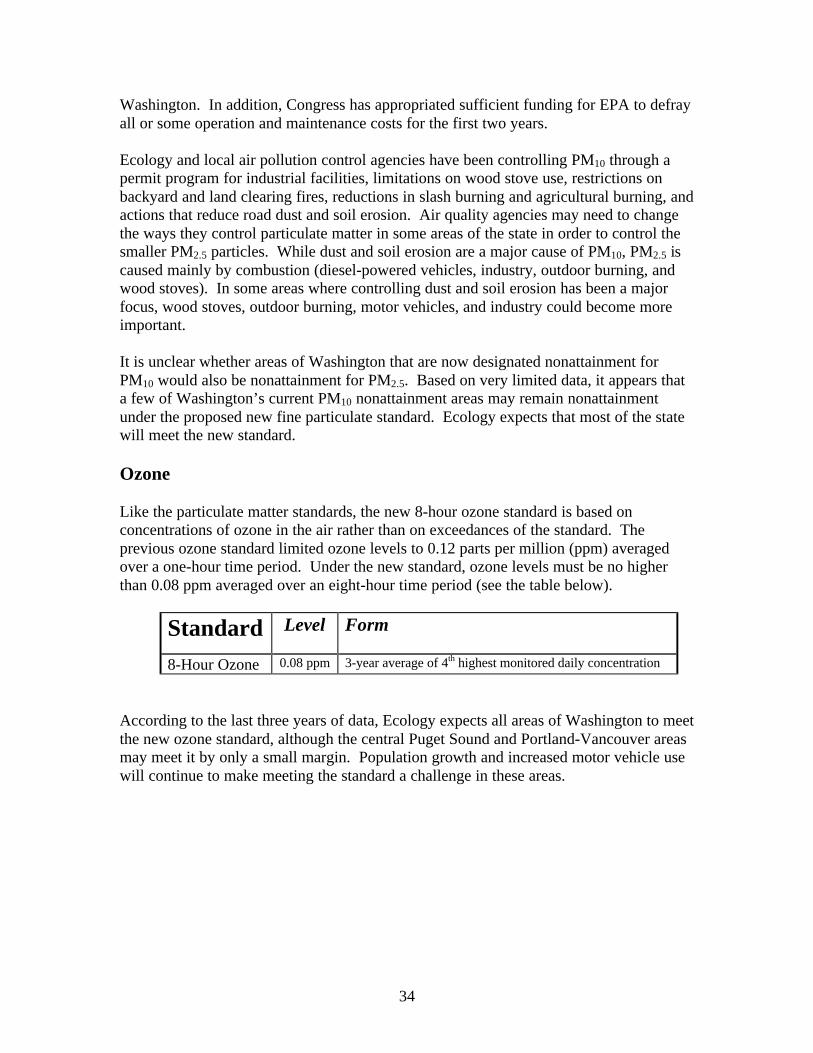
Like the particulate matter standards, the new 8-hour ozone standard is based onconcentrations of ozone in the air rather than on exceedances of the standard. Theprevious ozone standard limited ozone levels to 0.12 parts per million (ppm) averagedover a one-hour time period. Under the new standard, ozone levels must be no higherthan 0.08 ppm averaged over an eight-hour time period (see the table below).
Standard Level Form
8-Hour Ozone 0.08 ppm 3-year average of 4th highest monitored daily concentration
According to the last three years of data, Ecology expects all areas of Washington to meetthe new ozone standard, although the central Puget Sound and Portland-Vancouver areasmay meet it by only a small margin. Population growth and increased motor vehicle usewill continue to make meeting the standard a challenge in these areas.
35
Toxic Air Pollutants
Unlike the more familiar criteria air pollutants, most toxic air pollutants have no ambientair quality standard to meet. Instead, both the federal Clean Air Act and state regulationscontrol emissions of these pollutants by requiring sources of toxic air pollutants to usecontrol technology or other methods to limit their emissions of these pollutants. Many ofthe actions that reduce emissions of criteria pollutants, such as applying coatings moreefficiently, keeping motor vehicles in good repair, and capturing emissions frommanufacturing facilities, also reduce emissions of toxics.
The impacts of toxic air pollutants are not very well understood. Frequently, we don’tknow how much of them are emitted, what their concentrations are in the air, or whatspecific health effects they cause. Mixtures of toxic air pollutants, which can be expectedto occur in urban areas, are even less well understood. Therefore, both state and federalregulations take the “ounce of prevention” approach of minimizing or eliminatingemissions wherever practical.
In addition to minimizing emissions of toxic air pollutants, the Air Quality Programwould like to better understand how much toxic pollution is in the air, and how it getsthere. During 1997, Ecology made progress on both minimizing and understandingemissions.
To minimize emissions, Ecology’s Air Quality Program continued to work with EPA toset specific control technology requirements for aluminum smelters, pulp mills, and boatand reinforced plastics manufacturers. Staff worked with local air authorities and withmanufacturers to limit emissions of toxics from new or expanding facilities. Staff alsoworked with EPA on a project to help determine whether or not manufacturing facilitiesstill pose health risks after they have installed required control technology.
Improving our understanding of toxic pollutants in the air we breathe is an ongoingproject. During 1997, staff has been gathering data from previous studies, and designinga new study to complement the existing data – looking at different types of toxics atdifferent times of the year than have previously been measured. Staff has also beencomparing information from existing databases. For example, some facilities report theiremissions to the Toxics Release Inventory annually, and some report their emissions tothe Air Quality Program's emissions database. Combining the information on thesereported emissions with calculations of predicted emissions from manufacturingprocesses will give us an idea of what toxics are being emitted into the air. This, alongwith measurements in the air, will eventually let us know if there are “trouble spots” thatneed work, or if the “ounce of prevention” approach has been successful.
36
Emission Check Program
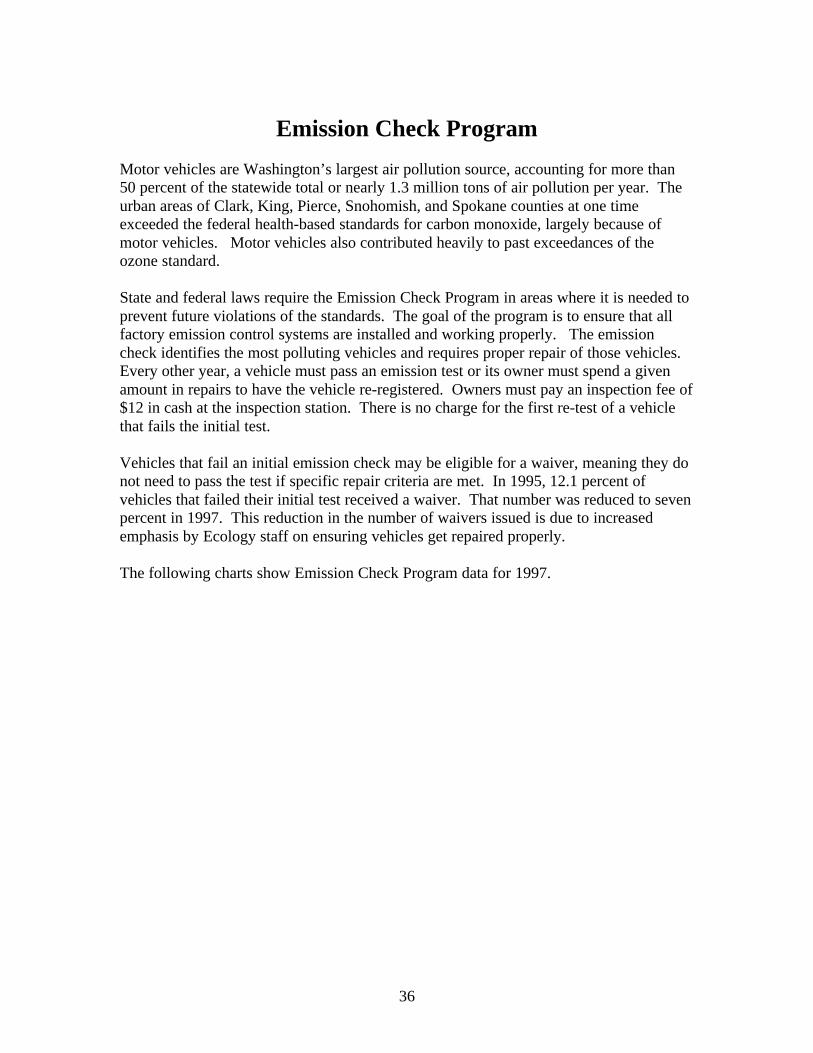
Motor vehicles are Washington’s largest air pollution source, accounting for more than50 percent of the statewide total or nearly 1.3 million tons of air pollution per year. Theurban areas of Clark, King, Pierce, Snohomish, and Spokane counties at one timeexceeded the federal health-based standards for carbon monoxide, largely because ofmotor vehicles. Motor vehicles also contributed heavily to past exceedances of theozone standard.
State and federal laws require the Emission Check Program in areas where it is needed toprevent future violations of the standards. The goal of the program is to ensure that allfactory emission control systems are installed and working properly. The emissioncheck identifies the most polluting vehicles and requires proper repair of those vehicles.Every other year, a vehicle must pass an emission test or its owner must spend a givenamount in repairs to have the vehicle re-registered. Owners must pay an inspection fee of$12 in cash at the inspection station. There is no charge for the first re-test of a vehiclethat fails the initial test.
Vehicles that fail an initial emission check may be eligible for a waiver, meaning they donot need to pass the test if specific repair criteria are met. In 1995, 12.1 percent ofvehicles that failed their initial test received a waiver. That number was reduced to sevenpercent in 1997. This reduction in the number of waivers issued is due to increasedemphasis by Ecology staff on ensuring vehicles get repaired properly.
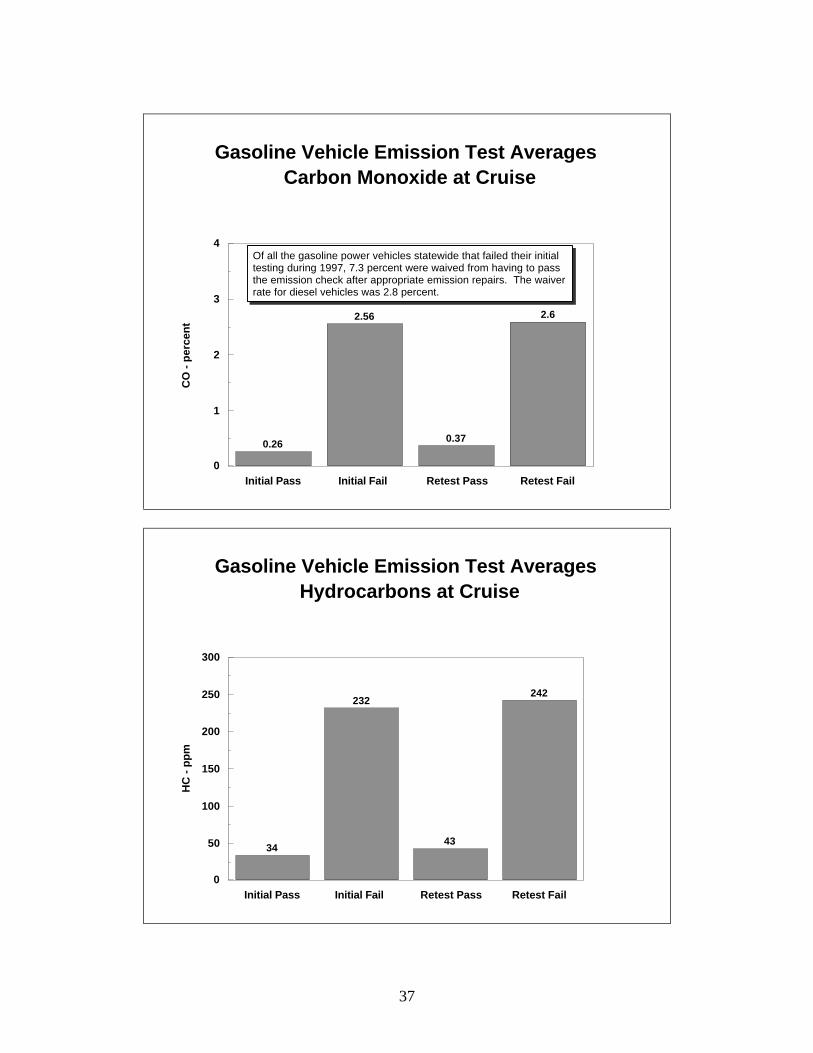
The following charts show Emission Check Program data for 1997.
37
Gasoline Vehicle Emission Test Averages Carbon Monoxide at Cruise
0.26
2.56
0.37
2.6
Initial Pass Initial Fail Retest Pass Retest Fail0
1
2
3
4
CO
- p
erce
nt
Gasoline Vehicle Emission Test Averages Hydrocarbons at Cruise
34
232
43
242
Initial Pass Initial Fail Retest Pass Retest Fail0
50
100
150
200
250
300
HC
- p
pm
Of all the gasoline power vehicles statewide that failed their initialtesting during 1997, 7.3 percent were waived from having to passthe emission check after appropriate emission repairs. The waiverrate for diesel vehicles was 2.8 percent.
38
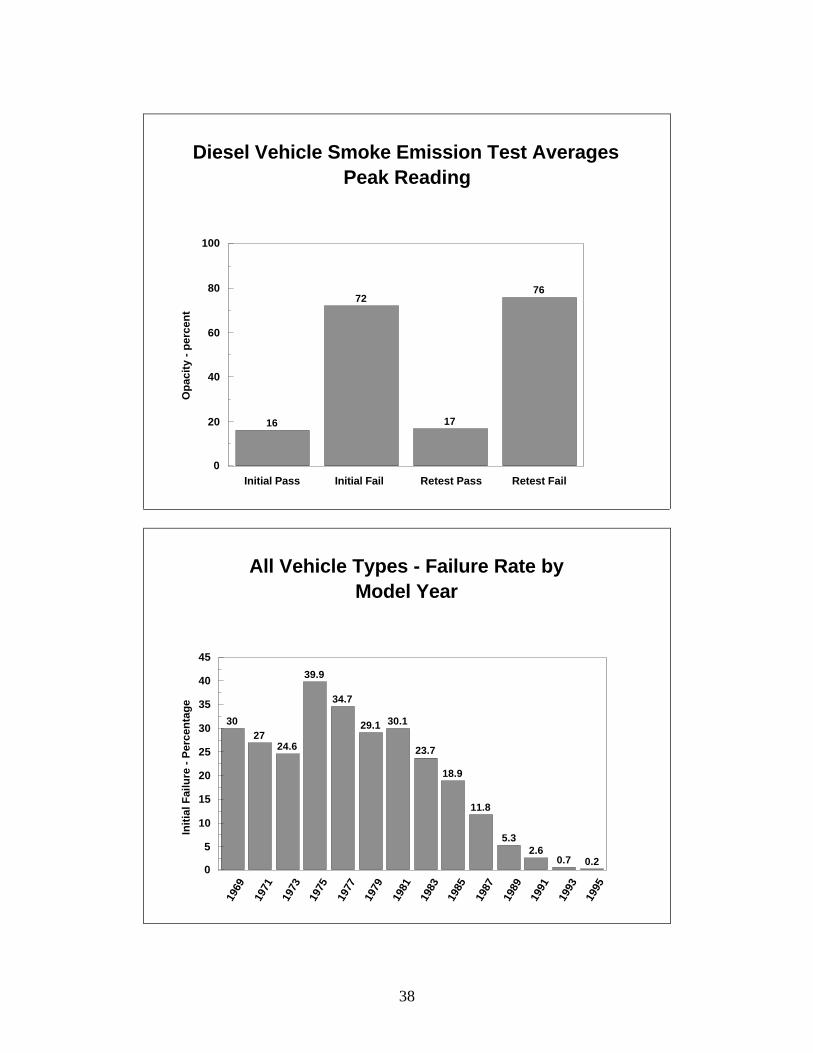
Diesel Vehicle Smoke Emission Test AveragesPeak Reading
16
72
17
76
Initial Pass Initial Fail Retest Pass Retest Fail0
20
40
60
80
100
Op
acit
y -
per
cen
t
All Vehicle Types - Failure Rate byModel Year
3027
24.6
39.9
34.7
29.1 30.1
23.7
18.9
11.8
5.32.6
0.7 0.2
1969
1971
1973
1975
1977
1979
1981
1983
1985
1987
1989
1991
1993
1995
0
5
10
15
20
25
30
35
40
45
Init
ial F
ailu
re -
Per
cen
tag
e
39
Program upgrades
During 1997, Ecology upgraded the Emission Check Program in the Clark County andSpokane areas to obtain greater emission reductions. In the Puget Sound area, the localagency requested an evaluation on how the impact of the Emission Check Program onvehicle owners could be lessened without losing the emission reductions being achieved.
Clark County
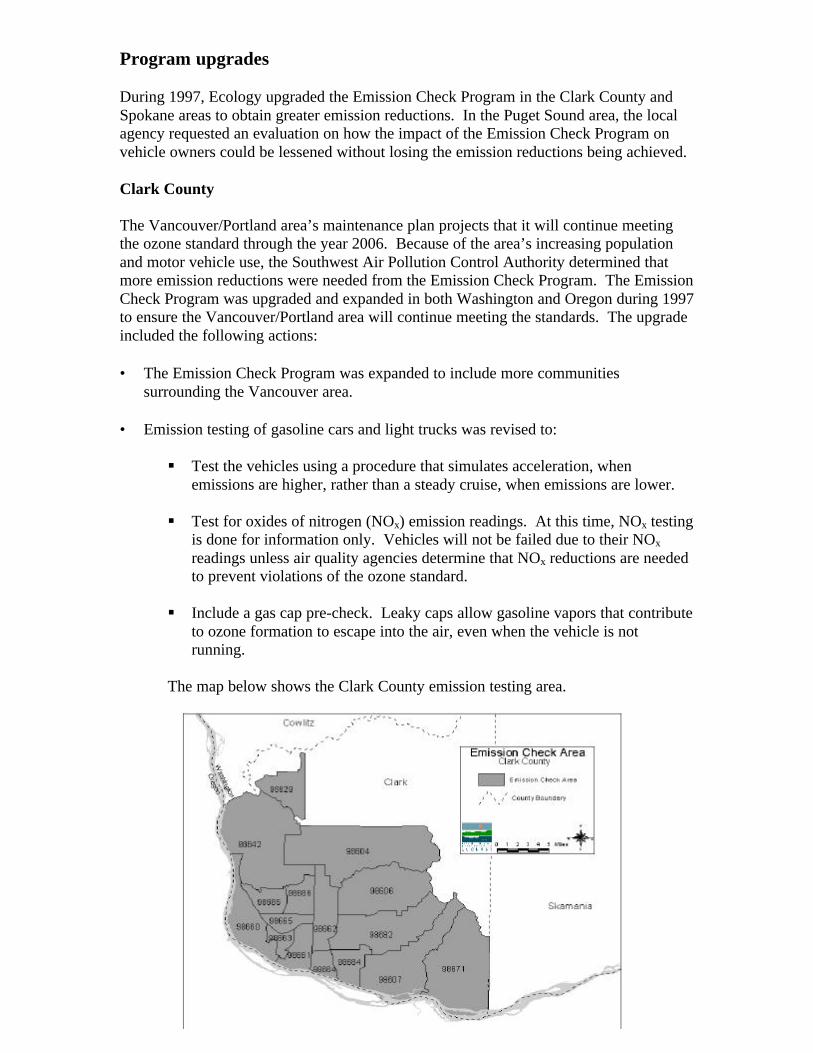
The Vancouver/Portland area’s maintenance plan projects that it will continue meetingthe ozone standard through the year 2006. Because of the area’s increasing populationand motor vehicle use, the Southwest Air Pollution Control Authority determined thatmore emission reductions were needed from the Emission Check Program. The EmissionCheck Program was upgraded and expanded in both Washington and Oregon during 1997to ensure the Vancouver/Portland area will continue meeting the standards. The upgradeincluded the following actions:
• The Emission Check Program was expanded to include more communitiessurrounding the Vancouver area.
• Emission testing of gasoline cars and light trucks was revised to:
§ Test the vehicles using a procedure that simulates acceleration, whenemissions are higher, rather than a steady cruise, when emissions are lower.
§ Test for oxides of nitrogen (NOx) emission readings. At this time, NOx testingis done for information only. Vehicles will not be failed due to their NOx
readings unless air quality agencies determine that NOx reductions are neededto prevent violations of the ozone standard.
§ Include a gas cap pre-check. Leaky caps allow gasoline vapors that contributeto ozone formation to escape into the air, even when the vehicle is notrunning.
The map below shows the Clark County emission testing area.
40
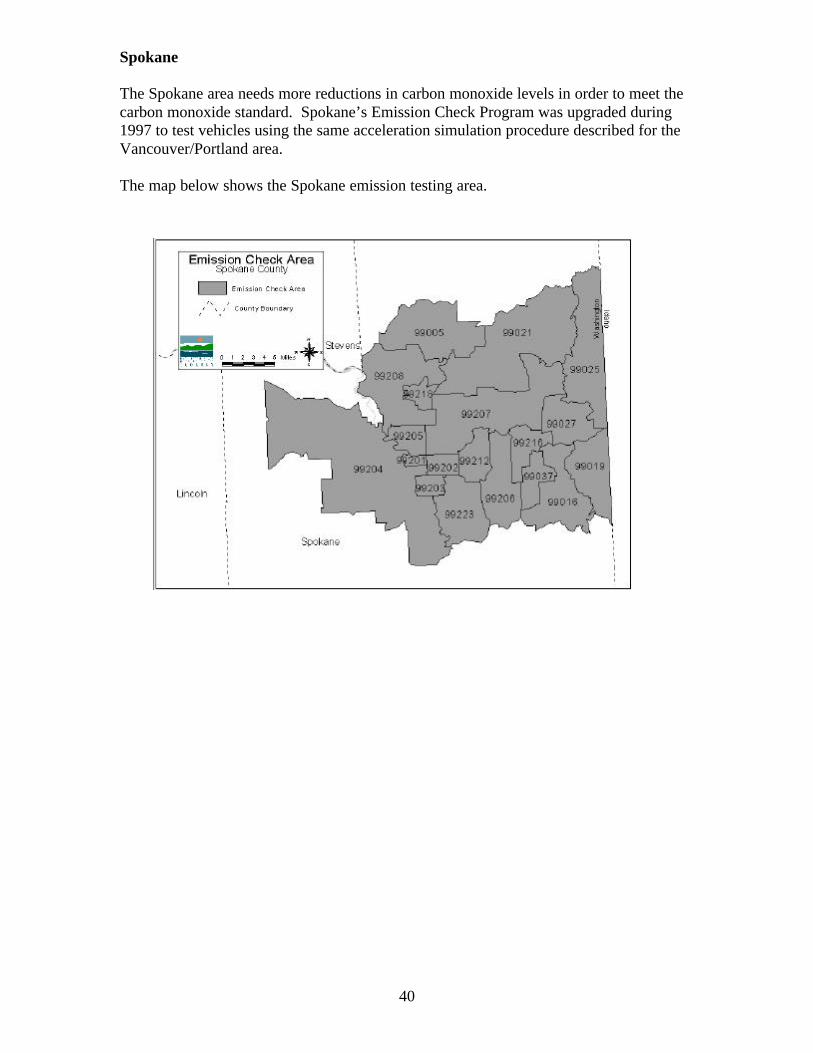
Spokane
The Spokane area needs more reductions in carbon monoxide levels in order to meet thecarbon monoxide standard. Spokane’s Emission Check Program was upgraded during1997 to test vehicles using the same acceleration simulation procedure described for theVancouver/Portland area.
The map below shows the Spokane emission testing area.
41
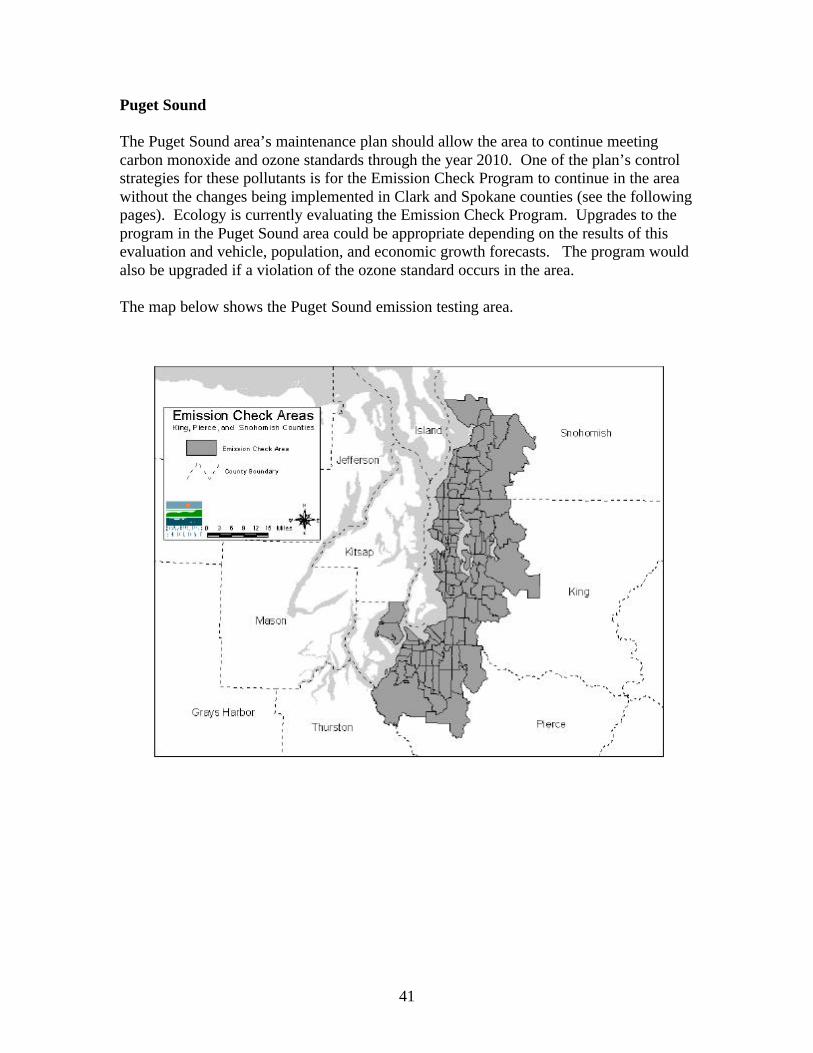
Puget Sound
The Puget Sound area’s maintenance plan should allow the area to continue meetingcarbon monoxide and ozone standards through the year 2010. One of the plan’s controlstrategies for these pollutants is for the Emission Check Program to continue in the areawithout the changes being implemented in Clark and Spokane counties (see the followingpages). Ecology is currently evaluating the Emission Check Program. Upgrades to theprogram in the Puget Sound area could be appropriate depending on the results of thisevaluation and vehicle, population, and economic growth forecasts. The program wouldalso be upgraded if a violation of the ozone standard occurs in the area.
The map below shows the Puget Sound emission testing area.
42
Program evaluation
Air Quality Program staff began an evaluation of the Emission Check Program in January1997. Teams evaluated the program in the areas of:
• selection of vehicles for testing;• inspection fees;• testing procedures and standards;• vehicle repairs;• customer service;• compliance; and• contractor performance.
The objectives of the evaluation were to: (1) evaluate the effectiveness of the currentprogram; (2) propose ways to change the program to minimize its impact on vehicleowners while continuing to benefit air quality; and (3) evaluate the proposed changes foreffectiveness and efficiency.
The first phase of the evaluation was a comprehensive review and analysis of the currentprogram. Teams surveyed vehicle owners, the testing contractor, repair shops andtechnicians, and the Department of Licensing to determine the level of programacceptance and types of changes desired. Some of the survey results are as follows:
• A contractor survey indicates that vehicle owners would prefer a payment methodother than cash only for the test. Most preferred to pay by check. However, at thesame time, 85 percent of those surveyed are not willing to pay a service charge for theconvenience of being able to pay by check.
• Many of the survey comments questioned the need for testing newer cars. Analysisof the test results indicates that newer vehicles could be exempt without significantlosses in emission reductions.
• Results of a compliance survey conducted by field staff indicate that the actualpercentage of vehicles being tested is about 10 percent less than the 90-96 percentestimate in the State Air Quality Plan.
• A survey of the repair shops indicates that vehicle owners are spending more onrepairs than the waiver requirement of $100 to $150. A pilot repair assistance projectin Clark County proved that many of the worst polluting vehicles can repaired forunder $300.
In addition to surveys, staff collected data on other states’ emission testing programs,including:
• How other states select vehicles for emission testing. Elements of this includeexemptions, the use of remote sensing, change of ownership tests, failure rate by
43
model year for different vehicle types, and the relationship between model year andvehicle manufacturer and emission readings.
• How emission checks are paid for in other states, as well as the costs andramifications of alternatives to the present cash fee at the test station.
• How Washington’s testing procedures and test standards compare with those of otherstates and EPA recommendations.
• How Washington’s training of auto repair technicians compares with that of otherstates.
• The effectiveness of emission repairs for failed vehicles, and ways repaireffectiveness is improved.
• Possible ways to improve customer service by Ecology and the test stations.
• The number of vehicles in emission check areas that have been tested and reasons forexempting those not tested.
The next phase of the evaluation investigated possible program revisions. Possiblerevisions focus on more accurately targeting those vehicles causing air quality problems;improving cost effectiveness of the program; improving customer convenience; andensuring the Emission Check Program is effective in improving air quality.
Air Quality Program staff are now working to develop packages of recommendedrevisions to the program. The evaluation is scheduled to be completed in early 1998. Atthat time legislators and interested parties will be invited to review and comment on thefindings.
44
Stage 2 Gasoline Refueling Vapor Recovery
Gasoline vapors accumulate within storage tanks in the space above the liquid gasoline.When a tank is refilled with gasoline, the rising liquid pushes accumulated vapors outinto the air. These vapors contain volatile organic compounds, which affect humanhealth and contribute to ozone pollution. Stage 2 gasoline vapor recovery systems collectgas fumes from vehicle fuel tanks when gasoline is pumped so the fumes are not releasedto the atmosphere. If gasoline fumes are not released, they do not turn into ozone,resulting in cleaner air.
The 1996 Washington State Legislature directed Ecology to determine where in westernWashington Stage 2 is needed to meet or maintain the ozone standard in ozonemaintenance. Maintenance areas of concern are the Central Puget Sound area (King,Pierce, and Snohomish counties) and the Vancouver/Portland area (Clark County).
During 1997, the Air Quality Program conducted a photochemical modeling study ofgasoline refueling in western Washington to determine whether and where Stage 2 isimportant in managing ozone. Based on study findings, Stage 2 will continue in Thurstonand Cowlitz counties at gas stations selling more than 1.2 million gallons of gasolineannually, and at stations in Kitsap County selling more than 840,000 gallons annually.Stage 2 may be removed at gas stations in Whatcom, Skagit, Lewis, Wahkiakum, andIsland counties. Final adoption of a new regulation took place in late 1997.
Stage 2 continues at larger stations in Cowlitz, Thurston, and Kitsap counties becausevapor controls in these counties are important to maintaining the ozone standard in thePortland/Vancouver and Central Puget Sound ozone maintenance areas. Volatile organiccompounds released by gasoline refueling in Whatcom, Skagit, Lewis, Wahkiakum, andIsland counties do not appear to increase ozone levels in the maintenance areas.
45
Protecting Visibility
Washington’s scenic beauty is often hidden by clouds and rain. Weeks can go by withoutbeing able to see more than a mile in the distance. Occasionally, however, the weatherclears and the views appear. The magnificence of our landscape is never more apparentthan on those cold, crisp, clear winter days when it seems one can see forever. The reasonthe views are so clear is that we are looking through very clean air that has recently comedown from the arctic and has almost no suspended particles of any kind obscuring ourview.
Sometimes that clear, clean arctic air will stop moving, held by a high pressure inversion.When this happens, the air becomes filled with small particles from a variety of sources.These sources include all types of combustion (oil, wood, gas, coal etc), dust resultingfrom vehicle tires grinding small particles ever smaller until they literally float in the air,and industrial processes and motor vehicles that release gases which chemically formaerosols in the air. Colors in the distance begin to dull and the edges of objects begin tosoften. If the inversion goes on long enough, entire mountain ranges can fade from viewand a ceiling will appear, with clean air above and dirty air below. The dirty air belowimpairs our visibility.
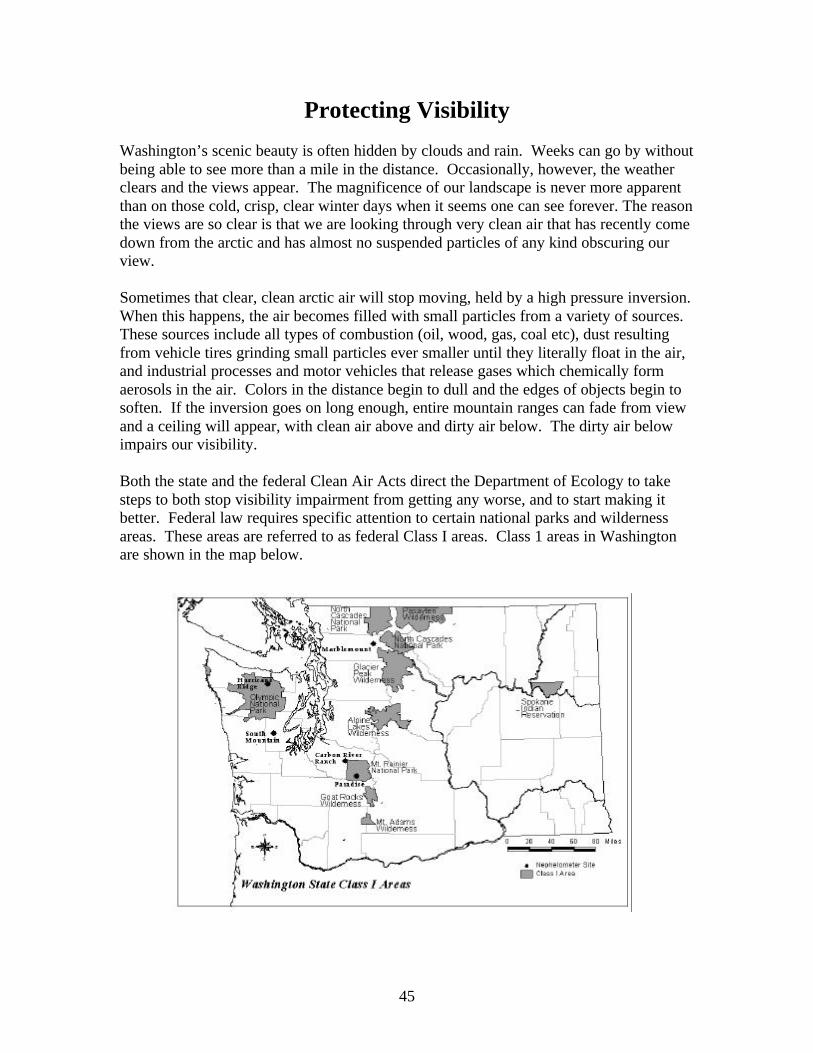
Both the state and the federal Clean Air Acts direct the Department of Ecology to takesteps to both stop visibility impairment from getting any worse, and to start making itbetter. Federal law requires specific attention to certain national parks and wildernessareas. These areas are referred to as federal Class I areas. Class 1 areas in Washingtonare shown in the map below.
46
Ecology’s plans for protecting and improving visibility in Class 1 areas are contained inthe air quality State Implementation Plan (SIP). In 1997, Ecology formally reviewed thevisibility portion of the SIP with the help of the Department of Natural Resources,Environmental Protection Agency, U.S. Park Service, and U.S. Forest Service. Inreviewing and making determinations about revising the SIP, staff analyzed emissiondata to pinpoint trends in visibility. Because the period of most concern is June throughSeptember (when park and wilderness area visitation is at its highest and warmer aircarries pollution to the higher elevations), staff created an emission inventoryrepresenting a typical summer weekday. The inventory calculated actual emissions ofsulfur dioxide, nitrogen oxides, and particulate matter for 1985 and 1994, and projectedemissions for the year 2006. It included the following source categories:
• On-road vehicles (cars, trucks, motorcycles)• Non-road equipment and vehicles (aircraft, boats, trains, heavy equipment, lawn and
garden equipment)• Agricultural windblown dust• Prescribed burning (the controlled burning of forest debris)• Point sources (large commercial/industrial facilities)
Ecology’s review of all the above pollutant emissions combined showed no real trend inpollutant emissions from 1985 to 1994. The inventory projects a moderate decrease inemissions from 1994 to 2006. From the emission inventory and various studies abouthow individual pollutants affect visibility, preliminary indications are that priority shouldcontinue to be given to reducing emissions of sulfur dioxide and carbon, and a lesserpriority to controlling dust and nitrogen oxides.
The results of Ecology’s review were published in a report to the public titled Review ofthe Washington State Visibility Protection State Implementation Plan Final Report(Publication No. 97-206). The report includes recommendations to revise the SIP. Thereview concluded that:
• reasonable progress has been made in protecting Class I areas from the impacts ofvisible plumes from slash burns and other sources; and
• the existing plan will continue to protect Class I areas from these sources, but is notadequate to protect these areas from impairment caused by “regional haze.” Regionalhaze is the result of the combined emissions of all types of pollutants by all types ofsources, over a large geographic area.
Also during 1997, Ecology:
• operated and expanded the visibility monitoring network;
• participated in federal efforts to develop a regional haze regulatory program;
47
• worked with Department of Natural Resources to improve the state’s SmokeManagement Plan;
• consulted with Federal Land Managers regarding plans to reintroduce fire as a naturaland beneficial part of the wildland ecosystem; and
• worked with local air agencies to start urban visibility programs.
Ecology’s proposal to revise the visibility SIP to protect and improve visibility in thestate marks a significant initiative that will require participation from a wide variety ofgroups and individuals. Ecology will be asking representatives of all levels ofgovernment, various types of industries (including the tourism industry), healthorganizations, environmental organizations and interested citizens to participate in thisinitiative. Participants will be asked to weigh the costs and benefits of programs toimprove and protect the visibility in our state and make recommendations to the agencyon the timing, extent, and focus of a program that would be supported by the state’scitizens. In addition to improving visibility, a regional haze program will result in areduction of emissions that are also of concern for health reasons.
48
Grass Seed Field Burning
Commercially valuable grasses are grown, primarily in eastern Washington, to produceseed used in lawns, landscaping, and golf courses. Farmers typically burn the fields afterthe seeds have been harvested, usually during July, August, and September. The burningclears the field of waste straw and may help control weeds, insects, and disease. Somefarmers believe the burning helps the plant produce greater amounts of seed. Fieldburning also produces large amounts of smoke that contains high levels of smallparticulate matter and compounds that are harmful to human health.
During the burning season, growers have attempted to reduce the impact from smoke bydirecting smoke away from local population centers and burning only under favorableweather conditions. However, this does not reduce emissions, but only seeks to minimizeimpacts of burning. Despite these attempts to manage the smoke, smoke from fieldburning has been a continual problem, particularly in areas near population centers. Anintense debate regarding the health impacts and economic benefits of field burning hasbeen going on for several years.
Ecology’s Air Quality Program began to phase-down grass seed field burning in 1996following research findings that fine particulate matter contained in smoke from fieldburning can cause serious human health problems. Grass burning in 1996 was one-thirdless than in 1995 (about 37,000 acres in 1996, compared to about 60,000 acres in 1995).
Public pressure continued throughout 1997. Ecology and the Governor’s office receivedover 600 cards and letters demanding an end to grass seed field burning. During 1997,Ecology adopted changes to the agricultural burning regulation which further restrictedgrass field burning to one-third of the 1995 level (the amount of burning in 1997 isestimated to have been just under 20,000 acres). In the fall of 1997, the Air QualityProgram returned to its process of certifying alternatives to grass seed field burningwhich are generally practical, reasonably available, and economical. The timeline forthis process has Ecology announcing its proposal on alternatives in early March of 1998and making decisions about alternatives by June 1998.
Most farmers complied with burning restrictions. Ecology’s stronger compliance andenforcement activities on grass field burning during 1997 resulted in penalties for thosewho burned more than the allowed amount of acreage.
49
Columbia Plateau Project
Through the Columbia Plateau Project, Ecology continues to work on determining howmuch of the PM10 in eastern Washington comes from natural rather than human-causedsources. This project is particularly important to both the Spokane and Wallula PM10
nonattainment areas because they are impacted by windblown dust coming from outsidetheir boundaries.
The Columbia Plateau is a large area in southeastern Washington, northeastern Oregon,and parts of the Idaho panhandle. It is a mostly rural, agricultural area with low rainfall.In the late 1980s and early 1990s, the region experienced a number of dust storms. Thesewere caused by a period of low rainfall throughout the Pacific Northwest. During manyof these dust storms, the PM10 standard was exceeded at several monitors in the area.The Columbia Plateau Project is a cooperative effort of Ecology, EPA, and the U.S.Department of Agriculture. It has helped agency staff, growers, and researchers gain anunderstanding of the situation and of our ability to control or minimize the impact of dustemissions during these storms.
During 1997, project staff focused on technical research, development of controlmeasures, economic analysis, and air quality planning.
Technical research
Scientists from Washington State University, the University of Washington, University ofIdaho, Agricultural Research Service, and other agencies have analyzed many aspects ofthe problem of windblown dust. They have:
• identified areas where soils erode the most;• determined particulate matter concentrations in the air during dust storms using
computer modeling;• evaluated potential control measures that increase residue on fallow fields, increase
cropping, and otherwise provide lower emissions of particulate matter from fields;and
• worked toward identifying the source of windblown dust found in Spokane andKennewick during dust storms.
Control measures
A very important aspect of the project is the testing of options for controlling dustemissions from agricultural fields and other areas. Numerous control projects have beenongoing for two to three years. These include projects to investigate increasing residueon fallow fields, increasing the amount of time fields are cropped, use of minimum or no-till farming, and use of cover crops. Most of these projects are on-farm tests on largeplots with involvement from the growers.
50
Economic analysis
Staff conducted a large survey of people in the Spokane and TriCities areas regardingdust storms and their willingness to pay for a control program. Results show that peopleare concerned about the air pollution resulting from dust storms, and are willing to pay tosupport a control program.
Air quality planning
In response to a request initiated by Ecology, EPA recently released a Natural EventsPolicy. The policy applies to several types of natural events for which control is limited.Based on this policy, Ecology is writing a Natural Events Action Plan. This plan willprovide for public education, health advisories when dust storms occur, and controls inareas where human activities increase emissions of dust.
Natural events
The Natural Events policy applies to exceedances of the PM10 standard due to naturalcauses. Natural causes can include volcanic eruptions, wildfires, or high winds. Thepolicy calls for states to analyze and document conditions that show an exceedance wasdue to natural causes. A copy of the documentation is forwarded to EPA and is availablefor public review.
Based on this policy, Ecology and local air quality agencies have determined that sixevents in Washington since January 1994 were natural events. One was due to wildfiresand five were due to high winds.
Area Date Cause
Wenatchee July 31 & August2, 1994
Wildfires which burned over 10% of the totalacreage of Chelan County. Includes the TyeeCreek, Hatchery Creek, and Rat Creek fires.
Wallula June 13, 1994 High winds at Wallula and in the surrounding area.Hourly wind speeds at Wallula were between 25and 35 miles per hour for much of the day.
Spokane August 30, 1996 High winds in the Columbia Plateau and Spokane,which caused a widespread dust storm witnessedin several areas.
Kennewick March 3, 1997 High winds in Kennewick and the surroundingarea, which caused blowing dust. Wind gustsduring the day were between 30 and 50 miles perhour.
Wallula June 21, 1997 High winds with average hourly speeds of up to 30miles per hour, which caused dust from fields andopen areas to become airborne.
The exceedances that occurred during these natural events will not be used indetermining whether an area is nonattainment. However, controls will be developed forhuman activities that contribute to exceedances during such events.
51
Air Quality Program Internet Site
Ecology's Air Quality Program Internet web page first appeared on October 9, 1996. Itwas expanded and enhanced during 1997. The Internet address is:http://www.wa.gov/ecology/air/airhome.html. This web site is one of the most frequentlyaccessed sites in the Department of Ecology. We believe that by providing informationelectronically, we can minimize the use of paper. This saves energy as well as animportant natural resource.
The Air Quality Program site includes the following information:
• What's New - Informs the reader of the most recent additions to the web page.
• Who's Who – Contains up-to-date Air Quality Program telephone and e-maildirectories. Also includes an expertise directory to help the reader find theappropriate contact person for their specific question.
• Air Quality News - Contains an up-to-date listing of recent air quality news.
• Local Air Pollution Agencies - Contains an interactive map of Washington State toassist the reader in finding the appropriate air pollution agency for their area. Alsoprovides a viewable and downloadable one-page document entitled “Sources ofInformation about Air Pollution in Washington State.” Includes appropriate web siteand e-mail links to local air pollution agencies.
• Air Quality Regulations - Contains links to all Air Quality regulations.
• Publications - Contains a listing of Air Quality Program publications and how to getthem.
• Newsletters - Contains links to the three newsletters published by the Air QualityProgram, as well as other Ecology newsletters.
• AirLines (Published quarterly, offering updated information on programs requiredby the Clean Air Washington Act and other Air Quality Program activities)
• Aerations (A briefing for local air pollution control agencies, published bi-monthly by the Department of Ecology Air Quality Program)
• Emission Repair Update (A newsletter for professional Automotive Techniciansand other interested parties)
• Permit Register - Provides information on Air Operating Permits for industrialfacilities. Includes actions taken on a facility's permit application, includingcompletion of the draft and final permit, scheduling of hearings and public meetings,and modifications to the permit. This publication also provides information about
52
opportunities for public involvement in the operating permit process. A new PermitRegister is issued on the 10th and 25th of each month as needed.
• Air Quality Related Links - Contains links to other air quality-related web sites thatmay be of interest to the reader.
• Agricultural Burning
• New Grass Seed Field Burning Regulation - Contains links to backgroundinformation and documentation relating to the grass seed field burningamendments to Chapter 173-430 WAC, Agricultural Burning, that becameeffective February 7, 1997.
• Agricultural Burning Permit Information - Explains who needs a permit andwhere to get one.
• Wood Stove Information
• The Health Effects of Wood Smoke - Links to a downloadable informationalbrochure.
• Is My Wood Stove or Fireplace Certified? - Contains answers to frequently askedquestions and includes a listing of certified wood stoves, authorized fireplaces,and other solid fuel burning devices.
• Stationary Sources of Air Pollution
• Includes the 1996 Washington State Reasonably Available Control Technology(RACT) List and Schedule with links to:- Focus Sheet (background and general information)- 1996 RACT List and Schedule- Group A1 Sources
• Small Business Assistance Program - Contains links to:
• an informational brochure entitled “What You Should Know About Washington'sAir Quality Business Assistance Program;”
• local air pollution agencies business assistance web sites; and• other industry sectors’ business assistance programs web sites.
• Vehicle Emission Check Program - Contains information on Washington’s vehicleemission check program and includes locations of vehicle repair facilities andAuthorized Emission Specialists (AES).
Coming Soon!
It is the hope of the Air Quality Program to provide real-time air monitoring dataavailable on the Internet sometime in 1998.

53


![Con Air 1997 DvDrip[Eng]-Greenbud1969](https://img.pdfslide.net/doc/110x75/55cf9671550346d0338b7d77/con-air-1997-dvdripeng-greenbud1969.jpg)