Embed Size (px)
Citation preview
FORTY COMPARISONS OF MERCURY INJECTION DATAWITH OIL/WATER CAPILLARY PRESSURE
MEASUREMENTS BY THE POROUS PLATE TECHNIQUE
H. N. Greder*, V. Gallato**, Ph. Cordelier***, D. Laran*, V. Munoz*, O. d’Abrigeon*
*Elf Exploration Production (CSTJF, av. Larribau, 64018 Pau Cédex, France)** Institut Universitaire Professionalisé (Vannes, France)
*** Elf Congo (B.P. 761, av. Raymond Poincaré, Pointe Noire, Congo)
ABSTRACT
Mercury injection is a relatively quick and low cost technique to obtain capillary pressure data.In this paper we address the following question : Can mercury injection data be used to properlyestimate oil/water drainage capillary pressure curves representative of the reservoir ?
This question has been discussed in several previous papers, but there is a relative scarcityof relevant experimental data. This paper presents results from forty comparative tests which havebeen conducted over several years on consolidated core samples originating from the Gulf of Guineaand the North Sea.
Each test consisted in measuring capillary pressure by two different techniques on twoadjacent samples. Mercury injection with capillary pressure values up to 1000 bars was used on onesample and a higher cost oil/brine porous plate technique was applied on the adjacent sample. Thislatter technique consisted in measuring capillary pressure with stock tank oil and brine under stressand temperature. The effective confining stress, the concentration of the brine and the temperaturewere chosen in order to be representative of reservoir conditions. Such measurements are assumedto be more representative of the actual reservoir oil/water drainage capillary pressure.
Various lithologies were tested : 25 sandstones (either clean, laminated or bioturbated), 10dolomites (non vuggy and vuggy), 5 limestones. The tested samples had a wide range of permeabilityand porosity values.
Mercury injection data were scaled to oil/brine conditions with IFT values measured in the laboratory.Comparisons of these scaled data with the porous plate data were then conducted. Results show thatmercury injection systematically underestimates water saturation when compared to oil/brine resultsin the high Pc region. The differences of water saturation between the two techniques were thenanalyzed per type of facies. This complete set of tests reveals some relationships between mercuryinjection data and oil/water capillary pressure measurements for oil reservoirs. Local heterogeneities(bioturbations, non-uniform pore access radius distribution, tortuosity) were found to be the mainresponsible factors to explain these differences in sandstone reservoirs. Oil wettability seems to playan important role in carbonates (especially for limestones). Some general trends, provided in thepaper, can help the core analyst to correct its mercury injection data into more representative ones.However, more tests should be carried out to confirm and precise these relations and to point out newones. Only such relations can justify the use of the low-cost mercury injection technique for Pc studiesin oil reservoirs.
INTRODUCTION
Original Oil In Place (OOIP) in oil reservoirs is generally determined from interpretations of welllogs. As interpretations of saturations are based on empirical models, they always need to beconfronted to representative core measurements of saturations, resistivity index and capillary

pressure. Among the methods for measuring capillary pressures of two fluids in core samples, the useof the restored state technique, introduced by Leverett (1941) and Bruce (1947), is probably the mostrepresentative one as long as reservoir conditions are respected during the experiments. Severalauthors have actually shown that capillary pressure measurements are not only dependent on thestructures of the porous network but also on many parameters such as rock and oil interactions, watersalinity, temperature, confining and pore pressures proving the necessity of measuring capillarypressure curves with actual fluids and under reservoir conditions.
However, among the static methods, the restored state technique under reservoir conditionsremains a long and relatively costly technique. The mercury injection method, introduced by Purcell(1949) is still widely used in the oil industry since its cost and rapidity of operation outrun any othertechnique.
The objective of the paper is to point out and explain the relations between capillary pressuremeasurements obtained by these two techniques during first drainage. Results are expected to helpthe core analyst to optimize future Pc core analysis programs in order to find a good compromisebetween rapidity of operation and the necessity of determining valid saturation data.
LITTERATURE BACKGROUND
Gas/water drainage capillary pressure curves obtained by different techniques have been comparedin few papers. Melrose (1990) and Sabatier (1994) found good agreement between centrifuge andporous plate data in the low water saturation region. Results obtained on 12 sandstone samples byMelrose (1991) indicate that water saturations obtained by mercury injection (after appropriate scaleup) are lower than saturations obtained by centrifuge or porous plate in the low saturation region(about 4%PV difference). Sabatier (1994) did not confirm these results on six samples (4 sandstonesand 2 carbonates). He found a good match between mercury injection and porous plate for 5 out ofthe 6 samples.
In oil/water systems, very few comparative experiments have been published to our knowledge.Swanson (1985) indicates that differences between mercury and water/oil tests can be often attributedto a lack of equilibrium in the water/oil tests and to the influence of effective stress which can beapplied with the porous plate and not with the mercury technique. In Swanson’s sandstone example,oil saturation (for a Pc value of 5 bars) was lower than mercury saturation by about 10 %PV. Ninetypercent of this difference was due to effective stress and only ten percent was explained by a lack ofequilibrium in the water/oil test. However, Longeron (1989) did not get a good agreement betweenexperimental Pc results obtained with different fluid pairs. Bouvier (1991) presented three examplesof comparisons between porous plate oil/water data and scaled mercury data. Examples originatedfrom oolitic limestones. At capillary pressure levels corresponding to the invasion of macro-pores, oilsaturation was lower than mercury saturation by about 2.5 %PV for two samples. The results of thethird sample showed a higher value of oil saturation of about 4 %PV. Bouvier concluded that mercurycurves were closed to water/oil curves. Sabatier (1994) and Hamon (1997) pointed out that mercuryinjection results in lower values of initial water saturation when compared to oil/brine and gas/brinedata.
STRATEGY FOR THE FORTY COMPARATIVE TESTS
In order to analyse the forty comparative tests, we focused on the following two parameters :
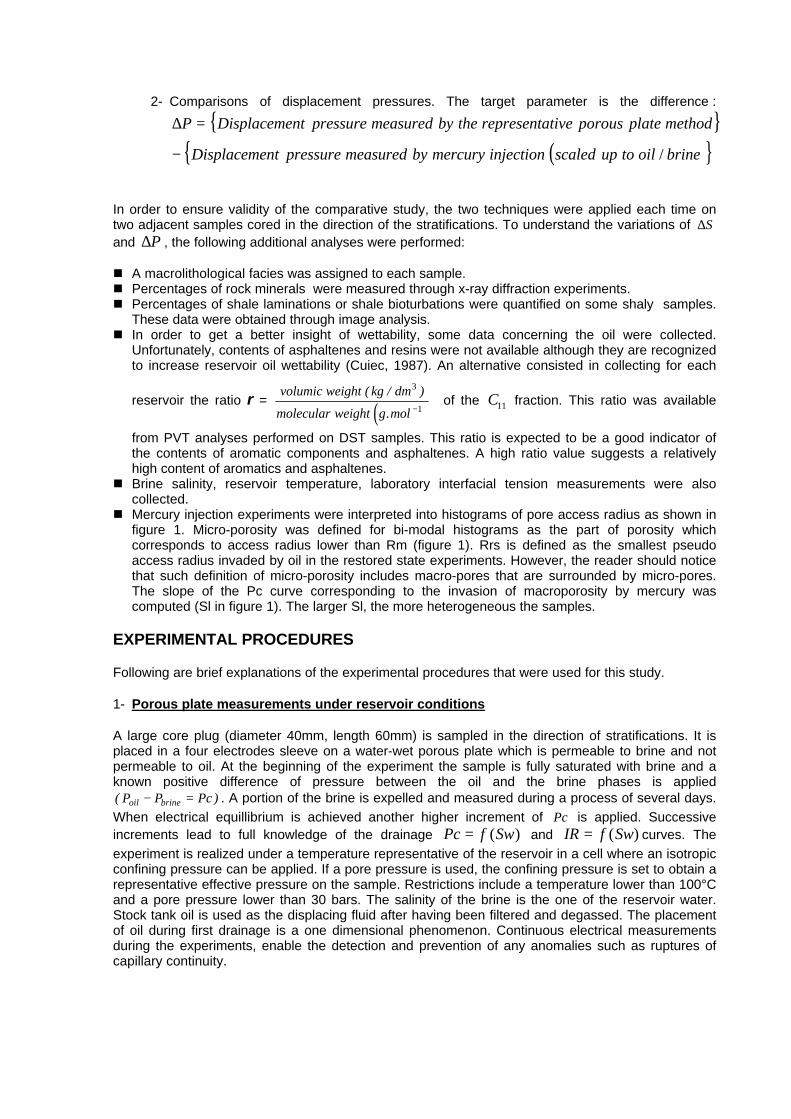
1- Comparisons of Swi obtained by the two methods for a value of oil/brine Pc of 4 bars. Thisvalue was always higher than the Pc value necessary to invade all macro-pores.
{ } { }∆S Swi SwiIn situ stored State Mercury Injection
= −− Re
Swi is the water saturation measured at an actual or scaled up oil/brine capillary pressureof 4 bars. (See figure 1). ∆S is expressed in fraction (as all saturations in this paper).
2- Comparisons of displacement pressures. The target parameter is the difference :
{ }( ){ }
∆P Displacement pressure measured by the representative porous plate method
Displacement pressure measured by mercury injection scaled up to oil brine
=
− /
In order to ensure validity of the comparative study, the two techniques were applied each time ontwo adjacent samples cored in the direction of the stratifications. To understand the variations of ∆Sand ∆P , the following additional analyses were performed:
n A macrolithological facies was assigned to each sample.n Percentages of rock minerals were measured through x-ray diffraction experiments.n Percentages of shale laminations or shale bioturbations were quantified on some shaly samples.
These data were obtained through image analysis.n In order to get a better insight of wettability, some data concerning the oil were collected.
Unfortunately, contents of asphaltenes and resins were not available although they are recognizedto increase reservoir oil wettability (Cuiec, 1987). An alternative consisted in collecting for each
reservoir the ratio r =( )
volumic weight kg dm
molecular weight g mol
( / )
.
3
1−
of the C11+ fraction. This ratio was available
from PVT analyses performed on DST samples. This ratio is expected to be a good indicator ofthe contents of aromatic components and asphaltenes. A high ratio value suggests a relativelyhigh content of aromatics and asphaltenes.
n Brine salinity, reservoir temperature, laboratory interfacial tension measurements were alsocollected.
n Mercury injection experiments were interpreted into histograms of pore access radius as shown infigure 1. Micro-porosity was defined for bi-modal histograms as the part of porosity whichcorresponds to access radius lower than Rm (figure 1). Rrs is defined as the smallest pseudoaccess radius invaded by oil in the restored state experiments. However, the reader should noticethat such definition of micro-porosity includes macro-pores that are surrounded by micro-pores.The slope of the Pc curve corresponding to the invasion of macroporosity by mercury wascomputed (Sl in figure 1). The larger Sl, the more heterogeneous the samples.
EXPERIMENTAL PROCEDURES
Following are brief explanations of the experimental procedures that were used for this study.
1- Porous plate measurements under reservoir conditions
A large core plug (diameter 40mm, length 60mm) is sampled in the direction of stratifications. It isplaced in a four electrodes sleeve on a water-wet porous plate which is permeable to brine and notpermeable to oil. At the beginning of the experiment the sample is fully saturated with brine and aknown positive difference of pressure between the oil and the brine phases is applied( )P P Pcoil brine− = . A portion of the brine is expelled and measured during a process of several days.When electrical equillibrium is achieved another higher increment of Pc is applied. Successiveincrements lead to full knowledge of the drainage Pc f Sw= ( ) and IR f Sw= ( ) curves. Theexperiment is realized under a temperature representative of the reservoir in a cell where an isotropicconfining pressure can be applied. If a pore pressure is used, the confining pressure is set to obtain arepresentative effective pressure on the sample. Restrictions include a temperature lower than 100°Cand a pore pressure lower than 30 bars. The salinity of the brine is the one of the reservoir water.Stock tank oil is used as the displacing fluid after having been filtered and degassed. The placementof oil during first drainage is a one dimensional phenomenon. Continuous electrical measurementsduring the experiments, enable the detection and prevention of any anomalies such as ruptures ofcapillary continuity.

Samples are previously cleaned by successive miscible displacements of toluene and isopropanol.Drying is achieved by combination of nitrogen drying and heating. Nitrogen drying is increased forshaly samples whereas drying under temperature is significantly reduced for good preservation ofclay structures.
Advantages of the method :n the method is close to reservoir conditionsn simultaneous measurements of capillary pressure and resistivity index as functions of saturationsare obtainedn the method is valid for unconsolidated samplesn measurements of isotropic compressibility can be easily obtained prior to drainageDrawbacks :n each step is attained only after several days (in house criterion is that the expelled water must beless than 0 02 243. /cm hours during two consecutive days). Drainage experiments typically lastbetween 50 and 120 days. Thickness of the porous plate varies between 2mm and 6.4mm.n maximum attainable Pc values are around 10 barsn the technique is costly and cannot be applied on large sets of samplesn cleaning of the samples never results in a completely water wet condition
2- Mercury injection
With this method, mercury is injected into an evacuated sample by increments of mercury pressureup to 4000 bars. Equilibrium is achieved very quickly and a full Pc f Mercury Saturation= ( ) curve canbe obtained in less than one day. At the end of drainage, high values of Pc lead to total invasion ofthe porous medium by mercury. Injection of mercury occurs in three dimensions. For theseexperiments mercury is clearly the non-wetting phase.For these experiments, small core plug samples (diameter and length of one inch) were used. Theywere sampled in the direction of the stratifications. A soxhlet technique with chloroform is used forcleaning. Heating is used for drying. Moderate heating is applied for shaly samples.
Advantages of the method:n equilibrium is attained after a short period during drainage as the wetting phase (vacuum) does nothave to be expelled from the sample.n high Pc values are attainablen mercury injection gives a good understanding of the pore networks which can be interpreted intodistributions of pore access radiusn It is a low-cost techniquen It gives an equivalent of a purely water-wet system when scaled up to oil/brine.n The displacing fluid is the non-wetting phaseDrawbacks :n the method is destructive for the core samplesn it is not representative of the reservoir fluidsn no measurement of resistivity can be maden the method is not valid for unconsolidated samples
EXPERIMENTAL RESULTS
Forty comparative tests were conducted :- 25 in sandstone lithologies- 15 in carbonates
Each test comprised a measurement of oil/brine capillary pressure on a large plug sample and amercury injection on an adjacent small plug sample.

The «sandstone » family
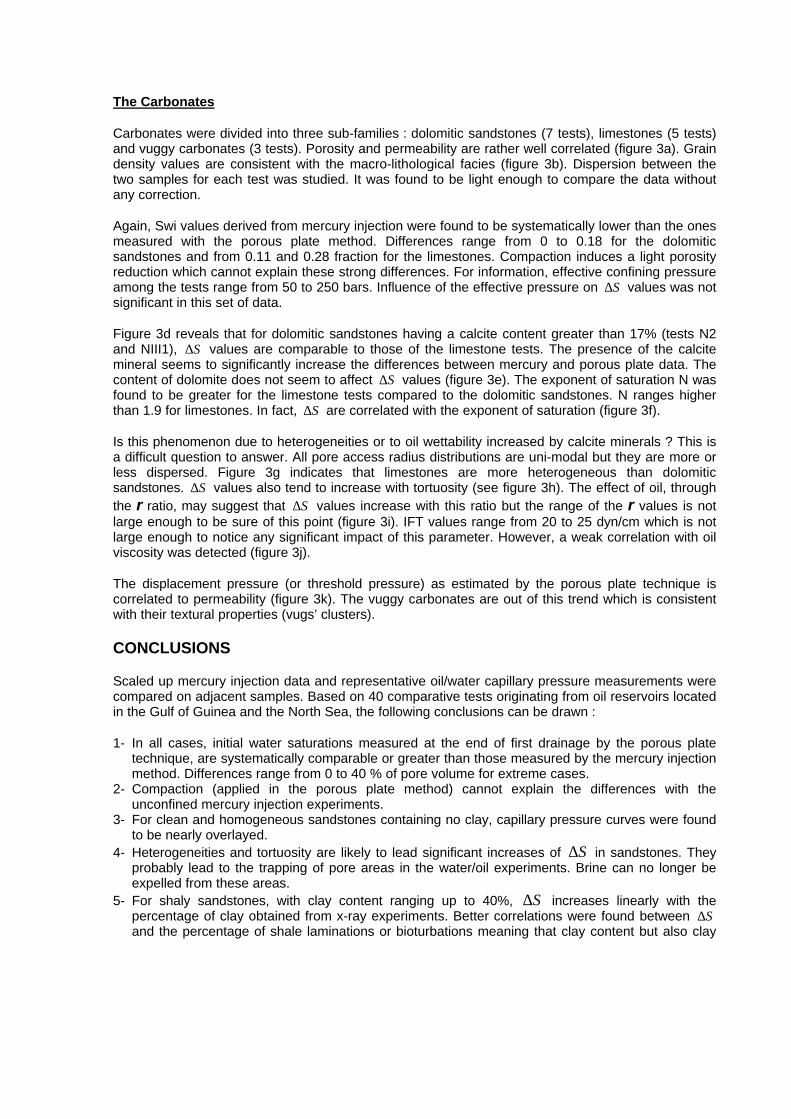
Conventional measurements of the 25 large core plug samples are represented in figures 2a and 2b.Each sample is named after its originating well. Similar first letters mean that the samples originatefrom the same cores. One will notice that porosity and permeability are correlated within each sub-family and that for a given porosity value, permeability is lower for bioturbated and laminated samplesthan for clean medium sandstones. Thickness of laminations and bioturbations is millimetric for thepresented samples. They correspond to low resistivity sands intervals. Grain density ranges from 2.65to 2.7 except for two samples (B1 and B2) which contain about 25 to 30% of siderite which is a heavymineral (~ 3.94g/cc).
∆S values were found to be always positive meaning that mercury injection systematicallyunderestimates initial water saturation. They range from zero to 30 %PV.
Let us scan the various explanations for these high values of ∆S :
1- Equilibrium times during oil/water measurements
In oil/water measurements, water is expelled from the sample at each capillary pressure step. Aswater saturation gets lower, relative permeability of water tends to zero and therefore the equilibriumtime tends to infinity (Van Lingen, 1996). On an average, 10 Pc steps were applied for each water/oilporous plate experiment. Each new step was applied after the expelled water flow rate was less than0 02 243. /cm hours during two consecutive days. Full experimental time ranged from 50 to 120 days.For simplicity, let’s assume that each step should have lasted ten more days increasing the overallexperimental drainage time by an extra 100 days. Let’s also assume a constant 0 01 243. /cm hours ofwater flow rate during this extra time. The expelled water would have increased by0 01 10 10 1 3. × × =days steps cm which represent about 7%PV for a typical 15 3cm pore volume. As thisphenomenon does not occur with mercury injection into an evacuated sample, the equilibrium timemay explain part of the discrepancies between the two techniques. However, it is not likely to beresponsible for more than several per cents of pore volume.
1- Natural dispersion
As the experiments are performed on two different samples although they are adjacent, one needs tocheck that there is no or little local dispersion which could explain the ∆S values. Permeability wasmeasured for each test on both samples under a light confining pressure of 20 bars. Figure 2c showsthat variation of permeability is less than 0.2 decades except for three samples (B1, B2 and C) wheredispersion reaches 0.7 decades. In the following figures, ∆S values were corrected to take intoaccount this dispersion through the two trends plotted in figure 2d. At the end of this step, data areno more dependent on local dispersion.
2- Compaction
Restored sate experiments are performed under effective stress whereas mercury injection isconducted on unconfined samples. As shown in figure 2e, compaction induces a porosity reduction.The permeability reduction could not be recorded during the experiments because of the presence ofthe porous plate. Porosity reductions average 0.01 fract which corresponds roughly to a maximumpermeability reduction of 0.15 decades (figure 2a) and a water saturation increase of 0.02 fraction(figure 2d). Therefore, compaction is not responsible for the high ∆S values.
3- Rock textural properties
• For shaly sandstones, figure 2g reveals a good correlation between ∆S values and the claycontent. The higher the clay content, the larger ∆S . This correlation is even better when the

percentage of shaly bioturbations or laminations replaces the content of clay (see figure 2h). Thismeans that not only clay content but also clay structure is correlated to ∆S . There are twoexceptions which are « out of trend ». Test L actually involves a friable large sample for theporous plate technique and a cemented sample for the mercury injection. For this latter test, thereis a local dispersion which was not detected with conventional measurements but with pictures.The other exception is test B3. The large sample of this test contains a nodule of shaly sand whichmay explain the relatively low ∆S value when it is compared with samples containing similarcontent of clay. For the shaly samples, micro-porosity (as defined in figure 1) is poorly correlatedto ∆S (see figure 2f). It can be noticed in figure 2i that ∆S does not only correspond to the part ofmicro-porosity but also includes part of the macro-porosity. This suggests that during theplacement of oil in the porous plate experiments, some pore areas full of brine and partlysurrounded by clay are trapped. When Pc is high enough to invade these areas, brine patches aredisconnected and cannot be expelled.
• For the clean sanstone (either fine or medium) with less than 1% of clay, ∆S values were foundto be correlated to Sl values and the cementation factor (figures 2j and 2k). Sl was notincluded for the E test because the mercury injection was performed in another lab and thecomputed value of Sl was considerably higher than our other in-house values. Therefore, poorconfidence was placed on this specific value. Both parameters Sl and m are related toheterogeneities. M is often called the tortuosity coefficient. High values of m suggest a tortuousporous medium and high values of Sl suggest heterogeneous pore access radii. However test Dshows a high value of Sl and a low value of m. To explain this « out of tendency » sample, welooked more precisely to its geological descriptions (macro-lithology and thin section). Grain sizedistribution of the D sample is described as heterogeneous but the geologist noticed that coarsergrains were organized in permeable patches (or strata). This can be seen on the 2a plot becausepermeability is rather high for this test given its porosity. This phenomenon explains the relativelylow m value for this test as the organized patches act as good conductors during electricalmeasurements. Interestingly, one will notice that this test is in the shaly sandstones’ trend in plot2d confirming the bi-modal behavior of the D sample (although it is not shaly at all).
All these local heterogeneities as well as their organization lead to the trapping of brine during oilplacement. The brine can no longer be expelled from the sample which is not the case for itsequivalent in the mercury injection technique as vacuum is always replaced by mercury.
• Finally, for clean and well-sorted sandstones, no significant difference in water saturation wasfound between the two techniques (tests T, AII).
4- Wettability
As presented in figure 2l, ∆S is poorly correlated to r for any given type of lithology. This suggeststhat either there is no influence of oil wettability on ∆S values or that the r ratio is not a goodindicator of the asphaltenes contents i. e. a bad indicator of oil wettability. To our knowledge, there isno clear evidence in the litterature of this ratio being a good indicator.
Finally, one will notice the two trends between ∆S and the Archie’s exponent of saturation (figure 2n)for the shaly sandstones. Following is a possible explanation: as the percentage of shale bioturbationsor laminations increase, the trapping of brine increases leading to higher values of ∆S . Some trappedareas (full of brine) are no more effective for conductivity leading to higher values of n. However,there is a second effect : as the shale content gets larger, the shaly structures responsible for thetrapping are more and more connected and form conductive paths. This lowers the n values stillgiving high values for ∆S .
The displacement pressure estimated during the porous plate experiments was found to be partiallycorrelated to absolute permeability (figure 2o). Differences with the Purcell estimations are slight andmaybe related to ∆S values (figure 2p). The difference is less than 100 mbars in most cases. It isdelicate to interpret these differences as they are strongly dependent on the scale-up coefficientwhich was used to scale mercury data to oil/brine data.
The Carbonates
Carbonates were divided into three sub-families : dolomitic sandstones (7 tests), limestones (5 tests)and vuggy carbonates (3 tests). Porosity and permeability are rather well correlated (figure 3a). Graindensity values are consistent with the macro-lithological facies (figure 3b). Dispersion between thetwo samples for each test was studied. It was found to be light enough to compare the data withoutany correction.
Again, Swi values derived from mercury injection were found to be systematically lower than the onesmeasured with the porous plate method. Differences range from 0 to 0.18 for the dolomiticsandstones and from 0.11 and 0.28 fraction for the limestones. Compaction induces a light porosityreduction which cannot explain these strong differences. For information, effective confining pressureamong the tests range from 50 to 250 bars. Influence of the effective pressure on ∆S values was notsignificant in this set of data.
Figure 3d reveals that for dolomitic sandstones having a calcite content greater than 17% (tests N2and NIII1), ∆S values are comparable to those of the limestone tests. The presence of the calcitemineral seems to significantly increase the differences between mercury and porous plate data. Thecontent of dolomite does not seem to affect ∆S values (figure 3e). The exponent of saturation N wasfound to be greater for the limestone tests compared to the dolomitic sandstones. N ranges higherthan 1.9 for limestones. In fact, ∆S are correlated with the exponent of saturation (figure 3f).
Is this phenomenon due to heterogeneities or to oil wettability increased by calcite minerals ? This isa difficult question to answer. All pore access radius distributions are uni-modal but they are more orless dispersed. Figure 3g indicates that limestones are more heterogeneous than dolomiticsandstones. ∆S values also tend to increase with tortuosity (see figure 3h). The effect of oil, throughthe r ratio, may suggest that ∆S values increase with this ratio but the range of the r values is notlarge enough to be sure of this point (figure 3i). IFT values range from 20 to 25 dyn/cm which is notlarge enough to notice any significant impact of this parameter. However, a weak correlation with oilviscosity was detected (figure 3j).
The displacement pressure (or threshold pressure) as estimated by the porous plate technique iscorrelated to permeability (figure 3k). The vuggy carbonates are out of this trend which is consistentwith their textural properties (vugs’ clusters).
CONCLUSIONS
Scaled up mercury injection data and representative oil/water capillary pressure measurements werecompared on adjacent samples. Based on 40 comparative tests originating from oil reservoirs locatedin the Gulf of Guinea and the North Sea, the following conclusions can be drawn :
1- In all cases, initial water saturations measured at the end of first drainage by the porous platetechnique, are systematically comparable or greater than those measured by the mercury injectionmethod. Differences range from 0 to 40 % of pore volume for extreme cases.
2- Compaction (applied in the porous plate method) cannot explain the differences with theunconfined mercury injection experiments.
3- For clean and homogeneous sandstones containing no clay, capillary pressure curves were foundto be nearly overlayed.
4- Heterogeneities and tortuosity are likely to lead significant increases of ∆S in sandstones. Theyprobably lead to the trapping of pore areas in the water/oil experiments. Brine can no longer beexpelled from these areas.
5- For shaly sandstones, with clay content ranging up to 40%, ∆S increases linearly with thepercentage of clay obtained from x-ray experiments. Better correlations were found between ∆Sand the percentage of shale laminations or bioturbations meaning that clay content but also clay

structure play a significant role during the oil migration in the reservoir. These structures are morelikely to be responsible for the trapping of some areas by oil preventing brine to be expelled.
6- In sandstones, the impact of oil characteristics seems secondary to the previous factors to explainthe differences in water saturation above the transition zone.
7- Concerning the carbonates, the larger differences in initial water saturation were found forlimestones.
8- Oil characteristics seems to play an important role to explain the Swi differences in carbonates.Increase in oil wettability would lead to greater differences of saturation with mercury data.
The overall study pointed out the interest of mercury injection data to quantify the degree ofheterogeneity of rock samples. However, their use in core-log calibration is questionable as theynearly always underestimate water saturation obtained by the porous plate technique. The trends thatare provided in the paper to explain these under-estimations should be used VERY cautiously. More ofsuch tests should be carried out to confirm and enrich these trends especially for carbonates. Oneshould also keep in mind that the mercury injection is a 3D phenomenom whereas the placement ofoil takes place in 1D for the porous plate technique. The 1D placement may exacerbate the impact ofheterogeneities on oil placement when compared to reality resulting in higher water saturations.Another point is that the cleaning procedure for the porous plate experiments does not turn thesamples to fully water-wet conditions and that the restored oil wettability may be higher than theactual reservoir one. In such cases the porous plate method would lead to higher water saturationvalues than the actual ones.
REFERENCES CITED
1. Anderson, W. G., 1987 : « Wettability Literature Survey - Part 4 : Effects of Wettability onCapillary Pressure », JPT, Oct., p.1283-1300.
2. Bouvier, L., Maquignon, S. M., 1991 : « Reconciliation of log and laboratory derived irreduciblewater saturations in a double porosity reservoir » Advances in core evaluation II - Gordon andBreach publishers, Philadelphia, ISBN : 2 88124 826 8, p.284
3. Bruce, W. A., Welge, H. J., 1947 : « Restored -state method for determination of oil in place andconnate water », API Division of Production, Amarillo, TX, May 22-23.
4. Cuiec, L.,1987 : « Wettability and oil reservoirs ». North Sea Oil and Gas Reservoirs TheNorwegian Institute of Technology (Graham and Trotman, 1987) pp. 193-207
5. Hamon, G., Pellerin, F. M., 1997: « Evidencing capillary pressure and relative permeability trendsfor reservoir simulation », SPE paper # 38898, to be presented in San Antonio, TX, Oct. 5-8, 1997.
6. Leverett, M. C., 1941 : Trans. AIME 142, 152-1697. Longeron, D. G., Argaud, M.J., Bouvier, L., 1989: « Resistivity Index and Capillary Measurements
Under Reservoir Conditions Using Crude Oil », SPE paper 19589, presented in San Antonio,Texas, Oct. 8-11.
8. Melrose, J. C., 1990: « Valid capillary pressure data at low wetting-phase saturations » SPE Res.Eng., Feb. 1990, 95-99.
9. Melrose, J. C., Dixon, J.R., 1991 : « Comparison of different techniques for obtaining capillarypressure data in the low-saturation region » SPE paper # 22690presented in Dallas, TX, Oct. 6-9,1991.
10. Purcell, W. R., 1949 : Trans. AIME, 186, 39-4811. Purcell, W. R., 1950 : « Interpretation of Capillary Pressure Data », Transactions AIME, 189, 369-
7112. Sabatier, L., 1994: « Comparative Study of Drainage Capillary Pressure Measurements using
Different Techniques and for Different Fluid Systems », SCA paper 9424.13. Swanson, B.F., 1985 : Microporosity in reservoir rocks. Its measurement and influence on
electrical resistivity. The log Analyst 26(6), 42-52, 1985.14. Van Lingen, P., P., and Kruijsdijk, C., 1996: « Real time modeling of capillary pressure
measurements », SPE paper # 36532 presented in Denver, CO, USA, Oct. 6-9, 1996 (annualtechnical SPE conference).

ACKNOWLEDGEMENTSThe authors would like to sincerely thank Mr. Gerald Hamon from Elf for his help in orienting thepresent study. F. M. Pellerin is also acknowledged for good discussions on capillary pressure.
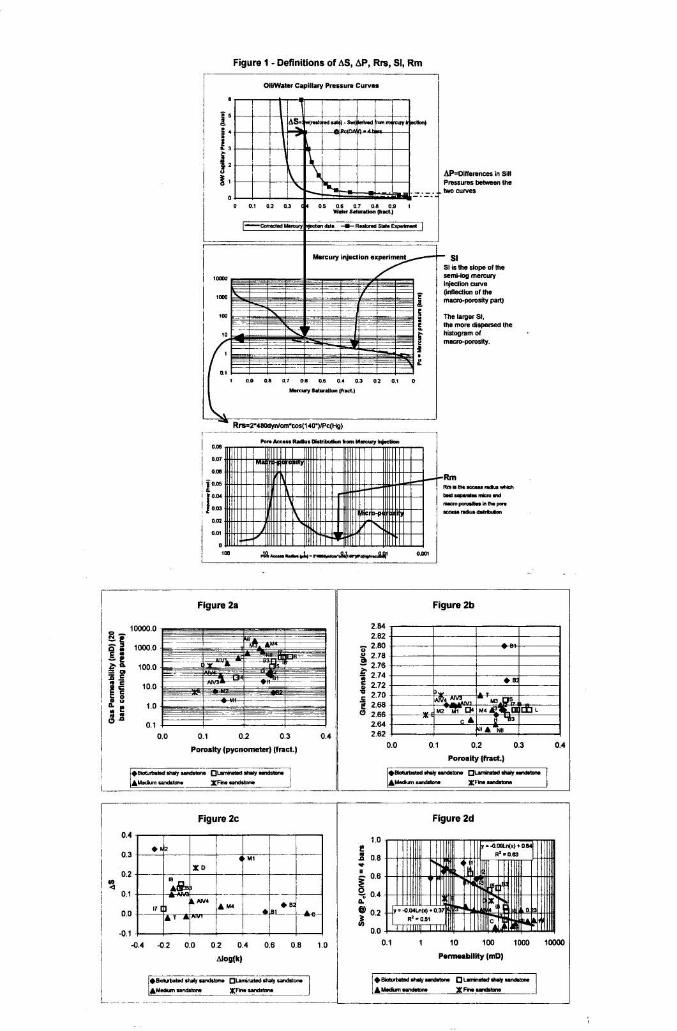
Figure 1 - Definitions of AS, AP, Rrs, SI, Rm
I O1VWater Capillary Pnrsun Curves i
AP=Diffemnccs in sill Preuuns beween the . hw CUNBS
- SI SI is UIe slop of the semblog mercury injedion cwve finfledion of the mauu-porosity part)
The larger SI. lhe mom dispned the hislooram of mauc-porosity.
BF a a f t $ @ r'ii k! 5
I t "
! i
Figure 2s Figure 2b
I ~ o m s i t y (pycnometer) (fnct.1
*0-.w- 0Lunh.M.h.h- AMammamdsha X F h 1 U
I
Figure 2c Figure 2d
I Figure 2e - Compaction on large samples Figure 2f
0.40 0.35 0.30 0.25 0.20 0.15 0.10 0.05 0.00
0.0 0.1 0.2 0.3 0.4
Pomsity with no stress (fract)
'~Bbofurbated rhsly randstone OLsmmatad *aiy sandstone
0.1
0.1 0.2 0.3 0.4 0.5 0.6 0.7 0.8
W~croporosity defined by Rm
[e~imturbated shah sandstone 0Larnloat.d rhaly sandstone & M u m sandstom I
Figure 29 Figure 2h
0 5 10 15 20 25
Clay (X)
0 20 40 60 80
Shale laminations or shaly bioturbated areas (%)
+Btmrbatad rhrly rmdstone OLammated rhsly sandstone
Figure 2j - Samples with less than 1% of clay content
0.4
0.3
0.2 In a
0.1
0.0
0.1
Figure 2k 0.4
0.3
0.2 U) a
0.1
0.0
0.1 1.50 1.75 2.00 2.25 2.50 2.75 3.00
Cementation factor
Figure 21 0.4
eBiolufbated shaly sandstone OLamlnated rhaw sandstone
AMedium saneslon. XFiw sandrtonm
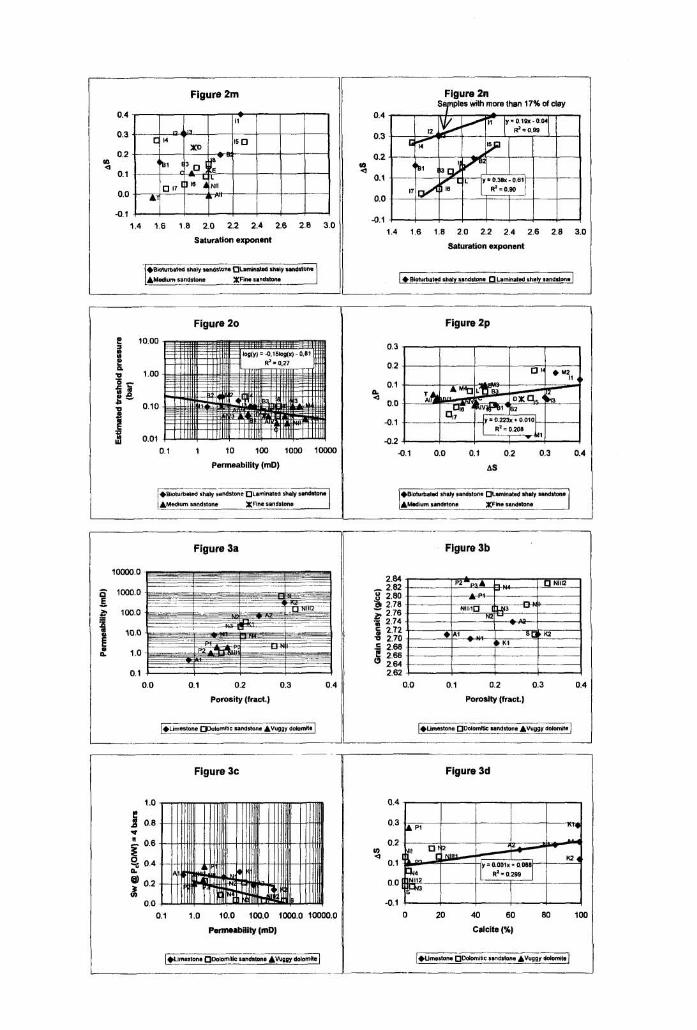
Figure 2m I I
1.4 1.6 1.8 2.0 2.2 2.4 2.6 2.8
Saturation exponent
Figure 2n Sajnples wiU~ more than 17% of clay
1.4 1.6 1.8 20 2.2 2.4 2.6 2.8 3.0
Saturation exponent
[* Biotutuasted shaiy ssndstons Laminated shsly sandston. I
Figure 20
0.1 1 10 100 1000 loo00
Permeability (mD)
Figure 2p
Figure 3a
0.0 0.1 0.2 0.3
Porosity (fract.)
1 *Ltmastons om lo mot^ sandstone AVuggy dolomle I!
0.0 0.1 0.2 0.3
Porosity (fract.)
Figure 3c
0.1 1.0 10.0 100.0 1MM.o 10000.0
Permeability (mD)
0 20 40 60 80 100
Calcite (%)
--- *Limestone nD&rnmc sandslone AVuggy dolomih

Figure 3e
Dolomite (%) II
Figure 3f
0.4
0.3
0.2 V) Q
0.1
0.0
0 .1 1.4 1.6 1.8 2.0 2.2 2.4 2.6 2.8 3.0
Saturation exponent
Cementation factor
1 Figure 3i Figure 3j
Oil viscosity (cPo)
Figure 3k
Permeability (mD)
j*Linuslone Ohlomitcc sandstons AVugpy dolomite I
Figure 31


![Capillary thermostatting in capillary electrophoresis · Capillary thermostatting in capillary electrophoresis ... 75 µm BF 3 Injection: ... 25-µm id BF 5 capillary. Voltage [kV]](https://img.pdfslide.net/doc/110x75/5c176ff509d3f27a578bf33a/capillary-thermostatting-in-capillary-electrophoresis-capillary-thermostatting.jpg)