Embed Size (px)
Citation preview
DOCUMENT RESUME
ED 431 764 SP 038 632
AUTHOR Wood, Robert W., Ed.; Hoag, Constance L., Ed.; Zalud,Garreth, Ed.
TITLE Research, Issues, and Practices. Annual Curriculum andInstruction Research Symposium Conference Proceedings,University of South Dakota (6th, Vermillion, SD, April 24,1998).
INSTITUTION South Dakota Univ., Vermillion. School of Education.PUB DATE 1999-06-01NOTE 96p.
PUB TYPE Collected Works Proceedings (021)EDRS PRICE MF01/PC04 Plus Postage.DESCRIPTORS Authors; Child Development; Children; *Computer Uses in
Education; *Critical Thinking; Disabilities; ElementarySchool Teachers; Elementary Secondary Education; InclusiveSchools; *Journal Writing; *Learning Disabilities;Mainstreaming; *Perinatal Influences; Preschool Education;Special Needs Students; Students; Teacher Attitudes;Thinking Skills; *Writing Skills
IDENTIFIERS South Dakota
ABSTRACTThis report includes papers from a 1998 symposium to promote
the professional sharing of current educational issues. The papers are: "ATapestry of Authors" (Maurine Richardson and Margaret Miller); "CriticalThinking Strategies Across the Curriculum" (Constance L. Hoag and SharonAndrews); "The Effect of Journal Writing on Teachers' Theory Development"(Lana Danielson); "School Subject Teaching Preferences Held by ElementaryTeachers" (Robert W. Wood and Lynne Roach); "Attribution Studies of Childrenwith Learning Disabilities" (Mary Ring); "An In-Depth Look at South Dakota'sSuccessful Early Childhood Inclusion Program" (Geralyn Jacobs, Dot Stoll,Joanne Wounded Head, Kristy Spencer, and Gui-Ping Zhang); "The Impact ofPerinatal Insults and Disabilities on Development from Birth to Eight Yearsof Age: Research Linked to Practice" (Marilyn Urquhart and Patricia Work);and "Writing and Computers: Increasing Geometric Content Based KnowledgeUsing the Van Hiele Model" (Roger Parsons, Jack Breen, and Robert Stack).(SM)
********************************************************************************
Reproductions supplied by EDRS are the best that can be madefrom the original document.
********************************************************************************
tv)
rf)
V3
C.)
RESEARCH, ISSUES, AND PRACTICES
a
Sixth.AnnualCurriculum and InstructionResearch SymposiumConferencg ProceedingsUniversity of South DakotaVermilion, South Dakota
April 24, 1998 Delzell Education Center
1
PERMISSION TO REPRODUCE ANDDISSEMINATE THIS MATERIAL HAS
BEEN GRANTED BY
Wc90A
TO THE EDUCATIONAL RESOURCESINFORMATION CENTER (ERIC)
U.S. DEPARTMENT OF EDUCATIONOffice of Educational Research end Improvement
EDUCATIONAL RESOURCES INFORMATIONCENTER (ERIC)
O This document has been reproduced asreceived from the person or organizationoriginating it.
o Minor changes have been made toimprove reproduction quality.
Points of view or opinions stated in thisdocument do not necessarily representofficial OERI position or policy.
TABLE OF CONTENTS
PageA TAPESTRY OF AUTHORSby Maurine Richardson and Margaret Miller .4
CRITICAL THINKING STRATEGIES ACROSS THE CURRICULUMby Constance L. Hoag and Sharon Andrews
THE EFFECT OF JOURNAL WRITING ON TEACHERS' THEORYDEVELOPMENTby Lana Danielson .26
SCHOOL SUBJECT TEACHING PREFERENCES HELD BY ELEMENTARYTEACHERSby Robert W. Wood and Lynne Roach .40
ATTRIBUTION STUDIES OF CHILDREN WITH LEARNING DISABILITIESby Mary Ring .51
AN IN-DEPTH LOOK AT SOUTH DAKOTA'S SUCCESSFUL EARLYCHILDHOOD INCLUSION PROGRAMby Geralyn Jacobs, Dot Stoll, Joanne Wounded Head, Kristy Spencer, andGui-Ping Zhang .63
THE IMPACT OF PERINATAL INSULTS AND DISABILMES ONDEVELOPMENT FROM BIRTH TO EIGHT YEARS OF AGE: RESEARCHLINKED TO PRACTICEby Marilyn Urquhart and Patricia Work 70
WRITING AND COMPUTERS: INCREASING GEOMETRIC CONTENTBASED KNOWLEDGE USING THE VAN HIELE MODELby Roger Parsons, Jack Breen, and Robert Stack .77
SYMPOSIUM PREFACE
The Curriculum and Instruction Research Symposium was conducted onApril 24, 1998 to promote the professional sharing of current educational issues.Other goals of this symposium included providing a forum for dialogueconcerning relevant educational topics, and the sharing of faculty researchinterests.
This symposium report contains a myriad of educational issues, topics, andresearch, and is the written report reflecting the oral presentations. We believethe publication of this document will continue to serve as a forum to encourageprofessional dialogue and as an acknowledgement of current, relevant research inthe field of education.
We gratefully acknowledge the financial support received from the Schoolof Education to help defray the cost of the symposium events.
Robert W. WoodConstance L. HoagGarreth ZaludDivision of Curriculum and InstructionSchool of EducationUniversity of South DakotaApril, 1999
3
4
A TAPESTRY OF AUTHORS
Maurine V. RichardsonAssociate Professor
Curriculum and Instruction Division
Margaret B. MillerAssociate ProfessorI. D. Weeks Library
4
5
INTRODUCTION
Considering the role that literature is playing in today's classroom, itcan not be relegated to the supplementary shelves. A good book should beplaced right beside the textbook as a resource for learning and developingskills and concepts (Oden, 1995). Using literature as part of the primaryreading material motivates learners to become more active and involved intheir learning (Smith & Johnson, 1995). Research by Ca !fee (1987) statesthat trade books provide students with the opportunity to see causalrelationships between concepts and to answer their questions throughreading. Textbooks may not provide sufficient depth of content to allowstudents to construct and comprehend events or phenomena, nor provideadequate explanations for promoting connections among the sequence ofideas according to Beck and McKeown (1991).
Students prefer literary works with subject matter that relate to theirpersonal experiences. They interact more with such literary works andactively seek them out (Harris, 1990). According to McMillan and Gentile(1988) literature promotes interest and involvement, as well as, providesstudents with positive experiences. Sewall (1988) states that narrativehistory can provide adventure and excitement that students enjoy.
There are four reasons why literary works need to be part of thecurriculum: 1) stories give students clues as to how they should reactemotionally to historical events and the people involved in them; 2) reality ismore easily understood through literary works, 3) literary works have anend and are more satisfying, and 4) provides a shared experience for theteacher and students and a place to start the literary work (Common, 1986).Literature provides an array of human experiences, feelings, and emotions(Shumaker & Shumaker, 1988).
Adding literature to the curriculum can add depth to the content understudy which will permit a broader investigation by students and the teacherand at the same time allow the examination of an issue from a variety ofperspectives, integrate information from diverse sources and to build upontheir interests (Smith & Johnson, 1995).
Books provide a wide range of information, as well as, share multiple
5
6
perspectives on the human experience. In addition, they can allow readersto engage in dialogue with any literature in the world (Pugh, Garcia, &Margalef-Boada, 1994). Students have a huge interest in the world aroundthem (Fitzhugh, 1993). The United States is not longer a melting pot, but asalad bowl, where each person can retain his/her own uniqueness culturally(Mattson & Richardson, 1992). In a truly inclusive community, no one isexclusive or excluded (England, 1992). It has been found that people areless threatened by other cultures if they truly understand their own culture(Mattson & Richardson, 1992). Rather than viewing cultural differences ashurdles, educators should accept the richness that diversity offers(Skeleton, 1991).
Clarke (1990) states that literature can humanize distant locations,events and captures the imagination. Literary works such as novels cantransport the reader to settings both past and present. These books cancontain examples of cultural and physical landscapes that can createmental images of spatial organization (Lamme, 1987). According to Levstik(1985) good fiction or nonfiction literature can capture the reader's interestthrough the characters and the places associated with the characters.
In conclusion, literature either in the genre of historical orcontemporary realistic fiction, can bring to the student a more meaningfuland detailed understanding of what life is like in another time or place, byturning dry factual information into a story. A story is a natural vehicle forenhancing learning because it makes the information real to children.
This research project was developed as a result of the investigatorsbeing asked by educators "Are there books written by authors about thestate they live in?" The question that has been asked of the investigatorsand knowing that children and adults love to read about their home states,as well as other areas of our country served as the bases for this researchproject. The following research question was investigated:1. What authors write/wrote literature using their home state or state inwhich they live(d) as the setting for their literary works?
The research has revealed a list entirely to long for this paper. Theinvestigators limited the research to the following question:
2. What authors use their home states in the upper Midwest as the setting
6

for their literary works? (Iowa, Kansas, Minnesota, Montana, Nebraska,North Dakota, and Wyoming)
This bibliography is a result of research. Although many books areavailable about each state, only a few are written by authors who live orhave lived in the state they are writing about. The following books are asample of mainly fiction books with stories that take place in a certain state;some are historical fiction, other are contemporary realistic fiction, and thefew remaining are non-fiction.
Iowa
Hall, Lynn. (1989). Dagmar Schultz and the Angel Edna. Charles Scribner'sSons. Grades 5-7.
Hall, Lynn. (1991). Dagmar Schultz and the Green-eyed Monster. CharlesScribner's Sons. Grades 5-7.
Ho II, Kristi D. (1973). The Haunting of Cabin 13. Athenaeum. Grades 3-6.Ho II, Kristi, D. (1989). Hidden in the Fog. Athenaeum. Grades 5-7.
Kansas
Brown, Irene Bennett. (1982). Before the Lark. Athenaeum. Grades 4-8.Martin, Bill Jr. and Archambault, John. Ghost-eyed Tree. Henry Holt.
Grades K-3.Martin, Bill Jr. and Archambault, John. Merry Months of Birds. DLM Grades
K-5.
Minnesota
Bauer, Marion Dane. (1991). Face to Face. Clarion. Grades 5-8.Paulson, Gary. (1996). Puppies. Dogs. and Blue Northerns: Reflections on
Being Raised by A Pack of Sled Dogs. Harcourt Brace & Co. Grades4-8.
Paulson, Gary. (1994). Father Water. Mother Woods: Essays on Fishingand Hunting in the North Woods. Delacorte Press. Grades 6-12.
Paulson, Gary. (1991). The Cookcamp. Orchard. Grades 5-8.Paulson, Gary. Popcorn Days and Buttermilk Nights. Lodestar. Grades6- 9.Wood, Douglas. (1995). Minnesota. the Spirit of the Land. Voyageur Press.
7
8
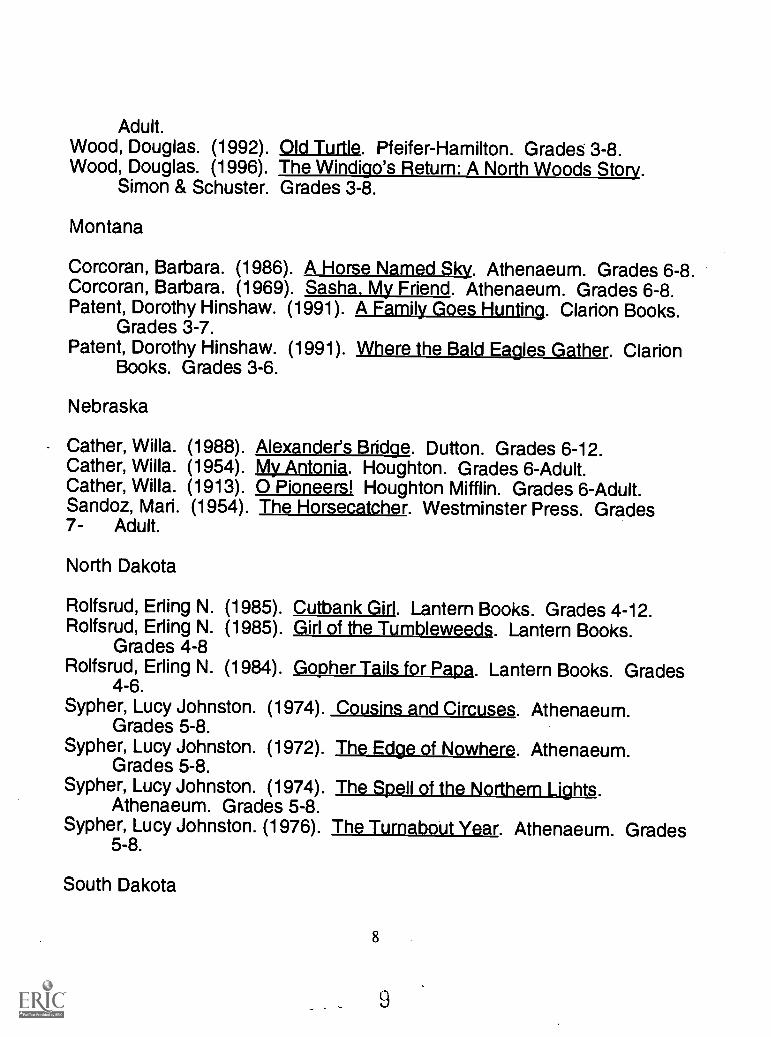
Adult.Wood, Douglas. (1992). Old Turtle. Pfeifer-Hamilton. Grades 3-8.Wood, Douglas. (1996). The Windigo's Return: A North Woods Story.
Simon & Schuster. Grades 3-8.
Montana
Corcoran, Barbara. (1986). A Horse Named Sky. Athenaeum. Grades 6-8.Corcoran, Barbara. (1969). Sasha. My Friend. Athenaeum. Grades 6-8.Patent, Dorothy Hinshaw. (1991). A Family Goes Hunting. Clarion Books.
Grades 3-7.Patent, Dorothy Hinshaw. (1991). Where the Bald Eagles Gather. Clarion
Books. Grades 3-6.
Nebraska
Cather, Willa.Cather, Willa.Cather, Willa.Sandoz, Mari.7- Adult.
North Dakota
(1988). Alexander's Bridge. Dutton. Grades 6-12.(1954). My Antonia. Houghton. Grades 6-Adult.(1913). 0 Pioneers! Houghton Mifflin. Grades 6-Adult.(1954). The Horsecatcher. Westminster Press. Grades
Rolfsrud, Er ling N. (1985). Cutbank Girl. Lantern Books. Grades 4-12.Rolfsrud, Er ling N. (1985). Girl of the Tumbleweeds. Lantern Books.
Grades 4-8Rolfsrud, Er ling N. (1984). Gopher Tails for Papa. Lantern Books. Grades
4-6.Sypher, Lucy Johnston. (1974).
Grades 5-8.Sypher, Lucy Johnston. (1972).
Grades 5-8.Sypher, Lucy Johnston. (1974).
Athenaeum. Grades 5-8.Sypher, Lucy Johnston. (1976).
5-8.
South Dakota
Cousins and Circuses. Athenaeum.
The Edge of Nowhere. Athenaeum.
The Spell of the Northern Lights.
The Turnabout Year. Athenaeum. Grades
8
9
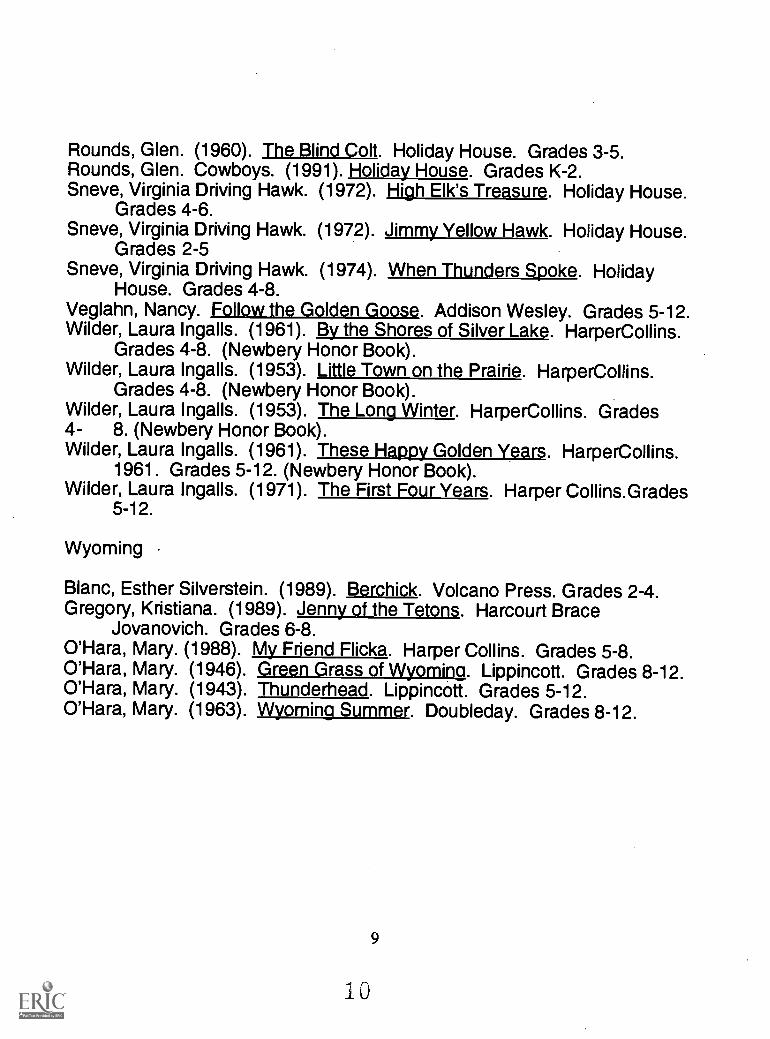
Rounds, Glen. (1960). The Blind Colt. Holiday House. Grades 3-5.Rounds, Glen. Cowboys. (1991). Holiday House. Grades K-2.Sneve, Virginia Driving Hawk. (1972). High Elk's Treasure. Holiday House.
Grades 4-6.Sneve, Virginia Driving Hawk. (1972). Jimmy Yellow Hawk. Holiday House.
Grades 2-5Sneve, Virginia Driving Hawk. (1974). When Thunders Spoke. Holiday
House. Grades 4-8.Veglahn, Nancy. Follow the Golden Goose. Addison Wesley. Grades 5-12.Wilder, Laura Ingalls. (1961). By the Shores of Silver Lake. Harper Collins.
Grades 4-8. (Newbery Honor Book).Wilder, Laura Ingalls. (1953). Little Town on the Prairie. Harper Collins.
Grades 4-8. (Newbery Honor Book).Wilder, Laura Ingalls. (1953). The Long Winter. Harper Collins. Grades4- 8. (Newbery Honor Book).Wilder, Laura Ingalls. (1961). These Happy Golden Years. Harper Collins.
1961. Grades 5-12. (Newbery Honor Book).Wilder, Laura Ingalls. (1971). The First Four Years. Harper Collins.Grades
5-12.
Wyoming
Blanc, Esther Silverstein. (1989). Berchick. Volcano Press. Grades 2-4.Gregory, Kristiana. (1989). Jenny of the Tetons. Harcourt Brace
Jovanovich. Grades 6-8.O'Hara, Mary. (1988). My Friend Flicka. Harper Collins. Grades 5-8.O'Hara, Mary. (1946). Green Grass of Wyoming. Lippincott. Grades 8-12.O'Hara, Mary. (1943). Thunderhead. Lippincott. Grades 5-12.O'Hara, Mary. (1963). Wyoming Summer. Doubleday. Grades 8-12.
9
10
REFERENCES
Beck, I. L. & McKeown, M. G. (1991). Social studies texts are hard tounderstand: Mediating some of the difficulties. Language Arts 68: 482-490.
Calfee, R. C. (1987). The role of text structure in acquiring knowledge.Final Report to the U.S. Department of Education (Federal Program No.,122b). Palo Alto, CA.: Stanford University, Text Analysis Project.
Clarke, G. (1990). A proposal to revise the elementary social studiescurriculum. ERIC Document Reproduction Service No. ED 318 661.
Common, K. L. (1986) Students, stories and the social studies. TheSocial Studies. 77(3): 246-248.
England, J. (1992). Building community for the 21st century. ERICDocument Reproduction Service No. EDD CG-92-8).
Fitzhugh, W. P. (1993, January). Geography and reading: Anintegrated approach to teaching reading skills. ERIC Reproduction ServiceNo. 367 563.
Harris, V. J. (1990). Multiethnic children's literature. In Exploringliterature in the classroom: Content and methods, ed. K. D. Wood and A.Moss. Christopher-Gordon, 169-201.
Lamme, A. J. (1987). Geography in children's literature: A Floridastudy. Journal of Geography. 4(86)160-164.
Levstik, L. (1985). Literary geography and mapping. SocialEducation. 49(1): 38-43.
Mattson, D. L. & Richardson, M. V. (1992). Salad bowl--All together,all unique, all special. ERIC Reproduction Service No. 349 526.
Oden, P. (1995, July/August). Books, places, regions--A naturalblend. Journal of Geography. 94(4): 466-470.
Pugh, S. L., Garcia, J., & Margalef-Boada, S. (1994, March/April).
10
1 1
Multicultural trade books in the social studies classroom. The SocialStudies. 85(2):62-65.
Sewall, G. T. (1988). American History textbooks: Where do we gofrom here? Phi Delta Kappan. 69(8): 553-558.
Shumaker, M. P. & Shumaker, R. C. (1988). 3000 paper cranes:Children's literature for remedial readers. The Reading Teacher. 41(6):544-549.
Smith, J. L. & Johnson, H. A. (1995, March\April). Dreaming ofAmerica: Weaving literature into middle school social studies. The SocialStudies. 86(1): 60-68.
Skeleton, S. (1991). Our shrinking world: The need for culturalawareness. Paper presented at the Annual Conference of the Associationfor Childhood Education International, San Diego, CA. (ERIC DocumentReproduction Service No. ED 338 381).
11
12
CRITICAL THINKING STRATEGIES ACROSS THE CURRICULUM
Constance L. HoagAssociate ProfessorSchool of Education
University of South Dakota
Sharon AndrewsGraduate Student
University of South Dakota
12
INTRODUCTION
Critical Thinking. What is it? Who does it? Who should do it? Howdoes one do it? What happens when one does it? Does it hurt? Does ithelp? ... Yes, the idea of critical thinking evokes a multitude of questions,especially when one considers such an attractive phrase in moderneducational thought. Just think of it. Is it really possible, or even desirablethat we motivate and lead others to think "critically" or to "critically" think?What are the benefits of a population or a society where the citizens arebetter at this "skill," and conversely, what might be the risks of accepting orcontributing to a society that does not engage in this kind of "thought?" If itis agreed that this type of thinking, whatever it really is, should be a stalwartof our modern educational philosophy, there are many other questions toanswer such as how should the teaching of such a skill be incorporated asan integral part of the educational environment? Is the teaching of "criticalthinking" equally appropriate to all the various disciplines, or is it moreapparent and therefore more meaningful in certain areas?
Perhaps the best direction to offer, rather than attempting to answerthe myriad of questions about critical thinking, is to pose the realization thatfar too many in education do not have a clear understanding of thedefinition of the term "critical thinking." Most educators would say that theyare familiar with critical thinking and that we should all strive to developbetter "critical thinkers," but the reality is that far too many who areresponsible for teaching and administration do not actually understand theterm at a substantive and meaningful level. Perhaps an account of thedevelopment of the critical thinking concept throughout history will moveone toward a greater understanding of the various attributes and thoughtson this important issue.
Throughout ancient history, hundreds of thinkers have contributed tothe development of critical thinking, and each major discipline has madesome contribution to critical thought. "Socratic Questioning" is probably thebest known critical thinking strategy today, which began over 2400 yearsago with Socrates and his challenges to justification of claims to knowledge.Through this type of questioning, ideas and information are questionedintensely before they are considered believable. According to Richard Paul(Paul and Binker, et al., 1990), there are six categories of questions:
13
14
"questions of clarification, questions that probe assumptions, questions thatprobe reasons and evidence, questions about viewpoints or perspectives,questions that probe implications and consequences, and questions aboutthe question" (pp. 44-45).
Sometime later, in the fourth and fifth centuries BC, the Greekphilosophers Plato, who recorded Socrates' thought, and Aristotle elevatedand compared that which only the trained mind notices, and what othersperceive. They thought that only the trained mind could see below thedelusive appearances. As a result of this point of view, there came the needfor a more comprehensive manner of thinking which was securely based onreason while respondent to objections.
The practice of systematic critical thinking, which was established byGreek philosophers, was continued by others during the Middle Ages. Forexample, Thomas Aquinas (1225-1274) called further attention to thebenefits of constant inquisition and questioning, and the importance ofreasoning in thought. Further, Aquinas used the results of critical thinkingand the aspect of constant criticism as an integral aspect in the evolutionand development of his own ideas.
In tracing the developments in critical thinking throughout the ages,the Renaissance included many scholars in all the major disciplines whobegan to think critically and examine the concept of critical thinking. OneEnglish scholar, Francis Bacon understood the shortcomings of the mind'snatural thought tendencies. In his work, The Advancement of Learning,Bacon cautioned against learning through only established fact. Rather, headvocated the importance of world experiences in the assimilation ofknowledge.
Included in the current century are.many other great philosophersand scholars who contributed to critical thinking. In particular, the moderncritical thinking movement can be traced back to 1941 to the work ofEdward Glaser (Paul, 1993). In his book, An Experiment in theDevelopment of_Critical Thinking,.Glaser (1985) suggested that criticalthinking involves three main elements: "(1) an attitude of being disposed toconsider in a thoughtful, perceptive manner the problems and subjects thatcome within the range of one's experiences; (2) knowledge of the methodsof logical inquiry and reasoning; and (3) skill in applying those methods"
14
- 15
(p.25). In collaboration with Watson, Glaser developed The Watson-GlaserCritical Thinking Appraisal in 1940 which also contributed to the moderncritical thinking movement.
While there are many contributors to the modern critical thinkingmovement, two of the more notable proponents were Robert Ennis andHarvey Siegel. Ennis defined critical thinking as "rational, reflective thinkingconcerned with what to do or believe" (cited in Paul, 1993, p.135). Thisdefinition emphasizes the impact of critical thinking on everyday life. Siegeldefined critical thinking as appropriate thinking influenced by reasons. Hebelieved that forces other than reason (e.g. emotion, desire, rewards,punishment, etc.) often interfere with our thinking (California Commissionon Teacher Credentialing, 1997).
One of the more notable recent figures in the area of critical thinkingwas Beyer (1985) who offered more specific criteria are properties of criticalthinking behavior. Specifically, he believes that critical thinking is acollection of discrete skills or operations, each which combines analysis andevaluation to some degree. He has compiled lists of critical thinking skillsfrom other researchers or teams of researchers. This list includes thefollowing which are at the center of critical thinking: "distinguishing betweenverifiable facts and value claims; determining the reliability of a source;determining the factual accuracy of a statement; distinguishing relevantfrom irrelevant information, claims, or reasons; detecting bias; identifyingunstated assumptions; identifying ambiguous or equivocal claims orarguments; recognizing inconsistencies or fallacies in a line of reasoning;distinguishing between warranted and unwarranted claims; and,determining the strength of an argument" (p.272).
Finally, the work of Richard Paul (1993) offers much more elaborationon the concept of critical thinking and further relates the idea tocontem-porary education. Paul believes that we should not put too muchweight on one definition of critical thinking because of the complex nature ofthe concept. In collaboration with A.J.A. Binker and Daniel Weil, Paul wrote,Critical Thinking Handbook: A Guide forRemodeling Lesson Plan inLanguage Arts, Social Studies, and Science (1990), in which he suggeststhat there are thirty-five dimensions of critical thinking, including affectiveand cognitive strategies. In general, Paul (1993) contends that the mind iscapable of spontaneous thought, but that it does not naturally think critically
15
16
or discipline itself in an intellectual manner. He further states that trainingand intervention are required to cause the mind to think critically.
There is public pressure on schools to demonstrate their worth andsuch pressure has caused school systems to narrow the focus of evaluationto tangible goals, competency based skills and achievement tests.However, the quality of learning is determined by the quality of the processoperations used in learning (Beyer, 1987, p. 25).
Educators (Paul, 1990) believe the evaluation of the quality ofeducation should be found in the context of the processes, the strategiesand the methods used by teachers. Research demonstrates that learningcan be improved and that scores on standardized achievement tests canbe raised if thinking skills are regularly integrated in the classroom. Further,when teachers begin to develop their own thinking and problem solvingskills, they are more likely to try new ideas in the classrooms.
PURPOSE OF THE STUDY
The purpose of this study was to determine the critical thinkingknowledge base of pre-service teachers and compare that knowledge basewith critical thinking and strategy acquisition/growth after two semesters ofuniversity classroom instruction and field based classroom experiences.The survey was completed prior to the student teaching semester.
For purposes of this study a strategy is defined as flexible plan that isused consciously, often to improve comprehension. Thinking strategies aremental plans in which a sequence of steps are used to secure informationenabling the learner to process and understand tasks (Dole, Brown &Trathen, 1996).
Good {elementary classroom} workers possess many flexible,adaptable, strategies that they use before, during and after studying toincrease their comprehension (Bromley, p. 12). The researchers expandedon the Bromley definition to suggest that pre-service teachers shouldpossess many flexible, adaptable strategies that they can use before,during and after teaching to aid elementary students in classroomcomprehension and knowledge acquisition.
16
1 7
A six point questionnaire was completed on both a pre-andpost-critical thinking survey. Three questions focusing upon (1) Definingcritical thinking, (2) Defining problem solving, and (3) Relating criticalthinking to Reflective Decision Making are not reported in this paper.
The substance of the questions appropriate to this paper were: (1)What specific strategies are you awareof to use when teaching critical thingor Problem solving....?, (2) I remember being in a classroom when thefollowing critical thinking or problem solving strategies were used...., and (3)At the present time I would feel secure using the following critical thinking orproblem solving models in my teaching.
RESEARCH PROCEDURES
The population was determined by membership in two elementaryeducation cohorts progressing through the prescribed pre-serviceprogram, students in Dr. Hoag's Principles and Practices of Education andInternship (first semester), and Language Arts (second semester). Thetime period included the spring 1997, fall 1997 and spring 1998 semesters.Cohort I was surveyed in spring 1997 and fall 1997, while Cohort II wassurveyed fall 1997 and spring 1998. Cohort I had thirty-three studentsresponding to the pre- and post-test and Cohort ll had responses fromthirty-one students for a total of sixty-four pre-service teachers.
For purposes of consistency and accuracy in determining the level ofcritical thinking learning acquisition only, students names were required onthe surveys. Students were given the option to participate or not toparticipate. If students were unable to complete both surveys theirresponses were appreciated, but not included in the data for this study.Human subjects permission was sought and received.
VARIABLES
There are five variables to be acknowledged when considering theresults of this survey:
* On both pre- and post-surveys the pre-service students wereresponding from memory with no suggested list of strategies.This technique was followed in order to not lead students and toomit rote/echo responses. The researchers believe teaching
17
18
requires immediate strategy knowledge.* The identification of terms within and throughout the curriculum may
not be identical.* Last experiences with a particular strategy may be the first recalled.* Personification of the pre-service teachers needs or learning style
may best recalled.* Some of the responses pre-service students gave deviated from the
meaning of a teaching strategy as defined by this study. Inthose cases, the response will not contained in this document.
FINDINGS
All data is based on the results of the posttest. Scores are reportedonly if in the post test any specific strategy totaled five students or more.
The first reported question focused on specific strategy awareness.See Appendix A for the graphics of the following results. In the pretest threecritical thinking/problem solving strategies were recalled: 1)Think-Pair-Share (6 responses), with Brainstorming and Round TableDiscussion (5 responses).
After two semesters of class curriculum the pre-service studentsidentified 15 strategies: Think-Pair-Share (30 responses), Brainstorming(24 responses), KWL K=Know-W=Want to know-L=Learned (15responses), Circle Consensus Response and Round Table Discussion (11responses). Jigsaw (8 responses), Delving, Inside-Outside Circles andNumbered Heads Together (7 responses), S=Survey, Q=Question,3R=Read, Recite, Review (6 responses) D=Directed R=Reading T=Thinking A =Activity, Think-Pair-Square, Q=Question, A= Answer R=Responses, Think-Write-Pair-Share and Semantic Webbing (5 responses).
The second reported question asked the pre-service students torecall being in a classroom where specific strategies were used. On thepre-test only one strategy Brainstorming had the designated number of five(5 responses). On the post testThink-Pair-Share (53 responses),Brainstorming (32 responses), K-W-L (25 responses), SemanticMaps/Webbing (15 responses), Circle Consensus Response,Think-Pair-Write, and Round Table Discussion received (12 responses).Delving, Journaling, Venn Diagrams and Think-Pair-Square received (11
18
19
responses), with Think Alouds and Character Webs (8 responses) followedby Blooms Taxonomy (7 responses, QAR (6 responses) and DLTA (5responses). The graphic of this information is found in Appendix B.
The final question reported in this survey asked pre-service teacherswhich of the critical thinking/problem solving strategies they would feelsecure in using in their student teaching classroom. On the pre-testBrainstorming was the only strategy to receive 5 responses. On thepost-survey Brainstorming ranked first (42 responses) while Think PairShare and K-W-L tied for second (23 responses). Journaling and GroupWork received (10 responses) and Delving received (9 responses). CircleConsensus Response (8 responses), Think-Pair-Write (7 responses) andRound Table Discussion ranked next (6 responses). The final strategiesreceiving 5 responses were Venn Diagrams, Bloom's Taxonomy, SemanticMaps/Webbing and Problem Solving. This information can be seen inAppendix C.
CONCLUSIONS
The researchers believe the awareness and recall questions areimportant issues. For future teachers to recognize critical thinkingstrategies when a peer or colleague is using a specific model adds to theviewers teaching reporter.
However, we believe the most important results are found in the finalreported question. If teachers are to use such models they must feel astrong knowledge base and feel secure when using such strategies in theirclassroom. The increase of comfort was remarkable from one semester toanother, from being comfortable with only one strategy to beingcomfortable when teaching fifteen strategies. This information imploresprofessors of future teachers to teach, model, demonstrate and allowpre-service students to become familiar and comfortable with a repertoireof teaching strategies.
19
00
SUPPLEMENTARY INFORMATIONCRITICAL THINKING THROUGHOUT HISTORY
A. Early Experts on Critical Thinking
I. Socrates (over 2500 years ago)
a. discovered a method of questioning that challengedjustification of claims to knowledge.
b. established the importance of asking "deep" questionsthat probed profoundly into thinking before ideas shouldbe accepted and deemed worthy of belief.
c. "Socratic" questioning is the best known critical thinkingteaching strategy. (see list)
II. Greeks - Plato, Aristotle (fourth and fifth centeries B. C.)
a. emphasized that things are often very different from whatthey appear
b. thought only the trained mind could see below the surface(delusive appearances
c. resulted in systematic thought, comprehensive andwell-reasoned thinking that is responsive to objections.
ID. Thomas Aquinas (middle ages)
a. incorporated responses to the test of critical thought andcriticism as a necessary stage in developing his ideas
b. raised awareness of the power and need for reasoning tobe developed and questioned (cross-examined).
IV. Francis Bacon (Renaissance 15th-16th centuries)
a. recognized that the-mind cannot be left to its naturaltendencies
b. wrote The Advancement of Learning which argued theimportance of studying the world from experience, ratherthan established facts.
20
V. Co let, Erasmus, More, Descartes, Machiavelli
VI. 16th and 17th Centuries
Hobbes, Lock, Boyle, Newton, Bay le, Montesquieu, Voltaire,Diderot
VII. 18th Century
Adam Smith, Kant
VIII. 19th Century
Comte, Spencer, Darwin, Freud
IX. Twentieth Century Experts on Critical Thinkinq
a. John Dewey (1933)
b. Edward Glaser suggested that critical thinking involvesthree main elements:1. an attitude of being disposed to consider in a
thoughtful, perceptive manner the problems andsubjects that come within the range of one'sexperiences
2. knowledge of the methods of logical inquiry andreasoning
3. skill in applying those methods
c. Robert Ennis (1962) defined critical thinking as "rational,reflective thinking concerned with what to do or believe."His definition calls attention to the wide role that criticalthinking plays in.everyday life.
d. Harvey Sigel (1980) defined critical thinking as thinkingappropriately moved by reasons. Our minds are ofteninappropriately moved by forces other than reason (e.g.
21
4.2
Fears, emotions, desires, rewards, punishment, etc.).
e. B. Beyer (1985) compiled lists of critical thinking skills fromother researchers.1. distinguishing between verifiable facts and value
claims2. determining the reliability of a source3. determining the factual accuracy of a statement4. distinguishing relevant from irrelevant information,
claims, or reasons5. detecting bias6. identifying unstated assumptions7. identifying ambiguous or equivocal claims or
arguments8. recognizing logical inconsistencies or fallacies in a
line of reasoning9. distinguishing between warranted and unwarranted
claims10. determining the strength of an argument. Walker,
pp. 17-18.
f. Richard Paul believes critical thinking is very complex.The mind does think spontaneously, but it is not of thenature of the mind to think critically. It takes training andIntervention to get the mind to think critically. It is notnormal or common for the human mind to discipline itselfintellectually.
Paul defined critical thinking as:1. disciplined, self-directed thinking which exemplifies
the perfection's of thinking appropriate to aparticular mode or domain of thinking
2. thinking that displays mastery of intellectual skillsand abilities
3. the art of thinking-about your thinking while you arethinking in order to make your thinking better: moreclear, more accurate, or more defensible.
22
2 3
Questions to be considered in the study of critical thinking:
1. What is critical thinking?
2. What are the benefits of a population or a society wherethe citizens are better at this "skill"?
3. What might be the risks of accepting or contributing to asociety that does not engage in this type of thought?
4. How should critical thinking be taught?
5. Does the mind naturally think critically, or does it have tobe trained to do so?
6. Who should teach critical thinking skills?
7. When should the teaching of critical thinking begin?
8. Is the teaching of critical thinking equally appropriate to allthe various disciplines?
9. When teaching critical thinking skills, is the teaching ofcontent sacrificed?
10. How should educators be held accountable for theteaching of critical thinking?
11. Do educators know how to teach critical thinking skills?
The following are examples of Socratic Questioning (from Critical ThinkingHandbook: A Guide for Remodeling Lesson Plans in Language Arts, SocialStudies, and Science, by Richard Paul, A.J.A. Binker, and Daniel Weil, 1995)
Questions of ClarificationWhat do you mean byCould you explain that further?Why do you say that?
23
L4
Questions that Probe AssumptionsWhat are you assuming?What could we assume instead?Is it always the case? Why do you think the assumption
holds here?
Questions that Probe Reasons, Evidence, and CausesIs that good evidence for believing thatWhat do you think the cause is?What are your reasons for saying that?
Questions About Viewpoints or PerspectivesWhat is an alternative?What would someone who disagrees say?Can/did anyone see this a different way?
Questions that Probe Implications and ConseauencesWhat are you implying by that?What effect would that have?If this and this are the case, then what else must be true?
Questions About the QuestionIs the question clear? Do we understand it?Do we all agree that this is the question?Why is this question important?
24
REFERENCES
Beyer, B. (1985). Critical thinking: What is it? Social Education, 49270-276.
Beyer, B. K. (1987). Practical strategies for the teaching of thinking.Allyn & Bacon, Inc. Boston.
Bromley, K. D. (1998). Language arts exploring connections (3rd ed.).Allyn & Bacon, Inc. Needham Heights, MA.
California Commission on Teacher Credentialing. (1997). Californiateacher preparation for instruction in critical thinking: Research findingsand policy recommendations. State of California.
Dale, J. A. , Brown, K. J., & Trethen, W. (1996). The effects of strategyinstruction on the comprehensive performance of at-risk students. ReadingResearch Quarterly, 31, 62-89.
Glaser, E. M. (1985). Educating for responsible citizenship in ademocracy. National Forum, LXV 24-27.
Paul, R. (1993). Critical thinking. Santa Rosa, CA: Foundation forCritical Thinking.
Paul, R. and Binker, A. J. A., & Weil, D. (1995). Critical thinkinghandbook: 4th-6th grades. A guide for remodeling lesson plans inlanguage arts, social studies, and science. Santa Rosa, CA: Foundation forCritical Thinking.
25
()4 1)
THE EI.PECT OF JOURNAL WRITING ON TEACHERS' THEORYDEVELOPMENT
Lana M. DanielsonAssociate ProfessorSchool of Education
University of South Dakota
26
INTRODUCTION
Writing-to-learn is an active approach to processing information andideas. It suggests that learning and writing are meaning-making processesthat facilitate the learner's ability to discover connections, describeprocesses, express emerging understanding, raise questions, and findanswers (Mayher, et al, 1983). Learning involves making distinctionsbetween different types of information. Schema theory provides anunderstanding of how prior knowledge is used to comprehend newinformation. Sometimes their prior knowledge helps learners to assimilateinformation, that is, it assists them in remembering certain facts. At othertimes, learners accommodate a new conceptualization. This occurs whenlearners reconstruct their understanding by interpreting the newinformation in relation to their prior knowledge (Rumelhart and Norman,1977). While writing can facilitate assimilation of information through theprocess of recording new facts, it is especially useful in promotingaccommodation in which the shaping and sharpening of this informationoccurs and new meaning can be constructed.
Britton (1975) described three kinds of writing. The first, calledtransactional, is writing "to get things done." It is used to inform, to advise,to persuade, or to instruct. In short, it is a means to an end. A secondfunction is called expressive. This is language "close to the self," often akind of "thinking aloud" on paper. It reflects the writer's immediate thoughtsand feelings, it is relaxed and familiar rather than formal, and thus it allowsthe writer to take risks. According to Britton, it is in this mode that "we framethe tentative first drafts of new ideas...where in times of crisis...we attempt towork our way towards some kind of a resolution" (82). A third category ofwriting is the poetic. This is language used as an art form and it exists for itsown sake.
According to Britton (19.75), as a novice the learner relies on theexpressive mode; the task and the audience remain close to his or herexperience. It is through the expressive mode that the writer is able tomove toward the transactional or poetic. As he or she gains expertise,choice of function is possible. The writer is able to express thoughts in
27
different ways, moving away from the intimacy of his or her own thoughts toaccommodate communication framed by different contexts and for differentaudiences.
Research on the use of journals (Mayher et al, 1983; Furwiler, 1987)indicates that expressive writing accommodates a variety of functions and .
audiences. It might serve as a reporting tool or as a place for examiningreactions to an event or experience. It might be written for the self orshared as a written dialogue with others. It can be used to record one'sthinking in progress, a means of processing new ideas in relation to what isalready known or experienced, to ask questions, synthesize ideas, andevaluate current thoughts about theory and practice. Journals put writers atthe center of the learning, allowing them to make decisions about the topicto be explored, the audience for whom they are writing, and the choice oflanguage to represent their understanding. By privileging such choice,connections can be made between personal knowledge or beliefs and newideas or concepts.
BACKGROUND OF THE STUDY
The Nebraska Prairie Visions Summer Institute, which began in 1987,was designed to provide training to K-12 educators in Nebraska on theimplementation of discipline-based art education (DBAE). Art specialists,classroom teachers, and administrators attended the Institute as schoolteams. The focus of the first week, located at the Joslyn Art Museum inOmaha, is DBAE theory. The second week teams meet in four smallerregional groups (Omaha, Lincoln, Kearney, and Scottsbluff) to focus onimplementation of DBAE in classroom practice. A third week allowsparticipants to write DBAE unit plans at their individual school sites.
In planning the 1994 Nebraska Prairie Visions Summer Institute, itwas decided that writing would be central to the instruction for andevaluation of learning about discipline-based art education. Writingprompts were devised to assist the participants in reflecting on what theyhad learned, how they were feeling about the day's experiences, and howthey were integrating new knowledge into their own beliefs about arteducation. Team leaders were introduced to theory that supportswriting-to-learn, the purpose of the writing segment of the Institute, andstrategies (e.g., providing written feedback, modeling reflective questions,
28
2 9
leading small group discussion on the previous day's writing) for facilitatingthe writing task in their small groups.
In 1995 it was decided that data would be gathered to document theparticipants' conceptualization of DBAE theory as indicated in their journalwriting. The segment of the study reported in this article was conductedduring the first week of the 1995 Institute and involved 111 Level 1participants. Journal writing time was scheduled each afternoon of theInstitute as a form of debriefing and discussion time was scheduled prior tothe formal lecture or activities the following morning. The Day 1 prompt was"Describe your experience in touring the Joslyn Galleries. What surprisedyou? What left you in awe or made you comfortable? What gallery or workare you eager to revisit? Why?" On succeeding days the followingwriting prompts were provided. "Today's activities...
created tensions in my thinking with regard to because....reinforced my thinking about because ....fostered an awareness about my current practice because ....raised the following questions in my mind ....made me reconsider my belief about because ....left me in need of more information about ....related to previous learning in which ....offered a meaningful application to my current practice by ...."
Two research questions guided this study: (1) How does journalwriting facilitate the participant's growth in conceptualizing the DBAEtheory? and (2) How does journal writing provide a vehicle for implementingDBAE into classroom practice?
To facilitate the data collection process, each participant wasprovided with color-coded NCR paper that listed specific writing promptsand space for daily responses. They were asked to select a personal code(e.g., initials, numerals, a logo) to designate their journal entries as a meansof providing anonymity as well as a sorting mechanism when data weregrouped for analysis.
SCORING PROTOCOLS
To analyze the data a basic protocol was designed to assess the
29
participants' growth in conceptualizing the DBAE theory and implementing itinto classroom practice. The protocol was based on research on reflectivedecision-making (Danielson, 1992), theory building (Lee, 1987), andstages of concern and levels of use of an innovation (Fuller, 1969; Hall &Loucks,1977, 1979).
Danielson (1992) examined what informed the decisions noviceteachers made about their teaching. Four stages characterized theirdecisions. At the technological level, novice teachers relied on an externalauthority such as theory presented in methods classes, their field-basedsupervisor, or the textbook. At the situational level, novice teachersresponded to the context, relying on their perceptions of What had occurredor what they anticipated would occur based on the specific event. At thedeliberate level, novice teachers recognized a dilemma or tension thatprompted them to ask questions and to seek other sources of informationbeyond the context. At the dialectical level, novice teachers moved beyondthe deliberate mode to transform their thinking and their teachingbehaviors.
Lee (1987) identified five aspects of theory building. Teachersconsider their own practice, reflect on what they do, engage in risk-taking,conduct action research to learn more about their practice, and thusinternalize theory.
Fuller (1969) and Hall and Loucks (1977; 1979) examined teachers'stages of concern as they encounter change and the levels of use thatcharacterize the implementation of innovations. The stages of concerninclude awareness (little concern about or involvement with the innovation);informational (a general awareness and interest in learning more about theinnovation); personal (uncertainty about the demands of the innovation andpersonal adequacy to meet them); management (focus on processes andtasks of using the innovation effectively); consequence (focus on impact ofinnovation on students and how to evaluate learning outcomes);collaboration (focus on coordination and cooperation in using innovation);refocusing (exploration of more universal benefits or applications of theinnovation).
Fuller also identified seven levels of use: the non-use level (user haslittle or no knowledge of innovation); orientation (user has recently acquired
30
information about he innovation); preparation (user is preparing for first useof the innovation); mechanical (user focuses most effort on short term,superficial use with little reflection on implications of the theory in theirpractice); routine (user has stabilized innovation with few changes and littlethought given to preparation or improvement of activity); refinement (uservaries the use of the innovation to increase impact on students); integration(user combines own efforts to use innovation with related activities ofcolleagues); renewal (user reevaluates quality of use of innovation toachieve increased impact on students, examines current research, andexplores new goals).
Based on these models and an initial reading of the data, a simplifiedprotocol was designed. Four basic stages were identified: Stage 1:Perfunctory (participant offered general summary response to the day'sevents); Stage 2: Self (participant indicated personalized orientation totheory and interest in learning more); Stage 3: Deliberate (participantfocused on process and tasks related to theory but at a superficial or literallevel);and Stage 4: Dialectical (participant indicated transfer of theory intopractice with risk-taking, appropriate new applications, and refinement ofinitial learning). Each journal entry was coded according to one of the fourstages and entered on a scoring sheet to provide a pattern of reflection forindividual participants as well as for the group over the week. For thepurposes of this study, only the pattern for the group is reported. (NR = Noresponse.) The scoring protocol with anchor responses from participants'journals is provided in Appendix A.
31
32
FINDINGS
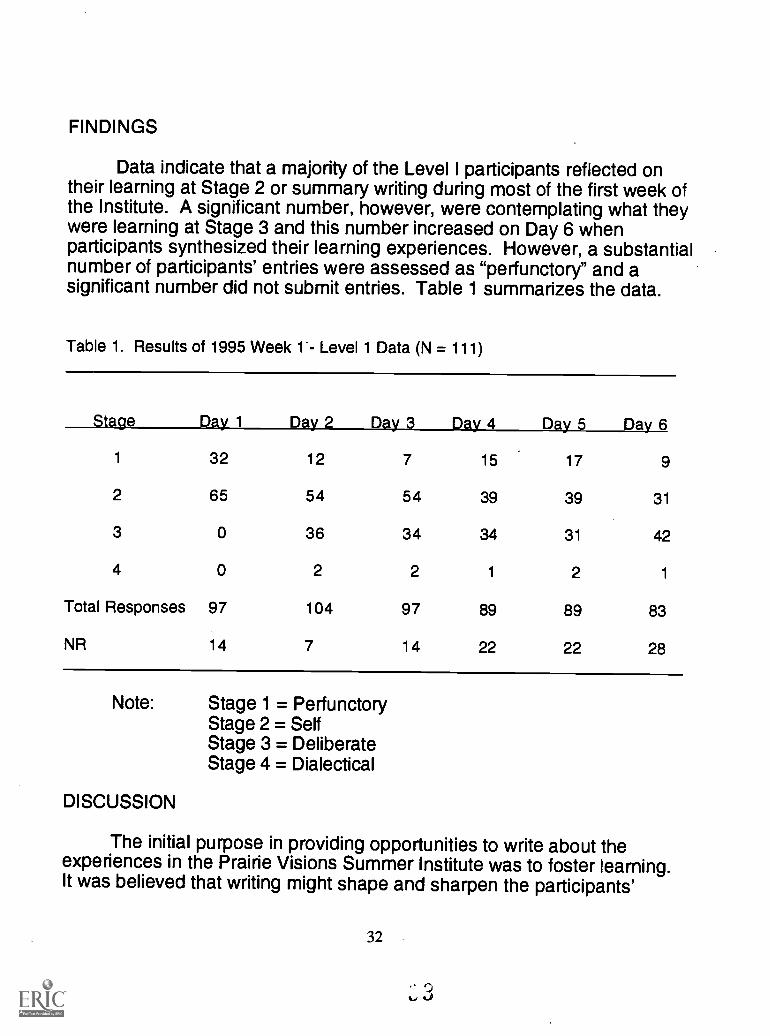
Data indicate that a majority of the Level I participants reflected ontheir learning at Stage 2 or summary writing during most of the first week ofthe Institute. A significant number, however, were contemplating what theywere learning at Stage 3 and this number increased on Day 6 whenparticipants synthesized their learning experiences. However, a substantialnumber of participants' entries were assessed as "perfunctory" and asignificant number did not submit entries. Table 1 summarizes the data.
Table 1. Results of 1995 Week 1- Level 1 Data (N = 111)
Stage Day 1 Day 2 Day 3 Day 4 Day 5 Day 6
1 32 12 7 15 17 9
2 65 54 54 39 39 31
3 o 36 34 34 31 42
4 0 2 2 1 2 1
Total Responses 97 104 97 89 89 83
NR 14 7 14 22 22 28
Note: Stage 1 = PerfunctoryStage 2 = SelfStage 3 = DeliberateStage 4 = Dialectical
DISCUSSION
The initial purpose in providing opportunities to write about theexperiences in the Prairie Visions Summer Institute was to foster learning.It was believed that writing might shape and sharpen the participants'
32
thinking about DBAE and provide a vehicle for a deeper conceptualizationof the theory and its implications in their classroom practice. Writingprompts were developed to encourage participants to think about theirexperiences each day and to provide a choice that matched their personalcomfort in articulating what they were learning or feeling. Faculty wereinserviced on the purpose of the writing and time was formally provided inthe schedule to validate its importance.
There are several possible reasons for the preponderance of Stage 1and 2 responses and the resulting smaller number of participantsresponding at Stage 3 and 4. The nature of the writing prompts might be afactor. Perhaps the writing prompts inadvertently invited responses relatedto how the activities could be used in the participants' classroom rather thanon how the theory/conceptual learning behind the activities could be used.Perhaps the number of reflections at Stage 1 could be diminished byeliminating prompts that invite summary writing. If, however, Week 1 isprimarily for learning and processing theory at a personal level,participants' response at Stage 2 or Stage 3 is appropriate. During Week 2when the goal is to transfer the theory into classroom practice, a concertedeffort could be made to foster reflection at Stage 3 and Stage 4.
Although time for reflective writing and dialogue was formally part ofthe schedule, actual use of the time might have been undermined. Latearrivals in the morning, early departures at the end of a full day,preferences for writing in one's own environment, and sessions that ranovertime at the end of a day all likely contributed to a casual regard(disregard) or perfunctory use of writing to facilitate thinking and learning.Discussion in the small groups prior to writing might foster greaterunderstanding that the purpose of an activity is to facilitate meaningfullearning of a concept and the routine appropriation of a "fun" or "neat"activity should be analyzed in terms of more sophisticated rationale for itsuse. Perhaps time for reflection needs to be during the day or tied to thebreak to encourage group processing and to validate the importance offormal debriefing tasks such as discussion and journal writing.
Faculty may need additional inservice on how to facilitate higherlevels of reflection. Discussions with participants about the purpose of thewriting and delving into their responses on why they enjoyed an activity andhow it might be transferred into their practice should be encouraged. In
33
3 4
some cases faculty might equate the amount of writing or speaking with thedepth of thought; their own level of conceptualization of what it means tobuild theory and implement it into meaningful practice might beunderdeveloped. Understanding what it means to internalize theory mightfoster a greater investment in facilitating writing, speaking, and thusthinking about DBAE. Reading the journal entries with increased purposeand then using them to initiate dialogue among participants mightencourage a greater degree of reflection.
Although the number of no responses (NR) might indicate absences,it is more likely that the writing tasks were not highly valued by the facultymember or some participants and that, as a result, a lack of sufficientmonitoring condoned non-completion of the journal entries. Research(Britton, 1975; Danielson, 1992; Fuller, 1969; Hall & Loucks,1977, 1979;and Lee, 1987) indicates the importance of social interaction in theorybuilding. The writing tasks have largely been a solitary activity, not so muchby design as by convenience. If the reflective writing could be combinedwith group discussions, a higher level of conceptualization of the theorymight result. Faculty should demonstrate the kind of thinking thatcontributes to growth by modeling how to move from summary (Stage 1)and personalized orientations (Stage 2) to meaningful applications (Stage 3and Stage 4). Additional inservice may be needed for faculty to develop thisskill.
The scoring protocols were based on what the researcher perceivedto be the goals of Week I. Perhaps an expectation to move beyond Stage 2in Week I is premature. Goals for participants' growth in their conceptual-ization of DBAE might be unrealistic given the intensity of the Institution andthe time in which participants can process a new knowledge base.
Some participants were more favorably disposed to reflect on theirpractice, as was indicated by their writing at Stage 3 and Stage 4. The codesheets indicate a horizontal pattern of the writing; that is, we could analyzeindividual participants to document the pattern of thinking throughout his orher participation. The-data from the 1995-Institute provides coding for 111participants during Week 1. Case studies of selected individuals might offeranother perspective on how learners process information and integrate itinto their theory base.
34
3 5
Perhaps analysis of the development and completion of unit plansduring Weeks 2 and 3 would provide additional information on how theparticipants have conceptualized DBAE theory. Of particular importancewould be the appropriate selection of activities to facilitate the desiredlearning outcomes. A strong pattern in the data was the description of anactivity as "fun" or "neat" without elaboration on how it contributes tomeaningful learning. Too often an activity is cast as the learning rather thana means for facilitating the learning. As part of the unit plan, participantsshould be required to articulate the desired learning, a meaningful rationalefor why an activity has been used (especially if it has been appropriatedfrom the Institute), how the activity will support the learning of specificconcepts, and how the task will be evaluated in terms of the statedobjective.
Finally, a word of caution. The writing episodes are one data source.For some of the participants writing is uncomfortable; for others it mighthave been supplementary to their group interactions; still others might havedone there processing with other participants through discussions outsidethe formal schedule Prairie Visions. Writing is only one vehicle forprocessing and demonstrating one's thinking.
35
3 6
REFERENCES
Britton, J., Burgess, T., Martin, N., McLeod, A. and Rosen, H. (1975).The development of writing abilities (11-18). London: MacMillan EducationLtd.
Danielson, L. (1992). Explorim modes of thinking: A study of howstudent teachers reflect on their practice. Unpublished doctoral dissertation.University of Iowa, Iowa City, IA.
Fuller, F. (1969). Concerns of teachers: A developmentalconceptualization. American Educational Research Journal, 6:2, 207-226.
Furwiler, T. (Ed.). (1987). The journal book. Portsmouth, NH:Boynton/Cook Publishers.
Hall and Loucks. (1979). New York: Teachers College Press,Columbia University.
Hall and Loucks. (1977). A development model for determiningwhether the treatment is actually implemented. American EducationalResearch Journal, 14 (Summer), 263-276.
Lee, S. (1987). The foundation of teachers' theory building.Unpublished doctoral dissertation. Texas A & M University, College Station,TX.
Mayher, J.; Lester, N., and Pradl, G. (1983). Learning to write/writingto learn. Portsmouth, NH: Boynton/Cook Publishers.
Rumelhart, D. and Norman, D. (1977). Accretion, tuning andrestructuring: Three modes of learning. In J. Cotton and R. Klatzky (Eds.),Semantic factors in cognition. Hillsdale, NJ: Erlbaum.
36
3 7
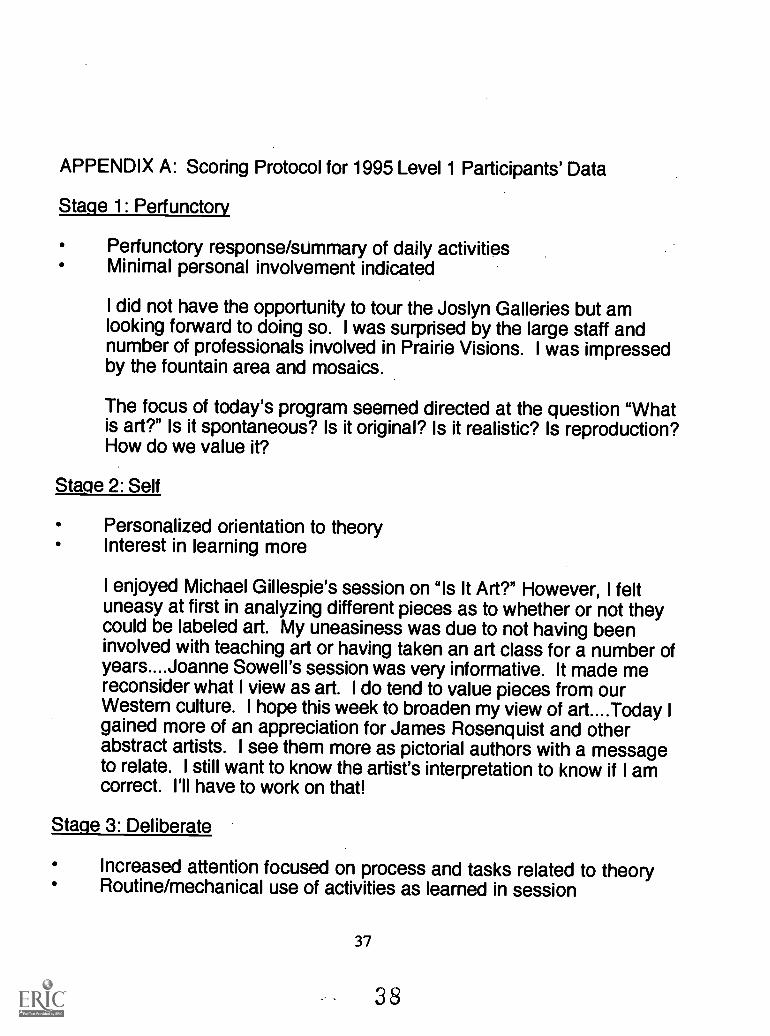
APPENDIX A: Scoring Protocol for 1995 Level 1 Participants' Data
Stacie 1: Perfunctorv
Perfunctory response/summary of daily activitiesMinimal personal involvement indicated
I did not have the opportunity to tour the Joslyn Galleries but amlooking forward to doing so. I was surprised by the large staff andnumber of professionals involved in Prairie Visions. I was impressedby the fountain area and mosaics.
The focus of today's program seemed directed at the question "Whatis art?" Is it spontaneous? Is it original? Is it realistic? Is reproduction?How do we value it?
Staqe 2: Self
Personalized orientation to theoryInterest in learning more
I enjoyed Michael Gillespie's session on "Is It Art?" However, I feltuneasy at first in analyzing different pieces as to whether or not theycould be labeled art. My uneasiness was due to not having beeninvolved with teaching art or having taken an art class for a number ofyears....Joanne Sowell's session was very informative. It made mereconsider what I view as art. I do tend to value pieces from ourWestern culture. I hope this week to broaden my view of art....Today I
gained more of an appreciation for James Rosenquist and otherabstract artists. I see them more as pictorial authors with a messageto relate. I still want to know the artist's interpretation to know if I amcorrect. I'll have to work on that!
Staqe 3: Deliberate
Increased attention focused on process and tasks related to theoryRoutine/mechanical use of activities as learned in session
37
38
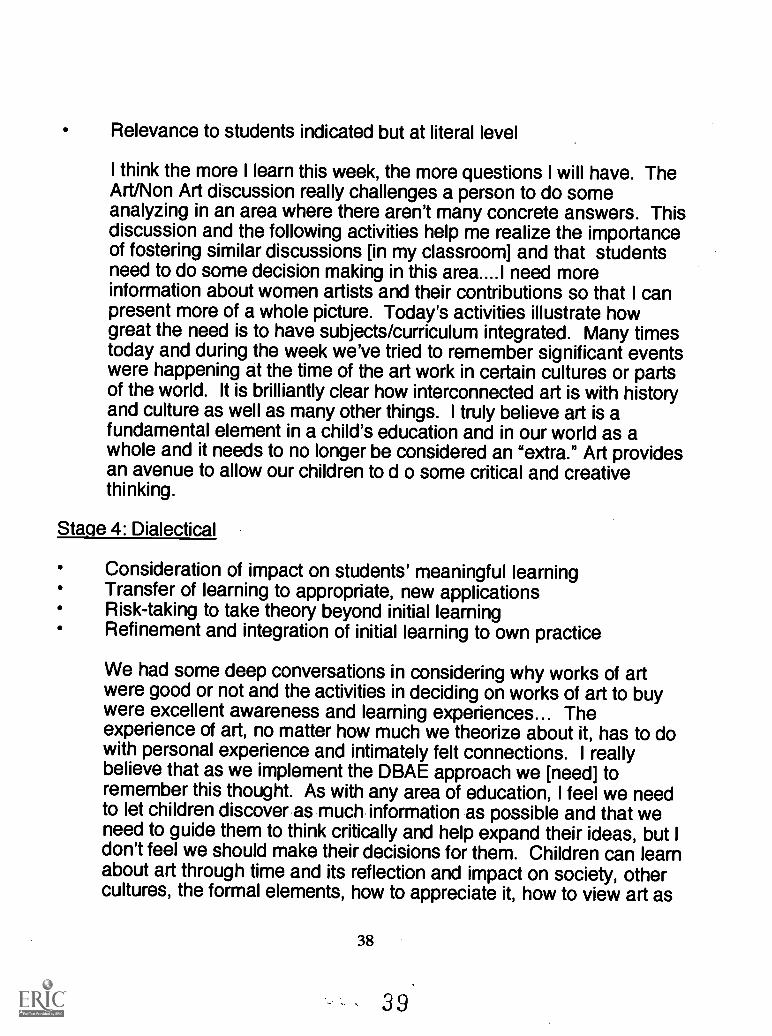
Relevance to students indicated but at literal level
I think the more I learn this week, the more questions I will have. TheArt/Non Art discussion really challenges a person to do someanalyzing in an area where there aren't many concrete answers. Thisdiscussion and the following activities help me realize the importanceof fostering similar discussions [in my classroom] and that studentsneed to do some decision making in this area....I need moreinformation about women artists and their contributions so that I canpresent more of a whole picture. Today's activities illustrate howgreat the need is to have subjects/curriculum integrated. Many timestoday and during the week we've tried to remember significant eventswere happening at the time of the art work in certain cultures or partsof the world. It is brilliantly clear how interconnected art is with historyand culture as well as many other things. I truly believe art is afundamental element in a child's education and in our world as awhole and it needs to no longer be considered an "extra." Art providesan avenue to allow our children to d o some critical and creativethinking.
Stage 4: Dialectical
Consideration of impact on students' meaningful learningTransfer of learning to appropriate, new applicationsRisk-taking to take theory beyond initial learningRefinement and integration of initial learning to own practice
We had some deep conversations in considering why works of artwere good or not and the activities in deciding on works of art to buywere excellent awareness and learning experiences... Theexperience of art, no matter how much we theorize about it, has to dowith personal experience and intimately felt connections. I reallybelieve that as we implement the DBAE approach we [need] toremember this thought. As with any area of education, I feel we needto let children discover as much information as possible and that weneed to guide them to think critically and help expand their ideas, but Idon't feel we should make their decisions for them. Children can learnabout art through time and its reflection and impact on society, othercultures, the formal elements, how to appreciate it, how to view art as
38
39

they develop critical thinking skills and foster creativity.
Today's activities raised the following questions in my mind: How willteachers present multicultural lessons that reflect sensitivity andrespect for the group they are addressing? These isolated lessonsneed to be integrated to a universal experience. These diversecultures do not exist in a void; they need to be interrelated to othercultures. I personally experience this around Christmas season whenteachers want to present a "multicultural" lesson using the Jewishholiday, Hanukkah. They lack an understanding of the religion andculture and think they can present a global perspective in one lessonon a minor holiday. They fail to achieve their outcome and lack anunderstanding of the reasons why. Holidays are used too much asdeparture points . Today's activities prompt the rethinking of how weselect what we will teach and what messages we are sending covertlyand overtly by what we address and what we choose not to address.
39
4 0
SCHOOL SUBJECT TEACHING PREFERENCES HELD BY ELEMENTARYTEACHERS
Robert W. WoodProfessor
School of EducationUniversity of South Dakota
Lynne RoachDirector, Economic Education Center
School of BusinessUniversity of South Dakota
40
41

INTRODUCTION
A teacher's interest in what they teach helps to carry them through thevarious teaching processes required of them in the elementary schools. Ifthey find satisfaction in the teaching g process, interest and enjoyment inteaching remains high. The converse of the generalization seems to beapparent in many cases.
There have been studies in South Dakota to identify how children feelabout the school subjects they study. Studies by Wood (1978) and Eicher,Wood, Webster, and Gullickson (1988) have dealt with school subjectspreferred by elementary school children in South Dakota. In studies dealingwith South Dakota, teacher's preferred subjects that have not beenconducted. This study was designed to determine the elementary schoolsubjects teachers prefer to teach.
PURPOSE OF THE STUDY
The purpose of this study was to survey elementary school teachersin the rural state of South Dakota with regard to the school subjects theyprefer to teach. This study invested (1) the subject preferences ofelementary school teachers teaching in grades one through sex in selectedSouth Dakota elementary schools; and, (2) to identify the school subjectswho would be the favorite and least favorite to teach.
NEED FOR THE STUDY
In order to improve the elementary schools it is important todetermine and analyze the school subjects which elementary schoolteachers prefer to teach. A result of this process should be thedevelopment of appropriate in-service and in-service educationalexperiences that would equip elementary teachers to be highly motivatedand competent to teach all school subjects typically taught in an elementaryschool.
THE METHOD
In order to select participants for the research, 100 elementaryschools with grades 1-6, were randomly selected by using a table of
41
4 2

random numbers. Two hundred teachers from the 100 elementary schoolswere mailed the survey instrument with an accompanying letter. In order tohave a balance of teachers across grades 1-6, the first questionnaire wassent to a first grade teacher, the second questionnaire to a second gradesteacher, up through grade six. The sequence started over again until 200teachers were identified. The outside of the envelope indicated theteachers in appropriate grade level. Participation was voluntary, and of the200 elementary teachers mailed the questionnaire, 124, or 62 percent ofthose contacted, participated in the research by completing and returningthe survey.
A six-item survey was designed to solicit information about theteachers and their perceptions about typical school subjects, which aretaught in the elementary school. Three major questions dealt with schoolsubjects. A listing of thirteen school subjects including mathematics, art,practical/creative writing, handwriting, health, music, reading, science,social studies, spelling, physical education, listening, and oral expressionwere listed. Following the subjects were some descriptive words. If theyliked teaching the subject the circled the word like. M If they dislikedteaching the subject, they circled dislike, and if they neither liked nordisliked teaching the subject, the circled the words, neither liked nordisliked.
Another questioned asked the teachers to identify one school subjectthat was their favorite to teach. Teachers fill in the subject in the blankspace provided. The last question asked the teachers to identify the oneschool subject that was their least favorite to teach.
DEMOGRAPHIC INFORMATION
Of the teachers responding, 85 percent were female and 15 percentmale. There was an attempt to have a balance of grade levels representedin this study. This balance was achieved with 18 percent of the teachersbeing first grade teachers, 20 percent on the second grade level, 17percent in third grade, 15-percent teaching fourth grade, 19 percent on thefifth grade level, and 10 percent teaching sixth grade.
There was a mix of years of teaching experience for the respondents10 percent had 1-5 years of experience, 13 percent from 6-10 years of
42
4 3

teaching, 16 percent from 11-15 years, 21 percent with 16-20 years ofteaching, 14 percent 21'-25 years of teaching, 15 percent with 26-30 yearsof teaching experience, 5 percent with 31-35 years of teaching, 6 percentwith 36-40 years teaching experience, and 1 percent of over 40 years in theteaching profession.
Based on the demographic information, the researchers believe thesample of teachers completing this teacher preference surveyquestionnaire are representative of elementary teachers in the state ofSouth Dakota.
FINDINGS
The first survey item asked the elementary teachers to circle like,dislike, or neither like nor dislike for thirteen commonly taught elementaryschool subjects. In order to determine a mean value for each subject so arank order of subjects could be made, a value of 1 was given for neither likenor dislike, a value of 2 assigned to dislike, and the value of 3 for like.
Mathematics was the highest ranked elementary school subject interms of liking to teach. Reading was a close second, with spelling, science,social studies, creative writing, oral expression, art, health, listening,handwriting, music, and physical education following. Table 2 summarizesthe data for this question.
The second question on the questionnaire asked teachers to identifyone school subject that was their favorite to teach. A blank space wasprovided. Thirty-nine percent of the teachers identified mathematics astheir favorite subject to teaches. Reading was identified by 21 percent astheir favorite, followed by science at 15 percent, social studies 13 percent,English 5 percent, and art and creative writing each received 2 percent. Snumbers of other subjects were identified and were classified asmiscellaneous at 3 percent. Table 2 summarizes the data from thisquestion.
The final question asked teachers to identify one school subject thatwas their least favorite to teach. Twenty percent identify science as theirleast favorite subject to teach. Creative writing was the second least subjectwith 15 percent of the teaching making this response. Handwriting followed
43
4 4
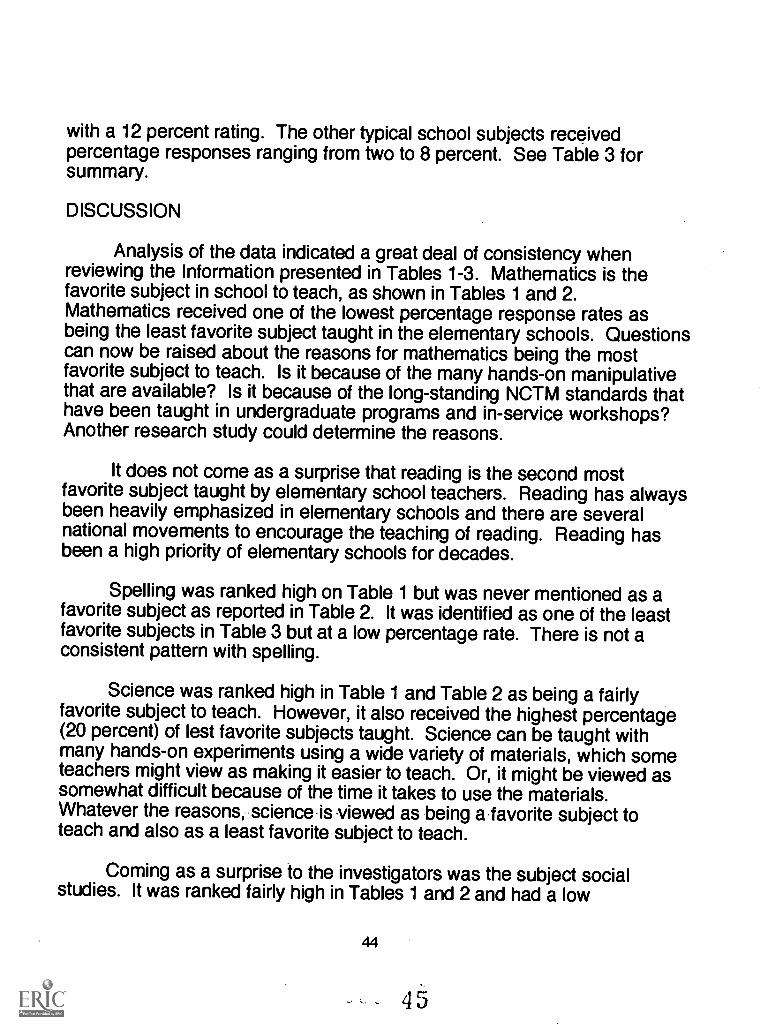
with a 12 percent rating. The other typical school subjects receivedpercentage responses ranging from two to 8 percent. See Table 3 forsummary.
DISCUSSION
Analysis of the data indicated a great deal of consistency whenreviewing the Information presented in Tables 1-3. Mathematics is thefavorite subject in school to teach, as shown in Tables 1 and 2.Mathematics received one of the lowest percentage response rates asbeing the least favorite subject taught in the elementary schools. Questionscan now be raised about the reasons for mathematics being the mostfavorite subject to teach. Is it because of the many hands-on manipulativethat are available? Is it because of the long-standing NCTM standards thathave been taught in undergraduate programs and in-service workshops?Another research study could determine the reasons.
It does not come as a surprise that reading is the second mostfavorite subject taught by elementary school teachers. Reading has alwaysbeen heavily emphasized in elementary schools and there are severalnational movements to encourage the teaching of reading. Reading hasbeen a high priority of elementary schools for decades.
Spelling was ranked high on Table 1 but was never mentioned as afavorite subject as reported in Table 2. It was identified as one of the leastfavorite subjects in Table 3 but at a low percentage rate. There is not aconsistent pattern with spelling.
Science was ranked high in Table 1 and Table 2 as being a fairlyfavorite subject to teach. However, it also received the highest percentage(20 percent) of lest favorite subjects taught. Science can be taught withmany hands-on experiments using a wide variety of materials, which someteachers might view as making it easier to teach. Or, it might be viewed assomewhat difficult because of the time it takes to use the materials.Whatever the reasons,-science is -viewed as being a favorite subject toteach and also as a least favorite subject to teach.
Coming as a surprise to the investigators was the subject socialstudies. It was ranked fairly high in Tables 1 and 2 and had a low
44
-

percentage in the least favorite subjects to teach. In past research studiesconducted by (Wood, 1978) and (Eicher, Wood) Webster, and Gullickson,1988) social studies was one of the least favorite subject of elementaryschool students.
In reviewing the data summarized in Tables 1, and 2, most of theelementary school subjects appear to be liked in terms of teaching. Onlymusic and physical education received low means as shown in Table 1.Neither is noted in Table 2. They are listed as being some of the leastfavorite subjects to teach but with low percentage numbers. One reason forthe low rankings might be that special teachers teach these subjects andtherefore not taught by the regular elementary school etcher.
In reviewing the tables and statements, we can quality the commentsby stating most of the elementary school teacher5s surveyed really did liketeaching the various school subjects. They leaned more toward LIKE thatDISLIKE on all of them with the exception of music and physical education.
RECOMMENDATIONS
Based on the data, the following recommendations are made:
1. Future studies should be conducted to determine why certainelementary school subjects are liked or disliked.
2. Pre-service and in-service workshops should be conducted tohelp teachers recognize and overcome any negative attitudestoward various subjects.
45
4 6
REFERENCES
Eicher, C., Wood, R., Webster, L. and Gullickson, A. School subjectspreferred by elementary school children in South Dakota: Ten years later.Education, 109,191-195.
Wood, R. An investigation of school subjects preferred by elementaryschool children of South Dakota. Education, 99, 77-84.
46
- 4 7
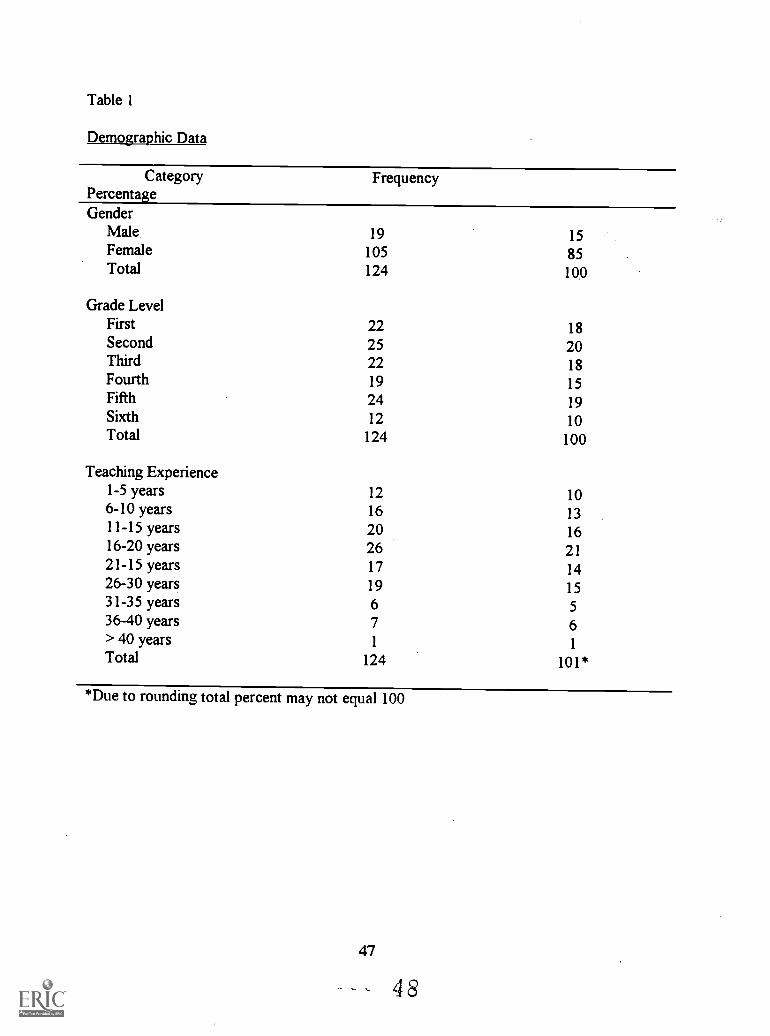
Table 1
Demographic Data
CategoryPercentage
Frequency
GenderMale 19 15Female 105 85Total 124 100
Grade LevelFirst 22 18Second 25 20Third 22 18Fourth 19 15Fifth 24 19Sixth 12 10Total 124 100
Teaching Experience1-5 years 12 106-10 years 16 1311-15 years 20 1616-20 years 26 2121-15 years 17 1426-30 years 19 1531-35 years 6 536-40 years 7 6> 40 years 1 1
Total 124 101*
*Due to rounding total percent may not equal 100
47
4 8
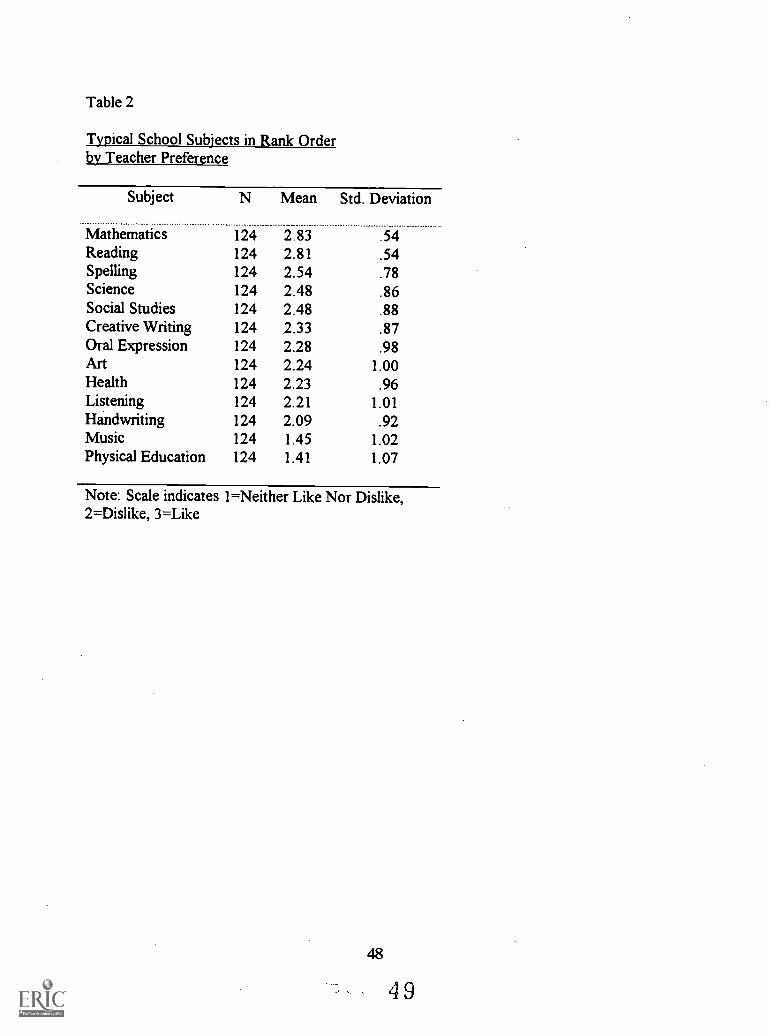
Table 2
Typical School Subjects in Rank Orderby Teacher Preference
Subject N Mean Std. Deviation
Mathematics 124 2.83 54Reading 124 2.81 .54Spelling 124 2.54 .78Science 124 2.48 .86Social Studies 124 2.48 .88Creative Writing 124 2.33 .87Oral Expression 124 2.28 .98Art 124 2.24 1.00Health 124 2.23 .96Listening 124 2.21 1.01Handwriting 124 2.09 .92Music 124 1.45 1.02Physical Education 124 1.41 1.07
Note: Scale indicates 1=Neither Like Nor Dislike,2=Dislike, 3=Like
48
4 9
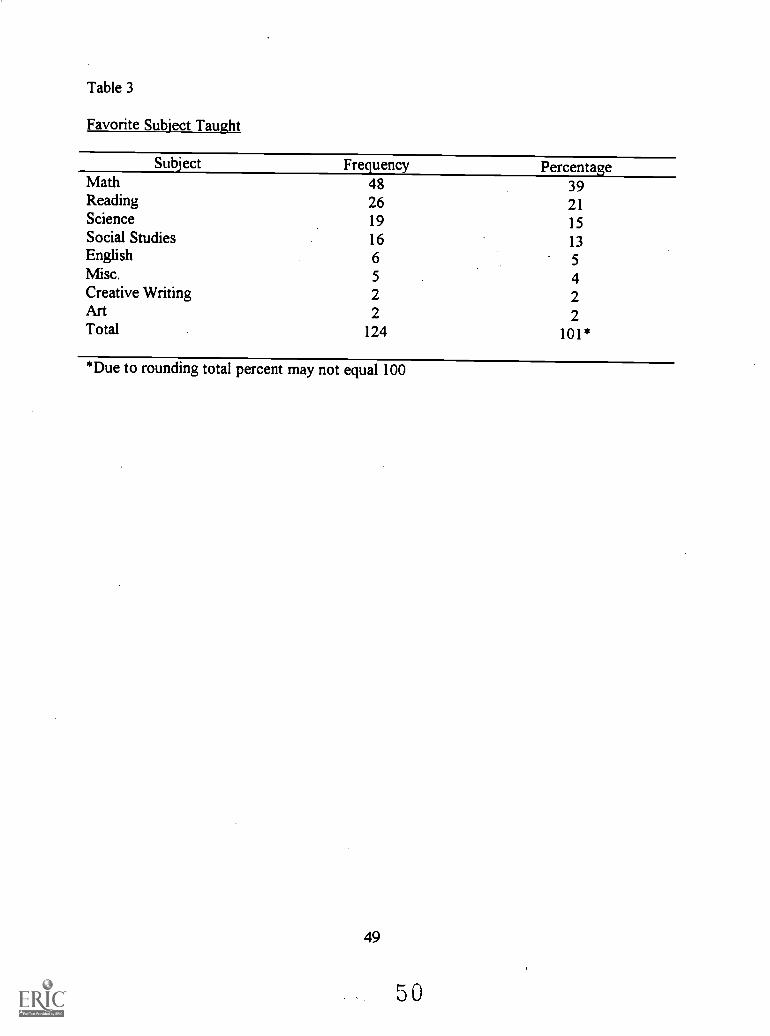
Table 3
Favorite Subject Taught
Subject Frequency PercentageMath 48 39Reading 26 21Science 19 15Social Studies 16 13English 6 5Misc. 5 4Creative Writing 2 2Art 2 2Total 124 101*
*Due to rounding total percent may not equal 100
49
5 0
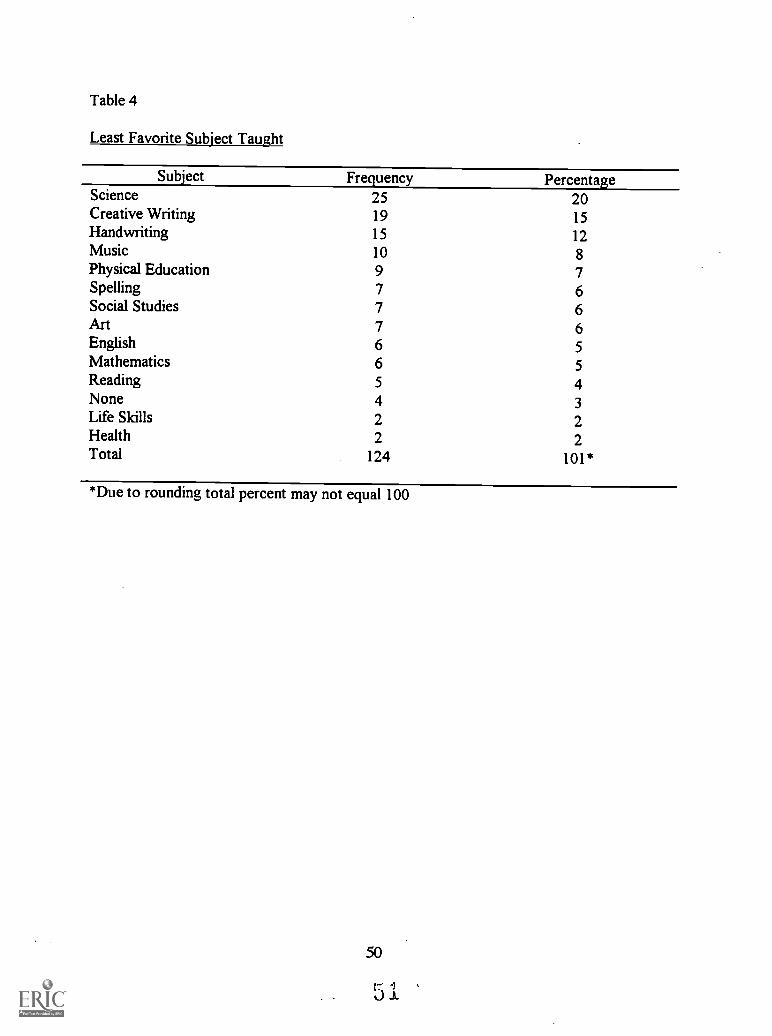
Table 4
Least Favorite Subject Taught
Subject Frequency PercentageScience 25 20Creative Writing 19 15Handwriting 15 12Music 10 8Physical Education 9 7Spelling 7 6Social Studies 7 6Art 7 6English 6 5Mathematics 6 5Reading 5 4None 4 3Life Skills 2 2Health 2 2Total 124 101*
*Due to rounding total percent may not equal 100
50
A REVIEW OF ATTRIBUTION STUDIES OF CHILDRENWITH LEARNING DISABILITIES (1977-1993)
Mary Milleret RingAssistant ProfessorSchool of Education
University of South Dakota
51
5 2
A REVIEW OF ATTRIBUTION STUDIES OF CHILDRENWITH LEARNING DISABILITIES (1977-1993)
Mary Milleret RingAssistant ProfessorSchool of Education
University of South Dakota
51
5 3
INTRODUCTION
Students with learning problems have been characterized as "learnedhelpless" (Thomas, 1979). They tend to view them-selves as failures andas dependent upon others for any successes they might have. Typically,students who have this view do not make use of the talents and abilitiesthey do have; thus, when they have an assignment appropriate for theirneeds and bail-ties, they may fail to try very hard (Licit, 1983). The learnedhelpless students have been found to give up and make attributions forfailures more quickly than students who were not considered learnedhelpless. While other students were still involved with the task and were stillseeking solutions, learned helpless students had stopped trying (Diner &Deck, 1978). The attributions of a student with learning disabilities (LD)have direct implications for classroom teachers when teaching methodsand curriculum modifications can be adjusted as needed.
According to Mercer (1992), attribution "refers to a person's beliefsconcerning the causes of events" (p. 623). Attributions influence a person'smotivation to perform a task. Weiner (1979) believed that attributionsinfluenced a person's self-esteem, expectations for future events, and theacceptance of responsibility for the outcomes of the events. Further,motivation may increase the students' effort and abilities on schoolassignments (Dweck, 1986) and thus, increase their task persistence. Theliterature suggests there is an interaction between attributions, motivation,and self-concept (Bender & Wall, 1994).
Various research methods have been used to measure studentattributions. Vispoel & Austin (1995) described three basic types ofmethods: the situational, the disposition, and the critical incident. In thedispositional method, the students reported their attributions for severalhypothetical situations. In the situational method, children rated their ownattributions for an experimental laboratory task, or rated the attributions fora hypothetical situation for another person. In the critical incident method,the students rated their attributions for a real life task or on a recalledreal-life task.
52
. 5 4
PURPOSE OF THE STUDY
This review examined the findings of research studies comparingattributions of students with and without learning disabilities. They wereconducted from 1977 to 1993.
THE METHOD
Selected studies were categorized according to the attributionfindings. The findings were divided into groups according to the degree ofspecificity for attributions. The groups included attribution outcomes ofstudents with disabilities and students without disabilities; attribution ofsuccess and failure of students with and without disabilities; and specificattribution (ability, effort, luck, and task difficulty) for students with andwithout disabilities.
FINDINGS
During this time period, research on attribution theory with studentswith LD primarily focused on "locus of control" differences between childrenwith LD and children without disabilities. The results of these studiesyielded a measure of internal or external attributions. Eight studiesconcluded that students with LD attributed outcomes differently fromstudents without disabilities. They attributed outcomes more to externalcauses than students without disabilities ( Engelberg & Evans, 1986;Fincham & Bar ling, 1978; Gardner, Warren, & Gardner, 1977; Grolnick &Ryan, 1990; Hallahan, Gajar, Cohen, & Tarver, 1978; Lewis & Patterson,1989; Rogers & Saklofske, 1985; Tarnowski & Nay, 1989). In contrast, fourstudies found no differences in attributions for outcomes (Cooley & Ayres,1988; Friedman & Medway, 1987; Hisama, 1976; Tollefson et al., 1982).Table 1 review studies of how students with and without learning disabilitiesdiffer in their attributions regarding academic achievement.
Four studies found students with LD attributed success more toexternal causes than-internal causes-(Chapman & Boersma, 1979; Lewis &Patterson, 1989; Pearl, Bryan, & Donahue, 1980; Rogers & Saklofske,1985). When attributing outcomes for a successful experience, thesestudents with LD were more likely to attribute success externally to taskdifficulty or luck. These students failed to take credit for having the ability or
53
Jr r
making the effort necessary for successful experiences. One study whichused an open-ended interview for measuring attributions for success foundno differences between students with LD and students without disabilities(Durrant, 1993).
When measuring specific attributions for success, researchers havenoted differences between students with LD and students withoutdisabilities. Students with LD were different in their perception of ability.They tended to view their ability as less important for success (Aponik &Dembo, 1983; Jacobson, Lowery & DuCette, 1986; Pearl, 1982). They alsocredited luck (Aponik & Dembo, 1983; Jacobson et al., 1986; Pearl et al.,1980; Pearl, 1982; Pearl, Bryan, & Herzog, 1983) and task difficulty (Pearl etal., 1980) as having greater impact on their success. The students with LDperceived factors outside of their control as influencing their successfuloutcome.
In contrast to the research supporting attributions of children with LDto external causes, Jacobsen et al. (1986) in Study #1 found no differencebetween normally achieving children and children with LD for attributingacademic success to effort. However, in his second study, when thestudents were asked to rate the significance of ability, effort, task difficulty,and luck for the same event, the students with LD gave higher rankings toluck and task difficulty than did normally achieving children. These childrenwith LD saw more causes contributing to their successful outcomes thannormally achieving students. No studies indicated that luck and taskdifficulty attributions were the same. Two studies found no differences forability attributions (Palmer, Drummond, Tollison & Zinkgraff, 1981; Pearl etal., 1980) and two studies found no differences for effort attributions (Pearlet al., 1980; Jacobson et al., 1986).
Three studies found no differences between students with LD andstudents without disabilities on attributions for failure (Chapman &Boersma, 1979; Lewis & Patterson, 1989; Pearl et al., 1980), and twostudies found differences (Diener & Dweck, 1978, Rogers & Saklofske,1985). When examining the specific-attributions for failure, differencesbecame more apparent. Students with LD attributed failure more to internalcauses of lack of ability (Aponik & Dembo, 1983; Jacobsen et al., 1986;Kistner, Osborne, & LeVerrier, 1988; Licht, Kistner, Ozkaragoz, Shapiro &Clausen, 1985; Palmer et al., 1982; Pearl, 1982) and effort (Jacobson et al.,
54
5 6
1986; Kistner et al., 1988; Pearl et al., 1980; Pearl, 1982) although Durrant(1993) found no differences. Also, differences in attributions for luck (Pearl,1982; Pearl et al., 1983) and task difficulty (Jacobson et al., 1986; Pearl etal., 1980; Pearl et al., 1983) have been noted.
Some researches found gender differences regarding attributions.Licht et al., (1985) found that girls with LD attributed failure to lack of abilitymore than girls without LD; however, they were not different on measures ofattributions for external factors. The same study found boys with LDattributed their failures to external factors more than boys without LD. Theboys were no different in the manner in which they attributed failure to lackof ability. Ryckman & Peckham (1986) found that girls with LD attributedsuccess more to effort and luck than did boys with LD. The girls alsoattributed failure more to ability than boys with LD.
The analysis of the literature did not reveal definitive findingsregarding the attributions of outcomes for students with learning disabilities.There was some support of the concept of learned helplessness forstudents with learning disabilities (Diener & Dweck, 1978; Pearl, 1980; Pearlet al., 1983; Rogers & Saklofske, 1985). These researchers found that thestudents with LD credited their success to some ability and effort, as well asa significant portion due to task difficulty and luck. Other studies have notsupported the notion of learned helplessness for students with learningdisabilities (Durrant, 1993; Friedman & Medway, 1987; Jacobson et al.,1986). These studies found no difference between the attributions ofstudents with learning disabilities and students without disabilities.
DISCUSSION
This study of the literature did not find conclusive evidence thatstudents with learning disabilities consistently follow the learnedhelplessness pattern. It may be that LD is a very heterogeneous groupconcerning their attributions for success and failure. In addition, it could bethat the attribution ratings do not occur consistently across variousattribution measures.
The attribution beliefs of students who follow the learned helplesspattern may lead the students to failure in the classroom. When studentsaccept little responsibility for their own successes, they will have little
55
5 7
confidence in having success in the future. When they believe that successis due to luck or task difficulty, they are apt to gain little self-confidence intheir own abilities and effort. Also, the students with LD who view failure asprimarily due to their lack of ability may find this has a debilitating effect ontheir self-concept. For the students who attribute failure to lack of ability,they are not likely to be persistent on academic tasks; whereas, if theirattribution for failure is external (i.e. task difficulty or luck), they are morelikely to be persistent (Licht et al., & Clausen, 1985). Classroom teachersneed to be sensitive to the needs of the students who exhibit learnedhelplessness behaviors.
CONCLUSIONS AND RECOMMENDATIONS
This attribution literature is somewhat inconsistent in the findings.This could be due to the control groups used or the method of measuringattributions. More recent studies have focused on defining more carefullythe comparison groups (Durrant, 1993; Grolnick & Ryan, 1990; Tarnowski &Nay, 1989; Wehmeyer, 1994) and measuring the differences in specificattributions for actual events (Vispoel & Austin, 1995). Further researchcould also look at the impact of classroom modifications and teachingmethods on attributions.
56
58
REFERENCES
Aponik, D. A., & Dembo, M. H. (1983). LD and normal adolescents'causal attributions of success and failure at different levels of task difficulty.Learning Disability Quarterly, 6, 31-39.
Bender, W. N., & Wall, M. E. (1994). Social-emotional development ofstudents with learning disabilities. Learning Disability Quarterly, 17,323-341.
Chapman, J. W., & Boersma, F. J. (1979). Learning disabilities, locusof control, and mother attitudes. Journal of Educational Psychology, 71,250-258.
Cooley, E. J., & Ayres, R. R. (1988). Self-concept and success-failureattributions of non-handicapped students and students with learningdisabilities. Journal of Learning Disabilities, 21, 174-178.
Diener, C. I., & Dweck, C. S. (1978). An analysis of learnedhelpless-ness: Continuous changes in performance, strategy, andachievement cognition's following failure. Journal of Personality and SocialPsychology, 36, 451-462.
Durrant, J. E. (1993). Attributions for achievement outcomes amongbehavioral subgroups of children with learning disabilities. Journal ofSpecial Education, 27, 306-320.
Dweck, C. S. (1986). Motivational processes affecting learning.American Psychologist, 1040-1048.
Engelberg, R. A., & Evans, E. D. (1986). Perceptions and attitudesabout school grading practices among intellectually gifted,learning-disabled, and normal elementary school pupils. The Journal ofSpecial Education, 20(1), 91-101.
Fincham, F., & Bar ling, J. (1978). Locus of control and generosity inlearning disabled, normal achieving, and gifted children. Child Development49 530-533.
57
5 9
Friedman, D. E., & Medway, F. J. (1987). Effects of varyingperformance sets and outcome on the expectations, attributions, andpersistence of boys with learning disabilities. Journal of LearningDisabilities, 20, 312-316.
Gardner, D. C. Warren, S. A., & Gardner, P. L. (1977). Locus of controland law knowledge: A comparison of normal, retarded, and learningdiSabled adolescents. Adolescence, 12, 103-109.
Grolnick, W. S., & Ryan, R. M. (1990). Self-perceptions, motivation,and adjustment in children with learning disabilities: A multiple groupcomparison study. Journal of Learning Disabilities, 23, 177-184.
Hallahan, D. P., Gajar, A. H., Cohen, S. B., & Tarver, S. G. (1978).Selective attention and locus of control in learning disabled and normalchildren. Journal of Learning Disabilities, 11, 47-52.
Hisama, T. (1976). Achievement motivation and the locus of control ofchildren with learning disabilities and behavior disorders. Journal ofLearning Disabilities, 9, 58-63.
Jacobsen, B., Lowery, B., & DuCette, J. (1986). Attributions of learningdisabled children. Journal of Educational Psychology, 78(1), 59-64.
Kistner, J. A., Osborne, M., & LeVerrier, L. (1988). Causal Attributionsof learning-disabled children: Developmental patterns and relation toacademic progress. Journal of Educational Psychology, 80(1), 82-89.
Lewis, S. K., & Patterson, E. L. (1989). Locus of control of children withlearning disabilities and perceived locus of control by significant others.Journal of Learning Disabilities 22, 255-257.
Licht, B. G. (1983). Cognitive--motivational factors that contribute tothe achievement of learning-disabled children. Journal of LearningDisabilities, 16, 4843-490.
Licht, B., Kistner, J., Ozkaragoz, T., Shapiro, S., & Clausen, L. (1985).Causal attributions of learning disabled children: Individual differences andtheir implications for persistence. Journal of Educational Psychology, 77,
58
6 0
208-216.
Mercer, C. D. (1992). Students with Learning Disabilities (4th ed.).New York: Macmillan Publishing Company.
Palmer, D., Drummond, F., Tollison, P., & Zinkgraff, S. (1982). Anattributional investigation of performance outcomes for learning-disabledand normal-achieving pupils. Journal of Special Education, 16, 207-219.
Pearl, R. (1982). LD children's attributions for success and failure: Areplication with a labeled LD sample. Learning Disability Quarterly, 5,173-176.
Pearl, R., Bryan, T., & Donahue, M. (1980). Learning disabledchildren's attributions for success and failure. Learning Disability Quarterly3(1), 3-9.
Pearl, R., Bryan, T., & Herzog, A. (1983). Learning disabled andnon-disabled children's strategy analyses under conditions of high and lowsuccess. Learning Disability Quarterly, 6, 67-74.
Rogers, H., & Saklofske, D. H. (1985). Self-concepts, locus of controland performance expectations of learning disabled children. Journal ofLearning Disabilities, 18, 273-278.
Ryckman, D. R., & Peckham, P. D. (1986). Gender differences onattribution patterns in academic areas for learning disabled students.Learning Disabilities Research 1(2), 83-89.
Tamowski, K. J., & Nay, S. M. (1989). Locus of control in children withlearning disabilities and hyperactivity: A subgroup analysis. Journal ofLearning Disabilities, 22, 381-383.
Thomas, A. (1979). Learned helplessness and expectancy factors:Implications for research in learning disabilities. Review of EducationResearch 49, 208-221.
Tollefson, N., Tracy, D., Johnsen, E., Buenning, M., Farmer, A., &Barke, C. (1982). Attribution patterns of learning disabled adolescents.Learning Disability Quarterly, 5, 14-20.
59
61
Vispoel, W. P., & Austin, J. R. (1995). Success and failure in junior highschool: A critical incident approach to understanding students' attributionalbeliefs. American Educational Research Journal, 32, 377-412.
Wehmeyer, M. L. (1994). Perceptions of self-determination andpsychological empowerment of adolescents with mental retardation.Education and Training in Mental Retardation and DevelopmentalDisabilities, 29, 9-21.
Weiner, B. (1979). A theory of motivation for some classroomexperiences. Journal of Educational Psychology, 71(1), 3-25.
60
6 2
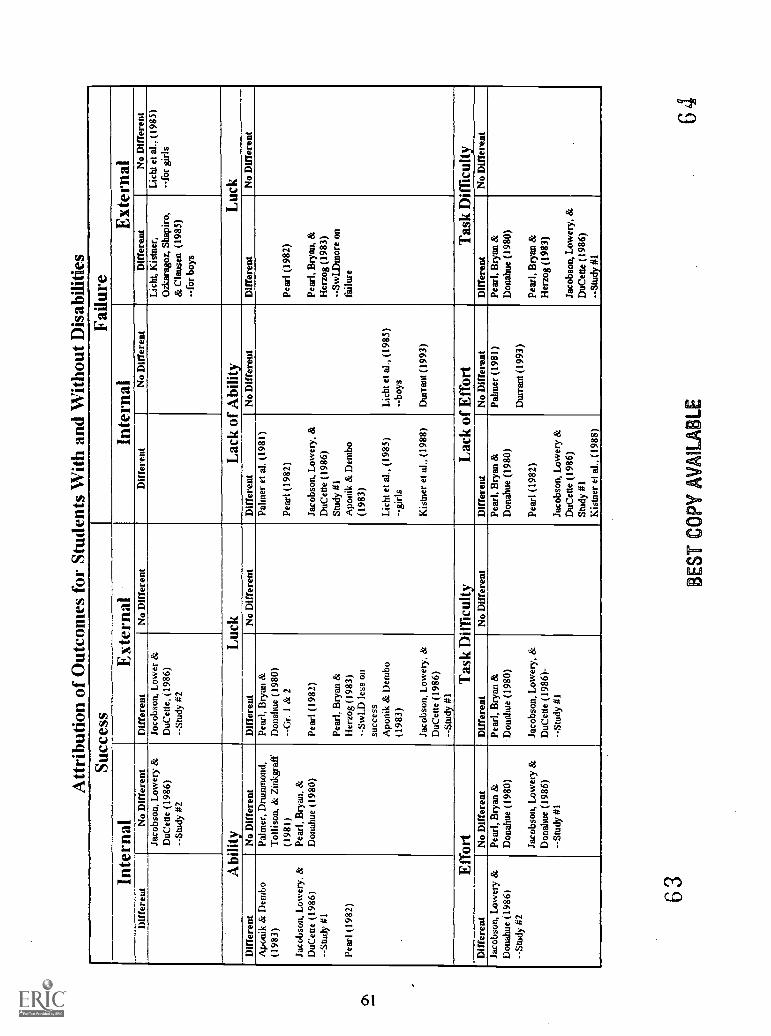
Attr
ibut
ion
of O
utco
mes
for
Stu
dent
s W
ith a
nd W
ithou
t Dis
abili
ties
Succ
ess
Failu
reIn
tern
alE
xter
nal
Inte
rnal
Ext
erna
lD
iffe
rent
No
Diff
eren
tD
iffer
ent
No
Diff
eren
tD
iffer
ent
No
Diff
eren
tD
iffer
ent
No
Diff
eren
tJa
cobs
on, L
ower
y &
DuC
ette
(19
86)
--S
tudy
42
Joco
bson
, Low
er &
DuC
ette
, (19
86)
--S
tudy
#2
Lich
t, K
istn
er,
Onz
arag
oz, S
hapi
ro,
& C
laus
en (
1985
)--
for
boys
Lich
t et a
l., (
1985
)--
for
girls
Abi
lity
Luc
kL
ack
of A
bilit
yL
uck
Diff
eren
tN
o D
iffer
ent
Diff
eren
tN
o D
iffer
ent
Diff
eren
tN
o D
iffer
ent
Diff
eren
tN
o D
iffer
ent
Apo
nik
& D
embo
(198
3)
Jaco
bson
, Low
ery,
&D
uCeu
e (1
986)
--S
tudy
41
Pea
rl (1
982)
Pal
mer
, Dru
mm
ond,
Tol
l i s
on, &
Zin
kgra
ff(1
981)
Pea
rl, B
ryan
, &D
onah
ue (
1980
)
Pea
rl, B
ryan
&D
onah
ue (
1980
)--
Gr.
1 &
2
Pea
rl (1
982)
Pea
rl, B
ryan
&H
erzo
g (1
983)
--S
wLD
less
on
succ
ess
Apo
nik
& D
embo
(198
3)
Jaco
bson
, Low
ety,
&D
uCet
te (
1986
)--
Stu
dy 4
1
Pal
mer
et a
l. (1
981)
Pea
rl (1
982)
Jaco
bson
, Low
ery,
&D
uCet
te (
1986
)S
tudy
41
Apo
nik
& D
embo
(198
3)
Lich
t et a
f., (
1985
)--
girls
Kis
tner
et a
l., (
1988
)
Lich
t et a
l., (
1985
)--
boys
Dur
rant
(19
93)
Pea
rl (1
982)
Pea
rl, B
ryan
, &H
erzo
g (1
983)
--S
wLD
mor
e on
failu
re
Eff
ort
Tas
k D
iffi
culty
Lac
k of
Eff
ort
Tas
k D
iffi
culty
Diff
eren
tN
o D
iffer
ent
Dif
fere
ntN
o D
iffe
rent
Dif
fere
ntN
o D
iffe
rent
Dif
fere
ntN
oD
iffer
ent
Jaco
bson
, Low
ery
&D
onah
ue (
1986
)--
Stu
dy 4
2
Pea
rl, B
ryan
&D
onah
ue (
1980
)
Jaco
bson
, Low
ery
&D
onah
ue (
1986
)--
Stu
dy 4
1
Pea
rl, B
ryan
&D
onah
ue (
1980
)
Jaco
bson
, Low
ery,
&D
uCet
te (
1986
)---
Stu
dy 4
1
Pea
rl, B
ryan
&D
onah
ue (
1980
)
Pea
rl (1
982)
Jaco
bson
, Low
ery
&D
uCet
te (
1986
)S
tudy
ffl
Kis
tner
et a
l., (
1988
)
Pal
mer
(19
81)
Dur
rant
(19
93)
Pea
rl, B
ryan
&D
onah
ue (
1980
)
Pea
rl, B
ryan
&H
erzo
g (1
983)
Jaco
bson
, Low
ery,
&D
uCet
te (
1986
)--
Stu
dy 4
1
63B
EST
CO
PY A
VM
LA
BL
E64
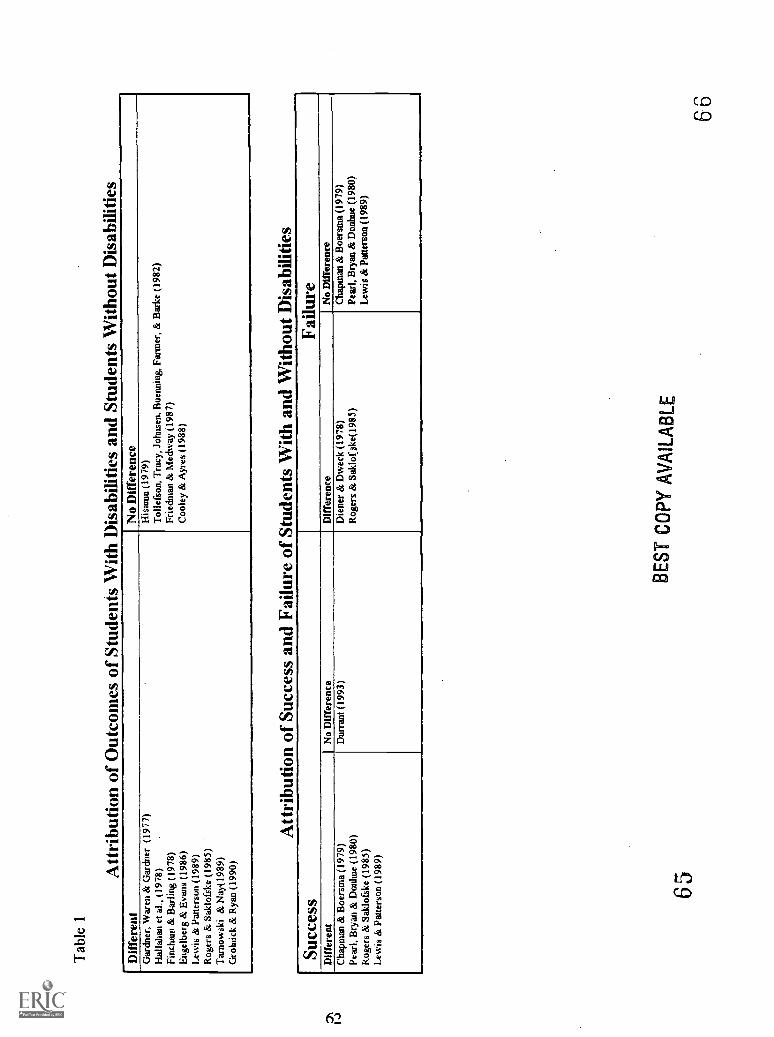
Tab
le 1
Attr
ibut
ion
of O
utco
mes
of
Stud
ents
With
Dis
abili
ties
and
Stud
ents
With
out D
isab
ilitie
sDifferent
No Difference
Gar
dner
, War
en &
Gar
dner
(19
77)
His
arna
(19
79)
Hal
laha
n et
al.,
(19
78)
Tol
lefs
on, T
racy
, Joh
nsen
. Bue
nnin
g, F
anne
r, &
Bar
ke (
1982
)Fi
nch=
& B
urlin
g (1
978)
Frie
dman
& M
edw
ay (
1987
)E
ngel
berg
& E
vans
(19
86)
Coo
ley
& A
yres
(19
88)
Lew
is &
Pan
erso
n (1
989)
Rog
ers
& S
aklo
fske
(19
85)
Tar
now
ski &
Nay
(198
9)G
roin
ick
& R
yan
(199
0)
Attr
ibut
ion
of S
ucce
ss a
nd F
ailu
re o
f St
uden
ts W
ith a
nd W
ithou
t Dis
abili
ties
Succ
ess
Failu
reD
iffe
rent
No
Dif
fere
nce
Dif
fere
nce
No
Dif
fere
nce
Cha
pman
& B
oers
ma
(197
9)Pe
arl,
Bry
an &
Don
hue
(198
0)R
oger
s &
Sak
lofs
ke (
1985
)L
ewis
& P
atte
rson
(19
89)
,
Dur
rant
(19
93)
Die
ner
& D
wec
k (1
978)
Rog
ers
& S
aklo
(ske
(198
5)C
'hap
man
& B
oers
ma
(197
9)Pe
arl,
Bry
an &
Don
hue
(198
0)L
ewis
& P
atte
rson
(19
89)
65B
EST
CO
PYA
VA
ILA
BL
E
66
AN IN-DEPTH LOOK AT SOUTH DAKOTA'SSUCCESSFUL EARLY CHILDHOOD INCLUSION PROGRAMS
Geralyn M. JacobsAssistant ProfessorSchool of Education
University of South Dakota
Joanne Wounded HeadKristy SpencerDorothy Stoll
Gui-Ping ZhangUniversity of South Dakota Students
63
6 7
INTRODUCTION
The South Dakota Early Childhood Inclusion Project is a collaborativeeffort between the South Dakota University Affiliated Program and theUniversity of South Dakota School of Education which began in 1995 withfunding from the South Dakota Office of Special Education. A major focusof the project is to provide support to school districts who are includingyoung children with special needs into integrated settings. Includingchildren with and without disabilities in collaborative programs has beenshown to be effective in meeting the needs of young children (McLean &Han line, 1990; Diamond, Hestenes, O'Connor, 1994; Wolery, Werts, &Holcombe, 1994). This article will present a brief description of the projectand describe research that was completed as part of the project.
AN OVERVIEW OF THE EARLY CHILDHOOD INCLUSION SUPPORTPROJECT
The South Dakota Early Childhood Inclusion Project was designed toprovide support for programs who were, or wished to begin, integratingchildren with special needs into their programs. This support takes onmany forms, including technical assistance and access to resources.During the early stage of implementation, project staff compiled anetworking list of individuals who would be willing to work with others whohad questions or were seeking advice about inclusion. The projectassembled a library of resources, which included books and videos forteachers and parents, as well as children's books, videos, toys andequipment. A list of all of these materials and the Networking List werecompiled into a Resource Manual. The manual also contained a 50-pagebook-list of children's books on a wide range of disabilities and medicaldisorders that could be accessed statewide through the inter-library loansystem in the state. The Resource Manuals were sent to every schooldistrict and special services cooperative around the state. The manual andbrochures distributed about the project contained a toll-free number thatallowed individuals to call to access resources available through the project.
One of the major purposes of the Project was to identify factors thatsupported successful inclusion. In order to accomplish this, project stafftraveled to 10 school districts around the state that were successfullyincluding children with disabilities. Staff interviewed parents,
64
6 8
administrators, teachers, therapists, and Head Start personnel. In theinterview, participants were asked to describe the challenges they faced,how they overcame these challenges, and the benefits they found frominclusion. Many of these interviews were videotaped and were then madeinto a video that could provide answers and direction to other districts.
The project then designed a course on inclusion, which they offeredover satellite and was accessible at 66 different high schools sites acrossthe state. Lectures for the course were done in Power Point slides, whichwere broadcast over the satellite network. Over 50 people registered forthis course throughout the state.
Project staff then produced a CD-ROM, "Inclusion: CelebratingChildren's Successes," containing clips from the video and the entire 15week series of Power Point slide show presentations from the course. TheCD also contained materials from the resource manual.
RESEARCH
The first step in the Project's research was distributing a survey to alldistricts in South Dakota to determine attitudes toward inclusion and togather information on inclusive service delivery practices for the three tofive year old children in the school districts. This survey, along with inputfrom the project's advisory committee, helped to identify ten districts formore in-depth study. Project staff traveled to each of the ten districts andinterviewed parents and personnel. Districts set up interviews with parentsand personnel based on individual's roles in their inclusive programs. Eachdistrict's program was unique, so the personnel involved varied. Somedistricts collaborated with Head Start Programs, while other districts did not.The goal was to interview at least one parent, one administrator, onetherapist, and one teacher at each district, but the numbers variedaccording to the district. Some scheduled interviews were also canceledbecause of other conflicts that arose. The remainder of this article willpresent the results of the responses from district administrators, teachersand therapists to questions regarding the-barriers-they faced as they triedto implement inclusion, as well as the suggestions and recommendationsthey had for other districts attempting inclusion.
65
6 9

RESEARCH DEMOGRAPHICS
Eighteen administrators were interviewed. These administratorsincluded: five Principals, five Directors of Special Education, fourSuperintendents, two Head Start Directors, one Head Start DisabilityCoordinator, and one Assistant Director of an Educational Cooperative.Twenty-two teachers were interviewed for this research, including sevenKindergarten Teachers, eight Early Intervention Teachers, three HeadStart Teachers, three Preschool Teachers, and one Primary (K/1) Teacher.Eight therapists were involved in the interviews, seven Speech/LanguagePathologists and one Physical Therapist.
BARRIERS TO INCLUSION
Each person interviewed was asked to describe the barriers they hadfaced as they implemented inclusion. Barriers fell into two generalcategories: Attitude Barriers and Policy Barriers. The Policy Barriers fell intothree subcategories: Program, Personnel and Funding, and LogisticalBarriers.
When asked, "What barriers did you face as you tried to implementinclusion?", Attitude Barriers were mentioned by 12 of the 18administrators, 12 of the 22 teachers and 4 of the 8 therapists. Thesebarriers included: understanding the importance of inclusion;understanding the concept of inclusion itself; lack of commitment toinclusion; parental concerns; public relations concerns; and problemsassociated with personnel having to deal with change.
In the category of Policy Barriers, Program-Related Barriers werecited by 8 of the 18 administrators, 19 of the 22 teachers, and 6 of 8 thetherapists. These barriers included: concerns over the curriculum beingdevelopmentally appropriate for the children; ensuring that the needs of allthe children were met; lack of time to plan; scheduling; and the difficulty ofcombining two different-programs into one.
In the category of Policy Barriers, Personnel Issues were brought upby 12 of the 18 administrators, 10 of the 22 teachers and 6 of the 8therapists. These barriers included: a lack of trained staff; lack of support
66
7 0
for staff; a high staff turnover rate; issues of pulling together as a team;sharing classrooms; and designating and sharing job responsibilities.
Another sub-category of Policy Barriers dealt with Funding andLogistics. These were reported barriers for 15 of the 18 administrators, 6 ofthe 22 teachers, and 3 of the 8 therapists. There were a number of fundingand logistical barriers which included: cost; lack of space or a facility itself;transporting children to and from programs; food and mealtime concerns;making buildings and rooms handicapped accessible; having enoughneeded materials; and tuition concerns.
This research is similar to that done by Smith and Rose (1993) whofound that the barriers most often faced by programs attempting toimplement inclusion fell into the categories of Policy and Attitudinal Barriers.
SUGGESTIONS AND RECOMMENDATIONS FOR IMPLEMENTINGINCLUSION
The personnel did have suggestions and recommendations for thosewho were trying to implement inclusion in their districts. The firstrecommendation was that all personnel work closely together as a teamand develop strong communication, including working to develop aphilosophy, team teaching, and flexibility. These suggestions were madeby 13 of the 18 administrators, all of the teachers, and 7 of the 8 therapists.
Another suggestion that was strongly recommended was that thedistrict needed to believe in Inclusion. All 18 administrators mentioned this,as did 17 of the 22 teachers and 5 of the 8 therapists. Specifically, theytalked about the district seeing the benefits of Inclusion, keeping an openmind, and continuing to work on inclusion.
A third suggestion from the districts was that to successfullyimplement inclusion, districts needed to spend time planning the process.Planning was-mentioned-by 12 of 4he -18 administrators, 7 of the 22teachers and 6 of the 8 therapists. When discussing planning, they spokeof issues such as having a long range plan, going slowly, identifying thepopulation that would be served, visiting other programs to get ideas, andhaving plenty of planning time once inclusive practices were underway.
67
71

A fourth major area of suggestions and recommendations was theneed for support and resources. This was voiced by half of all theadministrators, teachers and therapists. They recommended that districtswork with other agencies, combine their resources, and provide supportstaff for teachers. They also spoke of the need for administrative support,adequate funding and having appropriate facilities.
Another area of recommendations came in the need for training forstaff and parents. Seven of the 18 administrators, 4 of the 22 teachers, and3 of the 8 therapists echoed this, suggesting that both classes and inserviceopportunities in inclusion would help.
CONCLUSION
The results of this research point out the need districts have foradditional training and technical assistance. It also illustrates the need formodels that districts can follow as they attempt to implement inclusion.Finally, there is a need for continued research in this area to strengthen ourknowledge of factors that contribute to successful inclusion, allowing schooldistricts to build on the successes of other programs.
68
72
REFERENCES
Diamond, K.E., Hestenes, L.L., & O'Connor, C.E. (1994). Integratingyoung children with disabilities in preschool: Problems and promise. YoungChildren, 49(2), 68-73.
McLean, M. & Han line, M.F. (1990). Providing early interventionservices in integrated environments: Challenges and opportunities for thefuture. Topics in Early Childhood Special Education, 10(2), 62-77.
Rose, D. F., & Smith, B.J. (1993). Preschool mainstreaming: Attitudebarriers and strategies for addressing them. Young Children, 48(4), 59-62.
Wolery, M., Werts, M.G., & Holcombe, A. (1994). Current practiceswith young children who have disabilities: Placement, assessment, andinstruction issues. Focus on Exceptional Children, 26(6), 1-12.
69
7 3
THE IMPACT OF PERINATAL INSULTS AND DISABILITIES ON YOUNGCHILDREN'S DEVELOPMENT FROM BIRTH TO EIGHT YEARS OF AGE:
RESEARCH LINKED TO PRACTICE
Marilyn K. Urquhart, Ph. D.Professor in Special Education
School of EducationUniversity of South Dakota
Patricia Work, Ph.D.Professor in PsychologySchool of EducationUniversity of South Dakota
70
7 4
INTRODUCTION
Occasionally, conditions surrounding the birth of an infant interferewith the predictable organization of skills across modalities. Theseconditions may involve a stressful birth, geneticanomalies, or subtle andunsuspected characteristics that appear when major milestones arereached. As a result, the inaccurate or limited information the infantreceives and/or the lack of exploratory experiences resulting from themisinterpretation of information may further compromise the infant's abilityto organize and interpret experiences. When the organization ofinformation is impeded in one or several modalities, it is possible that theskill network that the at-risk infant uses to structure the environment mayproceed differently from that of the typical infant. Unfortunately, the impactof prenatal insult and disabilities at birth are rarely linked to a child's currentdevelopmental status. This is partially due to limited understanding of thelong term impact and understanding of early difficulties.
The results of two studies including children from birth to 8 year of ageare presented. These studies investigated whether events identified atbirth which placed infants at-risk contributed to their later developmentaldifficulties.
Study 1: Impact of Birth Trauma on Task Performance
To investigate the relationship of an insult or handicapping conditionfrom birth to infants' ability to organize and respond to stimuli receivedsimultaneously from multiple sensory modalities, infants between theadjusted ages of 91 and 240 days were recruited from neonatal follow-upclinics. Behaviors were observed during three tasks that requiredintegrating multiple stimuli, a) a task of spatial perception; b) a task ofintermodal representation of speech; and c) a contingency learning task.Findings presented in Table 1 indicate that a) mechanically ventilatedinfants were more irritable than non-ventilated infants, b) infants from lowerincome families were fussier than infants from higher income families, c)lower birth weight infants were more successful on the visual task thanhigher birth weight infants, d) 5-minute Apgar scores were more predictiveof infants' success than 1-minute scores on the visual task, e) older infantswere more accurate during the reaching task than younger infants, f) therewere more smiling responses from older infants, and g) older infants were
71
7 5
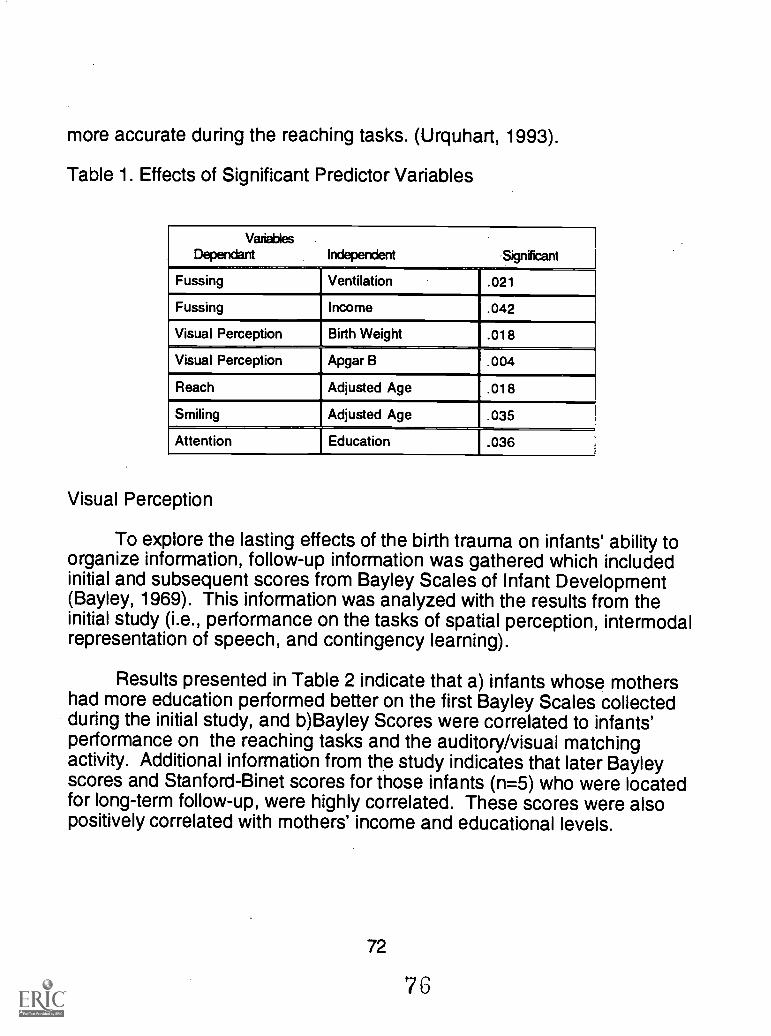
more accurate during the reaching tasks. (Urquhart, 1993).
Table 1. Effects of Significant Predictor Variables
VariablesDependant Independent Significant
Fussing Ventilation .021
Fussing Income .042
Visual Perception Birth Weight .018
Visual Perception Apgar B .004,
Reach Adjusted Age .018
Smiling Adjusted Age .035
Attention Education I .036
Visual Perception
To explore the lasting effects of the birth trauma on infants' ability toorganize information, follow-up information was gathered which includedinitial and subsequent scores from Bayley Scales of Infant Development(Bayley, 1969). This information was analyzed with the results from theinitial study (i.e., performance on the tasks of spatial perception, intermodalrepresentation of speech, and contingency learning).
Results presented in Table 2 indicate that a) infants whose mothershad more education performed better on the first Bayley Scales collectedduring the initial study, and b)Bayley Scores were correlated to infants'performance on the reaching tasks and the auditory/visual matchingactivity. Additional information from the study indicates that later Bayleyscores and Stanford-Binet scores for those infants (n=5) who were locatedfor long-term follow-up, were highly correlated. These scores were alsopositively correlated with mothers' income and educational levels.
72
7 6
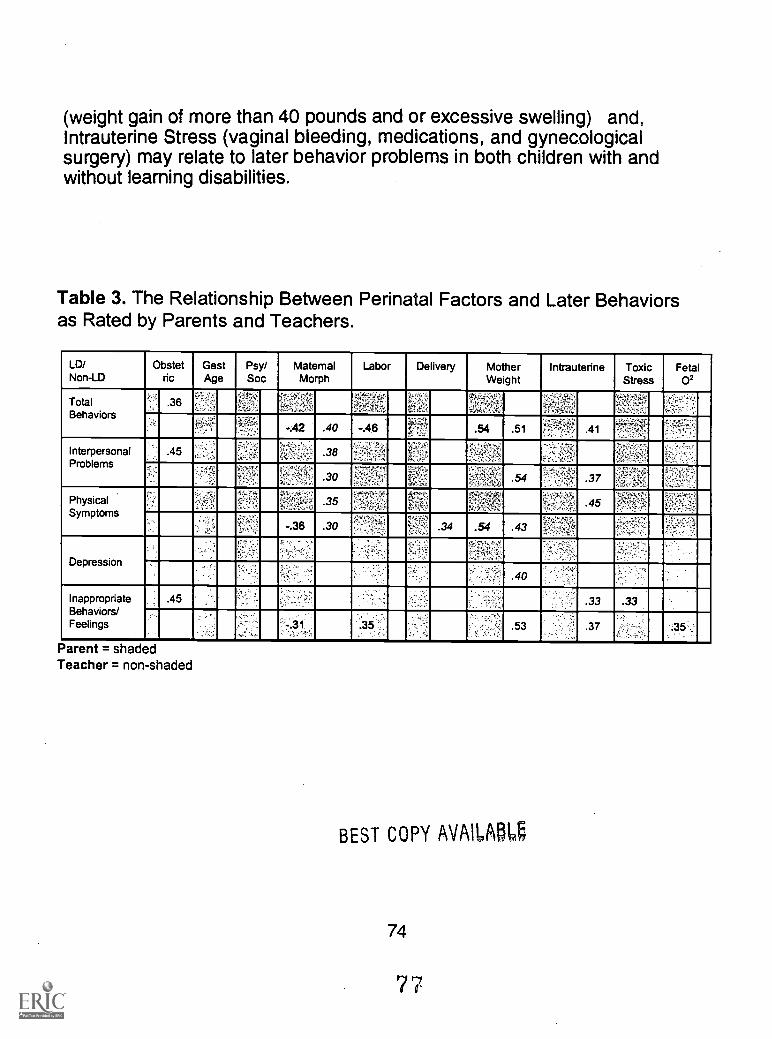
(weight gain of more than 40 pounds and or excessive swelling) and,Intrauterine Stress (vaginal bleeding, medications, and gynecologicalsurgery) may relate to later behavior problems in both children with andwithout learning disabilities.
Table 3. The Relationship Between Perinatal Factors and Later Behaviorsas Rated by Parents and Teachers.
LD/Non-LD
Obstetdo
GestAge
Psy/Soc
MaternalMorph
Labor Delivery MotherWeight
Intrauterine ToxicStress
Fetal02
TotalBehaviors
e,,,-,'
,:, .36 It '''..-',,,.:
11, s.: ':*-'..-Y ''...,-
:4--.,..,,,-. ',. ,
-,/,'. 'I' ,-. .....-:/-- .: -; ,,,,,c,;.- s, ;
',..,.:
..
'',..:::f: -.42 .40 -A6 ..,, ., .54 .51 ."----, '''', 41
InterpersonalProblems
'; .45.,
"1-,',,,, .38 , --,,, ...,., ,?.":, '','.' .4. ^2
:7:1 4; : - , :- -, .. ,.. :-. ,
-1,,, A ,-- ,
.30 ''' 7''''''4- ; ''
,,,.,.,,
- .....,- : -54 ,. .37.
PhysicalSymptoms
....:::-.
.'; -".:- . ',--,....<,,-; .35 t:''-- ,
. -''/-:-.;`,...",
..^,, ,:*l'AL''''
, , :'1 -' -' - .45
-.36 .30 , ''"` ° - .34 .54 .43,.
Depression
,
...- , .
, - ,,,.
.. ,, --
.: .40
InappropriateBehaviors/Feelings
: .45
.
, - .33 .33
.
, ..'," -.31 , .35
. ,
.53 '. \ .-"' .37 :35' ;
Parent = shadedTeacher = non-shaded
BEST COPY AVAILAM
74
7"7
Although data from this research do not establish a causalrelationship between birth events and later competence in young children,the findings suggest that birth events and environmental factors maycontribute to a child's later performance. Future research should continueto evaluate the impact that insults early in development have on children'slong term development to provide parents and practitioners with moreinformation when evaluating and planning appropriate interventionstrategies.
75
78
REFERENCES
Batchlor, E. S., Dean, R. S., Gray, J. W., & Wenck, S. (1991).Classification rates and relative risk factors for prenatal events in predictingEmotional/Behavioral disorders in children. Pre and prenatal psychology,5, 327-341.
Bayley, N. (1969). The Psychological Corporation.
Boll, T. J., Stanford, L. D. & O'Donnell, L. (1994, March).Administration of a non- verbal, non-motor measure of learning ability andnear-cognitive functioning: The new Children's Category Test. Paperpresented at the 26th annual National Association of School Psychologists,Seattle, WA.
Boll, T. J. (1993). Children's Category Test Manual. San Antonio:Psychological Corporation.
Gray, J. W., Davis, B., McKoy, K., Dean, R. S., Joy, K. L. (1992).Mothers' self-report of prenatal information as predictors of schoolachievement. Journal of School Psychology, 30, 233- 243.
Gray, J. W., & Dean, R. S., (1991). Neuropsychology of prenatalcomplications. New York: Springer.
Gray, J. W., & Dean, R. S., (1985). Maternal Prenatal Scale. Ball StateUniversity: Indiana.
Nagleri, J. A., LeBuffe, P. A., & Pfeiffer (1993). Devereux BehaviorRating Scale-School Form Manual. San Antonio: Harcourt Brace.
Urquhart, M. K. (1993). The impact of an insult or disability from birthon infants' ability to organize and interpret multiple sources of information.Topics in Early Childhood Special Education, 13(4), 508-531.
76
7 9
INCREASING GEOMETRIC CONTENT KNOWLEDGE: COMPUTER-BASED INSTRUCTION JOURNAL WRITING
Roger Ray ParsonsAssistant Professor of Mathematics Education
University of South Dakota
Robert StackAssistant Professor of Mathematics
University of Nebraska-Chadron
Jack BreenInstructor of Mathematics and Computer ScienceWestern Iowa Technology Community College
77
8 0
INTRODUCTION
The present high school geometry course is not effective for moststudents. Many students fail high school geometry because of the lack ofentry-level knowledge (Senk, 1989; Usiskin, 1982). The difficulties thatstudents have with high school geometry appear to begin in earlier grades.Research findings (Burger, 1985; Fuys, Geddes, & Tisch ler, 1988; Usiskin,1982) show that geometry is a neglected part of the middle schoolmathematics experience of many students. These findings indicate thatwhat geometry is taught at the middle school level is often taught by rote orrequires minimal student response and teacher feedback.
The weaknesses in instruction are likely to be related to the teachers'own experiences with mathematics. Mayberry (1983) found that manypre-service elementary teachers (70%), who had taken a high schoolgeometry class, were at or below van Hie le Level 2 (informal deduction).Pre-service elementary teachers who did not take a high school geometryclass were at or below van Hie le Level 1 (recognize and name properties ofgeometric figures). Geometric content knowledge has an effect oninstruction. Parsons (1994) found that pre-service elementary teachers'instruction was at their measured van Hie le level. That is, if a pre-serviceelementary teacher is measured to be at van Hie le Level 0 (recognition ofshapes), then instruction will only be at van Hie le Level 0.
The use of a LOGO program has been found to produce positiveresults in K-8 students' learning of geometric content (Thomas & Thomas,1984). Yusef (1991) found that by using a LOGO program andLOGO-based Instruction, seventh and eighth grade students were able toraise their van Hie le levels by as much as two van Hie le levels. Otherresearch conducted on the effects of using a LOGO program has beendirected toward inservice teachers and their implementation of LOGOprogramming into their elementary classrooms (Moreira & Noss, 1995).Parsons (1996) showed that the use of a LOGO program and LOGO-basedinstruction could increase geometric content knowledge of pre-serviceelementary teachers.
The purpose of this paper is to report the research that wasconducted using the van Hie le Model at the University of South Dakotaduring 1998. Researchers at the University of South Dakota were involved
78
81

in two projects: (1) a study to determine if computer-based instruction wouldraise the van Hie le levels of eighth grade students, and (2) a study todetermine if journal writing would raise the van Hie le levels of pre-serviceelementary teachers in a concept mathematics course.
79
82
REFERENCE
Breen, J. (1997). Computers and geometric content knowledge.Unpublished Manuscript.
Fuys, D., Geddes, D., & Tisch ler, R. (1985). An investigation of theVan Hie le model of thinking in geometry amosaadolescents. (Final reportof the Investigation of the van Hie le Model of Thinking in Geometry AmongAdolescents Project). Brooklyn, NY. Brooklyn College, School of Education
Mayberry, J. (1983). The van Hie le levels of geometric thought inundergraduate pre-service teachers. Journal for Research in MathematicsEducation, 14(1), 58-69.
Moreira, C. & Noss, R. (1995). Understanding teachers' attitudes tochange in a logo mathematics environment. Educational Studies inMathematics, 28(2), 155-76.
National Council of Teachers of Mathematics. (1991). Professionalstandards for teaching mathematics. Reston, VA.: Author.
National Council of Teachers of Mathematics. (1991). Teaching andevaluation standards for school mathematics. Reston, VA.: Author.
Parsons, R. (April, 1994). Teacher beliefs and content knowledge:Influences on lesson crafting of pre-service teachers during geometrylessons. In R. Wood (Ed.), Research. Issues. and Practices: SecondAnnual Curriculum and Instruction Research Symposium ConferenceProceedings (pp. 12017). Vermillion, University of South Dakota.
Senk, S. (1989). Van Hie le levels and achievement in writinggeometry proofs. Journal for Research in Mathematics Education, 20(3),309-321.
Thomas, E., & Thomas, R. (1984). Exploring geometry with LOGO.Arithmetic Teacher, 32(1), 16-18.
80
8'3
Usiskin, Z. (1982). Van Hie le levels and achievement in secondaryschool geometry. (Final report of the Cognitive Development andAchievement in Secondary School Geometry Project). Chicago: Universityof Chicago, Department of Education.
Yusuf, M. (1991). LOGO based instruction in geometry. Paperpresented at the Annual Meeting of the Mid-Western Educational ResearchAssociation. Chicago, IL.
81
8 4
Achievement in Geometric Understanding by Eighth Grade Students
INTRODUCTION
Learning geometry can be difficult for most geometry students(Battista & Clements, 1995; Fuys, 1985; Fuys, Geddes, & Tisch ler, 1988;Markel, 1994; Mullis, Dossey, Owen, & Phillips, 1991; Senk, 1989; Usiskin,1982; van Hiele, 1986). Studies have shown that students need experiencein thinking at different levels of geometric understanding (Fuys, Geddes, &Tischler, 1988; Shaughnessy & Burger, 1985; Usiskin, 1982; van Hiele,1986). The van Hiele model of thinking in geometry provides strategies andsuggested activities for helping students move from one van Hiele level tothe next van Hiele level (Fuys, Geddes, & Tischler, 1988; Shaughnessy &Burger, 1985; van Hiele, 1986). This study used Windows TM Geometry asthe geometry computer-based guided instruction application. Windows TMGeometry is composed of on-line self-help tutorials to guide the geometrystudent through over 55 subject areas using over 700 practice problems.
Description of Study (8th Grade Students)
To check the efficacy of the software application (Windows TMGeometry), the researcher gave a demonstration of Windows TMGeometry at a joint science and math teachers' conference in February1997 (Breen, 1997). Encouraged by the reception that the demonstration
82
85
received at the conference, the researcher then scheduled a pilot study inAugust 1997. The purpose of the pilot study was to determine whethereighth grade students could use the application software (Windows TMGeometry) in an instructional setting. The pilot study showed that eighthgrade students could use Windows TM Geometry with minimal training andcould advance to the next higher van Hie le level of geometric thought.
The primary purpose of this study was to investigate the effect that ageometry computer-based guided instruction application (Windows TMGeometry) had on (a) an eighth grade student's understanding of standardgeometric concepts, and (c) an eighth grade student's understanding ofcertain geometric definitions. Specifically, this study was concerned withthe question: can eighth grade students achieve van Hiele Level 2 (InformalDeduction) through the use of geometry computer-based guidedinstruction (Windows TM Geometry)?
METHODOLOGY AND RESULTS (8th Grade Students)
In December 1997 eleven students from the middle school, located ina college town in South Dakota, took the Van Hiele Geometry Test prior toand after instruction with the geometry computer-based, guided instructionapplication (Windows TM GeometrA. The five-week study was conductedat a state university located in the southeast area of South Dakota. Thestudy was divided into three phases.
The first phase of the study was the pretest that was conducted onNovember 19th, 1997 and November 20th, 1997. All the participants in thestudy completed the Van Hiele Geometry Test, the Entering GeometryTest, and the Geometry Vocabulary Test in slightly more than one hour.
The second phase of the study comprised of three treatmentsessions. The actual activities used in the study were compared againstactivities, lessons, and exercises contained in the textbook developed bySerra (1989). Discovering Geometry (Serra, 1989), reflects the researchon the van Hiele model for geometric thinking by its author, Michael Serra.Discovering Geometry (Serra, 1989) guides students to discover andmaster concepts and relationships before they are introduced to formalproofs.
83
8 6
The last phase of the study was conducted on December 17th, 1997.
Van Hie le Geometry Test Results
The criterion of three out of five correct answers on each van Hie lelevel was used to assign the student's van Hie le level (Senk, 1989, Usiskin,1982). Students who did not meet the qualifications required for van Hie leLevel 0 (Visualizations) were assigned to a Below Level 0 category. Table 1shows the students' van Hie le levels from the pretest and posttest portionsof the study. As shown in Table 1, two students (18.18%) entered thetreatment portion of the study at a van Hie le level less than Van Hie le Level0 (visualization), five students (45.45%) were at Van Hie le Level 0(Visualization), and four students (36.36% were at Van Hie le Level 1(Analysis). No eighth grade student had met the van Hie le level criterionbeyond Van Hie le Level 1 (Analysis).
The one-tailed "t" test (t=11.701, df=10;p<0.001) for nondependentsamples was used to determine whether there was a significant differencebetween the results of the pre-test and post-test. The hypothesis that therewas no difference in the students; van Hie le levels after exposure togeometry computer-based guided instruction was rejected. The inferenceof this test is that the treatment (Windows TM Geometry) did make adifference in the eighth grade students' level of geometric understanding asmeasured by the Van Hie le Geometry Test.
A simple Z test (Z = 2.543; p= .0055; a= .05) was used to check theproportions between the pre-test and post-test at Van Hie le level 2(Informal Deduction). The hypothesis that the proportions were equal wasrejected. The inference of this test is that eighth grade students canachieve Van Hie le Level 2 (Informal Deduction) after instruction with ageometry computer-based guided instruction (Windows TM Geometry).
Entering Geometry Test Results
Achievement on standard geometry content (not including proofs)was measured in the pretest and posttest portions of the study by theEntering Geometry Test. The two-tailed t test (t= 1.39458, df= 10; p<0.05),adjusted for non-independent means, indicated that there was nosignificant difference in the students' scores between the pretest and
84
87
posttest results. The inference from this statistical test was that the eighthgrade students' understanding of basic geometric concepts were notaffected by the geometry computer-based guided instruction (Windows TMGeometry).
Geometry Vocabulary Test Results
The van Hie le model (van Hie le, 1986) indicates that two personsreasoning at different levels of geometric understanding may notunderstand each other. The van Hie le model further states that each vanHie le level of geometric thinking has its own vocabulary and geometricsymbols (van Hie le, 1986).
The Geometry Vocabulary Test was administered in the pretest andposttest portions of the study to determine if the eighth grade student's useof geometry computer-based guided instruction (Windows TM Geometry)had any affect upon the student's understanding of standard geometricterms. The two-tailed t test (t= -0.39606, df= 10; p<.05), adjusted fornon-independent samples, confirmed that there was no significantdifference in the scores from the Geometry Vocabulary Test between thepretest and posttest portions of the study. The inference from this statisticaltest is that the geometry computer-based guided instruction (Windows TMGeometry) had no affect upon the eighth grade students' definitions ofgeometric terms.
IMPLICATIONS AND DISCUSSION (8TH GRADE STUDENTS)
The study did demonstrate the effectiveness of geometrycomputer-based guided instruction (Windows TM Geometry) when used asa geometry tutor in the classroom. The treatment did help the eighth gradestudents progress through the instructional phases associated withgeometric understanding. The treatment did help the eighth gradestudents achieve van Hie le Level 2 (Informal Deduction) in geometricthinking. The fact that the computer-based guided instruction (WindowsTM Geometry) was inexpensive to purchase (less than $15) and requiredminimal instruction in its use are two features which should encourage theuse of such software in the classroom.
85
88
Analysis of the Entering Geometry Test results (see table 1) showedno difference in the students' understanding of basic geometric conceptsafter treatment with van Hie le phase-based activities. This result did notdiffer from other studies in the learning of geometric concepts usingcomputer-based guided instruction and van Hie le phase-based activities(Bobango, 1989; Thompson, 1993).
Analysis of the Geometry Vocabulary Test results (see Table 1)showed no difference in the eighth grade students' scores taken before andafter treatment with the computer-based guided instruction (Windows TMGeometry). This result was unexpected by the researcher. Van Hie le(1986) had warned of the tendency of geometric learning to degenerateinto rote memorization of the geometric concepts by the students. Theresearcher observed this facet of student behavior. Several studentsmentioned to the researcher after completing the posttest series ofexaminations that they knew that they had gotten some answers wrongbecause they couldn't remember the answers. Analysis of the Van HieieGeometry Test results and the Geometry Vocabulary Test results showedthat some students had incorrectly answered questions I the posttest thatthey had answered correctly in the pretest. During the pretest series ofexaminations, the students had not been formally exposed to the geometricconcepts being introduced with the treatment. In answering the pretestquestions the students analyzed the questions and constructed their ownanswers. In answering the same questions in the posttest portion of thestudy, some students depended upon memorization instead of analysis
86
8 9

REFERENCES
Battista, M.T. & Clements, D.H., (1995). Geometry and proof. TheMathematics Teacher, 88 (1), 48-53.
Bobango, J.C. (1988). Van Hie le levels of geometric thought andstudent achievement in standard content and proof writing: The effect ofphase-based instruction. (Doctoral dissertation, Pennsylvania StateUniversity, 1988). Dissertation Abstracts International 48, 2566A.
Breen, J. (1997, February). Shapes and figures: Using geometrycomputer-based guided instruction to move students from van Hie le Level0 to van Hie le Level 2. Presented at the Fifth Annual Joint Conference ofthe South Dakota Science Teachers Association and the South DakotaCouncil of Teachers of Mathematics, Huron, SD.
Fuys, D. (1985). Van Hie le levels of thinking in geometry. Educationand Urban Society, 17 (4), 462.
Fuys, D., Geddes, D., & Tisch ler, R. (1988). The van Hie le model ofthinking in geometry among adolescents. (Journal for Research inMathematics Education Monograph No.3). Reston, VA: National Council ofTeachers in Mathematics.
Markel, W.D. (1994). The role of proof in mathematics education.School Science and Mathematics, 94 (6) 291-295.
Mullis, I.V., Dossey, J.A., Owen, E.H., & Phillips, G.W. (1991). TheState of mathematics achievement NAEP's 1990 assessment of the nationand trial assessment of the states (On-line). Available:http://www.enc.org/online/enc2137.
National Council of Teachers of Mathematics. (1989). Curriculum andevaluation standards for school mathematics. Reston, VA: Author.
Senk, S.L. (1989). Van Hiele levels and achievement in writinggeometry proofs. Journal for Research in Mathematics Education, 20(3),309-321.
87
9 0
Serra, M. (1989). IDiscovering geometry: An inductive approach.Berkeley, CA: Key Curriculum Press.
Shaughnessy, J.M. & Burger, W.F. (1985). Spadework prior todeduction in geometry. The Mathematics Teacher, 78(6), 419-428.
Thompson, E. (1993). Three methods of instruction in high schoolgeometry and the effects they have on achievement, retention, and attitude(geometry instruction, cooperative learning, CAI). (Doctoral dissertation,Montana State University, 1992). Dissertation Abstracts International 53,2724A
Usiskin, Z. (1982). Van Hie le levels and achievement in secondaryschool geometry (Final report of the Cognitive development andAchievement in Secondary school Geometry Project). Chicago: Universityof Chicago, Department of Education. (ERIC Document ReproductionService No. ED 220 288).
Van Hie le, P.M., (1986). Structure and insight: A theory ofmathematics education. Orlando FL: Academic Press.
88
91
INTRODUCTION
Results from research (Borasi & Rose, 1989; Mett, 1987; Miller, 1992;Nahrgang & Petersen, 1986) suggested that journal writing will enhancestudents' mathematical understanding in specific areas such as algebraand calculus. The idea of writing to improve understanding in variouscontent courses is widely publicized. Farrell (1978), Lehr (1980), and Stock(1-985) mentioned the idea of writing across the curriculum. The Curriculumand Evaluation Standards for School Mathematics (NCTM, 1989) and theProfessional Standards for Teaching Mathematics (1991) supported theuse of writing as an instructional technique to improve student and teacherdiscourse in mathematics.
DESCRIPTION OF STUDY
This study explored the influence of journal writing on the geometricunderstanding of pre-service elementary education teachers in aclassroom setting. This study also explored the influence of journal writingon the proof-writing abilities of pre-service elementary teachers.The study addressed the following research questions.1. To what extent does journal writing affect the geometric understanding ofan experimental group of pre-service elementary teachers?2. To what extent does journal writing affect an experimental group ofpre-service elementary teachers with no previous collegiate instruction invan Hie le Geometry in showing progress in moving from one van Hie leLevel to the next?3. To what extent does journal writing affect an experimental group ofpre-service elementary teachers in using proof writing to increase theirgeometric understanding?4. To what extent does journal writing affect an experimental group ofpre-service elementary teachers in using journal writing to increase theirproof-writing ability?5. To what extent does journal writing affect an experimental group ofpre-service elementary teachers in their ability to verbalize their geometricunderstanding in an interview containing activities based on the van Hie leLevels?
METHODOLOGY AND RESULTS
89
9 2
Pre-service elementary teachers were randomly divided into twogroups, control and experimental. All participants were given aquestionnaire which assessed the student's age, gender, year in college,mathematics courses completed at the high school and college levels, andother related questions pertaining to the students' perceptions about theteaching and learning of mathematics. All participants were then given apretest consisting of the van Hie le Geometry Test and the Geometry ProofTest (Usiskin, 1982). Both groups received two sets of instruction on vanHie le Levels 0-3. The experimental group also completed journalsconsisting of questions pertaining to the respective van Hie le Level. Uponthe completion of the lessons, a posttest was administered to eachparticipant consisting of the same van Hie le Geometry Test and GeometryProof Test (Usiskin, 1982). Each participant was then given an interview todetermine whether they could verbalize at the same van Hie le Level as theytested.
The method of data analysis that was presented and discussed inMeasures of Problem-Solving Performance and Problem-SolvingInstruction (Schoenfeld, 1982) was used to assess the proof-writing skills.A one-tailed t-test involving paired differences of dependent samples wasused to determine any significant differences (at the .05 level) in the controlgroup as compared to the experimental group in terms of van Hie le Levelsand within each of the five van Hie le Levels.
The results from the proof-writing test showed similar conclusions forthe control group and the experimental group. Only one proof wascompletely solved by one participant. The results obtained from theGeometry Proof Test is consistent with prior research conducted byMayberry (1983) and Senk (1989) in that students who have had highschool geometry cannot write proofs.
The results from the van Hie le Geometry Test indicated that therewas a difference in the van Hie le Levels from the pretest to the posttest inthe experimental group. The data suggests that journal writing improvedthe van Hie le Level in an experimental group of pre-service elementaryteachers. Other results obtained from the van Hie le Geometry Testindicated that there was a trend toward significance in the experimentalgroup in the number of correct responses from the pretest to the posttestfor van Hie le Level 1 (Analysis) and van Hie le Level 4 (Rigor).
90
9 3
The results from the interview indicated that the participants mighthave had some preconceived notions about geometry prior to thebeginning of the study. Participants perceived the study of proofs as "agood refresher' and that they "still did not like the proofs".
IMPLICATIONS AND DISCUSSIONS
The implications of this study are that further research must beconducted to determine if interactive learning may have been a contributingfactor to the significance in van Hie le Levels. Further research needs to beconducted to determine the effects of journal writing on a group of studentwho have never had any instruction in geometry. The preconceived notionsabout geometry may have had an effect on the results of the GeometryProof Test. Also, the inclusion of a question in the interview pertainingspecifically to the effects of journal writing on the geometric understandingof the participants in the experimental group should be incorporated.Further research is necessary so that this study may be duplicated with anincreased number of participants in the control and experimental groups.
91
9 4

REFERENCES
Bagley, T., & Gallenberger, C. (1992). Assessing students'dispositions: Using journals to improve students' performance.Mathematics Teacher, 85(8), 660-663.
Borasi, R., & Rose, B.J. (1989). Journal writing and mathematicsinstruction. Educational Studies in Mathematics, 20, 347-365.
Farrell, M.A. (1987). Geometry for secondary school teachers. InLearning and teaching geometry. 1987 yearbook of the national council ofteachers of mathematics, (pp.236-250). Reston, VA: The Council.
Lehr, F. (1980). Writing as learning in the content areas. EnglishJournal, 69(1), 23-25.
Mayberrry, J. (1983). The van Hie le levels of geometric thought inundergraduate pre-service teachers. Journal for Research in MathematicsEducation, 14(1), 58-69.
Mett, C. (1987). Writing as a learning device in calculus. MathematicsTeacher, 80(7), 534-537.
Miller, D.D. (1992). Teacher benefits from using impromptu writingprompts in algebra classes. Journal for Research in MathematicsEducation, 23(4), 329-340.
Nahrgang, C.D. & Petersen, B.T. (1986). Using writing to learnmathematics. Mathematics Teacher, 79(6), 461-465.
National Council of Teachers of Mathematics. (1980). An agenda foraction: recommendations for school mathematics of the 1980's. Reston,VA: Author.
National Council of Teachers of Mathematics. (1989). Curriculum andevaluation standards for school mathematics. Reston, VA: Author.National Council of Teachers of Mathematics. (1991).
92
9 5
Professional standards for teaching mathematics. Reston, VA:Author.
Schoenfeld, A.H. (1982). Measures of problem-solving performanceand of problem-solving instruction. Journal for Research in MathematicsEducation, 13(1),31-49.
Senk, J.L.(1989). Van Hie le levels and achievement in writinggeometry proofs. Journal for Research in Mathematics Education, 20(3),309-321.
Stock, P.L. (1985). Writing across the curriculum. Theory intoPractice, 25(2), 97-101.
Usiskin, Z. (1982). Van Hie le levels and achievement in secondaryschool geometry (Final report of the Cognitive Development andAchievement in Secondary School Geometry Project). Chicago: Universityof Chicago, Department of Education. (ERIC Document ReproductionService No. 220 288).
93
9 6
U.S. DEPARTMENT OF EDUCATIONOffice of Educational Research and Improvement (0ERI)
Educational Resources Information Center (ERIC)
REPRODUCTION RELEASE(Specific Document)
I. DOCUMENT IDENTIFICATION:
Title: e5-ec,,t.c -1) 1- .55(4 -P 5) auxi Vtra-04-i-ce9
Author(s):to. U.90120d etv.et,
Corporate Source:
II. REPRODUCTION RELEASE:
Publication Date:
k.)Lrodt-e1)19qT
In order to disseminate as widely as possible timely and significant materials of interest to the educational community, documents
announced in the monthly abstract journal of the ERIC system. Resources in Education (RIE), are usually made available to usersin microfiche, reproduced paper copy, and electronic/optical media, and sold through the ERIC Document Reproduction Service
(EDRS) or other ERIC vendors. Credit is given to the source of each document, and, if reproduction release is granted, one ofthe following notices is affixed to the document.
If permission is granted to reproduce the identified document, please CHECK ONE of the following options and sign the releasebelow.
In Sample sticker to be affixed to document Sample sticker to be affixed to document 1::*
Check herePermittingmicrofiche(4"x 6" film),paper copy,electronic,and optical mediareproduction
RMISSION TO REPRODUCE THISERIAL HAS EEf1GRANTED
salaTO THE EDUCATIONAL RESOURCES
--INFORMATION CENTER_(ERIC)."
Level 1
"PERMISSION TO REPRODUCE THISMATERIAL IN OTHER THAN PAPER
COPY HAS BEEN GRANTED BY
TO THE EDUCATIONAL RESOURCESINFORMATION-CENTER:(ERIC):"
lsvel 2
or here
Permittingreproductionin other thanpaper copy.
Sign Here, PleaseDocuments will be processed as indicated provided reproduction quality permits. If permission to reproduce is granted, but
neither box is checked, documents will be processed at Level 1.
"I herebyIndicatedsystemservi
grant to the Educational Resources Information Center (ERIC) nonexclusive permission to reproduce this document asabove. Reproduction from the ERIC microfiche or electronic/optical media by persons other than ERIC employees and its
tractors requires permission from the copyright holder. Exception is made for nonprofit reproduction by libraries and otherage cies to satisfy information needs of educators in response to discrete inquiries."
Signa ur :\i CO - Lej-&/ Pusition:
YV-0 t"/ 1 o rPrintel_Name:
\ k t .- \i\100 dOrganization:
ci-6, 6 %.( nC ad)
Lewl 0 hk" SO- bql-Coi-ct,Address: it to v. tp..0 SO - t,ct \<0.k ck
LE1L(. E. c_Lavk_ 5s,savoe( 0 c- E.,c)Li.vccrte 0 4
\.)-2Nr vvIA k\ot,t , 10 5'71)&7
Telephone Number:
( 1,05 ) Gqq- 533-Date:
3ctLi tii Oct?


![Yazdani, G. - Ajanta. Part IV [Caves XVII-XXVII] (96p).pdf](https://img.pdfslide.net/doc/110x75/577cc7a41a28aba711a18ce2/yazdani-g-ajanta-part-iv-caves-xvii-xxvii-96ppdf.jpg)