Embed Size (px)
Citation preview
1H FY2015
Earnings Results Briefing
(References)
February, 2016
Contents
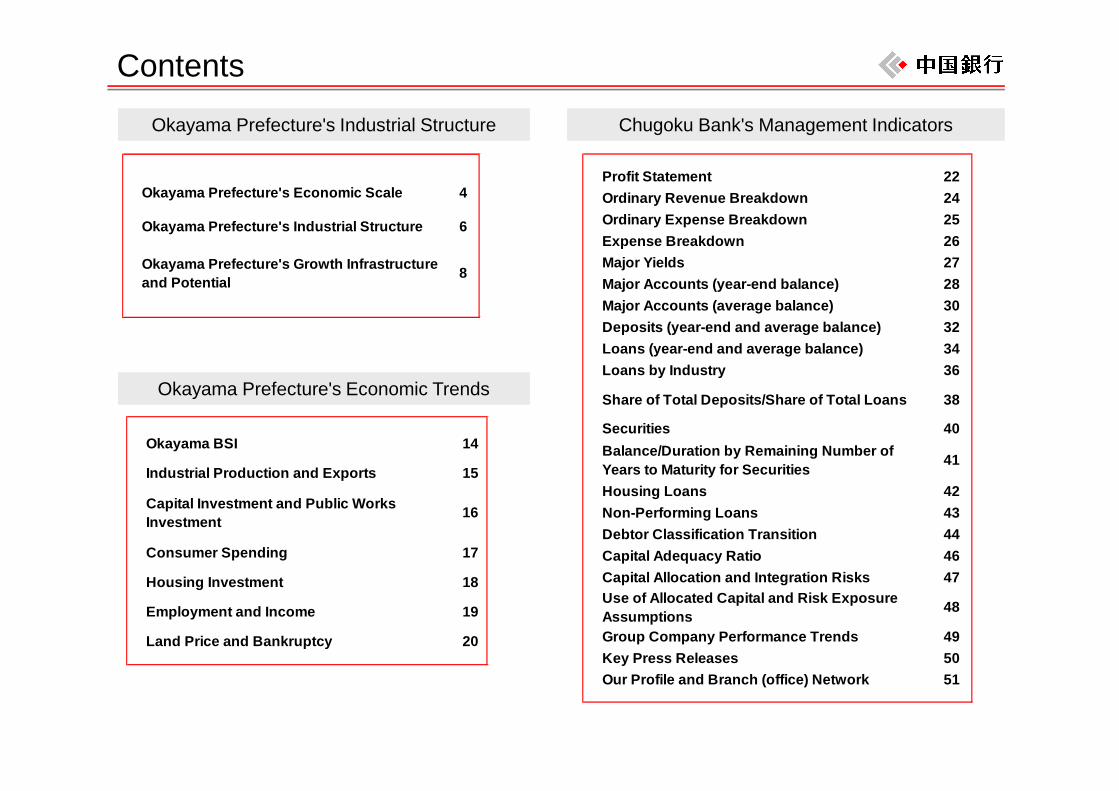
Okayama Prefecture's Industrial StructureOkayama Prefecture's Industrial Structure Chugoku Bank's Management IndicatorsChugoku Bank's Management Indicators
Okayama Prefecture's Economic Scale 4
Okayama Prefecture's Industrial Structure 6
Okayama Prefecture's Growth Infrastructureand Potential 8
Okayama Prefecture's Economic Scale 4
Okayama Prefecture's Industrial Structure 6
Okayama Prefecture's Growth Infrastructureand Potential 8
Profit Statement 22Ordinary Revenue Breakdown 24Ordinary Expense Breakdown 25Expense Breakdown 26Major Yields 27Major Accounts (year-end balance) 28Major Accounts (average balance) 30Deposits (year-end and average balance) 32Loans (year-end and average balance) 34Loans by Industry 36
Share of Total Deposits/Share of Total Loans 38
Securities 40Balance/Duration by Remaining Number ofYears to Maturity for Securities 41
Housing Loans 42Non-Performing Loans 43Debtor Classification Transition 44Capital Adequacy Ratio 46Capital Allocation and Integration Risks 47Use of Allocated Capital and Risk ExposureAssumptions 48
Group Company Performance Trends 49Key Press Releases 50Our Profile and Branch (office) Network 51
Okayama Prefecture's Economic TrendsOkayama Prefecture's Economic Trends
Okayama BSI 14
Industrial Production and Exports 15
Capital Investment and Public WorksInvestment 16
Consumer Spending 17
Housing Investment 18
Employment and Income 19
Land Price and Bankruptcy 20
Okayama BSI 14
Industrial Production and Exports 15
Capital Investment and Public WorksInvestment 16
Consumer Spending 17
Housing Investment 18
Employment and Income 19
Land Price and Bankruptcy 20
Okayama Prefecture's Industrial Structure
Materials-4
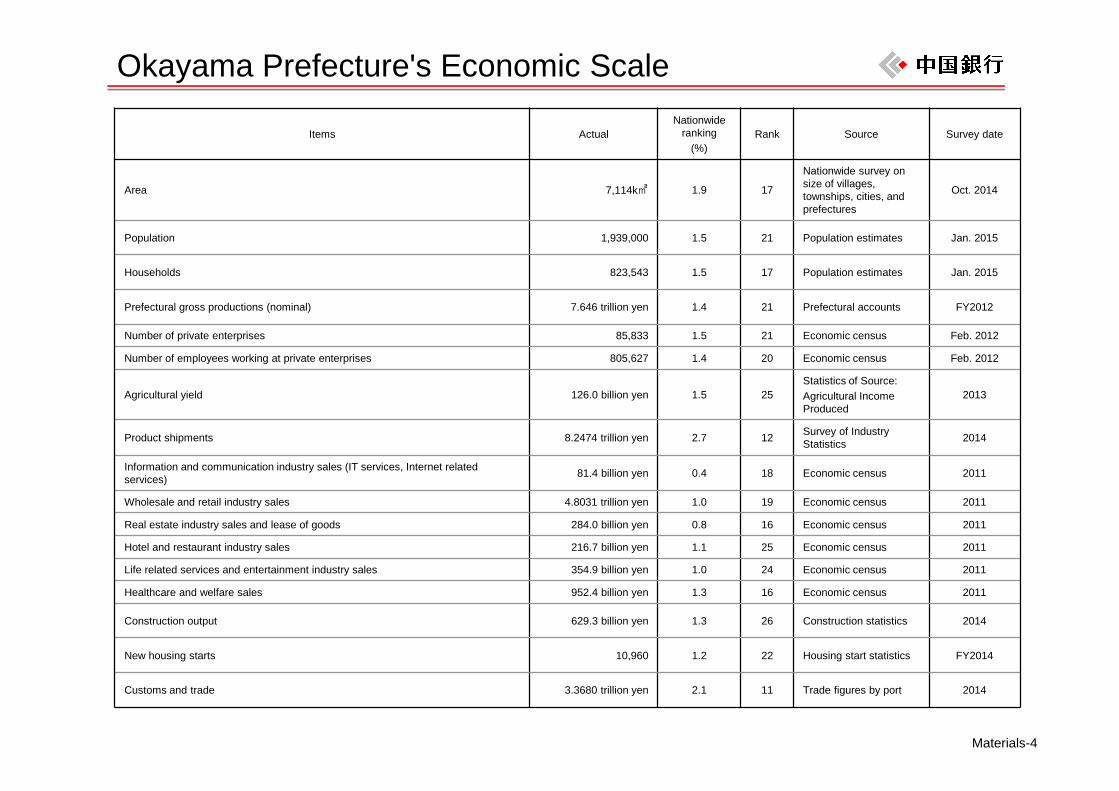
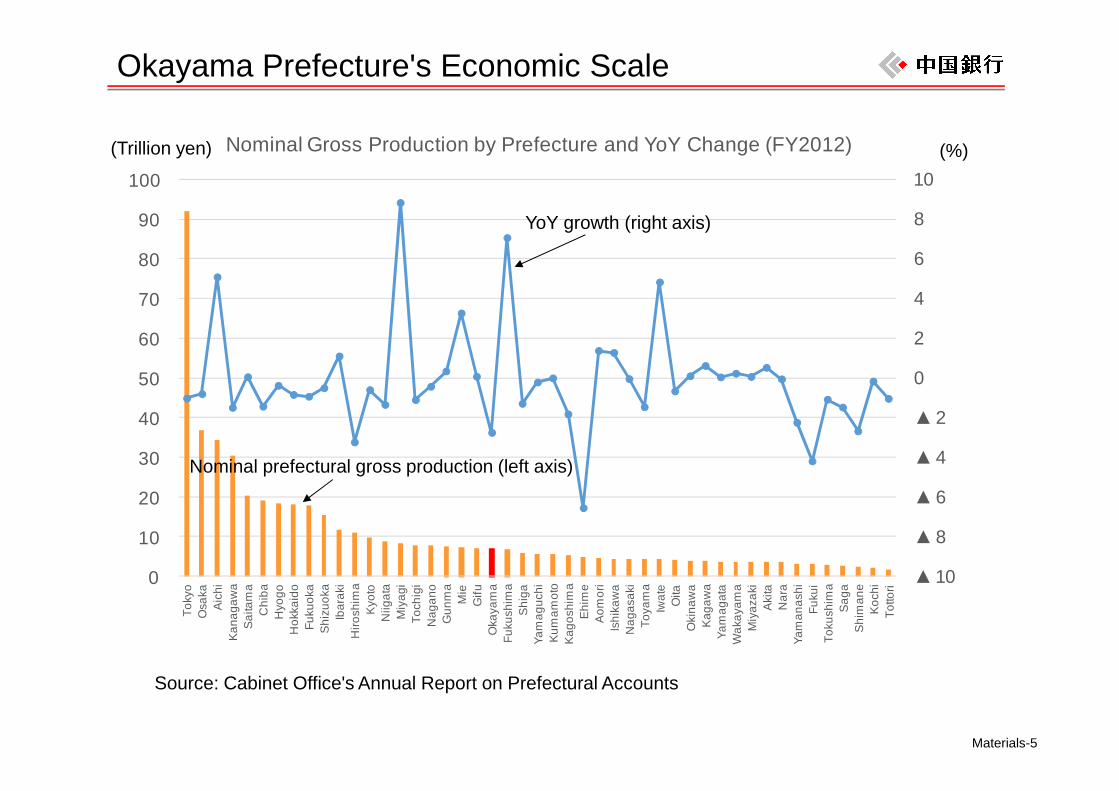
Okayama Prefecture's Economic Scale
Items ActualNationwide
ranking(%)
Rank Source Survey date
Area 7,114k㎡ 1.9 17
Nationwide survey on size of villages, townships, cities, and prefectures
Oct. 2014
Population 1,939,000 1.5 21 Population estimates Jan. 2015
Households 823,543 1.5 17 Population estimates Jan. 2015
Prefectural gross productions (nominal) 7.646 trillion yen 1.4 21 Prefectural accounts FY2012
Number of private enterprises 85,833 1.5 21 Economic census Feb. 2012
Number of employees working at private enterprises 805,627 1.4 20 Economic census Feb. 2012
Agricultural yield 126.0 billion yen 1.5 25Statistics of Source:Agricultural Income Produced
2013
Product shipments 8.2474 trillion yen 2.7 12 Survey of Industry Statistics 2014
Information and communication industry sales (IT services, Internet related services) 81.4 billion yen 0.4 18 Economic census 2011
Wholesale and retail industry sales 4.8031 trillion yen 1.0 19 Economic census 2011
Real estate industry sales and lease of goods 284.0 billion yen 0.8 16 Economic census 2011
Hotel and restaurant industry sales 216.7 billion yen 1.1 25 Economic census 2011
Life related services and entertainment industry sales 354.9 billion yen 1.0 24 Economic census 2011
Healthcare and welfare sales 952.4 billion yen 1.3 16 Economic census 2011
Construction output 629.3 billion yen 1.3 26 Construction statistics 2014
New housing starts 10,960 1.2 22 Housing start statistics FY2014
Customs and trade 3.3680 trillion yen 2.1 11 Trade figures by port 2014
Materials-5
Okayama Prefecture's Economic Scale
▲ 10
▲ 8
▲ 6
▲ 4
▲ 2
0
2
4
6
8
10
0
10
20
30
40
50
60
70
80
90
100 To
kyo
Osa
kaA
ichi
Kan
agaw
aS
aita
ma
Chi
baH
yogo
Hok
kaid
oFu
kuok
aS
hizu
oka
Ibar
aki
Hiro
shim
aK
yoto
Niig
ata
Miy
agi
Toch
igi
Nag
ano
Gun
ma
Mie
Gifu
Oka
yam
aFu
kush
ima
Shi
gaYa
mag
uchi
Kum
amot
oK
agos
him
aE
him
eA
omor
iIs
hika
wa
Nag
asak
iTo
yam
aIw
ate
Oita
Oki
naw
aK
agaw
aYa
mag
ata
Wak
ayam
aM
iyaz
aki
Aki
taN
ara
Yam
anas
hiFu
kui
Toku
shim
aS
aga
Shi
man
eK
ochi
Totto
ri
Nominal Gross Production by Prefecture and YoY Change (FY2012)(Trillion yen)
Source: Cabinet Office's Annual Report on Prefectural Accounts
(%)
YoY growth (right axis)
Nominal prefectural gross production (left axis)
Materials-6
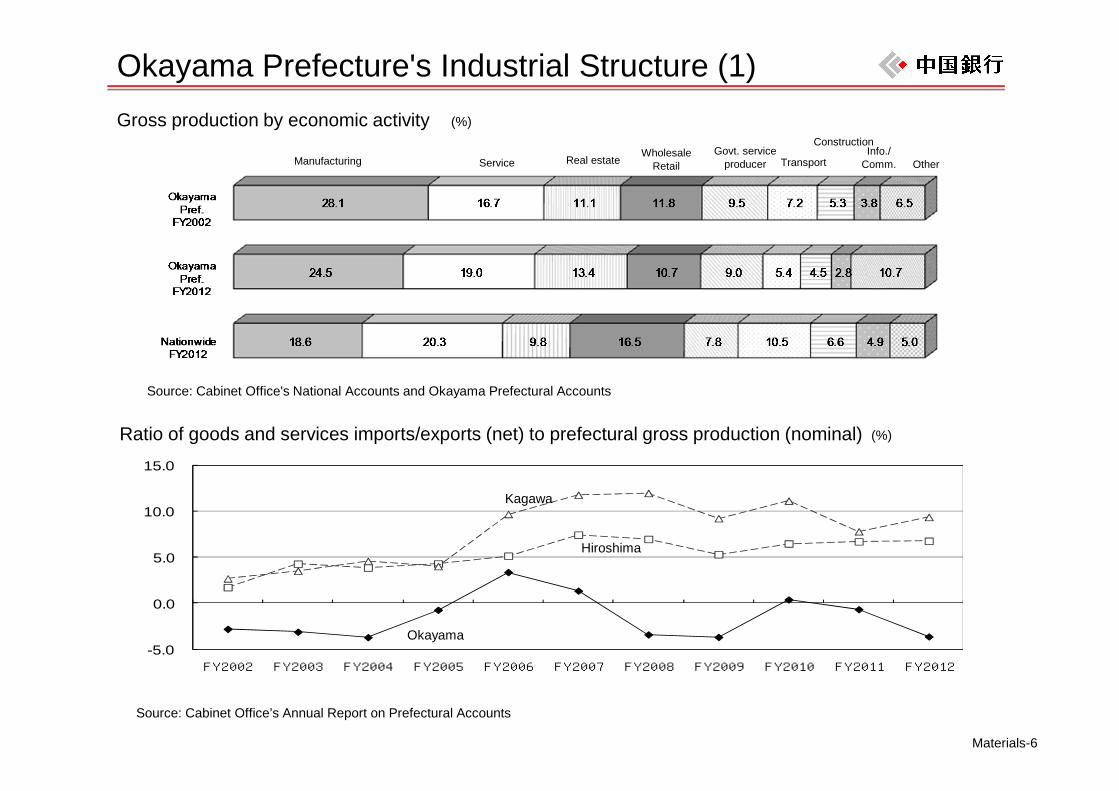
Okayama Prefecture's Industrial Structure (1)
Manufacturing Service Real estateGovt. service
producerWholesale
Retail Transport
ConstructionInfo./
Comm. Other
Gross production by economic activity
Ratio of goods and services imports/exports (net) to prefectural gross production (nominal)
Source: Cabinet Office's National Accounts and Okayama Prefectural Accounts
-5.0
0.0
5.0
10.0
15.0
FY2002 FY2003 FY2004 FY2005 FY2006 FY2007 FY2008 FY2009 FY2010 FY2011 FY2012
Hiroshima
Okayama
Kagawa
(%)
(%)
Source: Cabinet Office’s Annual Report on Prefectural Accounts
38.4
22.7
21.4
11.2
6.3
52.8 47.2
Materials-7
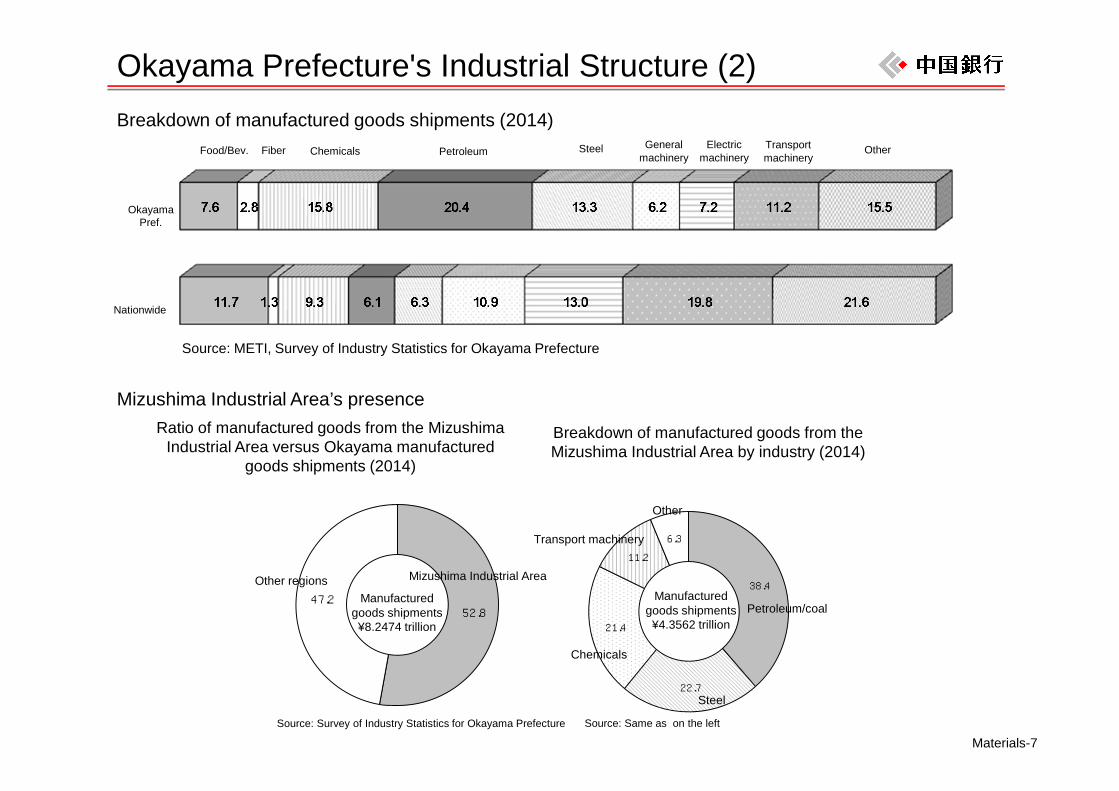
Okayama Prefecture's Industrial Structure (2)
Food/Bev. Fiber Chemicals Petroleum Steel General machinery
Electric machinery
Transport machinery
Other
Breakdown of manufactured goods shipments (2014)
Mizushima Industrial Area’s presence
Source: METI, Survey of Industry Statistics for Okayama Prefecture
Ratio of manufactured goods from the Mizushima Industrial Area versus Okayama manufactured
goods shipments (2014)
Breakdown of manufactured goods from the Mizushima Industrial Area by industry (2014)
Other regions Mizushima Industrial Area
Source: Survey of Industry Statistics for Okayama Prefecture
Manufactured goods shipments¥8.2474 trillion
Manufactured goods shipments¥4.3562 trillion
Steel
Chemicals
Transport machinery
Other
Source: Same as on the left
Petroleum/coal
Nationwide
Okayama Pref.
Materials-8
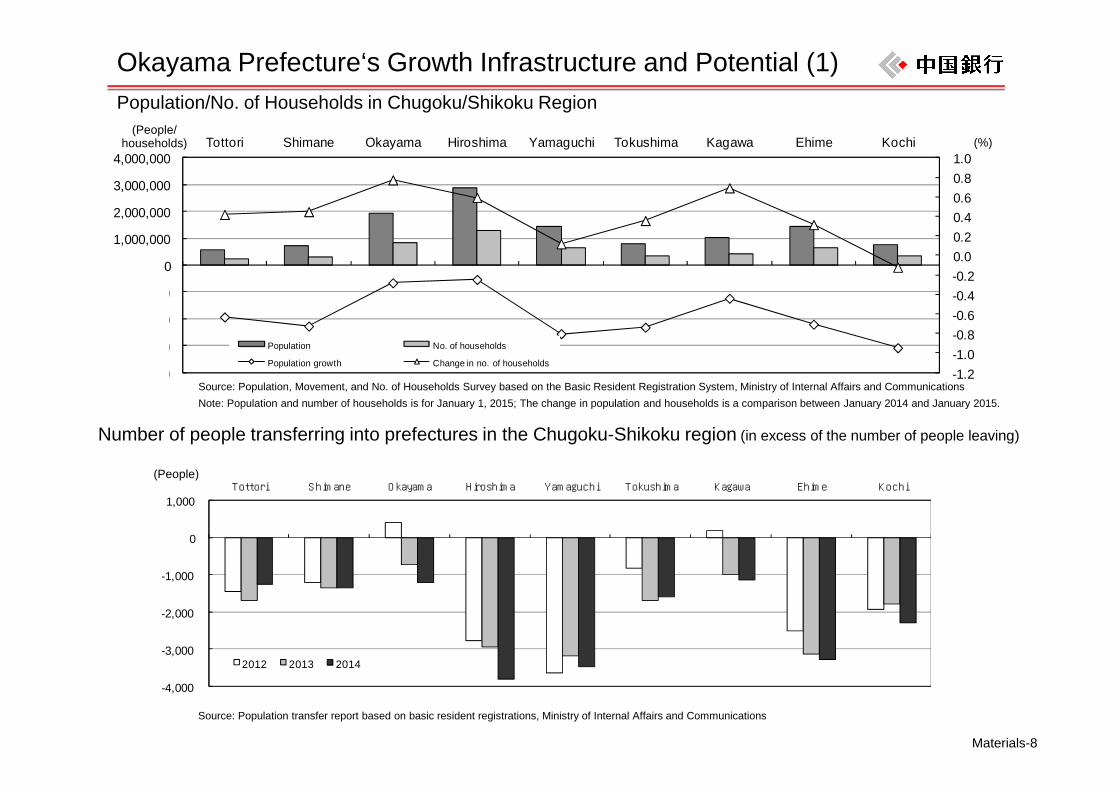
Okayama Prefecture‘s Growth Infrastructure and Potential (1)Population/No. of Households in Chugoku/Shikoku Region
-4,000
-3,000
-2,000
-1,000
0
1,000 Tottori Shimane Okayama Hiroshima Yamaguchi Tokushima Kagawa Ehime Kochi
2012 2013 2014
(People)
Source: Population transfer report based on basic resident registrations, Ministry of Internal Affairs and Communications
-1.2 -1.0 -0.8 -0.6 -0.4 -0.2 0.0 0.2 0.4 0.6 0.8 1.0
-4,000,000
-3,000,000
-2,000,000
-1,000,000
0
1,000,000
2,000,000
3,000,000
4,000,000Tottori Shimane Okayama Hiroshima Yamaguchi Tokushima Kagawa Ehime Kochi
Population No. of households
Population growth Change in no. of households
(People/households) (%)
Source: Population, Movement, and No. of Households Survey based on the Basic Resident Registration System, Ministry of Internal Affairs and CommunicationsNote: Population and number of households is for January 1, 2015; The change in population and households is a comparison between January 2014 and January 2015.
Number of people transferring into prefectures in the Chugoku-Shikoku region (in excess of the number of people leaving)
Materials-9
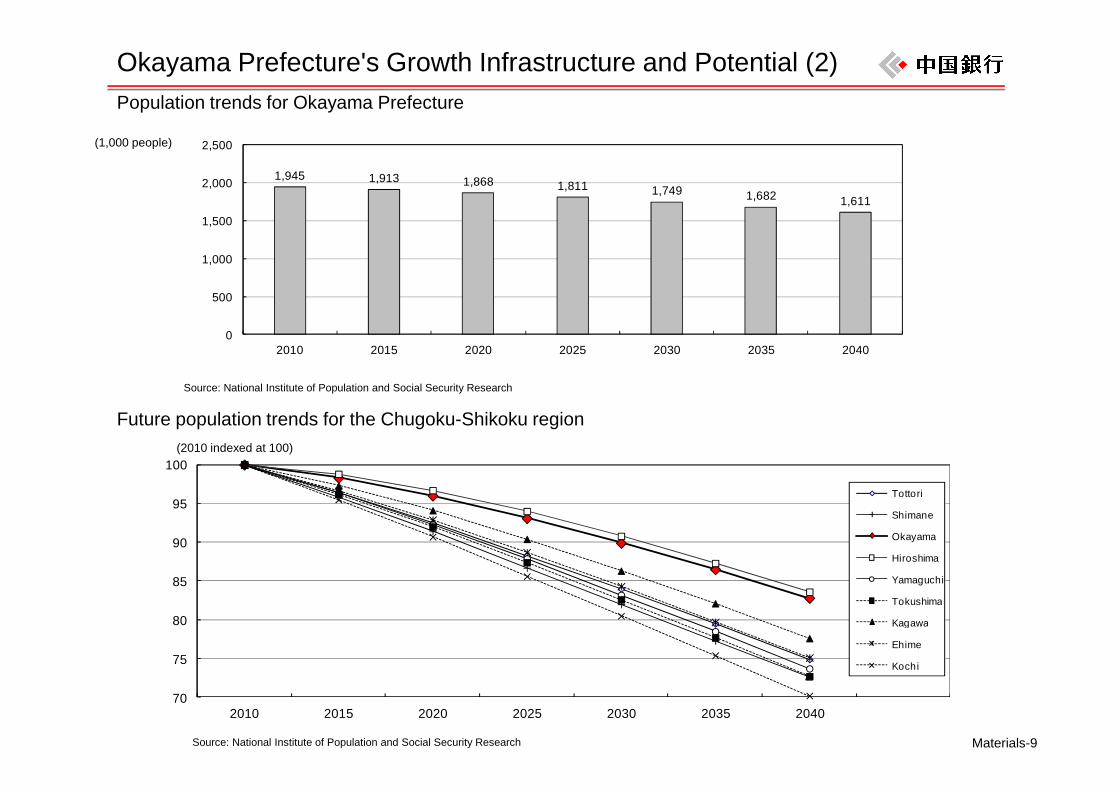
Okayama Prefecture's Growth Infrastructure and Potential (2)
70
75
80
85
90
95
100
2010 2015 2020 2025 2030 2035 2040
Tottori
Shimane
Okayama
Hiroshima
Yamaguchi
Tokushima
Kagawa
Ehime
Kochi
Future population trends for the Chugoku-Shikoku region(2010 indexed at 100)
Source: National Institute of Population and Social Security Research
1,945 1,913 1,868 1,811 1,749 1,682 1,611
0
500
1,000
1,500
2,000
2,500
2010 2015 2020 2025 2030 2035 2040
Population trends for Okayama Prefecture
Source: National Institute of Population and Social Security Research
(1,000 people)
Materials-10
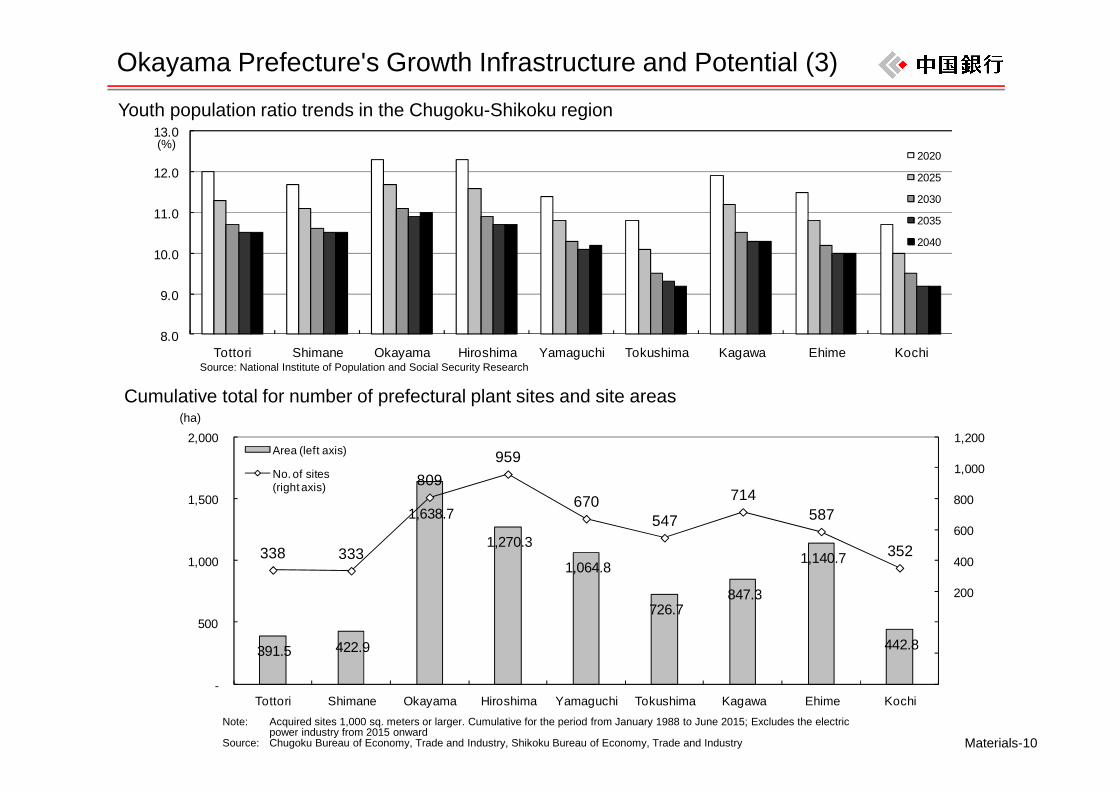
Okayama Prefecture's Growth Infrastructure and Potential (3)
Cumulative total for number of prefectural plant sites and site areas
391.5 422.9
1,638.7
1,270.3
1,064.8
726.7 847.3
1,140.7
442.8
338 333
809959
670547
714587
352
(400)
(200)
-
200
400
600
800
1,000
1,200
-
500
1,000
1,500
2,000
Tottori Shimane Okayama Hiroshima Yamaguchi Tokushima Kagawa Ehime Kochi
Area (left axis)
No. of sites (right axis)
(ha)
Note: Acquired sites 1,000 sq. meters or larger. Cumulative for the period from January 1988 to June 2015; Excludes the electric power industry from 2015 onward
Source: Chugoku Bureau of Economy, Trade and Industry, Shikoku Bureau of Economy, Trade and Industry
8.0
9.0
10.0
11.0
12.0
13.0
Tottori Shimane Okayama Hiroshima Yamaguchi Tokushima Kagawa Ehime Kochi
2020
2025
2030
2035
2040
Source: National Institute of Population and Social Security Research
Youth population ratio trends in the Chugoku-Shikoku region
(%)

Materials-11
Okayama Prefecture‘s Growth Infrastructure and Potential (4)
Warm climate and crosspointWarm climate and crosspoint
In recent years, chosen as a site to decentralize riskShifting from centralization to decentralization of business sites
Favorable transit access
– Natural environment with minimal exposure to typhoons, earthquakes, and other natural disastersThe number and area of plant sites is increasing
– Local government actively inviting companies to industrial zonesInfrastructure development, including Okayama Research Park and Tamashima Harbor Island
– Expressway network extending from the Great Seto BridgeDistribution points that cover a region from Kansai to KyushuPopulation within two-hour diameter is 16 million peopleOkayama Soja I.C Logistics Centre has an advanced distribution center
– Key transportation pointsRailway directly connects Chugoku-Shikoku with all prefectural capitalsMizushima Port is an international container terminal and ranks 9th nationwide in terms of cargo volume handled
Since the Great East Japan Earthquake, focus has been on Okayama Prefecture due to the minimal risk of natural disasters
Materials provided by Okayama Prefecture * ®: Industrial parks ①-⑬: Industrial zones
Becoming a connection point between Chugoku-Shikoku and West Japan
(Japan Cross Laminated Timber Association)
CO2
Materials-12
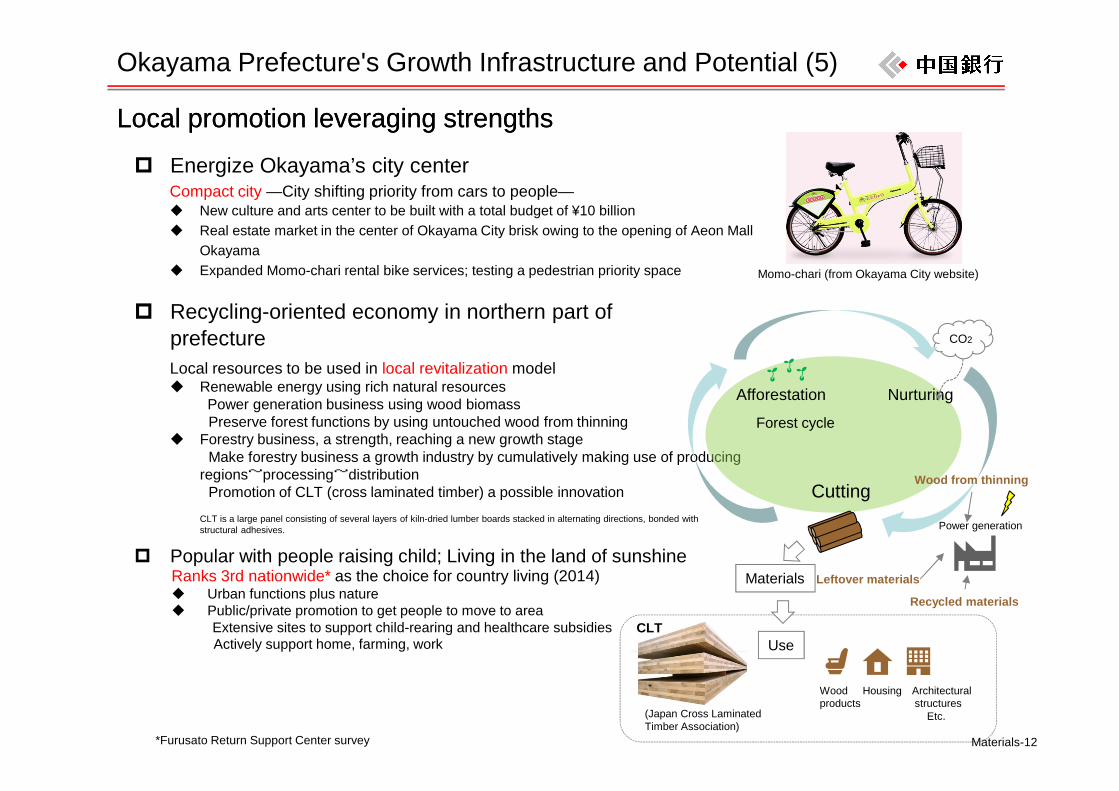
Okayama Prefecture's Growth Infrastructure and Potential (5)
Local promotion leveraging strengthsLocal promotion leveraging strengths
Compact city —City shifting priority from cars to people— New culture and arts center to be built with a total budget of ¥10 billion Real estate market in the center of Okayama City brisk owing to the opening of Aeon Mall
Okayama Expanded Momo-chari rental bike services; testing a pedestrian priority space
Energize Okayama’s city center
Recycling-oriented economy in northern part of prefectureLocal resources to be used in local revitalization model Renewable energy using rich natural resources
Power generation business using wood biomassPreserve forest functions by using untouched wood from thinning
Forestry business, a strength, reaching a new growth stageMake forestry business a growth industry by cumulatively making use of producing
regions~processing~distributionPromotion of CLT (cross laminated timber) a possible innovation
Popular with people raising child; Living in the land of sunshineRanks 3rd nationwide* as the choice for country living (2014) Urban functions plus nature Public/private promotion to get people to move to area
Extensive sites to support child-rearing and healthcare subsidiesActively support home, farming, work
Momo-chari (from Okayama City website)
Cutting
Afforestation Nurturing
Wood Housing Architecturalproducts structures
Etc.
Forest cycle
Power generation
Materials
Wood from thinning
Leftover materials
Recycled materials
CLTUse
CLT is a large panel consisting of several layers of kiln-dried lumber boards stacked in alternating directions, bonded with structural adhesives.
*Furusato Return Support Center survey
Okayama Prefecture's Economic Trends
Materials-14
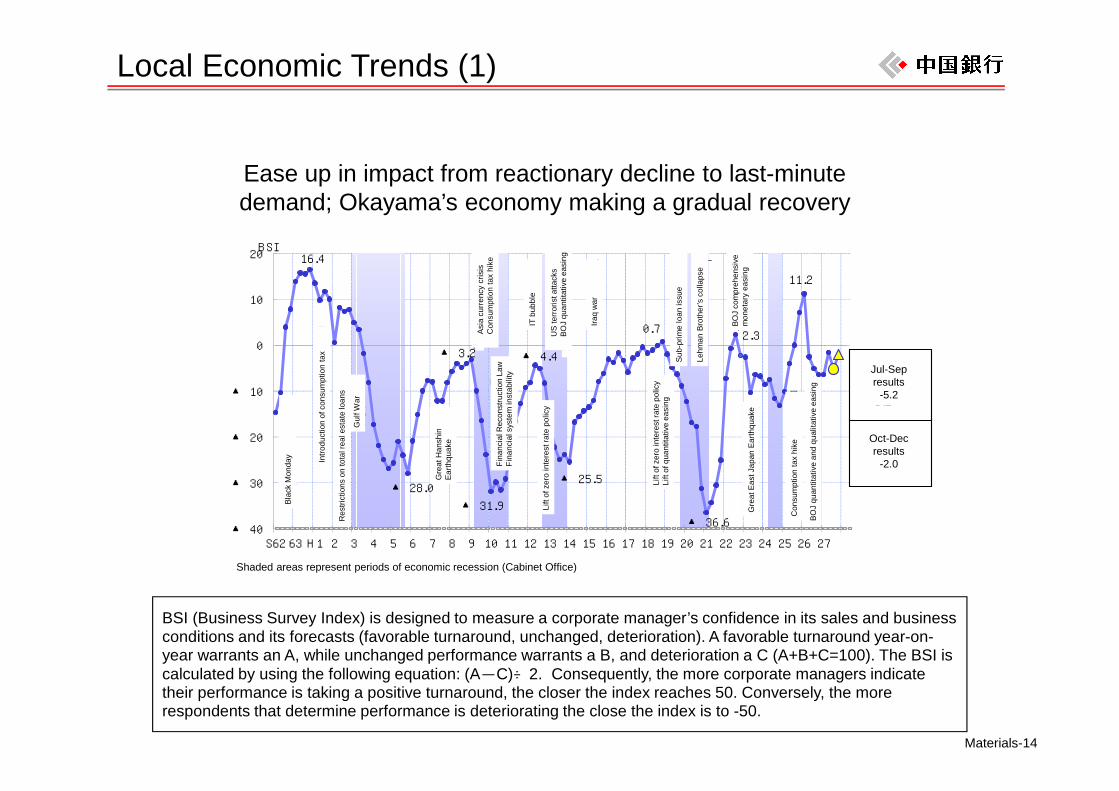
Local Economic Trends (1)
BSI (Business Survey Index) is designed to measure a corporate manager’s confidence in its sales and business conditions and its forecasts (favorable turnaround, unchanged, deterioration). A favorable turnaround year-on-year warrants an A, while unchanged performance warrants a B, and deterioration a C (A+B+C=100). The BSI is calculated by using the following equation: (A-C)÷2. Consequently, the more corporate managers indicate their performance is taking a positive turnaround, the closer the index reaches 50. Conversely, the more respondents that determine performance is deteriorating the close the index is to -50.
Ease up in impact from reactionary decline to last-minute demand; Okayama’s economy making a gradual recovery
16.4
▲ 28.0
▲ 3.2
▲ 31.9
▲ 4.4
▲ 25.5
0.7
▲ 36.6
2.3
11.2
▲ 40
▲ 30
▲ 20
▲ 10
0
10
20
S62 63 H1 2 3 4 5 6 7 8 9 10 11 12 13 14 15 16 17 18 19 20 21 22 23 24 25 26 27
ブラックマンデー
消費税導入 湾
岸戦争
阪神大震災
アジア通貨危機
消費税率引き上げ
1
金融再生法施行
金融システム不安
ゼロ金利政策解除
日銀、量的緩和
網掛けの部分は、内閣府による景気後退期。
ITバブル
BSI
不動産融資の総量規制
米、同時多発テロ
イラク戦争
ゼロ金利政策解除
量的緩和解除
リーマンショック
サブプライム問題
日銀、包括緩和
東日本大震災
10~12月期予測値▲2.0
日銀、量的・質的緩和
消費税率引き上げ
7~9月期実績値▲5.2
Asia
cur
renc
y cr
isis
Con
sum
ptio
n ta
x hi
ke
IT b
ubbl
e
US
terr
oris
t atta
cks
BOJ
quan
titat
ive
easi
ng
Iraq
war
Sub-
prim
e lo
an is
sue
Lehm
an B
roth
er’s
col
laps
e
BOJ
com
preh
ensi
ve
mon
etar
y ea
sing
Blac
k M
onda
y Intro
duct
ion
of c
onsu
mpt
ion
tax
Res
trict
ions
on
tota
l rea
l est
ate
loan
s
Gul
f War
Gre
at H
ansh
in
Earth
quak
e
Fina
ncia
l Rec
onst
ruct
ion
Law
Fina
ncia
l sys
tem
inst
abili
ty
Lift
of z
ero
inte
rest
rate
pol
icy
Lift
of z
ero
inte
rest
rate
pol
icy
Lift
of q
uant
itativ
e ea
sing
Gre
at E
ast J
apan
Ear
thqu
ake
Con
sum
ptio
n ta
x hi
ke
BOJ
quan
titat
ive
and
qual
itativ
e ea
sing
Jul-Sep results
-5.2
Oct-Dec results
-2.0
Shaded areas represent periods of economic recession (Cabinet Office)
Materials-15
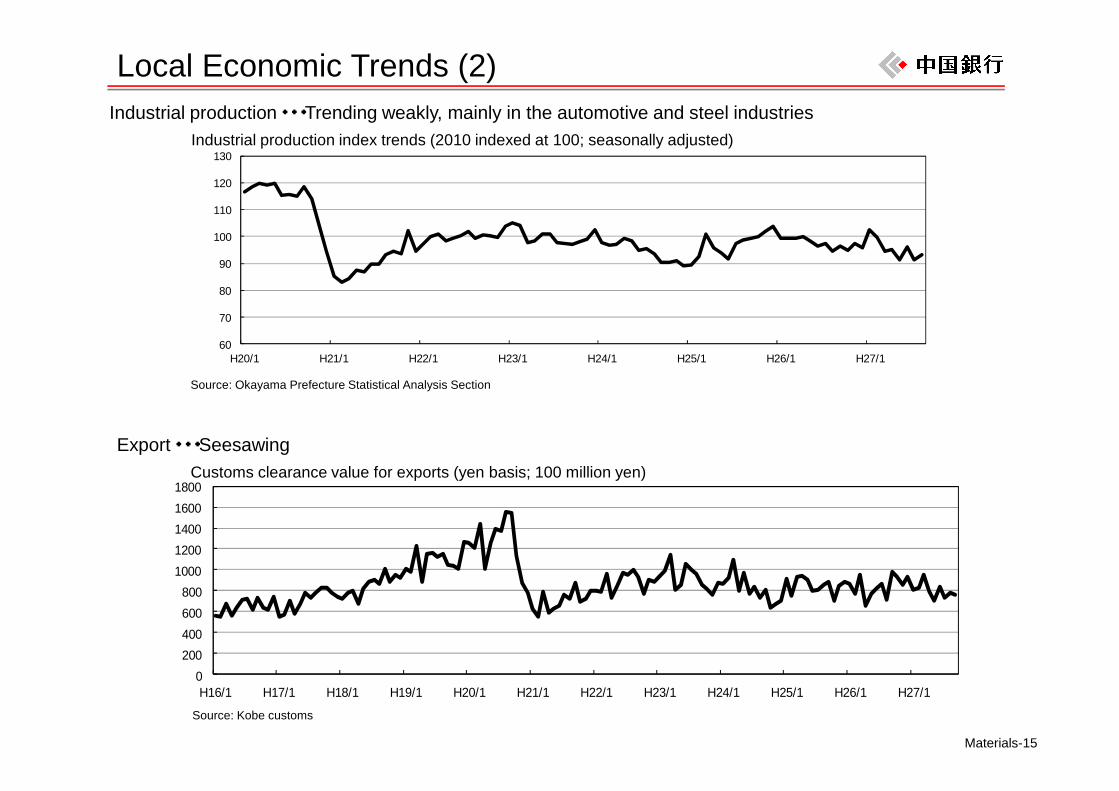
Local Economic Trends (2)Industrial production・・・Trending weakly, mainly in the automotive and steel industries
Export・・・Seesawing
0200400600800
10001200140016001800
H16/1 H17/1 H18/1 H19/1 H20/1 H21/1 H22/1 H23/1 H24/1 H25/1 H26/1 H27/1
60
70
80
90
100
110
120
130
H20/1 H21/1 H22/1 H23/1 H24/1 H25/1 H26/1 H27/1
Source: Okayama Prefecture Statistical Analysis Section
Source: Kobe customs
Industrial production index trends (2010 indexed at 100; seasonally adjusted)
Customs clearance value for exports (yen basis; 100 million yen)
Materials-16
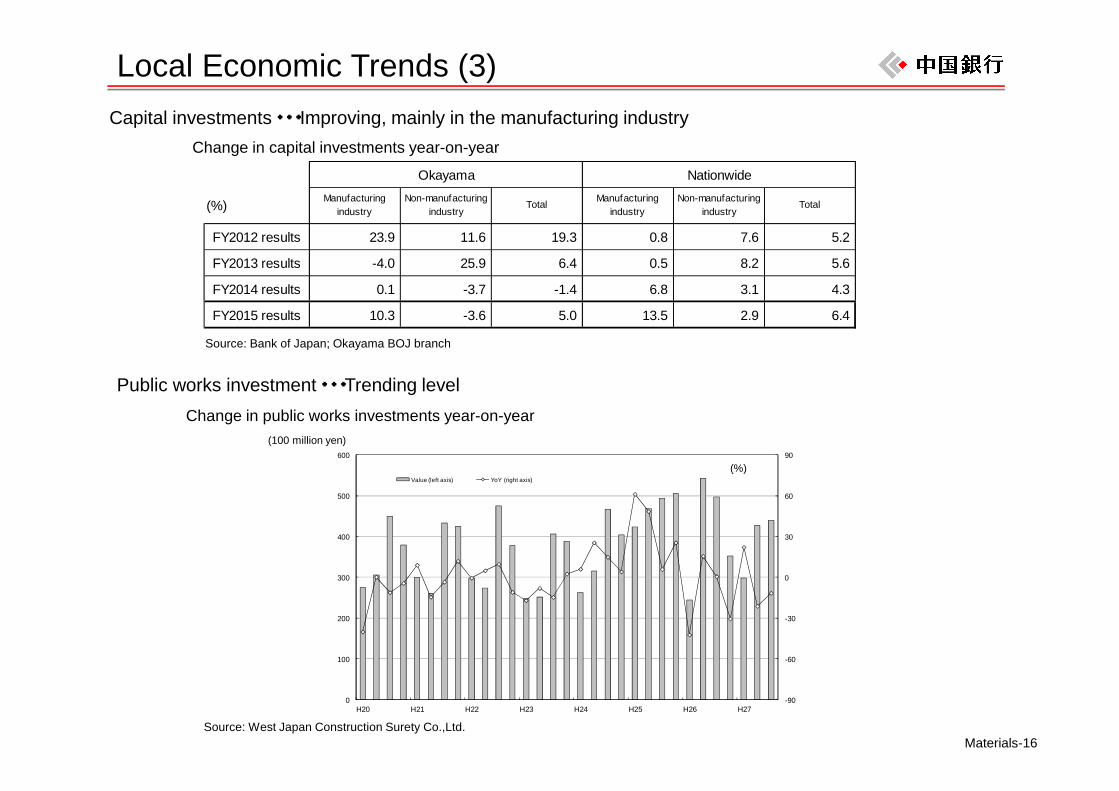
Local Economic Trends (3)Capital investments・・・Improving, mainly in the manufacturing industry
Public works investment・・・Trending level
-90
-60
-30
0
30
60
90
0
100
200
300
400
500
600
H20 H21 H22 H23 H24 H25 H26 H27
Value (left axis) YoY (right axis)
Okayama Nationwide
(%) Manufacturingindustry
Non-manufacturingindustry
Total Manufacturingindustry
Non-manufacturingindustry
Total
FY2012 results 23.9 11.6 19.3 0.8 7.6 5.2
FY2013 results -4.0 25.9 6.4 0.5 8.2 5.6
FY2014 results 0.1 -3.7 -1.4 6.8 3.1 4.3
FY2015 results 10.3 -3.6 5.0 13.5 2.9 6.4
Source: Bank of Japan; Okayama BOJ branch
Change in capital investments year-on-year
Change in public works investments year-on-year
Source: West Japan Construction Surety Co.,Ltd.
(100 million yen)
(%)
Materials-17
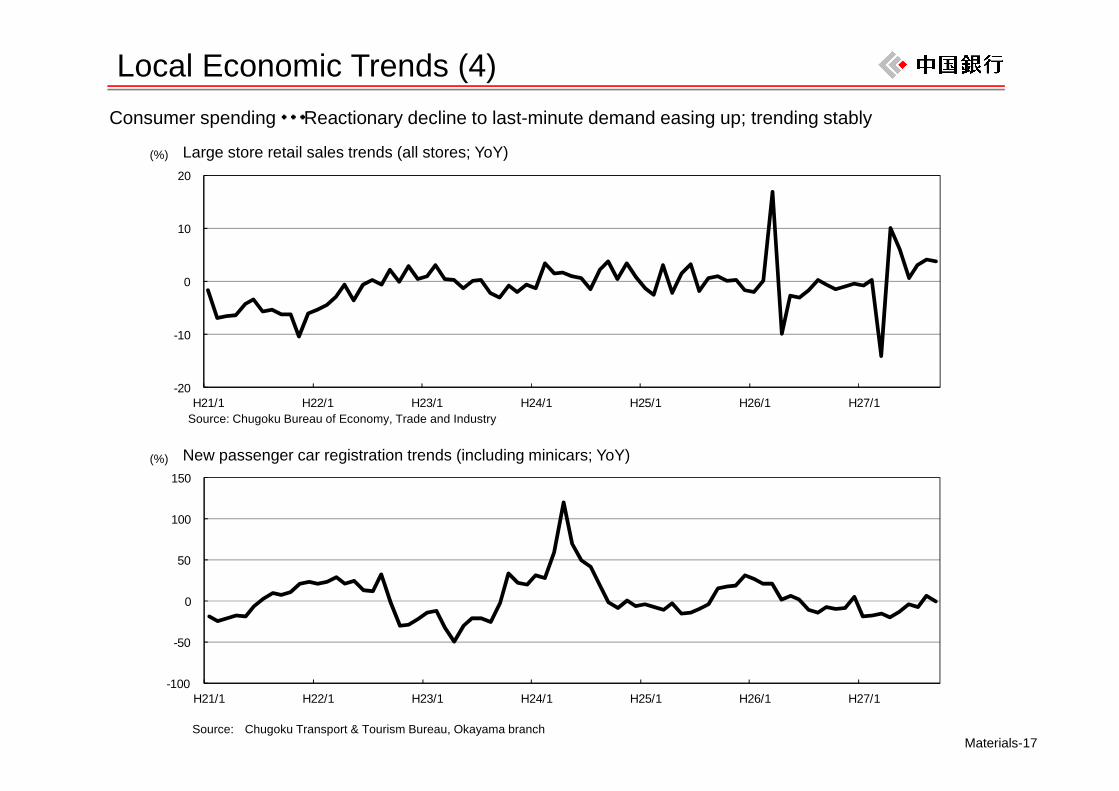
Local Economic Trends (4)Consumer spending・・・Reactionary decline to last-minute demand easing up; trending stably
-100
-50
0
50
100
150
H21/1 H22/1 H23/1 H24/1 H25/1 H26/1 H27/1
-20
-10
0
10
20
H21/1 H22/1 H23/1 H24/1 H25/1 H26/1 H27/1
Large store retail sales trends (all stores; YoY)
New passenger car registration trends (including minicars; YoY)
(%)
(%)
Source: Chugoku Bureau of Economy, Trade and Industry
Source: Chugoku Transport & Tourism Bureau, Okayama branch
Materials-18
0
200
400
600
H21/1 H22/1 H23/1 H24/1 H25/1 H26/1 H27/1
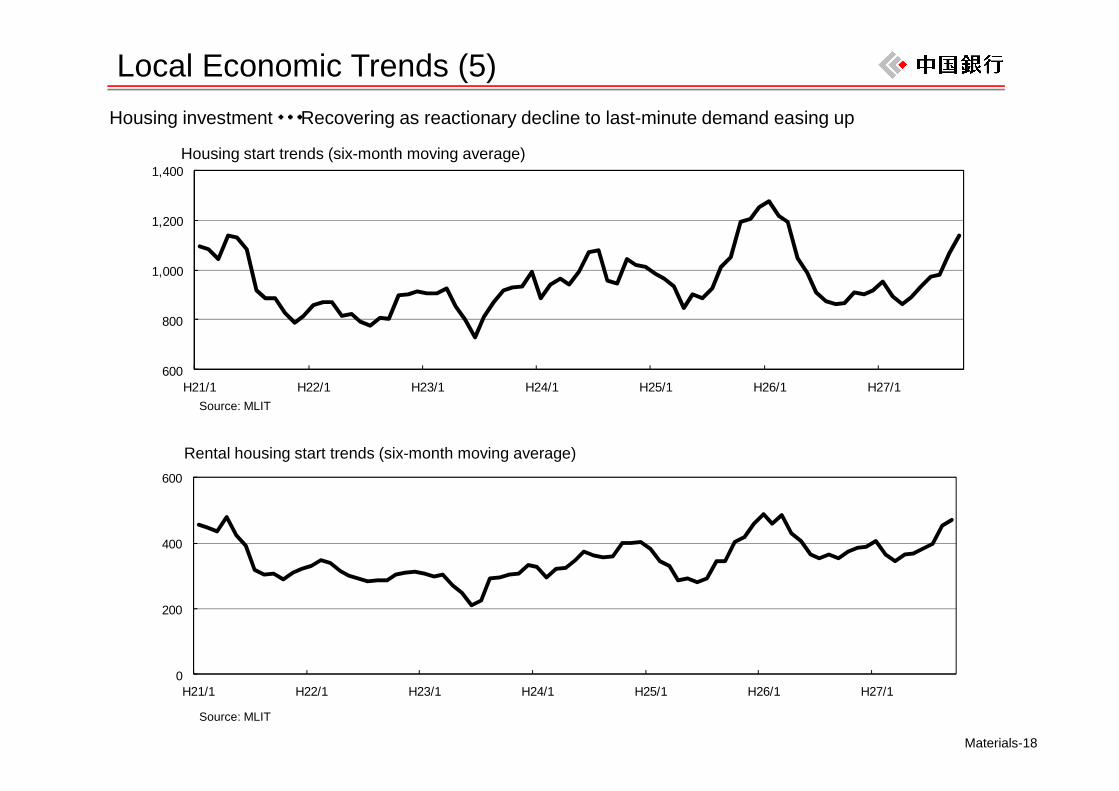
Local Economic Trends (5)
600
800
1,000
1,200
1,400
H21/1 H22/1 H23/1 H24/1 H25/1 H26/1 H27/1
Housing investment・・・Recovering as reactionary decline to last-minute demand easing up
Source: MLIT
Housing start trends (six-month moving average)
Rental housing start trends (six-month moving average)
Source: MLIT
Materials-19
80
85
90
95
100
105
110
115
H21/1 H22/1 H23/1 H24/1 H25/1 H26/1 H27/1
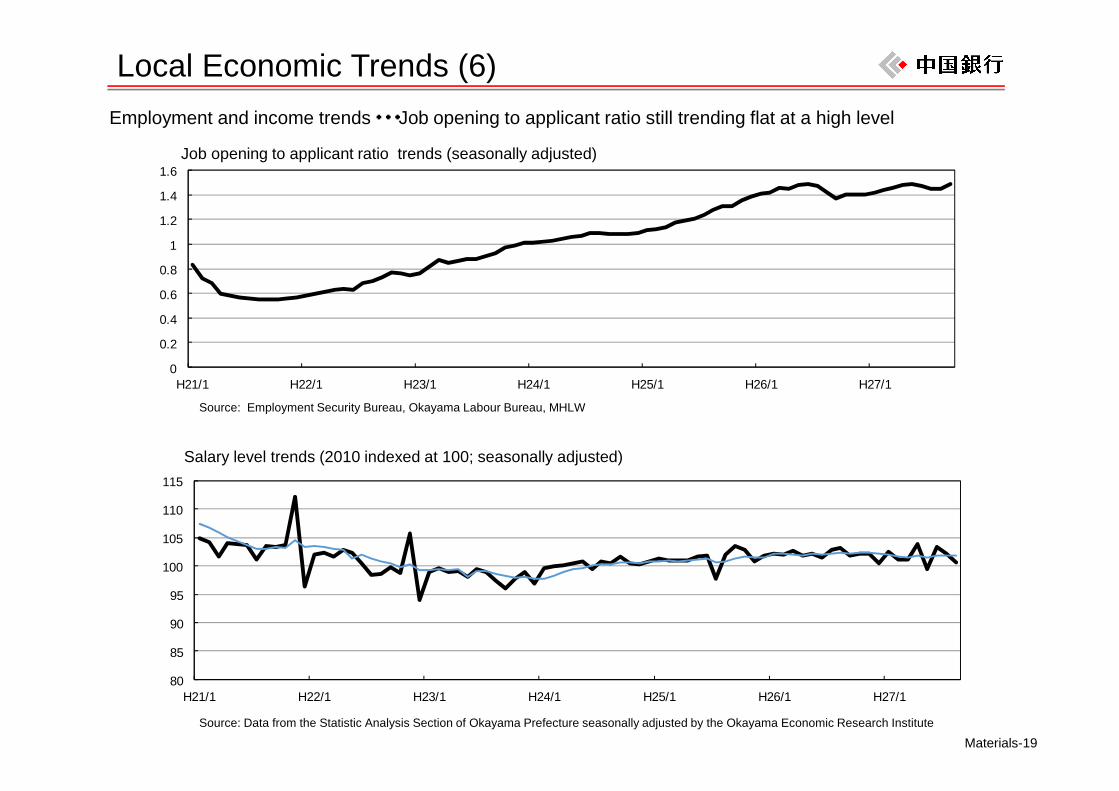
Local Economic Trends (6)
0
0.2
0.4
0.6
0.8
1
1.2
1.4
1.6
H21/1 H22/1 H23/1 H24/1 H25/1 H26/1 H27/1
Source: Data from the Statistic Analysis Section of Okayama Prefecture seasonally adjusted by the Okayama Economic Research Institute
Job opening to applicant ratio trends (seasonally adjusted)
Salary level trends (2010 indexed at 100; seasonally adjusted)
Source: Employment Security Bureau, Okayama Labour Bureau, MHLW
Employment and income trends・・・Job opening to applicant ratio still trending flat at a high level

Materials-20
Local Economic Trends (7)Land prices・・・Decline contracted for the 4th year in a row
-12.0
-10.0
-8.0
-6.0
-4.0
-2.0
0.0
H15 H16 H17 H18 H19 H20 H21 H22 H23 H24 H25 H26 H27
Residential land Commercial land
Standard land price trends (YoY)
Corporate bankruptcies・・・Number of bankruptcies and total liabilities both at a low levelCorporate bankruptcy trends (quarterly)
Source: Prefectural livelihood and transportation section, Okayama Prefecture
Source: Okayama branch, Teikoku Databank
(%)
(100 million yen)
0
100
200
300
400
500
600
0
10
20
30
40
50
21 22 23 24 25 26 27
Value (right axis) No. of bankruptcies (left axis)
2,439
Chugoku Bank's Management Indicators
Materials-22
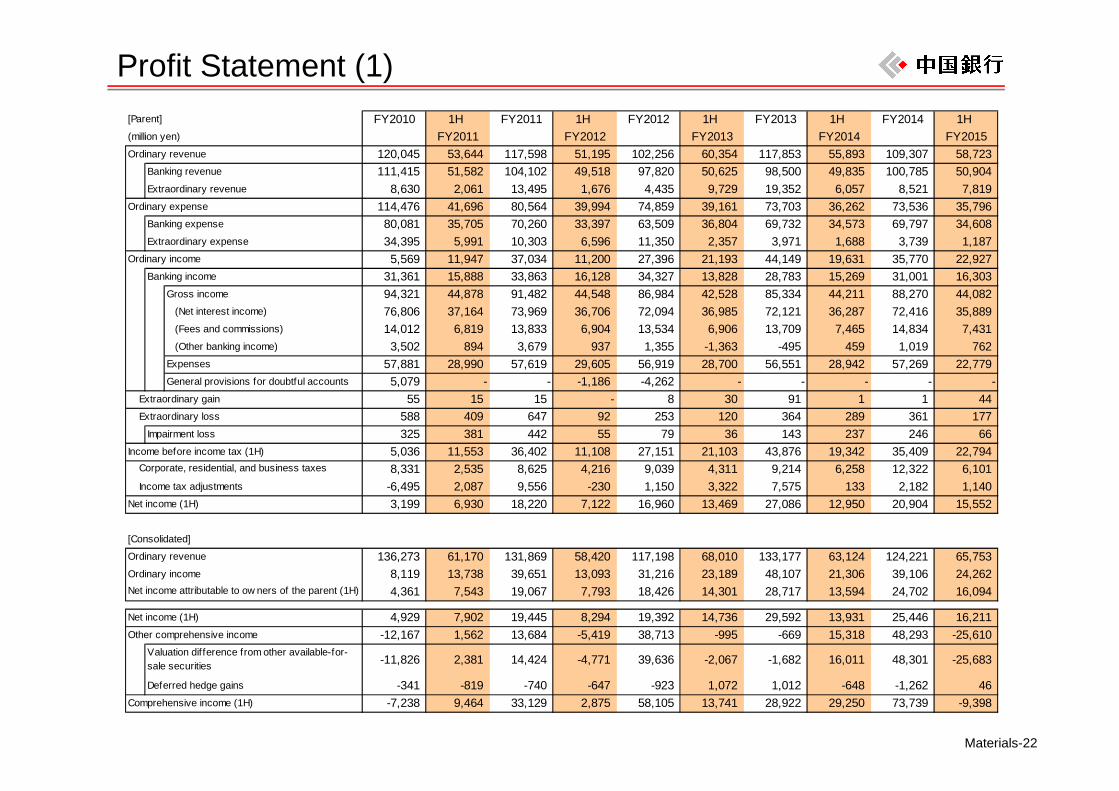
Profit Statement (1)[Parent] FY2010 1H FY2011 1H FY2012 1H FY2013 1H FY2014 1H (million yen) FY2011 FY2012 FY2013 FY2014 FY2015Ordinary revenue 120,045 53,644 117,598 51,195 102,256 60,354 117,853 55,893 109,307 58,723
Banking revenue 111,415 51,582 104,102 49,518 97,820 50,625 98,500 49,835 100,785 50,904Extraordinary revenue 8,630 2,061 13,495 1,676 4,435 9,729 19,352 6,057 8,521 7,819
Ordinary expense 114,476 41,696 80,564 39,994 74,859 39,161 73,703 36,262 73,536 35,796Banking expense 80,081 35,705 70,260 33,397 63,509 36,804 69,732 34,573 69,797 34,608Extraordinary expense 34,395 5,991 10,303 6,596 11,350 2,357 3,971 1,688 3,739 1,187
Ordinary income 5,569 11,947 37,034 11,200 27,396 21,193 44,149 19,631 35,770 22,927Banking income 31,361 15,888 33,863 16,128 34,327 13,828 28,783 15,269 31,001 16,303
Gross income 94,321 44,878 91,482 44,548 86,984 42,528 85,334 44,211 88,270 44,082 (Net interest income) 76,806 37,164 73,969 36,706 72,094 36,985 72,121 36,287 72,416 35,889 (Fees and commissions) 14,012 6,819 13,833 6,904 13,534 6,906 13,709 7,465 14,834 7,431 (Other banking income) 3,502 894 3,679 937 1,355 -1,363 -495 459 1,019 762Expenses 57,881 28,990 57,619 29,605 56,919 28,700 56,551 28,942 57,269 22,779General provisions for doubtful accounts 5,079 - - -1,186 -4,262 - - - - -
Extraordinary gain 55 15 15 - 8 30 91 1 1 44 Extraordinary loss 588 409 647 92 253 120 364 289 361 177
Impairment loss 325 381 442 55 79 36 143 237 246 66Income before income tax (1H) 5,036 11,553 36,402 11,108 27,151 21,103 43,876 19,342 35,409 22,794
8,331 2,535 8,625 4,216 9,039 4,311 9,214 6,258 12,322 6,101 Income tax adjustments -6,495 2,087 9,556 -230 1,150 3,322 7,575 133 2,182 1,140Net income (1H) 3,199 6,930 18,220 7,122 16,960 13,469 27,086 12,950 20,904 15,552
[Consolidated]
Ordinary revenue 136,273 61,170 131,869 58,420 117,198 68,010 133,177 63,124 124,221 65,753Ordinary income 8,119 13,738 39,651 13,093 31,216 23,189 48,107 21,306 39,106 24,262
4,361 7,543 19,067 7,793 18,426 14,301 28,717 13,594 24,702 16,094
Net income (1H) 4,929 7,902 19,445 8,294 19,392 14,736 29,592 13,931 25,446 16,211Other comprehensive income -12,167 1,562 13,684 -5,419 38,713 -995 -669 15,318 48,293 -25,610
-11,826 2,381 14,424 -4,771 39,636 -2,067 -1,682 16,011 48,301 -25,683
Deferred hedge gains -341 -819 -740 -647 -923 1,072 1,012 -648 -1,262 46Comprehensive income (1H) -7,238 9,464 33,129 2,875 58,105 13,741 28,922 29,250 73,739 -9,398
Net income attributable to ow ners of the parent (1H)
Valuation difference from other available-for-sale securities
Corporate, residential, and business taxes
Materials-23
Profit Statement (2)
[Parent] FY2010 1H FY2011 1H FY2012 1H FY2013 1H FY2014 1H
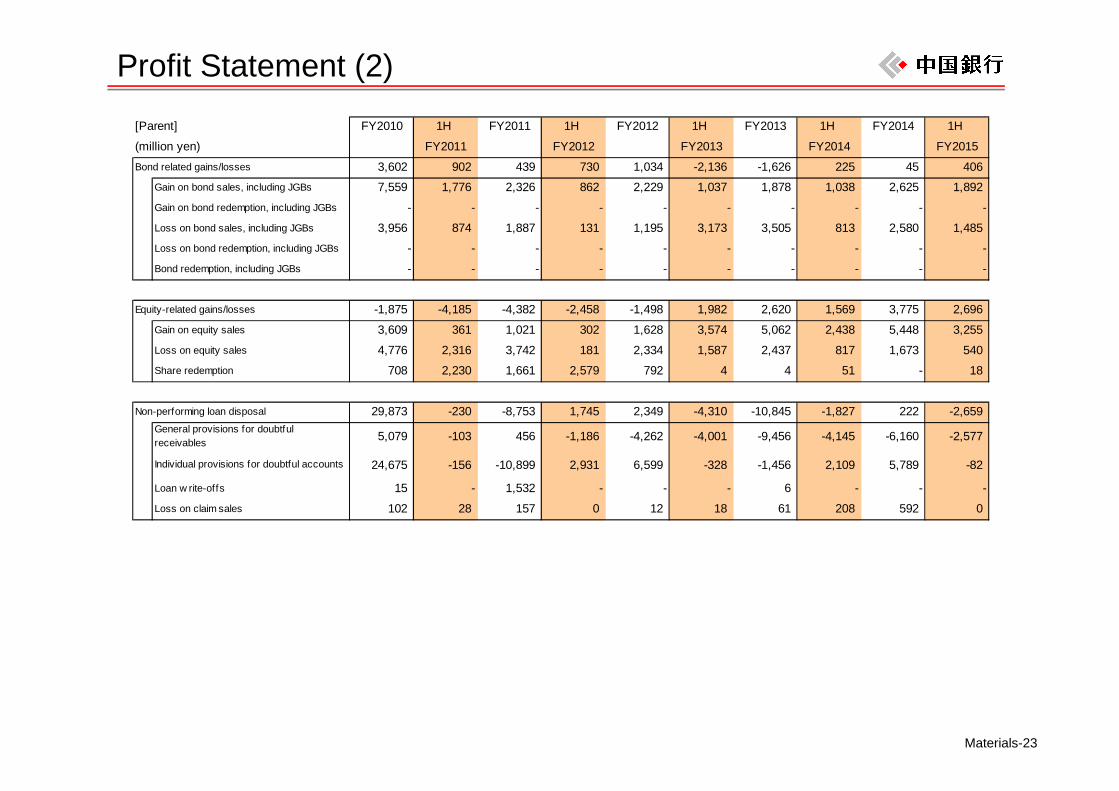
(million yen) FY2011 FY2012 FY2013 FY2014 FY2015Bond related gains/losses 3,602 902 439 730 1,034 -2,136 -1,626 225 45 406
7,559 1,776 2,326 862 2,229 1,037 1,878 1,038 2,625 1,892
- - - - - - - - - -
3,956 874 1,887 131 1,195 3,173 3,505 813 2,580 1,485
- - - - - - - - - -
- - - - - - - - - -
Equity-related gains/losses -1,875 -4,185 -4,382 -2,458 -1,498 1,982 2,620 1,569 3,775 2,696Gain on equity sales 3,609 361 1,021 302 1,628 3,574 5,062 2,438 5,448 3,255Loss on equity sales 4,776 2,316 3,742 181 2,334 1,587 2,437 817 1,673 540Share redemption 708 2,230 1,661 2,579 792 4 4 51 - 18
Non-performing loan disposal 29,873 -230 -8,753 1,745 2,349 -4,310 -10,845 -1,827 222 -2,659
5,079 -103 456 -1,186 -4,262 -4,001 -9,456 -4,145 -6,160 -2,577
24,675 -156 -10,899 2,931 6,599 -328 -1,456 2,109 5,789 -82
Loan w rite-offs 15 - 1,532 - - - 6 - - -Loss on claim sales 102 28 157 0 12 18 61 208 592 0
Individual provisions for doubtful accounts
Gain on bond sales, including JGBs
Gain on bond redemption, including JGBs
Loss on bond sales, including JGBs
Loss on bond redemption, including JGBs
Bond redemption, including JGBs
General provisions for doubtfulreceivables
Materials-24
Ordinary Revenue Breakdown
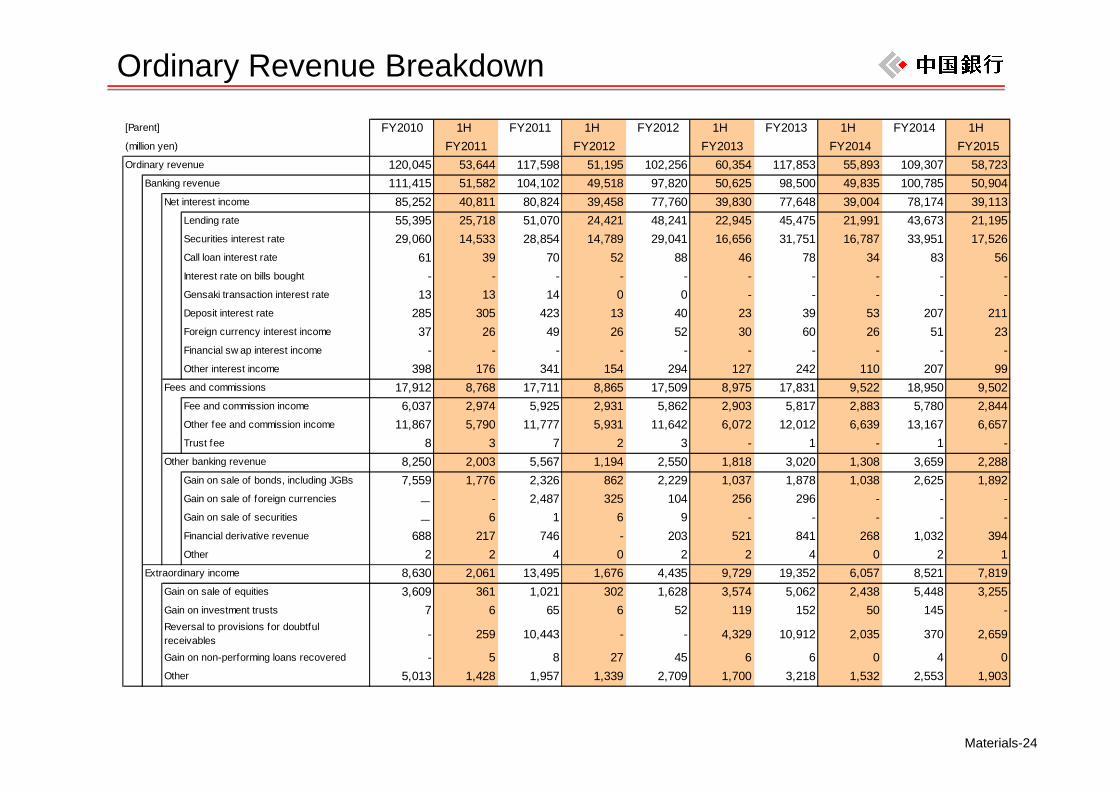
[Parent] FY2010 1H FY2011 1H FY2012 1H FY2013 1H FY2014 1H (million yen) FY2011 FY2012 FY2013 FY2014 FY2015Ordinary revenue 120,045 53,644 117,598 51,195 102,256 60,354 117,853 55,893 109,307 58,723
Banking revenue 111,415 51,582 104,102 49,518 97,820 50,625 98,500 49,835 100,785 50,904Net interest income 85,252 40,811 80,824 39,458 77,760 39,830 77,648 39,004 78,174 39,113
Lending rate 55,395 25,718 51,070 24,421 48,241 22,945 45,475 21,991 43,673 21,195Securities interest rate 29,060 14,533 28,854 14,789 29,041 16,656 31,751 16,787 33,951 17,526Call loan interest rate 61 39 70 52 88 46 78 34 83 56Interest rate on bills bought - - - - - - - - - -Gensaki transaction interest rate 13 13 14 0 0 - - - - -Deposit interest rate 285 305 423 13 40 23 39 53 207 211Foreign currency interest income 37 26 49 26 52 30 60 26 51 23Financial sw ap interest income - - - - - - - - - -Other interest income 398 176 341 154 294 127 242 110 207 99
Fees and commissions 17,912 8,768 17,711 8,865 17,509 8,975 17,831 9,522 18,950 9,502Fee and commission income 6,037 2,974 5,925 2,931 5,862 2,903 5,817 2,883 5,780 2,844Other fee and commission income 11,867 5,790 11,777 5,931 11,642 6,072 12,012 6,639 13,167 6,657Trust fee 8 3 7 2 3 - 1 - 1 -
Other banking revenue 8,250 2,003 5,567 1,194 2,550 1,818 3,020 1,308 3,659 2,288Gain on sale of bonds, including JGBs 7,559 1,776 2,326 862 2,229 1,037 1,878 1,038 2,625 1,892Gain on sale of foreign currencies - - 2,487 325 104 256 296 - - -Gain on sale of securities - 6 1 6 9 - - - - -Financial derivative revenue 688 217 746 - 203 521 841 268 1,032 394Other 2 2 4 0 2 2 4 0 2 1
Extraordinary income 8,630 2,061 13,495 1,676 4,435 9,729 19,352 6,057 8,521 7,8193,609 361 1,021 302 1,628 3,574 5,062 2,438 5,448 3,255
7 6 65 6 52 119 152 50 145 -
- 259 10,443 - - 4,329 10,912 2,035 370 2,659
- 5 8 27 45 6 6 0 4 05,013 1,428 1,957 1,339 2,709 1,700 3,218 1,532 2,553 1,903
Gain on sale of equities
Gain on investment trustsReversal to provisions for doubtfulreceivablesGain on non-performing loans recovered
Other
Materials-25
Ordinary Expense Breakdown
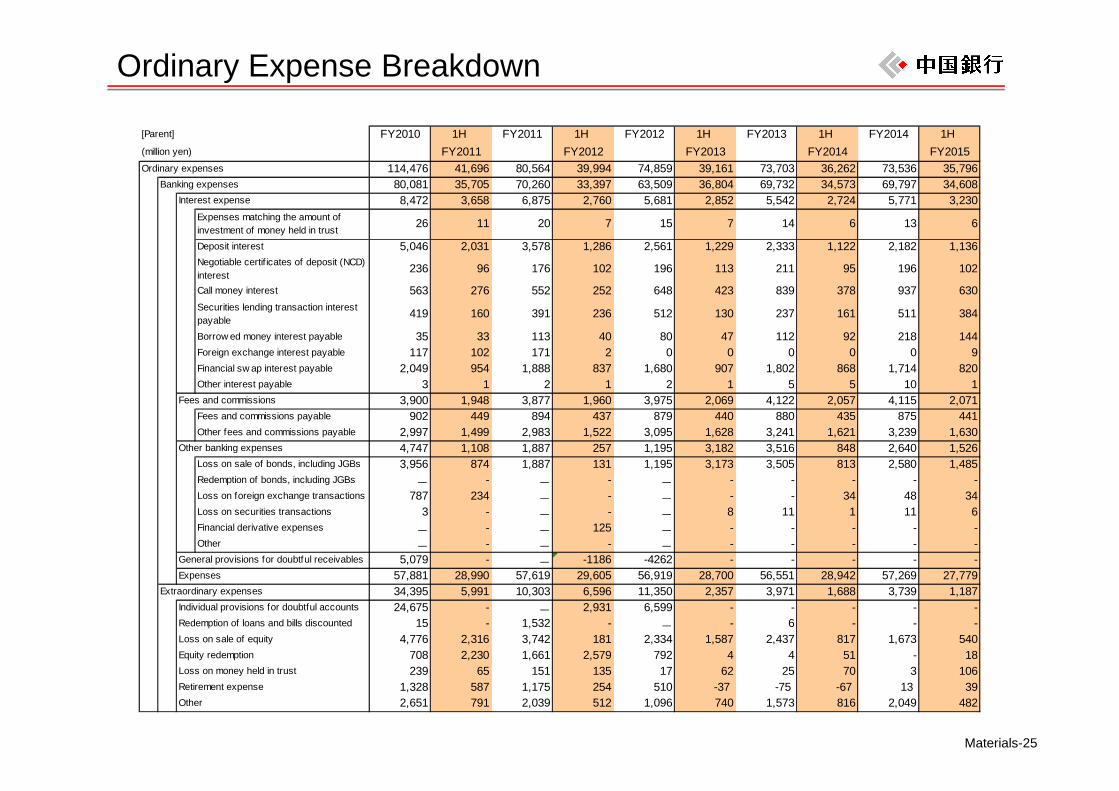
[Parent] FY2010 1H FY2011 1H FY2012 1H FY2013 1H FY2014 1H (million yen) FY2011 FY2012 FY2013 FY2014 FY2015Ordinary expenses 114,476 41,696 80,564 39,994 74,859 39,161 73,703 36,262 73,536 35,796
Banking expenses 80,081 35,705 70,260 33,397 63,509 36,804 69,732 34,573 69,797 34,608Interest expense 8,472 3,658 6,875 2,760 5,681 2,852 5,542 2,724 5,771 3,230
Expenses matching the amount ofinvestment of money held in trust 26 11 20 7 15 7 14 6 13 6
Deposit interest 5,046 2,031 3,578 1,286 2,561 1,229 2,333 1,122 2,182 1,136Negotiable certif icates of deposit (NCD)interest 236 96 176 102 196 113 211 95 196 102
Call money interest 563 276 552 252 648 423 839 378 937 630Securities lending transaction interestpayable 419 160 391 236 512 130 237 161 511 384
Borrow ed money interest payable 35 33 113 40 80 47 112 92 218 144Foreign exchange interest payable 117 102 171 2 0 0 0 0 0 9Financial sw ap interest payable 2,049 954 1,888 837 1,680 907 1,802 868 1,714 820Other interest payable 3 1 2 1 2 1 5 5 10 1
Fees and commissions 3,900 1,948 3,877 1,960 3,975 2,069 4,122 2,057 4,115 2,071Fees and commissions payable 902 449 894 437 879 440 880 435 875 441Other fees and commissions payable 2,997 1,499 2,983 1,522 3,095 1,628 3,241 1,621 3,239 1,630
Other banking expenses 4,747 1,108 1,887 257 1,195 3,182 3,516 848 2,640 1,526Loss on sale of bonds, including JGBs 3,956 874 1,887 131 1,195 3,173 3,505 813 2,580 1,485Redemption of bonds, including JGBs - - - - - - - - - -Loss on foreign exchange transactions 787 234 - - - - - 34 48 34Loss on securities transactions 3 - - - - 8 11 1 11 6Financial derivative expenses - - - 125 - - - - - -Other - - - - - - - - - -
5,079 - - -1186 -4262 - - - - -Expenses 57,881 28,990 57,619 29,605 56,919 28,700 56,551 28,942 57,269 27,779
Extraordinary expenses 34,395 5,991 10,303 6,596 11,350 2,357 3,971 1,688 3,739 1,18724,675 - - 2,931 6,599 - - - - -
15 - 1,532 - - - 6 - - -4,776 2,316 3,742 181 2,334 1,587 2,437 817 1,673 540
708 2,230 1,661 2,579 792 4 4 51 - 18239 65 151 135 17 62 25 70 3 106
1,328 587 1,175 254 510 -37 -75 -67 13 392,651 791 2,039 512 1,096 740 1,573 816 2,049 482Other
General provisions for doubtful receivables
Individual provisions for doubtful accountsRedemption of loans and bills discountedLoss on sale of equityEquity redemptionLoss on money held in trustRetirement expense
Materials-26
Expense Breakdown
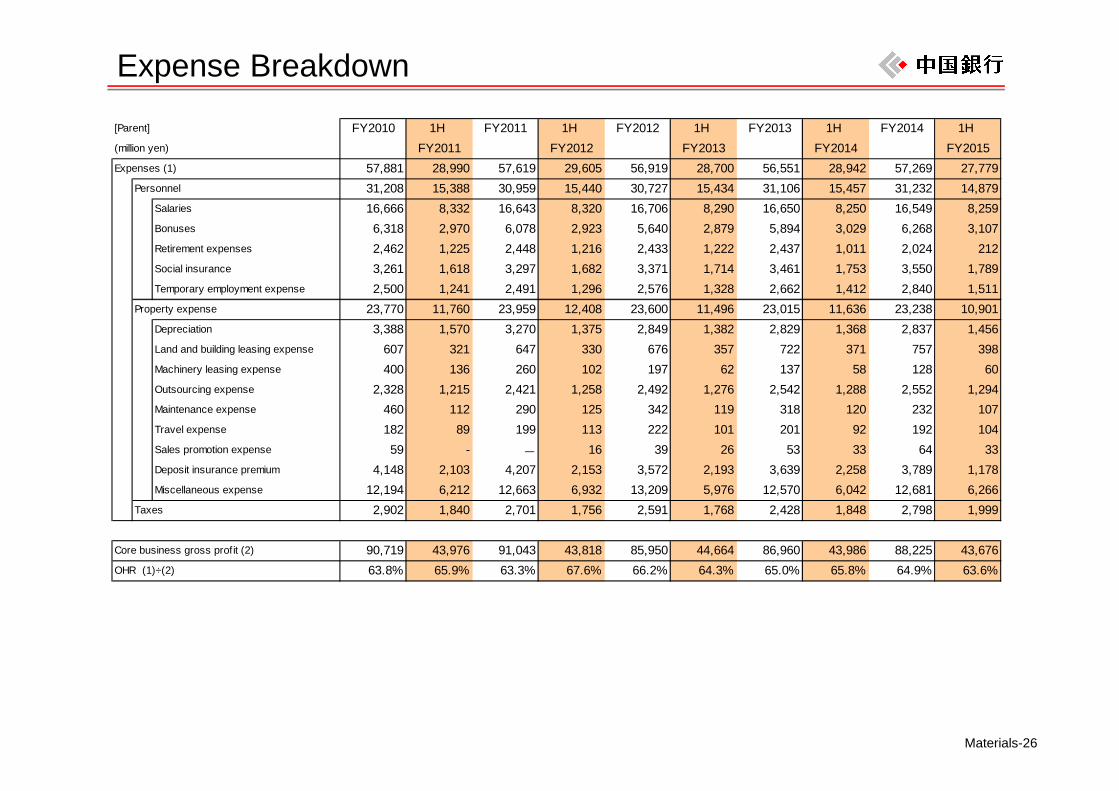
[Parent] FY2010 1H FY2011 1H FY2012 1H FY2013 1H FY2014 1H (million yen) FY2011 FY2012 FY2013 FY2014 FY2015Expenses (1) 57,881 28,990 57,619 29,605 56,919 28,700 56,551 28,942 57,269 27,779
Personnel 31,208 15,388 30,959 15,440 30,727 15,434 31,106 15,457 31,232 14,879Salaries 16,666 8,332 16,643 8,320 16,706 8,290 16,650 8,250 16,549 8,259Bonuses 6,318 2,970 6,078 2,923 5,640 2,879 5,894 3,029 6,268 3,107Retirement expenses 2,462 1,225 2,448 1,216 2,433 1,222 2,437 1,011 2,024 212Social insurance 3,261 1,618 3,297 1,682 3,371 1,714 3,461 1,753 3,550 1,789Temporary employment expense 2,500 1,241 2,491 1,296 2,576 1,328 2,662 1,412 2,840 1,511
Property expense 23,770 11,760 23,959 12,408 23,600 11,496 23,015 11,636 23,238 10,901Depreciation 3,388 1,570 3,270 1,375 2,849 1,382 2,829 1,368 2,837 1,456Land and building leasing expense 607 321 647 330 676 357 722 371 757 398Machinery leasing expense 400 136 260 102 197 62 137 58 128 60Outsourcing expense 2,328 1,215 2,421 1,258 2,492 1,276 2,542 1,288 2,552 1,294Maintenance expense 460 112 290 125 342 119 318 120 232 107Travel expense 182 89 199 113 222 101 201 92 192 104Sales promotion expense 59 - - 16 39 26 53 33 64 33Deposit insurance premium 4,148 2,103 4,207 2,153 3,572 2,193 3,639 2,258 3,789 1,178Miscellaneous expense 12,194 6,212 12,663 6,932 13,209 5,976 12,570 6,042 12,681 6,266
Taxes 2,902 1,840 2,701 1,756 2,591 1,768 2,428 1,848 2,798 1,999
Core business gross profit (2) 90,719 43,976 91,043 43,818 85,950 44,664 86,960 43,986 88,225 43,676OHR (1)÷(2) 63.8% 65.9% 63.3% 67.6% 66.2% 64.3% 65.0% 65.8% 64.9% 63.6%
Materials-27
Major YieldsFY2010 1H FY2011 1H FY2012 1H FY2013 1H FY2014 1H
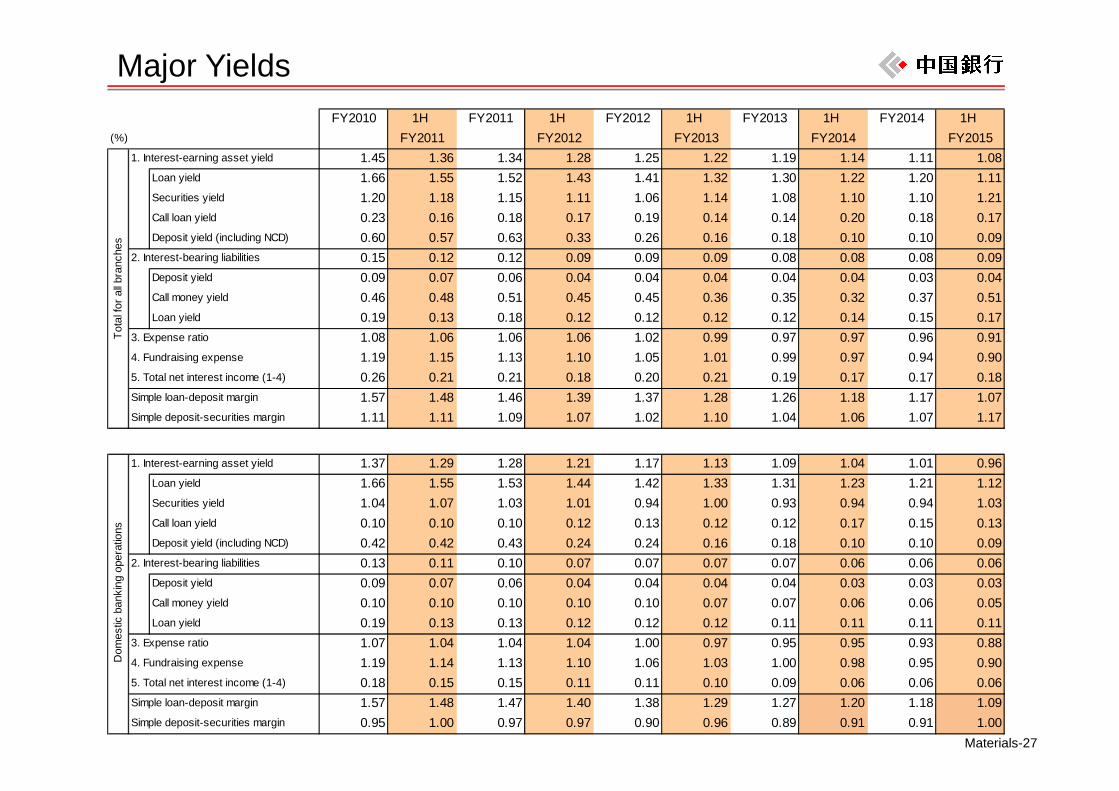
(%) FY2011 FY2012 FY2013 FY2014 FY20151. Interest-earning asset yield 1.45 1.36 1.34 1.28 1.25 1.22 1.19 1.14 1.11 1.08
Loan yield 1.66 1.55 1.52 1.43 1.41 1.32 1.30 1.22 1.20 1.11Securities yield 1.20 1.18 1.15 1.11 1.06 1.14 1.08 1.10 1.10 1.21Call loan yield 0.23 0.16 0.18 0.17 0.19 0.14 0.14 0.20 0.18 0.17Deposit yield (including NCD) 0.60 0.57 0.63 0.33 0.26 0.16 0.18 0.10 0.10 0.09
2. Interest-bearing liabilities 0.15 0.12 0.12 0.09 0.09 0.09 0.08 0.08 0.08 0.09Deposit yield 0.09 0.07 0.06 0.04 0.04 0.04 0.04 0.04 0.03 0.04Call money yield 0.46 0.48 0.51 0.45 0.45 0.36 0.35 0.32 0.37 0.51Loan yield 0.19 0.13 0.18 0.12 0.12 0.12 0.12 0.14 0.15 0.17
3. Expense ratio 1.08 1.06 1.06 1.06 1.02 0.99 0.97 0.97 0.96 0.914. Fundraising expense 1.19 1.15 1.13 1.10 1.05 1.01 0.99 0.97 0.94 0.905. Total net interest income (1-4) 0.26 0.21 0.21 0.18 0.20 0.21 0.19 0.17 0.17 0.18Simple loan-deposit margin 1.57 1.48 1.46 1.39 1.37 1.28 1.26 1.18 1.17 1.07Simple deposit-securities margin 1.11 1.11 1.09 1.07 1.02 1.10 1.04 1.06 1.07 1.17
1. Interest-earning asset yield 1.37 1.29 1.28 1.21 1.17 1.13 1.09 1.04 1.01 0.96Loan yield 1.66 1.55 1.53 1.44 1.42 1.33 1.31 1.23 1.21 1.12Securities yield 1.04 1.07 1.03 1.01 0.94 1.00 0.93 0.94 0.94 1.03Call loan yield 0.10 0.10 0.10 0.12 0.13 0.12 0.12 0.17 0.15 0.13Deposit yield (including NCD) 0.42 0.42 0.43 0.24 0.24 0.16 0.18 0.10 0.10 0.09
2. Interest-bearing liabilities 0.13 0.11 0.10 0.07 0.07 0.07 0.07 0.06 0.06 0.06Deposit yield 0.09 0.07 0.06 0.04 0.04 0.04 0.04 0.03 0.03 0.03Call money yield 0.10 0.10 0.10 0.10 0.10 0.07 0.07 0.06 0.06 0.05Loan yield 0.19 0.13 0.13 0.12 0.12 0.12 0.11 0.11 0.11 0.11
3. Expense ratio 1.07 1.04 1.04 1.04 1.00 0.97 0.95 0.95 0.93 0.884. Fundraising expense 1.19 1.14 1.13 1.10 1.06 1.03 1.00 0.98 0.95 0.905. Total net interest income (1-4) 0.18 0.15 0.15 0.11 0.11 0.10 0.09 0.06 0.06 0.06Simple loan-deposit margin 1.57 1.48 1.47 1.40 1.38 1.29 1.27 1.20 1.18 1.09Simple deposit-securities margin 0.95 1.00 0.97 0.97 0.90 0.96 0.89 0.91 0.91 1.00
Tota
l for
all b
ranc
hes
Dom
estic
ban
king
ope
ratio
ns
Materials-28
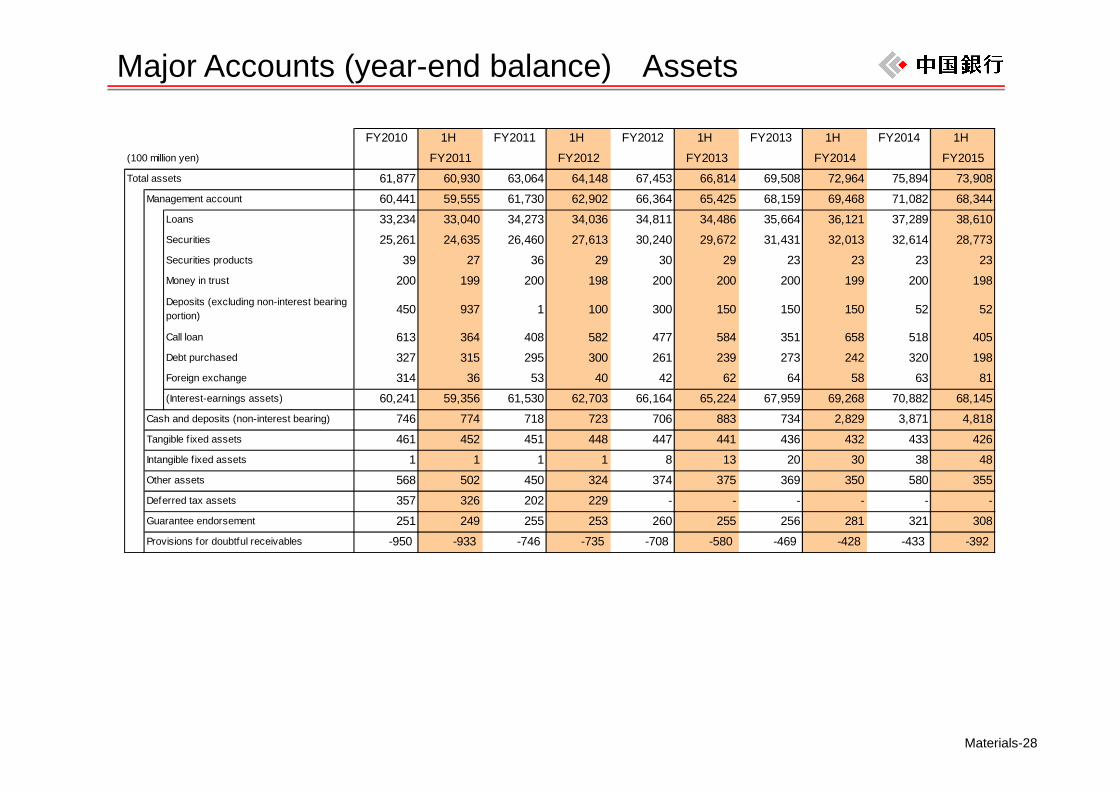
Major Accounts (year-end balance) Assets
FY2010 1H FY2011 1H FY2012 1H FY2013 1H FY2014 1H (100 million yen) FY2011 FY2012 FY2013 FY2014 FY2015Total assets 61,877 60,930 63,064 64,148 67,453 66,814 69,508 72,964 75,894 73,908
Management account 60,441 59,555 61,730 62,902 66,364 65,425 68,159 69,468 71,082 68,344Loans 33,234 33,040 34,273 34,036 34,811 34,486 35,664 36,121 37,289 38,610Securities 25,261 24,635 26,460 27,613 30,240 29,672 31,431 32,013 32,614 28,773Securities products 39 27 36 29 30 29 23 23 23 23Money in trust 200 199 200 198 200 200 200 199 200 198
Deposits (excluding non-interest bearingportion) 450 937 1 100 300 150 150 150 52 52
Call loan 613 364 408 582 477 584 351 658 518 405Debt purchased 327 315 295 300 261 239 273 242 320 198Foreign exchange 314 36 53 40 42 62 64 58 63 81(Interest-earnings assets) 60,241 59,356 61,530 62,703 66,164 65,224 67,959 69,268 70,882 68,145
Cash and deposits (non-interest bearing) 746 774 718 723 706 883 734 2,829 3,871 4,818Tangible fixed assets 461 452 451 448 447 441 436 432 433 426Intangible fixed assets 1 1 1 1 8 13 20 30 38 48Other assets 568 502 450 324 374 375 369 350 580 355Deferred tax assets 357 326 202 229 - - - - - -Guarantee endorsement 251 249 255 253 260 255 256 281 321 308Provisions for doubtful receivables -950 -933 -746 -735 -708 -580 -469 -428 -433 -392
Materials-29
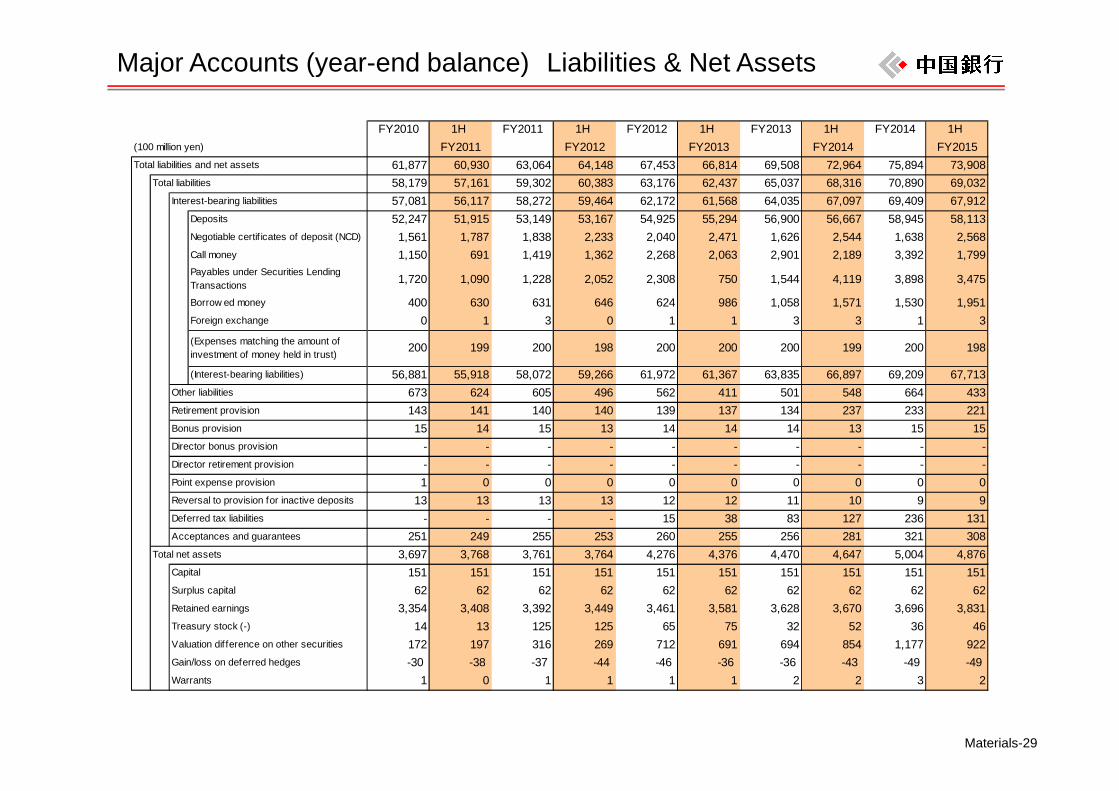
Major Accounts (year-end balance) Liabilities & Net Assets
FY2010 1H FY2011 1H FY2012 1H FY2013 1H FY2014 1H (100 million yen) FY2011 FY2012 FY2013 FY2014 FY2015Total liabilities and net assets 61,877 60,930 63,064 64,148 67,453 66,814 69,508 72,964 75,894 73,908
Total liabilities 58,179 57,161 59,302 60,383 63,176 62,437 65,037 68,316 70,890 69,032Interest-bearing liabilities 57,081 56,117 58,272 59,464 62,172 61,568 64,035 67,097 69,409 67,912
Deposits 52,247 51,915 53,149 53,167 54,925 55,294 56,900 56,667 58,945 58,113Negotiable certif icates of deposit (NCD) 1,561 1,787 1,838 2,233 2,040 2,471 1,626 2,544 1,638 2,568Call money 1,150 691 1,419 1,362 2,268 2,063 2,901 2,189 3,392 1,799Payables under Securities LendingTransactions 1,720 1,090 1,228 2,052 2,308 750 1,544 4,119 3,898 3,475
Borrow ed money 400 630 631 646 624 986 1,058 1,571 1,530 1,951Foreign exchange 0 1 3 0 1 1 3 3 1 3
(Expenses matching the amount ofinvestment of money held in trust) 200 199 200 198 200 200 200 199 200 198
(Interest-bearing liabilities) 56,881 55,918 58,072 59,266 61,972 61,367 63,835 66,897 69,209 67,713Other liabilities 673 624 605 496 562 411 501 548 664 433Retirement provision 143 141 140 140 139 137 134 237 233 221Bonus provision 15 14 15 13 14 14 14 13 15 15Director bonus provision - - - - - - - - - -Director retirement provision - - - - - - - - - -Point expense provision 1 0 0 0 0 0 0 0 0 0Reversal to provision for inactive deposits 13 13 13 13 12 12 11 10 9 9Deferred tax liabilities - - - - 15 38 83 127 236 131Acceptances and guarantees 251 249 255 253 260 255 256 281 321 308
Total net assets 3,697 3,768 3,761 3,764 4,276 4,376 4,470 4,647 5,004 4,876Capital 151 151 151 151 151 151 151 151 151 151Surplus capital 62 62 62 62 62 62 62 62 62 62Retained earnings 3,354 3,408 3,392 3,449 3,461 3,581 3,628 3,670 3,696 3,831Treasury stock (-) 14 13 125 125 65 75 32 52 36 46
172 197 316 269 712 691 694 854 1,177 922-30 -38 -37 -44 -46 -36 -36 -43 -49 -49
1 0 1 1 1 1 2 2 3 2
Valuation dif ference on other securities
Gain/loss on deferred hedges
Warrants
Materials-30
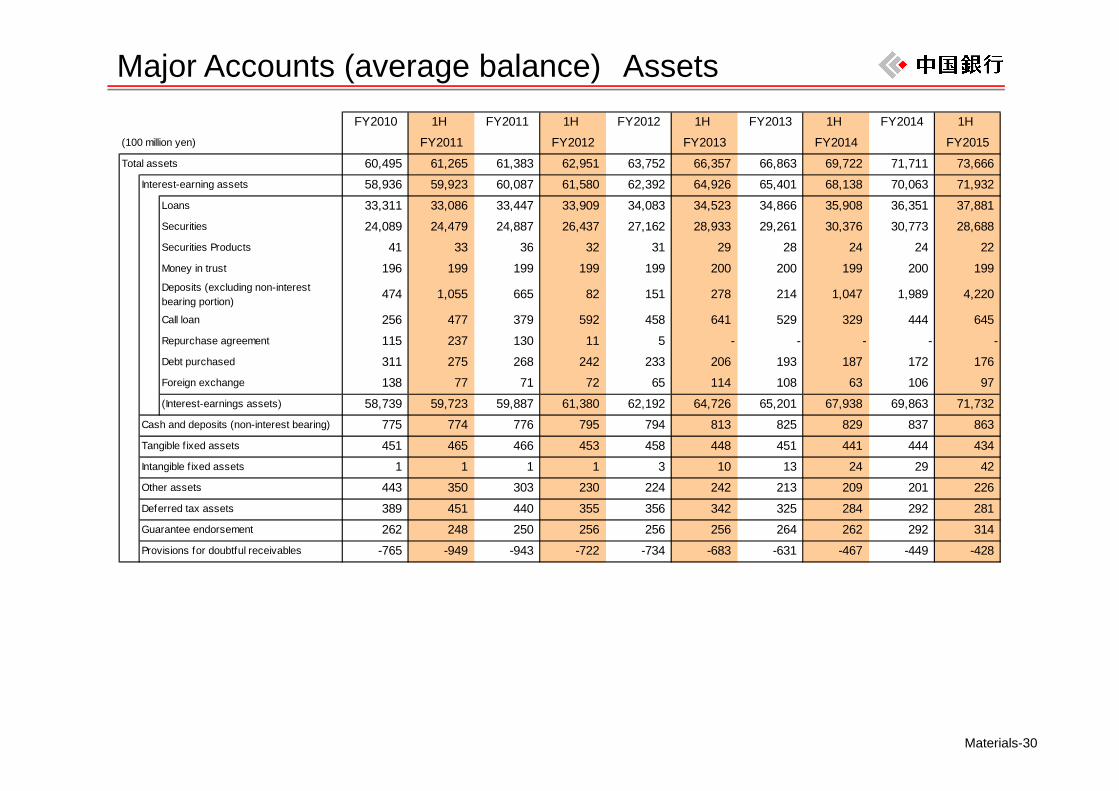
Major Accounts (average balance) AssetsFY2010 1H FY2011 1H FY2012 1H FY2013 1H FY2014 1H
(100 million yen) FY2011 FY2012 FY2013 FY2014 FY2015Total assets 60,495 61,265 61,383 62,951 63,752 66,357 66,863 69,722 71,711 73,666
Interest-earning assets 58,936 59,923 60,087 61,580 62,392 64,926 65,401 68,138 70,063 71,932Loans 33,311 33,086 33,447 33,909 34,083 34,523 34,866 35,908 36,351 37,881Securities 24,089 24,479 24,887 26,437 27,162 28,933 29,261 30,376 30,773 28,688Securities Products 41 33 36 32 31 29 28 24 24 22Money in trust 196 199 199 199 199 200 200 199 200 199Deposits (excluding non-interestbearing portion)
474 1,055 665 82 151 278 214 1,047 1,989 4,220
Call loan 256 477 379 592 458 641 529 329 444 645Repurchase agreement 115 237 130 11 5 - - - - -Debt purchased 311 275 268 242 233 206 193 187 172 176Foreign exchange 138 77 71 72 65 114 108 63 106 97(Interest-earnings assets) 58,739 59,723 59,887 61,380 62,192 64,726 65,201 67,938 69,863 71,732
775 774 776 795 794 813 825 829 837 863Tangible f ixed assets 451 465 466 453 458 448 451 441 444 434Intangible f ixed assets 1 1 1 1 3 10 13 24 29 42Other assets 443 350 303 230 224 242 213 209 201 226Deferred tax assets 389 451 440 355 356 342 325 284 292 281Guarantee endorsement 262 248 250 256 256 256 264 262 292 314
-765 -949 -943 -722 -734 -683 -631 -467 -449 -428
Cash and deposits (non-interest bearing)
Provisions for doubtful receivables
Materials-31
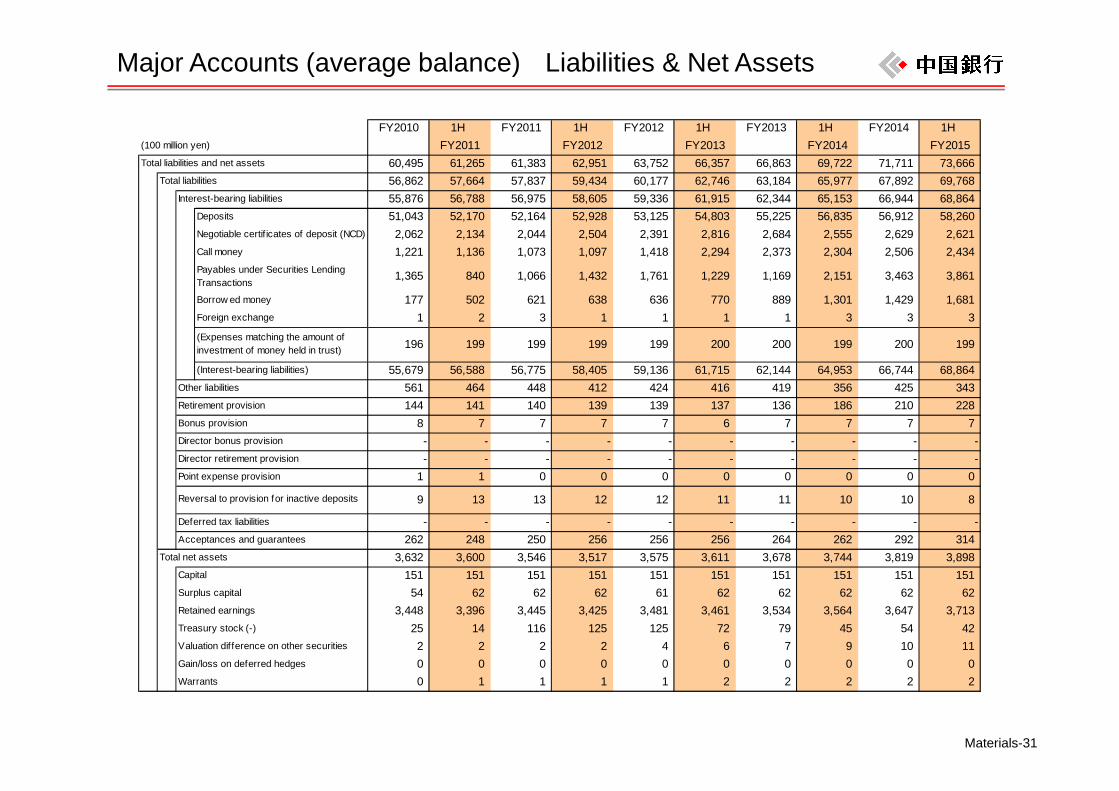
Major Accounts (average balance) Liabilities & Net Assets
FY2010 1H FY2011 1H FY2012 1H FY2013 1H FY2014 1H (100 million yen) FY2011 FY2012 FY2013 FY2014 FY2015Total liabilities and net assets 60,495 61,265 61,383 62,951 63,752 66,357 66,863 69,722 71,711 73,666
Total liabilities 56,862 57,664 57,837 59,434 60,177 62,746 63,184 65,977 67,892 69,768Interest-bearing liabilities 55,876 56,788 56,975 58,605 59,336 61,915 62,344 65,153 66,944 68,864
Deposits 51,043 52,170 52,164 52,928 53,125 54,803 55,225 56,835 56,912 58,260Negotiable certif icates of deposit (NCD) 2,062 2,134 2,044 2,504 2,391 2,816 2,684 2,555 2,629 2,621Call money 1,221 1,136 1,073 1,097 1,418 2,294 2,373 2,304 2,506 2,434Payables under Securities LendingTransactions 1,365 840 1,066 1,432 1,761 1,229 1,169 2,151 3,463 3,861
Borrow ed money 177 502 621 638 636 770 889 1,301 1,429 1,681Foreign exchange 1 2 3 1 1 1 1 3 3 3(Expenses matching the amount ofinvestment of money held in trust) 196 199 199 199 199 200 200 199 200 199
(Interest-bearing liabilities) 55,679 56,588 56,775 58,405 59,136 61,715 62,144 64,953 66,744 68,864Other liabilities 561 464 448 412 424 416 419 356 425 343Retirement provision 144 141 140 139 139 137 136 186 210 228Bonus provision 8 7 7 7 7 6 7 7 7 7Director bonus provision - - - - - - - - - -Director retirement provision - - - - - - - - - -Point expense provision 1 1 0 0 0 0 0 0 0 0
9 13 13 12 12 11 11 10 10 8
Deferred tax liabilities - - - - - - - - - -Acceptances and guarantees 262 248 250 256 256 256 264 262 292 314
Total net assets 3,632 3,600 3,546 3,517 3,575 3,611 3,678 3,744 3,819 3,898Capital 151 151 151 151 151 151 151 151 151 151Surplus capital 54 62 62 62 61 62 62 62 62 62Retained earnings 3,448 3,396 3,445 3,425 3,481 3,461 3,534 3,564 3,647 3,713Treasury stock (-) 25 14 116 125 125 72 79 45 54 42
2 2 2 2 4 6 7 9 10 11Gain/loss on deferred hedges 0 0 0 0 0 0 0 0 0 0Warrants 0 1 1 1 1 2 2 2 2 2
Valuation difference on other securities
Reversal to provision for inactive deposits
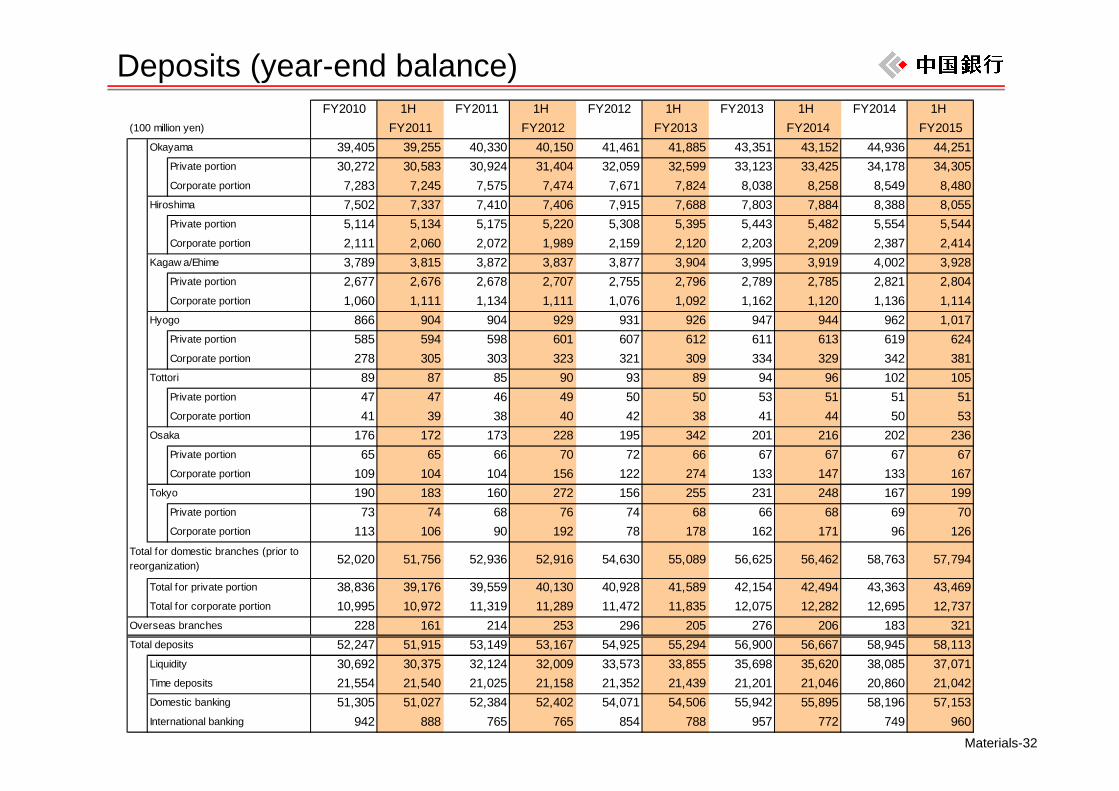
Materials-32
Deposits (year-end balance)FY2010 1H FY2011 1H FY2012 1H FY2013 1H FY2014 1H
(100 million yen) FY2011 FY2012 FY2013 FY2014 FY2015Okayama 39,405 39,255 40,330 40,150 41,461 41,885 43,351 43,152 44,936 44,251
Private portion 30,272 30,583 30,924 31,404 32,059 32,599 33,123 33,425 34,178 34,305Corporate portion 7,283 7,245 7,575 7,474 7,671 7,824 8,038 8,258 8,549 8,480
Hiroshima 7,502 7,337 7,410 7,406 7,915 7,688 7,803 7,884 8,388 8,055Private portion 5,114 5,134 5,175 5,220 5,308 5,395 5,443 5,482 5,554 5,544Corporate portion 2,111 2,060 2,072 1,989 2,159 2,120 2,203 2,209 2,387 2,414
Kagaw a/Ehime 3,789 3,815 3,872 3,837 3,877 3,904 3,995 3,919 4,002 3,928Private portion 2,677 2,676 2,678 2,707 2,755 2,796 2,789 2,785 2,821 2,804Corporate portion 1,060 1,111 1,134 1,111 1,076 1,092 1,162 1,120 1,136 1,114
Hyogo 866 904 904 929 931 926 947 944 962 1,017Private portion 585 594 598 601 607 612 611 613 619 624Corporate portion 278 305 303 323 321 309 334 329 342 381
Tottori 89 87 85 90 93 89 94 96 102 105Private portion 47 47 46 49 50 50 53 51 51 51Corporate portion 41 39 38 40 42 38 41 44 50 53
Osaka 176 172 173 228 195 342 201 216 202 236Private portion 65 65 66 70 72 66 67 67 67 67Corporate portion 109 104 104 156 122 274 133 147 133 167
Tokyo 190 183 160 272 156 255 231 248 167 199Private portion 73 74 68 76 74 68 66 68 69 70Corporate portion 113 106 90 192 78 178 162 171 96 126
52,020 51,756 52,936 52,916 54,630 55,089 56,625 56,462 58,763 57,794
Total for private portion 38,836 39,176 39,559 40,130 40,928 41,589 42,154 42,494 43,363 43,469Total for corporate portion 10,995 10,972 11,319 11,289 11,472 11,835 12,075 12,282 12,695 12,737
Overseas branches 228 161 214 253 296 205 276 206 183 321Total deposits 52,247 51,915 53,149 53,167 54,925 55,294 56,900 56,667 58,945 58,113
Liquidity 30,692 30,375 32,124 32,009 33,573 33,855 35,698 35,620 38,085 37,071Time deposits 21,554 21,540 21,025 21,158 21,352 21,439 21,201 21,046 20,860 21,042Domestic banking 51,305 51,027 52,384 52,402 54,071 54,506 55,942 55,895 58,196 57,153International banking 942 888 765 765 854 788 957 772 749 960
Total for domestic branches (prior toreorganization)
Materials-33
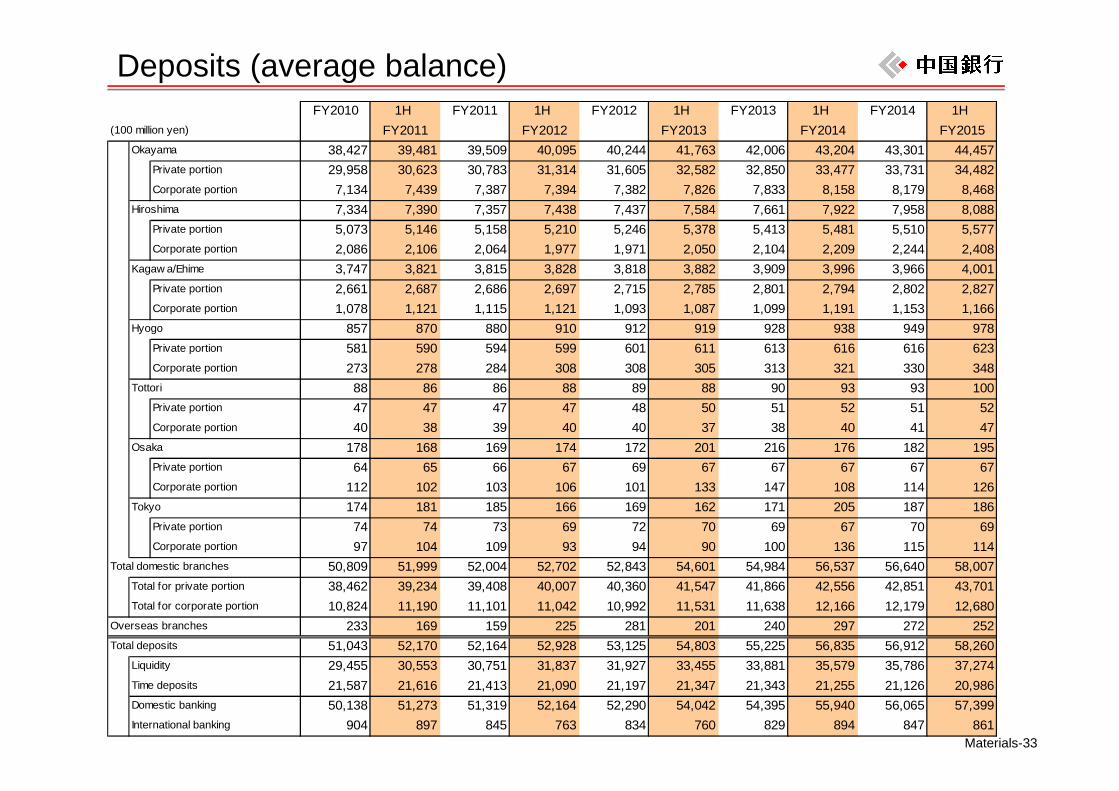
Deposits (average balance)FY2010 1H FY2011 1H FY2012 1H FY2013 1H FY2014 1H
(100 million yen) FY2011 FY2012 FY2013 FY2014 FY2015Okayama 38,427 39,481 39,509 40,095 40,244 41,763 42,006 43,204 43,301 44,457
Private portion 29,958 30,623 30,783 31,314 31,605 32,582 32,850 33,477 33,731 34,482Corporate portion 7,134 7,439 7,387 7,394 7,382 7,826 7,833 8,158 8,179 8,468
Hiroshima 7,334 7,390 7,357 7,438 7,437 7,584 7,661 7,922 7,958 8,088Private portion 5,073 5,146 5,158 5,210 5,246 5,378 5,413 5,481 5,510 5,577Corporate portion 2,086 2,106 2,064 1,977 1,971 2,050 2,104 2,209 2,244 2,408
Kagaw a/Ehime 3,747 3,821 3,815 3,828 3,818 3,882 3,909 3,996 3,966 4,001Private portion 2,661 2,687 2,686 2,697 2,715 2,785 2,801 2,794 2,802 2,827Corporate portion 1,078 1,121 1,115 1,121 1,093 1,087 1,099 1,191 1,153 1,166
Hyogo 857 870 880 910 912 919 928 938 949 978Private portion 581 590 594 599 601 611 613 616 616 623Corporate portion 273 278 284 308 308 305 313 321 330 348
Tottori 88 86 86 88 89 88 90 93 93 100Private portion 47 47 47 47 48 50 51 52 51 52Corporate portion 40 38 39 40 40 37 38 40 41 47
Osaka 178 168 169 174 172 201 216 176 182 195Private portion 64 65 66 67 69 67 67 67 67 67Corporate portion 112 102 103 106 101 133 147 108 114 126
Tokyo 174 181 185 166 169 162 171 205 187 186Private portion 74 74 73 69 72 70 69 67 70 69Corporate portion 97 104 109 93 94 90 100 136 115 114
50,809 51,999 52,004 52,702 52,843 54,601 54,984 56,537 56,640 58,007Total for private portion 38,462 39,234 39,408 40,007 40,360 41,547 41,866 42,556 42,851 43,701Total for corporate portion 10,824 11,190 11,101 11,042 10,992 11,531 11,638 12,166 12,179 12,680
Overseas branches 233 169 159 225 281 201 240 297 272 252Total deposits 51,043 52,170 52,164 52,928 53,125 54,803 55,225 56,835 56,912 58,260
Liquidity 29,455 30,553 30,751 31,837 31,927 33,455 33,881 35,579 35,786 37,274Time deposits 21,587 21,616 21,413 21,090 21,197 21,347 21,343 21,255 21,126 20,986Domestic banking 50,138 51,273 51,319 52,164 52,290 54,042 54,395 55,940 56,065 57,399International banking 904 897 845 763 834 760 829 894 847 861
Total domestic branches
Materials-34
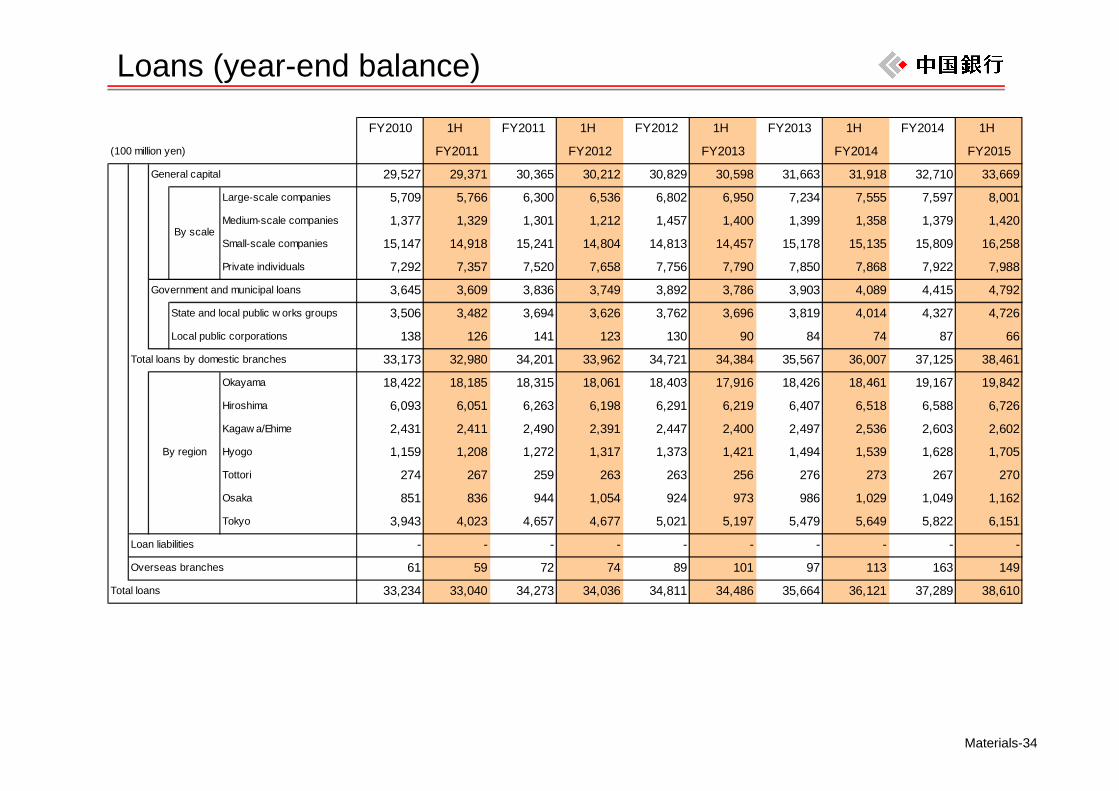
Loans (year-end balance)
FY2010 1H FY2011 1H FY2012 1H FY2013 1H FY2014 1H
(100 million yen) FY2011 FY2012 FY2013 FY2014 FY2015
General capital 29,527 29,371 30,365 30,212 30,829 30,598 31,663 31,918 32,710 33,669
5,709 5,766 6,300 6,536 6,802 6,950 7,234 7,555 7,597 8,001
Medium-scale companies 1,377 1,329 1,301 1,212 1,457 1,400 1,399 1,358 1,379 1,420
Small-scale companies 15,147 14,918 15,241 14,804 14,813 14,457 15,178 15,135 15,809 16,258
Private individuals 7,292 7,357 7,520 7,658 7,756 7,790 7,850 7,868 7,922 7,988
Government and municipal loans 3,645 3,609 3,836 3,749 3,892 3,786 3,903 4,089 4,415 4,792
State and local public w orks groups 3,506 3,482 3,694 3,626 3,762 3,696 3,819 4,014 4,327 4,726
Local public corporations 138 126 141 123 130 90 84 74 87 66
Total loans by domestic branches 33,173 32,980 34,201 33,962 34,721 34,384 35,567 36,007 37,125 38,461
Okayama 18,422 18,185 18,315 18,061 18,403 17,916 18,426 18,461 19,167 19,842
Hiroshima 6,093 6,051 6,263 6,198 6,291 6,219 6,407 6,518 6,588 6,726
Kagaw a/Ehime 2,431 2,411 2,490 2,391 2,447 2,400 2,497 2,536 2,603 2,602
Hyogo 1,159 1,208 1,272 1,317 1,373 1,421 1,494 1,539 1,628 1,705
Tottori 274 267 259 263 263 256 276 273 267 270
Osaka 851 836 944 1,054 924 973 986 1,029 1,049 1,162
Tokyo 3,943 4,023 4,657 4,677 5,021 5,197 5,479 5,649 5,822 6,151
Loan liabilities - - - - - - - - - -
Overseas branches 61 59 72 74 89 101 97 113 163 149
Total loans 33,234 33,040 34,273 34,036 34,811 34,486 35,664 36,121 37,289 38,610
By scale
By region
Large-scale companies
Materials-35
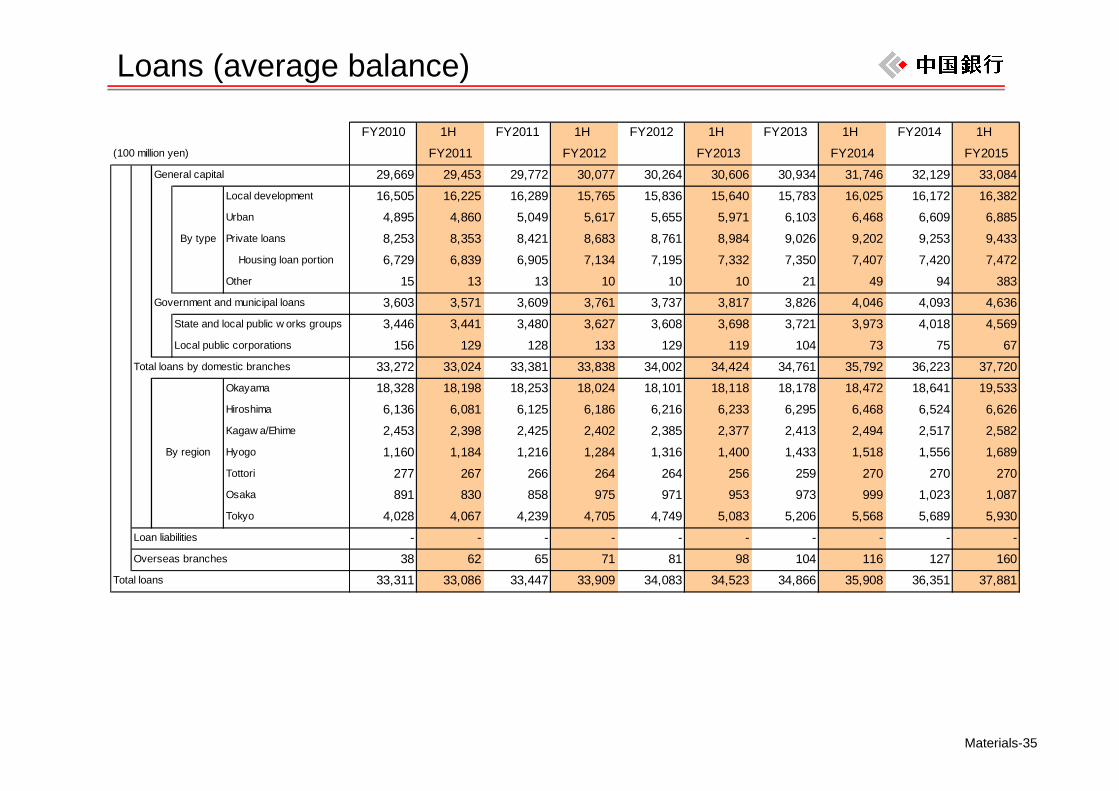
Loans (average balance)
FY2010 1H FY2011 1H FY2012 1H FY2013 1H FY2014 1H (100 million yen) FY2011 FY2012 FY2013 FY2014 FY2015
General capital 29,669 29,453 29,772 30,077 30,264 30,606 30,934 31,746 32,129 33,084Local development 16,505 16,225 16,289 15,765 15,836 15,640 15,783 16,025 16,172 16,382Urban 4,895 4,860 5,049 5,617 5,655 5,971 6,103 6,468 6,609 6,885Private loans 8,253 8,353 8,421 8,683 8,761 8,984 9,026 9,202 9,253 9,433
Housing loan portion 6,729 6,839 6,905 7,134 7,195 7,332 7,350 7,407 7,420 7,472Other 15 13 13 10 10 10 21 49 94 383
Government and municipal loans 3,603 3,571 3,609 3,761 3,737 3,817 3,826 4,046 4,093 4,636State and local public w orks groups 3,446 3,441 3,480 3,627 3,608 3,698 3,721 3,973 4,018 4,569Local public corporations 156 129 128 133 129 119 104 73 75 67
Total loans by domestic branches 33,272 33,024 33,381 33,838 34,002 34,424 34,761 35,792 36,223 37,720Okayama 18,328 18,198 18,253 18,024 18,101 18,118 18,178 18,472 18,641 19,533Hiroshima 6,136 6,081 6,125 6,186 6,216 6,233 6,295 6,468 6,524 6,626Kagaw a/Ehime 2,453 2,398 2,425 2,402 2,385 2,377 2,413 2,494 2,517 2,582Hyogo 1,160 1,184 1,216 1,284 1,316 1,400 1,433 1,518 1,556 1,689Tottori 277 267 266 264 264 256 259 270 270 270Osaka 891 830 858 975 971 953 973 999 1,023 1,087Tokyo 4,028 4,067 4,239 4,705 4,749 5,083 5,206 5,568 5,689 5,930
Loan liabilities - - - - - - - - - -Overseas branches 38 62 65 71 81 98 104 116 127 160
Total loans 33,311 33,086 33,447 33,909 34,083 34,523 34,866 35,908 36,351 37,881
By region
By type
Materials-36
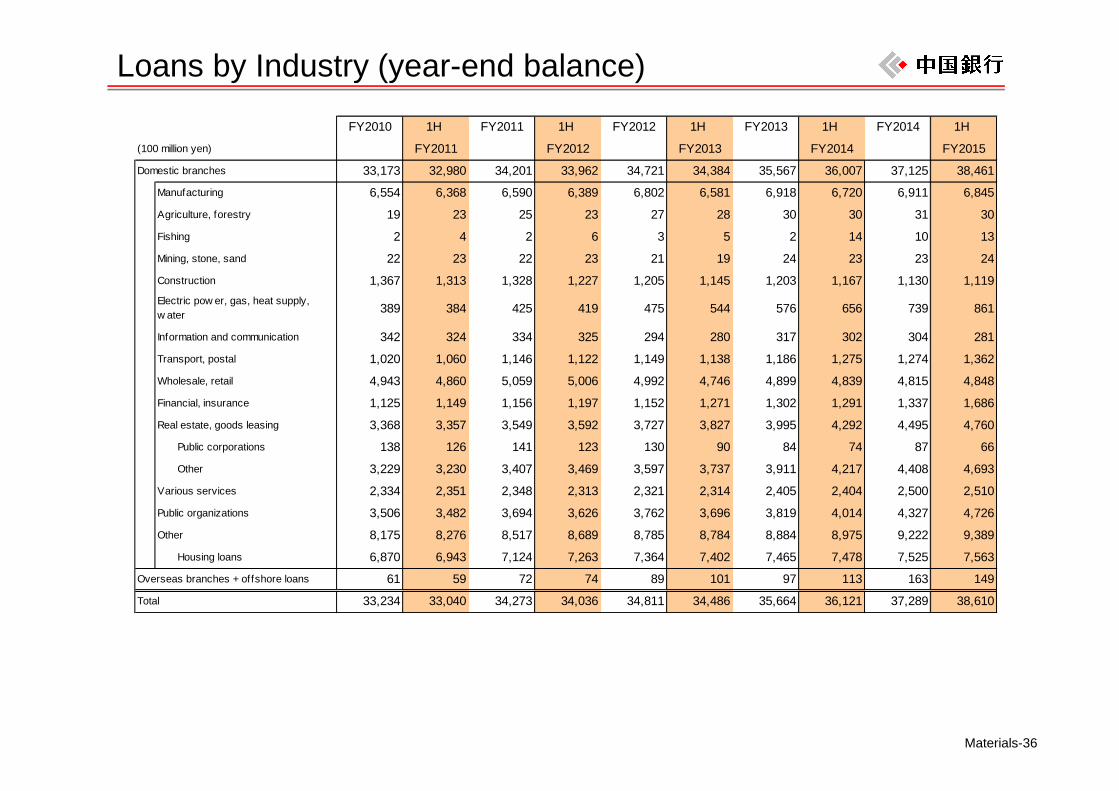
Loans by Industry (year-end balance)
FY2010 1H FY2011 1H FY2012 1H FY2013 1H FY2014 1H
(100 million yen) FY2011 FY2012 FY2013 FY2014 FY2015
Domestic branches 33,173 32,980 34,201 33,962 34,721 34,384 35,567 36,007 37,125 38,461
Manufacturing 6,554 6,368 6,590 6,389 6,802 6,581 6,918 6,720 6,911 6,845
Agriculture, forestry 19 23 25 23 27 28 30 30 31 30
Fishing 2 4 2 6 3 5 2 14 10 13
Mining, stone, sand 22 23 22 23 21 19 24 23 23 24
Construction 1,367 1,313 1,328 1,227 1,205 1,145 1,203 1,167 1,130 1,119
389 384 425 419 475 544 576 656 739 861
Information and communication 342 324 334 325 294 280 317 302 304 281
Transport, postal 1,020 1,060 1,146 1,122 1,149 1,138 1,186 1,275 1,274 1,362
Wholesale, retail 4,943 4,860 5,059 5,006 4,992 4,746 4,899 4,839 4,815 4,848
Financial, insurance 1,125 1,149 1,156 1,197 1,152 1,271 1,302 1,291 1,337 1,686
Real estate, goods leasing 3,368 3,357 3,549 3,592 3,727 3,827 3,995 4,292 4,495 4,760
Public corporations 138 126 141 123 130 90 84 74 87 66
Other 3,229 3,230 3,407 3,469 3,597 3,737 3,911 4,217 4,408 4,693
Various services 2,334 2,351 2,348 2,313 2,321 2,314 2,405 2,404 2,500 2,510
Public organizations 3,506 3,482 3,694 3,626 3,762 3,696 3,819 4,014 4,327 4,726
Other 8,175 8,276 8,517 8,689 8,785 8,784 8,884 8,975 9,222 9,389
Housing loans 6,870 6,943 7,124 7,263 7,364 7,402 7,465 7,478 7,525 7,563
Overseas branches + offshore loans 61 59 72 74 89 101 97 113 163 149
Total 33,234 33,040 34,273 34,036 34,811 34,486 35,664 36,121 37,289 38,610
Electric pow er, gas, heat supply,w ater
Materials-37
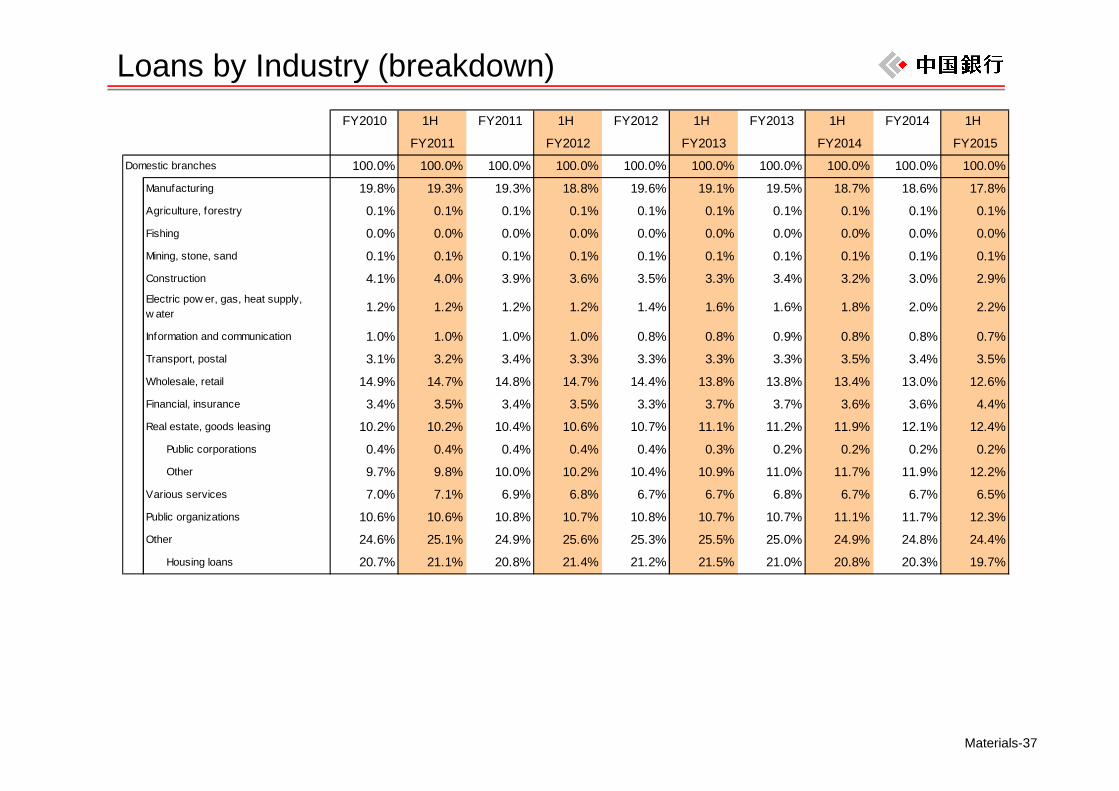
Loans by Industry (breakdown)FY2010 1H FY2011 1H FY2012 1H FY2013 1H FY2014 1H
FY2011 FY2012 FY2013 FY2014 FY2015
Domestic branches 100.0% 100.0% 100.0% 100.0% 100.0% 100.0% 100.0% 100.0% 100.0% 100.0%
Manufacturing 19.8% 19.3% 19.3% 18.8% 19.6% 19.1% 19.5% 18.7% 18.6% 17.8%
Agriculture, forestry 0.1% 0.1% 0.1% 0.1% 0.1% 0.1% 0.1% 0.1% 0.1% 0.1%
Fishing 0.0% 0.0% 0.0% 0.0% 0.0% 0.0% 0.0% 0.0% 0.0% 0.0%
Mining, stone, sand 0.1% 0.1% 0.1% 0.1% 0.1% 0.1% 0.1% 0.1% 0.1% 0.1%
Construction 4.1% 4.0% 3.9% 3.6% 3.5% 3.3% 3.4% 3.2% 3.0% 2.9%
1.2% 1.2% 1.2% 1.2% 1.4% 1.6% 1.6% 1.8% 2.0% 2.2%
Information and communication 1.0% 1.0% 1.0% 1.0% 0.8% 0.8% 0.9% 0.8% 0.8% 0.7%
Transport, postal 3.1% 3.2% 3.4% 3.3% 3.3% 3.3% 3.3% 3.5% 3.4% 3.5%
Wholesale, retail 14.9% 14.7% 14.8% 14.7% 14.4% 13.8% 13.8% 13.4% 13.0% 12.6%
Financial, insurance 3.4% 3.5% 3.4% 3.5% 3.3% 3.7% 3.7% 3.6% 3.6% 4.4%
Real estate, goods leasing 10.2% 10.2% 10.4% 10.6% 10.7% 11.1% 11.2% 11.9% 12.1% 12.4%
Public corporations 0.4% 0.4% 0.4% 0.4% 0.4% 0.3% 0.2% 0.2% 0.2% 0.2%
Other 9.7% 9.8% 10.0% 10.2% 10.4% 10.9% 11.0% 11.7% 11.9% 12.2%
Various services 7.0% 7.1% 6.9% 6.8% 6.7% 6.7% 6.8% 6.7% 6.7% 6.5%
Public organizations 10.6% 10.6% 10.8% 10.7% 10.8% 10.7% 10.7% 11.1% 11.7% 12.3%
Other 24.6% 25.1% 24.9% 25.6% 25.3% 25.5% 25.0% 24.9% 24.8% 24.4%
Housing loans 20.7% 21.1% 20.8% 21.4% 21.2% 21.5% 21.0% 20.8% 20.3% 19.7%
Electric pow er, gas, heat supply,w ater
Materials-38
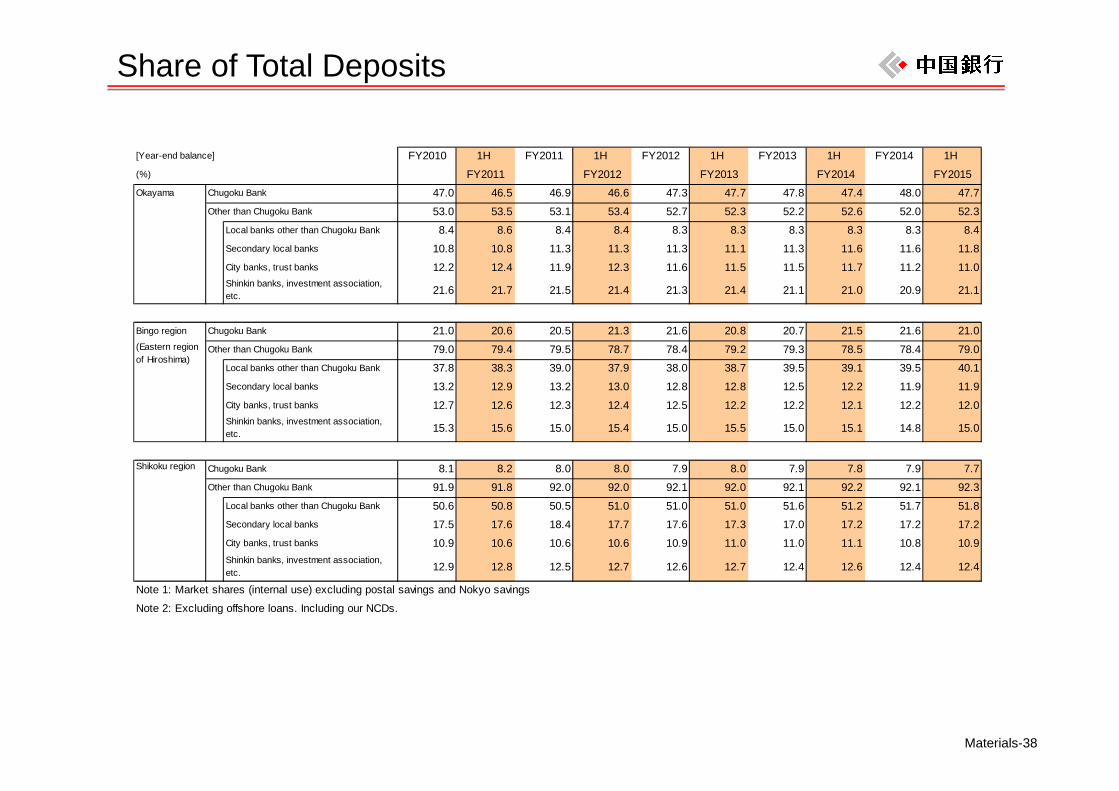
Share of Total Deposits
[Year-end balance] FY2010 1H FY2011 1H FY2012 1H FY2013 1H FY2014 1H (%) FY2011 FY2012 FY2013 FY2014 FY2015Okayama Chugoku Bank 47.0 46.5 46.9 46.6 47.3 47.7 47.8 47.4 48.0 47.7
Other than Chugoku Bank 53.0 53.5 53.1 53.4 52.7 52.3 52.2 52.6 52.0 52.3Local banks other than Chugoku Bank 8.4 8.6 8.4 8.4 8.3 8.3 8.3 8.3 8.3 8.4Secondary local banks 10.8 10.8 11.3 11.3 11.3 11.1 11.3 11.6 11.6 11.8City banks, trust banks 12.2 12.4 11.9 12.3 11.6 11.5 11.5 11.7 11.2 11.0Shinkin banks, investment association,etc. 21.6 21.7 21.5 21.4 21.3 21.4 21.1 21.0 20.9 21.1
Bingo region Chugoku Bank 21.0 20.6 20.5 21.3 21.6 20.8 20.7 21.5 21.6 21.0Other than Chugoku Bank 79.0 79.4 79.5 78.7 78.4 79.2 79.3 78.5 78.4 79.0
Local banks other than Chugoku Bank 37.8 38.3 39.0 37.9 38.0 38.7 39.5 39.1 39.5 40.1Secondary local banks 13.2 12.9 13.2 13.0 12.8 12.8 12.5 12.2 11.9 11.9City banks, trust banks 12.7 12.6 12.3 12.4 12.5 12.2 12.2 12.1 12.2 12.0Shinkin banks, investment association,etc. 15.3 15.6 15.0 15.4 15.0 15.5 15.0 15.1 14.8 15.0
Chugoku Bank 8.1 8.2 8.0 8.0 7.9 8.0 7.9 7.8 7.9 7.7Other than Chugoku Bank 91.9 91.8 92.0 92.0 92.1 92.0 92.1 92.2 92.1 92.3
Local banks other than Chugoku Bank 50.6 50.8 50.5 51.0 51.0 51.0 51.6 51.2 51.7 51.8Secondary local banks 17.5 17.6 18.4 17.7 17.6 17.3 17.0 17.2 17.2 17.2City banks, trust banks 10.9 10.6 10.6 10.6 10.9 11.0 11.0 11.1 10.8 10.9Shinkin banks, investment association,etc. 12.9 12.8 12.5 12.7 12.6 12.7 12.4 12.6 12.4 12.4
Note 1: Market shares (internal use) excluding postal savings and Nokyo savings
Note 2: Excluding offshore loans. Including our NCDs.
(Eastern regionof Hiroshima)
Shikoku region
Materials-39
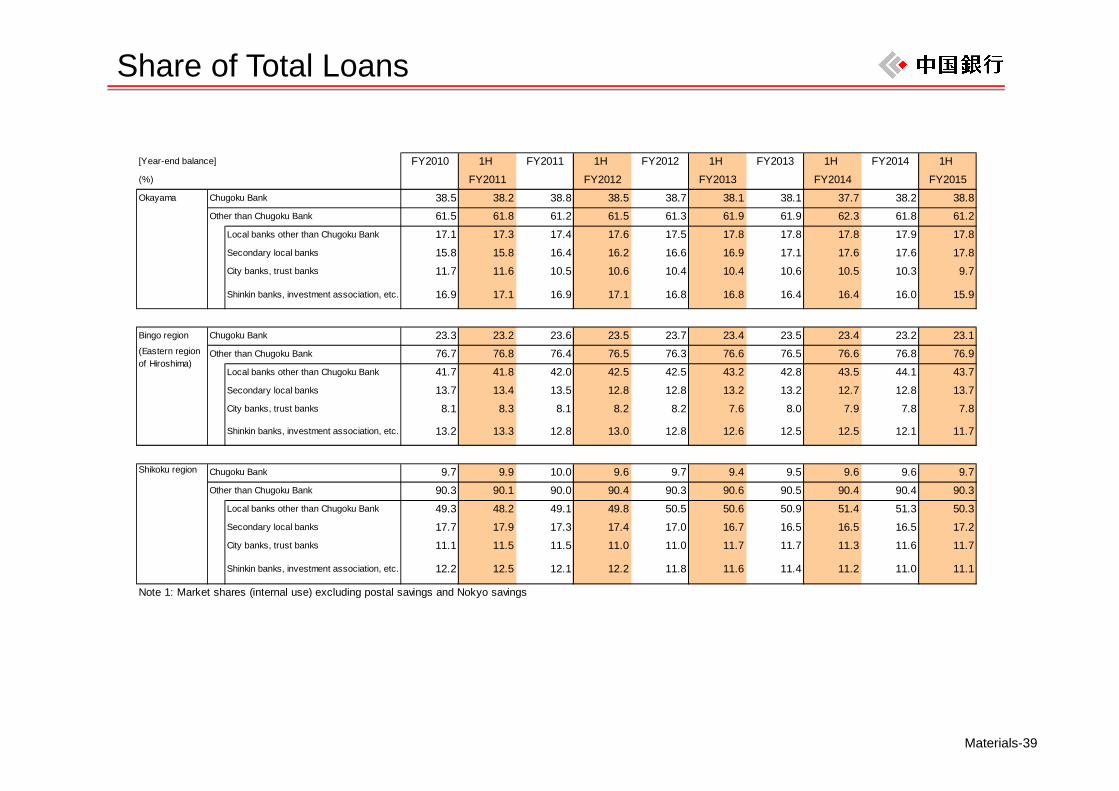
Share of Total Loans
[Year-end balance] FY2010 1H FY2011 1H FY2012 1H FY2013 1H FY2014 1H (%) FY2011 FY2012 FY2013 FY2014 FY2015Okayama Chugoku Bank 38.5 38.2 38.8 38.5 38.7 38.1 38.1 37.7 38.2 38.8
Other than Chugoku Bank 61.5 61.8 61.2 61.5 61.3 61.9 61.9 62.3 61.8 61.2Local banks other than Chugoku Bank 17.1 17.3 17.4 17.6 17.5 17.8 17.8 17.8 17.9 17.8Secondary local banks 15.8 15.8 16.4 16.2 16.6 16.9 17.1 17.6 17.6 17.8City banks, trust banks 11.7 11.6 10.5 10.6 10.4 10.4 10.6 10.5 10.3 9.7
Shinkin banks, investment association, etc. 16.9 17.1 16.9 17.1 16.8 16.8 16.4 16.4 16.0 15.9
Bingo region Chugoku Bank 23.3 23.2 23.6 23.5 23.7 23.4 23.5 23.4 23.2 23.1Other than Chugoku Bank 76.7 76.8 76.4 76.5 76.3 76.6 76.5 76.6 76.8 76.9
Local banks other than Chugoku Bank 41.7 41.8 42.0 42.5 42.5 43.2 42.8 43.5 44.1 43.7Secondary local banks 13.7 13.4 13.5 12.8 12.8 13.2 13.2 12.7 12.8 13.7City banks, trust banks 8.1 8.3 8.1 8.2 8.2 7.6 8.0 7.9 7.8 7.8
Shinkin banks, investment association, etc. 13.2 13.3 12.8 13.0 12.8 12.6 12.5 12.5 12.1 11.7
Chugoku Bank 9.7 9.9 10.0 9.6 9.7 9.4 9.5 9.6 9.6 9.7Other than Chugoku Bank 90.3 90.1 90.0 90.4 90.3 90.6 90.5 90.4 90.4 90.3
Local banks other than Chugoku Bank 49.3 48.2 49.1 49.8 50.5 50.6 50.9 51.4 51.3 50.3Secondary local banks 17.7 17.9 17.3 17.4 17.0 16.7 16.5 16.5 16.5 17.2City banks, trust banks 11.1 11.5 11.5 11.0 11.0 11.7 11.7 11.3 11.6 11.7
Shinkin banks, investment association, etc. 12.2 12.5 12.1 12.2 11.8 11.6 11.4 11.2 11.0 11.1
Note 1: Market shares (internal use) excluding postal savings and Nokyo savings
(Eastern regionof Hiroshima)
Shikoku region
Materials-40
Securities
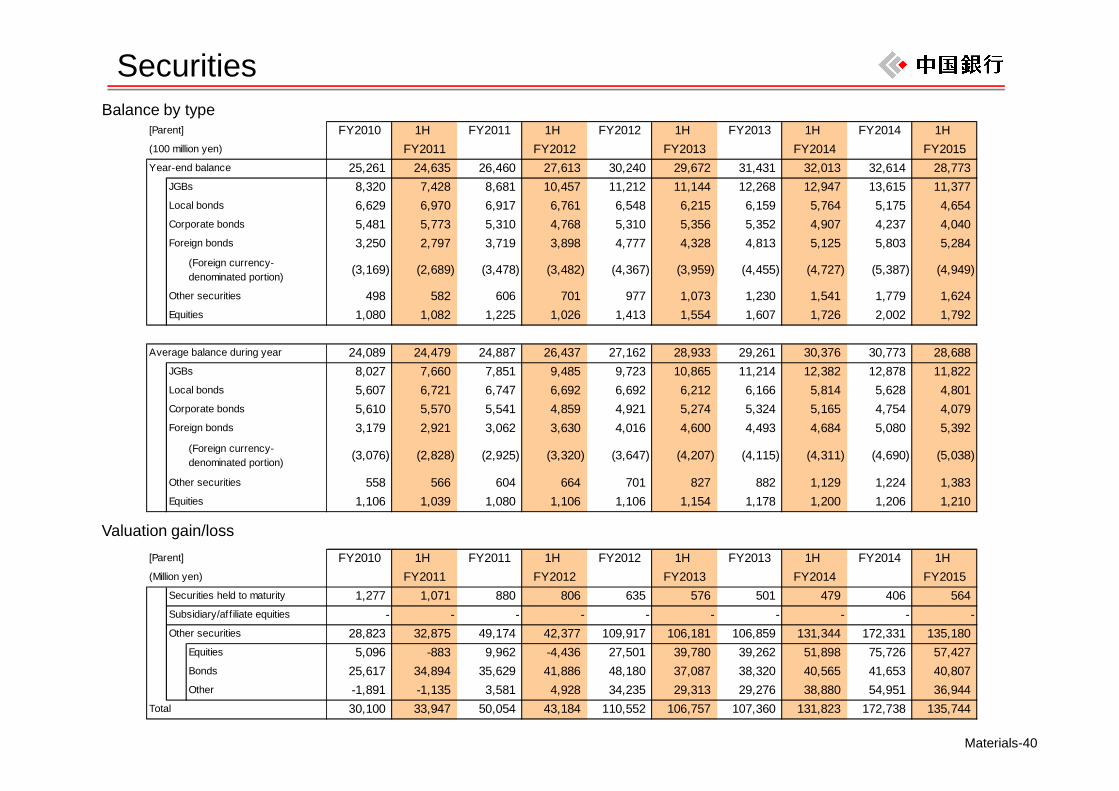
[Parent] FY2010 1H FY2011 1H FY2012 1H FY2013 1H FY2014 1H (100 million yen) FY2011 FY2012 FY2013 FY2014 FY2015Year-end balance 25,261 24,635 26,460 27,613 30,240 29,672 31,431 32,013 32,614 28,773
JGBs 8,320 7,428 8,681 10,457 11,212 11,144 12,268 12,947 13,615 11,377Local bonds 6,629 6,970 6,917 6,761 6,548 6,215 6,159 5,764 5,175 4,654Corporate bonds 5,481 5,773 5,310 4,768 5,310 5,356 5,352 4,907 4,237 4,040Foreign bonds 3,250 2,797 3,719 3,898 4,777 4,328 4,813 5,125 5,803 5,284
(Foreign currency-denominated portion) (3,169) (2,689) (3,478) (3,482) (4,367) (3,959) (4,455) (4,727) (5,387) (4,949)
Other securities 498 582 606 701 977 1,073 1,230 1,541 1,779 1,624Equities 1,080 1,082 1,225 1,026 1,413 1,554 1,607 1,726 2,002 1,792
Average balance during year 24,089 24,479 24,887 26,437 27,162 28,933 29,261 30,376 30,773 28,688JGBs 8,027 7,660 7,851 9,485 9,723 10,865 11,214 12,382 12,878 11,822Local bonds 5,607 6,721 6,747 6,692 6,692 6,212 6,166 5,814 5,628 4,801Corporate bonds 5,610 5,570 5,541 4,859 4,921 5,274 5,324 5,165 4,754 4,079Foreign bonds 3,179 2,921 3,062 3,630 4,016 4,600 4,493 4,684 5,080 5,392
(Foreign currency-denominated portion) (3,076) (2,828) (2,925) (3,320) (3,647) (4,207) (4,115) (4,311) (4,690) (5,038)
Other securities 558 566 604 664 701 827 882 1,129 1,224 1,383Equities 1,106 1,039 1,080 1,106 1,106 1,154 1,178 1,200 1,206 1,210
[Parent] FY2010 1H FY2011 1H FY2012 1H FY2013 1H FY2014 1H (Million yen) FY2011 FY2012 FY2013 FY2014 FY2015
Securities held to maturity 1,277 1,071 880 806 635 576 501 479 406 564Subsidiary/affiliate equities - - - - - - - - - -Other securities 28,823 32,875 49,174 42,377 109,917 106,181 106,859 131,344 172,331 135,180
Equities 5,096 -883 9,962 -4,436 27,501 39,780 39,262 51,898 75,726 57,427Bonds 25,617 34,894 35,629 41,886 48,180 37,087 38,320 40,565 41,653 40,807Other -1,891 -1,135 3,581 4,928 34,235 29,313 29,276 38,880 54,951 36,944
Total 30,100 33,947 50,054 43,184 110,552 106,757 107,360 131,823 172,738 135,744
Balance by type
Valuation gain/loss
Materials-41
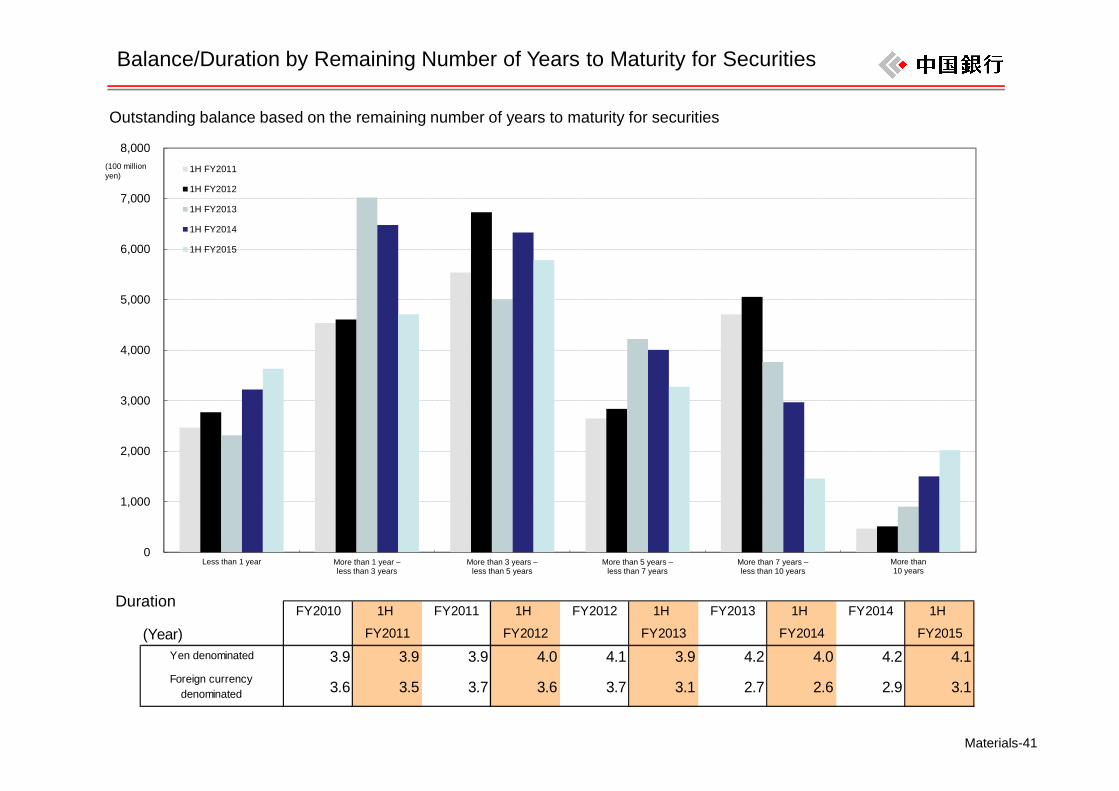
Balance/Duration by Remaining Number of Years to Maturity for Securities
0
1,000
2,000
3,000
4,000
5,000
6,000
7,000
8,000
Less than 1 year More than 1 year –less than 3 years
More than 3 years –less than 5 years
More than 5 years –less than 7 years
More than 7 years –less than 10 years
More than10 years
1H FY2011
1H FY2012
1H FY2013
1H FY2014
1H FY2015
FY2010 1H FY2011 1H FY2012 1H FY2013 1H FY2014 1H
(Year) FY2011 FY2012 FY2013 FY2014 FY2015Yen denominated 3.9 3.9 3.9 4.0 4.1 3.9 4.2 4.0 4.2 4.1Foreign currency
denominated 3.6 3.5 3.7 3.6 3.7 3.1 2.7 2.6 2.9 3.1
Outstanding balance based on the remaining number of years to maturity for securities
Duration
(100 million yen)
Materials-42
0
20
40
60
80
100
120
140
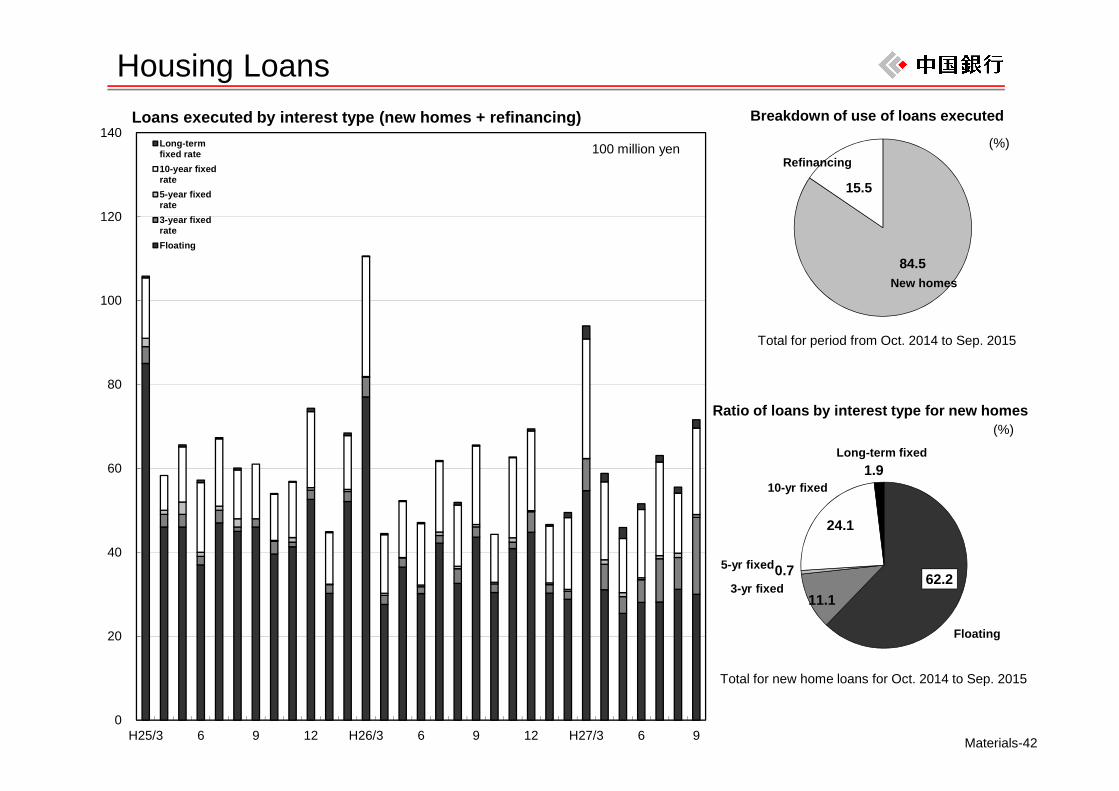
H25/3 6 9 12 H26/3 6 9 12 H27/3 6 9
Long-termfixed rate10-year fixedrate5-year fixedrate3-year fixedrateFloating
100 million yen
Loans executed by interest type (new homes + refinancing)
Total for new home loans for Oct. 2014 to Sep. 2015
62.2 11.1
0.7
24.1
1.9
Ratio of loans by interest type for new homes
3-yr fixed
Long-term fixed
(%)
5-yr fixed
10-yr fixed
Floating
84.5
15.5
Breakdown of use of loans executed
New homes
(%)Refinancing
Housing Loans
Total for period from Oct. 2014 to Sep. 2015
Materials-43
[Parent]
(million yen, %)
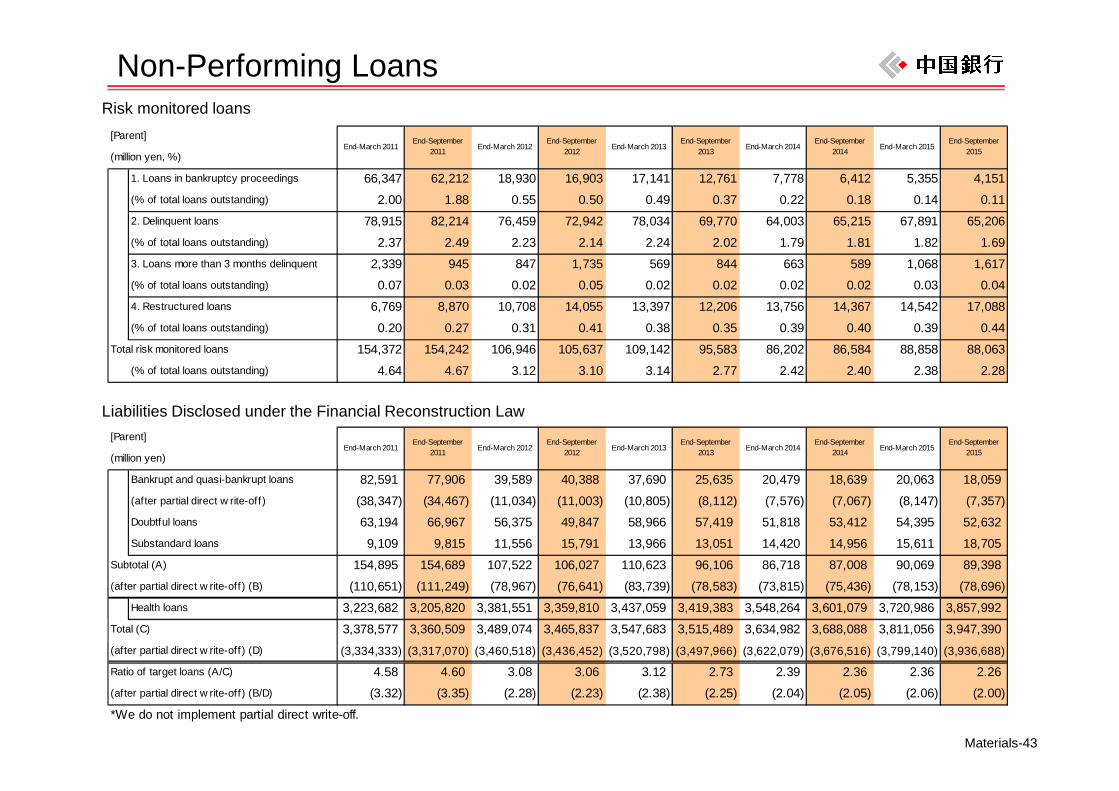
1. Loans in bankruptcy proceedings 66,347 62,212 18,930 16,903 17,141 12,761 7,778 6,412 5,355 4,151(% of total loans outstanding) 2.00 1.88 0.55 0.50 0.49 0.37 0.22 0.18 0.14 0.112. Delinquent loans 78,915 82,214 76,459 72,942 78,034 69,770 64,003 65,215 67,891 65,206(% of total loans outstanding) 2.37 2.49 2.23 2.14 2.24 2.02 1.79 1.81 1.82 1.693. Loans more than 3 months delinquent 2,339 945 847 1,735 569 844 663 589 1,068 1,617(% of total loans outstanding) 0.07 0.03 0.02 0.05 0.02 0.02 0.02 0.02 0.03 0.044. Restructured loans 6,769 8,870 10,708 14,055 13,397 12,206 13,756 14,367 14,542 17,088(% of total loans outstanding) 0.20 0.27 0.31 0.41 0.38 0.35 0.39 0.40 0.39 0.44
Total risk monitored loans 154,372 154,242 106,946 105,637 109,142 95,583 86,202 86,584 88,858 88,063(% of total loans outstanding) 4.64 4.67 3.12 3.10 3.14 2.77 2.42 2.40 2.38 2.28
[Parent]
(million yen)
Bankrupt and quasi-bankrupt loans 82,591 77,906 39,589 40,388 37,690 25,635 20,479 18,639 20,063 18,059(after partial direct w rite-off) (38,347) (34,467) (11,034) (11,003) (10,805) (8,112) (7,576) (7,067) (8,147) (7,357)Doubtful loans 63,194 66,967 56,375 49,847 58,966 57,419 51,818 53,412 54,395 52,632Substandard loans 9,109 9,815 11,556 15,791 13,966 13,051 14,420 14,956 15,611 18,705
Subtotal (A) 154,895 154,689 107,522 106,027 110,623 96,106 86,718 87,008 90,069 89,398(after partial direct w rite-off) (B) (110,651) (111,249) (78,967) (76,641) (83,739) (78,583) (73,815) (75,436) (78,153) (78,696)
Health loans 3,223,682 3,205,820 3,381,551 3,359,810 3,437,059 3,419,383 3,548,264 3,601,079 3,720,986 3,857,992Total (C) 3,378,577 3,360,509 3,489,074 3,465,837 3,547,683 3,515,489 3,634,982 3,688,088 3,811,056 3,947,390(after partial direct w rite-off) (D) (3,334,333) (3,317,070) (3,460,518) (3,436,452) (3,520,798) (3,497,966) (3,622,079) (3,676,516) (3,799,140) (3,936,688)
Ratio of target loans (A/C) 4.58 4.60 3.08 3.06 3.12 2.73 2.39 2.36 2.36 2.26(after partial direct w rite-off) (B/D) (3.32) (3.35) (2.28) (2.23) (2.38) (2.25) (2.04) (2.05) (2.06) (2.00)
*We do not implement partial direct write-off.
End-March 2014End-September
2014 End-March 2015End-September
2015
End-March 2014End-September
2014 End-March 2015End-September
2015
End-March 2011End-September
2011 End-March 2012End-September
2012 End-March 2013End-September
2013
End-March 2011End-September
2011 End-March 2012End-September
2012 End-March 2013End-September
2013
Non-Performing LoansRisk monitored loans
Liabilities Disclosed under the Financial Reconstruction Law
Materials-44
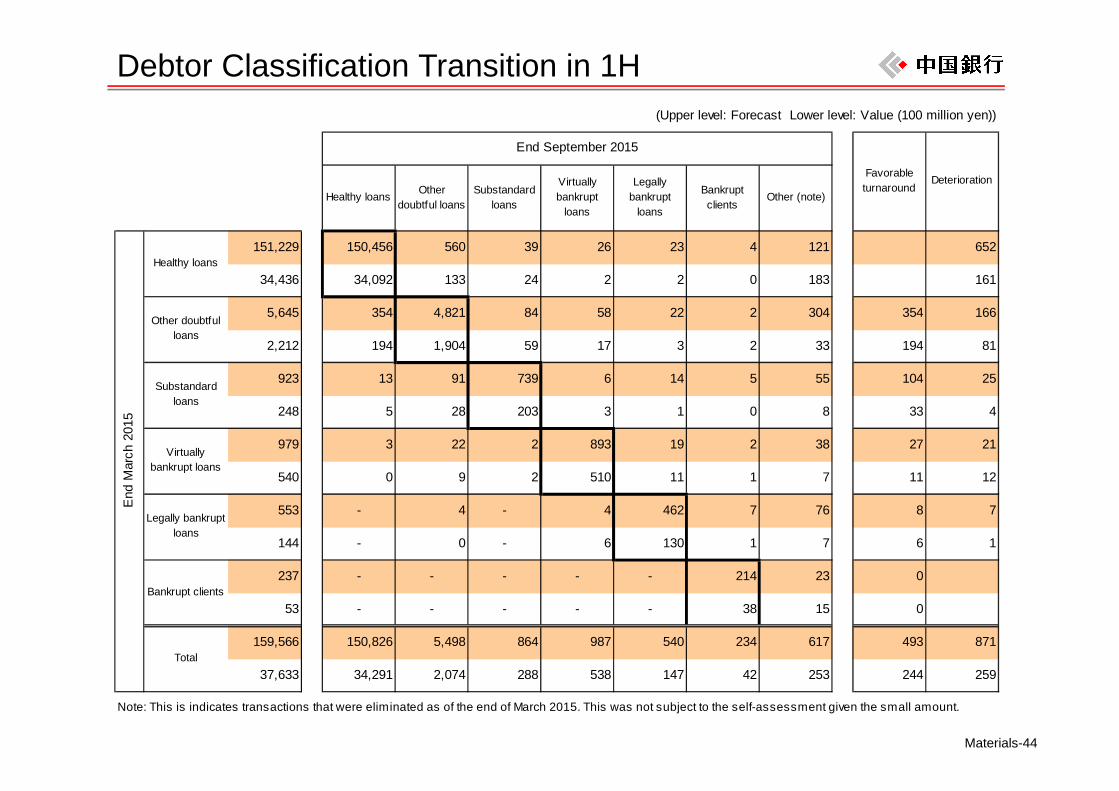
Debtor Classification Transition in 1H(Upper level: Forecast Lower level: Value (100 million yen))
Healthy loans Otherdoubtful loans
Substandardloans
Virtuallybankrupt
loans
Legallybankrupt
loans
Bankruptclients
Other (note)
151,229 150,456 560 39 26 23 4 121 652
34,436 34,092 133 24 2 2 0 183 161
5,645 354 4,821 84 58 22 2 304 354 166
2,212 194 1,904 59 17 3 2 33 194 81
923 13 91 739 6 14 5 55 104 25
248 5 28 203 3 1 0 8 33 4
979 3 22 2 893 19 2 38 27 21
540 0 9 2 510 11 1 7 11 12
553 - 4 - 4 462 7 76 8 7
144 - 0 - 6 130 1 7 6 1
237 - - - - - 214 23 0
53 - - - - - 38 15 0
159,566 150,826 5,498 864 987 540 234 617 493 871
37,633 34,291 2,074 288 538 147 42 253 244 259
Note: This is indicates transactions that were eliminated as of the end of March 2015. This was not subject to the self-assessment given the small amount.
Total
End September 2015E
nd M
arch
201
5
Other doubtfulloans
Favorableturnaround
Deterioration
Healthy loans
Substandardloans
Virtuallybankrupt loans
Legally bankruptloans
Bankrupt clients
Materials-45
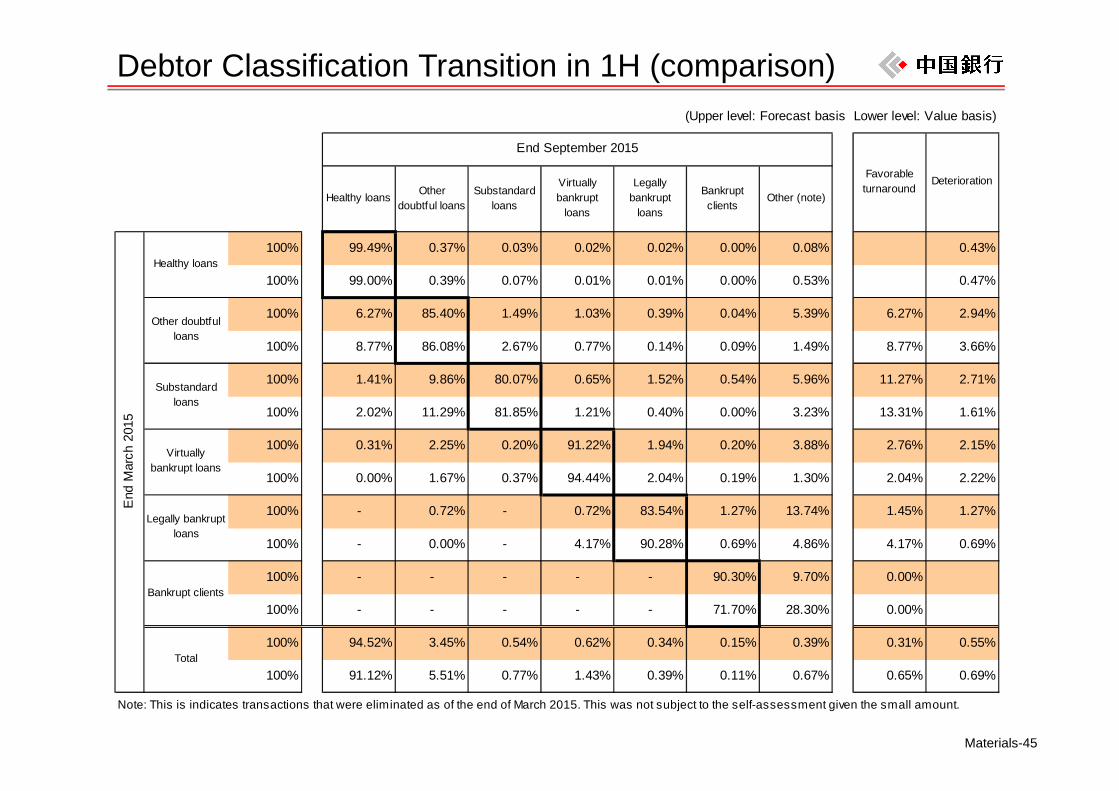
Debtor Classification Transition in 1H (comparison)(Upper level: Forecast basis Lower level: Value basis)
Healthy loans Otherdoubtful loans
Substandardloans
Virtuallybankrupt
loans
Legallybankrupt
loans
Bankruptclients
Other (note)
100% 99.49% 0.37% 0.03% 0.02% 0.02% 0.00% 0.08% 0.43%
100% 99.00% 0.39% 0.07% 0.01% 0.01% 0.00% 0.53% 0.47%
100% 6.27% 85.40% 1.49% 1.03% 0.39% 0.04% 5.39% 6.27% 2.94%
100% 8.77% 86.08% 2.67% 0.77% 0.14% 0.09% 1.49% 8.77% 3.66%
100% 1.41% 9.86% 80.07% 0.65% 1.52% 0.54% 5.96% 11.27% 2.71%
100% 2.02% 11.29% 81.85% 1.21% 0.40% 0.00% 3.23% 13.31% 1.61%
100% 0.31% 2.25% 0.20% 91.22% 1.94% 0.20% 3.88% 2.76% 2.15%
100% 0.00% 1.67% 0.37% 94.44% 2.04% 0.19% 1.30% 2.04% 2.22%
100% - 0.72% - 0.72% 83.54% 1.27% 13.74% 1.45% 1.27%
100% - 0.00% - 4.17% 90.28% 0.69% 4.86% 4.17% 0.69%
100% - - - - - 90.30% 9.70% 0.00%
100% - - - - - 71.70% 28.30% 0.00%
100% 94.52% 3.45% 0.54% 0.62% 0.34% 0.15% 0.39% 0.31% 0.55%
100% 91.12% 5.51% 0.77% 1.43% 0.39% 0.11% 0.67% 0.65% 0.69%
Note: This is indicates transactions that were eliminated as of the end of March 2015. This was not subject to the self-assessment given the small amount.
Deterioration
Healthy loans
Substandardloans
Virtuallybankrupt loans
Legally bankruptloans
Bankrupt clients
Total
End September 2015E
nd M
arch
201
5
Other doubtfulloans
Favorableturnaround
Materials-46
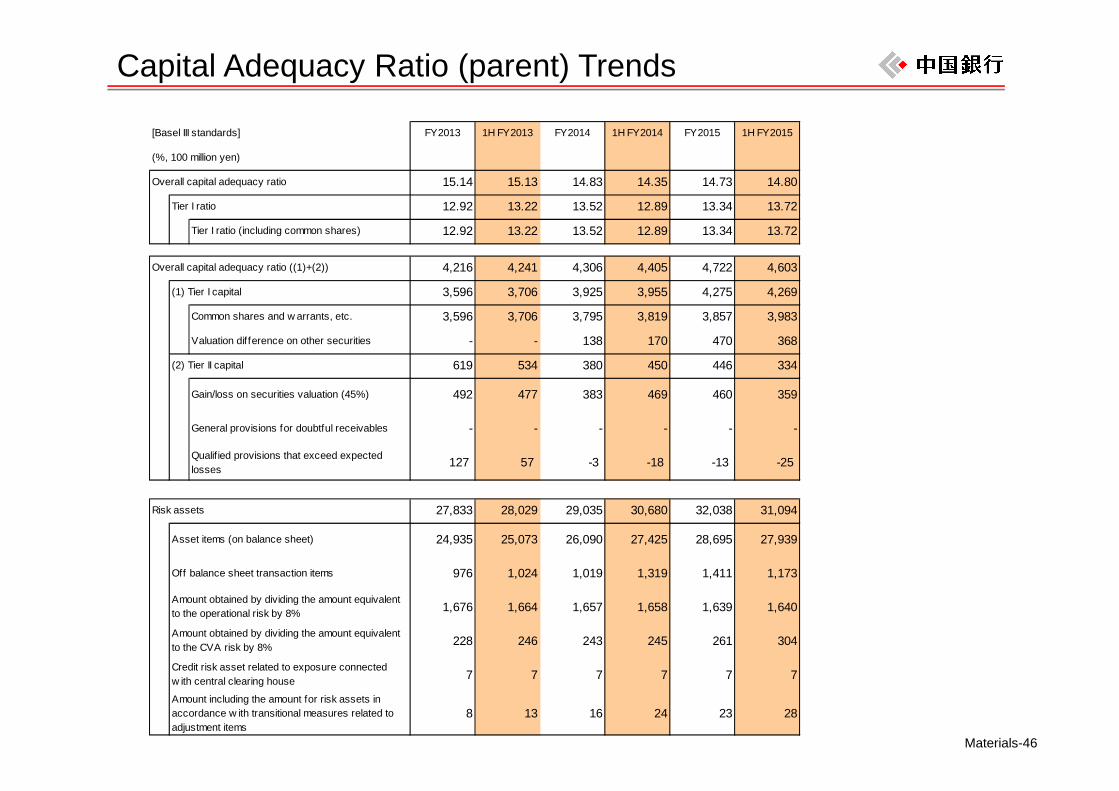
Capital Adequacy Ratio (parent) Trends
[Basel III standards] FY2013 1H FY2013 FY2014 1H FY2014 FY2015 1H FY2015
(%, 100 million yen)
Overall capital adequacy ratio 15.14 15.13 14.83 14.35 14.73 14.80
Tier I ratio 12.92 13.22 13.52 12.89 13.34 13.72
Tier I ratio (including common shares) 12.92 13.22 13.52 12.89 13.34 13.72
Overall capital adequacy ratio ((1)+(2)) 4,216 4,241 4,306 4,405 4,722 4,603
(1) Tier I capital 3,596 3,706 3,925 3,955 4,275 4,269
Common shares and w arrants, etc. 3,596 3,706 3,795 3,819 3,857 3,983
Valuation dif ference on other securities - - 138 170 470 368
(2) Tier II capital 619 534 380 450 446 334
Gain/loss on securities valuation (45%) 492 477 383 469 460 359
General provisions for doubtful receivables - - - - - -
Qualified provisions that exceed expectedlosses 127 57 -3 -18 -13 -25
Risk assets 27,833 28,029 29,035 30,680 32,038 31,094
24,935 25,073 26,090 27,425 28,695 27,939
976 1,024 1,019 1,319 1,411 1,173
1,676 1,664 1,657 1,658 1,639 1,640
228 246 243 245 261 304
7 7 7 7 7 7
8 13 16 24 23 28
Credit risk asset related to exposure connectedw ith central clearing house
Amount including the amount for risk assets inaccordance w ith transitional measures related toadjustment items
Asset items (on balance sheet)
Off balance sheet transaction items
Amount obtained by dividing the amount equivalentto the operational risk by 8%
Amount obtained by dividing the amount equivalentto the CVA risk by 8%
Market risk
1,840
(100 million yen)
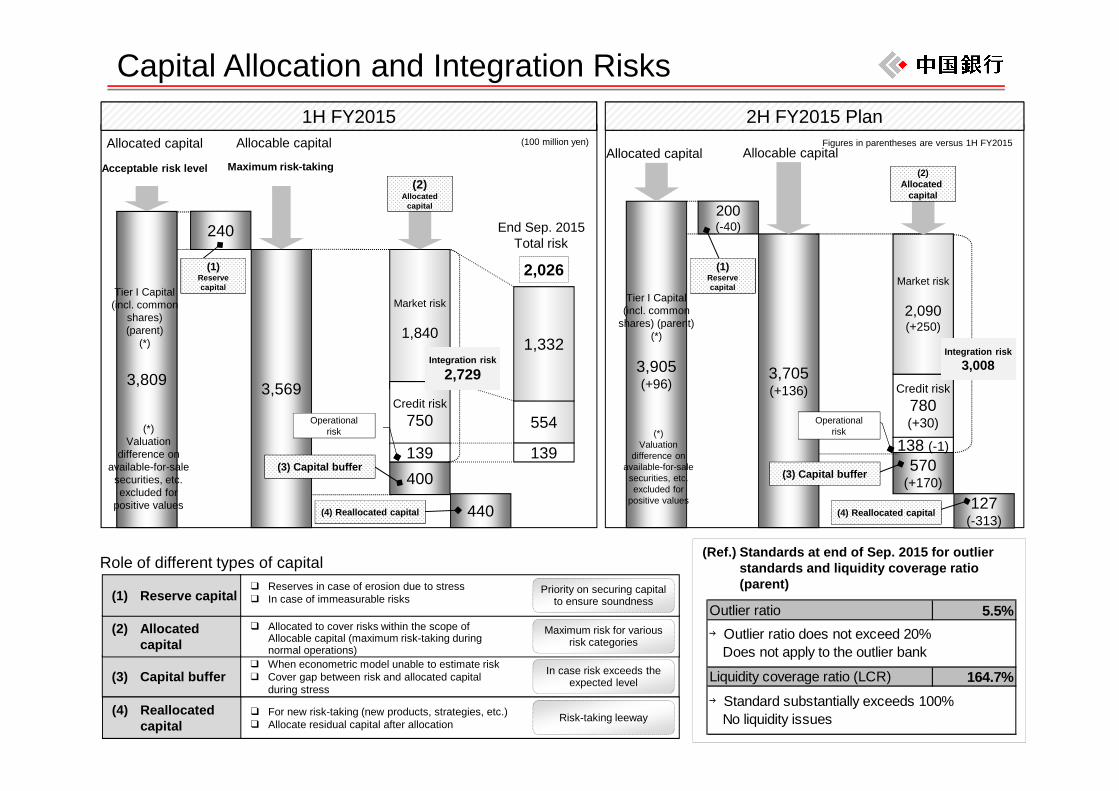
Outlier ratio 5.5%
Liquidity coverage ratio (LCR) 164.7%
→Outlier ratio does not exceed 20% Does not apply to the outlier bank
→Standard substantially exceeds 100% No liquidity issues
(Ref.) Standards at end of Sep. 2015 for outlier standards and liquidity coverage ratio (parent)
1H FY2015 2H FY2015 PlanFigures in parentheses are versus 1H FY2015
554
Allocated capital Allocable capital
Role of different types of capital
3,905(+96)
200(-40)
3,705(+136) Credit risk
780(+30)
Market risk
2,090(+250)
Integration risk3,008
570(+170)
127(-313)
(1)Reserve capital
2,026
(3) Capital buffer
(4) Reallocated capital
❑ When econometric model unable to estimate risk❑ Cover gap between risk and allocated capital
during stress
In case risk exceeds the expected level
❑ Allocated to cover risks within the scope of Allocable capital (maximum risk-taking during normal operations)
❑ Reserves in case of erosion due to stress❑ In case of immeasurable risks
Priority on securing capital to ensure soundness
Maximum risk for various risk categories
❑ For new risk-taking (new products, strategies, etc.)❑ Allocate residual capital after allocation Risk-taking leeway
(2)Allocated
capital
End Sep. 2015Total risk
(*)Valuation
difference on available-for-sale
securities, etc. excluded for
positive values
Tier I Capital (incl. common
shares) (parent)(*)
3,809
240
3,569Credit risk
750
400
440
(1)Reserve capital
(3) Capital buffer
(2)Allocated
capital
Allocated capital Allocable capital
Maximum risk-takingAcceptable risk level
Tier I Capital (incl. common
shares) (parent)
(*)
(*)Valuation
difference on available-for-sale
securities, etc. excluded for
positive values
138 (-1)
Capital Allocation and Integration Risks
139
1,332
139
Integration risk
2,729
Operational risk
(3) Capital buffer
(4) Reallocated capital
(2) Allocated capital
(1) Reserve capital
(4) Reallocated capital
Operational risk
Materials-48
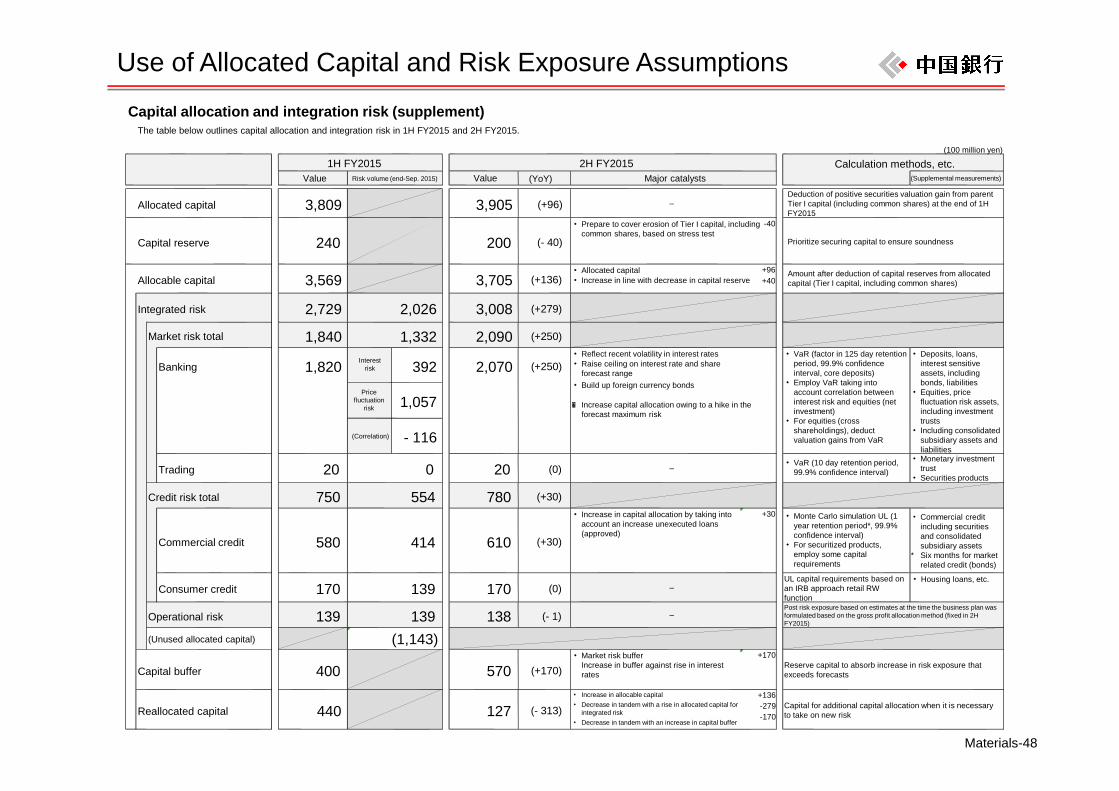
Use of Allocated Capital and Risk Exposure Assumptions
Capital allocation and integration risk (supplement)The table below outlines capital allocation and integration risk in 1H FY2015 and 2H FY2015.
(100 million yen)
Value Value (YoY) (Supplemental measurements)
Allocated capital 3,809 3,905 (+96)
Capital reserve 240 200 (- 40)
・ Prepare to cover erosion of Tier I capital, including common shares, based on stress test
-40
Allocable capital 3,569 3,705 (+136)・ Allocated capital・ Increase in line with decrease in capital reserve
+96+40
Integrated risk 2,729 2,026 3,008 (+279)
1,840 1,332 2,090 (+250)
Trading 20 0 20 (0)
Credit risk total 750 554 780 (+30)
Commercial credit 580 414 610 (+30)
・ Increase in capital allocation by taking into account an increase unexecuted loans (approved)
+30
Consumer credit 170 139 170 (0)UL capital requirements based on an IRB approach retail RWfunction
・ Housing loans, etc.
Operational risk 139 139 138 (- 1)
(Unused allocated capital)
Capital buffer 400 570 (+170)・ Market risk buffer
Increase in buffer against rise in interest rates
+170
Reallocated capital 440 127 (- 313)・ Increase in allocable capital・ Decrease in tandem with a rise in allocated capital for
integrated risk・ Decrease in tandem with an increase in capital buffer
+136-279-170
(Correlation) - 116
Banking
Market risk total
1,057
392
Risk volume (end-Sep. 2015)
–
–
Interest risk (+250)
Amount after deduction of capital reserves from allocated capital (Tier I capital, including common shares)
Capital for additional capital allocation when it is necessary to take on new risk
2H FY2015Major catalysts
Calculation methods, etc.
–
–
・ VaR (factor in 125 day retention period, 99.9% confidence interval, core deposits)
・ Employ VaR taking into account correlation between interest risk and equities (net investment)
・ For equities (cross shareholdings), deduct valuation gains from VaR
・ Reflect recent volatility in interest rates・ Raise ceiling on interest rate and share
forecast range・ Build up foreign currency bonds
⇒ Increase capital allocation owing to a hike in the forecast maximum risk
(1,143)
1H FY2015
Deduction of positive securities valuation gain from parent Tier I capital (including common shares) at the end of 1H FY2015
Post risk exposure based on estimates at the time the business plan was formulated based on the gross profit allocation method (fixed in 2H FY2015)
2,070
Prioritize securing capital to ensure soundness
Reserve capital to absorb increase in risk exposure that exceeds forecasts
1,820Price
fluctuation risk
・ Deposits, loans, interest sensitive assets, including bonds, liabilities
・ Equities, price fluctuation risk assets, including investment trusts
・ Including consolidated subsidiary assets and liabilities
・ VaR (10 day retention period, 99.9% confidence interval)
・ Monte Carlo simulation UL (1 year retention period*, 99.9% confidence interval)
・ For securitized products, employ some capital requirements
・ Monetary investment trust
・ Securities products
・ Commercial credit including securities and consolidated subsidiary assets
* Six months for market related credit (bonds)
Materials-49
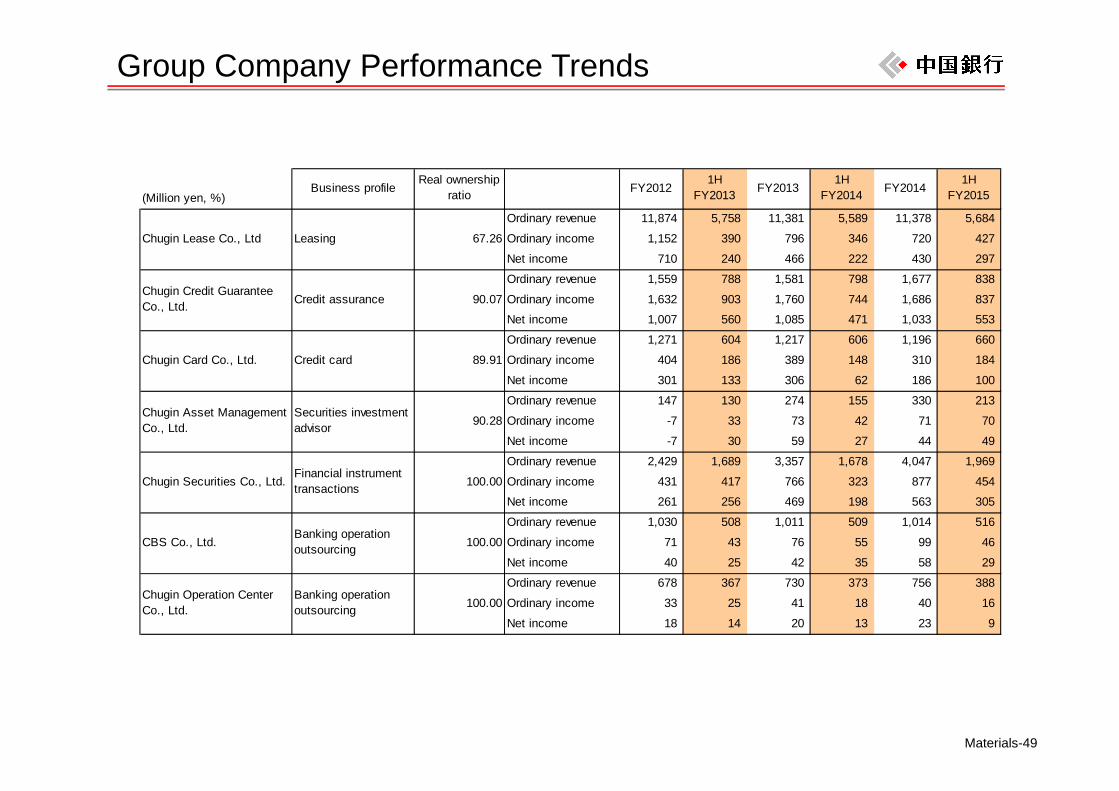
Group Company Performance Trends
(Million yen, %)
Ordinary revenue 11,874 5,758 11,381 5,589 11,378 5,684
67.26 Ordinary income 1,152 390 796 346 720 427
Net income 710 240 466 222 430 297
Ordinary revenue 1,559 788 1,581 798 1,677 838
90.07 Ordinary income 1,632 903 1,760 744 1,686 837
Net income 1,007 560 1,085 471 1,033 553
Ordinary revenue 1,271 604 1,217 606 1,196 660
89.91 Ordinary income 404 186 389 148 310 184
Net income 301 133 306 62 186 100
Ordinary revenue 147 130 274 155 330 213
90.28 Ordinary income -7 33 73 42 71 70
Net income -7 30 59 27 44 49
Ordinary revenue 2,429 1,689 3,357 1,678 4,047 1,969
100.00 Ordinary income 431 417 766 323 877 454
Net income 261 256 469 198 563 305
Ordinary revenue 1,030 508 1,011 509 1,014 516
100.00 Ordinary income 71 43 76 55 99 46
Net income 40 25 42 35 58 29
Ordinary revenue 678 367 730 373 756 388
100.00 Ordinary income 33 25 41 18 40 16
Net income 18 14 20 13 23 9
FY20131H
FY2014
Banking operationoutsourcing
Banking operationoutsourcing
Chugin Lease Co., Ltd
Chugin Credit GuaranteeCo., Ltd.
FY20141H
FY2015Real ownership
ratioBusiness profile FY20121H
FY2013
Chugin Card Co., Ltd.
Chugin Asset ManagementCo., Ltd.
Chugin Securities Co., Ltd.
CBS Co., Ltd.
Chugin Operation CenterCo., Ltd.
Leasing
Credit assurance
Credit card
Securities investmentadvisor
Financial instrumenttransactions
Materials-50
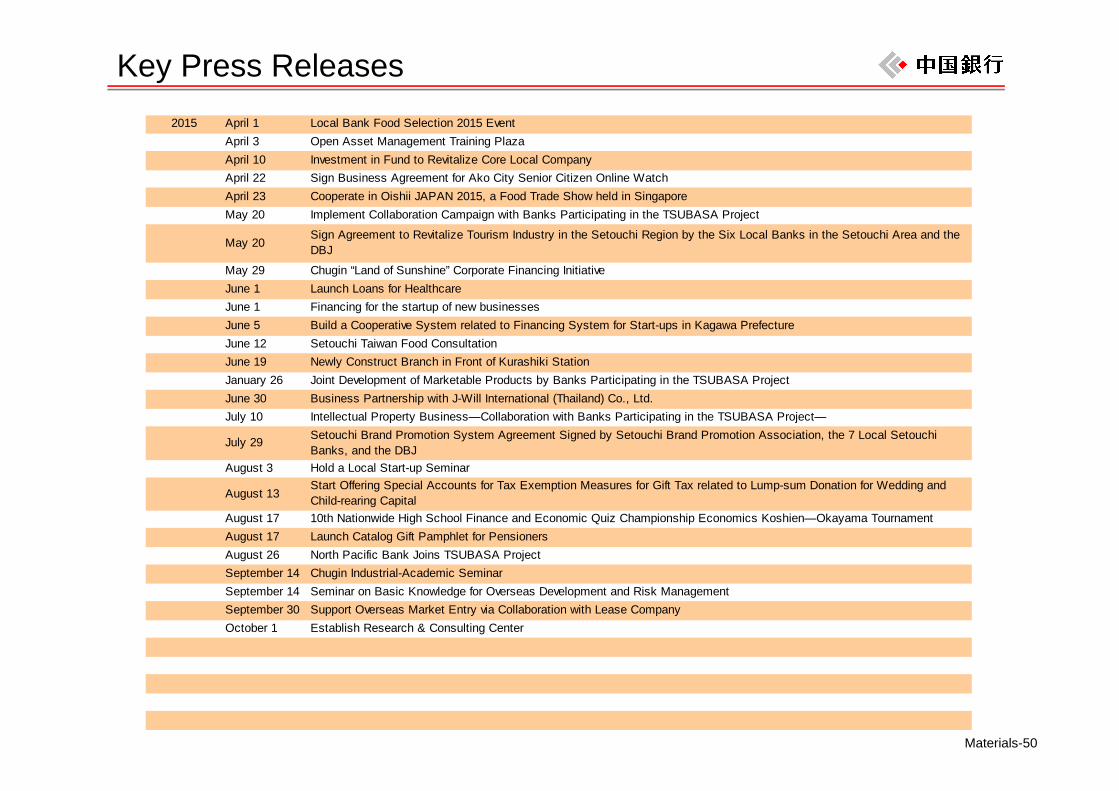
Key Press Releases2015 April 1 Local Bank Food Selection 2015 Event
April 3 Open Asset Management Training PlazaApril 10 Investment in Fund to Revitalize Core Local CompanyApril 22 Sign Business Agreement for Ako City Senior Citizen Online Watch April 23 Cooperate in Oishii JAPAN 2015, a Food Trade Show held in SingaporeMay 20 Implement Collaboration Campaign with Banks Participating in the TSUBASA Project
May 20Sign Agreement to Revitalize Tourism Industry in the Setouchi Region by the Six Local Banks in the Setouchi Area and theDBJ
May 29 Chugin “Land of Sunshine” Corporate Financing Initiative June 1 Launch Loans for HealthcareJune 1 Financing for the startup of new businessesJune 5 Build a Cooperative System related to Financing System for Start-ups in Kagawa PrefectureJune 12 Setouchi Taiwan Food ConsultationJune 19 Newly Construct Branch in Front of Kurashiki StationJanuary 26 Joint Development of Marketable Products by Banks Participating in the TSUBASA ProjectJune 30 Business Partnership with J-Will International (Thailand) Co., Ltd.July 10 Intellectual Property Business—Collaboration with Banks Participating in the TSUBASA Project—
July 29 Setouchi Brand Promotion System Agreement Signed by Setouchi Brand Promotion Association, the 7 Local SetouchiBanks, and the DBJ
August 3 Hold a Local Start-up Seminar
August 13Start Offering Special Accounts for Tax Exemption Measures for Gift Tax related to Lump-sum Donation for Wedding andChild-rearing Capital
August 17 10th Nationwide High School Finance and Economic Quiz Championship Economics Koshien—Okayama TournamentAugust 17 Launch Catalog Gift Pamphlet for PensionersAugust 26 North Pacific Bank Joins TSUBASA ProjectSeptember 14 Chugin Industrial-Academic SeminarSeptember 14 Seminar on Basic Knowledge for Overseas Development and Risk ManagementSeptember 30 Support Overseas Market Entry via Collaboration with Lease CompanyOctober 1 Establish Research & Consulting Center
Materials-51
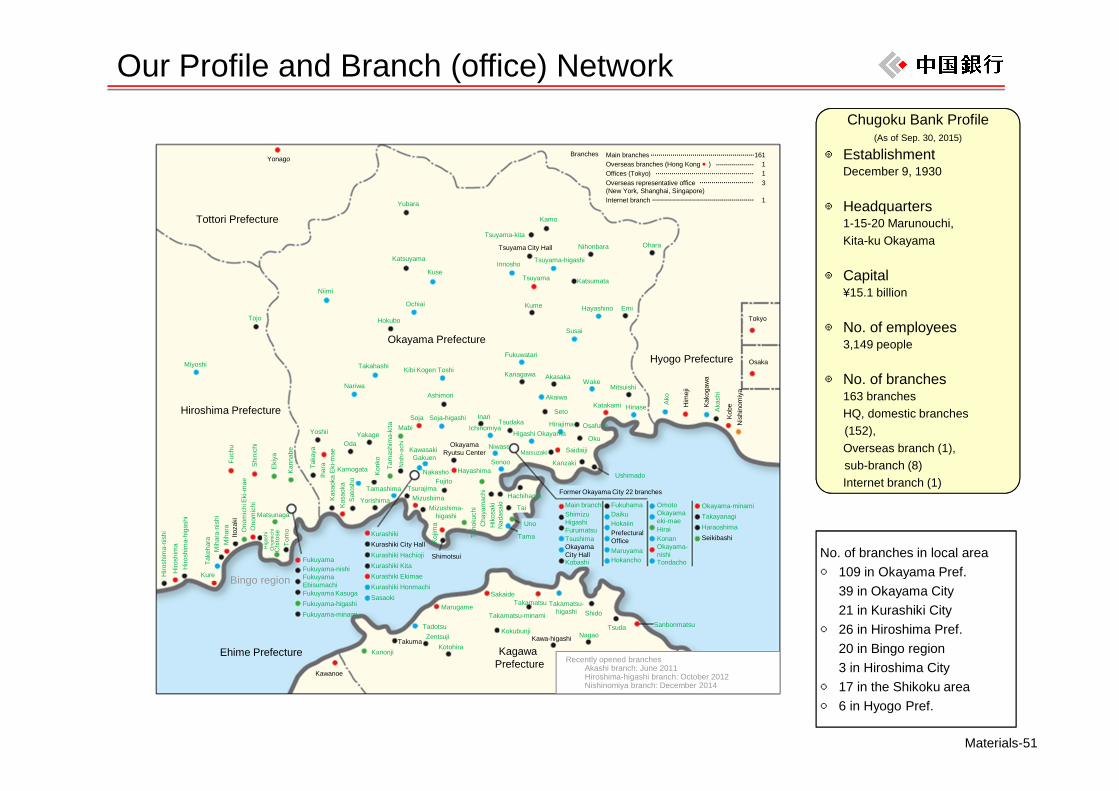
Our Profile and Branch (office) Network
No. of branches in local area○ 109 in Okayama Pref.
39 in Okayama City21 in Kurashiki City
○ 26 in Hiroshima Pref.20 in Bingo region3 in Hiroshima City
○ 17 in the Shikoku area○ 6 in Hyogo Pref.
Chugoku Bank Profile(As of Sep. 30, 2015)
◎ EstablishmentDecember 9, 1930
◎ Headquarters1-15-20 Marunouchi, Kita-ku Okayama
◎ Capital¥15.1 billion
◎ No. of employees3,149 people
◎ No. of branches163 branchesHQ, domestic branches (152),Overseas branch (1), sub-branch (8)Internet branch (1)
Recently opened branchesAkashi branch: June 2011Hiroshima-higashi branch: October 2012Nishinomiya branch: December 2014
Bingo region
Yonago
Tottori Prefecture
Miyoshi
Tojo
Niimi
Hiroshima Prefecture
Fuch
u
Shi
nich
i
Eki
ya
Kan
nabe
Hiro
shim
a-ni
shi
Hiro
shim
aH
irosh
ima-
higa
shi
Kure
Take
hara
Mih
ara-
nish
iM
ihar
aIto
zaki
Ono
mic
hi E
ki-m
aeO
nom
ichi
Matsunaga
Hig
ashi
Ono
mic
hiC
hito
seTo
mo
FukuyamaFukuyama-nishiFukuyama Ebisumachi
Yubara
Katsuyama
Kuse
Ochiai
Hokubo
Okayama Prefecture
Nariwa
Takahashi Kibi Kogen Toshi
Ashimori
Yoshii
OdaYakage
MabiSoja Soja-higashi
Kon
ko
Tam
ashi
ma-
kita
Nis
hi-a
chi
Kawasaki Gakuen
Nakasho
Okayama Ryutsu Center
HayashimaFujito
Taka
yaIh
ara
Kas
aoka
Kamogata
Yorishima
Tamashima TsurajimaMizushima
Mizushima-higashi
Koj
ima
Shimotsui
KurashikiKurashiki City HallKurashiki HachiojiKurashiki KitaKurashiki EkimaeKurashiki HonmachiSasaoki
Main branches 161Overseas branches (Hong Kong ●) 1Offices (Tokyo) 1Overseas representative office 3(New York, Shanghai, Singapore)Internet branch 1
Branches
Kas
aoka
Eki
-mae
Kamo
Tsuyama-kita
Tsuyama City Hall
Innosho Tsuyama-higashi
Tsuyama
Kume
Fukuwatari
Kanagawa
Nihonbara Ohara
Katsumata
Hayashino Emi
Susai
Hyogo Prefecture
Tokyo
Osaka
Inari
Ichinomiya
Niwase
Senoo
Tsudaka
Higashi Okayama
Matsuzaki
Akasaka
Akaiwa
Seto
Hirajima
Saidaiji
Kanzaki
Ushimado
WakeMitsuishi
Katakami Hinase
Osafune
Oku
Ako
Him
eji
Kak
ogaw
aA
kash
i
Kob
eN
ishi
nom
iya
Tano
kuch
iC
haya
mac
hiH
ikos
aki
Nad
asak
iHachihama
Tama
Uno
Tai
Former Okayama City 22 branches
Main branchShimizuHigashi Furumatsu
FukuhamaDaikuHokaiinPrefectural Office
Omoto Okayama-minamiTakayanagiHaraoshimaSeikibashi
Ehime Prefecture
Kawanoe
KanonjiTakuma
TadotsuZentsuji
Kotohira
Marugame
Sakaide
Takamatsu-minami
Kokubunji
Kagawa Prefecture
Kawa-higashi
Takamatsu Takamatsu-higashi Shido
TsudaNagao
Sanbonmatsu
Sat
osho
Fukuyama KasugaFukuyama-higashiFukuyama-minami
HiraiKonanOkayama-nishi
Okayama eki-mae
Tondacho
MaruyamaHokancho
TsushimaOkayama City HallKobashi

For inquiries regarding this document, please contact:Management Planning Department, The Chugoku Bank, Ltd.Mr. Ohara / Mr. UmakoshiTel: 086-234-6519; Fax:086-234-6587 Email:[email protected]