Embed Size (px)
Citation preview


2 ALASKA ECONOMIC TRENDS JULY 2005
July 2005Volume 25Number 7
ISSN 0160-3345
Alaska Economic
Trends is a monthly publication dealing
with a variety of economic-related
issues in the state.
Alaska Economic Trends is funded by the
Employment Security Division and published by
the Alaska Department of Labor and Workforce Development, P.O. Box 21149, Juneau, Alaska
99802-1149.
Printed and distributed by Assets, Inc., a vocational training and employment
program, at a cost of $1.42 per copy.
To contact us for more information,
to subscribe, or for mailing list changes or
back copies, [email protected]
Material in this publication is public
information and, with appropriate credit, may be reproduced without
permission.
Trends is available on the Internet.
See URL above.
http://almis.labor.state.ak.us
Frank H. Murkowski, Governor of AlaskaGreg O’Claray, Commissioner
Cover design by Sam Dapcevich
Email Trends authors at: [email protected]
July Trends authors are staff with the Research and Analysis Section,
Administrative Services Division,Alaska Department of Labor and Workforce Development
Subscriptions:[email protected]
(907) 465-4500
Contents:
The Cost of Living in Alaska 4
Employment Scene 24Earnings data for 2004 show healthy growth
ALASKA ECONOMIC TRENDS JULY 2005 3
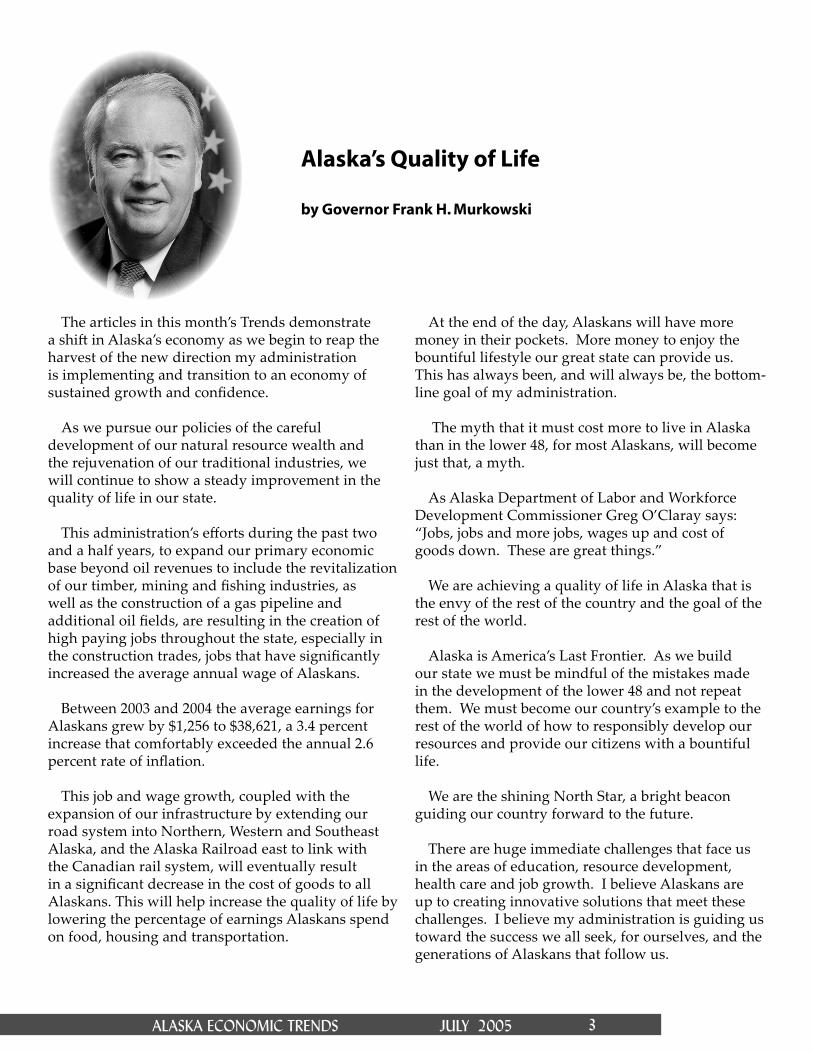
Alaska’s Quality of Life
by Governor Frank H. Murkowski
The articles in this month’s Trends demonstrate a shi in Alaska’s economy as we begin to reap the harvest of the new direction my administration is implementing and transition to an economy of sustained growth and confi dence.
As we pursue our policies of the careful development of our natural resource wealth and the rejuvenation of our traditional industries, we will continue to show a steady improvement in the quality of life in our state.
This administration’s eff orts during the past two and a half years, to expand our primary economic base beyond oil revenues to include the revitalization of our timber, mining and fi shing industries, as well as the construction of a gas pipeline and additional oil fi elds, are resulting in the creation of high paying jobs throughout the state, especially in the construction trades, jobs that have signifi cantly increased the average annual wage of Alaskans.
Between 2003 and 2004 the average earnings for Alaskans grew by $1,256 to $38,621, a 3.4 percent increase that comfortably exceeded the annual 2.6 percent rate of infl ation.
This job and wage growth, coupled with the expansion of our infrastructure by extending our road system into Northern, Western and Southeast Alaska, and the Alaska Railroad east to link with the Canadian rail system, will eventually result in a signifi cant decrease in the cost of goods to all Alaskans. This will help increase the quality of life by lowering the percentage of earnings Alaskans spend on food, housing and transportation.
At the end of the day, Alaskans will have more money in their pockets. More money to enjoy the bountiful lifestyle our great state can provide us. This has always been, and will always be, the bo om-line goal of my administration.
The myth that it must cost more to live in Alaska than in the lower 48, for most Alaskans, will become just that, a myth.
As Alaska Department of Labor and Workforce Development Commissioner Greg O’Claray says: “Jobs, jobs and more jobs, wages up and cost of goods down. These are great things.”
We are achieving a quality of life in Alaska that is the envy of the rest of the country and the goal of the rest of the world.
Alaska is America’s Last Frontier. As we build our state we must be mindful of the mistakes made in the development of the lower 48 and not repeat them. We must become our country’s example to the rest of the world of how to responsibly develop our resources and provide our citizens with a bountiful life.
We are the shining North Star, a bright beacon guiding our country forward to the future.
There are huge immediate challenges that face us in the areas of education, resource development, health care and job growth. I believe Alaskans are up to creating innovative solutions that meet these challenges. I believe my administration is guiding us toward the success we all seek, for ourselves, and the generations of Alaskans that follow us.

4 ALASKA ECONOMIC TRENDS JULY 2005
he high cost of living in Alaska is part of the state’s folklore, but the stories are based on economic reality. In the state’s early days, transportation costs and a limited ability to
produce goods locally led to exorbitant prices for everything from housing to basic grocery items. As the state’s population grew and infrastructure developed, costs moderated substantially but remained signifi cantly higher than the national average.
In the last decade, the gap between costs in Alaska and those in the lower 48 have narrowed even more, but one of the surveys discussed in this annual cost of living article still places three Alaska cities among the nation’s 20 most expensive, and the state’s distance from larger markets and population centers makes it likely that costs will always be marginally higher in the 49th state.
Two kinds of cost-of-living measures
Cost-of-living measures come in two basic types. One indicates the change in the cost of living in a specifi c location over time. The Consumer Price Index (CPI), often referred to as the infl ation rate, is the principal measure of this type. The CPI is used by landlords, workers, unions, and employers to adjust rents and salaries, among other things. The Alaska Permanent Fund Corporation uses the CPI to determine how much money must be added to the principal of the Permanent Fund to keep up with infl ation.
T
The Cost of Living in Alaska By Dan Robinson andNeal Fried
Alaska still one of the most expensive states
The other type of cost-of-living measure examines cost differences among places at a specifi c point in time. Measures of this type can answer questions about whether it’s more expensive to live in Fairbanks or Ketchikan, for example. Certain items are selected for comparison and then a survey is conducted to determine how much the items cost in different locations.
Some surveys of this type look at how much it would cost in different locations to maintain a certain standard of living. In other words, if a person can afford to live in a three bedroom home, eat out twice a week, and drive a late-model car in Boise, Idaho on an income of $40,000 a year, how much more or less would it cost to maintain the same living standards in Boston, Massachusetts? Comparisons such as these play a big role in relocation decisions. Several measures of this type will be discussed in this article.
Use measures with caution
All cost-of-living measures have shortcomings and limitations which users should recognize. Most measure price changes over time or price differences between cities by fi rst selecting a sample of goods and services designed to represent the needs and wants of the average household or households within a specifi c income range. This “market basket” of goods and services generally includes housing, food, transportation, medical care, and entertainment,

ALASKA ECONOMIC TRENDS JULY 2005 5
among other things. Some measures compile very detailed market baskets while others compare only basic goods and services.
Because no two consumers spend their money exactly alike, however, no index can fully capture what price differences over time will mean to a household or how a household will respond to price differences between cities. For example, the average household in Homer may spend its income quite differently than the average household in Bethel, depending on the prices of various goods and services in the two cities and the availability of substitutes. Further, the spending habits of households are constantly in fl ux due to changing tastes, technology, marketing, and the availability of goods, but cost-of-living measures generally must assume that consumers do not adjust buying habits.
How fast are prices rising?
The Anchorage Consumer Price Index (CPI) is the most frequently used cost-of-living index in Alaska. Anchorage is one of about 80 urban communities in the country where a CPI is calculated as the long-term record of price changes. Because a CPI is not calculated for any other Alaska city, the Anchorage CPI is often used as the best substitute for a statewide infl ation measure.
The U.S. Department of Labor’s Bureau of Labor Statistics (BLS) conducts elaborate surveys of Anchorage consumers’ spending habits to determine both the appropriate market basket of goods to be measured and the weight each item will have in the overall index. (See Exhibit 1.)
Exhibit 1 shows, for example, that the average Anchorage consumer spends nearly 43 percent of his or her consumption dollar on housing and 18 percent on transportation. In most categories the Anchorage weights are only slightly different from those used for the national CPI. The most notable exception is recreation, where Anchorage consumers spend 8.1 percent of their consumption dollars and national consumers spend only 5.9 percent.
BLS measures price changes by collecting prices for goods and services on a regular basis in Anchorage and other cities for which a CPI is produced. The Anchorage CPI is produced on a semi-annual basis (January-to-June and July-to-December time periods). The two semi-annual numbers are then combined to create an annual average, which is the number most often used in wage and rent contracts. (See Exhibit 2.)
All references to the CPI in this article are to the CPI-U (Consumer Price Index for all Urban Consumers). BLS also produces an index called the CPI-W (Consumer Price Index for Urban Wage Earners and Clerical Workers), which instead of containing data on all urban consumers as the CPI-U does, only contains data on urban consumers who are either wage earners or clerical workers. At the national level, the CPI-U represents about 80 percent of the population while the CPI-W represents only 40 percent. Although the CPI-W is useful in certain situations, the CPI-U is the most prominent and frequently used measure.
Housing 42.6%
Transportation 17.8%
Food & beverages 14.2%
Recreation 8.1%
Medical care 5.3%
Education/Commun. 5.2%Other goods & services 3.6%
Apparel & upkeep 3.3%
1Component WeightingIn Anchorage CPI 2003
Source: U.S. Department of Labor, Bureau of Labor Statistics
6 ALASKA ECONOMIC TRENDS JULY 2005
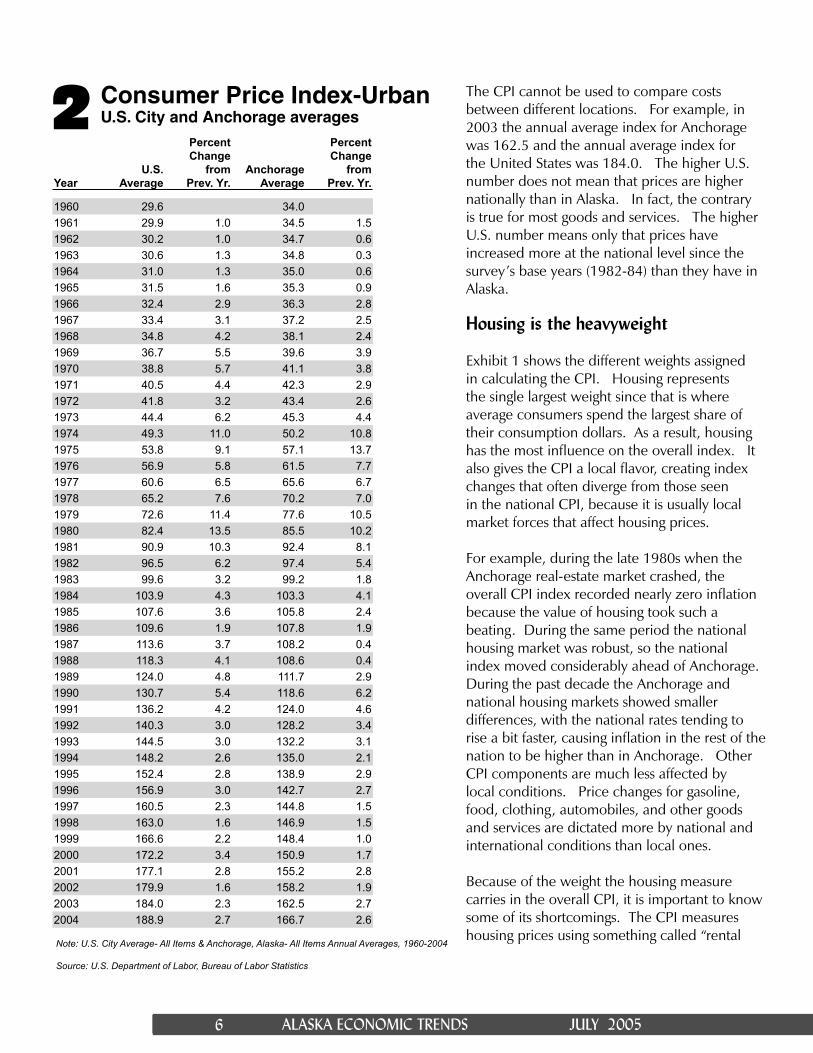
The CPI cannot be used to compare costs between different locations. For example, in 2003 the annual average index for Anchorage was 162.5 and the annual average index for the United States was 184.0. The higher U.S. number does not mean that prices are higher nationally than in Alaska. In fact, the contrary is true for most goods and services. The higher U.S. number means only that prices have increased more at the national level since the survey’s base years (1982-84) than they have in Alaska.
Housing is the heavyweight
Exhibit 1 shows the different weights assigned in calculating the CPI. Housing represents the single largest weight since that is where average consumers spend the largest share of their consumption dollars. As a result, housing has the most infl uence on the overall index. It also gives the CPI a local fl avor, creating index changes that often diverge from those seen in the national CPI, because it is usually local market forces that affect housing prices.
For example, during the late 1980s when the Anchorage real-estate market crashed, the overall CPI index recorded nearly zero infl ation because the value of housing took such a beating. During the same period the national housing market was robust, so the national index moved considerably ahead of Anchorage. During the past decade the Anchorage and national housing markets showed smaller differences, with the national rates tending to rise a bit faster, causing infl ation in the rest of the nation to be higher than in Anchorage. Other CPI components are much less affected by local conditions. Price changes for gasoline, food, clothing, automobiles, and other goods and services are dictated more by national and international conditions than local ones.
Because of the weight the housing measure carries in the overall CPI, it is important to know some of its shortcomings. The CPI measures housing prices using something called “rental
Percent PercentChange Change
U.S. from Anchorage fromYear Average Prev. Yr. Average Prev. Yr.
1960 29.6 34.01961 29.9 1.0 34.5 1.51962 30.2 1.0 34.7 0.61963 30.6 1.3 34.8 0.31964 31.0 1.3 35.0 0.61965 31.5 1.6 35.3 0.91966 32.4 2.9 36.3 2.81967 33.4 3.1 37.2 2.51968 34.8 4.2 38.1 2.41969 36.7 5.5 39.6 3.91970 38.8 5.7 41.1 3.81971 40.5 4.4 42.3 2.91972 41.8 3.2 43.4 2.61973 44.4 6.2 45.3 4.41974 49.3 11.0 50.2 10.81975 53.8 9.1 57.1 13.71976 56.9 5.8 61.5 7.71977 60.6 6.5 65.6 6.71978 65.2 7.6 70.2 7.01979 72.6 11.4 77.6 10.51980 82.4 13.5 85.5 10.21981 90.9 10.3 92.4 8.11982 96.5 6.2 97.4 5.41983 99.6 3.2 99.2 1.81984 103.9 4.3 103.3 4.11985 107.6 3.6 105.8 2.41986 109.6 1.9 107.8 1.91987 113.6 3.7 108.2 0.41988 118.3 4.1 108.6 0.41989 124.0 4.8 111.7 2.91990 130.7 5.4 118.6 6.21991 136.2 4.2 124.0 4.61992 140.3 3.0 128.2 3.41993 144.5 3.0 132.2 3.11994 148.2 2.6 135.0 2.11995 152.4 2.8 138.9 2.91996 156.9 3.0 142.7 2.71997 160.5 2.3 144.8 1.51998 163.0 1.6 146.9 1.51999 166.6 2.2 148.4 1.02000 172.2 3.4 150.9 1.72001 177.1 2.8 155.2 2.82002 179.9 1.6 158.2 1.92003 184.0 2.3 162.5 2.72004 188.9 2.7 166.7 2.6
2 Consumer Price Index-UrbanU.S. City and Anchorage averages
Note: U.S. City Average- All Items & Anchorage, Alaska- All Items Annual Averages, 1960-2004
Source: U.S. Department of Labor, Bureau of Labor Statistics

ALASKA ECONOMIC TRENDS JULY 2005 7
equivalency,” which uses the current rental value of houses to compare prices rather than actual home prices or appraised values. This method can overstate or understate infl ation because actual house values and rental costs are not always closely connected.
In fact, in both Anchorage and the nation as a whole, house prices have risen dramatically in the last several years. Rental prices have not seen a similar increase, leading many to believe that recent CPI numbers understate infl ation for the majority of Americans who own rather than rent. BLS takes the position that much of the purchasing of houses in recent years is for investment purposes rather than for use as a primary dwelling. Since investment spending is excluded from consumer price calculations, housing prices are a less reliable measure of dollars spent on actual housing costs than are rental equivalencies, according to BLS. To isolate price changes other than housing, BLS produces an index called CPI All Items Less Shelter. (See Exhibit 4.) This index reveals less noticeable differences between Anchorage and the nation than does the CPI-U.
Inflation rate at 2.6 percent in 2004
It has been eleven years since Anchorage infl ation exceeded three percent. (See Exhibit 3.) In 2004 the Anchorage CPI rose 2.6 percent, which was slightly lower than the nation’s infl ation rate of 2.7 percent, but higher than the ten-year average Anchorage infl ation rate of 2.1 percent.
Prices in 2004 increased in all major categories. Housing costs, the category with the largest weight, rose by a moderate 1.6 percent, which will be a surprising fi gure to anyone who purchased a house in 2004 (see above explanation of the CPI’s rental equivalency method of determining housing costs). A sub-category of housing, fuel and utility costs, rose 9.2 percent over the year, while costs for household furnishings fell by 2.7 percent.
6.2%
4.6%
3.4%3.1%
2.1%
2.9%2.7%
1.5% 1.5%1%
1.7%
2.8%
1.9%
2.7% 2.6%
1990
1991
1992
1993
1994
1995
1996
1997
1998
1999
2000
2001
2002
2003
2004
The largest increase among the major categories was a 4.4 percent increase in food and beverage costs. Transportation rose by 2.8 percent and apparel costs grew by less than one percent. Although data on medical costs have not been published separately over the last three years because of an inadequate number of sample reporters, medical costs are still incorporated in the overall index. There is little doubt that medical costs continued to rise faster than most, if not all, other components. Nationally, medical costs increased by 4.4 percent in 2004.
Source: U.S. Department of Labor, Bureau of Labor Statistics
What does $100 in 1980 dollars equal today?
The Anchorage CPI can help determine how much money it would take today to equal a dollar amount from some earlier year. Use this equation to determine how many 2004 dollars it would take to equal a certain number of 1980 dollars (or simply replace the index numbers with other years to do a similar comparison):
Multiply 1.95 by any number of 1980 dollars and you will have the 2004 equivalent. So, $195 in 2004 would have the same purchasing power as $100 did in 1980.
The formula can also be reversed to defl ate current dollars to some earlier year (e.g., $100 in 2004 would equal $51 in 1980). Infl ation calculators that require only the years and a dollar amount are also available on many websites, including ours: http://almis.labor.state.ak.us/
2004 Anchorage CPI (see Exhibit 2)Divided by 1980 Anchorage CPI
166.7 85.5 = 1.95
3Anchorage Consumer PricesRose moderately in 2004

8 ALASKA ECONOMIC TRENDS JULY 2005
ALL ITEMS LESS SHELTER HOUSING TRANSPORTATION Pct. Chg. Pct. Chg. Pct. Chg. Pct. Chg. Pct. Chg. Pct. Chg.
U.S. from Anch. from U.S. from Anch from U.S. from Anch. fromYear Average Prev. Yr. Average Prev. Yr. Average Prev. Yr. Average Prev. Yr. Average Prev. Yr. Average Prev. Yr.
1983 99.8 3.7 99.9 3.7 99.5 2.7 99.0 0.8 99.3 2.4 98.5 1.81984 103.9 4.1 103.8 3.9 103.6 4.1 102.7 3.7 103.7 4.4 104.6 6.21985 107.0 3.0 107.5 3.6 107.7 4.0 103.0 0.3 106.4 2.6 108.2 3.41986 108.0 0.9 111.2 3.4 110.9 3.0 102.6 -0.4 102.3 -3.9 107.8 -0.41987 111.6 3.3 115.1 3.5 114.2 3.0 97.5 -5.0 105.4 3.0 111.3 3.21988 115.9 3.9 117.8 2.3 118.5 3.8 95.4 -2.2 108.7 3.1 113.0 1.51989 121.6 4.9 122.3 3.8 123.0 3.8 96.3 0.9 114.1 5.0 116.7 3.31990 128.2 5.4 128.0 4.7 128.5 4.5 103.9 7.9 120.5 5.6 120.7 3.41991 133.5 4.1 131.9 3.0 133.6 4.0 111.2 7.0 123.8 2.7 121.7 0.81992 137.3 2.8 134.6 2.0 137.5 2.9 116.6 4.9 126.5 2.2 123.3 1.31993 141.4 3.0 137.9 2.5 141.2 2.7 121.1 3.9 130.4 3.1 128.8 4.51994 144.8 2.4 140.3 1.7 144.8 2.6 122.9 1.5 134.3 3.0 136.9 6.31995 148.6 2.6 144.6 3.1 148.5 2.6 124.9 1.6 139.1 3.6 143.8 5.01996 152.8 2.8 148.4 2.6 152.8 2.9 127.9 2.4 143.0 2.8 147.2 2.41997 155.9 2.0 150.6 1.5 156.8 2.6 129.4 1.2 144.3 0.9 147.0 -0.11998 157.2 0.8 152.6 1.3 160.4 2.3 131.0 1.2 141.6 -1.9 144.9 -1.41999 160.2 1.9 153.5 0.6 163.9 2.2 132.7 1.3 144.4 2.0 143.7 -0.82000 165.7 3.4 156.1 1.7 169.6 3.5 134.2 1.1 153.3 6.2 150.5 4.72001 169.7 2.4 160.6 2.9 176.4 4.0 139.0 3.6 154.3 0.7 153.0 1.72002 170.8 0.6 162.2 1.0 180.3 2.2 143.5 3.2 152.9 -1.0 151.5 -1.02003 174.6 2.2 166.5 2.7 184.8 2.5 146.8 2.3 157.6 3.1 158.3 4.52004 179.3 2.7 171.7 3.1 189.5 2.5 149.1 1.6 163.1 3.5 162.7 2.8
FOOD & BEVERAGES MEDICAL CARE* APPAREL & UPKEEPPct. Chg. Pct. Chg. Pct. Chg. Pct. Chg. Pct. Chg. Pct. Chg.
U.S. from Anch. from U.S. from Anch. from U.S. from Anch. fromYear Average Prev. Yr. Average Prev. Yr. Average Prev. Yr. Average Prev. Yr. Average Prev. Yr. Average Prev. Yr.
1983 99.5 2.3 99.7 2.6 100.6 8.8 99.7 5.2 100.2 2.5 101.6 5.21984 103.2 3.7 103.2 3.5 106.8 6.2 105.5 5.8 102.1 1.9 101.7 0.11985 105.6 2.3 106.2 2.9 113.5 6.3 110.9 5.1 105.0 2.8 105.8 4.01986 109.1 3.3 110.8 4.3 122.0 7.5 127.8 15.2 105.9 0.9 109.0 3.01987 113.5 4.0 113.1 2.1 130.1 6.6 137.0 7.2 110.6 4.4 116.6 7.01988 118.2 4.1 113.8 0.6 138.6 6.5 145.8 6.4 115.4 4.3 119.1 2.11989 124.9 5.7 117.2 3.0 149.3 7.7 154.4 5.9 118.6 2.8 125.0 5.01990 132.1 5.8 123.7 5.5 162.8 9.0 161.2 4.4 124.1 4.6 127.7 2.21991 136.8 3.6 127.7 3.2 177.0 8.7 173.5 7.6 128.7 3.7 126.6 -0.91992 138.7 1.4 130.3 2.0 190.1 7.4 183.0 5.5 131.9 2.5 130.2 2.81993 141.6 2.1 131.2 0.7 201.4 5.9 189.6 3.6 133.7 1.4 131.2 0.81994 144.9 2.3 131.9 0.5 211.0 4.8 197.8 4.3 133.4 -0.2 128.9 -1.81995 148.9 2.8 138.5 5.0 220.5 4.5 211.6 7.0 132.0 -1.1 130.0 0.91996 153.7 3.2 143.4 3.5 228.2 3.5 231.1 9.2 131.7 -0.2 128.7 -1.01997 157.7 2.6 145.8 1.7 234.6 2.8 248.9 7.7 132.9 0.9 127.0 -1.31998 161.1 2.2 147.3 1.0 242.1 3.2 255.7 2.7 133.0 0.1 125.6 -1.11999 164.6 2.2 148.4 0.7 250.6 3.5 260.8 2.0 131.3 -1.3 125.8 0.22000 168.4 2.3 151.7 2.2 260.8 4.1 272.1 4.3 129.6 -1.3 124.5 -1.02001 173.6 3.1 156.4 3.1 272.8 4.6 282.9 4.0 127.3 -1.8 131.1 5.32002 176.8 1.8 157.9 1.0 285.6 4.7 ------* ------ 124.0 -2.6 126.7 -3.42003 180.5 2.1 161.8 2.5 297.1 4.0 ------ ------ 120.9 -2.5 123.2 -2.82004 186.6 3.4 168.9 4.4 310.1 4.4 ------ ------ 120.4 -0.4 123.9 0.6
4 Selected Components of CPI Anchorage and U.S. city annual averages 1983–2004
*Since 2002 no annual index was produced for medical care.
Source: U.S. Department of Labor, Bureau of Labor Statistics

ALASKA ECONOMIC TRENDS JULY 2005 9
Food costs differ widely around the state
Four times a year, the University of Alaska Fairbanks Cooperative Extension Service posts results from its surveys of the cost of food at home for a week in 20 Alaska communities and Portland, Oregon. (See Exhibits 5 and 6.) The food basket includes items that will provide the minimum levels of nutrition for an individual or family at the lowest possible cost. The survey also includes information on utility and fuel costs. The strength of this survey is its geographic coverage: no other survey covers as many Alaska communities. Another advantage is that it has been produced consistently for many years.
Being mostly limited to food, which makes up a relatively small portion of total consumption dollars, the survey is unsuitable for use as a comprehensive cost of living measure. Another weakness is the study’s necessary assumption that the same items would be purchased in all of the communities surveyed. The study recently began including grocery items delivered to rural communities, a widespread practice in Alaska, but food items obtained through barter or brought back to communities as baggage or private cargo are not captured. The study also makes no allowance for the consumption of subsistence foods instead of store-bought items.
Food costs most in Atka
According to the December 2004 study, a family of four enjoyed the lowest food costs in Anchorage, Fairbanks, and Mat-Su. (See Exhibit 5.) The highest costs tend to be in remote communities which are serviced by air most of the year and by barge during the summer months. Bethel, Atka, Barrow, Dillingham, Galena, Nome, Dutch Harbor, and Naknek-King Salmon belong in this category. All of these communities except Dutch Harbor had food costs that exceeded $200 a week.
Communities connected to a road system or the Alaska Marine Highway fare a little better, with prices somewhere between those above and urban areas. Kodiak, Sitka, and Ketchikan are
5Weekly Food Cost in AlaskaFamily of Four, Children 6-11, December 2004
$107$296$268$202$138$202$167$121$264$145$151$131$127$125$150$123$233$191$136
AnchorageAtka
BarrowBethelDelta
D illinghamDutch Harbor
FairbanksGalenaHainesHom erJuneau
Kenai-SoldotnaKetchikan
KodiakMat-Su
Naknek-King Salm onNom eSitka
$0 $50 $100 $150 $200 $250 $300
examples. Other factors that affect food prices are the size and competitiveness of the market and the proximity to a larger population center.
Juneau tops the list in rental costs
Housing costs are often a good proxy for an area’s cost of living because they make up such a large slice of total expenditures. Information on housing rental prices in ten areas around the state is available through a survey conducted for the Alaska Housing Finance Corporation (AHFC) by the Alaska Department of Labor and Workforce Development. The survey collects monthly rental costs for two-bedroom apartments and three-bedroom single-family homes. (See Exhibits 7 and 8.)
The cost of housing varies dramatically from place to place in Alaska. Housing supply, building costs, the condition of the local economy, and demographic change are all factors that help explain housing cost differences.
Source: University of Alaska, Fairbanks, Cooperative Extension Service.

10 ALASKA ECONOMIC TRENDS JULY 2005
Pct. of Pct. of Pct. of Pct. of Pct. of Kenai/ Pct. of Pct. ofYear Anch. Fbks. Anch. Juneau Anch. Bethel Anch. Nome Anch. Kodiak Anch. Soldotna Anch. Tok Anch.
1978 $76.67 $84.15 110% $73.72 96% $114.05 149% $118.85 155% - - $82.48 108% - -
1979 82.18 89.39 109 74.88 91 129.16 157 128.67 157 - - 100.41 122 - -
1980 88.44 90.54 102 85.92 97 130.87 148 131.14 148 $99.42 112% 120.84 137 $108.82 123%
1981 86.69 98.47 114 93.95 108 138.66 160 150.27 173 - - - - 114.80 132
1982 77.30 92.09 119 99.98 129 125.50 162 149.04 193 - - - - - -
1983 81.66 83.79 103 88.62 109 128.30 157 130.14 159 104.94 129 86.98 107 - -
1984 84.22 91.26 108 91.66 109 136.54 162 142.07 169 115.97 138 87.97 104 121.66 144
1985 89.06 90.08 101 106.61 120 138.13 155 152.41 171 108.17 121 91.47 103 116.19 130
1986 87.25 90.61 104 87.65 100 137.96 158 142.04 163 105.49 121 92.78 106 124.18 142
1987 88.90 85.12 96 88.24 99 140.81 158 147.96 166 104.39 117 96.95 109 117.51 132
1988 90.99 94.74 104 92.95 102 137.57 151 147.69 162 116.68 128 95.53 105 119.69 132
1989 93.80 94.33 101 96.73 103 140.65 150 - - 124.61 133 104.20 111 139.43 149
1990 98.73 103.49 105 100.86 102 146.92 149 155.48 157 154.55 157 103.21 105 131.03 133
1991 102.84 114.65 111 104.21 101 152.49 148 150.29 146 127.96 124 111.88 109 143.45 139
1992 100.46 92.31 92 102.62 102 142.51 142 158.08 157 124.61 124 109.60 109 132.94 132
1993 97.89 93.42 95 103.70 106 147.84 151 145.94 149 125.19 128 111.61 114 136.96 140
1994 91.32 94.96 104 104.09 114 133.47 146 140.22 154 123.99 136 105.51 116 140.78 154
1995 89.30 93.26 104 99.38 111 140.68 158 148.55 166 123.04 138 102.48 115 122.89 138
1996 101.43 96.65 95 96.93 96 148.70 147 162.61 160 125.71 124 105.01 104 142.46 140
1997 96.57 97.73 101 98.89 102 150.42 156 - - 123.92 128 104.87 109 - -
1998 98.74 98.35 100 103.08 104 155.24 157 174.27 176 130.04 132 104.13 105 144.67 147
1999 99.87 98.52 99 104.45 105 163.11 163 155.29 155 143.81 144 109.58 110 132.61 133
2000 100.89 100.63 100 104.55 104 162.63 161 157.40 156 133.89 133 112.01 111 139.31 138
2001 106.43 103.61 97 112.53 106 180.89 170 176.56 166 140.23 132 119.55 112 141.73 133
2002 100.61 100.80 100 110.52 110 187.96 187 179.76 179 143.36 142 119.12 118 126.92 126
2003 105.54 112.77 107 117.78 112 186.07 176 177.38 168 144.13 137 122.39 116 126.37 120
2004 117.33 118.73 101 122.48 104 198.33 169 183.46 156 140.70 120 127.38 109 120.85 103
6 Weekly Food Cost for Eight Alaska Cities, 1978-2004 Costs for a Family of four with elementary school-age children
Note: Sales tax included in food prices.
Source: “Cost of Food at Home for a Week,” September 1978 to September 2004. University of Alaska Cooperative Extension Service, U.S. Dept of Agriculture and SEA Grant Cooperating. Website: http://extension.uaf.edu/ace/fcs/fcs.html
In 2004, rental costs for houses were highest in Juneau and the Valdez-Cordova Census Area. (See Exhibit 7.) Juneau has been near the top of the list for years, and increased another $41 in 2004. Valdez-Cordova saw a bigger increase, jumping from $1,354 in 2003 to $1,522 in 2004. The average price for Anchorage rentals actually declined by $10 after a big jump in 2003.
Juneau also tops the list of apartment rental costs, up $54 to $1,021 a month. The second most expensive market for apartment rental costs among the communities surveyed was Kodiak, where the average rent increased by $117 from 2003 to 2004. Rental prices in Anchorage increased by only $10 to $855. Rents in the Matanuska-Susitna Borough and on the Kenai Peninsula were also substantially less expensive than other parts of the state.

ALASKA ECONOMIC TRENDS JULY 2005 11
Housing sale prices highest in Anchorage and Juneau
A survey of lenders reveals that for houses sold during the second half of 2004, the highest average sale prices were in Juneau at $266,000 and Anchorage at $265,000. Those numbers are nearly $40,000 higher than the statewide average and noticeably higher than all of the other communities for which data were available. Both Juneau and Anchorage sale prices increased by around ten percent in 2004.
The average sale price for a Mat-Su home was more than $60,000 lower than an Anchorage home, partly explaining why the Mat-Su Borough has grown dramatically in recent years and why more and more Alaskans are commuting from Mat-Su to Anchorage. It is important to note that this survey captures only the prices of homes actually sold; how closely that amount approximates the value of the average homes in the various communities is a separate question.
Fairbanks tops list of housing affordability
The Alaska Housing Finance Corporation also establishes a housing affordability index for ten areas in the state. (See Exhibit 10.) This index not only takes the cost of housing into account but also the ability to pay for this housing, using the average wages in the respective areas and determining how many wage earners would be needed to afford the average house. Combining these two factors—housing costs and average wages—yields some surprising results.
Although the Mat-Su Borough has some of the lowest housing costs in the state, for those who both live and work in the borough, purchasing a home takes slightly more wage earners than does Anchorage. In other words, Anchorage’s higher housing costs are balanced by the city’s higher wages and the benefi t of low housing costs in Mat-Su are negated by relatively low wages. Not surprisingly, an increasing number of Alaskans are living in the Mat-Su Borough and working in Anchorage to get the best of both worlds.
7Three-Bedroom ApartmentsCost highest in Juneau and Valdez-Cordova
8Two-Bedroom Apartments Costs highest in Juneau and Kodiak
Note: Includes cost of utilitiesSource: Alaska Department of Labor and Workforce Development, Research and Analysis Section and Alaska Housing Finance Corporation, 2004 Rental Market Survey.
Note: Includes cost of utilitiesSource: Alaska Department of Labor and Workforce Development, Research and Analysis Section and Alaska Housing Finance Corporation, 2004 Rental Market Survey.
$1,531
$1,522
$1,379
$1,350
$1,341
$1,274
$1,238
$1,180
$1,018
$813
Ju neau
Vald ez-C o rdo va
An cho rage
Fairbanks
Sitka
K etch ikan
Matanu ska-Su sitn a
K od iak Island
K enai Pen insu la
Wran gell-Petersbu rg
$1,021
$1,015
$950
$914
$900
$866
$855
$745
$723
$699
Juneau
Kodiak
Sitka
Valdez-Cordova
Ketchikan
Fairbanks
Anchorage
Matanuska-Susitna
Wrangell-Petersburg
Kenai Peninsula

12 ALASKA ECONOMIC TRENDS JULY 2005
$266,000
$265,000
$228,000
$212,000
$199,000
$198,000
$192,000
$186,000
$184,000
$173,000
Juneau
Anchorage
Statew ide
Kodiak
Mat-Su
Ketchikan
Bethel
Fairbanks
Rest of State
Kenai
1.20
1.20
1.26
1.43
1.52
1.55
1.57
1.59
1.70
1.71
Fairbanks
Kenai
Alaska
Anchorage
Ketchikan
Kodiak
MatSu
Bethel
Juneau
Anchorage Workerbuys Mat-Su House
9 Single-Family Home Sales PriceJuneau and Anchorage are close for top prices
Note: Average Sales price for second half of 2004Source: Alaska Department of Labor and Workforce Development, Research and Analysis Section and Alaska Housing Finance Corporation, 2004 Survey of Lender’s Activity.
10Housing AffordabilityWage Earners Needed to Buy an Average House
Note: Data based upon second half of 2004Source: Alaska Department of Labor and Workforce Development, Research and Analysis Section and Alaska Housing Finance Corporation, 2004 Alaska Affordability Index.
Only Fairbanks can match the Anchorage wage earner living in Mat-Su for housing affordability. In both places it takes just 1.2 wage earners to purchase the average house. Contrast that with Juneau, where despite above average wages housing is less affordable because it is some of the state’s most expensive. Housing in Bethel is less affordable because of lower than average wages and high housing costs related to its remote location.
ACCRA looks at higher income households
Every quarter the nonprofi t American Chamber of Commerce Researchers Association (ACCRA) publishes the results of its detailed cost of living surveys of about 400 cities. ACCRA’s market basket is meant to capture the expenditure patterns of professional and executive households with incomes in the top fi fth of all U.S. households. Expenditures for each city are compared to the average for all cities surveyed, which is assigned a score of 100. For example, a city with an index score of 125 has costs 25 percent higher than the average of all ACCRA cities surveyed. The survey does not include taxes, a signifi cant point for Alaskans, whose tax burden is the lowest in the country.
The fi rst quarter 2005 ACCRA survey reveals that the cost of living for Alaska’s higher income residents is still well above average. Anchorage, Fairbanks, Juneau, and Kodiak all recorded composite index scores above 120. (See Exhibit 11.)
Juneau, Kodiak, and Fairbanks were all among the 20 most expensive ACCRA cities surveyed. (See Exhibit 12.) Health care costs are still substantially higher in Alaska than in the average U.S. city, but the gap has narrowed since last year. Juneau’s health care costs were more than seventy percent higher than the average city (ACCRA index score of 170.1) compared to about fi fty percent higher in the most current ACCRA numbers (index score of 148.9). The other three Alaska cities all saw similar declines. The most likely reason is because Alaska health care costs, though still increasing, are doing so at a slower rate than most other parts of the country.

ALASKA ECONOMIC TRENDS JULY 2005 13
Items All Misc.Region Index Grocery Health Goods & City Costs Items Housing Util. Trans. Care Services
Anchorage, AK 120.3 135.9 127.1 83.1 112.2 129.2 120.5 Fairbanks, AK 126.8 134.3 130.1 142.8 112.2 140.5 118.9 Juneau, AK 132.2 144.5 140.6 135.9 132.5 148.9 117.8 Kodiak, AK 131.6 144.5 137.8 132.0 127.6 135.5 122.2
West Seattle, WA 116.5 108.9 133.0 105.2 111.2 127.7 108.9 Corvalis, OR 109.9 114.7 108.9 112.7 110.2 120.8 106.7 Los Angeles-Long Beach, CA 153.7 123.4 253.2 114.1 112.5 120.6 108.2 San Francisco, CA 178.7 153.8 307.0 98.2 112.2 129.1 127.5 Las Vegas, NV 110.6 102.0 130.0 104.8 104.4 111.0 100.9
Southwest/Mountain Boise, ID 94.7 85.2 86.8 91.7 104.4 104.5 102.0 St. George, UT 94.2 91.1 91.3 80.6 102.3 88.1 100.2 Phoenix, AZ 96.8 100.7 88.8 92.9 102.3 99.5 101.3 Denver, CO 101.6 106.4 105.2 87.5 96.0 106.5 101.7 Dallas, TX 91.7 91.6 75.5 103.8 102.3 100.8 97.8
Midwest Rochester, MN 97.3 88.6 90.7 113.5 102.1 101.9 99.6 Cleveland, OH 102.5 109.7 101.6 119.0 102.0 99.9 96.3 Chicago, IL 128.6 116.3 165.3 105.1 111.9 120.3 114.8
Southeast Orlando, FL 97.0 92.4 90.7 95.3 99.7 89.6 104.5 Montgomery, AL 94.3 93.1 90.0 95.9 97.5 85.4 98.0 Atlanta, GA 96.0 95.0 91.6 86.7 106.3 110.4 98.3 Raleigh, NC 93.8 102.6 75.8 102.6 107.4 109.5 97.6
Atlantic/New England New York City - Manhattan 203.9 142.6 373.2 153.4 113.6 138.4 131.6 Boston, MA 137.2 119.1 178.4 133.2 111.3 132.0 118.2 Philadelphia, PA 123.2 127.7 135.3 122.0 113.3 116.1 115.1
11Selected Cities - ACCRAFirst Quarter 2005
Source: American Chamber of Commerce Researchers Association, Urban Area Index Data, First Quarter 2005.
Alaska cities remain expensive in the ACCRA survey primarily because of high housing costs (housing has the largest weight in the overall index score). Juneau housing is more than 40 percent more expensive than average and Anchorage, the least expensive Alaska city measured by ACCRA, reports housing costs about 27 percent higher than average.
Exhibit 11 and 12 show that housing costs on both the East and West coasts raise living costs signifi cantly there, while generally cheaper housing in the middle of the country lower overall costs there. Of the 20 most expensive
ACCRA cities, all but Chicago and Fairbanks are either on or near one of the nation’s coasts.
Runzheimer Survey
The Runzheimer Plan of Living Cost Standards looks at households on the lower end of the income spectrum. (See Exhibit 13.) The Alaska Department of Labor and Workforce Development contracts with Runzheimer to survey geographic cost differentials for a family of four with an annual income of $32,000. The survey determines how much more or less it would cost in various cities for the family to

14 ALASKA ECONOMIC TRENDS JULY 2005
Misc.All Items Grocery Health Goods &
City Index Items Housing Utilities Trans. Care Services
Expenditure Weight 13% 29% 10% 9% 4% 33%
New York (Manhattan), NY 203.9 142.6 373.2 153.4 113.6 138.4 131.6San Francisco, CA 178.7 153.8 307.0 98.2 112.2 129.1 127.5San Jose, CA 167.2 140.5 269.8 110.3 117.6 119.7 126.6Honolulu, HI 156.9 149.7 216.5 150.5 127.5 112.2 124.6Los Angeles-Long Beach, CA 153.7 123.4 253.2 114.1 112.5 120.6 108.2Orange County, CA 152.8 127.3 247.5 111.0 114.2 120.4 109.4Oakland, CA 150.7 149.9 229.2 93.3 115.4 126.1 114.1Stamford, CT 148.0 114.1 228.0 121.4 114.2 119.7 113.9San Diego, CA 146.9 109.0 229.0 97.5 118.8 122.9 117.1New York (Queens), NY 142.9 125.6 184.7 143.6 116.6 119.3 123.9Washington DC/Suburban MD, VA 140.0 105.3 214.1 105.2 111.2 120.5 111.1Bergen-Passaic, NJ 137.6 123.1 191.9 115.7 105.0 106.8 116.3Boston, MA 137.2 119.1 178.4 133.2 111.3 1325.0 118.2Bethesda, MD 133.7 105.5 186.3 111.0 113.2 110.5 114.9Newark-Elizabeth, NJ 133.5 119.9 174.7 116.1 106.8 110.6 118.9Juneau, AK 132.2 144.5 140.6 135.9 132.5 148.9 117.8Kodiak, AK 131.6 144.5 137.8 132.0 127.6 135.5 122.2Middlesex, NJ 130.2 120.4 172.1 111.6 106.5 106.0 113.3Chicago, IL 128.6 116.3 165.3 105.1 111.9 120.3 114.8Fairbanks, AK 126.8 134.3 130.1 142.8 112.2 140.5 118.9
12 ACCRA Cost of Living Index First Quarter 200520 Highest Cost Urban Areas
maintain the same standard of living $32,000 would purchase in the standard U.S. city.
According to the Runzheimer survey, a household in Anchorage would need an income of $36,884 to maintain the standard of living obtainable with $32,000 in the standard city. A slightly lower income would be necessary in Fairbanks, and a noticeably higher amount in Juneau. The principal difference between the three Alaska cities surveyed by Runzheimer is the price of housing for relatively low-income families. Housing costs for households with this income level add up to a few thousand dollars less a year in Fairbanks than in Anchorage and more than $5,000 less than in Juneau (costs include mortgage payments, real estate taxes, insurance, utilities, and maintenance).
As with most other cost of living measures, housing prices have the most signifi cant impact on the Runzheimer data. Los Angeles is especially expensive for households with lower incomes because housing prices are 262.8 percent higher than the standard city. As a result, living in Los Angeles with the same standard of living that $32,000 buys in the standard U.S. city would require an income of more than $57,000.
The military’s cost of living index
The United States Department of Defense (DOD) produces a cost-of-living index for all of its overseas locations, including Alaska and Hawaii. (See Exhibit 14.) The DOD index shows the allowance paid to service members stationed in high-cost areas to help them maintain purchasing power similar to that obtainable in the continental U.S.
Source: American Chamber of Commerce Researchers Association, Urban Area Index Data, First Quarter 2005.

ALASKA ECONOMIC TRENDS JULY 2005 15
Misc.Total Pct. of Pct. of Pct. of Pct. of Goods & Pct. of
Costs Std. City Taxation Std. City Trans. Std. City Housing Std. City Services Std. City
Alaska Composite 37,273 116.5% 2,448 77.4% 4,648 106.5% 18,972 135.2% 12,572 110.4%
Anchorage 36,884 115.3% 2,448 77.4% 4,759 109.0% 18,648 132.9% 12,503 109.8% Fairbanks 34,645 108.3% 2,448 77.4% 4,668 106.9% 16,458 117.3% 12,606 110.7% Juneau 40,289 125.9% 2,448 77.4% 4,517 103.5% 21,812 155.4% 12,606 110.7%
West Astoria, OR 33,802 105.6% 3,390 107.2% 4,367 100.0% 16,386 116.8% 11,383 99.9% Bellingham, WA 35,976 112.4% 2,448 77.4% 4,684 107.3% 17,835 127.1% 11,836 103.9% Corvalis, OR 33,880 105.9% 3,390 107.2% 4,358 99.8% 16,458 117.3% 11,398 100.1% Hilo, HI 36,636 114.5% 3,123 98.7% 5,582 127.9% 16,207 115.5% 12,931 113.5% Lakeport, CA 41,802 130.6% 2,448 77.4% 5,272 120.8% 22,993 163.8% 12,141 106.6% Los Angeles, CA 57,446 179.5% 2,448 77.4% 6,488 148.6% 36,888 262.8% 12,556 110.2% Yakima, WA 31,293 97.8% 2,448 77.4% 4,680 107.2% 13,188 94.0% 11,836 103.9%
Southwest/Mountain Cody, WY 27,961 87.4% 2,448 77.4% 4,539 104.0% 11,305 80.5% 10,850 95.3% El Paso, TX 27,649 86.4% 2,448 77.4% 4,643 106.4% 11,035 78.6% 10,746 94.3% Flagstaff, AZ 34,974 109.3% 2,719 86.0% 4,670 107.0% 16,753 119.4% 11,815 103.7% Jackson, WY 51,455 160.8% 2,448 77.4% 4,539 104.0% 34,691 247.2% 10,850 95.3% Lewiston, ID 30,521 95.4% 2,790 88.2% 4,482 102.7% 13,822 98.5% 10,551 92.6% Reno, NV 35,262 110.2% 2,448 77.4% 4,953 113.5% 17,147 122.2% 11,584 101.7% Provo, UT 30,676 95.9% 3,175 100.4% 4,660 106.8% 12,755 90.9% 11,122 97.6%
Midwest Grand Rapids, MN 30,360 94.9% 2,583 81.7% 4,960 113.6% 13,228 94.3% 10,930 96.0% Lansing, MI 36,102 112.8% 2,744 86.8% 5,535 126.8% 17,717 126.2% 11,236 98.6% Oklahoma City, OK 28,317 88.5% 3,215 101.6% 4,548 104.2% 10,316 73.5% 11,068 97.2% Springfi eld , MO 27,588 86.2% 3,215 101.6% 4,509 103.3% 9,756 69.5% 11,142 97.8%
Southeast Nashville, TN 28,806 90.0% 2,448 77.4% 4,168 95.5% 11,703 83.4% 11,195 98.3% New Orleans, LA 30,524 95.4% 3,091 97.7% 5,475 125.4% 12,033 85.7% 10,924 95.9% West Palm Beach , FL 37,478 117.1% 2,448 77.4% 5,433 124.5% 19,155 136.5% 11,559 101.5% Wilmer, AL 27,471 85.8% 3,433 108.5% 4,211 96.5% 10,313 73.5% 10,692 93.9%
Atlantic/New England Boston, MA 48,062 150.2% 3,241 102.5% 6,361 145.7% 27,570 196.4% 12,335 108.3% Elmira, NY 29,160 91.1% 3,099 98.0% 4,659 106.7% 11,303 80.5% 11,036 96.9% Trenton, NJ 45,624 142.6% 2,754 87.1% 5,453 124.9% 27,391 195.2% 11,436 100.4%
13Runzheimer International Living Cost StandardsDecember 2004
Source: Runzheimer’s Living Cost Index, December 2004
This adjustment is calculated on income remaining after housing expenses, taxes, savings, life insurance, gifts, and charitable contributions are deducted. DOD collects pricing data on approximately 120 goods and uses the Bureau of Labor Statistics consumer expenditure survey for assigning weights to the various goods. One of the DOD index’s strengths is its broad geographic coverage—27 Alaska locations are included. Another strength is that the data
are relatively current. Its biggest weakness is that it does not include housing, which is treated separately by the military with a housing allowance program.
State of Alaska geographic differentials
One of the most comprehensive data sets of state cost differentials was produced in a 1985 State of Alaska survey done to determine location pay

16 ALASKA ECONOMIC TRENDS JULY 2005
Location Index
Anchorage 122Barrow 152Bethel 152Clear AFS 124College 124Cordova 134Delta Junction 126Dillingham 152Fairbanks 124Galena 152Homer 134Juneau 128Kenai (incld. Soldotna) 134Ketchikan 138Kodiak 128Kotzebue 152Metlakatla 152Nome 152Petersburg 138Seward 134Sitka 136Spuce Cape 128Tok 132Unalaska 128Valdez 134Wainwright 152Wasilla 120
14OCONUS* 2005Cost-Of-Living Allowance Indexes
Note: *Overseas Cost of living allowance.Source: Department of Defense, effective date May 2005.
for state workers. (See Exhibit 15.) The results of this survey are still used by the state. Workers in Fairbanks, for example, receive a four- percent higher wage or salary than their colleagues in Anchorage in similar positions. The highest geographic differential pay goes to state workers in Barrow and Kotzebue, where cost of living was determined to be 42 percent higher than in Anchorage, Juneau, Kenai, and the other cities in Exhibit 16 with scores of 100.
A new approach to geographic differentials
The Institute of Social and Economic Research (ISER) at the University of Alaska Anchorage recently completed a study of cost differences among Alaska’s 53 school districts. (See Exhibit 16.) Most previous school studies have looked at differences in the costs of heating schools, travel, materials, and teacher salaries. The ISER researchers added a twist by attempting to calculate how high salaries would have to be for districts around the state to attract and retain teachers and administrators with similar qualifi cations.
They looked at data on teacher recruitment and turnover, as well as differences in climate, amenities, and any other factors teachers consider when deciding whether to stay in a particular area. The researchers used Anchorage costs as the base (Anchorage = 100). The highest indexed school district was 211.6 for Yukon Flats and 21 school districts had scores of at least 150. For more information about the ISER study, see: www.iser.uaa.alaska.edu Summary
Cost-of-living questions can have complicated answers and no single survey or index can supply a perfect answer. Each survey has specifi c limitations that must be considered before reaching conclusions about either the change in costs over time or the difference in costs from one place to another. With that in mind, users have an abundance of information to explore the cost of living in Alaska, one of the state’s most fundamental economic issues.
Cost of LivingPlace Names and Duty Stations Differential
Aleutians Islands 112Aniak,McGrath,Galena 130Anchorage (base district) 100Barrow,Kotzebue 142Bethel 138Bristol Bay 127Delta Junction,Tok 116Fairbanks 104Fort Yukon (above Arctic Circle) 142Juneau 100Kenai, Cook Inlet 100Ketchikan 100Kodiak 109Nenana Duty Station 120Nome 134Palmer,Wasilla 100Seward 100Sitka 100Skagway,Haines, Yakutat 105Valdez,Cordova,Glennallen 111Wade Hampton 130Wrangell, Petersburg 100
15Geographic Pay DifferentialState of Alaska
Source:The McDowell Group and State of Alaska, Department of Administration, 1986.

ALASKA ECONOMIC TRENDS JULY 2005 17
Districts with Lower Cost Differentials Proposed Cost Differentials Current Cost Differentials
Anchorage School District 100.0 100.0Matanuska-Susitna School District 107.0 101.0Fairbanks NS Borough School District 107.0 103.9Juneau Borough Schools 114.5 100.5Wrangell City School District 115.9 100.0Ketchikan Getway Borough District 117.0 100.0Valdez City School District 117.0 109.5Kenai Peninsula Borough Schools 117.1 100.4Skagway City School District 117.4 114.3Sitka Borough School District 119.5 100.0Haines Borough School District 120.0 100.8Craig City School District 120.6 101.0
Districts with Mid-Range Differentials
Cordova City School District 123.4 109.6Delta Greely School District 124.1 110.6Petersburg City School District 124.4 100.0Kodiak Island Borough School District 128.9 109.3Klawock City School District 130.2 101.7Copper River School District 131.6 117.6Denali Borough School District 133.2 131.3Nenana City School District 133.8 127.0Annette Island School District 133.8 101.1Dillingham City School District 134.6 125.4Galena City School District 139.1 134.8Hoonah City School District 139.9 105.5Southeast Island School District 140.3 112.4Yakutat School District 141.2 104.6Unalaska City School District 144.1 124.5Nome City School District 145.0 131.9Kake City School District 145.9 102.5Pelican City School District 147.7 129.0Bristol Bay Borough School 147.8 126.2Chugach School District 149.6 129.4Hydaburg City School District 150.4 108.5
Districts with Highest Cost Differentials
Chatham Region Schools 157.6 112.0Alaska Gateway School District 159.4 129.1Kashunamiut School District 161.9 138.9St.Marys City School District 162.4 135.1Lower Kuskikwim School District 166.3 149.1Southwest Region School District 168.5 142.3Pribilof Island School District 169.1 141.9Yupiit School District 172.3 146.9Kuspuk School District 173.4 143.4Tanana City School District 178.6 149.6North Slope Borough School District 179.1 150.4Northwest Arctic School District 182.3 154.9Yukon Koyukuk School District 183.5 150.2Iditarod Area School District 184.6 147.0Lower Yukon School District 186.1 143.8Aleutian Region School District 193.9 173.6Aleutians East Borough School District 199.1 142.3Lake and Peninsula School District 199.4 155.8Bering Strait School District 199.8 152.5Yukon Flats School District 211.6 166.8
16Proposed and Current Geographic Cost Differentials Anchorage Costs = 100
Source: Institute of Social and Economic Research, University of Alaska Anchorage

18 ALASKA ECONOMIC TRENDS JULY 2005
Alaska Cost-of-Living Information on the World Wide Web
Beyond the information in this article there are web sites that can provide quick cost of living comparisons. The sites generally provide little detail, but they can be handy as quick reference sources.
www.labor.state.ak.us/research/relocate/relocmap.htm
The Alaska Department of Labor and Workforce Development’s relocation site offers cost of living information, general information about Alaska, information on employment opportunities, and about traveling to Alaska.
www.stats.bls.gov
The U.S. Department of Labor, Bureau of Labor Statistics, Consumer Price Index site provides CPI data for Anchorage and all areas. There is also general, technical, and research information on the CPI. There is also an infl ation calculator at this site.
www.homefair.com/calc/citysnap.html
The Homefair City Reports present a side-by-side comparison of two cities’ cost of living, climate, demographics, and other vital information from a database that is updated quarterly. Homefair City Reports offers one complimentary report with up to two destinations. There are many other web sites with cost-of-living information. They include:CityRating.com www.cityrating.com/costofl iving.asp Homeadvisor msn homeadvisor.msn.com/pickaplace/comparecities.aspxACCRA www.accra.org/

ALASKA ECONOMIC TRENDS JULY 2005 19
Earnings data for 2004 show healthy growth
Alaska Employment
Sceneby
Dan RobinsonEconomist
verage earnings for Alaska’s wage and salary employment grew by $1,256 in 2004 to $38,621. The 3.4 percent increase comfortably
exceeded the 2.6 percent rate of infl ation in 2004, as measured by the Anchorage consumer price index. The earnings fi gures are pre-tax and they do not include the value of employer contributions to benefi ts such as health insurance and retirement savings plans.
Goods producing jobs generally more lucrative
The average private sector job paid $37,516 in 2004, up 3.3 percent from 2003. Jobs in goods-producing industry sectors paid an average of $56,226 in 2004, substantially more than the $33,332 paid in service-providing sectors. Both numbers were up, although earnings in the service-providing sectors grew 3.9 percent in 2004, while those in goods-producing sectors grew a little less at 1.3 percent.
Oil and gas extraction jobs paid an average of $139,317 in 2004, more than any other major category in 2004. That amount was an 8.9 percent increase over 2003’s earnings, although the actual number of oil and gas extraction jobs declined very slightly.
Construction jobs paid an average of $52,918 in 2004, also substantially more than the
Astatewide average, but a gain of just seven-tenths of a percent from 2003. The most lucrative construction jobs are the in sub-category of highway, street, and bridge construction where average earnings in 2004 were $77,627, a 3.1 percent increase from 2003.
Alaska’s manufacturing industries lost ground in earnings per job in 2004, dropping from $34,690 to $33,721. Seafood processing jobs, which make up about seventy percent of all manufacturing employment in Alaska, saw earnings fall from $31,184 in 2003 to $29,695 in 2004, a decline of nearly fi ve percent.
Earnings up in all service-providing sectors
In the service-providing sectors of the state’s economy, the retail trade industry, which provides more than ten percent of all wage and salary employment in the state, saw a small increase in earnings per job, from $25,435 to $25,773. Part of the reason for retail trade’s lower earnings is that retail jobs average fewer hours than jobs in other industries because there are so many part-time retail positions.Average earnings for the transportation and warehousing industries also increased in 2004, jumping from $45,027 to $47, 529, a 5.6 percent increase. About a third of those jobs were in air transportation, which saw an eleven percent increase in earnings per job to $51,976. The actual number of air transportation jobs fell by about 100, however.

20 ALASKA ECONOMIC TRENDS JULY 2005
In the information sector, earnings per job increased a robust 7.0 percent to $48,057. The telecommunications industry, which makes up nearly two-thirds of this sector, saw an earnings increase of 6.4% to $59,581.
Jobs in fi nancial activities paid 2.6 percent more in 2004, moving to $40,020. One sub-category that stands out is investment banking and securities, where earnings per job were a hefty $132,088, an increase of more than twenty percent over 2003. The actual number of jobs is very small, however, with just 66 in 2004, which is down from 73 in 2003.
The professional and business services sector reported an increase of 5.4 percent per job in 2004 to $41,329. Education and health services saw an increase of 3.3 percent to $35,596. Jobs in the health care and social services industries, which make up nearly the entire education and health services sector, earned an average of $36,012, about three percent more per year than in 2003.
A high percentage of part-time jobs in the leisure and hospitality sector reduce earnings per job to relatively low levels. The majority of the sector’s approximately 30,000 jobs are in either the hotel or restaurant industries. In 2004, earnings per job increased 4.5 percent to $15,848.
In the other services sector, a catch-all category that includes everything from auto repair shops to funeral homes and civic organizations, earnings per job increased 3.5 percent to $25,345.
Federal government earnings outpace state and local government
Federal government jobs paid an average of $57,810 in 2004, an increase of 5.9 percent. State jobs paid an average of $40,104, an increase of 1.4 percent. Earnings per job in local government increased 3.5 percent in 2004 to $35,457. Education-related jobs accounted for more than half of the nearly 38,000 local government jobs. Average earnings for these jobs grew 4.1 percent to $37,993.
Total
N. Res
. & M
in.
Const.
Manuf.
Trade,
Trans.,
& U
til.
Informati
on
Fin. Acti
vities
Prof. &
Bus.
Serv.
Educ. & H
ealth
Serv.
Leisure
& Hosp
.
Other Serv
.
Fed. G
vt.
State G
vt.
Local G
vt.
0
2
4
6
8
-2
-4
2.6% inflation
1 Earnings per JobPercent Increase, 2003-2004
Source: Alaska Department of Labor and Workforce Development, Research and Analysis Section

ALASKA ECONOMIC TRENDS JULY 2005 21
Steady employment growth and a declining unemployment rate
Preliminary May estimates showed an increase of 11,400 jobs since April as seasonal employment continued to build towards its mid-summer peak. (See Exhibit 2.) The over-the-month gain was slightly higher than May 2004’s increase of 11,000 jobs. The state’s estimated job count of 310,800 was 4,600 more than May 2004, which equates to an over-the-year growth rate of 1.5 percent. The state’s two most populous regions, Anchorage/Mat-Su and the Interior (which includes Fairbanks), recorded nearly all of the gains. (See Exhibit 4.)
The state’s unemployment rate (not seasonally adjusted) continued to decline in May, falling eight-tenths of a percentage point to 6.3 percent. (See Exhibit 3.) The rate was a full percentage point lower than May 2004’s rate of 7.3 percent and the lowest May rate since 2001’s 5.8 percent.
About the data
The data discussed in this article was produced from quarterly reports that nearly all wage and salary employers are required to fi le under Alaska unemployment insurance laws. Because reporting is mandatory, the employment and wage data represents a near census of employment and wages for Alaska’s payroll jobs (those for which workers are paid either a wage or salary).
The federal/state cooperative program that produces the data is called the Quarterly Census of Employment and Wages, or QCEW. The program does not attempt to convert the data into full-time equivalency job counts or to produce wage rates. It simply reports the number of job holders on the payroll each month and their total earnings for each quarter, both of which are then annualized at the end of each calendar year. Consequently, as noted in the article, earnings per job will be lower for industries in which job holders generally work fewer hours.
For more information about the program: http://bls.gov/cew/home.htm

22 ALASKA ECONOMIC TRENDS JULY 2005
prelim. revised revisedNOT SEASONALLY ADJUSTED 05/05 04/05 05/04United States 4.9 4.9 5.3
Alaska Statewide 6.3 7.1 7.3
SEASONALLY ADJUSTED
United States 5.1 5.2 5.6
Alaska Statewide 6.4 6.7 7.4
3Unemployment RatesUnited States and Alaska
4 By RegionNonfarm Wage and Salary Employment
Changes from: Percent Change: 05/05 04/05 05/04 04/05 05/04 04/05 05/04Anch/Mat-Su 164,300 161,100 161,100 3,200 3,200 2.0% 2.0%Gulf 29,450 27,300 29,050 2,150 400 7.9% 1.4%Interior 46,200 43,300 45,200 2,900 1,000 6.7% 2.2%Northern 15,600 15,650 15,800 -50 -200 -0.3% -1.3%Southeast 37,400 34,350 37,350 3,050 50 8.9% 0.1%Southwest 17,900 17,900 17,750 0 150 0.0% 0.8%
For more current state and regional employment and unemployment data,
visit our website.
http://almis.labor.state.ak.us/
2004 BenchmarkThe offi cial defi nition of unemployment excludes anyone who has not actively sought work in the four-week period up to and including the week that includes the 12th of the reference month. Many individuals do not meet this defi nition because they have not conducted an active job search, due to the scarcity of employment opportunities in rural Alaska.
2 Nonfarm Wage and SalaryEmployment
prelim. revised revised Changes from:ALASKA 05/05 04/05 05/04 04/05 05/04
Total Nonfarm Wage & Salary1 310,800 299,400 306,200 11,400 4,600 Goods Producing 39,100 36,400 38,200 2,700 900 Service-Providing 271,700 263,000 268,000 8,700 3,700Natural Resources & Mining 10,500 10,300 10,300 200 200 Logging 500 500 600 0 -100 Mining 10,100 10,000 9,700 100 400 Oil,Gas Extr Drilling 8,500 8,400 8,300 100 200Construction 18,300 16,100 17,700 2,200 600Manufacturing 10,300 10,000 10,200 300 100 Wood Product Mfg. 300 300 400 0 -100 Seafood Processing 6,600 6,400 6,400 200 200Trade, Transportation, Utilities 64,100 60,200 63,600 3,900 500 Wholesale Trade 6,300 6,100 6,200 200 100 Retail Trade 35,800 34,200 35,400 1,600 400 Food and Beverage Stores 6,000 5,900 6,000 100 0 General Merchandise Stores 9,200 9,000 9,200 200 0 Trans/Warehousing/Utilities 22,000 19,900 22,000 2,100 0 Air Transportation 6,400 5,900 6,600 500 -200 Truck Transportation 3,100 2,900 3,000 200 100Information 6,900 6,800 6,900 100 0 Telecommunications 4,200 4,100 4,100 100 100Financial Activities 14,900 14,700 14,600 200 300Professional & Business Svcs 23,600 23,100 23,200 500 400Educational & Health Svcs 36,600 36,100 35,000 500 1,600 Health Care 26,200 25,900 24,900 300 1,300Leisure and Hospitality 31,700 27,800 30,500 3,900 1,200 Accommodation 8,500 6,600 8,400 1,900 100 Food Svcs & Drinking Places 19,200 17,600 18,200 1,600 1,000Other Services 11,100 10,800 11,500 300 -400Government2 82,800 83,500 82,700 -700 100 Federal Government3 17,300 16,900 17,300 400 0 State Government 24,000 25,000 23,900 -1,000 100 State Govt. Education 6,900 8,100 6,800 -1,200 100 Local Government 41,500 41,600 41,500 -100 0 Local Govt Education 23,900 24,100 23,800 -200 100 Tribal Government 3,900 4,000 3,900 -100 0
Notes 1Excludes self-employed workers, fi shermen, domestics, and unpaid family workers as well as agricultural workers.2 Includes employees of public school systems and the University of Alaska. 3 Excludes uniformed military4 Metropolitan Statistical Area Prepared in cooperation with the U.S. Dept. of Labor, Bureau of Labor Statistics.Regional data prepared in part with funding from the Employment Security Division.
Source: Alaska Department of Labor & Workforce Development, Research and Analysis

ALASKA ECONOMIC TRENDS JULY 2005 23
Employer ResourcesThe Research & Analysis offi ces of the Alaska Department of Labor and Workforce Development have a Workforce Information Web Page at: http://almis.labor.state.ak.us
Here an employer will fi nd links to: Alaska Economic, Occupation, Career Profi les and Population Information. Links to Industry data, Cost of Living, Training Resources, Regional, Prevailing Wage, Unemployment, and Employment information is also available. Electronic issues of Alaska Economic Trends Magazine, publications and manuals and links to other data sources are available on this page.